水力発電市場レポート:2024-2034
Hydropower Market Report 2024-2034
レポート詳細
水力発電市場レポート 2024-2034 :この調査レポートは、業界とその基礎となるダイナミクスをより良く理解することを望むなら、新たな収益ポケットを目指す大手企業にとって貴重なもの... もっと見る
※上記価格は部署ライセンス(Departmental licence)価格です。
その他の価格についてはデータリソースまでお問合せください。
日本語のページは自動翻訳を利用し作成しています。
実際のレポートは英文のみでご納品いたします。

|

|
サマリー
レポート詳細
水力発電市場レポート 2024-2034:この調査レポートは、業界とその基礎となるダイナミクスをより良く理解することを望むなら、新たな収益ポケットを目指す大手企業にとって貴重なものとなるでしょう。異業種への進出や新地域での既存事業の拡大を目指す企業にも有用です。
環境意識の高まりと持続可能な発電の必要性
水力発電は、環境に優しく持続可能なエネルギー源として認知されており、環境意識の高まりや持続可能な発電の必要性とシームレスに一致している。さらに、水力発電プロジェクトは、信頼できる揺るぎない電力供給を提供することで、エネルギー安全保障を確保する上で極めて重要な役割を果たしている。多様な規模の電力需要に対応できる水力発電の適応性は、世界規模で水力発電が広く採用されるための有力な触媒となっている。市場の成長を大きく後押ししているのは、水力発電プロジェクトを実質的に支援する政府のイニシアティブ、補助金、有利な政策である。
水力発電市場には数多くのビジネスチャンスがある。急成長する市場への参入は、業界参加者にとって有望な軌道である。これらの市場は未開拓の水力発電の可能性を誇っていることが多く、斬新なプロジェクトを開始するための肥沃な土壌を提供している。さらに、有利な市場に製造ユニットを設立することは、操業効率を高め、コストを削減する可能性を秘めている。中低所得国における低コストの水力発電ソリューションの導入は、エネルギー需要に持続的に対処するための重要な機会として浮上している。地域の事業体と戦略的提携を結ぶことは、知識の交換、技術の移転、相互の発展を促進する。同時に、先進的なタービンシステムやスマートグリッド統合などの最先端技術への投資は、技術革新と効率向上の道を開く。
新しい太陽光発電と陸上風力発電は、水力発電の限界運転コスト以下になりつつある
新しい太陽光発電(PV)と陸上風力発電が、水力発電の限界運転コストと同等、あるいはそれを下回るコストに近づいているという主張は、ダムや貯水池を含む水力発電施設の建設に関連する高い初期資本コストが重要である可能性を示唆している。水力発電は歴史的に信頼性が高く、費用対効果の高い再生可能エネルギー源であったが、インフラ整備に必要な先行投資により、太陽光発電や陸上風力発電プロジェクトのコスト低下に対抗する能力が制限される可能性がある。さらに、新たな水力発電プロジェクトの建設に伴う環境問題や規制上の課題も、抑制要因として作用する可能性がある。生態系への影響、地域社会の移転、生息地の破壊を理由とするダム建設への反対は、特に太陽光発電や風力発電の環境面での利点と比較した場合、水力発電の成長を妨げる可能性がある。
市場調査レポートを購入する前にすべき質問とは?
- 水力発電市場はどのように進化しているのか?
- 水力発電市場の推進要因と抑制要因は何か?
- 水力発電の各サブ市場セグメントは予測期間中にどのように成長し、2034年にはどれくらいの売上を占めるようになるのか?
- 2024年から2034年にかけて、各水力発電サブマーケットの市場シェアはどのように推移するのか?
- 2024年から2034年までの市場全体の主な牽引役は何か?
- 主要な水力発電市場はマクロ経済の動きに概ね追随するのか、それとも個々の国市場が他を凌駕するのか。
- 2034年までに各国市場のシェアはどう変化し、2034年に市場をリードするのはどの地域か?
- 主要プレーヤーは誰で、予測期間中の見通しは?
- これらの大手企業の水力発電プロジェクトとは?
- 2024年から2034年の間に、産業はどのように発展していくのか?現在および今後10年間の水力発電プロジェクトにはどのような意味があるのか?
- 水力発電市場をさらに拡大するために、製品の商業化の必要性は高まっているのか?
- 水力発電市場はどこへ向かい、どのようにすれば市場の最前線に立つことができるのか?
- 新製品やサービスラインへの最適な投資方法とは?
- 企業を新たな成長軌道に乗せ、C-suiteに移行させるための重要な展望とは?
このことが、現在、そして今後10年間の水力発電市場にどのような影響を与えるかを見極める必要がある:
- 420ページにわたる本レポートでは、154の表と201の図表を掲載しています。
- 本レポートでは、業界における主要な有利分野をハイライトしているため、今すぐターゲットを絞ることができます。
- 世界、地域、国の売上と成長に関する詳細な分析が含まれています。
- 競合他社が成功した主なトレンド、変化、収益予測をハイライトしています。
本レポートは、水力発電市場が今後10年間でどのように発展していくのか、またCOVID-19の景気後退と好転の変動に合わせてどのように発展していくのかをお伝えします。この市場は、過去10年間のどの時点よりも今が重要である。
2034年までの予測やその他の分析から、商業的な展望が明らかになる
- 2034年までの収益予測に加え、最新の業績、成長率、市場シェアを提供します。
- ビジネスの展望と展開に関する独自の分析をご覧いただけます。
- 定性的分析(市場力学、促進要因、機会、阻害要因、課題を含む)、コスト構造、水力発電価格上昇の影響、最近の動向をご覧いただけます。
本レポートには、COVID-19が業界と貴社にどのような影響を与えるかについてのデータ分析と貴重な洞察が含まれている。本レポートでは、COVID-19の4つの回収パターンとその影響、すなわち「V」、「L」、「W」、「U」について論じている。
レポート対象セグメント
市場規模の推定
- 市場価値 (US$ Billion)
- 市場規模(GW)
タイプ別市場セグメント
- 貯留式水力発電所
- 貯留式水力発電所
- 流水式水力発電所
容量別市場セグメント
- マイクロ&ピコ(100KW未満)
- 小型(100KW-30MW)
- 大型(30MW~100MW)
- 巨大(100MW以上)
エンドユーザー別市場セグメント
- 産業用
- 商業用
- 住宅用
- 政府機関
- その他のエンドユーザー
CAPEX別市場セグメント
- 土木建設
- 電気機械設備
- 電力インフラ
- グリッド接続インフラ
- 保守・修理
- 雑費
世界市場全体とセグメント別の収益予測に加え、4つの地域と20の主要国市場の収益予測も掲載しています:
北米
- アメリカ
- カナダ
欧州
- スペイン
- イタリア
- フランス
- ノルウェー
- ロシア
- その他の欧州
アジア太平洋
- 中国
- 日本
- インド
- オーストラリア
- 韓国
- その他のアジア太平洋地域
ラテンアメリカ
- ブラジル
- メキシコ
- その他のラテンアメリカ
中東・アフリカ
- GCC
- 南アフリカ
- その他の中東・アフリカ
また、2024年から2034年までの水力発電市場の主要企業のプロファイルも掲載している。
報告書に掲載されている主要企業
・ Å Energi
・ Alstom
・ American Electric Power Company, Inc.
・ Andritz AG
・ British Columbia Hydro and Power Authority
・ China Three Gorges Corporation
・ Duke Energy Corporation
・ Électricité de France (EDF)
・ Eletrobras
・ Enel S.p.A
・ GE Renewable Energy
・ Ontario Power Generation Inc.
・ SSE plc
・ State Power Investment Corporation
・ Voith Group
2024年から2034年までの世界の水力発電市場全体の売上高(金額ベース)は、2024年に2,656億米ドルを突破する。2034年まで力強い収益成長を予測。当調査では、最も大きな可能性を秘めた企業を特定しています。彼らの能力、進歩、商業的展望を発見し、一歩先を行くお手伝いをします。
水力発電市場、2024-2034年レポートはどのようにお役に立ちますか?
要約すると、420ページに及ぶこのレポートは、以下のような知識を提供する:
- 水力発電市場の2024年から2034年までの収益予測 市場量(GW)、タイプ、エンドユーザー、容量、CAPEXの各予測を世界および地域レベルで掲載 - 業界の展望を発見し、投資と収益に最も有利な場所を見つけることができます。
- 4つの地域と20の主要国市場の2034年までの収益予測 - 北米、欧州、アジア太平洋、ラテンアメリカ、中東・アフリカの水力発電市場の2024年から2034年までの予測をご覧ください。また、米国、カナダ、ブラジル、ドイツ、フランス、英国、ノルウェー、スペイン、ロシア、中国、インド、日本、オーストラリアなどの主要国の市場も予測しています。
- 既存企業や市場参入を目指す企業の展望 - 水力発電市場に関わる主要企業15社の企業プロファイルを含む、2024年から2034年までの市場。
独自の予測による定量的・定性的分析をご覧ください。私たちのレポートだけに含まれる情報を入手し、貴重なビジネスインテリジェンスで情報を得ることができます。
他にはない情報
私たちの新しいレポートがあれば、知識に遅れをとったり、チャンスを逃したりする可能性が低くなります。弊社のレポートが貴社の調査、分析、意思決定にどのように役立つかをご覧ください。Visiongainの調査は、水力発電市場、2024年から2034年、市場をリードする企業の商業分析を必要とするすべての人のためのものです。データ、トレンド、予測をご覧いただけます。
ページTOPに戻る
目次
目次
1 レポート概要
1.1 研究の目的
1.2 水力発電市場の紹介
1.3 本レポートの特徴
1.4 本レポートを読むべき理由
1.5 本分析レポートが回答する主な質問
1.6 本レポートは誰のためのものか?
1.7 方法論
1.7.1 市場の定義
1.7.2 市場評価・予測手法
1.7.3 データの検証
1.7.3.1 一次調査
1.7.3.2 セカンダリーリサーチ
1.8 よくある質問(FAQ)
1.9 Visiongainの関連レポート
1.10 Visiongainについて
2 エグゼクティブ・サマリー
3 市場概要
3.1 主要な調査結果
3.2 市場ダイナミクス
3.2.1 市場牽引要因
3.2.1.1 水力発電は低炭素発電に大きく貢献する
3.2.1.2 水力発電所の近代化の行方
3.2.1.3 柔軟で信頼性の高い発電が市場を牽引する
3.2.2 市場の抑制要因
3.2.2.1 新しい太陽光発電(PV)と陸上風力発電のコストは、水力発電の限界運転コスト以下になりつつある
3.2.2.2 発電エネルギーが季節の高低に左右されるため、供給が不安定であることが小水力発電導入の阻害要因になる可能性がある
3.2.2.3 水力発電事業は政策と規制に関する課題に直面している
3.2.3 市場機会
3.2.3.1 IoTと水力発電の統合が新たな機会を生むと期待される
3.2.3.2 新興国と発展途上国、特に公共部門投資を通じて世界の水力発電の成長を牽引してきた
3.2.3.3 アジア太平洋、アフリカ、中東で水力発電の拡大が予想される
3.3 ポーターのファイブフォース分析
3.3.1 サプライヤーの交渉力(中)
3.3.2 買い手の交渉力(中)
3.3.3 競争力(中)
3.3.4 代替品による脅威(中)
3.3.5 新規参入の脅威(低)
3.4 COVID-19の影響分析
3.4.1 "V字型回復"
3.4.2 "U字型回復"
3.4.3 "W字型回復"
3.4.4 "L字型回復"
3.5 PEST分析
4 水力発電市場分析:タイプ別
4.1 主要な調査結果
4.2 タイプ別セグメント 市場魅力度指数
4.3 タイプ別水力発電市場規模の推定と予測
4.4 インパウンドメント水力発電所
4.4.1 2024〜2034年の地域別市場規模(US$ Billion)
4.4.2 地域別市場シェア、2024年・2034年(%)
4.5 貯留式水力発電所
4.5.1 2024年~2034年の地域別市場規模(US$ Billion)
4.5.2 地域別市場シェア、2024年・2034年(%)
4.6 河川水力発電所
4.6.1 2024年~2034年の地域別市場規模(US$ Billion)
4.6.2 地域別市場シェア、2024年・2034年(%)
5 水力発電市場分析:容量別
5.1 主な調査結果
5.2 容量セグメント 市場魅力度指数
5.3 水力発電の容量別市場規模予測と予測
5.4 マイクロ&ピコ(100KW未満)
5.4.1 2024〜2034年の地域別市場規模(US$ Billion)
5.4.2 地域別市場シェア、2024年・2034年(%)
5.5 小型(100KW〜30MW)
5.5.1 2024年~2034年の地域別市場規模(US$ Billion)
5.5.2 地域別市場シェア、2024年・2034年(%)
5.6 大規模(30MW~100MW)
5.6.1 2024年~2034年の地域別市場規模(US$ Billion)
5.6.2 地域別市場シェア、2024年・2034年(%)
5.7 巨大市場(100MW以上)
5.7.1 2024年~2034年の地域別市場規模(US$ Billion)
5.7.2 地域別市場シェア、2024年・2034年(%)
6 水力発電市場分析:エンドユーザー別
6.1 主要な調査結果
6.2 エンドユーザーセグメント 市場魅力度指数
6.3 エンドユーザー別水力発電市場規模の推定と予測
6.4 産業用
6.4.1 2024〜2034年の地域別市場規模(US$ Billion)
6.4.2 地域別市場シェア、2024年・2034年(%)
6.5 業務用
6.5.1 2024〜2034年の地域別市場規模(US$ Billion)
6.5.2 地域別市場シェア、2024年・2034年(%)
6.6 家庭用
6.6.1 2024〜2034年の地域別市場規模(US$ Billion)
6.6.2 地域別市場シェア、2024年・2034年(%)
6.7 政府機関
6.7.1 2024年~2034年の地域別市場規模(US$ Billion)
6.7.2 地域別市場シェア、2024年・2034年(%)
6.8 その他のエンドユーザー
6.8.1 2024〜2034年の地域別市場規模(US$ Billion)
6.8.2 地域別市場シェア、2024年・2034年(%)
7 水力発電市場分析:CAPEX別
7.1 主要調査結果
7.2 CAPEXセグメント 市場魅力度指数
7.3 CAPEX別水力発電市場規模の推定と予測
7.4 土木建設
7.4.1 2024〜2034年の地域別市場規模(US$ Billion)
7.4.2 地域別市場シェア、2024年・2034年(%)
7.5 電気機械設備
7.5.1 2024~2034年の地域別市場規模(US$ Billion)
7.5.2 地域別市場シェア、2024年・2034年(%)
7.6 電力インフラ
7.6.1 2024〜2034年の地域別市場規模(US$ Billion)
7.6.2 地域別市場シェア、2024年・2034年(%)
7.7 送電網接続インフラ
7.7.1 2024〜2034年の地域別市場規模(US$ Billion)
7.7.2 2024年および2034年の地域別市場シェア(%)
7.8 メンテナンスと修理
7.8.1 2024〜2034年の地域別市場規模(US$ Billion)
7.8.2 地域別市場シェア、2024年・2034年(%)
7.9 雑費
7.9.1 2024〜2034年の地域別市場規模(US$ Billion)
7.9.2 地域別市場シェア、2024年・2034年(%)
8 水力発電市場分析:地域別
8.1 主要な調査結果
8.2 地域別市場規模の推定と予測
9 北米の水力発電市場分析
9.1 主要な調査結果
9.2 北米の水力発電市場魅力度指数
9.3 北米の国別水力発電市場、2024年、2029年、2034年(US$ Billion)
9.4 北米の水力発電市場規模推計と予測
9.5 北米の水力発電市場規模推定と予測:国別
9.6 北米の水力発電市場規模推定と予測:タイプ別
9.7 北米の水力発電市場規模推定と予測:容量別
9.8 北米の水力発電市場規模推定と予測:エンドユーザー別
9.9 北米の水力発電市場規模推定と予測:CAPEX別
9.10 アメリカの水力発電市場分析
9.11 カナダの水力発電市場分析
10 欧州の水力発電市場分析
10.1 主要な調査結果
10.2 欧州水力発電市場魅力度指数
10.3 欧州の国別水力発電市場、2024年、2029年、2034年(US$ Billion)
10.4 欧州の水力発電市場規模推定と予測
10.5 欧州の水力発電市場規模推定と予測:国別
10.6 欧州の水力発電市場規模推定と予測:タイプ別
10.7 欧州の水力発電市場規模推定と予測:容量別予測
10.8 欧州の水力発電市場規模推定と予測:エンドユーザー別
10.9 欧州の水力発電市場規模推定と予測:CAPEX別
10.10 スペインの水力発電市場分析
10.11 イタリアの水力発電市場分析
10.12 フランスの水力発電市場分析
10.13 ノルウェーの水力発電市場の分析
10.14 ロシアの水力発電市場の分析
10.15 その他の欧州の水力発電市場の分析
11 アジア太平洋水力発電市場分析
11.1 主要な調査結果
11.2 アジア太平洋地域の水力発電市場魅力度指数
11.3 アジア太平洋地域の国別水力発電市場、2024年、2029年、2034年(US$ Billion)
11.4 アジア太平洋地域の水力発電市場規模推定と予測
11.5 アジア太平洋地域の水力発電市場規模推定と予測:国別
11.6 アジア太平洋地域の水力発電市場規模推定と予測:タイプ別
11.7 アジア太平洋地域の水力発電市場規模推定と予測:容量別
11.8 アジア太平洋地域の水力発電市場規模推定と予測:エンドユーザー別
11.9 アジア太平洋地域の水力発電市場規模推定と予測:CAPEX別
11.10 中国の水力発電市場分析
11.11 インドの水力発電市場分析
11.12 日本の水力発電市場の分析
11.13 韓国の水力発電市場分析
11.14 オーストラリア水力発電市場の分析
11.15 その他のアジア太平洋地域の水力発電市場分析
12 中東・アフリカ水力発電市場分析
12.1 主要な調査結果
12.2 中東・アフリカの水力発電市場魅力度指数
12.3 中東・アフリカの国別水力発電市場、2024年、2029年、2034年(US$ Billion)
12.4 中東・アフリカの水力発電市場の規模推定と予測
12.5 中東・アフリカの水力発電市場規模推定と予測:国別
12.6 中東・アフリカの水力発電市場規模推定と予測:タイプ別
12.7 中東・アフリカの水力発電市場規模推定と予測:容量別予測
12.8 中東・アフリカの水力発電市場規模推定と予測:エンドユーザー別
12.9 中東・アフリカの水力発電市場規模推定と予測:CAPEX別
12.10 GCCの水力発電市場分析
12.11 南アフリカの水力発電市場分析
12.12 その他の中東・アフリカ水力発電市場の分析
13 ラテンアメリカの水力発電市場分析
13.1 主要な調査結果
13.2 ラテンアメリカの水力発電市場魅力度指数
13.3 ラテンアメリカの国別水力発電市場、2024年、2029年、2034年(US$ Billion)
13.4 ラテンアメリカの水力発電市場規模推定と予測
13.5 ラテンアメリカの水力発電市場規模推定と予測:国別
13.6 ラテンアメリカの水力発電市場規模推定と予測:タイプ別予測
13.7 ラテンアメリカの水力発電市場規模推定と予測:容量別
13.8 ラテンアメリカの水力発電市場規模推定と予測:エンドユーザー別
13.9 ラテンアメリカの水力発電市場規模推定と予測:CAPEX別
13.10 ブラジルの水力発電市場分析
13.11 メキシコの水力発電市場分析
13.12 その他のラテンアメリカの水力発電市場分析
14 主要企業のプロファイル
14.1 競争環境、2022年
14.2 戦略的展望
14.3 China Three Gorges Corporation
14.3.1 会社概要
14.3.2 会社概要
14.3.3 財務分析
14.3.3.1 純収入、2018年~2022年
14.3.4 製品ベンチマーク
14.3.5 戦略的展望
14.4 State Power Investment Corporation
14.4.1 会社概要
14.4.2 会社概要
14.4.3 財務分析
14.4.3.1 純収入、2018年~2022年
14.4.3.2 事業セグメント収益シェア、2022年(%)
14.4.4 製品ベンチマーク
14.4.5 戦略的展望
14.5 Électricité de France (EDF)
14.5.1 会社概要
14.5.2 会社概要
14.5.3 財務分析
14.5.3.1 純収入、2018年~2022年
14.5.3.2 地域別収入シェア、2022年(%)
14.5.3.3 事業セグメント別収益シェア、2022年(%)
14.5.4 製品ベンチマーク
14.5.5 戦略的展望
14.6 Enel S.p.A
14.6.1 会社概要
14.6.2 会社概要
14.6.3 財務分析
14.6.3.1 純収入、2018年~2022年
14.6.3.2 地域別収益シェア、2022年(%)
14.6.3.3 事業セグメント別売上シェア、2022年(%)
14.6.4 製品ベンチマーク
14.6.5 戦略的展望
14.7 GE Renewable Energy
14.7.1 会社概要
14.7.2 会社概要
14.7.3 財務分析
14.7.3.1 純収入、2018-2022年
14.7.3.2 R&D、2018年~2022年
14.7.3.3 地域別収益シェア、2022年(%)
14.7.3.4 事業セグメント収益シェア、2022年(%)
14.7.4 製品ベンチマーク
14.7.5 戦略的展望
14.8 American Electric Power Company, Inc.
14.8.1 会社概要
14.8.2 会社概要
14.8.3 財務分析
14.8.3.1 純収入、2018-2022年
14.8.3.2 事業セグメント別売上高シェア、2022年(%)
14.8.4 製品ベンチマーク
14.8.5 戦略的展望
14.9 Duke Energy Corporation
14.9.1 会社概要
14.9.2 会社概要
14.9.3 財務分析
14.9.3.1 純収入、2018年~2022年
14.9.3.2 事業セグメント収益シェア、2022年(%)
14.9.4 製品ベンチマーク
14.9.5 戦略的展望
14.10 Ontario Power Generation Inc.
14.10.1 会社概要
14.10.2 会社概要
14.10.3 製品ベンチマーク
14.10.4 戦略的展望
14.11 Eletrobras
14.11.1 会社概要
14.11.2 会社概要
14.11.3 財務分析
14.11.3.1 純収入(2018年~2022年
14.11.3.2 R&D、2018年~2022年
14.11.4 製品ベンチマーク
14.11.5 戦略的展望
14.12 Voith Group
14.12.1 会社概要
14.12.2 会社概要
14.12.3 製品ベンチマーク
14.12.4 戦略的展望
14.13 Alstom
14.13.1 会社概要
14.13.2 会社概要
14.13.3 財務分析
14.13.3.1 純収入、2018年~2022年
14.13.3.2 売上高、2018年~2022年
14.13.4 製品ベンチマーク
14.13.5 戦略的展望
14.14 Andritz AG
14.14.1 会社概要
14.14.2 会社概要
14.14.3 財務分析
14.14.3.1 純収入、2018-2022年
14.14.4 製品ベンチマーク
14.14.5 戦略的展望
14.15 SSE plc
14.15.1 会社概要
14.15.2 会社概要
14.15.3 財務分析
14.15.3.1 純収入、2018年~2022年
14.15.4 製品ベンチマーク
14.15.5 戦略的展望
14.16 Å Energi
14.16.1 会社概要
14.16.2 会社概要
14.16.3 製品ベンチマーク
14.16.4 戦略的展望
14.17 British Columbia Hydro and Power Authority
14.17.1 会社概要
14.17.2 会社概要
14.17.3 製品ベンチマーク
14.17.4 戦略的展望
15 結論と提言
15.1 ビジョンゲインからの結びの言葉
15.2 市場プレイヤーへの提言
ページTOPに戻る
図表リスト
表の一覧
Table 1 Hydropower Market Snapshot, 2024 & 2034 (US$ Billion, CAGR %)
Table 2 Record Numbers of Solar Panels were Shipped in the United States during 2021
Table 3 Global Hydropower Market by Region, 2024-2034 (US$ Bn, AGR (%), CAGR (%)) (V-Shaped Recovery Scenario)
Table 4 Global Hydropower Market by Region, 2024-2034 (US$ Bn, AGR (%), CAGR (%)) (U-Shaped Recovery Scenario)
Table 5 Global Hydropower Market by Region, 2024-2034 (US$ Bn, AGR (%), CAGR (%)) (W-Shaped Recovery Scenario)
Table 6 Global Hydropower Market by Region, 2024-2034 (US$ Bn, AGR (%), CAGR (%)) (L-Shaped Recovery Scenario)
Table 7 Global Hydropower Market by Type, 2024-2034 (US$ Bn, AGR (%), CAGR (%))
Table 8 Impoundment Hydropower Plant Market by Region, 2024-2034 (US$ Bn, AGR (%), CAGR (%))
Table 9 Storage Hydropower Plant Market by Region, 2024-2034 (US$ Bn, AGR (%), CAGR (%))
Table 10 Run-of-River Hydropower Plant Market by Region, 2024-2034 (US$ Bn, AGR (%), CAGR (%))
Table 11 Global Hydropower Market by Capacity, 2024-2034 (US$ Bn, AGR (%), CAGR (%))
Table 12 Micro & Pico (Below 100 KW) Market by Region, 2024-2034 (US$ Bn, AGR (%), CAGR (%))
Table 13 Small (100KW – 30 MW) Market by Region, 2024-2034 (US$ Bn, AGR (%), CAGR (%))
Table 14 Large (30 MW - 100 MW) Market by Region, 2024-2034 (US$ Bn, AGR (%), CAGR (%))
Table 15 Gigantic (Above 100 MW) Market by Region, 2024-2034 (US$ Bn, AGR (%), CAGR (%))
Table 16 Global Hydropower Market by End-User, 2024-2034 (US$ Bn, AGR (%), CAGR (%))
Table 17 Industrial Market by Region, 2024-2034 (US$ Bn, AGR (%), CAGR (%))
Table 18 Commercial Market by Region, 2024-2034 (US$ Bn, AGR (%), CAGR (%))
Table 19 Residential Market by Region, 2024-2034 (US$ Bn, AGR (%), CAGR (%))
Table 20 Government and Institutes Market by Region, 2024-2034 (US$ Bn, AGR (%), CAGR (%))
Table 21 Other End-User Market by Region, 2024-2034 (US$ Bn, AGR (%), CAGR (%))
Table 22 Global Hydropower Market by CAPEX, 2024-2034 (US$ Bn, AGR (%), CAGR (%))
Table 23 Civil Construction Market by Region, 2024-2034 (US$ Bn, AGR (%), CAGR (%))
Table 24 Electromechanical Equipment Market by Region, 2024-2034 (US$ Bn, AGR (%), CAGR (%))
Table 25 Electric Power Infrastructure Market by Region, 2024-2034 (US$ Bn, AGR (%), CAGR (%))
Table 26 Grid Connection Infrastructure Market by Region, 2024-2034 (US$ Bn, AGR (%), CAGR (%))
Table 27 Maintenance and Repairs Market by Region, 2024-2034 (US$ Bn, AGR (%), CAGR (%))
Table 28 Miscellaneous Expenses Market by Region, 2024-2034 (US$ Bn, AGR (%), CAGR (%))
Table 29 Hydropower Market Forecast by Region, 2024-2034 (US$ Billion, AGR%, CAGR%)
Table 30 North America Hydropower Market by Value, 2024-2034 (US$ Bn, AGR (%), CAGR (%))
Table 31 North America Hydropower Market by Power Generation, 2024-2034 (GW, AGR (%), CAGR (%))
Table 32 North America Hydropower Market by Country, 2024-2034 (US$ Bn, AGR (%), CAGR (%))
Table 33 North America Hydropower Generation Market by Country, 2024-2034 (GW, AGR (%), CAGR (%))
Table 34 North America Hydropower Market by Type, 2024-2034 (US$ Bn, AGR (%), CAGR (%))
Table 35 North America Hydropower Market by Capacity, 2024-2034 (US$ Bn, AGR (%), CAGR (%))
Table 36 North America Hydropower Market by End-User, 2024-2034 (US$ Bn, AGR (%), CAGR (%))
Table 37 North America Hydropower Market by CAPEX, 2024-2034 (US$ Bn, AGR (%), CAGR (%))
Table 38 US Hydropower Market by Value, 2024-2034 (US$ Bn, AGR (%), CAGR (%))
Table 39 US Hydropower Market by Power Generation, 2024-2034 (GW, AGR (%), CAGR (%))
Table 40 Canada Hydropower Market by Value, 2024-2034 (US$ Bn, AGR (%), CAGR (%))
Table 41 Canada Hydropower Market by Power Generation, 2024-2034 (GW, AGR (%), CAGR (%))
Table 42 Europe Hydropower Market by Value, 2024-2034 (US$ Bn, AGR (%), CAGR (%))
Table 43 Europe Hydropower Market by Power Generation, 2024-2034 (GW, AGR (%), CAGR (%))
Table 44 Europe Hydropower Market by Country, 2024-2034 (US$ Bn, AGR (%), CAGR (%))
Table 45 Europe Hydropower Generation Market by Country, 2024-2034 (GW, AGR (%), CAGR (%))
Table 46 Europe Hydropower Market by Type, 2024-2034 (US$ Bn, AGR (%), CAGR (%))
Table 47 Europe Hydropower Market by Capacity, 2024-2034 (US$ Bn, AGR (%), CAGR (%))
Table 48 Europe Hydropower Market by End-User, 2024-2034 (US$ Bn, AGR (%), CAGR (%))
Table 49 Europe Hydropower Market by CAPEX, 2024-2034 (US$ Bn, AGR (%), CAGR (%))
Table 50 Spain Hydropower Market by Value, 2024-2034 (US$ Bn, AGR (%), CAGR (%))
Table 51 Spain Hydropower Market by Power Generation, 2024-2034 (GW, AGR (%), CAGR (%))
Table 52 Italy Hydropower Market by Value, 2024-2034 (US$ Bn, AGR (%), CAGR (%))
Table 53 Italy Hydropower Market by Power Generation, 2024-2034 (GW, AGR (%), CAGR (%))
Table 54 France Hydropower Market by Value, 2024-2034 (US$ Bn, AGR (%), CAGR (%))
Table 55 France Hydropower Market by Power Generation, 2024-2034 (GW, AGR (%), CAGR (%))
Table 56 Norway Hydropower Market by Value, 2024-2034 (US$ Bn, AGR (%), CAGR (%))
Table 57 Norway Hydropower Market by Power Generation, 2024-2034 (GW, AGR (%), CAGR (%))
Table 58 Russia Hydropower Market by Value, 2024-2034 (US$ Bn, AGR (%), CAGR (%))
Table 59 Russia Hydropower Market by Power Generation, 2024-2034 (GW, AGR (%), CAGR (%))
Table 60 Rest of Europe Hydropower Market by Value, 2024-2034 (US$ Bn, AGR (%), CAGR (%))
Table 61 Rest of Europe Hydropower Market by Power Generation, 2024-2034 (GW, AGR (%), CAGR (%))
Table 62 Asia-Pacific Hydropower Market by Value, 2024-2034 (US$ Bn, AGR (%), CAGR (%))
Table 63 Asia-Pacific Hydropower Market by Power Generation, 2024-2034 (GW, AGR (%), CAGR (%))
Table 64 Asia-Pacific Hydropower Market by Country, 2024-2034 (US$ Bn, AGR (%), CAGR (%))
Table 65 Asia-Pacific Hydropower Generation Market by Country, 2024-2034 (GW, AGR (%), CAGR (%))
Table 66 Asia-Pacific Hydropower Market by Type, 2024-2034 (US$ Bn, AGR (%), CAGR (%))
Table 67 Asia-Pacific Hydropower Market by Capacity, 2024-2034 (US$ Bn, AGR (%), CAGR (%))
Table 68 Asia-Pacific Hydropower Market by End-User, 2024-2034 (US$ Bn, AGR (%), CAGR (%))
Table 69 Asia-Pacific Hydropower Market by CAPEX, 2024-2034 (US$ Bn, AGR (%), CAGR (%))
Table 70 China Hydropower Market by Value, 2024-2034 (US$ Bn, AGR (%), CAGR (%))
Table 71 China Hydropower Market by Power Generation, 2024-2034 (GW, AGR (%), CAGR (%))
Table 72 India Hydropower Market by Value, 2024-2034 (US$ Bn, AGR (%), CAGR (%))
Table 73 India Hydropower Market by Power Generation, 2024-2034 (GW, AGR (%), CAGR (%))
Table 74 Japan Hydropower Market by Value, 2024-2034 (US$ Bn, AGR (%), CAGR (%))
Table 75 Japan Hydropower Market by Power Generation, 2024-2034 (GW, AGR (%), CAGR (%))
Table 76 South Korea Hydropower Market by Value, 2024-2034 (US$ Bn, AGR (%), CAGR (%))
Table 77 South Korea Hydropower Market by Power Generation, 2024-2034 (GW, AGR (%), CAGR (%))
Table 78 Australia Hydropower Market by Value, 2024-2034 (US$ Bn, AGR (%), CAGR (%))
Table 79 Australia Hydropower Market by Power Generation, 2024-2034 (GW, AGR (%), CAGR (%))
Table 80 Rest of Asia-Pacific Hydropower Market by Value, 2024-2034 (US$ Bn, AGR (%), CAGR (%))
Table 81 Rest of Asia-Pacific Hydropower Market by Power Generation, 2024-2034 (GW, AGR (%), CAGR (%))
Table 82 Middle East & Africa Hydropower Market by Value, 2024-2034 (US$ Bn, AGR (%), CAGR (%))
Table 83 Middle East & Africa Hydropower Market by Power Generation, 2024-2034 (GW, AGR (%), CAGR (%))
Table 84 Middle East & Africa Hydropower Market by Country, 2024-2034 (US$ Bn, AGR (%), CAGR (%))
Table 85 Middle East & Africa Hydropower Generation Market by Country, 2024-2034 (GW, AGR (%), CAGR (%))
Table 86 Middle East & Africa Hydropower Market by Type, 2024-2034 (US$ Bn, AGR (%), CAGR (%))
Table 87 Middle East & Africa Hydropower Market by Capacity, 2024-2034 (US$ Bn, AGR (%), CAGR (%))
Table 88 Middle East & Africa Hydropower Market by End-User, 2024-2034 (US$ Bn, AGR (%), CAGR (%))
Table 89 Middle East & Africa Hydropower Market by CAPEX, 2024-2034 (US$ Bn, AGR (%), CAGR (%))
Table 90 GCC Hydropower Market by Value, 2024-2034 (US$ Bn, AGR (%), CAGR (%))
Table 91 GCC Hydropower Market by Power Generation, 2024-2034 (GW, AGR (%), CAGR (%))
Table 92 South Africa Hydropower Market by Value, 2024-2034 (US$ Bn, AGR (%), CAGR (%))
Table 93 South Africa Hydropower Market by Power Generation, 2024-2034 (GW, AGR (%), CAGR (%))
Table 94 Rest of Middle East & Africa Hydropower Market by Value, 2024-2034 (US$ Bn, AGR (%), CAGR (%))
Table 95 Rest of Middle East & Africa Hydropower Market by Power Generation, 2024-2034 (GW, AGR (%), CAGR (%))
Table 96 Latin America Hydropower Market by Value, 2024-2034 (US$ Bn, AGR (%), CAGR (%))
Table 97 Latin America Hydropower Market by Power Generation, 2024-2034 (GW, AGR (%), CAGR (%))
Table 98 Latin America Hydropower Market by Country, 2024-2034 (US$ Bn, AGR (%), CAGR (%))
Table 99 Latin America Hydropower Generation Market by Country, 2024-2034 (GW, AGR (%), CAGR (%))
Table 100 Latin America Hydropower Market by Type, 2024-2034 (US$ Bn, AGR (%), CAGR (%))
Table 101 Latin America Hydropower Market by Capacity, 2024-2034 (US$ Bn, AGR (%), CAGR (%))
Table 102 Latin America Hydropower Market by End-User, 2024-2034 (US$ Bn, AGR (%), CAGR (%))
Table 103 Latin America Hydropower Market by CAPEX, 2024-2034 (US$ Bn, AGR (%), CAGR (%))
Table 104 Brazil Hydropower Market by Value, 2024-2034 (US$ Bn, AGR (%), CAGR (%))
Table 105 Brazil Hydropower Market by Power Generation, 2024-2034 (GW, AGR (%), CAGR (%))
Table 106 Mexico Hydropower Market by Value, 2024-2034 (US$ Bn, AGR (%), CAGR (%))
Table 107 Mexico Hydropower Market by Power Generation, 2024-2034 (GW, AGR (%), CAGR (%))
Table 108 Rest of Latin America Hydropower Market by Value, 2024-2034 (US$ Bn, AGR (%), CAGR (%))
Table 109 Rest of Latin America Hydropower Market by Power Generation, 2024-2034 (GW, AGR (%), CAGR (%))
Table 110 Strategic Outlook - Contract
Table 111 China Three Gorges Corporation: Key Details, (CEO, HQ, Revenue, Founded, No. of Employees, Company Type, Website, Business Segment)
Table 112 China Three Gorges Corporation: Product Benchmarking
Table 113 China Three Gorges Corporation: Strategic Outlook
Table 114 State Power Investment Corporation: Key Details, (CEO, HQ, Revenue, Founded, No. of Employees, Company Type, Website, Business Segment)
Table 115 State Power Investment Corporation: Product Benchmarking
Table 116 State Power Investment Corporation: Strategic Outlook
Table 117 Électricité de France (EDF): Key Details, (CEO, HQ, Revenue, Founded, No. of Employees, Company Type, Website, Business Segment)
Table 118 Électricité de France (EDF): Product Benchmarking
Table 119 Électricité de France (EDF): Strategic Outlook
Table 120 Enel S.p.A: Key Details, (CEO, HQ, Revenue, Founded, No. of Employees, Company Type, Website, Business Segment)
Table 121 Enel S.p.A: Product Benchmarking
Table 122 Enel S.p.A: Strategic Outlook
Table 123 GE Renewable Energy: Key Details, (CEO, HQ, Revenue, Founded, No. of Employees, Company Type, Website, Business Segment)
Table 124 GE Renewable Energy: Product Benchmarking
Table 125 GE Renewable Energy: Strategic Outlook
Table 126 American Electric Power Company, Inc.: Key Details, (CEO, HQ, Revenue, Founded, No. of Employees, Company Type, Website, Business Segment)
Table 127 American Electric Power Company, Inc.: Product Benchmarking
Table 128 American Electric Power Company, Inc.: Strategic Outlook
Table 129 Duke Energy Corporation: Key Details, (CEO, HQ, Revenue, Founded, No. of Employees, Company Type, Website, Business Segment)
Table 130 Duke Energy Corporation: Product Benchmarking
Table 131 Duke Energy Corporation: Strategic Outlook
Table 132 Ontario Power Generation Inc.: Key Details, (CEO, HQ, Revenue, Founded, No. of Employees, Company Type, Website, Business Segment)
Table 133 Ontario Power Generation Inc.: Product Benchmarking
Table 134 Ontario Power Generation Inc.: Strategic Outlook
Table 135 Eletrobras: Key Details, (CEO, HQ, Revenue, Founded, No. of Employees, Company Type, Website, Business Segment)
Table 136 Eletrobras: Product Benchmarking
Table 137 Eletrobras: Strategic Outlook
Table 138 Voith Group: Key Details, (CEO, HQ, Revenue, Founded, No. of Employees, Company Type, Website, Business Segment)
Table 139 Voith Group: Product Benchmarking
Table 140 Voith Group: Strategic Outlook
Table 141 Alstom: Key Details, (CEO, HQ, Revenue, Founded, No. of Employees, Company Type, Website, Business Segment)
Table 142 Alstom: Product Benchmarking
Table 143 Alstom: Strategic Outlook
Table 144 Andritz AG: Key Details, (CEO, HQ, Revenue, Founded, No. of Employees, Company Type, Website, Business Segment)
Table 145 Andritz AG: Product Benchmarking
Table 146 Andritz AG: Strategic Outlook
Table 147 SSE plc: Key Details, (CEO, HQ, Revenue, Founded, No. of Employees, Company Type, Website, Business Segment)
Table 148 SSE plc: Product Benchmarking
Table 149 SSE plc: Strategic Outlook
Table 150 Å Energi: Key Details, (CEO, HQ, Revenue, Founded, No. of Employees, Company Type, Website, Business Segment)
Table 151 Å Energi: Product Benchmarking
Table 152 Å Energi: Strategic Outlook
Table 153 British Columbia Hydro and Power Authority: Key Details, (CEO, HQ, Revenue, Founded, No. of Employees, Company Type, Website, Business Segment)
Table 154 British Columbia Hydro and Power Authority: Product Benchmarking
Table 155 British Columbia Hydro and Power Authority: Strategic Outlook
図の一覧
Figure 1 Hydropower Market Segmentation
Figure 2 Hydropower Market by Type: Market Attractiveness Index
Figure 3 Hydropower Market by Capacity: Market Attractiveness Index
Figure 4 Hydropower Market by End-User: Market Attractiveness Index
Figure 5 Hydropower Market by CAPEX: Market Attractiveness Index
Figure 6 Hydropower Market Attractiveness Index by Region
Figure 7 Hydropower Market: Market Dynamics
Figure 8 Global Solar PV Installed Cost
Figure 9 Solar PV and Onshore Wind Investment Cost Estimates for New Contracted Projects Under High Commodity Prices (2018-2023)
Figure 10 Hydropower Market: Porter’s Five Forces Analysis
Figure 11 Global Hydropower Market Share Forecast by COVID, 2024-2034 (%)
Figure 12 Global Hydropower Market by Region, 2024-2034 (US$ Bn, AGR (%)) (V-Shaped Recovery Scenario)
Figure 13 Global Hydropower Market by Region, 2024-2034 (US$ Bn, AGR (%)) (U-Shaped Recovery Scenario)
Figure 14 Global Hydropower Market by Region, 2024-2034 (US$ Bn, AGR (%)) (W-Shaped Recovery Scenario)
Figure 15 Global Hydropower Market by Region, 2024-2034 (US$ Bn, AGR (%)) (L-Shaped Recovery Scenario)
Figure 16 Hydropower Market: PEST Analysis
Figure 17 Hydropower Market by Type: Market Attractiveness Index
Figure 18 Global Hydropower Market by Type, 2024-2034 (US$ Bn, AGR (%))
Figure 19 Hydropower Market Share Forecast by Type, 2024, 2029, 2034 (%)
Figure 20 Impoundment Hydropower Plant Market by Region, 2024-2034 (US$ Bn, AGR (%))
Figure 21 Impoundment Hydropower Plant Market Share Forecast by Region, 2024 & 2034 (%)
Figure 22 Storage Hydropower Plant Market by Region, 2024-2034 (US$ Bn, AGR (%))
Figure 23 Storage Hydropower Plant Market Share Forecast by Region, 2024 & 2034 (%)
Figure 24 Run-of-River Hydropower Plant Market by Region, 2024-2034 (US$ Bn, AGR (%))
Figure 25 Run-of-River Hydropower Plant Market Share Forecast by Region, 2024 & 2034 (%)
Figure 26 Hydropower Market by Capacity: Market Attractiveness Index
Figure 27 Global Hydropower Market by Capacity, 2024-2034 (US$ Bn, AGR (%))
Figure 28 Hydropower Market Share Forecast by Capacity, 2024, 2029, 2034 (%)
Figure 29 Micro & Pico (Below 100 KW) Market by Region, 2024-2034 (US$ Bn, AGR (%))
Figure 30 Micro & Pico (Below 100 KW) Market Share Forecast by Region, 2024 & 2034 (%)
Figure 31 Small (100KW – 30 MW) Market by Region, 2024-2034 (US$ Bn, AGR (%))
Figure 32 Small (100KW – 30 MW) Market Share Forecast by Region, 2024 & 2034 (%)
Figure 33 Large (30 MW - 100 MW) Market by Region, 2024-2034 (US$ Bn, AGR (%))
Figure 34 Large (30 MW - 100 MW) Market Share Forecast by Region, 2024 & 2034 (%)
Figure 35 Gigantic (Above 100 MW) Market by Region, 2024-2034 (US$ Bn, AGR (%))
Figure 36 Gigantic (Above 100 MW) Market Share Forecast by Region, 2024 & 2034 (%)
Figure 37 Hydropower Market by End-User: Market Attractiveness Index
Figure 38 Global Hydropower Market by End-User, 2024-2034 (US$ Bn, AGR (%))
Figure 39 Hydropower Market Share Forecast by End-User, 2024, 2029, 2034 (%)
Figure 40 Industrial Market by Region, 2024-2034 (US$ Bn, AGR (%))
Figure 41 Industrial Market Share Forecast by Region, 2024 & 2034 (%)
Figure 42 Commercial Market by Region, 2024-2034 (US$ Bn, AGR (%))
Figure 43 Commercial Market Share Forecast by Region, 2024 & 2034 (%)
Figure 44 Residential Market by Region, 2024-2034 (US$ Bn, AGR (%))
Figure 45 Residential Market Share Forecast by Region, 2024 & 2034 (%)
Figure 46 Government and Institutes Market by Region, 2024-2034 (US$ Bn, AGR (%))
Figure 47 Government and Institutes Market Share Forecast by Region, 2024 & 2034 (%)
Figure 48 Other End-User Market by Region, 2024-2034 (US$ Bn, AGR (%))
Figure 49 Other End-User Market Share Forecast by Region, 2024 & 2034 (%)
Figure 50 Hydropower Market by CAPEX: Market Attractiveness Index
Figure 51 Global Hydropower Market by CAPEX, 2024-2034 (US$ Bn, AGR (%))
Figure 52 Hydropower Market Share Forecast by CAPEX, 2024, 2029, 2034 (%)
Figure 53 Civil Construction Market by Region, 2024-2034 (US$ Bn, AGR (%))
Figure 54 Civil Construction Market Share Forecast by Region, 2024 & 2034 (%)
Figure 55 Electromechanical Equipment Market by Region, 2024-2034 (US$ Bn, AGR (%))
Figure 56 Electromechanical Equipment Market Share Forecast by Region, 2024 & 2034 (%)
Figure 57 Electric Power Infrastructure Market by Region, 2024-2034 (US$ Bn, AGR (%))
Figure 58 Electric Power Infrastructure Market Share Forecast by Region, 2024 & 2034 (%)
Figure 59 Grid Connection Infrastructure Market by Region, 2024-2034 (US$ Bn, AGR (%))
Figure 60 Grid Connection Infrastructure Market Share Forecast by Region, 2024 & 2034 (%)
Figure 61 Maintenance and Repairs Market by Region, 2024-2034 (US$ Bn, AGR (%))
Figure 62 Maintenance and Repairs Market Share Forecast by Region, 2024 & 2034 (%)
Figure 63 Miscellaneous Expenses Market by Region, 2024-2034 (US$ Bn, AGR (%))
Figure 64 Miscellaneous Expenses Market Share Forecast by Region, 2024 & 2034 (%)
Figure 65 Hydropower Market Forecast by Region 2024 and 2034 (Revenue, CAGR%)
Figure 66 Hydropower Market Share Forecast by Region 2024, 2029, 2034 (%)
Figure 67 Hydropower Market by Region, 2024-2034 (US$ Billion, AGR %)
Figure 68 North America Hydropower Market Attractiveness Index
Figure 69 North America Hydropower Market by Region, 2024, 2029 & 2034 (US$ Billion)
Figure 70 North America Hydropower Market by Value, 2024-2034 (US$ Bn, AGR (%))
Figure 71 North America Hydropower Market by Power Generation, 2024-2034 (GW, AGR (%))
Figure 72 North America Hydropower Market by Country, 2024-2034 (US$ Bn, AGR (%))
Figure 73 North America Hydropower Generation Market by Country, 2024-2034 (GW, AGR (%))
Figure 74 North America Hydropower Market Share Forecast by Country, 2024 & 2034 (%)
Figure 75 North America Hydropower Market by Type, 2024-2034 (US$ Bn, AGR (%))
Figure 76 North America Hydropower Market Share Forecast Type, 2024 & 2034 (%)
Figure 77 North America Hydropower Market by Capacity, 2024-2034 (US$ Bn, AGR (%))
Figure 78 North America Hydropower Market Share Forecast by Capacity, 2024 & 2034 (%)
Figure 79 North America Hydropower Market by End-User, 2024-2034 (US$ Bn, AGR (%))
Figure 80 North America Hydropower Market Share Forecast by End-User, 2024 & 2034 (%)
Figure 81 North America Hydropower Market by CAPEX, 2024-2034 (US$ Bn, AGR (%))
Figure 82 North America Hydropower Market Share Forecast by CAPEX, 2024 & 2034 (%)
Figure 83 US Hydropower Market by Value, 2024-2034 (US$ Bn, AGR (%))
Figure 84 US Hydropower Market by Power Generation, 2024-2034 (GW, AGR (%))
Figure 85 Canada Hydropower Market by Value, 2024-2034 (US$ Bn, AGR (%))
Figure 86 Canada Hydropower Market by Power Generation, 2024-2034 (GW, AGR (%))
Figure 87 Europe Hydropower Market Attractiveness Index
Figure 88 Europe Hydropower Market by Region, 2024, 2029 & 2034 (US$ Billion)
Figure 89 Europe Hydropower Market by Value, 2024-2034 (US$ Bn, AGR (%))
Figure 90 Europe Hydropower Market by Power Generation, 2024-2034 (GW, AGR (%))
Figure 91 Europe Hydropower Market by Country, 2024-2034 (US$ Bn, AGR (%))
Figure 92 Europe Hydropower Generation Market by Country, 2024-2034 (GW, AGR (%))
Figure 93 Europe Hydropower Market Share Forecast by Country, 2024 & 2034 (%)
Figure 94 Europe Hydropower Market by Type, 2024-2034 (US$ Bn, AGR (%))
Figure 95 Europe Hydropower Market Share Forecast Type, 2024 & 2034 (%)
Figure 96 Europe Hydropower Market by Capacity, 2024-2034 (US$ Bn, AGR (%))
Figure 97 Europe Hydropower Market Share Forecast by Capacity, 2024 & 2034 (%)
Figure 98 Europe Hydropower Market by End-User, 2024-2034 (US$ Bn, AGR (%))
Figure 99 Europe Hydropower Market Share Forecast by End-User, 2024 & 2034 (%)
Figure 100 Europe Hydropower Market by CAPEX, 2024-2034 (US$ Bn, AGR (%))
Figure 101 Europe Hydropower Market Share Forecast by CAPEX, 2024 & 2034 (%)
Figure 102 Spain Hydropower Market by Value, 2024-2034 (US$ Bn, AGR (%))
Figure 103 Spain Hydropower Market by Power Generation, 2024-2034 (GW, AGR (%))
Figure 104 Italy Hydropower Market by Value, 2024-2034 (US$ Bn, AGR (%))
Figure 105 Italy Hydropower Market by Power Generation, 2024-2034 (GW, AGR (%))
Figure 106 France Hydropower Market by Value, 2024-2034 (US$ Bn, AGR (%))
Figure 107 France Hydropower Market by Power Generation, 2024-2034 (GW, AGR (%))
Figure 108 Norway Hydropower Market by Value, 2024-2034 (US$ Bn, AGR (%))
Figure 109 Norway Hydropower Market by Power Generation, 2024-2034 (GW, AGR (%))
Figure 110 Russia Hydropower Market by Value, 2024-2034 (US$ Bn, AGR (%))
Figure 111 Russia Hydropower Market by Power Generation, 2024-2034 (GW, AGR (%))
Figure 112 Rest of Europe Hydropower Market by Value, 2024-2034 (US$ Bn, AGR (%))
Figure 113 Rest of Europe Hydropower Market by Power Generation, 2024-2034 (GW, AGR (%))
Figure 114 Asia-Pacific Hydropower Market Attractiveness Index
Figure 115 Asia-Pacific Hydropower Market by Region, 2024, 2029 & 2034 (US$ Billion)
Figure 116 Asia-Pacific Hydropower Market by Value, 2024-2034 (US$ Bn, AGR (%))
Figure 117 Asia-Pacific Hydropower Market by Power Generation, 2024-2034 (GW, AGR (%))
Figure 118 Asia-Pacific Hydropower Market by Country, 2024-2034 (US$ Bn, AGR (%))
Figure 119 Asia-Pacific Hydropower Generation Market by Country, 2024-2034 (GW, AGR (%))
Figure 120 Asia-Pacific Hydropower Market Share Forecast by Country, 2024 & 2034 (%)
Figure 121 Asia-Pacific Hydropower Market by Type, 2024-2034 (US$ Bn, AGR (%))
Figure 122 Asia-Pacific Hydropower Market Share Forecast Type, 2024 & 2034 (%)
Figure 123 Asia-Pacific Hydropower Market by Capacity, 2024-2034 (US$ Bn, AGR (%))
Figure 124 Asia-Pacific Hydropower Market Share Forecast by Capacity, 2024 & 2034 (%)
Figure 125 Asia-Pacific Hydropower Market by End-User, 2024-2034 (US$ Bn, AGR (%))
Figure 126 Asia-Pacific Hydropower Market Share Forecast by End-User, 2024 & 2034 (%)
Figure 127 Asia-Pacific Hydropower Market by CAPEX, 2024-2034 (US$ Bn, AGR (%))
Figure 128 Asia-Pacific Hydropower Market Share Forecast by CAPEX, 2024 & 2034 (%)
Figure 129 China Hydropower Market by Value, 2024-2034 (US$ Bn, AGR (%))
Figure 130 China Hydropower Market by Power Generation, 2024-2034 (GW, AGR (%))
Figure 131 India Hydropower Market by Value, 2024-2034 (US$ Bn, AGR (%))
Figure 132 India Hydropower Market by Power Generation, 2024-2034 (GW, AGR (%))
Figure 133 Japan Hydropower Market by Value, 2024-2034 (US$ Bn, AGR (%))
Figure 134 Japan Hydropower Market by Power Generation, 2024-2034 (GW, AGR (%))
Figure 135 South Korea Hydropower Market by Value, 2024-2034 (US$ Bn, AGR (%))
Figure 136 South Korea Hydropower Market by Power Generation, 2024-2034 (GW, AGR (%))
Figure 137 Australia Hydropower Market by Value, 2024-2034 (US$ Bn, AGR (%))
Figure 138 Australia Hydropower Market by Power Generation, 2024-2034 (GW, AGR (%))
Figure 139 Rest of Asia-Pacific Hydropower Market by Value, 2024-2034 (US$ Bn, AGR (%))
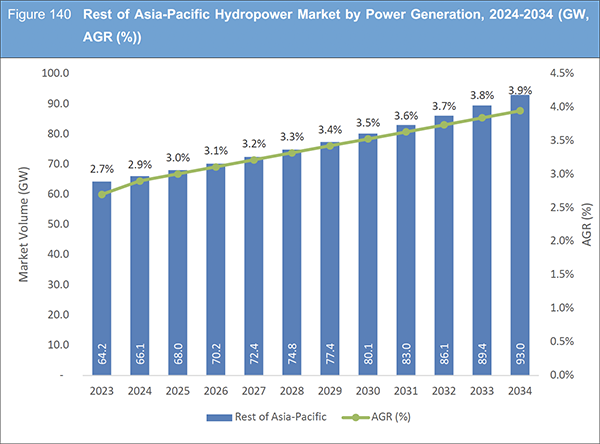
Figure 140 Rest of Asia-Pacific Hydropower Market by Power Generation, 2024-2034 (GW, AGR (%))
Figure 141 Middle East and Africa Hydropower Market Attractiveness Index
Figure 142 Middle East and Africa Hydropower Market by Region, 2024, 2029 & 2034 (US$ Billion)
Figure 143 Middle East & Africa Hydropower Market by Value, 2024-2034 (US$ Bn, AGR (%))
Figure 144 Middle East & Africa Hydropower Market by Power Generation, 2024-2034 (GW, AGR (%))
Figure 145 Middle East & Africa Hydropower Market by Country, 2024-2034 (US$ Bn, AGR (%))
Figure 146 Middle East & Africa Hydropower Generation Market by Country, 2024-2034 (GW, AGR (%))
Figure 147 Middle East and Africa Hydropower Market Share Forecast by Country, 2024 & 2034 (%)
Figure 148 Middle East & Africa Hydropower Market by Type, 2024-2034 (US$ Bn, AGR (%))
Figure 149 Middle East and Africa Hydropower Market Share Forecast Type, 2024 & 2034 (%)
Figure 150 Middle East & Africa Hydropower Market by Capacity, 2024-2034 (US$ Bn, AGR (%))
Figure 151 Middle East and Africa Hydropower Market Share Forecast by Capacity, 2024 & 2034 (%)
Figure 152 Middle East & Africa Hydropower Market by End-User, 2024-2034 (US$ Bn, AGR (%))
Figure 153 Middle East and Africa Hydropower Market Share Forecast by End-User, 2024 & 2034 (%)
Figure 154 Middle East & Africa Hydropower Market by CAPEX, 2024-2034 (US$ Bn, AGR (%))
Figure 155 Middle East and Africa Hydropower Market Share Forecast by CAPEX, 2024 & 2034 (%)
Figure 156 GCC Hydropower Market by Value, 2024-2034 (US$ Bn, AGR (%))
Figure 157 GCC Hydropower Market by Power Generation, 2024-2034 (GW, AGR (%))
Figure 158 South Africa Hydropower Market by Value, 2024-2034 (US$ Bn, AGR (%))
Figure 159 South Africa Hydropower Market by Power Generation, 2024-2034 (GW, AGR (%))
Figure 160 Rest of Middle East & Africa Hydropower Market by Value, 2024-2034 (US$ Bn, AGR (%))
Figure 161 Rest of Middle East & Africa Hydropower Market by Power Generation, 2024-2034 (GW, AGR (%))
Figure 162 Latin America Hydropower Market Attractiveness Index
Figure 163 Latin America Hydropower Market by Region, 2024, 2029 & 2034 (US$ Billion)
Figure 164 Latin America Hydropower Market by Value, 2024-2034 (US$ Bn, AGR (%))
Figure 165 Latin America Hydropower Market by Power Generation, 2024-2034 (GW, AGR (%))
Figure 166 Latin America Hydropower Market by Country, 2024-2034 (US$ Bn, AGR (%))
Figure 167 Latin America Hydropower Generation Market by Country, 2024-2034 (GW, AGR (%))
Figure 168 Latin America Hydropower Market Share Forecast by Country, 2024 & 2034 (%)
Figure 169 Latin America Hydropower Market by Type, 2024-2034 (US$ Bn, AGR (%))
Figure 170 Latin America Hydropower Market Share Forecast Type, 2024 & 2034 (%)
Figure 171 Latin America Hydropower Market by Capacity, 2024-2034 (US$ Bn, AGR (%))
Figure 172 Latin America Hydropower Market Share Forecast by Capacity, 2024 & 2034 (%)
Figure 173 Latin America Hydropower Market by End-User, 2024-2034 (US$ Bn, AGR (%))
Figure 174 Latin America Hydropower Market Share Forecast by End-User, 2024 & 2034 (%)
Figure 175 Latin America Hydropower Market by CAPEX, 2024-2034 (US$ Bn, AGR (%))
Figure 176 Latin America Hydropower Market Share Forecast by CAPEX, 2024 & 2034 (%)
Figure 177 Brazil Hydropower Market by Value, 2024-2034 (US$ Bn, AGR (%))
Figure 178 Brazil Hydropower Market by Power Generation, 2024-2034 (GW, AGR (%))
Figure 179 Mexico Hydropower Market by Value, 2024-2034 (US$ Bn, AGR (%))
Figure 180 Mexico Hydropower Market by Power Generation, 2024-2034 (GW, AGR (%))
Figure 181 Rest of Latin America Hydropower Market by Value, 2024-2034 (US$ Bn, AGR (%))
Figure 182 Rest of Latin America Hydropower Market by Power Generation, 2024-2034 (GW, AGR (%))
Figure 183 Hydropower Market: Company Share, 2022
Figure 184 China Three Gorges Corporation.: Net Revenue, 2018-2022 (US$ Million, AGR%)
Figure 185 State Power Investment Corporation.: Net Revenue, 2018-2022 (US$ Million, AGR%)
Figure 186 State Power Investment Corporation.: Business Segment Revenue Share, 2022 (%)
Figure 187 Électricité de France (EDF).: Net Revenue, 2018-2022 (US$ Million, AGR%)
Figure 188 Électricité de France (EDF).: Regional Revenue Share, 2022 (%)
Figure 189 Électricité de France (EDF).: Business Segment Revenue Share, 2022 (%)
Figure 190 Enel S.p.A.: Net Revenue, 2018-2022 (US$ Million, AGR%)
Figure 191 Enel S.p.A.: Regional Revenue Share, 2022 (%)
Figure 192 Enel S.p.A.: Business Segment Revenue Share, 2022 (%)
Figure 193 GE Renewable Energy.: Net Revenue, 2018-2022 (US$ Million, AGR%)
Figure 194 GE Renewable Energy.: R&D, 2018-2022 (US$ Million, AGR%)
Figure 195 GE Renewable Energy.: Regional Revenue Share, 2022 (%)
Figure 196 GE Renewable Energy.: Business Segment Revenue Share, 2022 (%)
Figure 197 American Electric Power Company, Inc..: Net Revenue, 2018-2022 (US$ Million, AGR%)
Figure 198 American Electric Power Company, Inc..: Business Segment Revenue Share, 2022 (%)
Figure 199 Duke Energy Corporation.: Net Revenue, 2018-2022 (US$ Million, AGR%)
Figure 200 Duke Energy Corporation.: Business Segment Revenue Share, 2022 (%)
Figure 201 Eletrobras .: Net Revenue, 2018-2022 (US$ Million, AGR%)
Figure 202 Eletrobras .: R&D, 2018-2022 (US$ Million, AGR%)
Figure 203 Alstom.: Net Revenue, 2018-2022 (US$ Million, AGR%)
Figure 204 Alstom.: R&D, 2018-2022 (US$ Million, AGR%)
Figure 205 Andritz AG.: Net Revenue, 2018-2022 (US$ Million, AGR%)
Figure 206 SSE plc.: Net Revenue, 2018-2022 (US$ Million, AGR%)
ページTOPに戻る
Summary
Report Details
The Hydropower Market Report 2024-2034: This report will prove invaluable to leading firms striving for new revenue pockets if they wish to better understand the industry and its underlying dynamics. It will be useful for companies that would like to expand into different industries or to expand their existing operations in a new region.
Growing Environmental Consciousness and the Need for Sustainable Power Generation
Hydropower stands acknowledged as an environmentally friendly and sustainable energy source, aligning seamlessly with the escalating global focus on environmental awareness and the imperative for sustainable power generation. Furthermore, hydropower projects play a pivotal role in ensuring energy security by furnishing a dependable and unwavering power supply. The adaptability of hydropower, capable of catering to diverse scales of electricity demand, serves as a compelling catalyst for its widespread adoption on a global scale. Substantially propelling market growth are government initiatives, subsidies, and favorable policies that lend substantial support to hydropower projects.
The hydropower market is rife with numerous opportunities. Venturing into burgeoning markets represents a promising trajectory for industry participants. These markets often boast untapped hydropower potential, offering fertile ground for the initiation of novel projects. Furthermore, establishing manufacturing units in lucrative markets holds the potential to augment operational efficiency and curtail costs. Embracing low-cost hydropower solutions in low and middle-income countries emerges as a significant opportunity to address energy needs sustainably. Forming strategic alliances with regional entities facilitates the exchange of knowledge, technology transfer, and mutual advancement. Simultaneously, investments in cutting-edge technologies, such as advanced turbine systems and smart grid integration, unlock avenues for innovation and efficiency enhancements.
New Solar Photovoltaic (PV) and Onshore Wind Power are on the Verge of Costing Less Than the Marginal Operating Cost of Hydropower
The assertion that new Solar Photovoltaic (PV) and Onshore Wind Power are approaching cost parity with, or even potentially undercutting, the marginal operating cost of Hydropower implies a significant could be the high initial capital costs associated with the construction of hydropower facilities, including dams and reservoirs. While hydropower has historically been a reliable and cost-effective source of renewable energy, the upfront investment required for infrastructure development might limit its ability to compete with the decreasing costs of solar PV and onshore wind projects. Additionally, environmental concerns and regulatory challenges associated with the construction of new hydropower projects may act as restraining factors. Opposition to dam construction due to ecological impacts, displacement of communities, and habitat disruption can hinder the growth of hydropower, especially when compared to the perceived environmental benefits of solar and wind installations.
What Questions Should You Ask before Buying a Market Research Report?
• How is the hydropower market evolving?
• What is driving and restraining the hydropower market?
• How will each hydropower submarket segment grow over the forecast period and how much revenue will these submarkets account for in 2034?
• How will the market shares for each hydropower submarket develop from 2024 to 2034?
• What will be the main driver for the overall market from 2024 to 2034?
• Will leading hydropower markets broadly follow the macroeconomic dynamics, or will individual national markets outperform others?
• How will the market shares of the national markets change by 2034 and which geographical region will lead the market in 2034?
• Who are the leading players and what are their prospects over the forecast period?
• What are the hydropower projects for these leading companies?
• How will the industry evolve during the period between 2024 and 2034? What are the implications of hydropower projects taking place now and over the next 10 years?
• Is there a greater need for product commercialisation to further scale the hydropower market?
• Where is the hydropower market heading and how can you ensure you are at the forefront of the market?
• What are the best investment options for new product and service lines?
• What are the key prospects for moving companies into a new growth path and C-suite?
You need to discover how this will impact the hydropower market today, and over the next 10 years:
• Our 420-page report provides 154 tables and 201 charts/graphs exclusively to you.
• The report highlights key lucrative areas in the industry so you can target them – NOW.
• It contains in-depth analysis of global, regional and national sales and growth.
• It highlights for you the key successful trends, changes and revenue projections made by your competitors.
This report tells you TODAY how the hydropower market will develop in the next 10 years, and in line with the variations in COVID-19 economic recession and bounce. This market is more critical now than at any point over the last 10 years.
Forecasts to 2034 and other analyses reveal commercial prospects
• In addition to revenue forecasting to 2034, our new study provides you with recent results, growth rates, and market shares.
• You will find original analyses, with business outlooks and developments.
• Discover qualitative analyses (including market dynamics, drivers, opportunities, restraints and challenges), cost structure, impact of rising hydropower prices and recent developments.
This report includes data analysis and invaluable insight into how COVID-19 will affect the industry and your company. Four COVID-19 recovery patterns and their impact, namely, “V”, “L”, “W” and “U” are discussed in this report.
Segments Covered in the Report
Market Size Estimation by
• Market Values (US$ Billion)
• Market Volume (GW)
Market Segment by Type
• Impoundment Hydropower Plant
• Storage Hydropower Plant
• Run-of-River Hydropower Plant
Market Segment by Capacity
• Micro & Pico (Below 100 KW)
• Small (100KW-30 MW)
• Large (30 MW-100 MW)
• Gigantic (Above 100 MW)
Market Segment by End-User
• Industrial
• Commercial
• Residential
• Government and Institutes
• Other End-User
Market Segment by CAPEX
• Civil Construction
• Electromechanical Equipment
• Electric Power Infrastructure
• Grid Connection Infrastructure
• Maintenance and Repairs
• Miscellaneous Expenses
In addition to the revenue predictions for the overall world market and segments, you will also find revenue forecasts for four regional and 20 leading national markets:
North America
• U.S.
• Canada
Europe
• Spain
• Italy
• France
• Norway
• Russia
• Rest of Europe
Asia Pacific
• China
• Japan
• India
• Australia
• South Korea
• Rest of Asia Pacific
Latin America
• Brazil
• Mexico
• Rest of Latin America
Middle East & Africa
• GCC
• South Africa
• Rest of Middle East & Africa
The report also includes profiles and for some of the leading companies in the Hydropower Market, 2024 to 2034, with a focus on this segment of these companies’ operations.
Leading companies profiled in the report
• Å Energi
• Alstom
• American Electric Power Company, Inc.
• Andritz AG
• British Columbia Hydro and Power Authority
• China Three Gorges Corporation
• Duke Energy Corporation
• Électricité de France (EDF)
• Eletrobras
• Enel S.p.A
• GE Renewable Energy
• Ontario Power Generation Inc.
• SSE plc
• State Power Investment Corporation
• Voith Group
Overall world revenue for Hydropower Market, 2024 to 2034 in terms of value the market will surpass US$265.6 billion in 2024, our work calculates. We predict strong revenue growth through to 2034. Our work identifies which organizations hold the greatest potential. Discover their capabilities, progress, and commercial prospects, helping you stay ahead.
How will the Hydropower Market, 2024 to 2034 report help you?
In summary, our 420-page report provides you with the following knowledge:
• Revenue forecasts to 2034 for Hydropower Market, 2024 to 2034 Market, with forecasts for market volume (GW), type, end-user, capacity, and CAPEX, each forecast at a global and regional level – discover the industry’s prospects, finding the most lucrative places for investments and revenues.
• Revenue forecasts to 2034 for four regional and 20 key national markets – See forecasts for the Hydropower Market, 2024 to 2034 market in North America, Europe, Asia-Pacific, Latin America and Middle East & Africa. Also forecasted is the market in the US, Canada, Brazil, Germany, France, UK, Norway, Spain, Russia, China, India, Japan, and Australia among other prominent economies.
• Prospects for established firms and those seeking to enter the market – including company profiles for 15 of the major companies involved in the Hydropower Market, 2024 to 2034.
Find quantitative and qualitative analyses with independent predictions. Receive information that only our report contains, staying informed with invaluable business intelligence.
Information found nowhere else
With our new report, you are less likely to fall behind in knowledge or miss out on opportunities. See how our work could benefit your research, analyses, and decisions. Visiongain’s study is for everybody needing commercial analyses for the Hydropower Market, 2024 to 2034, market-leading companies. You will find data, trends and predictions.
ページTOPに戻る
Table of Contents
Table of Contents
1 Report Overview
1.1 Objectives of the Study
1.2 Introduction to Hydropower Market
1.3 What This Report Delivers
1.4 Why You Should Read This Report
1.5 Key Questions Answered by This Analytical Report
1.6 Who Is This Report for?
1.7 Methodology
1.7.1 Market Definitions
1.7.2 Market Evaluation & Forecasting Methodology
1.7.3 Data Validation
1.7.3.1 Primary Research
1.7.3.2 Secondary Research
1.8 Frequently Asked Questions (FAQs)
1.9 Associated Visiongain Reports
1.10 About Visiongain
2 Executive Summary
3 Market Overview
3.1 Key Findings
3.2 Market Dynamics
3.2.1 Market Driving Factors
3.2.1.1 Hydropower Is a Key Contributor to Low-Carbon Electricity Generation
3.2.1.2 The Future of Hydroelectric Plant Modernization
3.2.1.3 Flexible and Reliable Power Generation is Getting Traction in the Market
3.2.2 Market Restraining Factors
3.2.2.1 New Solar Photovoltaic (PV) and Onshore Wind Power are on the Verge of Costing Less Than the Marginal Operating Cost of Hydropower
3.2.2.2 Unstable Supply, as the Energy Generated Depends on Seasonal Highs and Lows, Can Act as a Deterrent for Small Hydropower Installations
3.2.2.3 Hydropower Projects Face Challenges Related to Policy and Regulation
3.2.3 Market Opportunities
3.2.3.1 Integration of IoT with Hydropower Is Expected to Create New Opportunities
3.2.3.2 Emerging and Developing Economies, Particularly Through Public Sector Investments, have Led Global Hydropower Growth
3.2.3.3 Faster Hydropower Expansion is Anticipated in Asia-Pacific, Africa, and the Middle East
3.3 Porter’s Five Forces Analysis
3.3.1 Bargaining Power of Suppliers (Medium)
3.3.2 Bargaining Power of Buyers (Medium)
3.3.3 Competitive Rivalry (Medium)
3.3.4 Threat from Substitutes (Medium)
3.3.5 Threat of New Entrants (Low)
3.4 COVID-19 Impact Analysis
3.4.1 “V-Shaped Recovery”
3.4.2 “U-Shaped Recovery”
3.4.3 “W-Shaped Recovery”
3.4.4 “L-Shaped Recovery”
3.5 PEST Analysis
4 Hydropower Market Analysis by Type
4.1 Key Findings
4.2 Type Segment: Market Attractiveness Index
4.3 Hydropower Market Size Estimation and Forecast by Type
4.4 Impoundment Hydropower Plant
4.4.1 Market Size by Region, 2024-2034 (US$ Billion)
4.4.2 Market Share by Region, 2024 & 2034 (%)
4.5 Storage Hydropower Plant
4.5.1 Market Size by Region, 2024-2034 (US$ Billion)
4.5.2 Market Share by Region, 2024 & 2034 (%)
4.6 Run-of-River Hydropower Plant
4.6.1 Market Size by Region, 2024-2034 (US$ Billion)
4.6.2 Market Share by Region, 2024 & 2034 (%)
5 Hydropower Market Analysis by Capacity
5.1 Key Findings
5.2 Capacity Segment: Market Attractiveness Index
5.3 Hydropower Market Size Estimation and Forecast by Capacity
5.4 Micro & Pico (Below 100 KW)
5.4.1 Market Size by Region, 2024-2034 (US$ Billion)
5.4.2 Market Share by Region, 2024 & 2034 (%)
5.5 Small (100KW – 30 MW)
5.5.1 Market Size by Region, 2024-2034 (US$ Billion)
5.5.2 Market Share by Region, 2024 & 2034 (%)
5.6 Large (30 MW - 100 MW)
5.6.1 Market Size by Region, 2024-2034 (US$ Billion)
5.6.2 Market Share by Region, 2024 & 2034 (%)
5.7 Gigantic (Above 100 MW)
5.7.1 Market Size by Region, 2024-2034 (US$ Billion)
5.7.2 Market Share by Region, 2024 & 2034 (%)
6 Hydropower Market Analysis by End-User
6.1 Key Findings
6.2 End-User Segment: Market Attractiveness Index
6.3 Hydropower Market Size Estimation and Forecast by End-User
6.4 Industrial
6.4.1 Market Size by Region, 2024-2034 (US$ Billion)
6.4.2 Market Share by Region, 2024 & 2034 (%)
6.5 Commercial
6.5.1 Market Size by Region, 2024-2034 (US$ Billion)
6.5.2 Market Share by Region, 2024 & 2034 (%)
6.6 Residential
6.6.1 Market Size by Region, 2024-2034 (US$ Billion)
6.6.2 Market Share by Region, 2024 & 2034 (%)
6.7 Government and Institutes
6.7.1 Market Size by Region, 2024-2034 (US$ Billion)
6.7.2 Market Share by Region, 2024 & 2034 (%)
6.8 Other End-User
6.8.1 Market Size by Region, 2024-2034 (US$ Billion)
6.8.2 Market Share by Region, 2024 & 2034 (%)
7 Hydropower Market Analysis by CAPEX
7.1 Key Findings
7.2 CAPEX Segment: Market Attractiveness Index
7.3 Hydropower Market Size Estimation and Forecast by CAPEX
7.4 Civil Construction
7.4.1 Market Size by Region, 2024-2034 (US$ Billion)
7.4.2 Market Share by Region, 2024 & 2034 (%)
7.5 Electromechanical Equipment
7.5.1 Market Size by Region, 2024-2034 (US$ Billion)
7.5.2 Market Share by Region, 2024 & 2034 (%)
7.6 Electric Power Infrastructure
7.6.1 Market Size by Region, 2024-2034 (US$ Billion)
7.6.2 Market Share by Region, 2024 & 2034 (%)
7.7 Grid Connection Infrastructure
7.7.1 Market Size by Region, 2024-2034 (US$ Billion)
7.7.2 Market Share by Region, 2024 & 2034 (%)
7.8 Maintenance and Repairs
7.8.1 Market Size by Region, 2024-2034 (US$ Billion)
7.8.2 Market Share by Region, 2024 & 2034 (%)
7.9 Miscellaneous Expenses
7.9.1 Market Size by Region, 2024-2034 (US$ Billion)
7.9.2 Market Share by Region, 2024 & 2034 (%)
8 Hydropower Market Analysis by Region
8.1 Key Findings
8.2 Regional Market Size Estimation and Forecast
9 North America Hydropower Market Analysis
9.1 Key Findings
9.2 North America Hydropower Market Attractiveness Index
9.3 North America Hydropower Market by Country, 2024, 2029 & 2034 (US$ Billion)
9.4 North America Hydropower Market Size Estimation and Forecast
9.5 North America Hydropower Market Size Estimation and Forecast by Country
9.6 North America Hydropower Market Size Estimation and Forecast by Type
9.7 North America Hydropower Market Size Estimation and Forecast by Capacity
9.8 North America Hydropower Market Size Estimation and Forecast by End-User
9.9 North America Hydropower Market Size Estimation and Forecast by CAPEX
9.10 U.S. Hydropower Market Analysis
9.11 Canada Hydropower Market Analysis
10 Europe Hydropower Market Analysis
10.1 Key Findings
10.2 Europe Hydropower Market Attractiveness Index
10.3 Europe Hydropower Market by Country, 2024, 2029 & 2034 (US$ Billion)
10.4 Europe Hydropower Market Size Estimation and Forecast
10.5 Europe Hydropower Market Size Estimation and Forecast by Country
10.6 Europe Hydropower Market Size Estimation and Forecast by Type
10.7 Europe Hydropower Market Size Estimation and Forecast by Capacity
10.8 Europe Hydropower Market Size Estimation and Forecast by End-User
10.9 Europe Hydropower Market Size Estimation and Forecast by CAPEX
10.10 Spain Hydropower Market Analysis
10.11 Italy Hydropower Market Analysis
10.12 France Hydropower Market Analysis
10.13 Norway Hydropower Market Analysis
10.14 Russia Hydropower Market Analysis
10.15 Rest of Europe Hydropower Market Analysis
11 Asia-Pacific Hydropower Market Analysis
11.1 Key Findings
11.2 Asia-Pacific Hydropower Market Attractiveness Index
11.3 Asia-Pacific Hydropower Market by Country, 2024, 2029 & 2034 (US$ Billion)
11.4 Asia-Pacific Hydropower Market Size Estimation and Forecast
11.5 Asia-Pacific Hydropower Market Size Estimation and Forecast by Country
11.6 Asia-Pacific Hydropower Market Size Estimation and Forecast by Type
11.7 Asia-Pacific Hydropower Market Size Estimation and Forecast by Capacity
11.8 Asia-Pacific Hydropower Market Size Estimation and Forecast by End-User
11.9 Asia-Pacific Hydropower Market Size Estimation and Forecast by CAPEX
11.10 China Hydropower Market Analysis
11.11 India Hydropower Market Analysis
11.12 Japan Hydropower Market Analysis
11.13 South Korea Hydropower Market Analysis
11.14 Australia Hydropower Market Analysis
11.15 Rest of Asia-Pacific Hydropower Market Analysis
12 Middle East and Africa Hydropower Market Analysis
12.1 Key Findings
12.2 Middle East and Africa Hydropower Market Attractiveness Index
12.3 Middle East and Africa Hydropower Market by Country, 2024, 2029 & 2034 (US$ Billion)
12.4 Middle East and Africa Hydropower Market Size Estimation and Forecast
12.5 Middle East and Africa Hydropower Market Size Estimation and Forecast by Country
12.6 Middle East and Africa Hydropower Market Size Estimation and Forecast by Type
12.7 Middle East and Africa Hydropower Market Size Estimation and Forecast by Capacity
12.8 Middle East and Africa Hydropower Market Size Estimation and Forecast by End-User
12.9 Middle East and Africa Hydropower Market Size Estimation and Forecast by CAPEX
12.10 GCC Hydropower Market Analysis
12.11 South Africa Hydropower Market Analysis
12.12 Rest of Middle East & Africa Hydropower Market Analysis
13 Latin America Hydropower Market Analysis
13.1 Key Findings
13.2 Latin America Hydropower Market Attractiveness Index
13.3 Latin America Hydropower Market by Country, 2024, 2029 & 2034 (US$ Billion)
13.4 Latin America Hydropower Market Size Estimation and Forecast
13.5 Latin America Hydropower Market Size Estimation and Forecast by Country
13.6 Latin America Hydropower Market Size Estimation and Forecast by Type
13.7 Latin America Hydropower Market Size Estimation and Forecast by Capacity
13.8 Latin America Hydropower Market Size Estimation and Forecast by End-User
13.9 Latin America Hydropower Market Size Estimation and Forecast by CAPEX
13.10 Brazil Hydropower Market Analysis
13.11 Mexico Hydropower Market Analysis
13.12 Rest of Latin America Hydropower Market Analysis
14 Company Profiles
14.1 Competitive Landscape, 2022
14.2 Strategic Outlook
14.3 China Three Gorges Corporation
14.3.1 Company Snapshot
14.3.2 Company Overview
14.3.3 Financial Analysis
14.3.3.1 Net Revenue, 2018-2022
14.3.4 Product Benchmarking
14.3.5 Strategic Outlook
14.4 State Power Investment Corporation
14.4.1 Company Snapshot
14.4.2 Company Overview
14.4.3 Financial Analysis
14.4.3.1 Net Revenue, 2018-2022
14.4.3.2 Business Segment Revenue Share, 2022 (%)
14.4.4 Product Benchmarking
14.4.5 Strategic Outlook
14.5 Électricité de France (EDF)
14.5.1 Company Snapshot
14.5.2 Company Overview
14.5.3 Financial Analysis
14.5.3.1 Net Revenue, 2018-2022
14.5.3.2 Regional Revenue Share, 2022 (%)
14.5.3.3 Business Segment Revenue Share, 2022 (%)
14.5.4 Product Benchmarking
14.5.5 Strategic Outlook
14.6 Enel S.p.A
14.6.1 Company Snapshot
14.6.2 Company Overview
14.6.3 Financial Analysis
14.6.3.1 Net Revenue, 2018-2022
14.6.3.2 Regional Revenue Share, 2022 (%)
14.6.3.3 Business Segment Revenue Share, 2022 (%)
14.6.4 Product Benchmarking
14.6.5 Strategic Outlook
14.7 GE Renewable Energy
14.7.1 Company Snapshot
14.7.2 Company Overview
14.7.3 Financial Analysis
14.7.3.1 Net Revenue, 2018-2022
14.7.3.2 R&D, 2018-2022
14.7.3.3 Regional Revenue Share, 2022 (%)
14.7.3.4 Business Segment Revenue Share, 2022 (%)
14.7.4 Product Benchmarking
14.7.5 Strategic Outlook
14.8 American Electric Power Company, Inc.
14.8.1 Company Snapshot
14.8.2 Company Overview
14.8.3 Financial Analysis
14.8.3.1 Net Revenue, 2018-2022
14.8.3.2 Business Segment Revenue Share, 2022 (%)
14.8.4 Product Benchmarking
14.8.5 Strategic Outlook
14.9 Duke Energy Corporation
14.9.1 Company Snapshot
14.9.2 Company Overview
14.9.3 Financial Analysis
14.9.3.1 Net Revenue, 2018-2022
14.9.3.2 Business Segment Revenue Share, 2022 (%)
14.9.4 Product Benchmarking
14.9.5 Strategic Outlook
14.10 Ontario Power Generation Inc.
14.10.1 Company Snapshot
14.10.2 Company Overview
14.10.3 Product Benchmarking
14.10.4 Strategic Outlook
14.11 Eletrobras
14.11.1 Company Snapshot
14.11.2 Company Overview
14.11.3 Financial Analysis
14.11.3.1 Net Revenue, 2018-2022
14.11.3.2 R&D, 2018-2022
14.11.4 Product Benchmarking
14.11.5 Strategic Outlook
14.12 Voith Group
14.12.1 Company Snapshot
14.12.2 Company Overview
14.12.3 Product Benchmarking
14.12.4 Strategic Outlook
14.13 Alstom
14.13.1 Company Snapshot
14.13.2 Company Overview
14.13.3 Financial Analysis
14.13.3.1 Net Revenue, 2018-2022
14.13.3.2 R&D, 2018-2022
14.13.4 Product Benchmarking
14.13.5 Strategic Outlook
14.14 Andritz AG
14.14.1 Company Snapshot
14.14.2 Company Overview
14.14.3 Financial Analysis
14.14.3.1 Net Revenue, 2018-2022
14.14.4 Product Benchmarking
14.14.5 Strategic Outlook
14.15 SSE plc
14.15.1 Company Snapshot
14.15.2 Company Overview
14.15.3 Financial Analysis
14.15.3.1 Net Revenue, 2018-2022
14.15.4 Product Benchmarking
14.15.5 Strategic Outlook
14.16 Å Energi
14.16.1 Company Snapshot
14.16.2 Company Overview
14.16.3 Product Benchmarking
14.16.4 Strategic Outlook
14.17 British Columbia Hydro and Power Authority
14.17.1 Company Snapshot
14.17.2 Company Overview
14.17.3 Product Benchmarking
14.17.4 Strategic Outlook
15 Conclusion and Recommendations
15.1 Concluding Remarks from Visiongain
15.2 Recommendations for Market Players
ページTOPに戻る
List of Tables/Graphs
List of Tables
Table 1 Hydropower Market Snapshot, 2024 & 2034 (US$ Billion, CAGR %)
Table 2 Record Numbers of Solar Panels were Shipped in the United States during 2021
Table 3 Global Hydropower Market by Region, 2024-2034 (US$ Bn, AGR (%), CAGR (%)) (V-Shaped Recovery Scenario)
Table 4 Global Hydropower Market by Region, 2024-2034 (US$ Bn, AGR (%), CAGR (%)) (U-Shaped Recovery Scenario)
Table 5 Global Hydropower Market by Region, 2024-2034 (US$ Bn, AGR (%), CAGR (%)) (W-Shaped Recovery Scenario)
Table 6 Global Hydropower Market by Region, 2024-2034 (US$ Bn, AGR (%), CAGR (%)) (L-Shaped Recovery Scenario)
Table 7 Global Hydropower Market by Type, 2024-2034 (US$ Bn, AGR (%), CAGR (%))
Table 8 Impoundment Hydropower Plant Market by Region, 2024-2034 (US$ Bn, AGR (%), CAGR (%))
Table 9 Storage Hydropower Plant Market by Region, 2024-2034 (US$ Bn, AGR (%), CAGR (%))
Table 10 Run-of-River Hydropower Plant Market by Region, 2024-2034 (US$ Bn, AGR (%), CAGR (%))
Table 11 Global Hydropower Market by Capacity, 2024-2034 (US$ Bn, AGR (%), CAGR (%))
Table 12 Micro & Pico (Below 100 KW) Market by Region, 2024-2034 (US$ Bn, AGR (%), CAGR (%))
Table 13 Small (100KW – 30 MW) Market by Region, 2024-2034 (US$ Bn, AGR (%), CAGR (%))
Table 14 Large (30 MW - 100 MW) Market by Region, 2024-2034 (US$ Bn, AGR (%), CAGR (%))
Table 15 Gigantic (Above 100 MW) Market by Region, 2024-2034 (US$ Bn, AGR (%), CAGR (%))
Table 16 Global Hydropower Market by End-User, 2024-2034 (US$ Bn, AGR (%), CAGR (%))
Table 17 Industrial Market by Region, 2024-2034 (US$ Bn, AGR (%), CAGR (%))
Table 18 Commercial Market by Region, 2024-2034 (US$ Bn, AGR (%), CAGR (%))
Table 19 Residential Market by Region, 2024-2034 (US$ Bn, AGR (%), CAGR (%))
Table 20 Government and Institutes Market by Region, 2024-2034 (US$ Bn, AGR (%), CAGR (%))
Table 21 Other End-User Market by Region, 2024-2034 (US$ Bn, AGR (%), CAGR (%))
Table 22 Global Hydropower Market by CAPEX, 2024-2034 (US$ Bn, AGR (%), CAGR (%))
Table 23 Civil Construction Market by Region, 2024-2034 (US$ Bn, AGR (%), CAGR (%))
Table 24 Electromechanical Equipment Market by Region, 2024-2034 (US$ Bn, AGR (%), CAGR (%))
Table 25 Electric Power Infrastructure Market by Region, 2024-2034 (US$ Bn, AGR (%), CAGR (%))
Table 26 Grid Connection Infrastructure Market by Region, 2024-2034 (US$ Bn, AGR (%), CAGR (%))
Table 27 Maintenance and Repairs Market by Region, 2024-2034 (US$ Bn, AGR (%), CAGR (%))
Table 28 Miscellaneous Expenses Market by Region, 2024-2034 (US$ Bn, AGR (%), CAGR (%))
Table 29 Hydropower Market Forecast by Region, 2024-2034 (US$ Billion, AGR%, CAGR%)
Table 30 North America Hydropower Market by Value, 2024-2034 (US$ Bn, AGR (%), CAGR (%))
Table 31 North America Hydropower Market by Power Generation, 2024-2034 (GW, AGR (%), CAGR (%))
Table 32 North America Hydropower Market by Country, 2024-2034 (US$ Bn, AGR (%), CAGR (%))
Table 33 North America Hydropower Generation Market by Country, 2024-2034 (GW, AGR (%), CAGR (%))
Table 34 North America Hydropower Market by Type, 2024-2034 (US$ Bn, AGR (%), CAGR (%))
Table 35 North America Hydropower Market by Capacity, 2024-2034 (US$ Bn, AGR (%), CAGR (%))
Table 36 North America Hydropower Market by End-User, 2024-2034 (US$ Bn, AGR (%), CAGR (%))
Table 37 North America Hydropower Market by CAPEX, 2024-2034 (US$ Bn, AGR (%), CAGR (%))
Table 38 US Hydropower Market by Value, 2024-2034 (US$ Bn, AGR (%), CAGR (%))
Table 39 US Hydropower Market by Power Generation, 2024-2034 (GW, AGR (%), CAGR (%))
Table 40 Canada Hydropower Market by Value, 2024-2034 (US$ Bn, AGR (%), CAGR (%))
Table 41 Canada Hydropower Market by Power Generation, 2024-2034 (GW, AGR (%), CAGR (%))
Table 42 Europe Hydropower Market by Value, 2024-2034 (US$ Bn, AGR (%), CAGR (%))
Table 43 Europe Hydropower Market by Power Generation, 2024-2034 (GW, AGR (%), CAGR (%))
Table 44 Europe Hydropower Market by Country, 2024-2034 (US$ Bn, AGR (%), CAGR (%))
Table 45 Europe Hydropower Generation Market by Country, 2024-2034 (GW, AGR (%), CAGR (%))
Table 46 Europe Hydropower Market by Type, 2024-2034 (US$ Bn, AGR (%), CAGR (%))
Table 47 Europe Hydropower Market by Capacity, 2024-2034 (US$ Bn, AGR (%), CAGR (%))
Table 48 Europe Hydropower Market by End-User, 2024-2034 (US$ Bn, AGR (%), CAGR (%))
Table 49 Europe Hydropower Market by CAPEX, 2024-2034 (US$ Bn, AGR (%), CAGR (%))
Table 50 Spain Hydropower Market by Value, 2024-2034 (US$ Bn, AGR (%), CAGR (%))
Table 51 Spain Hydropower Market by Power Generation, 2024-2034 (GW, AGR (%), CAGR (%))
Table 52 Italy Hydropower Market by Value, 2024-2034 (US$ Bn, AGR (%), CAGR (%))
Table 53 Italy Hydropower Market by Power Generation, 2024-2034 (GW, AGR (%), CAGR (%))
Table 54 France Hydropower Market by Value, 2024-2034 (US$ Bn, AGR (%), CAGR (%))
Table 55 France Hydropower Market by Power Generation, 2024-2034 (GW, AGR (%), CAGR (%))
Table 56 Norway Hydropower Market by Value, 2024-2034 (US$ Bn, AGR (%), CAGR (%))
Table 57 Norway Hydropower Market by Power Generation, 2024-2034 (GW, AGR (%), CAGR (%))
Table 58 Russia Hydropower Market by Value, 2024-2034 (US$ Bn, AGR (%), CAGR (%))
Table 59 Russia Hydropower Market by Power Generation, 2024-2034 (GW, AGR (%), CAGR (%))
Table 60 Rest of Europe Hydropower Market by Value, 2024-2034 (US$ Bn, AGR (%), CAGR (%))
Table 61 Rest of Europe Hydropower Market by Power Generation, 2024-2034 (GW, AGR (%), CAGR (%))
Table 62 Asia-Pacific Hydropower Market by Value, 2024-2034 (US$ Bn, AGR (%), CAGR (%))
Table 63 Asia-Pacific Hydropower Market by Power Generation, 2024-2034 (GW, AGR (%), CAGR (%))
Table 64 Asia-Pacific Hydropower Market by Country, 2024-2034 (US$ Bn, AGR (%), CAGR (%))
Table 65 Asia-Pacific Hydropower Generation Market by Country, 2024-2034 (GW, AGR (%), CAGR (%))
Table 66 Asia-Pacific Hydropower Market by Type, 2024-2034 (US$ Bn, AGR (%), CAGR (%))
Table 67 Asia-Pacific Hydropower Market by Capacity, 2024-2034 (US$ Bn, AGR (%), CAGR (%))
Table 68 Asia-Pacific Hydropower Market by End-User, 2024-2034 (US$ Bn, AGR (%), CAGR (%))
Table 69 Asia-Pacific Hydropower Market by CAPEX, 2024-2034 (US$ Bn, AGR (%), CAGR (%))
Table 70 China Hydropower Market by Value, 2024-2034 (US$ Bn, AGR (%), CAGR (%))
Table 71 China Hydropower Market by Power Generation, 2024-2034 (GW, AGR (%), CAGR (%))
Table 72 India Hydropower Market by Value, 2024-2034 (US$ Bn, AGR (%), CAGR (%))
Table 73 India Hydropower Market by Power Generation, 2024-2034 (GW, AGR (%), CAGR (%))
Table 74 Japan Hydropower Market by Value, 2024-2034 (US$ Bn, AGR (%), CAGR (%))
Table 75 Japan Hydropower Market by Power Generation, 2024-2034 (GW, AGR (%), CAGR (%))
Table 76 South Korea Hydropower Market by Value, 2024-2034 (US$ Bn, AGR (%), CAGR (%))
Table 77 South Korea Hydropower Market by Power Generation, 2024-2034 (GW, AGR (%), CAGR (%))
Table 78 Australia Hydropower Market by Value, 2024-2034 (US$ Bn, AGR (%), CAGR (%))
Table 79 Australia Hydropower Market by Power Generation, 2024-2034 (GW, AGR (%), CAGR (%))
Table 80 Rest of Asia-Pacific Hydropower Market by Value, 2024-2034 (US$ Bn, AGR (%), CAGR (%))
Table 81 Rest of Asia-Pacific Hydropower Market by Power Generation, 2024-2034 (GW, AGR (%), CAGR (%))
Table 82 Middle East & Africa Hydropower Market by Value, 2024-2034 (US$ Bn, AGR (%), CAGR (%))
Table 83 Middle East & Africa Hydropower Market by Power Generation, 2024-2034 (GW, AGR (%), CAGR (%))
Table 84 Middle East & Africa Hydropower Market by Country, 2024-2034 (US$ Bn, AGR (%), CAGR (%))
Table 85 Middle East & Africa Hydropower Generation Market by Country, 2024-2034 (GW, AGR (%), CAGR (%))
Table 86 Middle East & Africa Hydropower Market by Type, 2024-2034 (US$ Bn, AGR (%), CAGR (%))
Table 87 Middle East & Africa Hydropower Market by Capacity, 2024-2034 (US$ Bn, AGR (%), CAGR (%))
Table 88 Middle East & Africa Hydropower Market by End-User, 2024-2034 (US$ Bn, AGR (%), CAGR (%))
Table 89 Middle East & Africa Hydropower Market by CAPEX, 2024-2034 (US$ Bn, AGR (%), CAGR (%))
Table 90 GCC Hydropower Market by Value, 2024-2034 (US$ Bn, AGR (%), CAGR (%))
Table 91 GCC Hydropower Market by Power Generation, 2024-2034 (GW, AGR (%), CAGR (%))
Table 92 South Africa Hydropower Market by Value, 2024-2034 (US$ Bn, AGR (%), CAGR (%))
Table 93 South Africa Hydropower Market by Power Generation, 2024-2034 (GW, AGR (%), CAGR (%))
Table 94 Rest of Middle East & Africa Hydropower Market by Value, 2024-2034 (US$ Bn, AGR (%), CAGR (%))
Table 95 Rest of Middle East & Africa Hydropower Market by Power Generation, 2024-2034 (GW, AGR (%), CAGR (%))
Table 96 Latin America Hydropower Market by Value, 2024-2034 (US$ Bn, AGR (%), CAGR (%))
Table 97 Latin America Hydropower Market by Power Generation, 2024-2034 (GW, AGR (%), CAGR (%))
Table 98 Latin America Hydropower Market by Country, 2024-2034 (US$ Bn, AGR (%), CAGR (%))
Table 99 Latin America Hydropower Generation Market by Country, 2024-2034 (GW, AGR (%), CAGR (%))
Table 100 Latin America Hydropower Market by Type, 2024-2034 (US$ Bn, AGR (%), CAGR (%))
Table 101 Latin America Hydropower Market by Capacity, 2024-2034 (US$ Bn, AGR (%), CAGR (%))
Table 102 Latin America Hydropower Market by End-User, 2024-2034 (US$ Bn, AGR (%), CAGR (%))
Table 103 Latin America Hydropower Market by CAPEX, 2024-2034 (US$ Bn, AGR (%), CAGR (%))
Table 104 Brazil Hydropower Market by Value, 2024-2034 (US$ Bn, AGR (%), CAGR (%))
Table 105 Brazil Hydropower Market by Power Generation, 2024-2034 (GW, AGR (%), CAGR (%))
Table 106 Mexico Hydropower Market by Value, 2024-2034 (US$ Bn, AGR (%), CAGR (%))
Table 107 Mexico Hydropower Market by Power Generation, 2024-2034 (GW, AGR (%), CAGR (%))
Table 108 Rest of Latin America Hydropower Market by Value, 2024-2034 (US$ Bn, AGR (%), CAGR (%))
Table 109 Rest of Latin America Hydropower Market by Power Generation, 2024-2034 (GW, AGR (%), CAGR (%))
Table 110 Strategic Outlook - Contract
Table 111 China Three Gorges Corporation: Key Details, (CEO, HQ, Revenue, Founded, No. of Employees, Company Type, Website, Business Segment)
Table 112 China Three Gorges Corporation: Product Benchmarking
Table 113 China Three Gorges Corporation: Strategic Outlook
Table 114 State Power Investment Corporation: Key Details, (CEO, HQ, Revenue, Founded, No. of Employees, Company Type, Website, Business Segment)
Table 115 State Power Investment Corporation: Product Benchmarking
Table 116 State Power Investment Corporation: Strategic Outlook
Table 117 Électricité de France (EDF): Key Details, (CEO, HQ, Revenue, Founded, No. of Employees, Company Type, Website, Business Segment)
Table 118 Électricité de France (EDF): Product Benchmarking
Table 119 Électricité de France (EDF): Strategic Outlook
Table 120 Enel S.p.A: Key Details, (CEO, HQ, Revenue, Founded, No. of Employees, Company Type, Website, Business Segment)
Table 121 Enel S.p.A: Product Benchmarking
Table 122 Enel S.p.A: Strategic Outlook
Table 123 GE Renewable Energy: Key Details, (CEO, HQ, Revenue, Founded, No. of Employees, Company Type, Website, Business Segment)
Table 124 GE Renewable Energy: Product Benchmarking
Table 125 GE Renewable Energy: Strategic Outlook
Table 126 American Electric Power Company, Inc.: Key Details, (CEO, HQ, Revenue, Founded, No. of Employees, Company Type, Website, Business Segment)
Table 127 American Electric Power Company, Inc.: Product Benchmarking
Table 128 American Electric Power Company, Inc.: Strategic Outlook
Table 129 Duke Energy Corporation: Key Details, (CEO, HQ, Revenue, Founded, No. of Employees, Company Type, Website, Business Segment)
Table 130 Duke Energy Corporation: Product Benchmarking
Table 131 Duke Energy Corporation: Strategic Outlook
Table 132 Ontario Power Generation Inc.: Key Details, (CEO, HQ, Revenue, Founded, No. of Employees, Company Type, Website, Business Segment)
Table 133 Ontario Power Generation Inc.: Product Benchmarking
Table 134 Ontario Power Generation Inc.: Strategic Outlook
Table 135 Eletrobras: Key Details, (CEO, HQ, Revenue, Founded, No. of Employees, Company Type, Website, Business Segment)
Table 136 Eletrobras: Product Benchmarking
Table 137 Eletrobras: Strategic Outlook
Table 138 Voith Group: Key Details, (CEO, HQ, Revenue, Founded, No. of Employees, Company Type, Website, Business Segment)
Table 139 Voith Group: Product Benchmarking
Table 140 Voith Group: Strategic Outlook
Table 141 Alstom: Key Details, (CEO, HQ, Revenue, Founded, No. of Employees, Company Type, Website, Business Segment)
Table 142 Alstom: Product Benchmarking
Table 143 Alstom: Strategic Outlook
Table 144 Andritz AG: Key Details, (CEO, HQ, Revenue, Founded, No. of Employees, Company Type, Website, Business Segment)
Table 145 Andritz AG: Product Benchmarking
Table 146 Andritz AG: Strategic Outlook
Table 147 SSE plc: Key Details, (CEO, HQ, Revenue, Founded, No. of Employees, Company Type, Website, Business Segment)
Table 148 SSE plc: Product Benchmarking
Table 149 SSE plc: Strategic Outlook
Table 150 Å Energi: Key Details, (CEO, HQ, Revenue, Founded, No. of Employees, Company Type, Website, Business Segment)
Table 151 Å Energi: Product Benchmarking
Table 152 Å Energi: Strategic Outlook
Table 153 British Columbia Hydro and Power Authority: Key Details, (CEO, HQ, Revenue, Founded, No. of Employees, Company Type, Website, Business Segment)
Table 154 British Columbia Hydro and Power Authority: Product Benchmarking
Table 155 British Columbia Hydro and Power Authority: Strategic Outlook
List of Figures
Figure 1 Hydropower Market Segmentation
Figure 2 Hydropower Market by Type: Market Attractiveness Index
Figure 3 Hydropower Market by Capacity: Market Attractiveness Index
Figure 4 Hydropower Market by End-User: Market Attractiveness Index
Figure 5 Hydropower Market by CAPEX: Market Attractiveness Index
Figure 6 Hydropower Market Attractiveness Index by Region
Figure 7 Hydropower Market: Market Dynamics
Figure 8 Global Solar PV Installed Cost
Figure 9 Solar PV and Onshore Wind Investment Cost Estimates for New Contracted Projects Under High Commodity Prices (2018-2023)
Figure 10 Hydropower Market: Porter’s Five Forces Analysis
Figure 11 Global Hydropower Market Share Forecast by COVID, 2024-2034 (%)
Figure 12 Global Hydropower Market by Region, 2024-2034 (US$ Bn, AGR (%)) (V-Shaped Recovery Scenario)
Figure 13 Global Hydropower Market by Region, 2024-2034 (US$ Bn, AGR (%)) (U-Shaped Recovery Scenario)
Figure 14 Global Hydropower Market by Region, 2024-2034 (US$ Bn, AGR (%)) (W-Shaped Recovery Scenario)
Figure 15 Global Hydropower Market by Region, 2024-2034 (US$ Bn, AGR (%)) (L-Shaped Recovery Scenario)
Figure 16 Hydropower Market: PEST Analysis
Figure 17 Hydropower Market by Type: Market Attractiveness Index
Figure 18 Global Hydropower Market by Type, 2024-2034 (US$ Bn, AGR (%))
Figure 19 Hydropower Market Share Forecast by Type, 2024, 2029, 2034 (%)
Figure 20 Impoundment Hydropower Plant Market by Region, 2024-2034 (US$ Bn, AGR (%))
Figure 21 Impoundment Hydropower Plant Market Share Forecast by Region, 2024 & 2034 (%)
Figure 22 Storage Hydropower Plant Market by Region, 2024-2034 (US$ Bn, AGR (%))
Figure 23 Storage Hydropower Plant Market Share Forecast by Region, 2024 & 2034 (%)
Figure 24 Run-of-River Hydropower Plant Market by Region, 2024-2034 (US$ Bn, AGR (%))
Figure 25 Run-of-River Hydropower Plant Market Share Forecast by Region, 2024 & 2034 (%)
Figure 26 Hydropower Market by Capacity: Market Attractiveness Index
Figure 27 Global Hydropower Market by Capacity, 2024-2034 (US$ Bn, AGR (%))
Figure 28 Hydropower Market Share Forecast by Capacity, 2024, 2029, 2034 (%)
Figure 29 Micro & Pico (Below 100 KW) Market by Region, 2024-2034 (US$ Bn, AGR (%))
Figure 30 Micro & Pico (Below 100 KW) Market Share Forecast by Region, 2024 & 2034 (%)
Figure 31 Small (100KW – 30 MW) Market by Region, 2024-2034 (US$ Bn, AGR (%))
Figure 32 Small (100KW – 30 MW) Market Share Forecast by Region, 2024 & 2034 (%)
Figure 33 Large (30 MW - 100 MW) Market by Region, 2024-2034 (US$ Bn, AGR (%))
Figure 34 Large (30 MW - 100 MW) Market Share Forecast by Region, 2024 & 2034 (%)
Figure 35 Gigantic (Above 100 MW) Market by Region, 2024-2034 (US$ Bn, AGR (%))
Figure 36 Gigantic (Above 100 MW) Market Share Forecast by Region, 2024 & 2034 (%)
Figure 37 Hydropower Market by End-User: Market Attractiveness Index
Figure 38 Global Hydropower Market by End-User, 2024-2034 (US$ Bn, AGR (%))
Figure 39 Hydropower Market Share Forecast by End-User, 2024, 2029, 2034 (%)
Figure 40 Industrial Market by Region, 2024-2034 (US$ Bn, AGR (%))
Figure 41 Industrial Market Share Forecast by Region, 2024 & 2034 (%)
Figure 42 Commercial Market by Region, 2024-2034 (US$ Bn, AGR (%))
Figure 43 Commercial Market Share Forecast by Region, 2024 & 2034 (%)
Figure 44 Residential Market by Region, 2024-2034 (US$ Bn, AGR (%))
Figure 45 Residential Market Share Forecast by Region, 2024 & 2034 (%)
Figure 46 Government and Institutes Market by Region, 2024-2034 (US$ Bn, AGR (%))
Figure 47 Government and Institutes Market Share Forecast by Region, 2024 & 2034 (%)
Figure 48 Other End-User Market by Region, 2024-2034 (US$ Bn, AGR (%))
Figure 49 Other End-User Market Share Forecast by Region, 2024 & 2034 (%)
Figure 50 Hydropower Market by CAPEX: Market Attractiveness Index
Figure 51 Global Hydropower Market by CAPEX, 2024-2034 (US$ Bn, AGR (%))
Figure 52 Hydropower Market Share Forecast by CAPEX, 2024, 2029, 2034 (%)
Figure 53 Civil Construction Market by Region, 2024-2034 (US$ Bn, AGR (%))
Figure 54 Civil Construction Market Share Forecast by Region, 2024 & 2034 (%)
Figure 55 Electromechanical Equipment Market by Region, 2024-2034 (US$ Bn, AGR (%))
Figure 56 Electromechanical Equipment Market Share Forecast by Region, 2024 & 2034 (%)
Figure 57 Electric Power Infrastructure Market by Region, 2024-2034 (US$ Bn, AGR (%))
Figure 58 Electric Power Infrastructure Market Share Forecast by Region, 2024 & 2034 (%)
Figure 59 Grid Connection Infrastructure Market by Region, 2024-2034 (US$ Bn, AGR (%))
Figure 60 Grid Connection Infrastructure Market Share Forecast by Region, 2024 & 2034 (%)
Figure 61 Maintenance and Repairs Market by Region, 2024-2034 (US$ Bn, AGR (%))
Figure 62 Maintenance and Repairs Market Share Forecast by Region, 2024 & 2034 (%)
Figure 63 Miscellaneous Expenses Market by Region, 2024-2034 (US$ Bn, AGR (%))
Figure 64 Miscellaneous Expenses Market Share Forecast by Region, 2024 & 2034 (%)
Figure 65 Hydropower Market Forecast by Region 2024 and 2034 (Revenue, CAGR%)
Figure 66 Hydropower Market Share Forecast by Region 2024, 2029, 2034 (%)
Figure 67 Hydropower Market by Region, 2024-2034 (US$ Billion, AGR %)
Figure 68 North America Hydropower Market Attractiveness Index
Figure 69 North America Hydropower Market by Region, 2024, 2029 & 2034 (US$ Billion)
Figure 70 North America Hydropower Market by Value, 2024-2034 (US$ Bn, AGR (%))
Figure 71 North America Hydropower Market by Power Generation, 2024-2034 (GW, AGR (%))
Figure 72 North America Hydropower Market by Country, 2024-2034 (US$ Bn, AGR (%))
Figure 73 North America Hydropower Generation Market by Country, 2024-2034 (GW, AGR (%))
Figure 74 North America Hydropower Market Share Forecast by Country, 2024 & 2034 (%)
Figure 75 North America Hydropower Market by Type, 2024-2034 (US$ Bn, AGR (%))
Figure 76 North America Hydropower Market Share Forecast Type, 2024 & 2034 (%)
Figure 77 North America Hydropower Market by Capacity, 2024-2034 (US$ Bn, AGR (%))
Figure 78 North America Hydropower Market Share Forecast by Capacity, 2024 & 2034 (%)
Figure 79 North America Hydropower Market by End-User, 2024-2034 (US$ Bn, AGR (%))
Figure 80 North America Hydropower Market Share Forecast by End-User, 2024 & 2034 (%)
Figure 81 North America Hydropower Market by CAPEX, 2024-2034 (US$ Bn, AGR (%))
Figure 82 North America Hydropower Market Share Forecast by CAPEX, 2024 & 2034 (%)
Figure 83 US Hydropower Market by Value, 2024-2034 (US$ Bn, AGR (%))
Figure 84 US Hydropower Market by Power Generation, 2024-2034 (GW, AGR (%))
Figure 85 Canada Hydropower Market by Value, 2024-2034 (US$ Bn, AGR (%))
Figure 86 Canada Hydropower Market by Power Generation, 2024-2034 (GW, AGR (%))
Figure 87 Europe Hydropower Market Attractiveness Index
Figure 88 Europe Hydropower Market by Region, 2024, 2029 & 2034 (US$ Billion)
Figure 89 Europe Hydropower Market by Value, 2024-2034 (US$ Bn, AGR (%))
Figure 90 Europe Hydropower Market by Power Generation, 2024-2034 (GW, AGR (%))
Figure 91 Europe Hydropower Market by Country, 2024-2034 (US$ Bn, AGR (%))
Figure 92 Europe Hydropower Generation Market by Country, 2024-2034 (GW, AGR (%))
Figure 93 Europe Hydropower Market Share Forecast by Country, 2024 & 2034 (%)
Figure 94 Europe Hydropower Market by Type, 2024-2034 (US$ Bn, AGR (%))
Figure 95 Europe Hydropower Market Share Forecast Type, 2024 & 2034 (%)
Figure 96 Europe Hydropower Market by Capacity, 2024-2034 (US$ Bn, AGR (%))
Figure 97 Europe Hydropower Market Share Forecast by Capacity, 2024 & 2034 (%)
Figure 98 Europe Hydropower Market by End-User, 2024-2034 (US$ Bn, AGR (%))
Figure 99 Europe Hydropower Market Share Forecast by End-User, 2024 & 2034 (%)
Figure 100 Europe Hydropower Market by CAPEX, 2024-2034 (US$ Bn, AGR (%))
Figure 101 Europe Hydropower Market Share Forecast by CAPEX, 2024 & 2034 (%)
Figure 102 Spain Hydropower Market by Value, 2024-2034 (US$ Bn, AGR (%))
Figure 103 Spain Hydropower Market by Power Generation, 2024-2034 (GW, AGR (%))
Figure 104 Italy Hydropower Market by Value, 2024-2034 (US$ Bn, AGR (%))
Figure 105 Italy Hydropower Market by Power Generation, 2024-2034 (GW, AGR (%))
Figure 106 France Hydropower Market by Value, 2024-2034 (US$ Bn, AGR (%))
Figure 107 France Hydropower Market by Power Generation, 2024-2034 (GW, AGR (%))
Figure 108 Norway Hydropower Market by Value, 2024-2034 (US$ Bn, AGR (%))
Figure 109 Norway Hydropower Market by Power Generation, 2024-2034 (GW, AGR (%))
Figure 110 Russia Hydropower Market by Value, 2024-2034 (US$ Bn, AGR (%))
Figure 111 Russia Hydropower Market by Power Generation, 2024-2034 (GW, AGR (%))
Figure 112 Rest of Europe Hydropower Market by Value, 2024-2034 (US$ Bn, AGR (%))
Figure 113 Rest of Europe Hydropower Market by Power Generation, 2024-2034 (GW, AGR (%))
Figure 114 Asia-Pacific Hydropower Market Attractiveness Index
Figure 115 Asia-Pacific Hydropower Market by Region, 2024, 2029 & 2034 (US$ Billion)
Figure 116 Asia-Pacific Hydropower Market by Value, 2024-2034 (US$ Bn, AGR (%))
Figure 117 Asia-Pacific Hydropower Market by Power Generation, 2024-2034 (GW, AGR (%))
Figure 118 Asia-Pacific Hydropower Market by Country, 2024-2034 (US$ Bn, AGR (%))
Figure 119 Asia-Pacific Hydropower Generation Market by Country, 2024-2034 (GW, AGR (%))
Figure 120 Asia-Pacific Hydropower Market Share Forecast by Country, 2024 & 2034 (%)
Figure 121 Asia-Pacific Hydropower Market by Type, 2024-2034 (US$ Bn, AGR (%))
Figure 122 Asia-Pacific Hydropower Market Share Forecast Type, 2024 & 2034 (%)
Figure 123 Asia-Pacific Hydropower Market by Capacity, 2024-2034 (US$ Bn, AGR (%))
Figure 124 Asia-Pacific Hydropower Market Share Forecast by Capacity, 2024 & 2034 (%)
Figure 125 Asia-Pacific Hydropower Market by End-User, 2024-2034 (US$ Bn, AGR (%))
Figure 126 Asia-Pacific Hydropower Market Share Forecast by End-User, 2024 & 2034 (%)
Figure 127 Asia-Pacific Hydropower Market by CAPEX, 2024-2034 (US$ Bn, AGR (%))
Figure 128 Asia-Pacific Hydropower Market Share Forecast by CAPEX, 2024 & 2034 (%)
Figure 129 China Hydropower Market by Value, 2024-2034 (US$ Bn, AGR (%))
Figure 130 China Hydropower Market by Power Generation, 2024-2034 (GW, AGR (%))
Figure 131 India Hydropower Market by Value, 2024-2034 (US$ Bn, AGR (%))
Figure 132 India Hydropower Market by Power Generation, 2024-2034 (GW, AGR (%))
Figure 133 Japan Hydropower Market by Value, 2024-2034 (US$ Bn, AGR (%))
Figure 134 Japan Hydropower Market by Power Generation, 2024-2034 (GW, AGR (%))
Figure 135 South Korea Hydropower Market by Value, 2024-2034 (US$ Bn, AGR (%))
Figure 136 South Korea Hydropower Market by Power Generation, 2024-2034 (GW, AGR (%))
Figure 137 Australia Hydropower Market by Value, 2024-2034 (US$ Bn, AGR (%))
Figure 138 Australia Hydropower Market by Power Generation, 2024-2034 (GW, AGR (%))
Figure 139 Rest of Asia-Pacific Hydropower Market by Value, 2024-2034 (US$ Bn, AGR (%))
Figure 140 Rest of Asia-Pacific Hydropower Market by Power Generation, 2024-2034 (GW, AGR (%))
Figure 141 Middle East and Africa Hydropower Market Attractiveness Index
Figure 142 Middle East and Africa Hydropower Market by Region, 2024, 2029 & 2034 (US$ Billion)
Figure 143 Middle East & Africa Hydropower Market by Value, 2024-2034 (US$ Bn, AGR (%))
Figure 144 Middle East & Africa Hydropower Market by Power Generation, 2024-2034 (GW, AGR (%))
Figure 145 Middle East & Africa Hydropower Market by Country, 2024-2034 (US$ Bn, AGR (%))
Figure 146 Middle East & Africa Hydropower Generation Market by Country, 2024-2034 (GW, AGR (%))
Figure 147 Middle East and Africa Hydropower Market Share Forecast by Country, 2024 & 2034 (%)
Figure 148 Middle East & Africa Hydropower Market by Type, 2024-2034 (US$ Bn, AGR (%))
Figure 149 Middle East and Africa Hydropower Market Share Forecast Type, 2024 & 2034 (%)
Figure 150 Middle East & Africa Hydropower Market by Capacity, 2024-2034 (US$ Bn, AGR (%))
Figure 151 Middle East and Africa Hydropower Market Share Forecast by Capacity, 2024 & 2034 (%)
Figure 152 Middle East & Africa Hydropower Market by End-User, 2024-2034 (US$ Bn, AGR (%))
Figure 153 Middle East and Africa Hydropower Market Share Forecast by End-User, 2024 & 2034 (%)
Figure 154 Middle East & Africa Hydropower Market by CAPEX, 2024-2034 (US$ Bn, AGR (%))
Figure 155 Middle East and Africa Hydropower Market Share Forecast by CAPEX, 2024 & 2034 (%)
Figure 156 GCC Hydropower Market by Value, 2024-2034 (US$ Bn, AGR (%))
Figure 157 GCC Hydropower Market by Power Generation, 2024-2034 (GW, AGR (%))
Figure 158 South Africa Hydropower Market by Value, 2024-2034 (US$ Bn, AGR (%))
Figure 159 South Africa Hydropower Market by Power Generation, 2024-2034 (GW, AGR (%))
Figure 160 Rest of Middle East & Africa Hydropower Market by Value, 2024-2034 (US$ Bn, AGR (%))
Figure 161 Rest of Middle East & Africa Hydropower Market by Power Generation, 2024-2034 (GW, AGR (%))
Figure 162 Latin America Hydropower Market Attractiveness Index
Figure 163 Latin America Hydropower Market by Region, 2024, 2029 & 2034 (US$ Billion)
Figure 164 Latin America Hydropower Market by Value, 2024-2034 (US$ Bn, AGR (%))
Figure 165 Latin America Hydropower Market by Power Generation, 2024-2034 (GW, AGR (%))
Figure 166 Latin America Hydropower Market by Country, 2024-2034 (US$ Bn, AGR (%))
Figure 167 Latin America Hydropower Generation Market by Country, 2024-2034 (GW, AGR (%))
Figure 168 Latin America Hydropower Market Share Forecast by Country, 2024 & 2034 (%)
Figure 169 Latin America Hydropower Market by Type, 2024-2034 (US$ Bn, AGR (%))
Figure 170 Latin America Hydropower Market Share Forecast Type, 2024 & 2034 (%)
Figure 171 Latin America Hydropower Market by Capacity, 2024-2034 (US$ Bn, AGR (%))
Figure 172 Latin America Hydropower Market Share Forecast by Capacity, 2024 & 2034 (%)
Figure 173 Latin America Hydropower Market by End-User, 2024-2034 (US$ Bn, AGR (%))
Figure 174 Latin America Hydropower Market Share Forecast by End-User, 2024 & 2034 (%)
Figure 175 Latin America Hydropower Market by CAPEX, 2024-2034 (US$ Bn, AGR (%))
Figure 176 Latin America Hydropower Market Share Forecast by CAPEX, 2024 & 2034 (%)
Figure 177 Brazil Hydropower Market by Value, 2024-2034 (US$ Bn, AGR (%))
Figure 178 Brazil Hydropower Market by Power Generation, 2024-2034 (GW, AGR (%))
Figure 179 Mexico Hydropower Market by Value, 2024-2034 (US$ Bn, AGR (%))
Figure 180 Mexico Hydropower Market by Power Generation, 2024-2034 (GW, AGR (%))
Figure 181 Rest of Latin America Hydropower Market by Value, 2024-2034 (US$ Bn, AGR (%))
Figure 182 Rest of Latin America Hydropower Market by Power Generation, 2024-2034 (GW, AGR (%))
Figure 183 Hydropower Market: Company Share, 2022
Figure 184 China Three Gorges Corporation.: Net Revenue, 2018-2022 (US$ Million, AGR%)
Figure 185 State Power Investment Corporation.: Net Revenue, 2018-2022 (US$ Million, AGR%)
Figure 186 State Power Investment Corporation.: Business Segment Revenue Share, 2022 (%)
Figure 187 Électricité de France (EDF).: Net Revenue, 2018-2022 (US$ Million, AGR%)
Figure 188 Électricité de France (EDF).: Regional Revenue Share, 2022 (%)
Figure 189 Électricité de France (EDF).: Business Segment Revenue Share, 2022 (%)
Figure 190 Enel S.p.A.: Net Revenue, 2018-2022 (US$ Million, AGR%)
Figure 191 Enel S.p.A.: Regional Revenue Share, 2022 (%)
Figure 192 Enel S.p.A.: Business Segment Revenue Share, 2022 (%)
Figure 193 GE Renewable Energy.: Net Revenue, 2018-2022 (US$ Million, AGR%)
Figure 194 GE Renewable Energy.: R&D, 2018-2022 (US$ Million, AGR%)
Figure 195 GE Renewable Energy.: Regional Revenue Share, 2022 (%)
Figure 196 GE Renewable Energy.: Business Segment Revenue Share, 2022 (%)
Figure 197 American Electric Power Company, Inc..: Net Revenue, 2018-2022 (US$ Million, AGR%)
Figure 198 American Electric Power Company, Inc..: Business Segment Revenue Share, 2022 (%)
Figure 199 Duke Energy Corporation.: Net Revenue, 2018-2022 (US$ Million, AGR%)
Figure 200 Duke Energy Corporation.: Business Segment Revenue Share, 2022 (%)
Figure 201 Eletrobras .: Net Revenue, 2018-2022 (US$ Million, AGR%)
Figure 202 Eletrobras .: R&D, 2018-2022 (US$ Million, AGR%)
Figure 203 Alstom.: Net Revenue, 2018-2022 (US$ Million, AGR%)
Figure 204 Alstom.: R&D, 2018-2022 (US$ Million, AGR%)
Figure 205 Andritz AG.: Net Revenue, 2018-2022 (US$ Million, AGR%)
Figure 206 SSE plc.: Net Revenue, 2018-2022 (US$ Million, AGR%)
ページTOPに戻る
本レポートと同じKEY WORD(power)の最新刊レポート
よくあるご質問
Visiongain社はどのような調査会社ですか?
英国の調査会社ヴィジョンゲイン社(Visiongain)は、通信とエネルギーのほか、自動車や化学・医薬品、金属など、広範な市場を対象に調査を行っています。自動車市場については、市場全般に関する調査のほ... もっと見る
調査レポートの納品までの日数はどの程度ですか?
在庫のあるものは速納となりますが、平均的には 3-4日と見て下さい。
但し、一部の調査レポートでは、発注を受けた段階で内容更新をして納品をする場合もあります。
発注をする前のお問合せをお願いします。
注文の手続きはどのようになっていますか?
1)お客様からの御問い合わせをいただきます。
2)見積書やサンプルの提示をいたします。
3)お客様指定、もしくは弊社の発注書をメール添付にて発送してください。
4)データリソース社からレポート発行元の調査会社へ納品手配します。
5) 調査会社からお客様へ納品されます。最近は、pdfにてのメール納品が大半です。
お支払方法の方法はどのようになっていますか?
納品と同時にデータリソース社よりお客様へ請求書(必要に応じて納品書も)を発送いたします。
お客様よりデータリソース社へ(通常は円払い)の御振り込みをお願いします。
請求書は、納品日の日付で発行しますので、翌月最終営業日までの当社指定口座への振込みをお願いします。振込み手数料は御社負担にてお願いします。
お客様の御支払い条件が60日以上の場合は御相談ください。
尚、初めてのお取引先や個人の場合、前払いをお願いすることもあります。ご了承のほど、お願いします。
データリソース社はどのような会社ですか?
当社は、世界各国の主要調査会社・レポート出版社と提携し、世界各国の市場調査レポートや技術動向レポートなどを日本国内の企業・公官庁及び教育研究機関に提供しております。
世界各国の「市場・技術・法規制などの」実情を調査・収集される時には、データリソース社にご相談ください。
お客様の御要望にあったデータや情報を抽出する為のレポート紹介や調査のアドバイスも致します。
|
|

