ウイルスベクターとプラスミドDNA製造市場レポート:2024-2034
Viral Vectors & Plasmid DNA Manufacturing Market Report 2024-2034
レポート詳細
ウイルスベクターとプラスミドDNA製造市場レポート 2024-2034 :本レポートは、新たな収益の柱を目指す大手企業にとって、業界とその根底にある力学をより深く理解する上で貴重なものと... もっと見る
※上記価格は部署ライセンス(Departmental licence)価格です。
その他の価格についてはデータリソースまでお問合せください。
日本語のページは自動翻訳を利用し作成しています。
実際のレポートは英文のみでご納品いたします。

|
サマリー
レポート詳細
ウイルスベクターとプラスミドDNA製造市場レポート 2024-2034:本レポートは、新たな収益の柱を目指す大手企業にとって、業界とその根底にある力学をより深く理解する上で貴重なものとなろう。異業種への進出や、新たな地域での既存事業の拡大を希望する企業にとっても有用であろう。
ウイルスベクターとプラスミドは、バイオテクノロジーの分野で、特にCRISPR-Cas9遺伝子編集のような進歩の文脈で、重要な役割を果たしている。それらは、遺伝物質を正確に送達するための不可欠なビークルとして機能し、科学者が基礎研究から治療的介入に至るまで、様々な目的で遺伝子を操作・改変することを可能にしている。アデノ随伴ウイルス(AAV)やレンチウイルスなどのウイルスベクターは、宿主細胞への遺伝物質の標的挿入を可能にし、遺伝子治療の中心的存在となっている。一方、プラスミドは、外来遺伝子を細胞や生物に導入するために、分子生物学研究で一般的に使用される汎用性の高い環状DNA断片である。プラスミドの重要性は遺伝子編集にとどまらず、ワクチン開発やタンパク質生産など、バイオテクノロジーの幅広い応用範囲に及んでいる。
バイオテクノロジーを取り巻く最近の動向は、ウイルスベクターとプラスミドの重要な役割をさらに際立たせている。2023年1月、バイオ医薬品業界の有力企業であるキャタレント社は、ベルギーのゴッセリースに最先端のプラスミドDNA(pDNA)製造施設を開設した。この施設は、プラスミドに対する需要の高まりを示すだけでなく、商業的規模での効率的な生産の必要性も示している。細胞および遺伝子企業を支援するために、既製のプラスミドを製造するというキャタレント社のコミットメントは、これらの遺伝子ツールが高い需要がある業界における広範な傾向を反映している。ゴーセリーズ社におけるpDNAの専門知識と、遺伝子治療、細胞治療、およびmRNAのためのウイルスベクターの臨床および商業的生産との統合は、同社のネットワーク全体にわたってサプライ・チェーンの継続性を保証する戦略的な動きである。これは、バイオテクノロジーのエコシステムにおけるこれらの要素の相互依存性と、治療イノベーションを推進する上でのそれらの集団的役割の証しである。
市場調査レポートを購入する前にすべき質問とは?
- ウイルスベクターとプラスミドDNA製造市場はどのように進化しているのか?
- 何がウイルスベクターとプラスミドDNA製造市場を促進し、抑制しているのか?
- ウイルスベクターとプラスミドDNA製造の各サブ市場セグメントは予測期間中にどのように成長し、2034年にこれらのサブ市場がどれくらいの収益を占めるようになるのか?
- 2024年から2034年にかけて、各ウイルスベクターおよびプラスミドDNA製造サブマーケットの市場シェアはどのように推移するのか?
- 2024年から2034年までの市場全体の主な牽引役は何か?
- 主要なウイルスベクター・プラスミドDNA製造市場はマクロ経済の動きに大枠で追随するのか、それとも個々の国内市場が他を凌駕するのか?
- 2034年までに各国市場のシェアはどのように変化し、どの地域が2034年に市場をリードするのか?
- 主要プレイヤーは誰で、予測期間中の見通しは?
- これらの主要企業のウイルスベクターおよびプラスミドDNA製造プロジェクトは?
- 2024年から2034年の間に、産業はどのように発展するのか?現在および今後10年間に実施されるウイルスベクターおよびプラスミドDNA製造プロジェクトにはどのような意味があるのか?
- ウイルスベクターとプラスミドDNA製造市場をさらに拡大するために、製品の商業化の必要性は高まっていますか?
- ウイルスベクターとプラスミドDNA製造市場はどこへ向かっているのか?
- 新製品やサービスラインに対する最適な投資オプションは何か?
- 企業を新たな成長軌道に乗せ、C-suiteに移行させるための重要な展望とは?
このことがウイルスベクターとプラスミドDNAの製造市場に現在、そして今後10年間でどのような影響を与えるかを見極める必要がある:
- 408ページにわたる本レポートでは、166の表、183の図表を掲載しています。
- 本レポートでは、業界における主要な有利分野をハイライトしているため、今すぐターゲットを絞ることができます。
- 世界、地域、国の売上と成長に関する詳細な分析が含まれています。
- 競合他社が成功した主なトレンド、変化、収益予測をハイライトします。
本レポートは、ウイルスベクターとプラスミドDNA製造市場が今後10年間にどのように発展し、COVID-19の景気後退と好転の変動に合わせて変化するかをお伝えします。この市場は過去10年間のどの時点よりも今が重要である。
2034年までの予測やその他の分析から、商業的な展望が明らかになる
- 2034年までの収益予測に加え、直近の実績、成長率、市場シェアを提供します。
- ビジネスの展望と展開に関する独自の分析をご覧いただけます。
- 定性的分析(市場ダイナミクス、促進要因、機会、阻害要因、課題を含む)、コスト構造、ウイルスベクターとプラスミドDNA製造価格の上昇の影響、最近の動向をご覧いただけます。
本レポートには、COVID-19が業界と貴社にどのような影響を与えるかについてのデータ分析と貴重な洞察が含まれている。本レポートでは、COVID-19の4つの回収パターンとその影響、すなわち「V」、「L」、「W」、「U」について論じている。
レポート対象セグメント
ベクタータイプ
- アデノウイルス
- レトロウイルス
- プラスミドDNA
- AAV
- レンチウイルス
- その他のベクター
用途
- アンチセンスとRNAi
- 遺伝子治療
- 細胞療法
- ワクチン学
エンドユーズ
- 製薬・バイオファーマ企業
- 研究機関
疾患
- 腫瘍学
- 遺伝子疾患
- 感染症
- その他の疾患
ワークフロー
- アップストリーム
- ダウンストリーム
世界市場全体と各分野の収益予測に加え、5つの地域と24の主要国市場の収益予測も掲載している:
北米
- アメリカ
- カナダ
欧州
- ドイツ
- 英国
- フランス
- スペイン
- イタリア
- スウェーデン
- スイス
- その他の欧州
アジア太平洋
- 中国
- 日本
- インド
- オーストラリア
- 韓国
- シンガポール
- 台湾
- その他のアジア太平洋地域
ラテンアメリカ
- ブラジル
- メキシコ
- アルゼンチン
- その他のラテンアメリカ
MEA
- GCC
- 南アフリカ
- その他のMEA
また、2024年から2034年までのウイルスベクターとプラスミドDNA製造市場における主要企業のプロファイルも掲載している。
報告書に掲載されている主要企業
・ Addgene
・ Advanced BioScience Laboratories, Inc. (ABL)
・ Aldevron
・ Altogen Biosystems
・ Amicus Therapeutics
・ ATUM
・ Batavia Biosciences B.V.
・ BioNTech IMFS
・ Biovian Oy
・ bluebird bio Inc.
・ Catalent Inc.
・ CEVEC Pharmaceuticals GmbH
・ Charles River Laboratories
・ Creative Biogene
・ FUJIFILM Diosynth Biotechnologies
・ GENEZEN
・ Lonza
・ Merck KGaA
・ Recipharm AB
・ Thermo Fisher Scientific Inc.
・ uniQure N.V.
・ VGXI Inc.
・ Virovek
・ VIVEbiotech
・ Waisman Biomanufacturing
・ WuXi AppTec
・ Yposkesi, Inc.
ウイルスベクターとプラスミドDNA製造市場の2024年から2034年までの世界全体の売上高は、金額ベースで2024年に13億5,000万米ドルを突破する。2034年まで売上は力強く成長すると予測している。当研究所では、最大の可能性を秘めた組織を特定している。彼らの能力、進歩、商業的展望を発見し、一歩先を行くお手伝いをします。
2024年から2034年までのウイルスベクターとプラスミドDNA製造市場」レポートはどのようにお役に立ちますか?
要約すると、400ページを超えるこのレポートは、以下の知識を提供する:
- ウイルスベクターとプラスミドDNA製造市場の2024年から2034年までの収益予測、ベクターの種類、用途、最終用途、疾患、ワークフローごとの予測を世界レベルと地域レベルで掲載 - 業界の将来性を発見し、投資と収益に最も有利な場所を見つけることができます。
- 5つの地域と24の主要国市場の2034年までの収益予測 - 北米、欧州、アジア太平洋、中南米、MEAのウイルスベクターとプラスミドDNA製造市場2024年から2034年までの市場予測をご覧ください。また、米国、カナダ、ドイツ、英国、フランス、スペイン、イタリア、スウェーデン、スイス、中国、インド、日本、オーストラリア、韓国、シンガポール、台湾、ブラジル、メキシコ、アルゼンチン、GCC、南アフリカ、その他の著名な経済圏の市場も予測しています。
- 既存企業や市場参入を目指す企業の展望 - 2024年から2034年までのウイルスベクターとプラスミドDNA製造市場に関わる主要企業27社の企業プロファイルを含む。
独自の予測による定量的・定性的分析をご覧ください。私たちのレポートだけに含まれる情報を入手し、貴重なビジネスインテリジェンスで情報を得ることができます。
他にはない情報
私たちの新しいレポートがあれば、知識に遅れをとったり、チャンスを逃したりする可能性が低くなります。Visiongainの調査レポートが貴社の調査、分析、意思決定にどのように役立つかをご覧ください。Visiongainの調査は、ウイルスベクターとプラスミドDNA製造市場2024年から2034年、市場をリードする企業の商業分析を必要とするすべての人のためのものです。データ、トレンド、予測をご覧いただけます。
ページTOPに戻る
目次
目次
1 レポート概要
1.1 研究の目的
1.2 ウイルスベクターとプラスミドDNA製造市場の紹介
1.3 本レポートの内容
1.4 本レポートを読むべき理由
1.5 本分析レポートが回答する主な質問
1.6 本レポートは誰のためのものか?
1.7 方法論
1.7.1 市場の定義
1.7.2 市場評価・予測手法
1.7.3 データの検証
1.7.3.1 一次調査
1.7.3.2 セカンダリーリサーチ
1.8 よくある質問(FAQ)
1.9 Visiongainの関連レポート
1.10 Visiongainについて
2 エグゼクティブ・サマリー
3 市場概要
3.1 主要な調査結果
3.2 市場ダイナミクス
3.2.1 市場促進要因
3.2.1.1 ウイルスベクター・ソリューションによる希少疾患治療の未来形成
3.2.1.2 ウイルスベクターとプラスミドはバイオテクノロジーの高精度化とブレークスルーを可能にする上で極めて重要な役割を果たす
3.2.1.3 進歩への投資はウイルスベクター革命への資本投下を含む
3.2.2 市場抑制要因
3.2.2.1 低収量と個別最適化が川下プロセスを阻む
3.2.2.2 投資の増加にもかかわらず、ウイルスベクターの需要は生産能力の伸びを上回る
3.2.3 市場機会
3.2.3.1 医療アクセスの向上とコスト効率に優れた治療を実現するウイルスベクターの機会獲得
3.2.3.2 ゲノム解読の進歩が市場成長を促進する
3.2.3.3 RNA医薬における合成DNAテンプレートの需要の高まり
3.3 COVID-19の影響分析
3.4 ポーターのファイブフォース分析
3.4.1 サプライヤーの交渉力
3.4.2 買い手の交渉力
3.4.3 競争相手のライバル関係
3.4.4 代替品による脅威
3.4.5 新規参入企業の脅威
3.5 PEST分析
4 ウイルスベクター生産能力マッピング分析
4.1 CMOのウイルスベクター生産能力
4.2 クリーンルーム設備 主要ウイルスベクターメーカー
4.3 受託製造インフラを形成する投資の急増
4.4 細胞・遺伝子治療分野におけるCMO/CDMO施設への投資と拡張
5 ウイルスベクターの生産と収率分析
5.1 はじめに
5.2 ATMPベクターと製造プラットフォーム
5.3 細胞・遺伝子治療用ウイルスベクターの規制上の課題
6 ウイルスベクター製造: プロセス経済的考察と課題
6.1 製造における技術的進歩
6.2 安定した生産者細胞株
6.3 安定生産細胞株による細胞毒性の課題の軽減
6.4 安定生産者株を利用するためのプロセス開発における重要な要素
6.5 効率の向上とコストの低減: CGT生産における安定生産者細胞株の貢献
6.5.1 生産上流の簡素化
6.5.2 試薬と労働力のコスト削減
6.5.3 スケールアップのための柔軟性の向上
6.6 LVV製造のための一過性トランスフェクションから安定したプロデューサー細胞株への切り替え時期は?
6.7 コストに関する考察
6.8 規制上の期待
7 組換えアデノ随伴ウイルス(rAAVs)遺伝子治療バイオ製造の課題と進歩
7.1 概要
8 ウイルスベクターの生産工程分析
8.1 概要
8.2 上流ユニット業務(細胞解凍・増殖~トランスフェクション)
8.3 ダウンストリームユニット業務(収穫~精製)
8.4 製剤化/安定化および充填/仕上げ
8.5 ウイルス解析
8.6 ウイルスベクター生産施設の必要性
8.7 規制基準のニーズ
8.8 人材育成とニーズ
9 ウイルスベクターとプラスミドDNA製造市場分析:ベクタータイプ別
9.1 主要な調査結果
9.2 ベクタータイプセグメント 市場魅力度指数
9.3 ベクタータイプ別ウイルスベクターとプラスミドDNA製造市場規模の推定と予測
9.4 アデノウイルス
9.4.1 2024-2034年地域別市場規模(US$ Million)
9.4.2 地域別市場シェア、2024年・2034年(%)
9.5 レトロウイルス
9.5.1 2024年~2034年の地域別市場規模(US$ Million)
9.5.2 地域別市場シェア、2024年・2034年(%)
9.6 プラスミドDNA
9.6.1 2024~2034年の地域別市場規模(US$ Million)
9.6.2 地域別市場シェア、2024年・2034年(%)
9.7 AAV
9.7.1 2024~2034年の地域別市場規模(US$ Million)
9.7.2 地域別市場シェア、2024年・2034年(%)
9.8 レンチウイルス
9.8.1 2024~2034年の地域別市場規模(US$ Million)
9.8.2 地域別市場シェア、2024年・2034年(%)
9.9 その他のベクター
9.9.1 2024~2034年の地域別市場規模(US$ Million)
9.9.2 地域別市場シェア、2024年・2034年(%)
10 ウイルスベクターとプラスミドDNA製造市場分析:用途別
10.1 主要な調査結果
10.2 アプリケーションセグメント市場魅力度指数
10.3 ウイルスベクターとプラスミドDNA製造の用途別市場規模の推定と予測
10.4 アンチセンスとRNAi
10.4.1 2024~2034年の地域別市場規模(US$ Million)
10.4.2 地域別市場シェア、2024年・2034年(%)
10.5 遺伝子治療
10.5.1 2024~2034年の地域別市場規模(US$ Million)
10.5.2 地域別市場シェア、2024年・2034年(%)
10.6 細胞療法
10.6.1 2024~2034年の地域別市場規模(US$ Million)
10.6.2 地域別市場シェア、2024年・2034年(%)
10.7 ワクチン療法
10.7.1 2024~2034年の地域別市場規模(US$ Million)
10.7.2 地域別市場シェア、2024年・2034年(%)
11 ウイルスベクターとプラスミドDNA製造市場分析:疾患別
11.1 主要な調査結果
11.2 疾患セグメント市場魅力度指数
11.3 ウイルスベクターとプラスミドDNA製造の疾患別市場規模推定と予測
11.4 がん領域
11.4.1 2024~2034年の地域別市場規模(US$ Million)
11.4.2 地域別市場シェア、2024年・2034年(%)
11.5 遺伝子疾患
11.5.1 2024~2034年の地域別市場規模(US$ Million)
11.5.2 地域別市場シェア、2024年・2034年(%)
11.6 感染症
11.6.1 2024~2034年の地域別市場規模(US$ Million)
11.6.2 地域別市場シェア、2024年・2034年(%)
11.7 その他の疾患
11.7.1 2024~2034年の地域別市場規模(US$ Million)
11.7.2 地域別市場シェア、2024年・2034年(%)
12 ウイルスベクターとプラスミドDNA製造市場分析:エンドユーズ別
12.1 主要な調査結果
12.2 最終用途セグメント 市場魅力度指数
12.3 エンドユーズ別のウイルスベクターとプラスミドDNA製造市場規模の推定と予測
12.4 製薬・バイオファーマ企業
12.4.1 2024年~2034年の地域別市場規模(US$ Million)
12.4.2 地域別市場シェア、2024年・2034年(%)
12.5 研究機関
12.5.1 2024~2034年の地域別市場規模(US$ Million)
12.5.2 地域別市場シェア、2024年・2034年(%)
13 ウイルスベクター・プラスミドDNA製造市場分析:ワークフロー別
13.1 主要な調査結果
13.2 ワークフローセグメント 市場魅力度指数
13.3 ワークフロー別のウイルスベクター・プラスミドDNA製造市場規模の推定と予測
13.4 アップストリーム
13.4.1 2024〜2034年の地域別市場規模(US$ Million)
13.4.2 地域別市場シェア、2024年・2034年(%)
13.5 ダウンストリーム
13.5.1 2024年~2034年の地域別市場規模(US$ Million)
13.5.2 地域別市場シェア、2024年~2034年 (%)
14 ウイルスベクターとプラスミドDNA製造市場分析:地域別
14.1 主要な調査結果
14.2 地域別市場規模の推定と予測
15 北米のウイルスベクターとプラスミドDNA製造市場分析
15.1 主要な調査結果
15.2 北米のウイルスベクターとプラスミドDNA製造市場魅力度指数
15.3 北米のウイルスベクターとプラスミドDNA製造市場の国別市場規模、2024年、2029年、2034年(US$ Million)
15.4 北米のウイルスベクターとプラスミドDNA製造市場規模推定と予測:国別
15.5 北米のウイルスベクターとプラスミドDNA製造市場規模推定と予測:ベクタータイプ別
15.6 北米のウイルスベクターとプラスミドDNA製造市場規模推定と予測:用途別
15.7 北米のウイルスベクターとプラスミドDNA製造市場規模推定と予測:エンドユーズ別
15.8 北米のウイルスベクターとプラスミドDNA製造市場規模推定と予測:疾患別
15.9 北米のウイルスベクターとプラスミドDNA製造市場規模推定と予測:ワークフロー別
15.10 米国のウイルスベクター・とプラスミドDNA製造市場分析
15.11 カナダのウイルスベクターとプラスミドDNA製造市場分析
16 欧州のウイルスベクターとプラスミドDNA製造市場分析
16.1 主要な調査結果
16.2 欧州のウイルスベクターとプラスミドDNA製造市場魅力度指数
16.3 欧州のウイルスベクターとプラスミドDNA製造の国別市場、2024年、2029年、2034年(US$ Million)
16.4 欧州のウイルスベクターとプラスミドDNA製造市場規模推定と予測:国別
16.5 欧州のウイルスベクターとプラスミドDNA製造市場規模推定と予測:ベクタータイプ別
16.6 欧州のウイルスベクターとプラスミドDNA製造市場規模推定と予測:用途別
16.7 欧州のウイルスベクターとプラスミドDNA製造市場規模推定と予測:エンドユーズ別
16.8 欧州のウイルスベクター・プラスミドDNA製造市場規模推定と予測:疾患別
16.9 欧州のウイルスベクターとプラスミドDNA製造市場規模推定と予測:ワークフロー別
16.10 ドイツのウイルスベクターとプラスミドDNA製造市場分析
16.11 フランスのウイルスベクターとプラスミドDNA製造市場分析
16.12 イギリスのウイルスベクターとプラスミドDNA製造市場分析
16.13 イタリアのウイルスベクターとプラスミドDNA製造市場分析
16.14 スペインのウイルスベクターとプラスミドDNA製造市場分析
16.15 スウェーデンのウイルスベクターとプラスミドDNA製造市場分析
16.16 スイス ウイルスベクターとプラスミドDNA製造市場分析
16.17 その他の欧州のウイルスベクターとプラスミドDNA製造市場分析
17 アジア太平洋地域のウイルスベクターとプラスミドDNA製造市場分析
17.1 主要な調査結果
17.2 アジア太平洋地域のウイルスベクターとプラスミドDNA製造市場魅力度指数
17.3 アジア太平洋地域のウイルスベクターとプラスミドDNA製造の国別市場規模、2024年、2029年、2034年(US$ Million)
17.4 アジア太平洋地域のウイルスベクターとプラスミドDNA製造市場規模推定と予測:国別
17.5 アジア太平洋地域のウイルスベクターとプラスミドDNA製造市場規模推定と予測:ベクタータイプ別
17.6 アジア太平洋地域のウイルスベクターとプラスミドDNA製造市場規模推定と予測:用途別
17.7 アジア太平洋地域のウイルスベクターとプラスミドDNA製造市場規模推定と予測:エンドユーズ別
17.8 アジア太平洋地域のウイルスベクターとプラスミドDNA製造市場規模推定と予測:疾患別
17.9 アジア太平洋地域のウイルスベクターとプラスミドDNA製造市場規模推定と予測:ワークフロー別
17.10 日本のウイルスベクターとプラスミドDNA製造市場分析
17.11 中国のウイルスベクターとプラスミドDNA製造市場分析
17.12 インド ウイルスベクターとプラスミドDNA製造市場分析
17.13 オーストラリアのウイルスベクターとプラスミドDNA製造市場分析
17.14 韓国のウイルスベクターとプラスミドDNA製造市場分析
17.15 シンガポールのウイルスベクターとプラスミドDNA製造市場分析
17.16 台湾のウイルスベクターとプラスミドDNA製造市場分析
17.17 その他のアジア太平洋地域のウイルスベクターとプラスミドDNA製造市場分析
18 ラテンアメリカのウイルスベクターとプラスミドDNA製造市場分析
18.1 主要な調査結果
18.2 ラテンアメリカのウイルスベクターとプラスミドDNA製造市場魅力度指数
18.3 ラテンアメリカのウイルスベクターとプラスミドDNA製造の国別市場、2024年、2029年、2034年(US$ Million)
18.4 ラテンアメリカのウイルスベクターとプラスミドDNA製造市場規模推定と予測:国別
18.5 ラテンアメリカのウイルスベクターとプラスミドDNA製造市場規模推定と予測:ベクタータイプ別
18.6 ラテンアメリカのウイルスベクターとプラスミドDNA製造市場規模推定と予測:用途別
18.7 ラテンアメリカのウイルスベクターとプラスミドDNA製造市場規模推定と予測:エンドユーズ別
18.8 ラテンアメリカのウイルスベクターとプラスミドDNA製造市場規模推定と予測:ワークフロー別
18.9 ブラジルのウイルスベクターとプラスミドDNA製造市場分析
18.10 メキシコのウイルスベクターとプラスミドDNA製造市場分析
18.11 アルゼンチンのウイルスベクターとプラスミドDNA製造市場分析
18.12 その他のラテンアメリカのウイルスベクターとプラスミドDNA製造市場分析
19 MEAのウイルスベクターとプラスミドDNA製造市場分析
19.1 主要な調査結果
19.2 MEAのウイルスベクターとプラスミドDNA製造市場魅力度指数
19.3 MEAのウイルスベクターとプラスミドDNA製造市場の国別市場規模予測、2024年、2029年、2034年(US$ Million)
19.4 MEAのウイルスベクターとプラスミドDNA製造国別市場規模推定と予測
19.5 MEAのウイルスベクターとプラスミドDNA製造市場規模推定と予測:ベクタータイプ別
19.6 MEAのウイルスベクターとプラスミドDNA製造市場規模推定と予測:用途別
19.7 MEAのウイルスベクターとプラスミドDNA製造市場規模推定と予測:エンドユーズ別
19.8 MEAのウイルスベクターとプラスミドDNA製造市場規模推定と予測:疾患別
19.9 MEAのウイルスベクターとプラスミドDNA製造市場規模推定と予測:ワークフロー別
19.10 GCCのウイルスベクターとプラスミドDNA製造市場分析
19.11 南アフリカのウイルスベクターとプラスミドDNA製造市場分析
19.12 その他のMEAのウイルスベクター・プラスミドDNA製造市場分析
20 会社概要
20.1 競争環境、2022年
20.2 戦略的展望
20.1 Amicus Therapeutics
20.1.1 会社概要
20.1.2 会社概要
20.1.3 財務分析
20.1.3.1 純収入、2017-2022年
20.1.3.2 R&D、2017-2022年
20.1.3.3 地域市場シェア、2022年
20.1.4 製品ベンチマーク
20.1.5 戦略的展望
20.2 Lonza Group Ltd
20.2.1 会社概要
20.2.2 会社概要
20.2.3 財務分析
20.2.3.1 純収入、2017-2022年
20.2.3.2 R&D、2017-2022年
20.2.3.3 地域市場シェア、2022年
20.2.4 製品ベンチマーク
20.2.5 戦略的展望
20.3 Merck KGaA
20.3.1 会社概要
20.3.2 会社概要
20.3.3 財務分析
20.3.3.1 純収入、2017-2022年
20.3.3.2 R&D、2017-2022年
20.3.3.3 地域市場シェア、2022年
20.3.4 製品ベンチマーク
20.3.5 戦略的展望
20.4 uniQure N.V.
20.4.1 会社概要
20.4.2 会社概要
20.4.3 財務分析
20.4.3.1 純収入、2017-2022年
20.4.3.2 R&D、2017-2022年
20.4.3.3 地域市場シェア、2022年
20.4.4 製品ベンチマーク
20.4.5 戦略的展望
20.5 Catalent Inc
20.5.1 会社概要
20.5.2 会社概要
20.5.3 財務分析
20.5.3.1 純収入、2017-2022年
20.5.3.2 売上高、2017-2022年
20.5.3.3 地域市場シェア、2022年
20.5.4 製品ベンチマーク
20.5.5 戦略的展望
20.6 Thermo Fisher Scientific Inc.
20.6.1 会社概要
20.6.2 会社概要
20.6.3 財務分析
20.6.3.1 純収入、2017-2022年
20.6.3.2 R&D、2017-2022年
20.6.3.3 地域市場シェア、2022年
20.6.4 製品ベンチマーク
20.6.5 戦略的展望
20.7 Charles River Laboratories
20.7.1 会社概要
20.7.2 会社概要
20.7.3 財務分析
20.7.3.1 純収入、2017-2022年
20.7.3.2 地域市場シェア、2022年
20.7.4 製品ベンチマーク
20.7.5 戦略的展望
20.8 FUJIFILM Diosynth Biotechnologies
20.8.1 会社概要
20.8.2 会社概要
20.8.3 製品ベンチマーク
20.8.4 戦略的展望
20.9 bluebird bio Inc
20.9.1 会社概要
20.9.2 会社概要
20.9.3 財務分析
20.9.3.1 純収入、2017-2022年
20.9.3.2 売上高、2017-2022年
20.9.4 製品ベンチマーク
20.9.5 戦略的展望
20.10 Aldevron
20.10.1 会社概要
20.10.2 会社概要
20.10.3 製品ベンチマーク
20.10.4 戦略的展望
20.11 Addgene
20.11.1 会社概要
20.11.2 会社概要
20.11.3 製品ベンチマーク
20.12 Creative Biogene
20.12.1 会社概要
20.12.2 会社概要
20.12.3 製品ベンチマーク
20.13 VIVEbiotech
20.13.1 会社概要
20.13.2 会社概要
20.13.3 製品ベンチマーク
20.13.4 戦略的展望
20.14 Recipharm AB
20.14.1 会社概要
20.14.2 会社概要
20.14.3 製品ベンチマーク
20.14.4 戦略的展望
20.15 Waisman Biomanufacturing
20.15.1 会社概要
20.15.2 会社概要
20.15.3 製品ベンチマーク
20.15.4 戦略的展望
20.16 VGXI, Inc.
20.16.1 会社概要
20.16.2 会社概要
20.16.3 製品ベンチマーク
20.16.4 戦略的展望
20.17 Batavia Biosciences B.V.
20.17.1 会社概要
20.17.2 会社概要
20.17.3 製品ベンチマーク
20.17.4 戦略的展望
20.18 WuXi AppTec
20.18.1 会社概要
20.18.2 会社概要
20.18.3 製品ベンチマーク
20.18.4 戦略的展望
20.19 ATUM
20.19.1 会社概要
20.19.2 会社概要
20.19.3 製品ベンチマーク
20.19.4 戦略的展望
20.20 Altogen Biosystems
20.20.1 会社概要
20.20.2 会社概要
20.20.3 製品ベンチマーク
20.21 GENEZEN
20.21.1 会社概要
20.21.2 会社概要
20.21.3 製品ベンチマーク
20.21.4 戦略的展望
20.22 Yposkesi, Inc.
20.22.1 会社概要
20.22.2 会社概要
20.22.3 製品ベンチマーク
20.22.4 戦略的展望
20.23 CEVEC Pharmaceuticals GmbH
20.23.1 会社概要
20.23.2 会社概要
20.23.3 製品ベンチマーク
20.23.4 戦略的展望
20.24 Virovek
20.24.1 会社概要
20.24.2 会社概要
20.24.3 製品ベンチマーク
20.24.4 戦略的展望
20.25 Advanced BioScience Laboratories, Inc (ABL)
20.25.1 会社概要
20.25.2 会社概要
20.25.3 製品ベンチマーク
20.25.4 戦略的展望
20.26 Biovian Oy
20.26.1 会社概要
20.26.2 会社概要
20.26.3 製品ベンチマーク
20.26.4 戦略的展望
20.27 BioNTech IMFS
20.27.1 会社概要
20.27.2 会社概要
20.27.3 製品ベンチマーク
20.27.4 戦略的展望
21 結論と提言
21.1 ビジョンゲインからの結びの言葉
21.2 市場プレイヤーへの提言
ページTOPに戻る
図表リスト
表の一覧
Table 1 Viral Vectors and Plasmid DNA Manufacturing Market Snapshot, 2022 & 2032 (US$ million, CAGR %)
Table 2 Viral Vectors and Plasmid DNA Manufacturing Market Forecast by Region 2024-2034 (US$ Million, AGR%, CAGR%): "V" Shaped Recovery
Table 3 Viral Vectors and Plasmid DNA Manufacturing Market Forecast by Region 2024-2034 (US$ Million, AGR%, CAGR%): "U" Shaped Recovery
Table 4 Viral Vectors and Plasmid DNA Manufacturing Market Forecast by Region 2024-2034 (US$ Million, AGR%, CAGR%): "W" Shaped Recovery
Table 5 Viral Vectors and Plasmid DNA Manufacturing Market Forecast by Region 2024-2034 (US$ Million, AGR%, CAGR%): "L" Shaped Recovery
Table 6 CMOs Capacity for Viral Vector Manufacturing
Table 7 Cleanroom Suites Facilities
Table 8 Investments and Expansions in CMO/CDMO Facilities in the Cell and Gene Therapy Sector
Table 9 Addressing Challenges and Technological Solutions
Table 10 Viral Vectors and Plasmid DNA Manufacturing Market Forecast by Vector Type, 2024-2034 (US$ Million, AGR%, CAGR%)
Table 11 Adenovirus Segment Market Forecast by Region, 2024-2034 (US$ Million, AGR%, CAGR%)
Table 12 Retrovirus Segment Market Forecast by Region, 2024-2034 (US$ Million, AGR%, CAGR%)
Table 13 Plasmid DNA Segment Market Forecast by Region, 2024-2034 (US$ Million, AGR%, CAGR%)
Table 14 AAV Market Forecast by Region, 2024-2034 (US$ Million, AGR%, CAGR%)
Table 15 Lentivirus Segment Market Forecast by Region, 2024-2034 (US$ Million, AGR%, CAGR%)
Table 16 Other Vaccine Segment Market Forecast by Region, 2024-2034 (US$ Million, AGR%, CAGR%)
Table 17 Viral Vectors and Plasmid DNA Manufacturing Market Forecast by Application, 2024-2034 (US$ Million, AGR%, CAGR%)
Table 18 Antisense RNAi Segment Market Forecast by Region, 2024-2034 (US$ Million, AGR%, CAGR%)
Table 19 Bacterial Segment Market Forecast by Region, 2024-2034 (US$ Million, AGR%, CAGR%)
Table 20 Cell Therapy Segment Market Forecast by Region, 2024-2034 (US$ Million, AGR%, CAGR%)
Table 21 Vaccinology Segment Market Forecast by Region, 2024-2034 (US$ Million, AGR%, CAGR%)
Table 22 Viral Vectors and Plasmid DNA Manufacturing Market Forecast by Disease, 2024-2034 (US$ Million, AGR%, CAGR%)
Table 23 Oncology Segment Market Forecast by Region, 2024-2034 (US$ Million, AGR%, CAGR%)
Table 24 Genetic Disorders Segment Market Forecast by Region, 2024-2034 (US$ Million, AGR%, CAGR%)
Table 25 Infectious Diseases Segment Market Forecast by Region, 2024-2034 (US$ Million, AGR%, CAGR%)
Table 26 Others Segment Market Forecast by Region, 2024-2034 (US$ Million, AGR%, CAGR%)
Table 27 Viral Vectors and Plasmid DNA Manufacturing Market Forecast by End-use, 2024-2034 (US$ Million, AGR%, CAGR%)
Table 28 Pharma and Biopharma Companies Segment Market Forecast by Region, 2024-2034 (US$ Million, AGR%, CAGR%)
Table 29 Research Institutes Segment Market Forecast by Region, 2024-2034 (US$ Million, AGR%, CAGR%)
Table 30 Viral Vectors and Plasmid DNA Manufacturing Market Forecast by Workflow, 2024-2034 (US$ Million, AGR%, CAGR%)
Table 31 Upstream Segment Market Forecast by Region, 2024-2034 (US$ Million, AGR%, CAGR%)
Table 32 Downstream Segment Market Forecast by Region, 2024-2034 (US$ Million, AGR%, CAGR%)
Table 33 Viral Vectors and Plasmid DNA Manufacturing Market Forecast by Region, 2024-2034 (US$ Million, AGR%, CAGR%)
Table 34 North America Viral Vectors and Plasmid DNA Manufacturing Market Forecast by Country, 2024-2034 (US$ Million, AGR%, CAGR%)
Table 35 North America Viral Vectors and Plasmid DNA Manufacturing Market Forecast by Vector Type, 2024-2034 (US$ Million, AGR%, CAGR%)
Table 36 North America Viral Vectors and Plasmid DNA Manufacturing Market Forecast by Application, 2024-2034 (US$ Million, AGR%, CAGR%)
Table 37 North America Viral Vectors and Plasmid DNA Manufacturing Market Forecast by End-use, 2024-2034 (US$ Million, AGR%, CAGR%)
Table 38 North America Viral Vectors and Plasmid DNA Manufacturing Market Forecast by Disease, 2024-2034 (US$ Million, AGR%, CAGR%)
Table 39 North America Viral Vectors and Plasmid DNA Manufacturing Market Forecast Workflow, 2024-2034 (US$ Million, AGR%, CAGR%)
Table 40 U.S. Viral Vectors and Plasmid DNA Manufacturing Market Forecast, 2024-2034 (US$ Million, AGR%, CAGR%)
Table 41 Canada Viral Vectors and Plasmid DNA Manufacturing Market Forecast, 2024-2034 (US$ Million, AGR%, CAGR%)
Table 42 Europe Viral Vectors and Plasmid DNA Manufacturing Market Forecast by Country, 2024-2034 (US$ Million, AGR%, CAGR %)
Table 43 Europe Viral Vectors and Plasmid DNA Manufacturing Market Forecast by Vector Type, 2024-2034 (US$ Million, AGR%, CAGR%)
Table 44 Europe Viral Vectors and Plasmid DNA Manufacturing Market Forecast by Application, 2024-2034 (US$ Million, AGR%, CAGR%)
Table 45 Europe Viral Vectors and Plasmid DNA Manufacturing Market Forecast by End-use, 2024-2034 (US$ Million, AGR%, CAGR%)
Table 46 Europe Viral Vectors and Plasmid DNA Manufacturing Market Forecast by Disease, 2024-2034 (US$ Million, AGR%, CAGR%)
Table 47 Europe Viral Vectors and Plasmid DNA Manufacturing Market Forecast Workflow, 2024-2034 (US$ Million, AGR%, CAGR%)
Table 48 Germany Viral Vectors and Plasmid DNA Manufacturing Market Forecast, 2024-2034 (US$ Million, AGR%, CAGR%)
Table 49 France Viral Vectors and Plasmid DNA Manufacturing Market Forecast, 2024-2034 (US$ Million, AGR%, CAGR%)
Table 50 UK Viral Vectors and Plasmid DNA Manufacturing Market Forecast, 2024-2034 (US$ Million, AGR%, CAGR%)
Table 51 Italy Viral Vectors and Plasmid DNA Manufacturing Market Forecast, 2024-2034 (US$ Million, AGR%, CAGR%)
Table 52 Spain Viral Vectors and Plasmid DNA Manufacturing Market Forecast, 2024-2034 (US$ Million, AGR%, CAGR%)
Table 53 Sweden Viral Vectors and Plasmid DNA Manufacturing Market Forecast, 2024-2034 (US$ Million, AGR%, CAGR%)
Table 54 Switzerland Viral Vectors and Plasmid DNA Manufacturing Market Forecast, 2024-2034 (US$ Million, AGR%, CAGR%)
Table 55 Rest of Europe Viral Vectors and Plasmid DNA Manufacturing Market Forecast, 2024-2034 (US$ Million, AGR%, CAGR%)
Table 56 Asia Pacific Viral Vectors and Plasmid DNA Manufacturing Market Forecast by Country, 2024-2034 (US$ Million, AGR%, CAGR%)
Table 57 Asia Pacific Viral Vectors and Plasmid DNA Manufacturing Market Forecast by Vector Type, 2024-2034 (US$ Million, AGR%, CAGR%)
Table 58 Asia Pacific Viral Vectors and Plasmid DNA Manufacturing Market Forecast by Application, 2024-2034 (US$ Million, AGR%, CAGR%)
Table 59 Asia Pacific Viral Vectors and Plasmid DNA Manufacturing Market Forecast by End-use, 2024-2034 (US$ Million, AGR%, CAGR%)
Table 60 Europe Viral Vectors and Plasmid DNA Manufacturing Market Forecast by Disease, 2024-2034 (US$ Million, AGR%, CAGR%)
Table 61 Asia Pacific Viral Vectors and Plasmid DNA Manufacturing Market Forecast Workflow, 2024-2034 (US$ Million, AGR%, CAGR%)
Table 62 Japan Viral Vectors and Plasmid DNA Manufacturing Market Forecast, 2024-2034 (US$ Million, AGR%, CAGR%)
Table 63 China Viral Vectors and Plasmid DNA Manufacturing Market Forecast, 2024-2034 (US$ Million, AGR%, CAGR%)
Table 64 India Viral Vectors and Plasmid DNA Manufacturing Market Forecast, 2024-2034 (US$ Million, AGR%, CAGR%)
Table 65 Australia Viral Vectors and Plasmid DNA Manufacturing Market Forecast, 2024-2034 (US$ Million, AGR%, CAGR%)
Table 66 South Korea Viral Vectors and Plasmid DNA Manufacturing Market Forecast, 2024-2034 (US$ Million, AGR%, CAGR%)
Table 67 Singapore Viral Vectors and Plasmid DNA Manufacturing Market Forecast, 2024-2034 (US$ Million, AGR%, CAGR%)
Table 68 Taiwan Viral Vectors and Plasmid DNA Manufacturing Market Forecast, 2024-2034 (US$ Million, AGR%, CAGR%)
Table 69 Rest of Asia Pacific Viral Vectors and Plasmid DNA Manufacturing Market Forecast, 2024-2034 (US$ Million, AGR%, CAGR%)
Table 70 Latin America Viral Vectors and Plasmid DNA Manufacturing Market Forecast by Country, 2024-2034 (US$ Million, AGR%, CAGR%)
Table 71 Latin America Viral Vectors and Plasmid DNA Manufacturing Market Forecast by Vector Type, 2024-2034 (US$ Million, AGR%, CAGR%)
Table 72 Latin America Viral Vectors and Plasmid DNA Manufacturing Market Forecast by Application, 2024-2034 (US$ Million, AGR%, CAGR%)
Table 73 Latin America Viral Vectors and Plasmid DNA Manufacturing Market Forecast by End-use, 2024-2034 (US$ Million, AGR%, CAGR%)
Table 74 Latin America Viral Vectors and Plasmid DNA Manufacturing Market Forecast Workflow, 2024-2034 (US$ Million, AGR%, CAGR%)
Table 75 Brazil Viral Vectors and Plasmid DNA Manufacturing Market Forecast, 2024-2034 (US$ Million, AGR%, CAGR%)
Table 76 Mexico Viral Vectors and Plasmid DNA Manufacturing Market Forecast, 2024-2034 (US$ Million, AGR%, CAGR%)
Table 77 Argentina Viral Vectors and Plasmid DNA Manufacturing Market Forecast, 2024-2034 (US$ Million, AGR%, CAGR%)
Table 78 Rest of Latin America Viral Vectors and Plasmid DNA Manufacturing Market Forecast, 2024-2034 (US$ Million, AGR%, CAGR%)
Table 79 MEA Viral Vectors and Plasmid DNA Manufacturing Market Forecast by Country, 2024-2034 (US$ Million, AGR%, CAGR%)
Table 80 MEA Viral Vectors and Plasmid DNA Manufacturing Market Forecast by Vector Type, 2024-2034 (US$ Million, AGR%, CAGR%)
Table 81 MEA Viral Vectors and Plasmid DNA Manufacturing Market Forecast by Application, 2024-2034 (US$ Million, AGR%, CAGR%)
Table 82 MEA Viral Vectors and Plasmid DNA Manufacturing Market Forecast by End-use, 2024-2034 (US$ Million, AGR%, CAGR%)
Table 83 MEA Viral Vectors and Plasmid DNA Manufacturing Market Forecast by Disease, 2024-2034 (US$ Million, AGR%, CAGR%)
Table 84 North America Viral Vectors and Plasmid DNA Manufacturing Market Forecast Workflow, 2024-2034 (US$ Million, AGR%, CAGR%)
Table 85 GCC Viral Vectors and Plasmid DNA Manufacturing Market Forecast, 2024-2034 (US$ Million, AGR%, CAGR%)
Table 86 South Africa Viral Vectors and Plasmid DNA Manufacturing Market Forecast, 2024-2034 (US$ Million, AGR%, CAGR%)
Table 87 Rest of MEA Viral Vectors and Plasmid DNA Manufacturing Market Forecast, 2024-2034 (US$ Million, AGR%, CAGR%)
Table 88 Strategic Outlook
Table 89 Amicus Therapeutics: Key Details, (CEO, HQ, Revenue, Founded, No. of Employees, Company Type, Website, Business Segment)
Table 90 Amicus Therapeutics : Product Benchmarking
Table 91 AstraZeneca: Strategic Outlook
Table 92 Lonza Group Ltd: Key Details, (CEO, HQ, Revenue, Founded, No. of Employees, Company Type, Website, Business Segment)
Table 93 Lonza Group Ltd: Product Benchmarking
Table 94 Lonza Group Ltd: Strategic Outlook
Table 95 Merck KGaA: Key Details, (CEO, HQ, Revenue, Founded, No. of Employees, Company Type, Website, Business Segment)
Table 96 Merck KGaA: Product Benchmarking
Table 97 Merck: Strategic Outlook
Table 98 uniQure N.V.: Key Details, (CEO, HQ, Revenue, Founded, No. of Employees, Company Type, Website, Business Segment)
Table 99 uniQure N.V. : Product Benchmarking
Table 100 uniQure N.V. : Strategic Outlook
Table 101 Catalent Inc: Key Details, (CEO, HQ, Revenue, Founded, No. of Employees, Company Type, Website, Business Segment)
Table 102 Catalent Inc: Product Benchmarking
Table 103 Catalent Inc: Strategic Outlook
Table 104 Thermo Fisher Scientific Inc.: Key Details, (CEO, HQ, Revenue, Founded, No. of Employees, Company Type, Website, Business Segment)
Table 105 Thermo Fisher Scientific Inc.: Product Benchmarking
Table 106 Thermo Fisher Scientific Inc.: Strategic Outlook
Table 107 Charles River Laboratories: Key Details, (CEO, HQ, Revenue, Founded, No. of Employees, Company Type, Website, Business Segment)
Table 108 Charles River Laboratories: Product Benchmarking
Table 109 Charles River Laboratories International Inc: Strategic Outlook
Table 110 FUJIFILM Diosynth Biotechnologies: Key Details, (CEO, HQ, Revenue, Founded, No. of Employees, Company Type, Website, Business Segment)
Table 111 FUJIFILM Diosynth Biotechnologies: Product Benchmarking
Table 112 FUJIFILM Diosynth Biotechnologies: Strategic Outlook
Table 113 bluebird bio Inc: Key Details, (CEO, HQ, Revenue, Founded, No. of Employees, Company Type, Website, Business Segment)
Table 114 bluebird bio Inc: Product Benchmarking
Table 115 bluebird bio Inc: Strategic Outlook
Table 116 Aldevron: Key Details, (CEO, HQ, Revenue, Founded, No. of Employees, Company Type, Website, Business Segment)
Table 117 Aldevron: Product Benchmarking
Table 118 Aldevron: Strategic Outlook
Table 119 Addgene: Key Details, (CEO, HQ, Revenue, Founded, No. of Employees, Company Type, Website, Business Segment)
Table 120 Addgene: Product Benchmarking
Table 121 Creative Biogene: Key Details, (CEO, HQ, Revenue, Founded, No. of Employees, Company Type, Website, Business Segment)
Table 122 Creative Biogene: Product Benchmarking
Table 123 Vivebiotech: Key Details, (CEO, HQ, Revenue, Founded, No. of Employees, Company Type, Website, Business Segment)
Table 124 VIVEbiotech: Product Benchmarking
Table 125 VIVEbiotech: Strategic Outlook
Table 126 Recipharm AB: Key Details, (CEO, HQ, Revenue, Founded, No. of Employees, Company Type, Website, Business Segment)
Table 127 Recifarm AB: Product Benchmarking
Table 128 Recipharm AB: Strategic Outlook
Table 129 Waisman Biomanufacturing: Key Details, (CEO, HQ, Revenue, Founded, No. of Employees, Company Type, Website, Business Segment)
Table 130 Waisman Biomanufacturing: Product Benchmarking
Table 131 Waisman Biomanufacturing: Strategic Outlook
Table 132 VGXI, Inc.: Key Details, (CEO, HQ, Revenue, Founded, No. of Employees, Company Type, Website, Business Segment)
Table 133 VGXI, Inc. : Product Benchmarking
Table 134 VGXI, Inc.: Strategic Outlook
Table 135 Batavia Biosciences B.V.: Key Details, (CEO, HQ, Revenue, Founded, No. of Employees, Company Type, Website, Business Segment)
Table 136 Batavia Biosciences B.V. : Product Benchmarking
Table 137 Batavia Biosciences B.V.: Strategic Outlook
Table 138 WuXi AppTec: Key Details, (CEO, HQ, Revenue, Founded, No. of Employees, Company Type, Website, Business Segment)
Table 139 Wuxi AppTec: Product Benchmarking
Table 140 Wuxi AppTec: Strategic Outlook
Table 141 ATUM: Key Details, (CEO, HQ, Revenue, Founded, No. of Employees, Company Type, Website, Business Segment)
Table 142 ATUM: Product Benchmarking
Table 143 ATUM: Strategic Outlook
Table 144 Altogen Biosystems: Key Details, (CEO, HQ, Revenue, Founded, No. of Employees, Company Type, Website, Business Segment)
Table 145 Altogen Biosystems: Product Benchmarking
Table 146 Genezen: Key Details, (CEO, HQ, Revenue, Founded, No. of Employees, Company Type, Website, Business Segment)
Table 147 Genezen: Product Benchmarking
Table 148 Genezen: Strategic Outlook
Table 149 Yposkesi, Inc: Key Details, (CEO, HQ, Revenue, Founded, No. of Employees, Company Type, Website, Business Segment)
Table 150 Yposkesi, Inc: Product Benchmarking
Table 151 Yposkesi, Inc: Strategic Outlook
Table 152 CEVEC Pharmaceuticals GmbH : Key Details, (CEO, HQ, Revenue, Founded, No. of Employees, Company Type, Website, Business Segment)
Table 153 CEVEC Pharmaceuticals GmbH : Product Benchmarking
Table 154 CEVEC Pharmaceuticals GmbH: Strategic Outlook
Table 155 Virovek: Key Details, (CEO, HQ, Revenue, Founded, No. of Employees, Company Type, Website, Business Segment)
Table 156 Virovek : Product Benchmarking
Table 157 Virovek: Strategic Outlook
Table 158 ABL Inc.: Key Details, (CEO, HQ, Revenue, Founded, No. of Employees, Company Type, Website, Business Segment)
Table 159 ABL Inc.: Product Benchmarking
Table 160 ABL Inc.: Strategic Outlook
Table 161 Biovian Oy: Key Details, (CEO, HQ, Revenue, Founded, No. of Employees, Company Type, Website, Business Segment)
Table 162 Biovian Oy : Product Benchmarking
Table 163 Biovian Oy: Strategic Outlook
Table 164 BioNTech IMFS : Key Details, (CEO, HQ, Revenue, Founded, No. of Employees, Company Type, Website, Business Segment)
Table 165 BioNTech IMFS: Product Benchmarking
Table 166 BioNTech IMFS: Strategic Outlook
図の一覧
Figure 1 Viral Vectors and Plasmid DNA Manufacturing Market Segmentation
Figure 2 Viral Vectors and Plasmid DNA Manufacturing Market by Vector Type: Market Attractiveness Index
Figure 3 Viral Vectors and Plasmid DNA Manufacturing Market by Application: Market Attractiveness Index
Figure 4 Viral Vectors and Plasmid DNA Manufacturing Market by End-use: Market Attractiveness Index
Figure 5 Viral Vectors and Plasmid DNA Manufacturing Market by Disease: Market Attractiveness Index
Figure 6 Viral Vectors and Plasmid DNA Manufacturing Market by Workflow: Market Attractiveness Index
Figure 7 Viral Vectors and Plasmid DNA Manufacturing Market Attractiveness Index by Region
Figure 8 Viral Vectors and Plasmid DNA Manufacturing Market: Market Dynamics
Figure 9 Viral Vectors and Plasmid DNA Manufacturing Market by Region, 2024-2034 (US$ Million, AGR %): “V” Shaped Recovery
Figure 10 Viral Vectors and Plasmid DNA Manufacturing Market by Region, 2024-2034 (US$ Million, AGR %): “U” Shaped Recovery
Figure 11 Viral Vectors and Plasmid DNA Manufacturing Market by Region, 2024-2034 (US$ Million, AGR %): “W” Shaped Recovery
Figure 12 Viral Vectors and Plasmid DNA Manufacturing Market by Region, 2024-2034 (US$ Million, AGR %): “L” Shaped Recovery
Figure 13 Viral Vectors and Plasmid Manufacturing Market: Porter’s Five Forces Analysis
Figure 14 Viral Vectors and Plasmid Manufacturing Market: PEST Analysis
Figure 15 Viral Vectors and Plasmid DNA Manufacturing Market by Vector Type: Market Attractiveness Index
Figure 16 Viral Vectors and Plasmid DNA Manufacturing Market Forecast by Vector Type, 2024-2034 (US$ Million, AGR %)
Figure 17 Viral Vectors and Plasmid DNA Manufacturing Market Share Forecast by Vector Type, 2024, 2029, 2034 (%)
Figure 18 Adenovirus Segment Market Forecast by Region, 2024-2034 (US$ Million, AGR %)
Figure 19 Adenovirus Segment Market Share Forecast by Region, 2024 & 2034 (%)
Figure 20 Retrovirus Segment Market Forecast by Region, 2024-2034 (US$ Million, AGR %)
Figure 21 Retrovirus Segment Market Share Forecast by Region, 2024 & 2034 (%)
Figure 22 Plasmid DNA Segment Market Forecast by Region, 2024-2034 (US$ Million, AGR %)
Figure 23 Plasmid DNA Segment Market Share Forecast by Region, 2024 & 2034 (%)
Figure 24 AAV Segment Market Forecast by Region, 2024-2034 (US$ Million, AGR %)
Figure 25 AAV Segment Market Share Forecast by Region, 2024 & 2034 (%)
Figure 26 Lentivirus Segment Market Forecast by Region, 2024-2034 (US$ Million, AGR %)
Figure 27 Letivirus Segment Market Share Forecast by Region, 2024 & 2034 (%)
Figure 28 Other Vectors Segment Market Forecast by Region, 2024-2034 (US$ Million, AGR %)
Figure 29 Other Vectors Segment Market Share Forecast by Region, 2024 & 2034 (%)
Figure 30 Viral Vectors and Plasmid DNA Manufacturing Market by Application: Market Attractiveness Index
Figure 31 Viral Vectors and Plasmid DNA Manufacturing Market Forecast by Application, 2024-2034 (US$ Million, AGR %)
Figure 32 Viral Vectors and Plasmid DNA Manufacturing Market Share Forecast by Application, 2024, 2029, 2034 (%)
Figure 33 Antisense RNAi Segment Market Forecast by Region, 2024-2034 (US$ Million, AGR %)
Figure 34 Antisense RNAi Segment Market Share Forecast by Region, 2024 & 2034 (%)
Figure 35 Gene Therapy Segment Market Forecast by Region, 2024-2034 (US$ Million, AGR %)
Figure 36 Gene Therapy Segment Market Share Forecast by Region, 2024 & 2034 (%)
Figure 37 Cell Therapy Segment Market Forecast by Region, 2024-2034 (US$ Million, AGR %)
Figure 38 Cell Therapy Segment Market Share Forecast by Region, 2024 & 2034 (%)
Figure 39 Vaccinology Segment Market Forecast by Region, 2024-2034 (US$ Million, AGR %)
Figure 40 Vaccinology Segment Market Share Forecast by Region, 2024 & 2034 (%)
Figure 41 Viral Vectors and Plasmid DNA Manufacturing Market by Disease: Market Attractiveness Index
Figure 42 Viral Vectors and Plasmid DNA Manufacturing Market Forecast by Disease, 2024-2034 (US$ Million, AGR %)
Figure 43 Viral Vectors and Plasmid DNA Manufacturing Market Share Forecast by Disease, 2024, 2029, 2034 (%)
Figure 44 Oncology Segment Market Forecast by Region, 2024-2034 (US$ Million, AGR %)
Figure 45 Oncology Segment Market Share Forecast by Region, 2024 & 2034 (%)
Figure 46 Genetic Disorders Segment Market Forecast by Region, 2024-2034 (US$ Million, AGR %)
Figure 47 Genetic Disorders Segment Market Share Forecast by Region, 2024 & 2034 (%)
Figure 48 Infectious Diseases Segment Market Forecast by Region, 2024-2034 (US$ Million, AGR %)
Figure 49 Infectious Diseases Segment Market Share Forecast by Region, 2024 & 2034 (%)
Figure 50 Others Segment Market Forecast by Region, 2024-2034 (US$ Million, AGR %)
Figure 51 Others Segment Market Share Forecast by Region, 2024 & 2034 (%)
Figure 52 Viral Vectors and Plasmid DNA Manufacturing Market by End-use: Market Attractiveness Index
Figure 53 Viral Vectors and Plasmid DNA Manufacturing Market Forecast by End-use, 2024-2034 (US$ Million, AGR %)
Figure 54 Viral Vectors and Plasmid DNA Manufacturing Market Share Forecast by End-use, 2024, 2029, 2034 (%)
Figure 55 Pharma and Biopharma Companies Segment Market Forecast by Region, 2024-2034 (US$ Million, AGR %)
Figure 56 Pharma and Biopharma Companies Segment Market Share Forecast by Region, 2024 & 2034 (%)
Figure 57 Research Institutes Segment Market Forecast by Region, 2024-2034 (US$ Million, AGR %)
Figure 58 Research Institutes Segment Market Share Forecast by Region, 2024 & 2034 (%)
Figure 59 Viral Vectors and Plasmid DNA Manufacturing Market by Workflow: Market Attractiveness Index
Figure 60 Viral Vectors and Plasmid DNA Manufacturing Market Forecast by Workflow, 2024-2034 (US$ Million, AGR %)
Figure 61 Viral Vectors and Plasmid DNA Manufacturing Market Share Forecast by Workflow, 2024, 2029, 2034 (%)
Figure 62 Upstream Segment Market Forecast by Region, 2024-2034 (US$ Million, AGR %)
Figure 63 Upstream Segment Market Share Forecast by Region, 2024 & 2034 (%)
Figure 64 Downstream Segment Market Forecast by Region, 2024-2034 (US$ Million, AGR %)
Figure 65 Downstream Segment Market Share Forecast by Region, 2024 & 2034 (%)
Figure 66 Viral Vectors and Plasmid DNA Manufacturing Market Forecast by Region 2024 and 2034 (Revenue, CAGR%)
Figure 67 Viral Vectors and Plasmid DNA Manufacturing Market Share Forecast by Region 2024, 2029, 2034 (%)
Figure 68 Viral Vectors and Plasmid DNA Manufacturing Market by Region, 2024-2034 (US$ Million, AGR %)
Figure 69 North America Viral Vectors and Plasmid DNA Manufacturing Market Attractiveness Index
Figure 70 North America Viral Vectors and Plasmid DNA Manufacturing Market by Region, 2024, 2029 & 2034 (US$ Million)
Figure 71 North America Viral Vectors and Plasmid DNA Manufacturing Market Forecast by Country, 2024-2034 (US$ Million, AGR %)
Figure 72 North America Viral Vectors and Plasmid DNA Manufacturing Market Share Forecast by Country, 2024 & 2034 (%)
Figure 73 North America Viral Vectors and Plasmid DNA Manufacturing Market Forecast by Vector Type, 2024-2034 (US$ Million, AGR %)
Figure 74 North America Viral Vectors and Plasmid DNA Manufacturing Market Share Forecast by Vector Type, 2024 & 2034 (%)
Figure 75 North America Viral Vectors and Plasmid DNA Manufacturing Market Forecast by Application, 2024-2034 (US$ Million, AGR %)
Figure 76 North America Viral Vectors and Plasmid DNA Manufacturing Market Share Forecast by Application, 2024 & 2034 (%)
Figure 77 North America Viral Vectors and Plasmid DNA Manufacturing Market Forecast by End-use, 2024-2034 (US$ Million, AGR %)
Figure 78 North America Viral Vectors and Plasmid DNA Manufacturing Market Share Forecast by End-use, 2024 & 2034 (%)
Figure 79 North America Viral Vectors and Plasmid DNA Manufacturing Market Forecast by Disease, 2024-2034 (US$ Million, AGR %)
Figure 80 North America Viral Vectors and Plasmid DNA Manufacturing Market Share Forecast by Disease, 2024 & 2034 (%)
Figure 81 North America Viral Vectors and Plasmid DNA Manufacturing Market Forecast by Workflow 2024-2034 (US$ Million, AGR %)
Figure 82 North America Viral Vectors and Plasmid DNA Manufacturing Market Share Forecast by Workflow, 2024 & 2034 (%)
Figure 83 U.S. Viral Vectors and Plasmid DNA Manufacturing Market Forecast, 2024-2034 (US$ Million, AGR %)
Figure 84 Canada Viral Vectors and Plasmid DNA Manufacturing Market Forecast, 2024-2034 (US$ Million, AGR %)
Figure 85 Europe Viral Vectors and Plasmid DNA Manufacturing Market Attractiveness Index
Figure 86 Europe Viral Vectors and Plasmid DNA Manufacturing Market by Region, 2024, 2029 & 2034 (US$ Million)
Figure 87 Europe Viral Vectors and Plasmid DNA Manufacturing Market Forecast by Country, 2024-2034 (US$ Million, AGR %)
Figure 88 Europe Viral Vectors and Plasmid DNA Manufacturing Market Share Forecast by Country, 2024 & 2034 (%)
Figure 89 Europe Viral Vectors and Plasmid DNA Manufacturing Market Forecast by Vector Type, 2024-2034 (US$ Million, AGR %)
Figure 90 Europe Viral Vectors and Plasmid DNA Manufacturing Market Share Forecast by Vector Type, 2024 & 2034 (%)
Figure 91 Europe Viral Vectors and Plasmid DNA Manufacturing Market Forecast by Application, 2024-2034 (US$ Million, AGR %)
Figure 92 Europe Viral Vectors and Plasmid DNA Manufacturing Market Share Forecast by Application, 2024 & 2034 (%)
Figure 93 Europe Viral Vectors and Plasmid DNA Manufacturing Market Forecast by End-use, 2024-2034 (US$ Million, AGR %)
Figure 94 Europe Viral Vectors and Plasmid DNA Manufacturing Market Share Forecast by End-use, 2024 & 2034 (%)
Figure 95 Europe Viral Vectors and Plasmid DNA Manufacturing Market Forecast by Disease, 2024-2034 (US$ Million, AGR %)
Figure 96 Europe Viral Vectors and Plasmid DNA Manufacturing Market Share Forecast by Disease, 2024 & 2034 (%)
Figure 97 North America Viral Vectors and Plasmid DNA Manufacturing Market Forecast by Workflow 2024-2034 (US$ Million, AGR %)
Figure 98 Europe Viral Vectors and Plasmid DNA Manufacturing Market Share Forecast by Workflow, 2024 & 2034 (%)
Figure 99 Germany Viral Vectors and Plasmid DNA Manufacturing Market Forecast, 2024-2034 (US$ Million, AGR %)
Figure 100 France Viral Vectors and Plasmid DNA Manufacturing Market Forecast, 2024-2034 (US$ Million, AGR %)
Figure 101 UK Viral Vectors and Plasmid DNA Manufacturing Market Forecast, 2024-2034 (US$ Million, AGR %)
Figure 102 Italy Viral Vectors and Plasmid DNA Manufacturing Market Forecast, 2024-2034 (US$ Million, AGR %)
Figure 103 Spain Viral Vectors and Plasmid DNA Manufacturing Market Forecast, 2024-2034 (US$ Million, AGR %)
Figure 104 Sweden Viral Vectors and Plasmid DNA Manufacturing Market Forecast, 2024-2034 (US$ Million, AGR %)
Figure 105 Switzerland Viral Vectors and Plasmid DNA Manufacturing Market Forecast, 2024-2034 (US$ Million, AGR %)
Figure 106 Rest of Europe Viral Vectors and Plasmid DNA Manufacturing Market Forecast, 2024-2034 (US$ Million, AGR %)
Figure 107 Asia Pacific Viral Vectors and Plasmid DNA Manufacturing Market Attractiveness Index
Figure 108 Asia Pacific Viral Vectors and Plasmid DNA Manufacturing Market by Region, 2024, 2029 & 2034 (US$ Million)
Figure 109 Asia Pacific Viral Vectors and Plasmid DNA Manufacturing Market Forecast by Country, 2024-2034 (US$ Million, AGR %)
Figure 110 Asia Pacific Viral Vectors and Plasmid DNA Manufacturing Market Share Forecast by Country, 2024 & 2034 (%)
Figure 111 Asia Pacific Viral Vectors and Plasmid DNA Manufacturing Market Forecast by Vector Type, 2024-2034 (US$ Million, AGR %)
Figure 112 Asia Pacific Viral Vectors and Plasmid DNA Manufacturing Market Share Forecast by Vector Type, 2024 & 2034 (%)
Figure 113 Asia Pacific Viral Vectors and Plasmid DNA Manufacturing Market Forecast by Application, 2024-2034 (US$ Million, AGR %)
Figure 114 Asia Pacific Viral Vectors and Plasmid DNA Manufacturing Market Share Forecast by Application, 2024 & 2034 (%)
Figure 115 Asia Pacific Viral Vectors and Plasmid DNA Manufacturing Market Forecast by End-use, 2024-2034 (US$ Million, AGR %)
Figure 116 Asia Pacific Viral Vectors and Plasmid DNA Manufacturing Market Share Forecast by End-use, 2024 & 2034 (%)
Figure 117 Europe Viral Vectors and Plasmid DNA Manufacturing Market Forecast by Disease, 2024-2034 (US$ Million, AGR %)
Figure 118 Europe Viral Vectors and Plasmid DNA Manufacturing Market Share Forecast by Disease, 2024 & 2034 (%)
Figure 119 Asia Pacific Viral Vectors and Plasmid DNA Manufacturing Market Forecast by Workflow 2024-2034 (US$ Million, AGR %)
Figure 120 North America Viral Vectors and Plasmid DNA Manufacturing Market Share Forecast by Workflow, 2024 & 2034 (%)
Figure 121 Japan Viral Vectors and Plasmid DNA Manufacturing Market Forecast, 2024-2034 (US$ Million, AGR %)
Figure 122 China Viral Vectors and Plasmid DNA Manufacturing Market Forecast, 2024-2034 (US$ Million, AGR %)
Figure 123 India Viral Vectors and Plasmid DNA Manufacturing Market Forecast, 2024-2034 (US$ Million, AGR %)
Figure 124 Australia Viral Vectors and Plasmid DNA Manufacturing Market Forecast, 2024-2034 (US$ Million, AGR %)
Figure 125 South Korea Viral Vectors and Plasmid DNA Manufacturing Market Forecast, 2024-2034 (US$ Million, AGR %)
Figure 126 Singapore Viral Vectors and Plasmid DNA Manufacturing Market Forecast, 2024-2034 (US$ Million, AGR %)
Figure 127 Taiwan Viral Vectors and Plasmid DNA Manufacturing Market Forecast, 2024-2034 (US$ Million, AGR %)
Figure 128 Rest of Asia Pacific Viral Vectors and Plasmid DNA Manufacturing Market Forecast, 2024-2034 (US$ Million, AGR %)
Figure 129 Latin America Viral Vectors and Plasmid DNA Manufacturing Market Attractiveness Index
Figure 130 Latin America Viral Vectors and Plasmid DNA Manufacturing Market by Region, 2024, 2029 & 2034 (US$ Million)
Figure 131 Latin America Viral Vectors and Plasmid DNA Manufacturing Market Forecast by Country, 2024-2034 (US$ Million, AGR %)
Figure 132 Latin America Viral Vectors and Plasmid DNA Manufacturing Market Share Forecast by Country, 2024 & 2034 (%)
Figure 133 Latin America Viral Vectors and Plasmid DNA Manufacturing Market Forecast by Vector Type, 2024-2034 (US$ Million, AGR %)
Figure 134 Latin America Viral Vectors and Plasmid DNA Manufacturing Market Share Forecast by Vector Type, 2024 & 2034 (%)
Figure 135 Latin America Viral Vectors and Plasmid DNA Manufacturing Market Forecast by Application, 2024-2034 (US$ Million, AGR %)
Figure 136 Latin America Viral Vectors and Plasmid DNA Manufacturing Market Share Forecast by Application, 2024 & 2034 (%)
Figure 137 Latin America Viral Vectors and Plasmid DNA Manufacturing Market Forecast by End-use, 2024-2034 (US$ Million, AGR %)
Figure 138 Latin America Viral Vectors and Plasmid DNA Manufacturing Market Share Forecast by End-use, 2024 & 2034 (%)
Figure 139 Latin America Viral Vectors and Plasmid DNA Manufacturing Market Forecast by Workflow 2024-2034 (US$ Million, AGR %)
Figure 140 Latin America Viral Vectors and Plasmid DNA Manufacturing Market Share Forecast by Workflow, 2024 & 2034 (%)
Figure 141 Brazil Viral Vectors and Plasmid DNA Manufacturing Market Forecast, 2024-2034 (US$ Million, AGR %)
Figure 142 Mexico Viral Vectors and Plasmid DNA Manufacturing Market Forecast, 2024-2034 (US$ Million, AGR %)
Figure 143 Argentina Viral Vectors and Plasmid DNA Manufacturing Market Forecast, 2024-2034 (US$ Million, AGR %)
Figure 144 Rest of Latin America Viral Vectors and Plasmid DNA Manufacturing Market Forecast, 2024-2034 (US$ Million, AGR %)
Figure 145 MEA Viral Vectors and Plasmid DNA Manufacturing Market Attractiveness Index
Figure 146 MEA Viral Vectors and Plasmid DNA Manufacturing Market by Region, 2024, 2029 & 2034 (US$ Million)
Figure 147 MEA Viral Vectors and Plasmid DNA Manufacturing Market Forecast by Country, 2024-2034 (US$ Million, AGR %)
Figure 148 MEA Viral Vectors and Plasmid DNA Manufacturing Market Share Forecast by Country, 2024 & 2034 (%)
Figure 149 MEA Viral Vectors and Plasmid DNA Manufacturing Market Forecast by Vector Type, 2024-2034 (US$ Million, AGR %)
Figure 150 MEA Viral Vectors and Plasmid DNA Manufacturing Market Share Forecast by Vector Type, 2024 & 2034 (%)
Figure 151 MEA Viral Vectors and Plasmid DNA Manufacturing Market Forecast by Application, 2024-2034 (US$ Million, AGR %)
Figure 152 MEA Viral Vectors and Plasmid DNA Manufacturing Market Share Forecast by Application, 2024 & 2034 (%)
Figure 153 MEA Viral Vectors and Plasmid DNA Manufacturing Market Forecast by End-use, 2024-2034 (US$ Million, AGR %)
Figure 154 MEA Viral Vectors and Plasmid DNA Manufacturing Market Share Forecast by Application, 2024 & 2034 (%)
Figure 155 MEA Viral Vectors and Plasmid DNA Manufacturing Market Forecast by Disease 2024-2034 (US$ Million, AGR %)
Figure 156 MEA Viral Vectors and Plasmid DNA Manufacturing Market Share Forecast by Disease, 2024 & 2034 (%)
Figure 157 MEA Viral Vectors and Plasmid DNA Manufacturing Market Forecast by Workflow 2024-2034 (US$ Million, AGR %)
Figure 158 MEA Viral Vectors and Plasmid DNA Manufacturing Market Share Forecast by Workflow, 2024 & 2034 (%)
Figure 159 GCC Viral Vectors and Plasmid DNA Manufacturing Market Forecast, 2024-2034 (US$ Million, AGR %)
Figure 160 South Africa Viral Vectors and Plasmid DNA Manufacturing Market Forecast, 2024-2034 (US$ Million, AGR %)
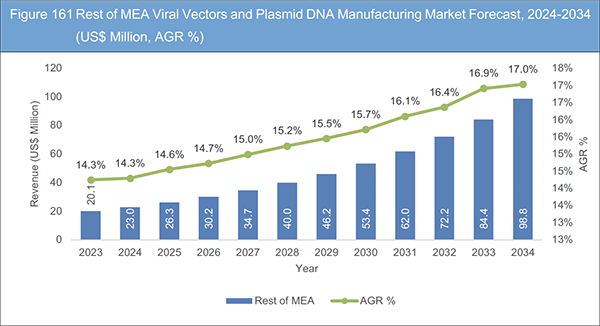
Figure 161 Rest of MEA Viral Vectors and Plasmid DNA Manufacturing Market Forecast, 2024-2034 (US$ Million, AGR %)
Figure 162 Amicus Therapeutics: Net Revenue, 2017-2022 (US$ Million, AGR%)
Figure 163 Amicus Therapeutics: R&D, 2017-2022 (US$ Million, AGR%)
Figure 164 Amicus Therapeutics: Regional Market Shares, 2022
Figure 165 Lonza Group Ltd: Net Revenue, 2017-2022 (US$ Million, AGR%)
Figure 166 Lonza Group Ltd: R&D, 2017-2022 (US$ Million, AGR%)
Figure 167 Lonza Group: Regional Market Shares, 2022
Figure 168 Merck KGaA: Net Revenue, 2017-2022 (US$ Million, AGR%)
Figure 169 Merck KGaA: R&D, 2017-2022 (US$ Million, AGR%)
Figure 170 Merck KGaA: Regional Market Shares, 2022
Figure 171 uniQure N.V.: Net Revenue, 2017-2022 (US$ Million, AGR%)
Figure 172 uniQure N.V.: R&D, 2017-2022 (US$ Million, AGR%)
Figure 173 uniQure N.V.: Regional Market Shares, 2022
Figure 174 Catalent Inc: Net Revenue, 2017-2022 (US$ Million, AGR%)
Figure 175 Catalent Inc: R&D, 2017-2022 (US$ Million, AGR%)
Figure 176 Catalent Inc: Regional Market Shares, 2022
Figure 177 Thermo Fisher Scientific Inc.: Net Revenue, 2017-2022 (US$ Million, AGR%)
Figure 178 Thermo Fisher Scientific Inc.: R&D, 2017-2022 (US$ Million, AGR%)
Figure 179 Thermo Fisher Scientific Inc.: Regional Market Shares, 2022
Figure 180 Charles River Laboratories: Net Revenue, 2017-2022 (US$ Million, AGR%)
Figure 181 Charles River Laboratories International Inc: Regional Market Shares, 2022
Figure 182 bluebird bio Inc: Net Revenue, 2017-2022 (US$ Million, AGR%)
Figure 183 bluebird bio Inc: R&D, 2017-2022 (US$ Million, AGR%)
ページTOPに戻る
Summary
Report Details
The Viral Vectors and Plasmid DNA Manufacturing Market Report 2024-2034: This report will prove invaluable to leading firms striving for new revenue pockets if they wish to better understand the industry and its underlying dynamics. It will be useful for companies that would like to expand into different industries or to expand their existing operations in a new region.
Viral vectors and plasmids are instrumental in the field of biotechnology, especially in the context of advancements like CRISPR-Cas9 gene editing. They serve as indispensable vehicles for delivering genetic material with precision, enabling scientists to manipulate and modify genes for various purposes, from basic research to therapeutic interventions. Viral vectors, such as adeno-associated viruses (AAVs) and lentiviruses, have become central players in gene therapy, allowing for the targeted insertion of genetic material into host cells. Plasmids, on the other hand, are versatile circular pieces of DNA commonly used in molecular biology research to introduce foreign genes into cells or organisms. Their importance extends beyond gene editing to encompass a wide array of biotechnological applications, including vaccine development and protein production.
Recent developments in the biotechnology landscape further underscore the critical role of viral vectors and plasmids. In January 2023, Catalent, a prominent player in the biopharmaceutical industry, inaugurated a state-of-the-art plasmid DNA (pDNA) manufacturing facility in Gosselies, Belgium. This facility not only signifies the growing demand for plasmids but also the need for their efficient production at a commercial scale. Catalent’s commitment to producing off-the-shelf plasmids to support cell and gene companies reflects the broader trend in the industry, where these genetic tools are in high demand. The integration of pDNA expertise in Gosselies with the clinical and commercial production of viral vectors for gene therapy, cell therapy, and mRNA across their network is a strategic move that ensures the continuity of the supply chain. It’s a testament to the interdependence of these elements in the biotechnology ecosystem and their collective role in driving therapeutic innovations.
What Questions Should You Ask before Buying a Market Research Report?
• How is the viral vectors and plasmid DNA manufacturing market evolving?
• What is driving and restraining the viral vectors and plasmid DNA manufacturing market?
• How will each viral vectors and plasmid DNA manufacturing submarket segment grow over the forecast period and how much revenue will these submarkets account for in 2034?
• How will the market shares for each viral vectors and plasmid DNA manufacturing submarket develop from 2024 to 2034?
• What will be the main driver for the overall market from 2024 to 2034?
• Will leading viral vectors and plasmid DNA manufacturing markets broadly follow the macroeconomic dynamics, or will individual national markets outperform others?
• How will the market shares of the national markets change by 2034 and which geographical region will lead the market in 2034?
• Who are the leading players and what are their prospects over the forecast period?
• What are the viral vectors and plasmid DNA manufacturing projects for these leading companies?
• How will the industry evolve during the period between 2024 and 2034? What are the implications of viral vectors and plasmid DNA manufacturing projects taking place now and over the next 10 years?
• Is there a greater need for product commercialisation to further scale the viral vectors and plasmid DNA manufacturing market?
• Where is the viral vectors and plasmid DNA manufacturing market heading and how can you ensure you are at the forefront of the market?
• What are the best investment options for new product and service lines?
• What are the key prospects for moving companies into a new growth path and C-suite?
You need to discover how this will impact the viral vectors and plasmid DNA manufacturing market today, and over the next 10 years:
• Our 408-page report provides 166 tables, 183 charts /graphs exclusively to you.
• The report highlights key lucrative areas in the industry so you can target them – NOW.
• It contains in-depth analysis of global, regional and national sales and growth.
• It highlights for you the key successful trends, changes and revenue projections made by your competitors.
This report tells you TODAY how the Viral Vectors and Plasmid DNA Manufacturing Market will develop in the next 10 years, and in line with the variations in COVID-19 economic recession and bounce. This market is more critical now than at any point over the last 10 years.
Forecasts to 2034 and other analyses reveal commercial prospects
• In addition to revenue forecasting to 2034, our new study provides you with recent results, growth rates, and market shares.
• You will find original analyses, with business outlooks and developments.
• Discover qualitative analyses (including market dynamics, drivers, opportunities, restraints and challenges), cost structure, impact of rising viral vectors and plasmid DNA manufacturing prices and recent developments.
This report includes data analysis and invaluable insight into how COVID-19 will affect the industry and your company. Four COVID-19 recovery patterns and their impact, namely, “V”, “L”, “W” and “U” are discussed in this report.
Segments Covered in the Report
Vector Type
• Adenovirus
• Retrovirus
• Plasmid DNA
• AAV
• Lentivirus
• Other Vectors
Application
• Antisense and RNAi
• Gene Therapy
• Cell Therapy
• Vaccinology
End-use
• Pharma and Biopharma Companies
• Research Institutes
Disease
• Oncology
• Genetic Disorders
• Infectious Diseases
• Others Diseases
Workflow
• Upstream
• Downstream
In addition to the revenue predictions for the overall world market and segments, you will also find revenue forecasts for five regional and 24 leading national markets:
North America
• U.S.
• Canada
Europe
• Germany
• UK
• France
• Spain
• Italy
• Sweden
• Switzerland
• Rest of Europe
Asia Pacific
• China
• Japan
• India
• Australia
• South Korea
• Singapore
• Taiwan
• Rest of Asia Pacific
Latin America
• Brazil
• Mexico
• Argentina
• Rest of Latin America
MEA
• GCC
• South Africa
• Rest of MEA
The report also includes profiles and for some of the leading companies in the Viral Vectors and Plasmid DNA Manufacturing Market, 2024 to 2034, with a focus on this segment of these companies’ operations.
Leading companies profiled in the report
• Addgene
• Advanced BioScience Laboratories, Inc. (ABL)
• Aldevron
• Altogen Biosystems
• Amicus Therapeutics
• ATUM
• Batavia Biosciences B.V.
• BioNTech IMFS
• Biovian Oy
• bluebird bio Inc.
• Catalent Inc.
• CEVEC Pharmaceuticals GmbH
• Charles River Laboratories
• Creative Biogene
• FUJIFILM Diosynth Biotechnologies
• GENEZEN
• Lonza
• Merck KGaA
• Recipharm AB
• Thermo Fisher Scientific Inc.
• uniQure N.V.
• VGXI Inc.
• Virovek
• VIVEbiotech
• Waisman Biomanufacturing
• WuXi AppTec
• Yposkesi, Inc.
Overall world revenue for viral vectors and plasmid DNA manufacturing market, 2024 to 2034 in terms of value the market will surpass US$1,350 million in 2024, our work calculates. We predict strong revenue growth through to 2034. Our work identifies which organizations hold the greatest potential. Discover their capabilities, progress, and commercial prospects, helping you stay ahead.
How will the Viral Vectors and Plasmid DNA Manufacturing Market, 2024 to 2034 report help you?
In summary, our 400+ page report provides you with the following knowledge:
• Revenue forecasts to 2034 for Viral Vectors and Plasmid DNA Manufacturing Market, 2024 to 2034, with forecasts for vector types, application, and end-use, disease and workflow each forecast at a global and regional level – discover the industry’s prospects, finding the most lucrative places for investments and revenues.
• Revenue forecasts to 2034 for five regional and 24 key national markets – See forecasts for the Viral Vectors and Plasmid DNA Manufacturing Market 2024 to 2034 market in North America, Europe, Asia-Pacific, Latin America, and MEA. Also forecasted is the market in the US, Canada, Germany, UK, France, Spain, Italy, Sweden, Switzerland, China, India, Japan, Australia, South Korea, Singapore, Taiwan, Brazil, Mexico, Argentina, GCC, South Africa, and among other prominent economies.
• Prospects for established firms and those seeking to enter the market – including company profiles for 27 of the major companies involved in the Viral Vectors and Plasmid DNA Manufacturing Market 2024 to 2034.
Find quantitative and qualitative analyses with independent predictions. Receive information that only our report contains, staying informed with invaluable business intelligence.
Information found nowhere else
With our new report, you are less likely to fall behind in knowledge or miss out on opportunities. See how our work could benefit your research, analyses, and decisions. Visiongain’s study is for everybody needing commercial analyses for the Viral Vectors and Plasmid DNA Manufacturing Market 2024 to 2034, market-leading companies. You will find data, trends and predictions.
ページTOPに戻る
Table of Contents
Table of Contents
1 Report Overview
1.1 Objectives of the Study
1.2 Introduction to Viral Vectors and Plasmid DNA Manufacturing Market
1.3 What This Report Delivers
1.4 Why You Should Read This Report
1.5 Key Questions Answered by This Analytical Report
1.6 Who is This Report for?
1.7 Methodology
1.7.1 Market Definitions
1.7.2 Market Evaluation & Forecasting Methodology
1.7.3 Data Validation
1.7.3.1 Primary Research
1.7.3.2 Secondary Research
1.8 Frequently Asked Questions (FAQs)
1.9 Associated Visiongain Reports
1.10 About Visiongain
2 Executive Summary
3 Market Overview
3.1 Key Findings
3.2 Market Dynamics
3.2.1 Market Driving Factors
3.2.1.1 Shaping the Future of Rare Disease Treatment with Viral Vector Solutions
3.2.1.2 Viral Vectors and Plasmids Play a Pivotal Role in Enabling Precision and Breakthroughs in Biotechnology
3.2.1.3 Investing in Progress Involves Capitalizing on the Viral Vector Revolution
3.2.2 Market Restraining Factors
3.2.2.1 Low Yields and Individual Optimization Hold Back Downstream Processes
3.2.2.2 Viral Vector Demand Outpaces Capacity Growth Despite Increased Investments
3.2.3 Market Opportunities
3.2.3.1 Seizing the Viral Vector Opportunity for Enhanced Healthcare Access and Cost-efficient Therapies
3.2.3.2 Advances in Genome Sequencing to Fuel Market Growth
3.2.3.3 Rising Demand for Synthetic DNA Templates in RNA Medicine
3.3 COVID-19 Impact Analysis
3.4 Porter’s Five Forces Analysis
3.4.1 Bargaining Power of Suppliers
3.4.2 Bargaining Power of Buyers
3.4.3 Competitive Rivalry
3.4.4 Threat from Substitutes
3.4.5 Threat of New Entrants
3.5 PEST Analysis
4 Viral Vector Production Capacity Mapping Analysis
4.1 CMOs Capacity for Viral Vector Manufacturing
4.2 Cleanroom Suites Facilities: Leading Viral Vector Manufacturers
4.3 Surge of Investments Reshaping Contract Manufacturing Infrastructure.
4.4 Investments and Expansions in CMO/CDMO Facilities in the Cell and Gene Therapy Sector
5 Viral Vector Production & Yield Analysis
5.1 Introduction
5.2 ATMP Vectors and Manufacturing Platforms
5.3 Regulatory Challenges for Viral Vectors for Cell and Gene Therapy
6 Viral Vector Manufacturing: Process Economic Considerations and Challenges
6.1 Technological Advances in Manufacturing
6.2 Stable Producer Cell Lines
6.3 Mitigating the Challenges of Cytotoxicity through Stable Producer Lines
6.4 Key Factors in Process Development for the Utilization of Stable Producer Lines
6.5 Enhancing Efficiency and Lowering Costs: The Contribution of Stable Producer Cell Lines in CGT Production
6.5.1 Simplified Upstream Production
6.5.2 Lower Costs for Reagents and Labour
6.5.3 More Flexibility for Scale Up
6.6 When is the Time to Switch from Transient Transfection to Stable Producer Cell Lines for LVV Manufacturing?
6.7 Cost Considerations
6.8 Regulatory Expectations
7 Challenges and Advances in Recombinant Adeno-Associated Viruses (rAAVs) Gene Therapy Biomanufacturing
7.1 Introduction
8 Viral Vectors Production Process Analysis
8.1 Introduction
8.2 Upstream Unit Operations (Cell Thaw and Expansion Through Transfection)
8.3 Downstream Unit Operations (Harvest Through Purification)
8.4 Formulation/Stability and Fill/Finish
8.5 Viral Analytics
8.6 Viral Vector Production: Facilities Needs
8.7 Regulatory Standard Needs
8.8 Workforce Development and Needs
9 Viral Vectors and Plasmid DNA Manufacturing Market Analysis by Vector Type
9.1 Key Findings
9.2 Vector Type Segment: Market Attractiveness Index
9.3 Viral Vectors and Plasmid DNA Manufacturing Market Size Estimation and Forecast by Vector Type
9.4 Adenovirus
9.4.1 Market Size by Region, 2024-2034 (US$ Million)
9.4.2 Market Share by Region, 2024 & 2034 (%)
9.5 Retrovirus
9.5.1 Market Size by Region, 2024-2034 (US$ Million)
9.5.2 Market Share by Region, 2024 & 2034 (%)
9.6 Plasmid DNA
9.6.1 Market Size by Region, 2024-2034 (US$ Million)
9.6.2 Market Share by Region, 2024 & 2034 (%)
9.7 AAV
9.7.1 Market Size by Region, 2024-2034 (US$ Million)
9.7.2 Market Share by Region, 2024 & 2034 (%)
9.8 Lentivirus
9.8.1 Market Size by Region, 2024-2034 (US$ Million)
9.8.2 Market Share by Region, 2024 & 2034 (%)
9.9 Other Vectors
9.9.1 Market Size by Region, 2024-2034 (US$ Million)
9.9.2 Market Share by Region, 2024 & 2034 (%)
10 Viral Vectors and Plasmid DNA Manufacturing Market Analysis by Application
10.1 Key Findings
10.2 Application Segment: Market Attractiveness Index
10.3 Viral Vectors and Plasmid DNA Manufacturing Market Size Estimation and Forecast by Application
10.4 Antisense and RNAi
10.4.1 Market Size by Region, 2024-2034 (US$ Million)
10.4.2 Market Share by Region, 2024 & 2034 (%)
10.5 Gene Therapy
10.5.1 Market Size by Region, 2024-2034 (US$ Million)
10.5.2 Market Share by Region, 2024 & 2034 (%)
10.6 Cell Therapy
10.6.1 Market Size by Region, 2024-2034 (US$ Million)
10.6.2 Market Share by Region, 2024 & 2034 (%)
10.7 Vaccinology
10.7.1 Market Size by Region, 2024-2034 (US$ Million)
10.7.2 Market Share by Region, 2024 & 2034 (%)
11 Viral Vectors and Plasmid DNA Manufacturing Market Analysis by Disease
11.1 Key Findings
11.2 Disease Segment: Market Attractiveness Index
11.3 Viral Vectors and Plasmid DNA Manufacturing Market Size Estimation and Forecast by Disease
11.4 Oncology
11.4.1 Market Size by Region, 2024-2034 (US$ Million)
11.4.2 Market Share by Region, 2024 & 2034 (%)
11.5 Genetic Disorders
11.5.1 Market Size by Region, 2024-2034 (US$ Million)
11.5.2 Market Share by Region, 2024 & 2034 (%)
11.6 Infectious Diseases
11.6.1 Market Size by Region, 2024-2034 (US$ Million)
11.6.2 Market Share by Region, 2024 & 2034 (%)
11.7 Other Diseases
11.7.1 Market Size by Region, 2024-2034 (US$ Million)
11.7.2 Market Share by Region, 2024 & 2034 (%)
12 Viral Vectors and Plasmid DNA Manufacturing Market Analysis by End-use
12.1 Key Findings
12.2 End-use Segment: Market Attractiveness Index
12.3 Viral Vectors and Plasmid DNA Manufacturing Market Size Estimation and Forecast by End-use
12.4 Pharma and Biopharma Companies
12.4.1 Market Size by Region, 2024-2034 (US$ Million)
12.4.2 Market Share by Region, 2024 & 2034 (%)
12.5 Research Institutes
12.5.1 Market Size by Region, 2024-2034 (US$ Million)
12.5.2 Market Share by Region, 2024 & 2034 (%)
13 Viral Vectors and Plasmid DNA Manufacturing Market Analysis by Workflow
13.1 Key Findings
13.2 Workflow Segment: Market Attractiveness Index
13.3 Viral Vectors and Plasmid DNA Manufacturing Market Size Estimation and Forecast by Workflow
13.4 Upstream
13.4.1 Market Size by Region, 2024-2034 (US$ Million)
13.4.2 Market Share by Region, 2024 & 2034 (%)
13.5 Downstream
13.5.1 Market Size by Region, 2024-2034 (US$ Million)
13.5.2 Market Share by Region, 2024 & 2034 (%)
14 Viral Vectors and Plasmid DNA Manufacturing Market Analysis by Region
14.1 Key Findings
14.2 Regional Market Size Estimation and Forecast
15 North America Viral Vectors and Plasmid DNA Manufacturing Market Analysis
15.1 Key Findings
15.2 North America Viral Vectors and Plasmid DNA Manufacturing Market Attractiveness Index
15.3 North America Viral Vectors and Plasmid DNA Manufacturing Market by Country, 2024, 2029 & 2034 (US$ Million)
15.4 North America Viral Vectors and Plasmid DNA Manufacturing Market Size Estimation and Forecast by Country
15.5 North America Viral Vectors and Plasmid DNA Manufacturing Market Size Estimation and Forecast by Vector Type
15.6 North America Viral Vectors and Plasmid DNA Manufacturing Market Size Estimation and Forecast by Application
15.7 North America Viral Vectors and Plasmid DNA Manufacturing Market Size Estimation and Forecast by End-use
15.8 North America Viral Vectors and Plasmid DNA Manufacturing Market Size Estimation and Forecast by Disease
15.9 North America Viral Vectors and Plasmid DNA Manufacturing Market Size Estimation and Forecast by Workflow
15.10 U.S. Viral Vectors and Plasmid DNA Manufacturing Market Analysis
15.11 Canada Viral Vectors and Plasmid DNA Manufacturing Market Analysis
16 Europe Viral Vectors and Plasmid DNA Manufacturing Market Analysis
16.1 Key Findings
16.2 Europe Viral Vectors and Plasmid DNA Manufacturing Market Attractiveness Index
16.3 Europe Viral Vectors and Plasmid DNA Manufacturing Market by Country, 2024, 2029 & 2034 (US$ Million)
16.4 Europe Viral Vectors and Plasmid DNA Manufacturing Market Size Estimation and Forecast by Country
16.5 Europe Viral Vectors and Plasmid DNA Manufacturing Market Size Estimation and Forecast by Vector Type
16.6 Europe Viral Vectors and Plasmid DNA Manufacturing Market Size Estimation and Forecast by Application
16.7 Europe Viral Vectors and Plasmid DNA Manufacturing Market Size Estimation and Forecast by End-use
16.8 Europe Viral Vectors and Plasmid DNA Manufacturing Market Size Estimation and Forecast by Disease
16.9 Europe Viral Vectors and Plasmid DNA Manufacturing Market Size Estimation and Forecast by Workflow
16.10 Germany Viral Vectors and Plasmid DNA Manufacturing Market Analysis
16.11 France Viral Vectors and Plasmid DNA Manufacturing Market Analysis
16.12 UK Viral Vectors and Plasmid DNA Manufacturing Market Analysis
16.13 Italy Viral Vectors and Plasmid DNA Manufacturing Market Analysis
16.14 Spain Viral Vectors and Plasmid DNA Manufacturing Market Analysis
16.15 Sweden Viral Vectors and Plasmid DNA Manufacturing Market Analysis
16.16 Switzerland Viral Vectors and Plasmid DNA Manufacturing Market Analysis
16.17 Rest of Europe Viral Vectors and Plasmid DNA Manufacturing Market Analysis
17 Asia Pacific Viral Vectors and Plasmid DNA Manufacturing Market Analysis
17.1 Key Findings
17.2 Asia Pacific Viral Vectors and Plasmid DNA Manufacturing Market Attractiveness Index
17.3 Asia Pacific Viral Vectors and Plasmid DNA Manufacturing Market by Country, 2024, 2029 & 2034 (US$ Million)
17.4 Asia Pacific Viral Vectors and Plasmid DNA Manufacturing Market Size Estimation and Forecast by Country
17.5 Asia Pacific Viral Vectors and Plasmid DNA Manufacturing Market Size Estimation and Forecast by Vector Type
17.6 Asia Pacific Viral Vectors and Plasmid DNA Manufacturing Market Size Estimation and Forecast by Application
17.7 Asia Pacific Viral Vectors and Plasmid DNA Manufacturing Market Size Estimation and Forecast by End-use
17.8 Asia Pacific Viral Vectors and Plasmid DNA Manufacturing Market Size Estimation and Forecast by Disease
17.9 Asia Pacific Viral Vectors and Plasmid DNA Manufacturing Market Size Estimation and Forecast by Workflow
17.10 Japan Viral Vectors and Plasmid DNA Manufacturing Market Analysis
17.11 China Viral Vectors and Plasmid DNA Manufacturing Market Analysis
17.12 India Viral Vectors and Plasmid DNA Manufacturing Market Analysis
17.13 Australia Viral Vectors and Plasmid DNA Manufacturing Market Analysis
17.14 South Korea Viral Vectors and Plasmid DNA Manufacturing Market Analysis
17.15 Singapore Viral Vectors and Plasmid DNA Manufacturing Market Analysis
17.16 Taiwan Viral Vectors and Plasmid DNA Manufacturing Market Analysis
17.17 Rest of Asia Pacific Viral Vectors and Plasmid DNA Manufacturing Market Analysis
18 Latin America Viral Vectors and Plasmid DNA Manufacturing Market Analysis
18.1 Key Findings
18.2 Latin America Viral Vectors and Plasmid DNA Manufacturing Market Attractiveness Index
18.3 Latin America Viral Vectors and Plasmid DNA Manufacturing Market by Country, 2024, 2029 & 2034 (US$ Million)
18.4 Latin America Viral Vectors and Plasmid DNA Manufacturing Market Size Estimation and Forecast by Country
18.5 Latin America Viral Vectors and Plasmid DNA Manufacturing Market Size Estimation and Forecast by Vector Type
18.6 Latin America Viral Vectors and Plasmid DNA Manufacturing Market Size Estimation and Forecast by Application
18.7 Latin America Viral Vectors and Plasmid DNA Manufacturing Market Size Estimation and Forecast by End-use
18.8 Latin America Viral Vectors and Plasmid DNA Manufacturing Market Size Estimation and Forecast by Workflow
18.9 Brazil Viral Vectors and Plasmid DNA Manufacturing Market Analysis
18.10 Mexico Viral Vectors and Plasmid DNA Manufacturing Market Analysis
18.11 Argentina Viral Vectors and Plasmid DNA Manufacturing Market Analysis
18.12 Rest of Latin America Viral Vectors and Plasmid DNA Manufacturing Market Analysis
19 MEA Viral Vectors and Plasmid DNA Manufacturing Market Analysis
19.1 Key Findings
19.2 MEA Viral Vectors and Plasmid DNA Manufacturing Market Attractiveness Index
19.3 MEA Viral Vectors and Plasmid DNA Manufacturing Market by Country, 2024, 2029 & 2034 (US$ Million)
19.4 MEA Viral Vectors and Plasmid DNA Manufacturing Market Size Estimation and Forecast by Country
19.5 MEA Viral Vectors and Plasmid DNA Manufacturing Market Size Estimation and Forecast by Vector Type
19.6 MEA Viral Vectors and Plasmid DNA Manufacturing Market Size Estimation and Forecast by Application
19.7 MEA Viral Vectors and Plasmid DNA Manufacturing Market Size Estimation and Forecast by End-use
19.8 MEA Viral Vectors and Plasmid DNA Manufacturing Market Size Estimation and Forecast by Disease
19.9 MEA Viral Vectors and Plasmid DNA Manufacturing Market Size Estimation and Forecast by Workflow
19.10 GCC Viral Vectors and Plasmid DNA Manufacturing Market Analysis
19.11 South Africa Viral Vectors and Plasmid DNA Manufacturing Market Analysis
19.12 Rest of MEA Viral Vectors and Plasmid DNA Manufacturing Market Analysis
20 Company Profiles
20.1 Competitive Landscape, 2022
20.2 Strategic Outlook
20.1 Amicus Therapeutics
20.1.1 Company Snapshot
20.1.2 Company Overview
20.1.3 Financial Analysis
20.1.3.1 Net Revenue, 2017-2022
20.1.3.2 R&D, 2017-2022
20.1.3.3 Regional Market Shares, 2022
20.1.4 Product Benchmarking
20.1.5 Strategic Outlook
20.2 Lonza Group Ltd
20.2.1 Company Snapshot
20.2.2 Company Overview
20.2.3 Financial Analysis
20.2.3.1 Net Revenue, 2017-2022
20.2.3.2 R&D, 2017-2022
20.2.3.3 Regional Market Shares, 2022
20.2.4 Product Benchmarking
20.2.5 Strategic Outlook
20.3 Merck KGaA
20.3.1 Company Snapshot
20.3.2 Company Overview
20.3.3 Financial Analysis
20.3.3.1 Net Revenue, 2017-2022
20.3.3.2 R&D, 2017-2022
20.3.3.3 Regional Market Shares, 2022
20.3.4 Product Benchmarking
20.3.5 Strategic Outlook
20.4 uniQure N.V.
20.4.1 Company Snapshot
20.4.2 Company Overview
20.4.3 Financial Analysis
20.4.3.1 Net Revenue, 2017-2022
20.4.3.2 R&D, 2017-2022
20.4.3.3 Regional Market Shares, 2022
20.4.4 Product Benchmarking
20.4.5 Strategic Outlook
20.5 Catalent Inc
20.5.1 Company Snapshot
20.5.2 Company Overview
20.5.3 Financial Analysis
20.5.3.1 Net Revenue, 2017-2022
20.5.3.2 R&D, 2017-2022
20.5.3.3 Regional Market Shares, 2022
20.5.4 Product Benchmarking
20.5.5 Strategic Outlook
20.6 Thermo Fisher Scientific Inc.
20.6.1 Company Snapshot
20.6.2 Company Overview
20.6.3 Financial Analysis
20.6.3.1 Net Revenue, 2017-2022
20.6.3.2 R&D, 2017-2022
20.6.3.3 Regional Market Shares, 2022
20.6.4 Product Benchmarking
20.6.5 Strategic Outlook
20.7 Charles River Laboratories
20.7.1 Company Snapshot
20.7.2 Company Overview
20.7.3 Financial Analysis
20.7.3.1 Net Revenue, 2017-2022
20.7.3.2 Regional Market Shares, 2022
20.7.4 Product Benchmarking
20.7.5 Strategic Outlook
20.8 FUJIFILM Diosynth Biotechnologies
20.8.1 Company Snapshot
20.8.2 Company Overview
20.8.3 Product Benchmarking
20.8.4 Strategic Outlook
20.9 bluebird bio Inc
20.9.1 Company Snapshot
20.9.2 Company Overview
20.9.3 Financial Analysis
20.9.3.1 Net Revenue, 2017-2022
20.9.3.2 R&D, 2017-2022
20.9.4 Product Benchmarking
20.9.5 Strategic Outlook
20.10 Aldevron
20.10.1 Company Snapshot
20.10.2 Company Overview
20.10.3 Product Benchmarking
20.10.4 Strategic Outlook
20.11 Addgene
20.11.1 Company Snapshot
20.11.2 Company Overview
20.11.3 Product Benchmarking
20.12 Creative Biogene
20.12.1 Company Snapshot
20.12.2 Company Overview
20.12.3 Product Benchmarking
20.13 VIVEbiotech
20.13.1 Company Snapshot
20.13.2 Company Overview
20.13.3 Product Benchmarking
20.13.4 Strategic Outlook
20.14 Recipharm AB
20.14.1 Company Snapshot
20.14.2 Company Overview
20.14.3 Product Benchmarking
20.14.4 Strategic Outlook
20.15 Waisman Biomanufacturing
20.15.1 Company Snapshot
20.15.2 Company Overview
20.15.3 Product Benchmarking
20.15.4 Strategic Outlook
20.16 VGXI, Inc.
20.16.1 Company Snapshot
20.16.2 Company Overview
20.16.3 Product Benchmarking
20.16.4 Strategic Outlook
20.17 Batavia Biosciences B.V.
20.17.1 Company Snapshot
20.17.2 Company Overview
20.17.3 Product Benchmarking
20.17.4 Strategic Outlook
20.18 WuXi AppTec
20.18.1 Company Snapshot
20.18.2 Company Overview
20.18.3 Product Benchmarking
20.18.4 Strategic Outlook
20.19 ATUM
20.19.1 Company Snapshot
20.19.2 Company Overview
20.19.3 Product Benchmarking
20.19.4 Strategic Outlook
20.20 Altogen Biosystems
20.20.1 Company Snapshot
20.20.2 Company Overview
20.20.3 Product Benchmarking
20.21 GENEZEN
20.21.1 Company Snapshot
20.21.2 Company Overview
20.21.3 Product Benchmarking
20.21.4 Strategic Outlook
20.22 Yposkesi, Inc.
20.22.1 Company Snapshot
20.22.2 Company Overview
20.22.3 Product Benchmarking
20.22.4 Strategic Outlook
20.23 CEVEC Pharmaceuticals GmbH
20.23.1 Company Snapshot
20.23.2 Company Overview
20.23.3 Product Benchmarking
20.23.4 Strategic Outlook
20.24 Virovek
20.24.1 Company Snapshot
20.24.2 Company Overview
20.24.3 Product Benchmarking
20.24.4 Strategic Outlook
20.25 Advanced BioScience Laboratories, Inc (ABL)
20.25.1 Company Snapshot
20.25.2 Company Overview
20.25.3 Product Benchmarking
20.25.4 Strategic Outlook
20.26 Biovian Oy
20.26.1 Company Snapshot
20.26.2 Company Overview
20.26.3 Product Benchmarking
20.26.4 Strategic Outlook
20.27 BioNTech IMFS
20.27.1 Company Snapshot
20.27.2 Company Overview
20.27.3 Product Benchmarking
20.27.4 Strategic Outlook
21 Conclusion and Recommendations
21.1 Concluding Remarks from Visiongain
21.2 Recommendations for Market Players
ページTOPに戻る
List of Tables/Graphs
List of Tables
Table 1 Viral Vectors and Plasmid DNA Manufacturing Market Snapshot, 2022 & 2032 (US$ million, CAGR %)
Table 2 Viral Vectors and Plasmid DNA Manufacturing Market Forecast by Region 2024-2034 (US$ Million, AGR%, CAGR%): "V" Shaped Recovery
Table 3 Viral Vectors and Plasmid DNA Manufacturing Market Forecast by Region 2024-2034 (US$ Million, AGR%, CAGR%): "U" Shaped Recovery
Table 4 Viral Vectors and Plasmid DNA Manufacturing Market Forecast by Region 2024-2034 (US$ Million, AGR%, CAGR%): "W" Shaped Recovery
Table 5 Viral Vectors and Plasmid DNA Manufacturing Market Forecast by Region 2024-2034 (US$ Million, AGR%, CAGR%): "L" Shaped Recovery
Table 6 CMOs Capacity for Viral Vector Manufacturing
Table 7 Cleanroom Suites Facilities
Table 8 Investments and Expansions in CMO/CDMO Facilities in the Cell and Gene Therapy Sector
Table 9 Addressing Challenges and Technological Solutions
Table 10 Viral Vectors and Plasmid DNA Manufacturing Market Forecast by Vector Type, 2024-2034 (US$ Million, AGR%, CAGR%)
Table 11 Adenovirus Segment Market Forecast by Region, 2024-2034 (US$ Million, AGR%, CAGR%)
Table 12 Retrovirus Segment Market Forecast by Region, 2024-2034 (US$ Million, AGR%, CAGR%)
Table 13 Plasmid DNA Segment Market Forecast by Region, 2024-2034 (US$ Million, AGR%, CAGR%)
Table 14 AAV Market Forecast by Region, 2024-2034 (US$ Million, AGR%, CAGR%)
Table 15 Lentivirus Segment Market Forecast by Region, 2024-2034 (US$ Million, AGR%, CAGR%)
Table 16 Other Vaccine Segment Market Forecast by Region, 2024-2034 (US$ Million, AGR%, CAGR%)
Table 17 Viral Vectors and Plasmid DNA Manufacturing Market Forecast by Application, 2024-2034 (US$ Million, AGR%, CAGR%)
Table 18 Antisense RNAi Segment Market Forecast by Region, 2024-2034 (US$ Million, AGR%, CAGR%)
Table 19 Bacterial Segment Market Forecast by Region, 2024-2034 (US$ Million, AGR%, CAGR%)
Table 20 Cell Therapy Segment Market Forecast by Region, 2024-2034 (US$ Million, AGR%, CAGR%)
Table 21 Vaccinology Segment Market Forecast by Region, 2024-2034 (US$ Million, AGR%, CAGR%)
Table 22 Viral Vectors and Plasmid DNA Manufacturing Market Forecast by Disease, 2024-2034 (US$ Million, AGR%, CAGR%)
Table 23 Oncology Segment Market Forecast by Region, 2024-2034 (US$ Million, AGR%, CAGR%)
Table 24 Genetic Disorders Segment Market Forecast by Region, 2024-2034 (US$ Million, AGR%, CAGR%)
Table 25 Infectious Diseases Segment Market Forecast by Region, 2024-2034 (US$ Million, AGR%, CAGR%)
Table 26 Others Segment Market Forecast by Region, 2024-2034 (US$ Million, AGR%, CAGR%)
Table 27 Viral Vectors and Plasmid DNA Manufacturing Market Forecast by End-use, 2024-2034 (US$ Million, AGR%, CAGR%)
Table 28 Pharma and Biopharma Companies Segment Market Forecast by Region, 2024-2034 (US$ Million, AGR%, CAGR%)
Table 29 Research Institutes Segment Market Forecast by Region, 2024-2034 (US$ Million, AGR%, CAGR%)
Table 30 Viral Vectors and Plasmid DNA Manufacturing Market Forecast by Workflow, 2024-2034 (US$ Million, AGR%, CAGR%)
Table 31 Upstream Segment Market Forecast by Region, 2024-2034 (US$ Million, AGR%, CAGR%)
Table 32 Downstream Segment Market Forecast by Region, 2024-2034 (US$ Million, AGR%, CAGR%)
Table 33 Viral Vectors and Plasmid DNA Manufacturing Market Forecast by Region, 2024-2034 (US$ Million, AGR%, CAGR%)
Table 34 North America Viral Vectors and Plasmid DNA Manufacturing Market Forecast by Country, 2024-2034 (US$ Million, AGR%, CAGR%)
Table 35 North America Viral Vectors and Plasmid DNA Manufacturing Market Forecast by Vector Type, 2024-2034 (US$ Million, AGR%, CAGR%)
Table 36 North America Viral Vectors and Plasmid DNA Manufacturing Market Forecast by Application, 2024-2034 (US$ Million, AGR%, CAGR%)
Table 37 North America Viral Vectors and Plasmid DNA Manufacturing Market Forecast by End-use, 2024-2034 (US$ Million, AGR%, CAGR%)
Table 38 North America Viral Vectors and Plasmid DNA Manufacturing Market Forecast by Disease, 2024-2034 (US$ Million, AGR%, CAGR%)
Table 39 North America Viral Vectors and Plasmid DNA Manufacturing Market Forecast Workflow, 2024-2034 (US$ Million, AGR%, CAGR%)
Table 40 U.S. Viral Vectors and Plasmid DNA Manufacturing Market Forecast, 2024-2034 (US$ Million, AGR%, CAGR%)
Table 41 Canada Viral Vectors and Plasmid DNA Manufacturing Market Forecast, 2024-2034 (US$ Million, AGR%, CAGR%)
Table 42 Europe Viral Vectors and Plasmid DNA Manufacturing Market Forecast by Country, 2024-2034 (US$ Million, AGR%, CAGR %)
Table 43 Europe Viral Vectors and Plasmid DNA Manufacturing Market Forecast by Vector Type, 2024-2034 (US$ Million, AGR%, CAGR%)
Table 44 Europe Viral Vectors and Plasmid DNA Manufacturing Market Forecast by Application, 2024-2034 (US$ Million, AGR%, CAGR%)
Table 45 Europe Viral Vectors and Plasmid DNA Manufacturing Market Forecast by End-use, 2024-2034 (US$ Million, AGR%, CAGR%)
Table 46 Europe Viral Vectors and Plasmid DNA Manufacturing Market Forecast by Disease, 2024-2034 (US$ Million, AGR%, CAGR%)
Table 47 Europe Viral Vectors and Plasmid DNA Manufacturing Market Forecast Workflow, 2024-2034 (US$ Million, AGR%, CAGR%)
Table 48 Germany Viral Vectors and Plasmid DNA Manufacturing Market Forecast, 2024-2034 (US$ Million, AGR%, CAGR%)
Table 49 France Viral Vectors and Plasmid DNA Manufacturing Market Forecast, 2024-2034 (US$ Million, AGR%, CAGR%)
Table 50 UK Viral Vectors and Plasmid DNA Manufacturing Market Forecast, 2024-2034 (US$ Million, AGR%, CAGR%)
Table 51 Italy Viral Vectors and Plasmid DNA Manufacturing Market Forecast, 2024-2034 (US$ Million, AGR%, CAGR%)
Table 52 Spain Viral Vectors and Plasmid DNA Manufacturing Market Forecast, 2024-2034 (US$ Million, AGR%, CAGR%)
Table 53 Sweden Viral Vectors and Plasmid DNA Manufacturing Market Forecast, 2024-2034 (US$ Million, AGR%, CAGR%)
Table 54 Switzerland Viral Vectors and Plasmid DNA Manufacturing Market Forecast, 2024-2034 (US$ Million, AGR%, CAGR%)
Table 55 Rest of Europe Viral Vectors and Plasmid DNA Manufacturing Market Forecast, 2024-2034 (US$ Million, AGR%, CAGR%)
Table 56 Asia Pacific Viral Vectors and Plasmid DNA Manufacturing Market Forecast by Country, 2024-2034 (US$ Million, AGR%, CAGR%)
Table 57 Asia Pacific Viral Vectors and Plasmid DNA Manufacturing Market Forecast by Vector Type, 2024-2034 (US$ Million, AGR%, CAGR%)
Table 58 Asia Pacific Viral Vectors and Plasmid DNA Manufacturing Market Forecast by Application, 2024-2034 (US$ Million, AGR%, CAGR%)
Table 59 Asia Pacific Viral Vectors and Plasmid DNA Manufacturing Market Forecast by End-use, 2024-2034 (US$ Million, AGR%, CAGR%)
Table 60 Europe Viral Vectors and Plasmid DNA Manufacturing Market Forecast by Disease, 2024-2034 (US$ Million, AGR%, CAGR%)
Table 61 Asia Pacific Viral Vectors and Plasmid DNA Manufacturing Market Forecast Workflow, 2024-2034 (US$ Million, AGR%, CAGR%)
Table 62 Japan Viral Vectors and Plasmid DNA Manufacturing Market Forecast, 2024-2034 (US$ Million, AGR%, CAGR%)
Table 63 China Viral Vectors and Plasmid DNA Manufacturing Market Forecast, 2024-2034 (US$ Million, AGR%, CAGR%)
Table 64 India Viral Vectors and Plasmid DNA Manufacturing Market Forecast, 2024-2034 (US$ Million, AGR%, CAGR%)
Table 65 Australia Viral Vectors and Plasmid DNA Manufacturing Market Forecast, 2024-2034 (US$ Million, AGR%, CAGR%)
Table 66 South Korea Viral Vectors and Plasmid DNA Manufacturing Market Forecast, 2024-2034 (US$ Million, AGR%, CAGR%)
Table 67 Singapore Viral Vectors and Plasmid DNA Manufacturing Market Forecast, 2024-2034 (US$ Million, AGR%, CAGR%)
Table 68 Taiwan Viral Vectors and Plasmid DNA Manufacturing Market Forecast, 2024-2034 (US$ Million, AGR%, CAGR%)
Table 69 Rest of Asia Pacific Viral Vectors and Plasmid DNA Manufacturing Market Forecast, 2024-2034 (US$ Million, AGR%, CAGR%)
Table 70 Latin America Viral Vectors and Plasmid DNA Manufacturing Market Forecast by Country, 2024-2034 (US$ Million, AGR%, CAGR%)
Table 71 Latin America Viral Vectors and Plasmid DNA Manufacturing Market Forecast by Vector Type, 2024-2034 (US$ Million, AGR%, CAGR%)
Table 72 Latin America Viral Vectors and Plasmid DNA Manufacturing Market Forecast by Application, 2024-2034 (US$ Million, AGR%, CAGR%)
Table 73 Latin America Viral Vectors and Plasmid DNA Manufacturing Market Forecast by End-use, 2024-2034 (US$ Million, AGR%, CAGR%)
Table 74 Latin America Viral Vectors and Plasmid DNA Manufacturing Market Forecast Workflow, 2024-2034 (US$ Million, AGR%, CAGR%)
Table 75 Brazil Viral Vectors and Plasmid DNA Manufacturing Market Forecast, 2024-2034 (US$ Million, AGR%, CAGR%)
Table 76 Mexico Viral Vectors and Plasmid DNA Manufacturing Market Forecast, 2024-2034 (US$ Million, AGR%, CAGR%)
Table 77 Argentina Viral Vectors and Plasmid DNA Manufacturing Market Forecast, 2024-2034 (US$ Million, AGR%, CAGR%)
Table 78 Rest of Latin America Viral Vectors and Plasmid DNA Manufacturing Market Forecast, 2024-2034 (US$ Million, AGR%, CAGR%)
Table 79 MEA Viral Vectors and Plasmid DNA Manufacturing Market Forecast by Country, 2024-2034 (US$ Million, AGR%, CAGR%)
Table 80 MEA Viral Vectors and Plasmid DNA Manufacturing Market Forecast by Vector Type, 2024-2034 (US$ Million, AGR%, CAGR%)
Table 81 MEA Viral Vectors and Plasmid DNA Manufacturing Market Forecast by Application, 2024-2034 (US$ Million, AGR%, CAGR%)
Table 82 MEA Viral Vectors and Plasmid DNA Manufacturing Market Forecast by End-use, 2024-2034 (US$ Million, AGR%, CAGR%)
Table 83 MEA Viral Vectors and Plasmid DNA Manufacturing Market Forecast by Disease, 2024-2034 (US$ Million, AGR%, CAGR%)
Table 84 North America Viral Vectors and Plasmid DNA Manufacturing Market Forecast Workflow, 2024-2034 (US$ Million, AGR%, CAGR%)
Table 85 GCC Viral Vectors and Plasmid DNA Manufacturing Market Forecast, 2024-2034 (US$ Million, AGR%, CAGR%)
Table 86 South Africa Viral Vectors and Plasmid DNA Manufacturing Market Forecast, 2024-2034 (US$ Million, AGR%, CAGR%)
Table 87 Rest of MEA Viral Vectors and Plasmid DNA Manufacturing Market Forecast, 2024-2034 (US$ Million, AGR%, CAGR%)
Table 88 Strategic Outlook
Table 89 Amicus Therapeutics: Key Details, (CEO, HQ, Revenue, Founded, No. of Employees, Company Type, Website, Business Segment)
Table 90 Amicus Therapeutics : Product Benchmarking
Table 91 AstraZeneca: Strategic Outlook
Table 92 Lonza Group Ltd: Key Details, (CEO, HQ, Revenue, Founded, No. of Employees, Company Type, Website, Business Segment)
Table 93 Lonza Group Ltd: Product Benchmarking
Table 94 Lonza Group Ltd: Strategic Outlook
Table 95 Merck KGaA: Key Details, (CEO, HQ, Revenue, Founded, No. of Employees, Company Type, Website, Business Segment)
Table 96 Merck KGaA: Product Benchmarking
Table 97 Merck: Strategic Outlook
Table 98 uniQure N.V.: Key Details, (CEO, HQ, Revenue, Founded, No. of Employees, Company Type, Website, Business Segment)
Table 99 uniQure N.V. : Product Benchmarking
Table 100 uniQure N.V. : Strategic Outlook
Table 101 Catalent Inc: Key Details, (CEO, HQ, Revenue, Founded, No. of Employees, Company Type, Website, Business Segment)
Table 102 Catalent Inc: Product Benchmarking
Table 103 Catalent Inc: Strategic Outlook
Table 104 Thermo Fisher Scientific Inc.: Key Details, (CEO, HQ, Revenue, Founded, No. of Employees, Company Type, Website, Business Segment)
Table 105 Thermo Fisher Scientific Inc.: Product Benchmarking
Table 106 Thermo Fisher Scientific Inc.: Strategic Outlook
Table 107 Charles River Laboratories: Key Details, (CEO, HQ, Revenue, Founded, No. of Employees, Company Type, Website, Business Segment)
Table 108 Charles River Laboratories: Product Benchmarking
Table 109 Charles River Laboratories International Inc: Strategic Outlook
Table 110 FUJIFILM Diosynth Biotechnologies: Key Details, (CEO, HQ, Revenue, Founded, No. of Employees, Company Type, Website, Business Segment)
Table 111 FUJIFILM Diosynth Biotechnologies: Product Benchmarking
Table 112 FUJIFILM Diosynth Biotechnologies: Strategic Outlook
Table 113 bluebird bio Inc: Key Details, (CEO, HQ, Revenue, Founded, No. of Employees, Company Type, Website, Business Segment)
Table 114 bluebird bio Inc: Product Benchmarking
Table 115 bluebird bio Inc: Strategic Outlook
Table 116 Aldevron: Key Details, (CEO, HQ, Revenue, Founded, No. of Employees, Company Type, Website, Business Segment)
Table 117 Aldevron: Product Benchmarking
Table 118 Aldevron: Strategic Outlook
Table 119 Addgene: Key Details, (CEO, HQ, Revenue, Founded, No. of Employees, Company Type, Website, Business Segment)
Table 120 Addgene: Product Benchmarking
Table 121 Creative Biogene: Key Details, (CEO, HQ, Revenue, Founded, No. of Employees, Company Type, Website, Business Segment)
Table 122 Creative Biogene: Product Benchmarking
Table 123 Vivebiotech: Key Details, (CEO, HQ, Revenue, Founded, No. of Employees, Company Type, Website, Business Segment)
Table 124 VIVEbiotech: Product Benchmarking
Table 125 VIVEbiotech: Strategic Outlook
Table 126 Recipharm AB: Key Details, (CEO, HQ, Revenue, Founded, No. of Employees, Company Type, Website, Business Segment)
Table 127 Recifarm AB: Product Benchmarking
Table 128 Recipharm AB: Strategic Outlook
Table 129 Waisman Biomanufacturing: Key Details, (CEO, HQ, Revenue, Founded, No. of Employees, Company Type, Website, Business Segment)
Table 130 Waisman Biomanufacturing: Product Benchmarking
Table 131 Waisman Biomanufacturing: Strategic Outlook
Table 132 VGXI, Inc.: Key Details, (CEO, HQ, Revenue, Founded, No. of Employees, Company Type, Website, Business Segment)
Table 133 VGXI, Inc. : Product Benchmarking
Table 134 VGXI, Inc.: Strategic Outlook
Table 135 Batavia Biosciences B.V.: Key Details, (CEO, HQ, Revenue, Founded, No. of Employees, Company Type, Website, Business Segment)
Table 136 Batavia Biosciences B.V. : Product Benchmarking
Table 137 Batavia Biosciences B.V.: Strategic Outlook
Table 138 WuXi AppTec: Key Details, (CEO, HQ, Revenue, Founded, No. of Employees, Company Type, Website, Business Segment)
Table 139 Wuxi AppTec: Product Benchmarking
Table 140 Wuxi AppTec: Strategic Outlook
Table 141 ATUM: Key Details, (CEO, HQ, Revenue, Founded, No. of Employees, Company Type, Website, Business Segment)
Table 142 ATUM: Product Benchmarking
Table 143 ATUM: Strategic Outlook
Table 144 Altogen Biosystems: Key Details, (CEO, HQ, Revenue, Founded, No. of Employees, Company Type, Website, Business Segment)
Table 145 Altogen Biosystems: Product Benchmarking
Table 146 Genezen: Key Details, (CEO, HQ, Revenue, Founded, No. of Employees, Company Type, Website, Business Segment)
Table 147 Genezen: Product Benchmarking
Table 148 Genezen: Strategic Outlook
Table 149 Yposkesi, Inc: Key Details, (CEO, HQ, Revenue, Founded, No. of Employees, Company Type, Website, Business Segment)
Table 150 Yposkesi, Inc: Product Benchmarking
Table 151 Yposkesi, Inc: Strategic Outlook
Table 152 CEVEC Pharmaceuticals GmbH : Key Details, (CEO, HQ, Revenue, Founded, No. of Employees, Company Type, Website, Business Segment)
Table 153 CEVEC Pharmaceuticals GmbH : Product Benchmarking
Table 154 CEVEC Pharmaceuticals GmbH: Strategic Outlook
Table 155 Virovek: Key Details, (CEO, HQ, Revenue, Founded, No. of Employees, Company Type, Website, Business Segment)
Table 156 Virovek : Product Benchmarking
Table 157 Virovek: Strategic Outlook
Table 158 ABL Inc.: Key Details, (CEO, HQ, Revenue, Founded, No. of Employees, Company Type, Website, Business Segment)
Table 159 ABL Inc.: Product Benchmarking
Table 160 ABL Inc.: Strategic Outlook
Table 161 Biovian Oy: Key Details, (CEO, HQ, Revenue, Founded, No. of Employees, Company Type, Website, Business Segment)
Table 162 Biovian Oy : Product Benchmarking
Table 163 Biovian Oy: Strategic Outlook
Table 164 BioNTech IMFS : Key Details, (CEO, HQ, Revenue, Founded, No. of Employees, Company Type, Website, Business Segment)
Table 165 BioNTech IMFS: Product Benchmarking
Table 166 BioNTech IMFS: Strategic Outlook
List of Figures
Figure 1 Viral Vectors and Plasmid DNA Manufacturing Market Segmentation
Figure 2 Viral Vectors and Plasmid DNA Manufacturing Market by Vector Type: Market Attractiveness Index
Figure 3 Viral Vectors and Plasmid DNA Manufacturing Market by Application: Market Attractiveness Index
Figure 4 Viral Vectors and Plasmid DNA Manufacturing Market by End-use: Market Attractiveness Index
Figure 5 Viral Vectors and Plasmid DNA Manufacturing Market by Disease: Market Attractiveness Index
Figure 6 Viral Vectors and Plasmid DNA Manufacturing Market by Workflow: Market Attractiveness Index
Figure 7 Viral Vectors and Plasmid DNA Manufacturing Market Attractiveness Index by Region
Figure 8 Viral Vectors and Plasmid DNA Manufacturing Market: Market Dynamics
Figure 9 Viral Vectors and Plasmid DNA Manufacturing Market by Region, 2024-2034 (US$ Million, AGR %): “V” Shaped Recovery
Figure 10 Viral Vectors and Plasmid DNA Manufacturing Market by Region, 2024-2034 (US$ Million, AGR %): “U” Shaped Recovery
Figure 11 Viral Vectors and Plasmid DNA Manufacturing Market by Region, 2024-2034 (US$ Million, AGR %): “W” Shaped Recovery
Figure 12 Viral Vectors and Plasmid DNA Manufacturing Market by Region, 2024-2034 (US$ Million, AGR %): “L” Shaped Recovery
Figure 13 Viral Vectors and Plasmid Manufacturing Market: Porter’s Five Forces Analysis
Figure 14 Viral Vectors and Plasmid Manufacturing Market: PEST Analysis
Figure 15 Viral Vectors and Plasmid DNA Manufacturing Market by Vector Type: Market Attractiveness Index
Figure 16 Viral Vectors and Plasmid DNA Manufacturing Market Forecast by Vector Type, 2024-2034 (US$ Million, AGR %)
Figure 17 Viral Vectors and Plasmid DNA Manufacturing Market Share Forecast by Vector Type, 2024, 2029, 2034 (%)
Figure 18 Adenovirus Segment Market Forecast by Region, 2024-2034 (US$ Million, AGR %)
Figure 19 Adenovirus Segment Market Share Forecast by Region, 2024 & 2034 (%)
Figure 20 Retrovirus Segment Market Forecast by Region, 2024-2034 (US$ Million, AGR %)
Figure 21 Retrovirus Segment Market Share Forecast by Region, 2024 & 2034 (%)
Figure 22 Plasmid DNA Segment Market Forecast by Region, 2024-2034 (US$ Million, AGR %)
Figure 23 Plasmid DNA Segment Market Share Forecast by Region, 2024 & 2034 (%)
Figure 24 AAV Segment Market Forecast by Region, 2024-2034 (US$ Million, AGR %)
Figure 25 AAV Segment Market Share Forecast by Region, 2024 & 2034 (%)
Figure 26 Lentivirus Segment Market Forecast by Region, 2024-2034 (US$ Million, AGR %)
Figure 27 Letivirus Segment Market Share Forecast by Region, 2024 & 2034 (%)
Figure 28 Other Vectors Segment Market Forecast by Region, 2024-2034 (US$ Million, AGR %)
Figure 29 Other Vectors Segment Market Share Forecast by Region, 2024 & 2034 (%)
Figure 30 Viral Vectors and Plasmid DNA Manufacturing Market by Application: Market Attractiveness Index
Figure 31 Viral Vectors and Plasmid DNA Manufacturing Market Forecast by Application, 2024-2034 (US$ Million, AGR %)
Figure 32 Viral Vectors and Plasmid DNA Manufacturing Market Share Forecast by Application, 2024, 2029, 2034 (%)
Figure 33 Antisense RNAi Segment Market Forecast by Region, 2024-2034 (US$ Million, AGR %)
Figure 34 Antisense RNAi Segment Market Share Forecast by Region, 2024 & 2034 (%)
Figure 35 Gene Therapy Segment Market Forecast by Region, 2024-2034 (US$ Million, AGR %)
Figure 36 Gene Therapy Segment Market Share Forecast by Region, 2024 & 2034 (%)
Figure 37 Cell Therapy Segment Market Forecast by Region, 2024-2034 (US$ Million, AGR %)
Figure 38 Cell Therapy Segment Market Share Forecast by Region, 2024 & 2034 (%)
Figure 39 Vaccinology Segment Market Forecast by Region, 2024-2034 (US$ Million, AGR %)
Figure 40 Vaccinology Segment Market Share Forecast by Region, 2024 & 2034 (%)
Figure 41 Viral Vectors and Plasmid DNA Manufacturing Market by Disease: Market Attractiveness Index
Figure 42 Viral Vectors and Plasmid DNA Manufacturing Market Forecast by Disease, 2024-2034 (US$ Million, AGR %)
Figure 43 Viral Vectors and Plasmid DNA Manufacturing Market Share Forecast by Disease, 2024, 2029, 2034 (%)
Figure 44 Oncology Segment Market Forecast by Region, 2024-2034 (US$ Million, AGR %)
Figure 45 Oncology Segment Market Share Forecast by Region, 2024 & 2034 (%)
Figure 46 Genetic Disorders Segment Market Forecast by Region, 2024-2034 (US$ Million, AGR %)
Figure 47 Genetic Disorders Segment Market Share Forecast by Region, 2024 & 2034 (%)
Figure 48 Infectious Diseases Segment Market Forecast by Region, 2024-2034 (US$ Million, AGR %)
Figure 49 Infectious Diseases Segment Market Share Forecast by Region, 2024 & 2034 (%)
Figure 50 Others Segment Market Forecast by Region, 2024-2034 (US$ Million, AGR %)
Figure 51 Others Segment Market Share Forecast by Region, 2024 & 2034 (%)
Figure 52 Viral Vectors and Plasmid DNA Manufacturing Market by End-use: Market Attractiveness Index
Figure 53 Viral Vectors and Plasmid DNA Manufacturing Market Forecast by End-use, 2024-2034 (US$ Million, AGR %)
Figure 54 Viral Vectors and Plasmid DNA Manufacturing Market Share Forecast by End-use, 2024, 2029, 2034 (%)
Figure 55 Pharma and Biopharma Companies Segment Market Forecast by Region, 2024-2034 (US$ Million, AGR %)
Figure 56 Pharma and Biopharma Companies Segment Market Share Forecast by Region, 2024 & 2034 (%)
Figure 57 Research Institutes Segment Market Forecast by Region, 2024-2034 (US$ Million, AGR %)
Figure 58 Research Institutes Segment Market Share Forecast by Region, 2024 & 2034 (%)
Figure 59 Viral Vectors and Plasmid DNA Manufacturing Market by Workflow: Market Attractiveness Index
Figure 60 Viral Vectors and Plasmid DNA Manufacturing Market Forecast by Workflow, 2024-2034 (US$ Million, AGR %)
Figure 61 Viral Vectors and Plasmid DNA Manufacturing Market Share Forecast by Workflow, 2024, 2029, 2034 (%)
Figure 62 Upstream Segment Market Forecast by Region, 2024-2034 (US$ Million, AGR %)
Figure 63 Upstream Segment Market Share Forecast by Region, 2024 & 2034 (%)
Figure 64 Downstream Segment Market Forecast by Region, 2024-2034 (US$ Million, AGR %)
Figure 65 Downstream Segment Market Share Forecast by Region, 2024 & 2034 (%)
Figure 66 Viral Vectors and Plasmid DNA Manufacturing Market Forecast by Region 2024 and 2034 (Revenue, CAGR%)
Figure 67 Viral Vectors and Plasmid DNA Manufacturing Market Share Forecast by Region 2024, 2029, 2034 (%)
Figure 68 Viral Vectors and Plasmid DNA Manufacturing Market by Region, 2024-2034 (US$ Million, AGR %)
Figure 69 North America Viral Vectors and Plasmid DNA Manufacturing Market Attractiveness Index
Figure 70 North America Viral Vectors and Plasmid DNA Manufacturing Market by Region, 2024, 2029 & 2034 (US$ Million)
Figure 71 North America Viral Vectors and Plasmid DNA Manufacturing Market Forecast by Country, 2024-2034 (US$ Million, AGR %)
Figure 72 North America Viral Vectors and Plasmid DNA Manufacturing Market Share Forecast by Country, 2024 & 2034 (%)
Figure 73 North America Viral Vectors and Plasmid DNA Manufacturing Market Forecast by Vector Type, 2024-2034 (US$ Million, AGR %)
Figure 74 North America Viral Vectors and Plasmid DNA Manufacturing Market Share Forecast by Vector Type, 2024 & 2034 (%)
Figure 75 North America Viral Vectors and Plasmid DNA Manufacturing Market Forecast by Application, 2024-2034 (US$ Million, AGR %)
Figure 76 North America Viral Vectors and Plasmid DNA Manufacturing Market Share Forecast by Application, 2024 & 2034 (%)
Figure 77 North America Viral Vectors and Plasmid DNA Manufacturing Market Forecast by End-use, 2024-2034 (US$ Million, AGR %)
Figure 78 North America Viral Vectors and Plasmid DNA Manufacturing Market Share Forecast by End-use, 2024 & 2034 (%)
Figure 79 North America Viral Vectors and Plasmid DNA Manufacturing Market Forecast by Disease, 2024-2034 (US$ Million, AGR %)
Figure 80 North America Viral Vectors and Plasmid DNA Manufacturing Market Share Forecast by Disease, 2024 & 2034 (%)
Figure 81 North America Viral Vectors and Plasmid DNA Manufacturing Market Forecast by Workflow 2024-2034 (US$ Million, AGR %)
Figure 82 North America Viral Vectors and Plasmid DNA Manufacturing Market Share Forecast by Workflow, 2024 & 2034 (%)
Figure 83 U.S. Viral Vectors and Plasmid DNA Manufacturing Market Forecast, 2024-2034 (US$ Million, AGR %)
Figure 84 Canada Viral Vectors and Plasmid DNA Manufacturing Market Forecast, 2024-2034 (US$ Million, AGR %)
Figure 85 Europe Viral Vectors and Plasmid DNA Manufacturing Market Attractiveness Index
Figure 86 Europe Viral Vectors and Plasmid DNA Manufacturing Market by Region, 2024, 2029 & 2034 (US$ Million)
Figure 87 Europe Viral Vectors and Plasmid DNA Manufacturing Market Forecast by Country, 2024-2034 (US$ Million, AGR %)
Figure 88 Europe Viral Vectors and Plasmid DNA Manufacturing Market Share Forecast by Country, 2024 & 2034 (%)
Figure 89 Europe Viral Vectors and Plasmid DNA Manufacturing Market Forecast by Vector Type, 2024-2034 (US$ Million, AGR %)
Figure 90 Europe Viral Vectors and Plasmid DNA Manufacturing Market Share Forecast by Vector Type, 2024 & 2034 (%)
Figure 91 Europe Viral Vectors and Plasmid DNA Manufacturing Market Forecast by Application, 2024-2034 (US$ Million, AGR %)
Figure 92 Europe Viral Vectors and Plasmid DNA Manufacturing Market Share Forecast by Application, 2024 & 2034 (%)
Figure 93 Europe Viral Vectors and Plasmid DNA Manufacturing Market Forecast by End-use, 2024-2034 (US$ Million, AGR %)
Figure 94 Europe Viral Vectors and Plasmid DNA Manufacturing Market Share Forecast by End-use, 2024 & 2034 (%)
Figure 95 Europe Viral Vectors and Plasmid DNA Manufacturing Market Forecast by Disease, 2024-2034 (US$ Million, AGR %)
Figure 96 Europe Viral Vectors and Plasmid DNA Manufacturing Market Share Forecast by Disease, 2024 & 2034 (%)
Figure 97 North America Viral Vectors and Plasmid DNA Manufacturing Market Forecast by Workflow 2024-2034 (US$ Million, AGR %)
Figure 98 Europe Viral Vectors and Plasmid DNA Manufacturing Market Share Forecast by Workflow, 2024 & 2034 (%)
Figure 99 Germany Viral Vectors and Plasmid DNA Manufacturing Market Forecast, 2024-2034 (US$ Million, AGR %)
Figure 100 France Viral Vectors and Plasmid DNA Manufacturing Market Forecast, 2024-2034 (US$ Million, AGR %)
Figure 101 UK Viral Vectors and Plasmid DNA Manufacturing Market Forecast, 2024-2034 (US$ Million, AGR %)
Figure 102 Italy Viral Vectors and Plasmid DNA Manufacturing Market Forecast, 2024-2034 (US$ Million, AGR %)
Figure 103 Spain Viral Vectors and Plasmid DNA Manufacturing Market Forecast, 2024-2034 (US$ Million, AGR %)
Figure 104 Sweden Viral Vectors and Plasmid DNA Manufacturing Market Forecast, 2024-2034 (US$ Million, AGR %)
Figure 105 Switzerland Viral Vectors and Plasmid DNA Manufacturing Market Forecast, 2024-2034 (US$ Million, AGR %)
Figure 106 Rest of Europe Viral Vectors and Plasmid DNA Manufacturing Market Forecast, 2024-2034 (US$ Million, AGR %)
Figure 107 Asia Pacific Viral Vectors and Plasmid DNA Manufacturing Market Attractiveness Index
Figure 108 Asia Pacific Viral Vectors and Plasmid DNA Manufacturing Market by Region, 2024, 2029 & 2034 (US$ Million)
Figure 109 Asia Pacific Viral Vectors and Plasmid DNA Manufacturing Market Forecast by Country, 2024-2034 (US$ Million, AGR %)
Figure 110 Asia Pacific Viral Vectors and Plasmid DNA Manufacturing Market Share Forecast by Country, 2024 & 2034 (%)
Figure 111 Asia Pacific Viral Vectors and Plasmid DNA Manufacturing Market Forecast by Vector Type, 2024-2034 (US$ Million, AGR %)
Figure 112 Asia Pacific Viral Vectors and Plasmid DNA Manufacturing Market Share Forecast by Vector Type, 2024 & 2034 (%)
Figure 113 Asia Pacific Viral Vectors and Plasmid DNA Manufacturing Market Forecast by Application, 2024-2034 (US$ Million, AGR %)
Figure 114 Asia Pacific Viral Vectors and Plasmid DNA Manufacturing Market Share Forecast by Application, 2024 & 2034 (%)
Figure 115 Asia Pacific Viral Vectors and Plasmid DNA Manufacturing Market Forecast by End-use, 2024-2034 (US$ Million, AGR %)
Figure 116 Asia Pacific Viral Vectors and Plasmid DNA Manufacturing Market Share Forecast by End-use, 2024 & 2034 (%)
Figure 117 Europe Viral Vectors and Plasmid DNA Manufacturing Market Forecast by Disease, 2024-2034 (US$ Million, AGR %)
Figure 118 Europe Viral Vectors and Plasmid DNA Manufacturing Market Share Forecast by Disease, 2024 & 2034 (%)
Figure 119 Asia Pacific Viral Vectors and Plasmid DNA Manufacturing Market Forecast by Workflow 2024-2034 (US$ Million, AGR %)
Figure 120 North America Viral Vectors and Plasmid DNA Manufacturing Market Share Forecast by Workflow, 2024 & 2034 (%)
Figure 121 Japan Viral Vectors and Plasmid DNA Manufacturing Market Forecast, 2024-2034 (US$ Million, AGR %)
Figure 122 China Viral Vectors and Plasmid DNA Manufacturing Market Forecast, 2024-2034 (US$ Million, AGR %)
Figure 123 India Viral Vectors and Plasmid DNA Manufacturing Market Forecast, 2024-2034 (US$ Million, AGR %)
Figure 124 Australia Viral Vectors and Plasmid DNA Manufacturing Market Forecast, 2024-2034 (US$ Million, AGR %)
Figure 125 South Korea Viral Vectors and Plasmid DNA Manufacturing Market Forecast, 2024-2034 (US$ Million, AGR %)
Figure 126 Singapore Viral Vectors and Plasmid DNA Manufacturing Market Forecast, 2024-2034 (US$ Million, AGR %)
Figure 127 Taiwan Viral Vectors and Plasmid DNA Manufacturing Market Forecast, 2024-2034 (US$ Million, AGR %)
Figure 128 Rest of Asia Pacific Viral Vectors and Plasmid DNA Manufacturing Market Forecast, 2024-2034 (US$ Million, AGR %)
Figure 129 Latin America Viral Vectors and Plasmid DNA Manufacturing Market Attractiveness Index
Figure 130 Latin America Viral Vectors and Plasmid DNA Manufacturing Market by Region, 2024, 2029 & 2034 (US$ Million)
Figure 131 Latin America Viral Vectors and Plasmid DNA Manufacturing Market Forecast by Country, 2024-2034 (US$ Million, AGR %)
Figure 132 Latin America Viral Vectors and Plasmid DNA Manufacturing Market Share Forecast by Country, 2024 & 2034 (%)
Figure 133 Latin America Viral Vectors and Plasmid DNA Manufacturing Market Forecast by Vector Type, 2024-2034 (US$ Million, AGR %)
Figure 134 Latin America Viral Vectors and Plasmid DNA Manufacturing Market Share Forecast by Vector Type, 2024 & 2034 (%)
Figure 135 Latin America Viral Vectors and Plasmid DNA Manufacturing Market Forecast by Application, 2024-2034 (US$ Million, AGR %)
Figure 136 Latin America Viral Vectors and Plasmid DNA Manufacturing Market Share Forecast by Application, 2024 & 2034 (%)
Figure 137 Latin America Viral Vectors and Plasmid DNA Manufacturing Market Forecast by End-use, 2024-2034 (US$ Million, AGR %)
Figure 138 Latin America Viral Vectors and Plasmid DNA Manufacturing Market Share Forecast by End-use, 2024 & 2034 (%)
Figure 139 Latin America Viral Vectors and Plasmid DNA Manufacturing Market Forecast by Workflow 2024-2034 (US$ Million, AGR %)
Figure 140 Latin America Viral Vectors and Plasmid DNA Manufacturing Market Share Forecast by Workflow, 2024 & 2034 (%)
Figure 141 Brazil Viral Vectors and Plasmid DNA Manufacturing Market Forecast, 2024-2034 (US$ Million, AGR %)
Figure 142 Mexico Viral Vectors and Plasmid DNA Manufacturing Market Forecast, 2024-2034 (US$ Million, AGR %)
Figure 143 Argentina Viral Vectors and Plasmid DNA Manufacturing Market Forecast, 2024-2034 (US$ Million, AGR %)
Figure 144 Rest of Latin America Viral Vectors and Plasmid DNA Manufacturing Market Forecast, 2024-2034 (US$ Million, AGR %)
Figure 145 MEA Viral Vectors and Plasmid DNA Manufacturing Market Attractiveness Index
Figure 146 MEA Viral Vectors and Plasmid DNA Manufacturing Market by Region, 2024, 2029 & 2034 (US$ Million)
Figure 147 MEA Viral Vectors and Plasmid DNA Manufacturing Market Forecast by Country, 2024-2034 (US$ Million, AGR %)
Figure 148 MEA Viral Vectors and Plasmid DNA Manufacturing Market Share Forecast by Country, 2024 & 2034 (%)
Figure 149 MEA Viral Vectors and Plasmid DNA Manufacturing Market Forecast by Vector Type, 2024-2034 (US$ Million, AGR %)
Figure 150 MEA Viral Vectors and Plasmid DNA Manufacturing Market Share Forecast by Vector Type, 2024 & 2034 (%)
Figure 151 MEA Viral Vectors and Plasmid DNA Manufacturing Market Forecast by Application, 2024-2034 (US$ Million, AGR %)
Figure 152 MEA Viral Vectors and Plasmid DNA Manufacturing Market Share Forecast by Application, 2024 & 2034 (%)
Figure 153 MEA Viral Vectors and Plasmid DNA Manufacturing Market Forecast by End-use, 2024-2034 (US$ Million, AGR %)
Figure 154 MEA Viral Vectors and Plasmid DNA Manufacturing Market Share Forecast by Application, 2024 & 2034 (%)
Figure 155 MEA Viral Vectors and Plasmid DNA Manufacturing Market Forecast by Disease 2024-2034 (US$ Million, AGR %)
Figure 156 MEA Viral Vectors and Plasmid DNA Manufacturing Market Share Forecast by Disease, 2024 & 2034 (%)
Figure 157 MEA Viral Vectors and Plasmid DNA Manufacturing Market Forecast by Workflow 2024-2034 (US$ Million, AGR %)
Figure 158 MEA Viral Vectors and Plasmid DNA Manufacturing Market Share Forecast by Workflow, 2024 & 2034 (%)
Figure 159 GCC Viral Vectors and Plasmid DNA Manufacturing Market Forecast, 2024-2034 (US$ Million, AGR %)
Figure 160 South Africa Viral Vectors and Plasmid DNA Manufacturing Market Forecast, 2024-2034 (US$ Million, AGR %)
Figure 161 Rest of MEA Viral Vectors and Plasmid DNA Manufacturing Market Forecast, 2024-2034 (US$ Million, AGR %)
Figure 162 Amicus Therapeutics: Net Revenue, 2017-2022 (US$ Million, AGR%)
Figure 163 Amicus Therapeutics: R&D, 2017-2022 (US$ Million, AGR%)
Figure 164 Amicus Therapeutics: Regional Market Shares, 2022
Figure 165 Lonza Group Ltd: Net Revenue, 2017-2022 (US$ Million, AGR%)
Figure 166 Lonza Group Ltd: R&D, 2017-2022 (US$ Million, AGR%)
Figure 167 Lonza Group: Regional Market Shares, 2022
Figure 168 Merck KGaA: Net Revenue, 2017-2022 (US$ Million, AGR%)
Figure 169 Merck KGaA: R&D, 2017-2022 (US$ Million, AGR%)
Figure 170 Merck KGaA: Regional Market Shares, 2022
Figure 171 uniQure N.V.: Net Revenue, 2017-2022 (US$ Million, AGR%)
Figure 172 uniQure N.V.: R&D, 2017-2022 (US$ Million, AGR%)
Figure 173 uniQure N.V.: Regional Market Shares, 2022
Figure 174 Catalent Inc: Net Revenue, 2017-2022 (US$ Million, AGR%)
Figure 175 Catalent Inc: R&D, 2017-2022 (US$ Million, AGR%)
Figure 176 Catalent Inc: Regional Market Shares, 2022
Figure 177 Thermo Fisher Scientific Inc.: Net Revenue, 2017-2022 (US$ Million, AGR%)
Figure 178 Thermo Fisher Scientific Inc.: R&D, 2017-2022 (US$ Million, AGR%)
Figure 179 Thermo Fisher Scientific Inc.: Regional Market Shares, 2022
Figure 180 Charles River Laboratories: Net Revenue, 2017-2022 (US$ Million, AGR%)
Figure 181 Charles River Laboratories International Inc: Regional Market Shares, 2022
Figure 182 bluebird bio Inc: Net Revenue, 2017-2022 (US$ Million, AGR%)
Figure 183 bluebird bio Inc: R&D, 2017-2022 (US$ Million, AGR%)
ページTOPに戻る
本レポートと同じKEY WORD(vector)の最新刊レポート
- 本レポートと同じKEY WORDの最新刊レポートはありません。
よくあるご質問
Visiongain社はどのような調査会社ですか?
英国の調査会社ヴィジョンゲイン社(Visiongain)は、通信とエネルギーのほか、自動車や化学・医薬品、金属など、広範な市場を対象に調査を行っています。自動車市場については、市場全般に関する調査のほ... もっと見る
調査レポートの納品までの日数はどの程度ですか?
在庫のあるものは速納となりますが、平均的には 3-4日と見て下さい。
但し、一部の調査レポートでは、発注を受けた段階で内容更新をして納品をする場合もあります。
発注をする前のお問合せをお願いします。
注文の手続きはどのようになっていますか?
1)お客様からの御問い合わせをいただきます。
2)見積書やサンプルの提示をいたします。
3)お客様指定、もしくは弊社の発注書をメール添付にて発送してください。
4)データリソース社からレポート発行元の調査会社へ納品手配します。
5) 調査会社からお客様へ納品されます。最近は、pdfにてのメール納品が大半です。
お支払方法の方法はどのようになっていますか?
納品と同時にデータリソース社よりお客様へ請求書(必要に応じて納品書も)を発送いたします。
お客様よりデータリソース社へ(通常は円払い)の御振り込みをお願いします。
請求書は、納品日の日付で発行しますので、翌月最終営業日までの当社指定口座への振込みをお願いします。振込み手数料は御社負担にてお願いします。
お客様の御支払い条件が60日以上の場合は御相談ください。
尚、初めてのお取引先や個人の場合、前払いをお願いすることもあります。ご了承のほど、お願いします。
データリソース社はどのような会社ですか?
当社は、世界各国の主要調査会社・レポート出版社と提携し、世界各国の市場調査レポートや技術動向レポートなどを日本国内の企業・公官庁及び教育研究機関に提供しております。
世界各国の「市場・技術・法規制などの」実情を調査・収集される時には、データリソース社にご相談ください。
お客様の御要望にあったデータや情報を抽出する為のレポート紹介や調査のアドバイスも致します。
|
|

