生物学的製剤の原薬製造サービス市場レポート:2023-2033
Biological Drug API Manufacturing Services Market Report 2023-2033
レポート詳細
生物学的製剤の原薬製造サービス市場レポート 2023-2033年 :本レポートは、業界とその基礎となる原動力をより良く理解することを望むなら、新たな収益ポケットを目指す大手企業にとっ... もっと見る
※上記価格は部署ライセンス(Departmental licence)価格です。
その他の価格についてはデータリソースまでお問合せください。
日本語のページは自動翻訳を利用し作成しています。
実際のレポートは英文のみでご納品いたします。
サマリー
レポート詳細
生物学的製剤の原薬製造サービス市場レポート 2023-2033年:本レポートは、業界とその基礎となる原動力をより良く理解することを望むなら、新たな収益ポケットを目指す大手企業にとって貴重なものとなるでしょう。異業種への進出や新規地域での既存事業の拡大を目指す企業にも有用です。
様々な疾患との闘いにおけるAPIのダイナミックな役割
API(医薬品原薬)は、がん、心血管疾患、糖尿病、感染症、鎮痛、呼吸器疾患など、さまざまな医療において重要な役割を果たしている。細菌やウイルス感染をターゲットとした医薬品の開発に大きく役立ち、治療ソリューションの進歩に貢献している。
感染症は世界的な死亡の主要原因であり、公衆衛生と経済発展に多大な影響を与えている。マラリアや結核のような病気における薬剤耐性株の出現や、殺虫剤耐性菌の出現は、より複雑な医療介入の必要性につながっている。こうした複雑さは、患者にとって経済的にも健康的にも永続的な意味を持つ。
これらの病気が世界の健康に及ぼす悪影響、抗菌薬に対する耐性菌の増加、有効な抗生物質の入手可能性の減少を考えると、革新的な企業は、これらの課題に対処するための新しい治療薬の発見と生産に注力せざるを得ない。
戦略的パートナーシップと提携
製薬業界におけるパートナーシップやコラボレーションは、生物学的製剤の原薬を製造するCMOに大きな成長の可能性をもたらす。製薬会社、大学、研究センターと戦略的パートナーシップを構築することで、リソースの共有、知識の共有、イノベーションを促進することができる。
CMOは、プロセス開発、最適化、スケールアップの専門知識を初期段階の提携に生かすことで、パートナーの医薬品開発期間の短縮を支援することができる。さらに、戦略的パートナーシップを通じて、独自のプラットフォーム、最先端技術、知的財産へのアクセスが可能になり、CMOの能力を向上させ、サービスの幅を広げることができる。
さらに、複数の製薬会社とコンソーシアムや提携を結ぶことで、CMOは顧客層を広げ、単一のパートナーへの依存度を下げ、共同研究開発のためのネットワークを構築することができる。生物学的製剤製造の分野では、協業的アプローチにより、双方に利益をもたらす形で資源、知識、リスクを共有し、革新と拡大を促進することができる。
市場調査レポートを購入する前にすべき質問とは?
- 生物学的製剤原薬製造サービス市場はどのように進化しているのか?
- 生物学的製剤原薬製造サービス市場を牽引する要因と阻害する要因は何か?
- 生物学的製剤原薬製造サービスの各サブマーケットセグメントは予測期間中にどのように成長し、これらのサブマーケットが2033年にどれくらいの収益を占めるようになるのか?
- 2023年から2033年にかけて、生物学的製剤原薬製造サービスの各サブマーケットの市場シェアはどのように推移するのか?
- 2023年から2033年にかけて市場全体を牽引する主な要因は何か?
- 主要な生物学的製剤原薬製造サービス市場はマクロ経済の動きに大枠で追随するのか、それとも個々の国内市場が他を凌駕するのか?
- 2033年までに各国市場のシェアはどのように変化し、2033年に市場をリードするのはどの地域か?
- 主要プレイヤーは誰で、予測期間中の見通しは?
- これらの大手企業の生物学的製剤原薬製造サービスプロジェクトとは?
- 2023年から2033年にかけて、業界はどのように進化するのか?生物学的製剤の原薬製造プロジェクトが
現在および今後10年間に実施される生物学的製剤の原薬製造プロジェクトはどのような意味を持つのか?
- 生物学的製剤の原薬製造サービス市場をさらに拡大するために、製品の商業化の必要性は高まっているか?
- 生物学的製剤の原薬製造サービス市場はどこへ向かい、どのようにすれば市場の最前線に立てるのか?
- 新製品やサービスラインに対する最適な投資オプションは何か?
- 企業を新たな成長軌道に乗せ、C-suiteに移行させるための重要な展望とは?
このことが生物学的製剤の原薬製造サービス市場に現在、そして今後10年間でどのような影響を与えるかを見極める必要がある:
- 261ページにわたる本レポートでは、89の表、135の図表を掲載しています。
- 本レポートは、業界における主要な有利分野にハイライトを当てているため、今すぐターゲットを絞ることができます。
- 世界、地域、国の売上と成長に関する詳細な分析が含まれています。
- 競合他社が成功した主なトレンド、変化、収益予測をハイライトしています。
本レポートは、生物学的製剤の原薬製造サービス市場が今後10年間でどのように発展するか、またCOVID-19の景気後退と好転の変動に合わせてどのように発展するかをお伝えします。この市場は、過去10年間のどの時点よりも今が重要である。
2033年までの予測やその他の分析から、商業的な展望が明らかになる
- 2033年までの収益予測に加え、直近の業績、成長率、市場シェアもご覧いただけます。
- ビジネスの展望と展開に関する独自の分析をご覧いただけます。
- 定性的分析(市場ダイナミクス、促進要因、機会、阻害要因など)、ポーターのファイブフォース分析、PEST分析、最近の動向をご覧いただけます。
本レポートには、COVID-19が業界と貴社にどのような影響を与えるかについてのデータ分析と貴重な洞察が含まれている。本レポートでは、COVID-19の4つの回収パターンとその影響、すなわち「V」、「L」、「W」、「U」について論じている。
レポート対象セグメント
製造タイプ
- アウトソーシング
- インハウス
用途
- ワクチン
- mAB
- インスリンアナログ製剤
- インターフェロン治療薬
- ヒト成長ホルモン
- その他
発現プラットフォーム
- 哺乳類細胞培養
- 微生物発酵
- その他
世界市場全体と各分野の収益予測に加え、5つの地域と22の主要国市場の収益予測も掲載している:
北米
- アメリカ
- カナダ
欧州
- ドイツ
- 英国
- フランス
- イタリア
- スペイン
- ロシア
- その他の欧州
アジア太平洋
- 日本
- 中国
- インド
- オーストラリア
- 韓国
- 東南アジア
- その他のアジア太平洋地域
ラテンアメリカ
- ブラジル
- メキシコ
- その他のラテンアメリカ
MEA
- GCC
- 南アフリカ
- その他のMEA
本レポートでは、生物学的製剤の原薬製造サービス市場の2023年から2033年にかけての主要企業のプロファイルも掲載している。
報告書に掲載されている主要企業
・ AbbVie Inc.
・ Boehringer Ingelheim International GmbH
・ Catalent, Inc.
・ Cytovance Biologics
・ FUJIFILM Diosynth Biotechnologies
・ Lonza
・ Piramal Pharma Solutions
・ Samsung Biologics
・ Thermo Fisher Scientific Inc.
生物学的製剤の原薬製造サービス市場全体の世界売上高(金額ベース)は、2023年に80億米ドルを突破する。2033年まで力強い収益成長を予測。当調査では、最も大きな可能性を秘めた組織を特定しています。彼らの能力、進歩、商業的展望を発見し、一歩先を行くお手伝いをします。
生物学的製剤の原薬製造サービス市場、2023-2033年レポートはどのようにお役に立つでしょうか?
要約すると、260ページを超えるこのレポートは、以下の知識を提供する:
- 生物学的製剤の原薬製造サービス市場の2023年から2033年までの収益予測、製造タイプ、用途、発現プラットフォームの各予測を世界レベルと地域レベルで掲載 - 業界の将来性を発見し、投資と収益に最も有利な場所を見つけることができます。
- 5つの地域と22の主要国市場の2033年までの収益予測 - 生物学的製剤の原薬製造サービス市場の2023年から2033年までの予測を北米、欧州、アジア太平洋、ラテンアメリカ、MEAでご覧いただけます。また、米国、カナダ、メキシコ、ブラジル、ドイツ、フランス、英国、イタリア、中国、インド、日本、オーストラリアなどの主要経済圏の市場も予測しています。
- 既存企業および市場参入を目指す企業の展望 - 生物学的製剤の原薬製造サービス市場に関わる主要企業10社の企業プロファイルを含む、2023年から2033年までの市場。
独自の予測による定量的・定性的分析をご覧ください。私たちのレポートだけに含まれる情報を入手し、貴重なビジネスインテリジェンスで情報を得ることができます。
他にはない情報
私たちの新しいレポートがあれば、知識に遅れをとったり、チャンスを逃したりする可能性が低くなります。弊社の調査レポートが貴社の調査、分析、意思決定にどのように役立つかをご覧ください。Visiongainの調査は、生物学的製剤の原薬製造サービス市場2023年から2033年、市場をリードする企業の商業分析を必要とするすべての人のためのものです。データ、トレンド、予測をご覧いただけます。
ページTOPに戻る
目次
目次
1 レポート概要
1.1 研究の目的
1.2 生物学的製剤の原薬製造サービス市場の紹介
1.3 本レポートの内容
1.4 本レポートを読むべき理由
1.5 本分析レポートが回答する主な質問は以下の通り
1.6 本レポートは誰のためのものか?
1.7 方法論
1.7.1 市場の定義
1.7.2 市場評価・予測手法
1.7.3 データの検証
1.8 よくある質問(FAQ)
1.9 関連レポート
1.10 Visiongainについて
2 エグゼクティブ・サマリー
3 市場概要
3.1 主要な調査結果
3.2 市場ダイナミクス
3.3 市場牽引要因
3.3.1 市場成長の原動力となる生物学的製剤の特許切れ
3.3.2 市場成長の原動力としてのアウトソーシング
3.3.3 希少医薬品への投資の増加
3.3.4 今後10年間でシングルユース技術が必須となる
3.4 市場抑制要因
3.4.1 生物製剤用原薬の製造が市場成長を抑制する
3.4.2 市場成長を阻害する価格圧力
3.4.3 市場成長を抑制する規制シナリオ
3.4.4 過剰生産が市場成長を阻害すると予測される
3.4.5 原薬生産は困難な課題である
3.5 市場機会
3.5.1 バイオプロセス技術の進歩
3.5.2 製造におけるカスタマイズと柔軟性
3.5.3 戦略的パートナーシップと提携
3.5.4 有利な成長機会を提供する新興経済国
3.6 SWOT分析
3.6.1 長所
3.6.2 弱点
3.6.3 機会
3.6.4 脅威
3.7 業界分析 ーPEST分析
3.7.1 政治的
3.7.2 経済
3.7.3 社会
3.7.4 技術的
3.8 ポーターのファイブフォース分析
3.8.1 サプライヤーの交渉力は低い
3.8.2 買い手の交渉力は中程度
3.8.3 老舗企業の存在により競争力は高い
3.8.4 代替品の脅威は中程度
3.8.5 新規参入企業の脅威は莫大な関連コストのため低い
3.9 COVID-19 影響分析
4 生物学的製剤の原薬製造サービス市場分析:製造タイプ別
4.1 主要な調査結果
4.2 製造タイプ別セグメント 市場魅力度指数
4.3 生物学的製剤原薬製造サービスの製造タイプ別市場規模推定と予測
4.4 外部委託
4.4.1 2023〜2033年の地域別市場予測(US$ Million, AGR %)
4.4.2 地域別市場シェア、2023年・2033年(%)
4.5 インハウス
4.5.1 2023~2033年の地域別市場予測(US$ Million, AGR %)
4.5.2 地域別市場シェア、2023年・2033年(%)
5 生物学的製剤原薬製造サービス市場分析:用途別
5.1 主要な調査結果
5.2 アプリケーションセグメント 市場魅力度指数
5.3 生物学的製剤原薬製造サービスの用途別市場規模の推定と予測
5.4 ワクチン
5.4.1 2023〜2033年の地域別市場予測(US$ Million, AGR %)
5.4.2 地域別市場シェア、2023年・2033年 (%)
5.5 mABs
5.5.1 2023~2033年の地域別市場予測(US$ Million, AGR %)
5.5.2 地域別市場シェア、2023年・2033年 (%)
5.6 インスリンアナログ製剤
5.6.1 2023~2033年の地域別市場予測(US$ Million, AGR %)
5.6.2 地域別市場シェア、2023年・2033年 (%)
5.7 インターフェロン治療薬
5.7.1 2023〜2033年の地域別市場予測(US$ Million, AGR %)
5.7.2 地域別市場シェア、2023年・2033年 (%)
5.8 ヒト成長ホルモン
5.8.1 2023~2033年の地域別市場予測(US$ Million, AGR %)
5.8.2 地域別市場シェア、2023年・2033年 (%)
5.9 その他
5.9.1 2023〜2033年の地域別市場予測(US$ Million, AGR %)
5.9.2 地域別市場シェア、2023年・2033年 (%)
6 生物学的製剤原薬製造サービス市場分析:発現プラットフォーム別
6.1 主要な調査結果
6.2 発現プラットフォームセグメント 市場魅力度指数
6.3 発現プラットフォーム別生物学的製剤原薬製造サービス市場規模の推定と予測
6.4 哺乳類細胞培養
6.4.1 2023〜2033年の地域別市場予測(US$ Million, AGR %)
6.4.2 地域別市場シェア、2023年・2033年(%)
6.5 微生物発酵
6.5.1 2023~2033年の地域別市場予測(US$ Million, AGR %)
6.5.2 地域別市場シェア、2023年・2033年(%)
6.6 その他
6.6.1 2023〜2033年の地域別市場予測(US$ Million, AGR %)
6.6.2 地域別市場シェア、2023年・2033年(%)
7 生物学的製剤原薬製造サービス市場分析:地域別
7.1 主要な調査結果
7.2 地域別市場規模の推定と予測
8 北米の生物医薬品原薬製造サービス市場分析
8.1 主要な調査結果
8.2 北米の生物学的製剤原薬製造サービス市場魅力度指数
8.3 北米の生物学的製剤原薬製造サービス市場の国別市場規模、2023年、2028年、2033年(US$ Million)
8.4 北米の生物学的製剤原薬製造サービス市場規模国別推定と予測
8.5 北米の生物学的製剤原薬製造サービス市場規模推定と予測:製造タイプ別
8.6 北米の生物学的製剤原薬製造サービス市場規模推定と予測:用途別
8.7 北米の生物学的製剤原薬製造サービス市場規模推定と予測:発現プラットフォーム別
8.8 米国の生物学的製剤原薬製造サービス市場分析
8.9 カナダの生物学的製剤原薬製造サービス市場分析
9 欧州の生物学的製剤原薬製造サービス市場分析
9.1 主要な調査結果
9.2 欧州の生物学的製剤原薬製造サービス市場魅力度指数
9.3 欧州の生物学的製剤原薬製造サービス市場の国別市場規模、2023年、2028年、2033年(US$ Million)
9.4 欧州の生物学的製剤原薬製造サービス市場規模国別推定と予測
9.5 欧州の生物学的製剤原薬製造サービス市場規模推定と予測:製造タイプ別
9.6 欧州の生物学的製剤原薬製造サービス市場規模推定と予測:用途別
9.7 欧州の生物学的製剤原薬製造サービス市場規模推定と予測:発現プラットフォーム別
9.8 ドイツの生物学的製剤原薬製造サービス市場分析
9.9 イギリスの生物学的製剤原薬製造サービス市場分析
9.10 フランスの生物学的製剤原薬製造サービス市場分析
9.11 イタリアの生物学的製剤原薬製造サービス市場分析
9.12 スペインの生物学的製剤原薬製造サービス市場分析
9.13 ロシアの生物学的製剤原薬製造サービス市場分析
9.14 その他の欧州の生物学的製剤原薬製造サービス市場分析
10 アジア太平洋地域の生物学的製剤原薬製造サービス市場分析
10.1 主要な調査結果
10.2 アジア太平洋地域の生物学的製剤原薬製造サービス市場魅力度指数
10.3 アジア太平洋地域の生物学的製剤原薬製造サービスの国別市場規模、2023年、2028年、2033年(US$ Million)
10.4 アジア太平洋地域の生物学的製剤原薬製造サービス市場規模推定と予測:国別
10.5 アジア太平洋地域の生物学的製剤原薬製造サービス市場規模推定と予測:製造タイプ別
10.6 アジア太平洋地域の生物学的製剤原薬製造サービス市場規模推定と予測:用途別
10.7 アジア太平洋地域の生物学的製剤原薬製造サービス市場規模推定と予測:発現プラットフォーム別
10.8 日本の生物学的製剤原薬製造サービス市場分析
10.9 中国の生物学的製剤原薬製造サービス市場分析
10.10 インドの生物学的製剤原薬製造サービス市場分析
10.11 オーストラリアの生物学的製剤原薬製造サービス市場分析
10.12 韓国の生物学的製剤原薬製造サービス市場分析
10.13 東南アジアの生物学的製剤原薬製造サービス市場分析
10.14 その他のアジア太平洋地域の生物学的製剤原薬製造サービス市場分析
11 ラテンアメリカの生物学的製剤原薬製造サービス市場分析
11.1 主要な調査結果
11.2 ラテンアメリカの生物学的製剤API製造サービス市場魅力度指数
11.3 ラテンアメリカの生物学的製剤原薬製造サービス市場の国別市場規模、2023年、2028年、2033年(US$ Million)
11.4 ラテンアメリカの生物学的製剤原薬製造サービス市場規模国別推定と予測
11.5 ラテンアメリカの生物学的製剤原薬製造サービス市場規模推定と予測:製造タイプ別
11.6 ラテンアメリカの生物学的製剤原薬製造サービス市場規模推定と予測:用途別
11.7 ラテンアメリカの生物学的製剤原薬製造サービス市場規模推定と予測::発現プラットフォーム別
11.8 ブラジルの生物学的製剤原薬製造サービス市場分析
11.9 メキシコの生物学的製剤API製造サービス市場分析
11.10 その他のラテンアメリカの生物学的製剤原薬製造サービス市場分析
12 MEAの生物学的製剤原薬製造サービス市場分析
12.1 主要な調査結果
12.2 MEA生物学的製剤原薬製造サービス市場魅力度指数
12.3 MEA生物学的製剤原薬製造サービスの国別市場規模、2023年、2028年、2033年 (US$ Million)
12.4 MEA生物学的製剤原薬製造サービス国別市場規模推定と予測
12.5 MEA生物学的製剤原薬製造サービス市場規模推定と予測:製造タイプ別
12.6 MEA生物学的製剤原薬製造サービス市場規模推定と予測:用途別
12.7 MEA生物学的製剤原薬製造サービス市場規模推定と予測:発現プラットフォーム別
12.8 GCCの生物学的製剤原薬製造サービス市場分析
12.9 南アフリカの生物学的製剤API製造サービス市場分析
12.10 その他のMEA生物学的製剤原薬製造サービス市場分析
13 企業のプロフィール
13.1 AbbVie Inc.
13.1.1 会社概要
13.1.2 会社概要
13.1.3 財務分析
13.1.4 サービスベンチマーク
13.1.5 戦略的展望
13.2 Lonza
13.2.1 会社概要
13.2.2 会社概要
13.2.3 財務分析
13.2.4 サービスベンチマーク
13.2.5 戦略的展望
13.3 Boehringer Ingelheim International GmbH
13.3.1 会社概要
13.3.2 会社概要
13.3.3 財務分析
13.3.4 サービスベンチマーク
13.3.5 戦略的展望
13.4 Catalent, Inc.
13.4.1 会社概要
13.4.2 会社概要
13.4.3 財務分析
13.4.4 サービス・ベンチマーク
13.4.5 戦略的展望
13.5 Piramal Pharma Solutions
13.5.1 会社概要
13.5.2 会社概要
13.5.3 サービス・ベンチマーク
13.5.4 戦略的展望
13.6 サイトバンス・バイオロジクス
13.6.1 会社概要
13.6.2 会社概要
13.6.3 Cytovance Biologics
13.6.4 戦略的展望
13.7 FUJIFILM Diosynth Biotechnologies
13.7.1 会社概要
13.7.2 会社概要
13.7.3 サービス・ベンチマーク
13.7.4 戦略的展望
13.8 Thermo Fisher Scientific Inc.
13.8.1 会社概要
13.8.2 会社概要
13.8.3 財務分析
13.8.4 サービスベンチマーク
13.8.5 戦略的展望
13.9 Samsung Biologics
13.9.1 会社概要
13.9.2 会社概要
13.9.3 サービス・ベンチマーク
13.9.4 戦略的展望
14 結論と提言
14.1 Visiongainの結論
14.2 市場プレイヤーへの提言
ページTOPに戻る
図表リスト
表の一覧
Table 1 Biological Drug API Manufacturing Services Market Snapshot, 2023 & 2033 (US$ Million, CAGR %)
Table 2 Biological Drug API Manufacturing Services Market Forecast by Region, 2023-2033 (US$ Million, AGR%, CAGR%): "V" Shaped Recovery
Table 3 Biological Drug API Manufacturing Services Market Forecast by Region, 2023-2033 (US$ Million, AGR%, CAGR%): "U" Shaped Recovery
Table 4 Biological Drug API Manufacturing Services Market Forecast by Region, 2023-2033 (US$ Million, AGR%, CAGR%): "W" Shaped Recovery
Table 5 Biological Drug API Manufacturing Services Market Forecast by Region, 2023-2033 (US$ Million, AGR%, CAGR%): "L" Shaped Recovery
Table 6 Biological Drug API Manufacturing Services Market Forecast by Manufacturing Type, 2023-2033 (US$ Million, AGR%, CAGR%)
Table 7 Outsourced Segment Market Forecast by Region, 2023-2033 (US$ Million, AGR%, CAGR%)
Table 8 In-house Segment Market Forecast by Region, 2023-2033 (US$ Million, AGR%, CAGR%)
Table 9 Biological Drug API Manufacturing Services Market Forecast by Application, 2023-2033 (US$ Million, AGR%, CAGR%)
Table 10 Vaccines Segment Market Forecast by Region, 2023-2033 (US$ Million, AGR%, CAGR%)
Table 11 mABs Segment Market Forecast by Region, 2023-2033 (US$ Million, AGR%, CAGR%)
Table 12 Insulin Analogues Segment Market Forecast by Region, 2023-2033 (US$ Million, AGR%, CAGR%)
Table 13 Interferon Therapies Segment Market Forecast by Region, 2023-2033 (US$ Million, AGR%, CAGR%)
Table 14 Human Growth Hormones Segment Market Forecast by Region, 2023-2033 (US$ Million, AGR%, CAGR%)
Table 15 Others Segment Market Forecast by Region, 2023-2033 (US$ Million, AGR%, CAGR%)
Table 16 Biological Drug API Manufacturing Services Market Forecast by Expression Platform, 2023-2033 (US$ Million, AGR%, CAGR%)
Table 17 Mammalian Cell Cultures Segment Market Forecast by Region, 2023-2033 (US$ Million, AGR%, CAGR%)
Table 18 Microbial Fermentations Segment Market Forecast by Region, 2023-2033 (US$ Million, AGR%, CAGR%)
Table 19 Others Segment Market Forecast by Region, 2023-2033 (US$ Million, AGR%, CAGR%)
Table 20 Biological Drug API Manufacturing Services Market Forecast by Region, 2023-2033 (US$ Million, AGR%, CAGR%)
Table 21 North America Biological Drug API Manufacturing Services Market Forecast by Country, 2023-2033 (US$ Million, AGR%, CAGR%)
Table 22 North America Biological Drug API Manufacturing Services Market Forecast by Manufacturing Type, 2023-2033 (US$ Million, AGR%, CAGR%)
Table 23 North America Biological Drug API Manufacturing Services Market Forecast by Application, 2023-2033 (US$ Million, AGR%, CAGR%)
Table 24 North America Biological Drug API Manufacturing Services Market Forecast by Expression Platform, 2023-2033 (US$ Million, AGR%, CAGR%)
Table 25 U.S. Biological Drug API Manufacturing Services Market Forecast, 2023-2033 (US$ Million, AGR%, CAGR%)
Table 26 Canada Biological Drug API Manufacturing Services Market Forecast, 2023-2033 (US$ Million, AGR%, CAGR%)
Table 27 Europe Biological Drug API Manufacturing Services Market Forecast by Country, 2023-2033 (US$ Million, AGR%, CAGR%)
Table 28 Europe Biological Drug API Manufacturing Services Market Forecast by Manufacturing Type, 2023-2033 (US$ Million, AGR%, CAGR%)
Table 29 Europe Biological Drug API Manufacturing Services Market Forecast by Application, 2023-2033 (US$ Million, AGR%, CAGR%)
Table 30 Europe Biological Drug API Manufacturing Services Market Forecast by Expression Platform, 2023-2033 (US$ Million, AGR%, CAGR%)
Table 31 Germany Biological Drug API Manufacturing Services Market Forecast, 2023-2033 (US$ Million, AGR%, CAGR%)
Table 32 UK Biological Drug API Manufacturing Services Market Forecast, 2023-2033 (US$ Million, AGR%, CAGR%)
Table 33 France Biological Drug API Manufacturing Services Market Forecast, 2023-2033 (US$ Million, AGR%, CAGR%)
Table 34 Italy Biological Drug API Manufacturing Services Market Forecast, 2023-2033 (US$ Million, AGR%, CAGR%)
Table 35 Spain Biological Drug API Manufacturing Services Market Forecast, 2023-2033 (US$ Million, AGR%, CAGR%)
Table 36 Russia Biological Drug API Manufacturing Services Market Forecast, 2023-2033 (US$ Million, AGR%, CAGR%)
Table 37 Rest of Europe Biological Drug API Manufacturing Services Market Forecast, 2023-2033 (US$ Million, AGR%, CAGR%)
Table 38 Asia Pacific Biological Drug API Manufacturing Services Market Forecast by Country, 2023-2033 (US$ Million, AGR%, CAGR%)
Table 39 Asia Pacific Biological Drug API Manufacturing Services Market Forecast by Manufacturing Type, 2023-2033 (US$ Million, AGR%, CAGR%)
Table 40 Asia Pacific Biological Drug API Manufacturing Services Market Forecast by Application, 2023-2033 (US$ Million, AGR%, CAGR%)
Table 41 Asia Pacific Biological Drug API Manufacturing Services Market Forecast by Expression Platform, 2023-2033 (US$ Million, AGR%, CAGR%)
Table 42 Japan Biological Drug API Manufacturing Services Market Forecast, 2023-2033 (US$ Million, AGR%, CAGR%)
Table 43 China Biological Drug API Manufacturing Services Market Forecast, 2023-2033 (US$ Million, AGR%, CAGR%)
Table 44 India Biological Drug API Manufacturing Services Market Forecast, 2023-2033 (US$ Million, AGR%, CAGR%)
Table 45 Australia Biological Drug API Manufacturing Services Market Forecast, 2023-2033 (US$ Million, AGR%, CAGR%)
Table 46 South Korea Biological Drug API Manufacturing Services Market Forecast, 2023-2033 (US$ Million, AGR%, CAGR%)
Table 47 South-East Asia Biological Drug API Manufacturing Services Market Forecast, 2023-2033 (US$ Million, AGR%, CAGR%)
Table 48 Rest of Asia Pacific Biological Drug API Manufacturing Services Market Forecast, 2023-2033 (US$ Million, AGR%, CAGR%)
Table 49 Latin America Biological Drug API Manufacturing Services Market Forecast by Country, 2023-2033 (US$ Million, AGR%, CAGR%)
Table 50 Latin America Biological Drug API Manufacturing Services Market Forecast by Manufacturing Type, 2023-2033 (US$ Million, AGR%, CAGR%)
Table 51 Latin America Biological Drug API Manufacturing Services Market Forecast by Application, 2023-2033 (US$ Million, AGR%, CAGR%)
Table 52 Latin America Biological Drug API Manufacturing Services Market Forecast by Expression Platform, 2023-2033 (US$ Million, AGR%, CAGR%)
Table 53 Brazil Biological Drug API Manufacturing Services Market Forecast, 2023-2033 (US$ Million, AGR%, CAGR%)
Table 54 Mexico Biological Drug API Manufacturing Services Market Forecast, 2023-2033 (US$ Million, AGR%, CAGR%)
Table 55 Rest of Latin America Biological Drug API Manufacturing Services Market Forecast, 2023-2033 (US$ Million, AGR%, CAGR%)
Table 56 MEA Biological Drug API Manufacturing Services Market Forecast by Country, 2023-2033 (US$ Million, AGR%, CAGR%)
Table 57 MEA Biological Drug API Manufacturing Services Market Forecast by Manufacturing Type, 2023-2033 (US$ Million, AGR%, CAGR%)
Table 58 MEA Biological Drug API Manufacturing Services Market Forecast by Application, 2023-2033 (US$ Million, AGR%, CAGR%)
Table 59 MEA Biological Drug API Manufacturing Services Market Forecast by Expression Platform, 2023-2033 (US$ Million, AGR%, CAGR%)
Table 60 GCC Biological Drug API Manufacturing Services Market Forecast, 2023-2033 (US$ Million, AGR%, CAGR%)
Table 61 South Africa Biological Drug API Manufacturing Services Market Forecast, 2023-2033 (US$ Million, AGR%, CAGR%)
Table 62 Rest of MEA Biological Drug API Manufacturing Services Market Forecast, 2023-2033 (US$ Million, AGR%, CAGR%)
Table 63 AbbVie Inc.: Key Details, (CEO, HQ, Revenue, Founded, No. of Employees, Company Type, Website, Business Segment)
Table 64 AbbVie, Inc.: Service Benchmarking
Table 65 AbbVie, Inc.: Strategic Outlook
Table 66 Lonza : Key Details, (CEO, HQ, Revenue, Founded, No. of Employees, Company Type, Website, Business Segment)
Table 67 Lonza: Service Benchmarking
Table 68 Lonza: Strategic Outlook
Table 69 Boehringer Ingelheim International GmbH: Key Details, (CEO, HQ, Revenue, Founded, No. of Employees, Company Type, Website, Business Segment)
Table 70 Boehringer Ingelheim GmbH: Service Benchmarking
Table 71 Boehringer Ingelheim International GmbH: Strategic Outlook
Table 72 Catalent, Inc. : Key Details, (CEO, HQ, Revenue, Founded, No. of Employees, Company Type, Website, Business Segment)
Table 73 Catalent, Inc: Service Benchmarking
Table 74 Catalent, Inc: Strategic Outlook
Table 75 Piramal Pharma Solutions: Key Details, (CEO, HQ, Revenue, Founded, No. of Employees, Company Type, Website, Business Segment)
Table 76 Piramal Pharma Solutions: Service Benchmarking
Table 77 Piramal Pharma Solutions: Strategic Outlook
Table 78 Cytovance Biologics: Key Details, (CEO, HQ, Revenue, Founded, No. of Employees, Company Type, Website, Business Segment)
Table 79 Cytovance Biologics: Service Benchmarking
Table 80 Cytovance Biologics: Strategic Outlook
Table 81 FUJIFILM Diosynth Biotechnologies: Key Details, (CEO, HQ, Revenue, Founded, No. of Employees, Company Type, Website, Business Segment)
Table 82 Fujifilm Diosynth Biotechnologies: Service Benchmarking
Table 83 FUJIFILM Diosynth Biotechnologies: Strategic Outlook
Table 84 Thermo Fisher Scientific Inc.: Key Details, (CEO, HQ, Revenue, Founded, No. of Employees, Company Type, Website, Business Segment)
Table 85 Thermo Fisher Scientific Inc.: Service Benchmarking
Table 86 Thermo Fisher Scientific Inc.: Strategic Outlook
Table 87 Samsung Biologics: Key Details, (CEO, HQ, Revenue, Founded, No. of Employees, Company Type, Website, Business Segment)
Table 88 Samsung Biologics: Service Benchmarking
Table 89 Samsung Biologics: Strategic Outlook
図の一覧
Figure 1 Biological Drug API Manufacturing Services Market Segmentation
Figure 2 Biological Drug API Manufacturing Services Market by Manufacturing Type: Market Attractiveness Index
Figure 3 Biological Drug API Manufacturing Services Market by Application: Market Attractiveness Index
Figure 4 Biological Drug API Manufacturing Services Market by Expression Platform: Market Attractiveness Index
Figure 5 Biological Drug API Manufacturing Services Market Attractiveness Index by Region
Figure 6 Biological Drug API Manufacturing Services Market: Market Dynamics
Figure 7 SWOT Analysis
Figure 8 PEST Analysis
Figure 9 Porter’s Five Forces Analysis
Figure 10 Biological Drug API Manufacturing Services Market by Region, 2023-2033 (US$ Million, AGR %): “V” Shaped Recovery
Figure 11 Biological Drug API Manufacturing Services Market by Region, 2023-2033 (US$ Million, AGR %): “U” Shaped Recovery
Figure 12 Biological Drug API Manufacturing Services Market by Region, 2023-2033 (US$ Million, AGR %): “W” Shaped Recovery
Figure 13 Biological Drug API Manufacturing Services Market by Region, 2023-2033 (US$ Million, AGR %): “L” Shaped Recovery
Figure 14 Biological Drug API Manufacturing Services Market Attractiveness Index by Manufacturing Type
Figure 15 Biological Drug API Manufacturing Services Market Forecast by Manufacturing Type, 2023-2033 (US$ Million, AGR %)
Figure 16 Biological Drug API Manufacturing Services Market Share Forecast by Manufacturing Type, 2023, 2028, 2033 (%)
Figure 17 Outsourced Segment Market Forecast by Region, 2023-2033 (US$ Million, AGR %)
Figure 18 Outsourced Segment Market Share Forecast by Region, 2023 & 2033 (%)
Figure 19 In-house Segment Market Forecast by Region, 2023-2033 (US$ Million, AGR %)
Figure 20 In-house Segment Market Share Forecast by Region, 2023 & 2033 (%)
Figure 21 Biological Drug API Manufacturing Services Market Attractiveness Index by Manufacturing Type
Figure 22 Biological Drug API Manufacturing Services Market Forecast by Application, 2023-2033 (US$ Million, AGR %)
Figure 23 Biological Drug API Manufacturing Services Market Share Forecast by Application, 2023, 2028, 2033 (%)
Figure 24 Vaccines Segment Market Forecast by Region, 2023-2033 (US$ Million, AGR %)
Figure 25 Vaccines Segment Market Share Forecast by Region, 2023 & 2033 (%)
Figure 26 mABs Segment Market Forecast by Region, 2023-2033 (US$ Million, AGR %)
Figure 27 mABs Segment Market Share Forecast by Region, 2023 & 2033 (%)
Figure 28 Insulin Analogues Segment Market Forecast by Region, 2023-2033 (US$ Million, AGR %)
Figure 29 Insulin Analogues Segment Market Share Forecast by Region, 2023 & 2033 (%)
Figure 30 Interferon Therapies Segment Market Forecast by Region, 2023-2033 (US$ Million, AGR %)
Figure 31 Interferon Therapies Segment Market Share Forecast by Region, 2023 & 2033 (%)
Figure 32 Human Growth Hormones Segment Market Forecast by Region, 2023-2033 (US$ Million, AGR %)
Figure 33 Human Growth Hormones Segment Market Share Forecast by Region, 2023 & 2033 (%)
Figure 34 Others Segment Market Forecast by Region, 2023-2033 (US$ Million, AGR %)
Figure 35 Others Segment Market Share Forecast by Region, 2023 & 2033 (%)
Figure 36 Biological Drug API Manufacturing Services Market Attractiveness Index by Expression Platform
Figure 37 Biological Drug API Manufacturing Services Market Forecast by Expression Platform, 2023-2033 (US$ Million, AGR %)
Figure 38 Biological Drug API Manufacturing Services Market Share Forecast by Expression Platform, 2023, 2028, 2033 (%)
Figure 39 Mammalian Cell Cultures Segment Market Forecast by Region, 2023-2033 (US$ Million, AGR %)
Figure 40 Mammalian Cell Cultures Segment Market Share Forecast by Region, 2023 & 2033 (%)
Figure 41 Microbial Fermentations Segment Market Forecast by Region, 2023-2033 (US$ Million, AGR %)
Figure 42 Microbial Fermentations Segment Market Share Forecast by Region, 2023 & 2033 (%)
Figure 43 Others Segment Market Forecast by Region, 2023-2033 (US$ Million, AGR %)
Figure 44 Others Segment Market Share Forecast by Region, 2023 & 2033 (%)
Figure 45 Biological Drug API Manufacturing Services Market Forecast by Region 2023, 2028, 2033 (Revenue, CAGR%)
Figure 46 Biological Drug API Manufacturing Services Market Share Forecast by Region 2023, 2028, 2033 (%)
Figure 47 Biological Drug API Manufacturing Services Market by Region, 2023-2033 (US$ Mn)
Figure 48 North America Biological Drug API Manufacturing Services Market Attractiveness Index
Figure 49 North America Biological Drug API Manufacturing Services Market by Region, 2023, 2028 & 2033 (US$ million)
Figure 50 North America Biological Drug API Manufacturing Services Market Forecast by Country, 2023-2033 (US$ million)
Figure 51 North America Biological Drug API Manufacturing Services Market Share Forecast by Country, 2023 & 2033 (%)
Figure 52 North America Biological Drug API Manufacturing Services Market Forecast by Manufacturing Type, 2023-2033 (US$ Million, AGR %)
Figure 53 North America Biological Drug API Manufacturing Services Market Share Forecast by Manufacturing Type, 2023 & 2033 (%)
Figure 54 North America Biological Drug API Manufacturing Services Market Forecast by Application, 2023-2033 (US$ Million, AGR %)
Figure 55 North America Biological Drug API Manufacturing Services Market Share Forecast by Application, 2023 & 2033 (%)
Figure 56 North America Biological Drug API Manufacturing Services Market Forecast by Expression Platform, 2023-2033 (US$ Million, AGR %)
Figure 57 North America Biological Drug API Manufacturing Services Market Share Forecast by Expression Platform, 2023 & 2033 (%)
Figure 58 U.S. Biological Drug API Manufacturing Services Market Forecast, 2023-2033 (US$ Million, AGR %)
Figure 59 Canada Biological Drug API Manufacturing Services Market Forecast, 2023-2033 (US$ Million, AGR %)
Figure 60 Europe Biological Drug API Manufacturing Services Market Attractiveness Index
Figure 61 Europe Biological Drug API Manufacturing Services Market by Region, 2023, 2028 & 2033 (US$ million)
Figure 62 Europe Biological Drug API Manufacturing Services Market Forecast by Country, 2023-2033 (US$ million)
Figure 63 Europe Biological Drug API Manufacturing Services Market Share Forecast by Country, 2023 & 2033 (%)
Figure 64 Europe Biological Drug API Manufacturing Services Market Forecast by Manufacturing Type, 2023-2033 (US$ Million, AGR %)
Figure 65 Europe Biological Drug API Manufacturing Services Market Share Forecast by Manufacturing Type, 2023 & 2033 (%)
Figure 66 Europe Biological Drug API Manufacturing Services Market Forecast by Application, 2023-2033 (US$ Million, AGR %)
Figure 67 Europe Biological Drug API Manufacturing Services Market Share Forecast by Application, 2023 & 2033 (%)
Figure 68 Europe Biological Drug API Manufacturing Services Market Forecast by Expression Platform, 2023-2033 (US$ Million, AGR %)
Figure 69 Europe Biological Drug API Manufacturing Services Market Share Forecast by Expression Platform, 2023 & 2033 (%)
Figure 70 Germany Biological Drug API Manufacturing Services Market Forecast, 2023-2033 (US$ Million, AGR %)
Figure 71 UK Biological Drug API Manufacturing Services Market Forecast, 2023-2033 (US$ Million, AGR %)
Figure 72 France Biological Drug API Manufacturing Services Market Forecast, 2023-2033 (US$ Million, AGR %)
Figure 73 Italy Biological Drug API Manufacturing Services Market Forecast, 2023-2033 (US$ Million, AGR %)
Figure 74 Spain Biological Drug API Manufacturing Services Market Forecast, 2023-2033 (US$ Million, AGR %)
Figure 75 Russia Biological Drug API Manufacturing Services Market Forecast, 2023-2033 (US$ Million, AGR %)
Figure 76 Rest of Europe Biological Drug API Manufacturing Services Market Forecast, 2023-2033 (US$ Million, AGR %)
Figure 77 Asia Pacific Biological Drug API Manufacturing Services Market Attractiveness Index
Figure 78 Asia Pacific Biological Drug API Manufacturing Services Market by Region, 2023, 2028 & 2033 (US$ million)
Figure 79 Asia Pacific Biological Drug API Manufacturing Services Market Forecast by Country, 2023-2033 (US$ million)
Figure 80 Asia Pacific Biological Drug API Manufacturing Services Market Share Forecast by Country, 2023 & 2033 (%)
Figure 81 Asia Pacific Biological Drug API Manufacturing Services Market Forecast by Manufacturing Type, 2023-2033 (US$ Million, AGR %)
Figure 82 Asia Pacific Biological Drug API Manufacturing Services Market Share Forecast by Manufacturing Type, 2023 & 2033 (%)
Figure 83 Asia Pacific Biological Drug API Manufacturing Services Market Forecast by Application, 2023-2033 (US$ Million, AGR %)
Figure 84 Asia Pacific Biological Drug API Manufacturing Services Market Share Forecast by Application, 2023 & 2033 (%)
Figure 85 Asia Pacific Biological Drug API Manufacturing Services Market Forecast by Expression Platform, 2023-2033 (US$ Million, AGR %)
Figure 86 Asia Pacific Biological Drug API Manufacturing Services Market Share Forecast by Expression Platform, 2023 & 2033 (%)
Figure 87 Japan Biological Drug API Manufacturing Services Market Forecast, 2023-2033 (US$ Million, AGR %)
Figure 88 China Biological Drug API Manufacturing Services Market Forecast, 2023-2033 (US$ Million, AGR %)
Figure 89 India Biological Drug API Manufacturing Services Market Forecast, 2023-2033 (US$ Million, AGR %)
Figure 90 Australia Biological Drug API Manufacturing Services Market Forecast, 2023-2033 (US$ Million, AGR %)
Figure 91 South Korea Biological Drug API Manufacturing Services Market Forecast, 2023-2033 (US$ Million, AGR %)
Figure 92 South East Asia Biological Drug API Manufacturing Services Market Forecast, 2023-2033 (US$ Million, AGR %)
Figure 93 Rest of Asia Pacific Biological Drug API Manufacturing Services Market Forecast, 2023-2033 (US$ Million, AGR %)
Figure 94 Latin America Biological Drug API Manufacturing Services Market Attractiveness Index
Figure 95 Latin America Biological Drug API Manufacturing Services Market by Region, 2023, 2028 & 2033 (US$ million)
Figure 96 Latin America Biological Drug API Manufacturing Services Market Forecast by Country, 2023-2033 (US$ million)
Figure 97 Latin America Biological Drug API Manufacturing Services Market Share Forecast by Country, 2023 & 2033 (%)
Figure 98 Latin America Biological Drug API Manufacturing Services Market Forecast by Manufacturing Type, 2023-2033 (US$ Million, AGR %)
Figure 99 Latin America Biological Drug API Manufacturing Services Market Share Forecast by Manufacturing Type, 2023 & 2033 (%)
Figure 100 Latin America Biological Drug API Manufacturing Services Market Forecast by Application, 2023-2033 (US$ Million, AGR %)
Figure 101 Latin America Biological Drug API Manufacturing Services Market Share Forecast by Application, 2023 & 2033 (%)
Figure 102 Latin America Biological Drug API Manufacturing Services Market Forecast by Expression Platform, 2023-2033 (US$ Million, AGR %)
Figure 103 Latin America Biological Drug API Manufacturing Services Market Share Forecast by Expression Platform, 2023 & 2033 (%)
Figure 104 Brazil Biological Drug API Manufacturing Services Market Forecast, 2023-2033 (US$ Million, AGR %)
Figure 105 Mexico Biological Drug API Manufacturing Services Market Forecast, 2023-2033 (US$ Million, AGR %)
Figure 106 Rest of Latin America Biological Drug API Manufacturing Services Market Forecast, 2023-2033 (US$ Million, AGR %)
Figure 107 MEA Biological Drug API Manufacturing Services Market Attractiveness Index
Figure 108 MEA Biological Drug API Manufacturing Services Market by Region, 2023, 2028 & 2033 (US$ million)
Figure 109 MEA Biological Drug API Manufacturing Services Market Forecast by Country, 2023-2033 (US$ million)
Figure 110 MEA Biological Drug API Manufacturing Services Market Share Forecast by Country, 2023 & 2033 (%)
Figure 111 MEA Biological Drug API Manufacturing Services Market Forecast by Manufacturing Type, 2023-2033 (US$ Million, AGR %)
Figure 112 MEA Biological Drug API Manufacturing Services Market Share Forecast by Manufacturing Type, 2023 & 2033 (%)
Figure 113 MEA Biological Drug API Manufacturing Services Market Forecast by Application, 2023-2033 (US$ Million, AGR %)
Figure 114 MEA Biological Drug API Manufacturing Services Market Share Forecast by Application, 2023 & 2033 (%)
Figure 115 MEA Biological Drug API Manufacturing Services Market Forecast by Expression Platform, 2023-2033 (US$ Million, AGR %)
Figure 116 MEA Biological Drug API Manufacturing Services Market Share Forecast by Expression Platform, 2023 & 2033 (%)
Figure 117 GCC Biological Drug API Manufacturing Services Market Forecast, 2023-2033 (US$ Million, AGR %)
Figure 118 South Africa Biological Drug API Manufacturing Services Market Forecast, 2023-2033 (US$ Million, AGR %)
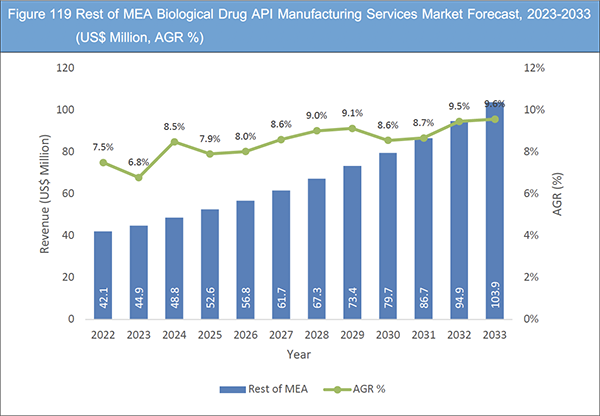
Figure 119 Rest of MEA Biological Drug API Manufacturing Services Market Forecast, 2023-2033 (US$ Million, AGR %)
Figure 120 AbbVie Inc.: Net Revenue, 2015-2022 (US$ Million, AGR %)
Figure 121 AbbVie Inc.: Regional Market Shares (%), 2022
Figure 122 AbbVie Inc.: R&D, 2015-2022 (US$ Million, AGR %)
Figure 123 Lonza : Net Revenue, 2015-2022 (US$ Million, AGR %)
Figure 124 Lonza : R&D, 2017-2021 (US$ Million, AGR %)
Figure 125 Lonza : Segment Market Shares, 2022
Figure 126 Lonza : Regional Market Shares, 2022
Figure 127 Boehringer Ingelheim International GmbH: Net Revenue, 2015-2022 (US$ Million, AGR %)
Figure 128 Boehringer Ingelheim International GmbH: Segment Market Shares, 2022
Figure 129 Boehringer Ingelheim International GmbH: Regional Market Shares, 2022
Figure 130 Catalent, Inc. : Net Revenue, 2015-2022 (US$ Million, AGR (%)
Figure 131 Catalent, Inc. : Segment Market Shares, 2022
Figure 132 Catalent, Inc. : Regional Market Shares, 2022
Figure 133 Thermo Fisher Scientific Inc.: Net Revenue, 2015-2022 (US$ million, AGR%)
Figure 134 Thermo Fisher Scientific Inc.: R&D, 2015-2022 (US$ million, AGR%)
Figure 135 Thermo Fisher Scientific Inc.: Regional Market Shares, 2022 (%)
ページTOPに戻る
Summary
Report Details
The Biological Drug API Manufacturing Services Market Report 2023-2033: This report will prove invaluable to leading firms striving for new revenue pockets if they wish to better understand the industry and its underlying dynamics. It will be useful for companies that would like to expand into different industries or to expand their existing operations in a new region.
Dynamic Role of APIs in Combatting Various Diseases
APIs (Active Pharmaceutical Ingredients) play a crucial role in various medical treatments, including cancer, cardiovascular disease, diabetes, infectious diseases, pain relief, and respiratory conditions. They significantly aid in the development of medications targeting bacterial and viral infections, contributing to advancements in therapeutic solutions.
Infectious diseases, a leading cause of global mortality, profoundly impact public health and economic progress. The emergence of drug-resistant strains in diseases like malaria and tuberculosis, along with insecticide-resistant organisms, has led to the necessity for more intricate medical interventions. These complexities have enduring financial and health implications for patients.
Given the adverse effects of these illnesses on worldwide health, the escalating resistance to antimicrobials, and the diminishing availability of effective antibiotics, innovative businesses are compelled to focus on discovering and producing new therapeutic medications to address these challenges.
Strategic Partnerships and Collaborations
Partnerships and collaborations within the pharmaceutical industry offer CMOs producing biological drug APIs substantial growth prospects. Creating strategic partnerships with pharmaceutical companies, universities, and research centres can encourage resource sharing, knowledge sharing, and innovation.
CMOs can help partners accelerate their drug development timelines by bringing their process development, optimisation, and scale-up expertise to early-stage collaborations. In addition, access to proprietary platforms, cutting-edge technologies, and intellectual property is made possible through strategic partnerships, which improve the CMO’s capabilities and broaden its range of services.
Additionally, by forming consortia or alliances with several pharmaceutical companies, CMOs can broaden their clientele, become less reliant on a single partner, and build a network for collaborative research and development. In the field of biological drug manufacturing, collaborative approaches enable the sharing of resources, knowledge, and risk in a way that benefits both parties and promotes innovation and expansion.
What Questions Should You Ask before Buying a Market Research Report?
• How is the biological drug API manufacturing services market evolving?
• What is driving and restraining the biological drug API manufacturing services market?
• How will each biological drug API manufacturing services submarket segment grow over the forecast period and how much revenue will these submarkets account for in 2033?
• How will the market shares for each biological drug API manufacturing services submarket develop from 2023 to 2033?
• What will be the main driver for the overall market from 2023 to 2033?
• Will leading biological drug API manufacturing services markets broadly follow the macroeconomic dynamics, or will individual national markets outperform others?
• How will the market shares of the national markets change by 2033 and which geographical region will lead the market in 2033?
• Who are the leading players and what are their prospects over the forecast period?
• What are the biological drug API manufacturing services projects for these leading companies?
• How will the industry evolve during the period between 2023 and 2033? What are the implications of
biological drug API manufacturing services projects taking place now and over the next 10 years?
• Is there a greater need for product commercialisation to further scale the biological drug API manufacturing services market?
• Where is the biological drug API manufacturing services market heading and how can you ensure you are at the forefront of the market?
• What are the best investment options for new product and service lines?
• What are the key prospects for moving companies into a new growth path and C-suite?
You need to discover how this will impact the biological drug API manufacturing services market today, and over the next 10 years:
• Our 261-page report provides 89 tables, 135 charts/graphs exclusively to you.
• The report highlights key lucrative areas in the industry so you can target them – NOW.
• It contains in-depth analysis of global, regional and national sales and growth.
• It highlights for you the key successful trends, changes and revenue projections made by your competitors.
This report tells you TODAY how the biological drug API manufacturing services market will develop in the next 10 years, and in line with the variations in COVID-19 economic recession and bounce. This market is more critical now than at any point over the last 10 years.
Forecasts to 2033 and other analyses reveal commercial prospects
• In addition to revenue forecasting to 2033, our new study provides you with recent results, growth rates, and market shares.
• You will find original analyses, with business outlooks and developments.
• Discover qualitative analyses (including market dynamics, drivers, opportunities, and restraints), Porter’s Five Forces Analysis, PEST Analysis and recent developments.
This report includes data analysis and invaluable insight into how COVID-19 will affect the industry and your company. Four COVID-19 recovery patterns and their impact, namely, “V”, “L”, “W” and “U” are discussed in this report.
Segments Covered in the Report
Manufacturing Type
• Outsourced
• In-house
Application
• Vaccines
• mABs
• Insulin Analogues
• Interferon Therapies
• Human Growth Hormones
• Others
Expression Platform
• Mammalian Cell Cultures
• Microbial Fermentations
• Others
In addition to the revenue predictions for the overall world market and segments, you will also find revenue forecasts for five regional and 22 leading national markets:
North America
• U.S.
• Canada
Europe
• Germany
• UK
• France
• Italy
• Spain
• Russia
• Rest of Europe
Asia Pacific
• Japan
• China
• India
• Australia
• South Korea
• South East Asia
• Rest of Asia Pacific
Latin America
• Brazil
• Mexico
• Rest of Latin America
MEA
• GCC
• South Africa
• Rest of MEA
The report also includes profiles and for some of the leading companies in the Biological Drug API Manufacturing Services Market, 2023 to 2033, with a focus on this segment of these companies’ operations.
Leading companies profiled in the report
• AbbVie Inc.
• Boehringer Ingelheim International GmbH
• Catalent, Inc.
• Cytovance Biologics
• FUJIFILM Diosynth Biotechnologies
• Lonza
• Piramal Pharma Solutions
• Samsung Biologics
• Thermo Fisher Scientific Inc.
Overall world revenue for Biological Drug API Manufacturing Services Market, 2023 to 2033 in terms of value the market will surpass US$8,000 million in 2023, our work calculates. We predict strong revenue growth through to 2033. Our work identifies which organizations hold the greatest potential. Discover their capabilities, progress, and commercial prospects, helping you stay ahead.
How will the Biological Drug API Manufacturing Services Market, 2023 to 2033 report help you?
In summary, our 260+ page report provides you with the following knowledge:
• Revenue forecasts to 2033 for Biological Drug API Manufacturing Services Market 2023 to 2033, with forecasts for manufacturing type, application and expression platform, each forecast at a global and regional level – discover the industry’s prospects, finding the most lucrative places for investments and revenues.
• Revenue forecasts to 2033 for five regional and 22 key national markets – See forecasts for the Biological Drug API Manufacturing Services Market, 2023 to 2033 market in North America, Europe, Asia-Pacific, Latin America, and MEA. Also forecasted is the market in the US, Canada, Mexico, Brazil, Germany, France, UK, Italy, China, India, Japan, and Australia among other prominent economies.
• Prospects for established firms and those seeking to enter the market – including company profiles for 10 of the major companies involved in the Biological Drug API Manufacturing Services Market, 2023 to 2033.
Find quantitative and qualitative analyses with independent predictions. Receive information that only our report contains, staying informed with invaluable business intelligence.
Information found nowhere else
With our new report, you are less likely to fall behind in knowledge or miss out on opportunities. See how our work could benefit your research, analyses, and decisions. Visiongain’s study is for everybody needing commercial analyses for the Biological Drug API Manufacturing Services Market 2023 to 2033, market-leading companies. You will find data, trends and predictions.
ページTOPに戻る
Table of Contents
Table of Contents
1 Report Overview
1.1 Objectives of the Study
1.2 Introduction to Biological Drug API Manufacturing Services Market
1.3 What This Report Delivers
1.4 Why You Should Read This Report
1.5 Key Questions Answered by This Analytical Report Include:
1.6 Who is This Report For?
1.7 Methodology
1.7.1 Market Definitions
1.7.2 Market Evaluation & Forecasting Methodology
1.7.3 Data Validation
1.8 Frequently Asked Questions (FAQs)
1.9 Associated Visiongain Reports
1.10 About Visiongain
2 Executive Summary
3 Market Overview
3.1 Key Findings
3.2 Market Dynamics
3.3 Market Driving Factors
3.3.1 Biological Patent Expirations to Fuel Market Growth
3.3.2 Outsourcing as a Driver for Market Growth
3.3.3 Growing Investments in Orphan Drugs
3.3.4 Single Use Technology will Become Essential Over the Next Decade
3.4 Market Restraining Factors
3.4.1 Manufacturing APIs for Biologics to Restrain Market Growth
3.4.2 Pricing Pressure to Impede Market Growth
3.4.3 Regulatory Scenarios to Restrain Market Growth
3.4.4 Excessive Production is Projected to Impede Market Growth
3.4.5 API Production is a Challenging Task
3.5 Market Opportunities
3.5.1 Advancements in Bioprocessing Techniques
3.5.2 Customisation and Flexibility in Manufacturing
3.5.3 Strategic Partnerships and Collaborations
3.5.4 Emerging Economies to Offer Lucrative Growth Opportunities
3.6 SWOT Analysis
3.6.1 Strengths
3.6.2 Weaknesses
3.6.3 Opportunities
3.6.4 Threats
3.7 Industry analysis – PEST Analysis
3.7.1 Political
3.7.2 Economical
3.7.3 Social
3.7.4 Technological
3.8 Porter’s Five Forces Analysis
3.8.1 Bargaining Power of Suppliers is Low
3.8.2 Bargaining Power of Buyers is Medium
3.8.3 Competitive Rivalry is High Due to Presence of Established Firms
3.8.4 Threat of Substitutes is Medium
3.8.5 Threat of New Entrants is Low Owing to Huge Associated Costs
3.9 COVID-19 Impact Analysis
4 Biological Drug API Manufacturing Services Market Analysis by Manufacturing Type
4.1 Key Findings
4.2 Manufacturing Type Segment: Market Attractiveness Index
4.3 Biological Drug API Manufacturing Services Market Size Estimation and Forecast by Manufacturing Type
4.4 Outsourced
4.4.1 Market Forecast by Region, 2023-2033 (US$ Million, AGR %)
4.4.2 Market Share by Region, 2023 & 2033 (%)
4.5 In-house
4.5.1 Market Forecast by Region, 2023-2033 (US$ Million, AGR %)
4.5.2 Market Share by Region, 2023 & 2033 (%)
5 Biological Drug API Manufacturing Services Market Analysis by Application
5.1 Key Findings
5.2 Application Segment: Market Attractiveness Index
5.3 Biological Drug API Manufacturing Services Market Size Estimation and Forecast by Application
5.4 Vaccines
5.4.1 Market Forecast by Region, 2023-2033 (US$ Million, AGR %)
5.4.2 Market Share by Region, 2023 & 2033 (%)
5.5 mABs
5.5.1 Market Forecast by Region, 2023-2033 (US$ Million, AGR %)
5.5.2 Market Share by Region, 2023 & 2033 (%)
5.6 Insulin Analogues
5.6.1 Market Forecast by Region, 2023-2033 (US$ Million, AGR %)
5.6.2 Market Share by Region, 2023 & 2033 (%)
5.7 Interferon Therapies
5.7.1 Market Forecast by Region, 2023-2033 (US$ Million, AGR %)
5.7.2 Market Share by Region, 2023 & 2033 (%)
5.8 Human Growth Hormones
5.8.1 Market Forecast by Region, 2023-2033 (US$ Million, AGR %)
5.8.2 Market Share by Region, 2023 & 2033 (%)
5.9 Others
5.9.1 Market Forecast by Region, 2023-2033 (US$ Million, AGR %)
5.9.2 Market Share by Region, 2023 & 2033 (%)
6 Biological Drug API Manufacturing Services Market Analysis by Expression Platform
6.1 Key Findings
6.2 Expression Platform Segment: Market Attractiveness Index
6.3 Biological Drug API Manufacturing Services Market Size Estimation and Forecast by Expression Platform
6.4 Mammalian Cell Cultures
6.4.1 Market Forecast by Region, 2023-2033 (US$ Million, AGR %)
6.4.2 Market Share by Region, 2023 & 2033 (%)
6.5 Microbial Fermentations
6.5.1 Market Forecast by Region, 2023-2033 (US$ Million, AGR %)
6.5.2 Market Share by Region, 2023 & 2033 (%)
6.6 Others
6.6.1 Market Forecast by Region, 2023-2033 (US$ Million, AGR %)
6.6.2 Market Share by Region, 2023 & 2033 (%)
7 Biological Drug API Manufacturing Services Market Analysis by Region
7.1 Key Findings
7.2 Regional Market Size Estimation and Forecast
8 North America Biological Drug API Manufacturing Services Market Analysis
8.1 Key Findings
8.2 North America Biological Drug API Manufacturing Services Market Attractiveness Index
8.3 North America Biological Drug API Manufacturing Services Market by Country, 2023, 2028 & 2033 (US$ Million)
8.4 North America Biological Drug API Manufacturing Services Market Size Estimation and Forecast by Country
8.5 North America Biological Drug API Manufacturing Services Market Size Estimation and Forecast by Manufacturing Type
8.6 North America Biological Drug API Manufacturing Services Market Size Estimation and Forecast by Application
8.7 North America Biological Drug API Manufacturing Services Market Size Estimation and Forecast by Expression Platform
8.8 U.S. Biological Drug API Manufacturing Services Market Analysis
8.9 Canada Biological Drug API Manufacturing Services Market Analysis
9 Europe Biological Drug API Manufacturing Services Market Analysis
9.1 Key Findings
9.2 Europe Biological Drug API Manufacturing Services Market Attractiveness Index
9.3 Europe Biological Drug API Manufacturing Services Market by Country, 2023, 2028 & 2033 (US$ Million)
9.4 Europe Biological Drug API Manufacturing Services Market Size Estimation and Forecast by Country
9.5 Europe Biological Drug API Manufacturing Services Market Size Estimation and Forecast by Manufacturing Type
9.6 Europe Biological Drug API Manufacturing Services Market Size Estimation and Forecast by Application
9.7 Europe Biological Drug API Manufacturing Services Market Size Estimation and Forecast by Expression Platform
9.8 Germany Biological Drug API Manufacturing Services Market Analysis
9.9 UK Biological Drug API Manufacturing Services Market Analysis
9.10 France Biological Drug API Manufacturing Services Market Analysis
9.11 Italy Biological Drug API Manufacturing Services Market Analysis
9.12 Spain Biological Drug API Manufacturing Services Market Analysis
9.13 Russia Biological Drug API Manufacturing Services Market Analysis
9.14 Rest of Europe Biological Drug API Manufacturing Services Market Analysis
10 Asia Pacific Biological Drug API Manufacturing Services Market Analysis
10.1 Key Findings
10.2 Asia Pacific Biological Drug API Manufacturing Services Market Attractiveness Index
10.3 Asia Pacific Biological Drug API Manufacturing Services Market by Country, 2023, 2028 & 2033 (US$ Million)
10.4 Asia Pacific Biological Drug API Manufacturing Services Market Size Estimation and Forecast by Country
10.5 Asia Pacific Biological Drug API Manufacturing Services Market Size Estimation and Forecast by Manufacturing Type
10.6 Asia Pacific Biological Drug API Manufacturing Services Market Size Estimation and Forecast by Application
10.7 Asia Pacific Biological Drug API Manufacturing Services Market Size Estimation and Forecast by Expression Platform
10.8 Japan Biological Drug API Manufacturing Services Market Analysis
10.9 China Biological Drug API Manufacturing Services Market Analysis
10.10 India Biological Drug API Manufacturing Services Market Analysis
10.11 Australia Biological Drug API Manufacturing Services Market Analysis
10.12 South Korea Biological Drug API Manufacturing Services Market Analysis
10.13 South East Asia Biological Drug API Manufacturing Services Market Analysis
10.14 Rest of Asia Pacific Biological Drug API Manufacturing Services Market Analysis
11 Latin America Biological Drug API Manufacturing Services Market Analysis
11.1 Key Findings
11.2 Latin America Biological Drug API Manufacturing Services Market Attractiveness Index
11.3 Latin America Biological Drug API Manufacturing Services Market by Country, 2023, 2028 & 2033 (US$ Million)
11.4 Latin America Biological Drug API Manufacturing Services Market Size Estimation and Forecast by Country
11.5 Latin America Biological Drug API Manufacturing Services Market Size Estimation and Forecast by Manufacturing Type
11.6 Latin America Biological Drug API Manufacturing Services Market Size Estimation and Forecast by Application
11.7 Latin America Biological Drug API Manufacturing Services Market Size Estimation and Forecast by Expression Platform
11.8 Brazil Biological Drug API Manufacturing Services Market Analysis
11.9 Mexico Biological Drug API Manufacturing Services Market Analysis
11.10 Rest of Latin America Biological Drug API Manufacturing Services Market Analysis
12 MEA Biological Drug API Manufacturing Services Market Analysis
12.1 Key Findings
12.2 MEA Biological Drug API Manufacturing Services Market Attractiveness Index
12.3 MEA Biological Drug API Manufacturing Services Market by Country, 2023, 2028 & 2033 (US$ Million)
12.4 MEA Biological Drug API Manufacturing Services Market Size Estimation and Forecast by Country
12.5 MEA Biological Drug API Manufacturing Services Market Size Estimation and Forecast by Manufacturing Type
12.6 MEA Biological Drug API Manufacturing Services Market Size Estimation and Forecast by Application
12.7 MEA Biological Drug API Manufacturing Services Market Size Estimation and Forecast by Expression Platform
12.8 GCC Biological Drug API Manufacturing Services Market Analysis
12.9 South Africa Biological Drug API Manufacturing Services Market Analysis
12.10 Rest of MEA Biological Drug API Manufacturing Services Market Analysis
13 Company Profiles
13.1 AbbVie Inc.
13.1.1 Company Snapshot
13.1.2 Company Overview
13.1.3 Financial Analysis
13.1.4 Service Benchmarking
13.1.5 Strategic Outlook
13.2 Lonza
13.2.1 Company Snapshot
13.2.2 Company Overview
13.2.3 Financial Analysis
13.2.4 Service Benchmarking
13.2.5 Strategic Outlook
13.3 Boehringer Ingelheim International GmbH
13.3.1 Company Snapshot
13.3.2 Company Overview
13.3.3 Financial Analysis
13.3.4 Service Benchmarking
13.3.5 Strategic Outlook
13.4 Catalent, Inc.
13.4.1 Company Snapshot
13.4.2 Company Overview
13.4.3 Financial Analysis
13.4.4 Service Benchmarking
13.4.5 Strategic Outlook
13.5 Piramal Pharma Solutions
13.5.1 Company Snapshot
13.5.2 Company Overview
13.5.3 Service Benchmarking
13.5.4 Strategic Outlook
13.6 Cytovance Biologics
13.6.1 Company Snapshot
13.6.2 Company Overview
13.6.3 Service Benchmarking
13.6.4 Strategic Outlook
13.7 FUJIFILM Diosynth Biotechnologies
13.7.1 Company Snapshot
13.7.2 Company Overview
13.7.3 Service Benchmarking
13.7.4 Strategic Outlook
13.8 Thermo Fisher Scientific Inc.
13.8.1 Company Snapshot
13.8.2 Company Overview
13.8.3 Financial Analysis
13.8.4 Service Benchmarking
13.8.5 Strategic Outlook
13.9 Samsung Biologics
13.9.1 Company Snapshot
13.9.2 Company Overview
13.9.3 Service Benchmarking
13.9.4 Strategic Outlook
14 Conclusion and Recommendations
14.1 Concluding Remarks from Visiongain
14.2 Recommendations for Market Players
ページTOPに戻る
List of Tables/Graphs
List of Tables
Table 1 Biological Drug API Manufacturing Services Market Snapshot, 2023 & 2033 (US$ Million, CAGR %)
Table 2 Biological Drug API Manufacturing Services Market Forecast by Region, 2023-2033 (US$ Million, AGR%, CAGR%): "V" Shaped Recovery
Table 3 Biological Drug API Manufacturing Services Market Forecast by Region, 2023-2033 (US$ Million, AGR%, CAGR%): "U" Shaped Recovery
Table 4 Biological Drug API Manufacturing Services Market Forecast by Region, 2023-2033 (US$ Million, AGR%, CAGR%): "W" Shaped Recovery
Table 5 Biological Drug API Manufacturing Services Market Forecast by Region, 2023-2033 (US$ Million, AGR%, CAGR%): "L" Shaped Recovery
Table 6 Biological Drug API Manufacturing Services Market Forecast by Manufacturing Type, 2023-2033 (US$ Million, AGR%, CAGR%)
Table 7 Outsourced Segment Market Forecast by Region, 2023-2033 (US$ Million, AGR%, CAGR%)
Table 8 In-house Segment Market Forecast by Region, 2023-2033 (US$ Million, AGR%, CAGR%)
Table 9 Biological Drug API Manufacturing Services Market Forecast by Application, 2023-2033 (US$ Million, AGR%, CAGR%)
Table 10 Vaccines Segment Market Forecast by Region, 2023-2033 (US$ Million, AGR%, CAGR%)
Table 11 mABs Segment Market Forecast by Region, 2023-2033 (US$ Million, AGR%, CAGR%)
Table 12 Insulin Analogues Segment Market Forecast by Region, 2023-2033 (US$ Million, AGR%, CAGR%)
Table 13 Interferon Therapies Segment Market Forecast by Region, 2023-2033 (US$ Million, AGR%, CAGR%)
Table 14 Human Growth Hormones Segment Market Forecast by Region, 2023-2033 (US$ Million, AGR%, CAGR%)
Table 15 Others Segment Market Forecast by Region, 2023-2033 (US$ Million, AGR%, CAGR%)
Table 16 Biological Drug API Manufacturing Services Market Forecast by Expression Platform, 2023-2033 (US$ Million, AGR%, CAGR%)
Table 17 Mammalian Cell Cultures Segment Market Forecast by Region, 2023-2033 (US$ Million, AGR%, CAGR%)
Table 18 Microbial Fermentations Segment Market Forecast by Region, 2023-2033 (US$ Million, AGR%, CAGR%)
Table 19 Others Segment Market Forecast by Region, 2023-2033 (US$ Million, AGR%, CAGR%)
Table 20 Biological Drug API Manufacturing Services Market Forecast by Region, 2023-2033 (US$ Million, AGR%, CAGR%)
Table 21 North America Biological Drug API Manufacturing Services Market Forecast by Country, 2023-2033 (US$ Million, AGR%, CAGR%)
Table 22 North America Biological Drug API Manufacturing Services Market Forecast by Manufacturing Type, 2023-2033 (US$ Million, AGR%, CAGR%)
Table 23 North America Biological Drug API Manufacturing Services Market Forecast by Application, 2023-2033 (US$ Million, AGR%, CAGR%)
Table 24 North America Biological Drug API Manufacturing Services Market Forecast by Expression Platform, 2023-2033 (US$ Million, AGR%, CAGR%)
Table 25 U.S. Biological Drug API Manufacturing Services Market Forecast, 2023-2033 (US$ Million, AGR%, CAGR%)
Table 26 Canada Biological Drug API Manufacturing Services Market Forecast, 2023-2033 (US$ Million, AGR%, CAGR%)
Table 27 Europe Biological Drug API Manufacturing Services Market Forecast by Country, 2023-2033 (US$ Million, AGR%, CAGR%)
Table 28 Europe Biological Drug API Manufacturing Services Market Forecast by Manufacturing Type, 2023-2033 (US$ Million, AGR%, CAGR%)
Table 29 Europe Biological Drug API Manufacturing Services Market Forecast by Application, 2023-2033 (US$ Million, AGR%, CAGR%)
Table 30 Europe Biological Drug API Manufacturing Services Market Forecast by Expression Platform, 2023-2033 (US$ Million, AGR%, CAGR%)
Table 31 Germany Biological Drug API Manufacturing Services Market Forecast, 2023-2033 (US$ Million, AGR%, CAGR%)
Table 32 UK Biological Drug API Manufacturing Services Market Forecast, 2023-2033 (US$ Million, AGR%, CAGR%)
Table 33 France Biological Drug API Manufacturing Services Market Forecast, 2023-2033 (US$ Million, AGR%, CAGR%)
Table 34 Italy Biological Drug API Manufacturing Services Market Forecast, 2023-2033 (US$ Million, AGR%, CAGR%)
Table 35 Spain Biological Drug API Manufacturing Services Market Forecast, 2023-2033 (US$ Million, AGR%, CAGR%)
Table 36 Russia Biological Drug API Manufacturing Services Market Forecast, 2023-2033 (US$ Million, AGR%, CAGR%)
Table 37 Rest of Europe Biological Drug API Manufacturing Services Market Forecast, 2023-2033 (US$ Million, AGR%, CAGR%)
Table 38 Asia Pacific Biological Drug API Manufacturing Services Market Forecast by Country, 2023-2033 (US$ Million, AGR%, CAGR%)
Table 39 Asia Pacific Biological Drug API Manufacturing Services Market Forecast by Manufacturing Type, 2023-2033 (US$ Million, AGR%, CAGR%)
Table 40 Asia Pacific Biological Drug API Manufacturing Services Market Forecast by Application, 2023-2033 (US$ Million, AGR%, CAGR%)
Table 41 Asia Pacific Biological Drug API Manufacturing Services Market Forecast by Expression Platform, 2023-2033 (US$ Million, AGR%, CAGR%)
Table 42 Japan Biological Drug API Manufacturing Services Market Forecast, 2023-2033 (US$ Million, AGR%, CAGR%)
Table 43 China Biological Drug API Manufacturing Services Market Forecast, 2023-2033 (US$ Million, AGR%, CAGR%)
Table 44 India Biological Drug API Manufacturing Services Market Forecast, 2023-2033 (US$ Million, AGR%, CAGR%)
Table 45 Australia Biological Drug API Manufacturing Services Market Forecast, 2023-2033 (US$ Million, AGR%, CAGR%)
Table 46 South Korea Biological Drug API Manufacturing Services Market Forecast, 2023-2033 (US$ Million, AGR%, CAGR%)
Table 47 South-East Asia Biological Drug API Manufacturing Services Market Forecast, 2023-2033 (US$ Million, AGR%, CAGR%)
Table 48 Rest of Asia Pacific Biological Drug API Manufacturing Services Market Forecast, 2023-2033 (US$ Million, AGR%, CAGR%)
Table 49 Latin America Biological Drug API Manufacturing Services Market Forecast by Country, 2023-2033 (US$ Million, AGR%, CAGR%)
Table 50 Latin America Biological Drug API Manufacturing Services Market Forecast by Manufacturing Type, 2023-2033 (US$ Million, AGR%, CAGR%)
Table 51 Latin America Biological Drug API Manufacturing Services Market Forecast by Application, 2023-2033 (US$ Million, AGR%, CAGR%)
Table 52 Latin America Biological Drug API Manufacturing Services Market Forecast by Expression Platform, 2023-2033 (US$ Million, AGR%, CAGR%)
Table 53 Brazil Biological Drug API Manufacturing Services Market Forecast, 2023-2033 (US$ Million, AGR%, CAGR%)
Table 54 Mexico Biological Drug API Manufacturing Services Market Forecast, 2023-2033 (US$ Million, AGR%, CAGR%)
Table 55 Rest of Latin America Biological Drug API Manufacturing Services Market Forecast, 2023-2033 (US$ Million, AGR%, CAGR%)
Table 56 MEA Biological Drug API Manufacturing Services Market Forecast by Country, 2023-2033 (US$ Million, AGR%, CAGR%)
Table 57 MEA Biological Drug API Manufacturing Services Market Forecast by Manufacturing Type, 2023-2033 (US$ Million, AGR%, CAGR%)
Table 58 MEA Biological Drug API Manufacturing Services Market Forecast by Application, 2023-2033 (US$ Million, AGR%, CAGR%)
Table 59 MEA Biological Drug API Manufacturing Services Market Forecast by Expression Platform, 2023-2033 (US$ Million, AGR%, CAGR%)
Table 60 GCC Biological Drug API Manufacturing Services Market Forecast, 2023-2033 (US$ Million, AGR%, CAGR%)
Table 61 South Africa Biological Drug API Manufacturing Services Market Forecast, 2023-2033 (US$ Million, AGR%, CAGR%)
Table 62 Rest of MEA Biological Drug API Manufacturing Services Market Forecast, 2023-2033 (US$ Million, AGR%, CAGR%)
Table 63 AbbVie Inc.: Key Details, (CEO, HQ, Revenue, Founded, No. of Employees, Company Type, Website, Business Segment)
Table 64 AbbVie, Inc.: Service Benchmarking
Table 65 AbbVie, Inc.: Strategic Outlook
Table 66 Lonza : Key Details, (CEO, HQ, Revenue, Founded, No. of Employees, Company Type, Website, Business Segment)
Table 67 Lonza: Service Benchmarking
Table 68 Lonza: Strategic Outlook
Table 69 Boehringer Ingelheim International GmbH: Key Details, (CEO, HQ, Revenue, Founded, No. of Employees, Company Type, Website, Business Segment)
Table 70 Boehringer Ingelheim GmbH: Service Benchmarking
Table 71 Boehringer Ingelheim International GmbH: Strategic Outlook
Table 72 Catalent, Inc. : Key Details, (CEO, HQ, Revenue, Founded, No. of Employees, Company Type, Website, Business Segment)
Table 73 Catalent, Inc: Service Benchmarking
Table 74 Catalent, Inc: Strategic Outlook
Table 75 Piramal Pharma Solutions: Key Details, (CEO, HQ, Revenue, Founded, No. of Employees, Company Type, Website, Business Segment)
Table 76 Piramal Pharma Solutions: Service Benchmarking
Table 77 Piramal Pharma Solutions: Strategic Outlook
Table 78 Cytovance Biologics: Key Details, (CEO, HQ, Revenue, Founded, No. of Employees, Company Type, Website, Business Segment)
Table 79 Cytovance Biologics: Service Benchmarking
Table 80 Cytovance Biologics: Strategic Outlook
Table 81 FUJIFILM Diosynth Biotechnologies: Key Details, (CEO, HQ, Revenue, Founded, No. of Employees, Company Type, Website, Business Segment)
Table 82 Fujifilm Diosynth Biotechnologies: Service Benchmarking
Table 83 FUJIFILM Diosynth Biotechnologies: Strategic Outlook
Table 84 Thermo Fisher Scientific Inc.: Key Details, (CEO, HQ, Revenue, Founded, No. of Employees, Company Type, Website, Business Segment)
Table 85 Thermo Fisher Scientific Inc.: Service Benchmarking
Table 86 Thermo Fisher Scientific Inc.: Strategic Outlook
Table 87 Samsung Biologics: Key Details, (CEO, HQ, Revenue, Founded, No. of Employees, Company Type, Website, Business Segment)
Table 88 Samsung Biologics: Service Benchmarking
Table 89 Samsung Biologics: Strategic Outlook
List of Figures
Figure 1 Biological Drug API Manufacturing Services Market Segmentation
Figure 2 Biological Drug API Manufacturing Services Market by Manufacturing Type: Market Attractiveness Index
Figure 3 Biological Drug API Manufacturing Services Market by Application: Market Attractiveness Index
Figure 4 Biological Drug API Manufacturing Services Market by Expression Platform: Market Attractiveness Index
Figure 5 Biological Drug API Manufacturing Services Market Attractiveness Index by Region
Figure 6 Biological Drug API Manufacturing Services Market: Market Dynamics
Figure 7 SWOT Analysis
Figure 8 PEST Analysis
Figure 9 Porter’s Five Forces Analysis
Figure 10 Biological Drug API Manufacturing Services Market by Region, 2023-2033 (US$ Million, AGR %): “V” Shaped Recovery
Figure 11 Biological Drug API Manufacturing Services Market by Region, 2023-2033 (US$ Million, AGR %): “U” Shaped Recovery
Figure 12 Biological Drug API Manufacturing Services Market by Region, 2023-2033 (US$ Million, AGR %): “W” Shaped Recovery
Figure 13 Biological Drug API Manufacturing Services Market by Region, 2023-2033 (US$ Million, AGR %): “L” Shaped Recovery
Figure 14 Biological Drug API Manufacturing Services Market Attractiveness Index by Manufacturing Type
Figure 15 Biological Drug API Manufacturing Services Market Forecast by Manufacturing Type, 2023-2033 (US$ Million, AGR %)
Figure 16 Biological Drug API Manufacturing Services Market Share Forecast by Manufacturing Type, 2023, 2028, 2033 (%)
Figure 17 Outsourced Segment Market Forecast by Region, 2023-2033 (US$ Million, AGR %)
Figure 18 Outsourced Segment Market Share Forecast by Region, 2023 & 2033 (%)
Figure 19 In-house Segment Market Forecast by Region, 2023-2033 (US$ Million, AGR %)
Figure 20 In-house Segment Market Share Forecast by Region, 2023 & 2033 (%)
Figure 21 Biological Drug API Manufacturing Services Market Attractiveness Index by Manufacturing Type
Figure 22 Biological Drug API Manufacturing Services Market Forecast by Application, 2023-2033 (US$ Million, AGR %)
Figure 23 Biological Drug API Manufacturing Services Market Share Forecast by Application, 2023, 2028, 2033 (%)
Figure 24 Vaccines Segment Market Forecast by Region, 2023-2033 (US$ Million, AGR %)
Figure 25 Vaccines Segment Market Share Forecast by Region, 2023 & 2033 (%)
Figure 26 mABs Segment Market Forecast by Region, 2023-2033 (US$ Million, AGR %)
Figure 27 mABs Segment Market Share Forecast by Region, 2023 & 2033 (%)
Figure 28 Insulin Analogues Segment Market Forecast by Region, 2023-2033 (US$ Million, AGR %)
Figure 29 Insulin Analogues Segment Market Share Forecast by Region, 2023 & 2033 (%)
Figure 30 Interferon Therapies Segment Market Forecast by Region, 2023-2033 (US$ Million, AGR %)
Figure 31 Interferon Therapies Segment Market Share Forecast by Region, 2023 & 2033 (%)
Figure 32 Human Growth Hormones Segment Market Forecast by Region, 2023-2033 (US$ Million, AGR %)
Figure 33 Human Growth Hormones Segment Market Share Forecast by Region, 2023 & 2033 (%)
Figure 34 Others Segment Market Forecast by Region, 2023-2033 (US$ Million, AGR %)
Figure 35 Others Segment Market Share Forecast by Region, 2023 & 2033 (%)
Figure 36 Biological Drug API Manufacturing Services Market Attractiveness Index by Expression Platform
Figure 37 Biological Drug API Manufacturing Services Market Forecast by Expression Platform, 2023-2033 (US$ Million, AGR %)
Figure 38 Biological Drug API Manufacturing Services Market Share Forecast by Expression Platform, 2023, 2028, 2033 (%)
Figure 39 Mammalian Cell Cultures Segment Market Forecast by Region, 2023-2033 (US$ Million, AGR %)
Figure 40 Mammalian Cell Cultures Segment Market Share Forecast by Region, 2023 & 2033 (%)
Figure 41 Microbial Fermentations Segment Market Forecast by Region, 2023-2033 (US$ Million, AGR %)
Figure 42 Microbial Fermentations Segment Market Share Forecast by Region, 2023 & 2033 (%)
Figure 43 Others Segment Market Forecast by Region, 2023-2033 (US$ Million, AGR %)
Figure 44 Others Segment Market Share Forecast by Region, 2023 & 2033 (%)
Figure 45 Biological Drug API Manufacturing Services Market Forecast by Region 2023, 2028, 2033 (Revenue, CAGR%)
Figure 46 Biological Drug API Manufacturing Services Market Share Forecast by Region 2023, 2028, 2033 (%)
Figure 47 Biological Drug API Manufacturing Services Market by Region, 2023-2033 (US$ Mn)
Figure 48 North America Biological Drug API Manufacturing Services Market Attractiveness Index
Figure 49 North America Biological Drug API Manufacturing Services Market by Region, 2023, 2028 & 2033 (US$ million)
Figure 50 North America Biological Drug API Manufacturing Services Market Forecast by Country, 2023-2033 (US$ million)
Figure 51 North America Biological Drug API Manufacturing Services Market Share Forecast by Country, 2023 & 2033 (%)
Figure 52 North America Biological Drug API Manufacturing Services Market Forecast by Manufacturing Type, 2023-2033 (US$ Million, AGR %)
Figure 53 North America Biological Drug API Manufacturing Services Market Share Forecast by Manufacturing Type, 2023 & 2033 (%)
Figure 54 North America Biological Drug API Manufacturing Services Market Forecast by Application, 2023-2033 (US$ Million, AGR %)
Figure 55 North America Biological Drug API Manufacturing Services Market Share Forecast by Application, 2023 & 2033 (%)
Figure 56 North America Biological Drug API Manufacturing Services Market Forecast by Expression Platform, 2023-2033 (US$ Million, AGR %)
Figure 57 North America Biological Drug API Manufacturing Services Market Share Forecast by Expression Platform, 2023 & 2033 (%)
Figure 58 U.S. Biological Drug API Manufacturing Services Market Forecast, 2023-2033 (US$ Million, AGR %)
Figure 59 Canada Biological Drug API Manufacturing Services Market Forecast, 2023-2033 (US$ Million, AGR %)
Figure 60 Europe Biological Drug API Manufacturing Services Market Attractiveness Index
Figure 61 Europe Biological Drug API Manufacturing Services Market by Region, 2023, 2028 & 2033 (US$ million)
Figure 62 Europe Biological Drug API Manufacturing Services Market Forecast by Country, 2023-2033 (US$ million)
Figure 63 Europe Biological Drug API Manufacturing Services Market Share Forecast by Country, 2023 & 2033 (%)
Figure 64 Europe Biological Drug API Manufacturing Services Market Forecast by Manufacturing Type, 2023-2033 (US$ Million, AGR %)
Figure 65 Europe Biological Drug API Manufacturing Services Market Share Forecast by Manufacturing Type, 2023 & 2033 (%)
Figure 66 Europe Biological Drug API Manufacturing Services Market Forecast by Application, 2023-2033 (US$ Million, AGR %)
Figure 67 Europe Biological Drug API Manufacturing Services Market Share Forecast by Application, 2023 & 2033 (%)
Figure 68 Europe Biological Drug API Manufacturing Services Market Forecast by Expression Platform, 2023-2033 (US$ Million, AGR %)
Figure 69 Europe Biological Drug API Manufacturing Services Market Share Forecast by Expression Platform, 2023 & 2033 (%)
Figure 70 Germany Biological Drug API Manufacturing Services Market Forecast, 2023-2033 (US$ Million, AGR %)
Figure 71 UK Biological Drug API Manufacturing Services Market Forecast, 2023-2033 (US$ Million, AGR %)
Figure 72 France Biological Drug API Manufacturing Services Market Forecast, 2023-2033 (US$ Million, AGR %)
Figure 73 Italy Biological Drug API Manufacturing Services Market Forecast, 2023-2033 (US$ Million, AGR %)
Figure 74 Spain Biological Drug API Manufacturing Services Market Forecast, 2023-2033 (US$ Million, AGR %)
Figure 75 Russia Biological Drug API Manufacturing Services Market Forecast, 2023-2033 (US$ Million, AGR %)
Figure 76 Rest of Europe Biological Drug API Manufacturing Services Market Forecast, 2023-2033 (US$ Million, AGR %)
Figure 77 Asia Pacific Biological Drug API Manufacturing Services Market Attractiveness Index
Figure 78 Asia Pacific Biological Drug API Manufacturing Services Market by Region, 2023, 2028 & 2033 (US$ million)
Figure 79 Asia Pacific Biological Drug API Manufacturing Services Market Forecast by Country, 2023-2033 (US$ million)
Figure 80 Asia Pacific Biological Drug API Manufacturing Services Market Share Forecast by Country, 2023 & 2033 (%)
Figure 81 Asia Pacific Biological Drug API Manufacturing Services Market Forecast by Manufacturing Type, 2023-2033 (US$ Million, AGR %)
Figure 82 Asia Pacific Biological Drug API Manufacturing Services Market Share Forecast by Manufacturing Type, 2023 & 2033 (%)
Figure 83 Asia Pacific Biological Drug API Manufacturing Services Market Forecast by Application, 2023-2033 (US$ Million, AGR %)
Figure 84 Asia Pacific Biological Drug API Manufacturing Services Market Share Forecast by Application, 2023 & 2033 (%)
Figure 85 Asia Pacific Biological Drug API Manufacturing Services Market Forecast by Expression Platform, 2023-2033 (US$ Million, AGR %)
Figure 86 Asia Pacific Biological Drug API Manufacturing Services Market Share Forecast by Expression Platform, 2023 & 2033 (%)
Figure 87 Japan Biological Drug API Manufacturing Services Market Forecast, 2023-2033 (US$ Million, AGR %)
Figure 88 China Biological Drug API Manufacturing Services Market Forecast, 2023-2033 (US$ Million, AGR %)
Figure 89 India Biological Drug API Manufacturing Services Market Forecast, 2023-2033 (US$ Million, AGR %)
Figure 90 Australia Biological Drug API Manufacturing Services Market Forecast, 2023-2033 (US$ Million, AGR %)
Figure 91 South Korea Biological Drug API Manufacturing Services Market Forecast, 2023-2033 (US$ Million, AGR %)
Figure 92 South East Asia Biological Drug API Manufacturing Services Market Forecast, 2023-2033 (US$ Million, AGR %)
Figure 93 Rest of Asia Pacific Biological Drug API Manufacturing Services Market Forecast, 2023-2033 (US$ Million, AGR %)
Figure 94 Latin America Biological Drug API Manufacturing Services Market Attractiveness Index
Figure 95 Latin America Biological Drug API Manufacturing Services Market by Region, 2023, 2028 & 2033 (US$ million)
Figure 96 Latin America Biological Drug API Manufacturing Services Market Forecast by Country, 2023-2033 (US$ million)
Figure 97 Latin America Biological Drug API Manufacturing Services Market Share Forecast by Country, 2023 & 2033 (%)
Figure 98 Latin America Biological Drug API Manufacturing Services Market Forecast by Manufacturing Type, 2023-2033 (US$ Million, AGR %)
Figure 99 Latin America Biological Drug API Manufacturing Services Market Share Forecast by Manufacturing Type, 2023 & 2033 (%)
Figure 100 Latin America Biological Drug API Manufacturing Services Market Forecast by Application, 2023-2033 (US$ Million, AGR %)
Figure 101 Latin America Biological Drug API Manufacturing Services Market Share Forecast by Application, 2023 & 2033 (%)
Figure 102 Latin America Biological Drug API Manufacturing Services Market Forecast by Expression Platform, 2023-2033 (US$ Million, AGR %)
Figure 103 Latin America Biological Drug API Manufacturing Services Market Share Forecast by Expression Platform, 2023 & 2033 (%)
Figure 104 Brazil Biological Drug API Manufacturing Services Market Forecast, 2023-2033 (US$ Million, AGR %)
Figure 105 Mexico Biological Drug API Manufacturing Services Market Forecast, 2023-2033 (US$ Million, AGR %)
Figure 106 Rest of Latin America Biological Drug API Manufacturing Services Market Forecast, 2023-2033 (US$ Million, AGR %)
Figure 107 MEA Biological Drug API Manufacturing Services Market Attractiveness Index
Figure 108 MEA Biological Drug API Manufacturing Services Market by Region, 2023, 2028 & 2033 (US$ million)
Figure 109 MEA Biological Drug API Manufacturing Services Market Forecast by Country, 2023-2033 (US$ million)
Figure 110 MEA Biological Drug API Manufacturing Services Market Share Forecast by Country, 2023 & 2033 (%)
Figure 111 MEA Biological Drug API Manufacturing Services Market Forecast by Manufacturing Type, 2023-2033 (US$ Million, AGR %)
Figure 112 MEA Biological Drug API Manufacturing Services Market Share Forecast by Manufacturing Type, 2023 & 2033 (%)
Figure 113 MEA Biological Drug API Manufacturing Services Market Forecast by Application, 2023-2033 (US$ Million, AGR %)
Figure 114 MEA Biological Drug API Manufacturing Services Market Share Forecast by Application, 2023 & 2033 (%)
Figure 115 MEA Biological Drug API Manufacturing Services Market Forecast by Expression Platform, 2023-2033 (US$ Million, AGR %)
Figure 116 MEA Biological Drug API Manufacturing Services Market Share Forecast by Expression Platform, 2023 & 2033 (%)
Figure 117 GCC Biological Drug API Manufacturing Services Market Forecast, 2023-2033 (US$ Million, AGR %)
Figure 118 South Africa Biological Drug API Manufacturing Services Market Forecast, 2023-2033 (US$ Million, AGR %)
Figure 119 Rest of MEA Biological Drug API Manufacturing Services Market Forecast, 2023-2033 (US$ Million, AGR %)
Figure 120 AbbVie Inc.: Net Revenue, 2015-2022 (US$ Million, AGR %)
Figure 121 AbbVie Inc.: Regional Market Shares (%), 2022
Figure 122 AbbVie Inc.: R&D, 2015-2022 (US$ Million, AGR %)
Figure 123 Lonza : Net Revenue, 2015-2022 (US$ Million, AGR %)
Figure 124 Lonza : R&D, 2017-2021 (US$ Million, AGR %)
Figure 125 Lonza : Segment Market Shares, 2022
Figure 126 Lonza : Regional Market Shares, 2022
Figure 127 Boehringer Ingelheim International GmbH: Net Revenue, 2015-2022 (US$ Million, AGR %)
Figure 128 Boehringer Ingelheim International GmbH: Segment Market Shares, 2022
Figure 129 Boehringer Ingelheim International GmbH: Regional Market Shares, 2022
Figure 130 Catalent, Inc. : Net Revenue, 2015-2022 (US$ Million, AGR (%)
Figure 131 Catalent, Inc. : Segment Market Shares, 2022
Figure 132 Catalent, Inc. : Regional Market Shares, 2022
Figure 133 Thermo Fisher Scientific Inc.: Net Revenue, 2015-2022 (US$ million, AGR%)
Figure 134 Thermo Fisher Scientific Inc.: R&D, 2015-2022 (US$ million, AGR%)
Figure 135 Thermo Fisher Scientific Inc.: Regional Market Shares, 2022 (%)
ページTOPに戻る
本レポートと同分野(生化学的薬物)の最新刊レポート
Visiongain社のヘルスケアと医薬・化学品分野での最新刊レポート
本レポートと同じKEY WORD(drug)の最新刊レポート
-
Global Biosimulation Market (2022 Edition) – Analysis By Component (Software, Service), Application (Drug Discovery, Pre-Clinical, Clinical), End-User, By Region, By Country: Market Insights and Forecast (2018-2028)
-
組換えタンパク質市場:製品(成長因子、ケモカイン、構造タンパク質、膜タンパク質)、用途(創薬・開発、バイオ医薬品生産、研究、診断)、エンドユーザー(バイオテクノロジー、CRO)別 - 2027年までの世界予測
-
遺伝子編集市場:技術別(亜鉛フィンガーヌクレアーゼ(ZFNs)、転写活性化因子様エフェクターベースヌクレアーゼ(TALENs)、CRISPR-Cas9遺伝子編集、制限酵素、その他)、用途別(遺伝子編集、細胞ラインエンジニアリング、動物遺伝子工学、植物遺伝子工学、薬剤開発、その他)、エンドユーザー別(バイオテクノロジーおよび製薬会社、学術・政府研究機関、契約研究機関)。世界の機会分析および産業予測、2021-2031年
-
血友病治療市場:タイプ別(血友病A、血友病B)、薬物療法別(遺伝子組換え凝固因子濃縮療法、血漿由来凝固因子濃縮療法、非因子補充療法、その他)。世界の機会分析および産業予測、2021-2031年
-
インスリン製剤とデリバリー技術の世界市場
-
Saudi Arabia Telepathology Services Market, By System (Static Image Based Systems, Virtual Slide Systems, Real-Time Systems), By Application (Teleconsultation, Disease Diagnosis, Drug Discovery & Training, Others), By End User (Pharmaceutical & Biotechnology Companies, Hospitals & Diagnostic Laboratories, Academic & Government Research Institutes), By Region, Competition Forecast & Opportunities, 2027
-
バイオシミュレーション市場の規模、シェア、動向分析レポート:製品別(ソフトウェア、サービス)、用途別(医薬品開発、創薬)、エンドユーザー別、地域別、セグメント別予測、2022年〜2030年
-
皮下注射針市場セグメント化されています。製品別(安全皮下注射針、非安全皮下注射針)、用途別(ドラッグデリバリー、ワクチン接種、血液検体採取)、エンドユーザー別(病院、糖尿病患者、家庭医、精神科、その他)、地域別 - 2019-2021年の市場規模、シェア&トレンド、2031年までの予測などグローバルな分析が可能
-
分子モデリング市場。セグメント別:用途別(創薬、薬剤開発、その他)、製品タイプ別(ソフトウェア、サービス)、地域別 - 2019-2020年の市場規模、シェア、トレンドの世界分析、2031年までの予測
-
経皮薬物送達システム市場:送達システムタイプ別(パッシブ、アクティブ)、用途別(鎮痛剤、ホルモン補充療法、高血圧症、乗り物酔い、禁煙、その他)。世界の機会分析および産業予測、2020-2030年
よくあるご質問
Visiongain社はどのような調査会社ですか?
英国の調査会社ヴィジョンゲイン社(Visiongain)は、通信とエネルギーのほか、自動車や化学・医薬品、金属など、広範な市場を対象に調査を行っています。自動車市場については、市場全般に関する調査のほ... もっと見る
調査レポートの納品までの日数はどの程度ですか?
在庫のあるものは速納となりますが、平均的には 3-4日と見て下さい。
但し、一部の調査レポートでは、発注を受けた段階で内容更新をして納品をする場合もあります。
発注をする前のお問合せをお願いします。
注文の手続きはどのようになっていますか?
1)お客様からの御問い合わせをいただきます。
2)見積書やサンプルの提示をいたします。
3)お客様指定、もしくは弊社の発注書をメール添付にて発送してください。
4)データリソース社からレポート発行元の調査会社へ納品手配します。
5) 調査会社からお客様へ納品されます。最近は、pdfにてのメール納品が大半です。
お支払方法の方法はどのようになっていますか?
納品と同時にデータリソース社よりお客様へ請求書(必要に応じて納品書も)を発送いたします。
お客様よりデータリソース社へ(通常は円払い)の御振り込みをお願いします。
請求書は、納品日の日付で発行しますので、翌月最終営業日までの当社指定口座への振込みをお願いします。振込み手数料は御社負担にてお願いします。
お客様の御支払い条件が60日以上の場合は御相談ください。
尚、初めてのお取引先や個人の場合、前払いをお願いすることもあります。ご了承のほど、お願いします。
データリソース社はどのような会社ですか?
当社は、世界各国の主要調査会社・レポート出版社と提携し、世界各国の市場調査レポートや技術動向レポートなどを日本国内の企業・公官庁及び教育研究機関に提供しております。
世界各国の「市場・技術・法規制などの」実情を調査・収集される時には、データリソース社にご相談ください。
お客様の御要望にあったデータや情報を抽出する為のレポート紹介や調査のアドバイスも致します。
|
|

