タイヤ由来燃料(TDF)市場レポート:2024-2034
Tire Derived Fuel (TDF) Market Report 2024-2034
レポート詳細
タイヤ由来燃料(TDF)市場レポート 2024-2034年 :本レポートは、業界とその基礎となる原動力をより良く理解したいと望むならば、新たな収益ポケットを目指す大手企業にとって貴重なも... もっと見る
※上記価格は部署ライセンス(Departmental licence)価格です。
その他の価格についてはデータリソースまでお問合せください。
日本語のページは自動翻訳を利用し作成しています。
実際のレポートは英文のみでご納品いたします。
サマリー
レポート詳細
タイヤ由来燃料(TDF)市場レポート 2024-2034年:本レポートは、業界とその基礎となる原動力をより良く理解したいと望むならば、新たな収益ポケットを目指す大手企業にとって貴重なものとなるでしょう。異業種への進出や新地域での既存事業の拡大を目指す企業にも有用です。
社会的認識と企業の持続可能性への取り組み
環境問題や企業の持続可能性への取り組みに対する社会の意識の高まりが、TDFの採用を後押ししている。消費者も企業も、自分たちの活動が環境に与える影響についてますます意識するようになっている。TDFを事業に取り入れている企業は、持続可能な慣行へのコミットメントを示し、企業イメージを高めている。ミシュランのような大手企業は、タイヤのリサイクルやTDFの取り組みに積極的に参加し、世界的な持続可能性の目標に沿い、タイヤ由来燃料の成長のための前向きな市場環境を促進している。
再生可能エネルギー源とよりクリーンな生産方法への世界的シフト
再生可能エネルギー源とよりクリーンな生産方法への世界的なシフトがTDF市場の成長を支えている。産業界がカーボンフットプリントの削減を目指す中、TDFは再生可能で低炭素なエネルギー源として浮上している。これは、持続可能な実践を重視する再生可能エネルギー転換の目的に合致している。デンマークのような国々では、TDFは再生可能エネルギー・ミックスに貢献し、従来の化石燃料と、よりクリーンで持続可能なエネルギーの未来との架け橋となっている。
市場調査レポートを購入する前にすべき質問とは?
- タイヤ由来燃料(TDF)市場はどのように進化しているのか?
- タイヤ由来燃料(TDF)市場の促進要因と抑制要因は何か?
- タイヤ由来燃料(TDF)サブマーケットの各セグメントは予測期間中にどのように成長し、2034年にはどれくらいの売上を占めるようになるのか?
- 2024年から2034年にかけて、各タイヤ由来燃料(TDF)サブマーケットの市場シェアはどのように推移するのか?
- 2024年から2034年までの市場全体の主な牽引役は何か?
- 主要なタイヤ由来燃料(TDF)市場はマクロ経済の動きに概ね追随するのか、それとも個々の国市場が他を凌駕するのか?
- 2034年までに各国市場のシェアはどのように変化し、2034年にはどの地域が市場をリードするのか?
- 主要プレーヤーは誰で、予測期間中の見通しは?
- これらの大手企業のタイヤ由来燃料(TDF)プロジェクトは?
- 2024年から2034年の間に、業界はどのように発展していくのか?現在および今後10年間のタイヤ由来燃料(TDF)プロジェクトにはどのような意味があるのか?
- タイヤ由来燃料(TDF)市場をさらに拡大するために、製品の商業化の必要性は高まっているか?
- タイヤ由来燃料(TDF)市場はどこに向かっているのか、そしてどのようにすれば市場の最前線に立てるのか?
- 新製品やサービスラインへの最適な投資方法とは?
- 企業を新たな成長軌道に乗せ、C-suiteに移行させるための重要な展望とは?
タイヤ由来燃料(TDF)市場が現在、そして今後10年間でどのような影響を受けるかを知る必要がある:
- 当レポートは413ページにわたり、152の表と202の図表を掲載しています。
- 本レポートでは、業界における主要な有利分野を取り上げているため、今すぐターゲットを絞ることができます。
- 本レポートには、世界、地域、国の売上と成長に関する詳細な分析が含まれています。
- 競合他社が成功した主なトレンド、変化、収益予測をハイライトしています。
本レポートは、タイヤ由来燃料(TDF)市場が今後10年間でどのように発展していくのか、またCOVID-19の景気後退と好転の変動に合わせてどのように発展していくのかをお伝えします。この市場は、過去10年間のどの時点よりも今が重要です。
2034年までの予測やその他の分析から、商業的な展望が明らかになる
- 2034年までの収益予測に加え、直近の実績、成長率、市場シェアを提供します。
- ビジネスの展望と展開に関する独自の分析をご覧いただけます。
- 質的分析(市場力学、促進要因、機会、阻害要因、課題を含む)、コスト構造、タイヤ由来燃料(TDF)価格上昇の影響、最近の動向をご覧いただけます。
本レポートには、COVID-19が業界と貴社にどのような影響を与えるかについてのデータ分析と貴重な洞察が含まれている。本レポートでは、COVID-19の4つの回収パターンとその影響、すなわち「V」、「L」、「W」、「U」について論じている。
レポート対象セグメント
形態別市場セグメント
- シュレッドタイヤ
- タイヤ全体
用途別市場セグメント
- エネルギー回収
- 材料回収
- 化学プロセス
リサイクル方法別市場セグメント
- 機械的破砕
- 熱分解
- セメントキルン共処理
- ガス化
タイヤタイプ別市場セグメント
- 乗用車用タイヤ
- 小型商用車用タイヤ
- 大型商用車用タイヤ
- オフロード車用タイヤ
- その他のタイヤタイプ
エンドユーズ市場セグメント
- セメント産業
- パルプ・製紙産業
- 公益事業および発電
- 産業用ボイラー
- 鉄鋼
- その他の最終用途
世界市場全体とセグメント別の収益予測に加え、4つの地域と20の主要国市場の収益予測も掲載しています:
北米
- アメリカ
- カナダ
欧州
- ドイツ
- スペイン
- イギリス
- フランス
- イタリア
- その他の欧州
アジア太平洋
- 中国
- 日本
- インド
- オーストラリア
- 韓国
- その他のアジア太平洋地域
ラテンアメリカ
- ブラジル
- メキシコ
- その他のラテンアメリカ
中東・アフリカ
- GCC
- 南アフリカ
- その他の中東・アフリカ
また、2024年から2034年までのタイヤ由来燃料(TDF)市場の主要企業のプロファイルと、これらの企業の事業のこのセグメントに焦点を当てています。
報告書に掲載されている主要企業
・ Babcock & Wilcox Enterprises, Inc
・ Beta Analytic Inc
・ Emanuel Tire LLC
・ Front Range Tire Recycle Inc.
・ Lakin Tire
・ Liberty Tire Recycling LLC
・ MS Tire Recycling LLC
・ Reliable Tire Disposal
・ Remondis
・ Renelux Cyprus Ltd
・ ResourceCo Pty Ltd
・ Tire Disposal and Recycling Inc.
・ Tire Stewardship Manitoba
・ Weibold
・ West Coast Rubber Recycling Inc
タイヤ由来燃料(TDF)市場の2024年から2034年までの世界全体の売上高(金額ベース)は、2024年に4億800万米ドルを突破すると当研究所は算出した。2034年まで収益は力強く成長すると予測。当調査では、最も大きな可能性を秘めた組織を特定しています。彼らの能力、進歩、商業的展望を発見し、一歩先を行くお手伝いをします。
タイヤ由来燃料(TDF)市場、2024-2034年レポートはどのようにお役に立つでしょうか?
要約すると、410ページを超えるこのレポートは、以下の知識を提供する:
- タイヤ由来燃料(TDF)市場の2024年から2034年までの収益予測 市場価値、市場量、形態、用途、リサイクル方法、タイヤタイプ、最終用途の各予測を世界および地域レベルで掲載 - 業界の展望を発見し、投資と収益に最も有利な場所を見つけることができます。
- 4つの地域と20の主要国市場の2034年までの収益予測 - 北米、欧州、アジア太平洋、中南米、中東・アフリカのタイヤ由来燃料(TDF)市場の2024年から2034年までの市場予測をご覧ください。また、米国、カナダ、ブラジル、ドイツ、フランス、英国、イタリア、中国、インド、日本、オーストラリアなどの著名経済圏の市場も予測しています。
- 既存企業および市場参入を目指す企業の展望 - タイヤ由来燃料(TDF)市場に関わる主要企業15社の企業プロファイルを含む、2024年から2034年までの市場。
独自の予測による定量的・定性的分析をご覧ください。私たちのレポートだけに含まれる情報を入手し、貴重なビジネスインテリジェンスで情報を得ることができます。
他にはない情報
私たちの新しいレポートがあれば、知識に遅れをとったり、チャンスを逃したりする可能性が低くなります。弊社のレポートが貴社の調査、分析、意思決定にどのように役立つかをご覧ください。Visiongainの調査は、タイヤ由来燃料(TDF)市場、2024年から2034年、市場をリードする企業の商業分析を必要とするすべての人のためのものです。データ、動向、予測をご覧いただけます。
ページTOPに戻る
目次
目次
1 レポート概要
1.1 研究の目的
1.2 タイヤ由来燃料(TDF)市場の紹介
1.3 本レポートの内容
1.4 本レポートを読むべき理由
1.5 本分析レポートが回答する主な質問
1.6 本レポートは誰のためのものか?
1.7 方法論
1.7.1 市場の定義
1.7.2 市場評価・予測手法
1.7.3 データの検証
1.7.3.1 一次調査
1.7.3.2 セカンダリーリサーチ
1.8 よくある質問(FAQ)
1.9 Visiongainの関連レポート
1.10 Visiongainについて
2 エグゼクティブ・サマリー
3 市場概要
3.1 主要な調査結果
3.2 市場ダイナミクス
3.2.1 市場促進要因
3.2.1.1 タイヤ由来燃料はセメント、鉄鋼、発電用の貴重な燃料源である
3.2.1.2 豊富な廃タイヤは、タイヤ由来燃料製造のための信頼できる安定した供給源となる
3.2.1.3 廃棄物削減、エネルギー回収、環境持続可能性の観点からのタイヤ由来燃料の利点
3.2.2 市場抑制要因
3.2.2.1 代替燃料やエネルギー源の入手可能性と費用対効果
3.2.2.2 エネルギー価格、市場需要の変動はタイヤ由来燃料プロジェクトの経済的実行可能性に影響を与え得る
3.2.2.3 経済的考慮はタイヤ由来燃料の普及への課題となり得る
3.2.3 市場機会
3.2.3.1 熱分解とガス化の技術進歩
3.2.3.2 政府の奨励金、補助金、支援政策
3.2.3.3 世界的なタイヤ生産量と廃棄率の継続的成長により、タイヤ由来燃料生産用の原料が安定供給される。
3.3 ポーターのファイブフォース分析
3.3.1 サプライヤーの交渉力(中)
3.3.2 買い手の交渉力(中)
3.3.3 競争力(中)
3.3.4 代替品による脅威(高)
3.3.5 新規参入の脅威(低)
3.4 COVID-19の影響分析
3.4.1 "V字型回復"
3.4.2 "U字型回復"
3.4.3 "W字型回復"
3.4.4 "L字型回復"
3.5 PEST分析
4 タイヤ由来燃料(TDF)市場分析:形態別
4.1 主な調査結果
4.2 フォームセグメント 市場魅力度指数
4.3 タイヤ由来燃料(TDF)の形態別市場規模の推定と予測
4.4 破砕タイヤ
4.4.1 2024〜2034年の地域別市場規模(US$ Million)
4.4.2 地域別市場シェア、2024年・2034年(%)
4.5 ホールタイヤ
4.5.1 2024〜2034年の地域別市場規模(US$ Million)
4.5.2 地域別市場シェア、2024年・2034年(%)
5 タイヤ由来燃料(TDF)市場分析:用途別
5.1 主要調査結果
5.2 用途別セグメント 市場魅力度指数
5.3 用途別タイヤ由来燃料(TDF)市場規模の推定と予測
5.4 エネルギー回収
5.4.1 2024〜2034年の地域別市場規模(US$ Million)
5.4.2 地域別市場シェア、2024年・2034年(%)
5.5 材料回収
5.5.1 2024〜2034年の地域別市場規模(US$ Million)
5.5.2 地域別市場シェア、2024年・2034年(%)
5.6 化学プロセス
5.6.1 2024年~2034年の地域別市場規模(US$ Million)
5.6.2 地域別市場シェア、2024年・2034年(%)
6 タイヤ由来燃料(TDF)市場分析:リサイクル方法別
6.1 主な調査結果
6.2 リサイクル方法セグメント 市場魅力度指数
6.3 再資源化方法別タイヤ由来燃料(TDF)市場規模の推定と予測
6.4 機械的破砕
6.4.1 2024〜2034年の地域別市場規模(US$ Million)
6.4.2 地域別市場シェア、2024年・2034年(%)
6.5 熱分解
6.5.1 2024~2034年の地域別市場規模(US$ Million)
6.5.2 地域別市場シェア、2024年・2034年(%)
6.6 セメントキルン・コプロセシング
6.6.1 2024~2034年の地域別市場規模(US$ Million)
6.6.2 地域別市場シェア、2024年・2034年(%)
6.7 ガス化
6.7.1 2024~2034年の地域別市場規模(US$ Million)
6.7.2 地域別市場シェア、2024年・2034年(%)
7 タイヤ由来燃料(TDF)市場分析:タイヤタイプ別
7.1 主要な調査結果
7.2 タイヤタイプ別セグメント 市場魅力度指数
7.3 タイヤタイプ別タイヤ由来燃料(TDF)市場規模の推定と予測
7.4 乗用車用タイヤ
7.4.1 2024〜2034年の地域別市場規模(US$ Million)
7.4.2 地域別市場シェア、2024年・2034年(%)
7.5 小型商用車用タイヤ
7.5.1 2024〜2034年の地域別市場規模(US$ Million)
7.5.2 地域別市場シェア、2024年・2034年(%)
7.6 大型商用車用タイヤ
7.6.1 2024〜2034年の地域別市場規模(US$ Million)
7.6.2 地域別市場シェア、2024年・2034年(%)
7.7 オフロード車両用タイヤ
7.7.1 2024~2034年の地域別市場規模(US$ Million)
7.7.2 地域別市場シェア、2024年・2034年(%)
7.8 その他のタイヤタイプ
7.8.1 2024〜2034年の地域別市場規模(US$ Million)
7.8.2 地域別市場シェア、2024年・2034年(%)
8 タイヤ由来燃料(TDF)市場分析:エンドユーズ別
8.1 主要調査結果
8.2 エンドユーズセグメント: 市場魅力度指数
8.3 タイヤタイプ別タイヤ由来燃料(TDF)市場規模の推定と予測
8.4 セメント産業
8.4.1 2024〜2034年の地域別市場規模(US$ Million)
8.4.2 地域別市場シェア、2024年・2034年(%)
8.5 紙パルプ産業
8.5.1 2024〜2034年の地域別市場規模(US$ Million)
8.5.2 地域別市場シェア、2024年・2034年(%)
8.6 ユーティリティ・発電
8.6.1 2024年~2034年の地域別市場規模(US$ Million)
8.6.2 地域別市場シェア、2024年・2034年(%)
8.7 産業用ボイラー
8.7.1 2024~2034年の地域別市場規模(US$ Million)
8.7.2 地域別市場シェア、2024年・2034年 (%)
8.8 鉄鋼製造
8.8.1 2024年~2034年の地域別市場規模(US$ Million)
8.8.2 地域別市場シェア、2024年・2034年(%)
8.9 その他の最終用途
8.9.1 2024〜2034年の地域別市場規模(US$ Million)
8.9.2 地域別市場シェア、2024年・2034年(%)
9 タイヤ由来燃料(TDF)市場分析:地域別
9.1 主要な調査結果
9.2 地域別市場規模の推定と予測
10 北米のタイヤ由来燃料(TDF)市場分析
10.1 主要な調査結果
10.2 北米のタイヤ由来燃料(TDF)市場魅力度指数
10.3 北米のタイヤ由来燃料(TDF)国別市場、2024年、2029年、2034年 (US$ Million)
10.4 北米のタイヤ由来燃料(TDF)市場規模の推定と予測
10.5 北米のタイヤ由来燃料(TDF)市場規模推定と予測:国別
10.6 北米のタイヤ由来燃料(TDF)市場規模推定と予測:形態別
10.7 北米のタイヤ由来燃料(TDF)市場規模推定と予測:用途別予測
10.8 北米のタイヤ由来燃料(TDF)市場規模推定と予測:リサイクル方法別
10.9 北米のタイヤ由来燃料(TDF)市場規模推定と予測:タイヤタイプ別
10.10 北米のタイヤ由来燃料(TDF)市場規模推定と予測:エンドユーズ別
10.11 アメリカタイヤ由来燃料(TDF)市場分析
10.12 カナダのタイヤ由来燃料(TDF)市場分析
11 欧州のタイヤ由来燃料(TDF)市場分析
11.1 主要な調査結果
11.2 欧州のタイヤ由来燃料(TDF)市場魅力度指数
11.3 欧州のタイヤ由来燃料(TDF)国別市場、2024年、2029年、2034年 (US$ Million)
11.4 欧州のタイヤ由来燃料(TDF)市場規模の推定と予測
11.5 欧州のタイヤ由来燃料(TDF)市場規模推定と予測:国別
11.6 欧州のタイヤ由来燃料(TDF)市場規模推定と予測:形態別
11.7 欧州のタイヤ由来燃料(TDF)市場規模推定と予測:用途別
11.8 欧州のタイヤ由来燃料(TDF)市場規模推定と予測:リサイクル方法別
11.9 欧州のタイヤ由来燃料(TDF)市場規模推定と予測:タイヤタイプ別
11.10 欧州のタイヤ由来燃料(TDF)市場規模推定と予測:エンドユーズ別
11.11 ドイツのタイヤ由来燃料(TDF)市場分析
11.12 イギリスのタイヤ由来燃料(TDF)市場分析
11.13 フランスのタイヤ由来燃料(TDF)市場分析
11.14 イタリアのタイヤ由来燃料(TDF)市場分析
11.15 スペインのタイヤ由来燃料(TDF)市場分析
11.16 その他の欧州のタイヤ由来燃料(TDF)市場分析
12 アジア太平洋地域のタイヤ由来燃料(TDF)市場分析
12.1 主要な調査結果
12.2 アジア太平洋地域のタイヤ由来燃料(TDF)市場魅力度指数
12.3 アジア太平洋地域のタイヤ由来燃料(TDF)国別市場、2024年、2029年、2034年 (US$ Million)
12.4 アジア太平洋地域のタイヤ由来燃料(TDF)市場規模の推定と予測
12.5 アジア太平洋地域のタイヤ由来燃料(TDF)国別市場規模の推定と予測
12.6 アジア太平洋地域のタイヤ由来燃料(TDF)市場規模推定と予測:形態別
12.7 アジア太平洋地域のタイヤ由来燃料(TDF)市場規模推定と予測:用途別
12.8 アジア太平洋地域のタイヤ由来燃料(TDF)市場規模推定と予測:リサイクル方法別
12.9 アジア太平洋地域のタイヤ由来燃料(TDF)市場規模推定と予測:タイヤタイプ別
12.10 アジア太平洋地域のタイヤ由来燃料(TDF)市場規模推定と予測:用途別
12.11 中国のタイヤ由来燃料(TDF)市場分析
12.12 インドのタイヤ由来燃料(TDF)市場分析
12.13 日本のタイヤ由来燃料(TDF)市場分析
12.14 韓国のタイヤ由来燃料(TDF)市場分析
12.15 オーストラリアのタイヤ由来燃料(TDF)市場分析
12.16 その他のアジア太平洋地域のタイヤ由来燃料(TDF)市場分析
13 中東・アフリカのタイヤ由来燃料(TDF)市場分析
13.1 主要な調査結果
13.2 中東・アフリカのタイヤ由来燃料(TDF)市場魅力度指数
13.3 中東・アフリカのタイヤ由来燃料(TDF)国別市場:2024年、2029、2034年 (US$ Million)
13.4 中東・アフリカのタイヤ由来燃料(TDF)市場規模推定と予測
13.5 中東・アフリカのタイヤ由来燃料(TDF)市場規模推定と予測:国別
13.6 中東・アフリカのタイヤ由来燃料(TDF)市場規模推定と予測:形態別
13.7 中東・アフリカのタイヤ由来燃料(TDF)市場規模推定と予測:用途別
13.8 中東・アフリカのタイヤ由来燃料(TDF)市場規模推定と予測:リサイクル方法別
13.9 中東・アフリカのタイヤ由来燃料(TDF)市場規模推定と予測:タイヤタイプ別
13.10 中東・アフリカのタイヤ由来燃料(TDF)市場規模推定と予測:エンドユーズ別
13.11 GCCのタイヤ由来燃料(TDF)市場分析
13.12 南アフリのカタイヤ由来燃料(TDF)市場分析
13.13 その他の中東・アフリカタイヤ由来燃料(TDF)市場分析
14 ラテンアメリカのタイヤ由来燃料(TDF)市場分析
14.1 主要な調査結果
14.2 ラテンアメリカのタイヤ由来燃料(TDF)市場魅力度指数
14.3 ラテンアメリカのタイヤ由来燃料(TDF)国別市場、2024年、2029年、2034年 (US$ Million)
14.4 ラテンアメリカのタイヤ由来燃料(TDF)市場規模推定と予測
14.5 ラテンアメリカのタイヤ由来燃料(TDF)市場規模推定と予測:国別
14.6 ラテンアメリカのタイヤ由来燃料(TDF)市場規模推定と予測:形態別
14.7 ラテンアメリカのタイヤ由来燃料(TDF)市場規模推定と予測:用途別予測
14.8 ラテンアメリカのタイヤ由来燃料(TDF)市場規模推定と予測:リサイクル方法別
14.9 ラテンアメリカのタイヤ由来燃料(TDF)市場規模推定と予測:タイヤタイプ別
14.10 ラテンアメリカのタイヤ由来燃料 (TDF) 市場規模推定と予測:エンドユーズ別
14.11 ブラジルタイヤ由来燃料(TDF)市場分析
14.12 メキシコのタイヤ由来燃料(TDF)市場分析
14.13 その他のラテンアメリカのタイヤ由来燃料(TDF)市場分析
15 会社概要
15.1 競争環境、2022年
15.2 戦略的展望
15.3 Babcock & Wilcox Enterprises, Inc
15.3.1 会社概要
15.3.2 会社概要
15.3.3 財務分析
15.3.3.1 純収入、2018-2022年
15.3.3.2 売上高、2018-2022年
15.3.3.3 地域別収益シェア、2022年(%)
15.3.3.4 事業セグメント収益シェア、2022年(%)
15.3.4 製品ベンチマーク
15.3.5 戦略的展望
15.4 Beta Analytic Inc
15.4.1 会社概要
15.4.2 会社概要
15.4.3 製品ベンチマーク
15.5 Emanuel Tire LLC
15.5.1 会社概要
15.5.2 会社概要
15.5.3 製品ベンチマーク
15.5.4 戦略的展望
15.6 Lakin Tire
15.6.1 会社概要
15.6.2 会社概要
15.6.3 製品ベンチマーク
15.6.4 戦略的展望
15.7 Liberty Tire Recycling LLC
15.7.1 会社概要
15.7.2 会社概要
15.7.3 製品ベンチマーク
15.7.4 戦略的展望
15.8 MS Tire Recycling LLC
15.8.1 会社概要
15.8.2 会社概要
15.8.3 製品ベンチマーク
15.9 Reliable Tire Disposal
15.9.1 会社概要
15.9.2 会社概要
15.9.3 製品ベンチマーク
15.10 Renelux Cyprus Ltd
15.10.1 会社概要
15.10.2 会社概要
15.10.3 製品ベンチマーク
15.11 ResourceCo Pty Ltd
15.11.1 会社概要
15.11.2 会社概要
15.11.3 製品ベンチマーク
15.11.4 戦略的展望
15.12 Remondis
15.12.1 会社概要
15.12.2 会社概要
15.12.3 製品ベンチマーク
15.13 Tire Disposal and Recycling Inc.
15.13.1 会社概要
15.13.2 会社概要
15.13.3 製品ベンチマーク
15.14 Tire Stewardship Manitoba
15.14.1 会社概要
15.14.2 会社概要
15.14.3 製品ベンチマーク
15.15 Weibold
15.15.1 会社概要
15.15.2 会社概要
15.15.3 製品ベンチマーク
15.16 West Coast Rubber Recycling Inc
15.16.1 会社概要
15.16.2 会社概要
15.16.3 製品ベンチマーク
15.16.4 戦略的展望
15.17 Front Range Tire Recycle Inc.
15.17.1 会社概要
15.17.2 会社概要
15.17.3 製品ベンチマーク
16 結論と提言
16.1 Visiongainからの結びの言葉
16.2 市場プレイヤーへの提言
ページTOPに戻る
図表リスト
表の一覧
Table 1 Tire Derived Fuel (TDF) Market Snapshot, 2024 & 2034 (US$ Million, CAGR %)
Table 2 Crude steel production by region
Table 3 Global Tire Derived Fuel (TDF) Market by Region, 2024-2034 (US$ Mn, AGR (%), CAGR (%)) (V-Shaped Recovery Scenario)
Table 4 Global Tire Derived Fuel (TDF) Market by Region, 2024-2034 (US$ Mn, AGR (%), CAGR (%)) (U-Shaped Recovery Scenario)
Table 5 Global Tire Derived Fuel (TDF) Market by Region, 2024-2034 (US$ Mn, AGR (%), CAGR (%)) (W-Shaped Recovery Scenario)
Table 6 Global Tire Derived Fuel (TDF) Market by Region, 2024-2034 (US$ Mn, AGR (%), CAGR (%)) (L-Shaped Recovery Scenario)
Table 7 Global Tire Derived Fuel (TDF) Market by Form, 2024-2034 (US$ Mn, AGR (%), CAGR (%))
Table 8 Shredded Tire Market by Region, 2024-2034 (US$ Mn, AGR (%), CAGR (%))
Table 9 Whole Tire Market by Region, 2024-2034 (US$ Mn, AGR (%), CAGR (%))
Table 10 Global Tire Derived Fuel (TDF) Market by Application, 2024-2034 (US$ Mn, AGR (%), CAGR (%))
Table 11 Energy Recovery Market by Region, 2024-2034 (US$ Mn, AGR (%), CAGR (%))
Table 12 Material Recovery Market by Region, 2024-2034 (US$ Mn, AGR (%), CAGR (%))
Table 13 Chemical Processes Market by Region, 2024-2034 (US$ Mn, AGR (%), CAGR (%))
Table 14 Global Tire Derived Fuel (TDF) Market by Recycling Method, 2024-2034 (US$ Mn, AGR (%), CAGR (%))
Table 15 Mechanical Shredding Market by Region, 2024-2034 (US$ Mn, AGR (%), CAGR (%))
Table 16 Pyrolysis Market by Region, 2024-2034 (US$ Mn, AGR (%), CAGR (%))
Table 17 Cement Kiln Co-Processing Market by Region, 2024-2034 (US$ Mn, AGR (%), CAGR (%))
Table 18 Gasification Market by Region, 2024-2034 (US$ Mn, AGR (%), CAGR (%))
Table 19 Global Tire Derived Fuel (TDF) Market by Tire Type, 2024-2034 (US$ Mn, AGR (%), CAGR (%))
Table 20 Passenger Car Tires Market by Region, 2024-2034 (US$ Mn, AGR (%), CAGR (%))
Table 21 Light Commercial Vehicle Tires Market by Region, 2024-2034 (US$ Mn, AGR (%), CAGR (%))
Table 22 Heavy Commercial Vehicle Tires Market by Region, 2024-2034 (US$ Mn, AGR (%), CAGR (%))
Table 23 Off-road Vehicle Tires Market by Region, 2024-2034 (US$ Mn, AGR (%), CAGR (%))
Table 24 Other Tire Type Market by Region, 2024-2034 (US$ Mn, AGR (%), CAGR (%))
Table 25 Global Tire Derived Fuel (TDF) Market by End-use, 2024-2034 (US$ Mn, AGR (%), CAGR (%))
Table 26 Cement Industry Market by Region, 2024-2034 (US$ Mn, AGR (%), CAGR (%))
Table 27 Pulp and Paper Industry Market by Region, 2024-2034 (US$ Mn, AGR (%), CAGR (%))
Table 28 Utility and Power Generation Market by Region, 2024-2034 (US$ Mn, AGR (%), CAGR (%))
Table 29 Industrial Boilers Market by Region, 2024-2034 (US$ Mn, AGR (%), CAGR (%))
Table 30 Steel Manufacturing Market by Region, 2024-2034 (US$ Mn, AGR (%), CAGR (%))
Table 31 Other End-use Market by Region, 2024-2034 (US$ Mn, AGR (%), CAGR (%))
Table 32 Tire Derived Fuel (TDF) Market Forecast by Region, 2024-2034 (US$ Million, AGR%, CAGR%)
Table 33 North America Tire Derived Fuel (TDF) Market by Value, 2024-2034 (US$ Mn, AGR (%), CAGR (%))
Table 34 North America Tire Derived Fuel (TDF) Market by Volume, 2024-2034 (US$ Mn, AGR (%), CAGR (%))
Table 35 North America Tire Derived Fuel (TDF) Market by Country, 2024-2034 (US$ Mn, AGR (%), CAGR (%))
Table 36 North America Tire Derived Fuel (TDF) Market Volume by Country, 2024-2034 (US$ Mn, AGR (%), CAGR (%))
Table 37 North America Tire Derived Fuel (TDF) Market by Form, 2024-2034 (US$ Mn, AGR (%), CAGR (%))
Table 38 North America Tire Derived Fuel (TDF) Market by Application, 2024-2034 (US$ Mn, AGR (%), CAGR (%))
Table 39 North America Tire Derived Fuel (TDF) Market by Recycling Method, 2024-2034 (US$ Mn, AGR (%), CAGR (%))
Table 40 North America Tire Derived Fuel (TDF) Market by Tire Type, 2024-2034 (US$ Mn, AGR (%), CAGR (%))
Table 41 North America Tire Derived Fuel (TDF) Market by End-use, 2024-2034 (US$ Mn, AGR (%), CAGR (%))
Table 42 US Tire Derived Fuel (TDF) Market by Value, 2024-2034 (US$ Mn, AGR (%), CAGR (%))
Table 43 US Tire Derived Fuel (TDF) Market by Volume, 2024-2034 (MMT, AGR (%), CAGR (%))
Table 44 Canada Tire Derived Fuel (TDF) Market by Value, 2024-2034 (US$ Mn, AGR (%), CAGR (%))
Table 45 Canada Tire Derived Fuel (TDF) Market by Volume, 2024-2034 (MMT, AGR (%), CAGR (%))
Table 46 Europe Tire Derived Fuel (TDF) Market by Value, 2024-2034 (US$ Mn, AGR (%), CAGR (%))
Table 47 Europe Tire Derived Fuel (TDF) Market by Volume, 2024-2034 (MMT, AGR (%), CAGR (%))
Table 48 Europe Tire Derived Fuel (TDF) Market by Country, 2024-2034 (US$ Mn, AGR (%), CAGR (%))
Table 49 Europe Tire Derived Fuel (TDF) Market Volume by Country, 2024-2034 (MMT, AGR (%), CAGR (%))
Table 50 Europe Tire Derived Fuel (TDF) Market by Form, 2024-2034 (US$ Mn, AGR (%), CAGR (%))
Table 51 Europe Tire Derived Fuel (TDF) Market by Application, 2024-2034 (US$ Mn, AGR (%), CAGR (%))
Table 52 Europe Tire Derived Fuel (TDF) Market by Recycling Method, 2024-2034 (US$ Mn, AGR (%), CAGR (%))
Table 53 Europe Tire Derived Fuel (TDF) Market by Tire Type, 2024-2034 (US$ Mn, AGR (%), CAGR (%))
Table 54 Europe Tire Derived Fuel (TDF) Market by End-use, 2024-2034 (US$ Mn, AGR (%), CAGR (%))
Table 55 Germany Tire Derived Fuel (TDF) Market by Value, 2024-2034 (US$ Mn, AGR (%), CAGR (%))
Table 56 Germany Tire Derived Fuel (TDF) Market by Volume, 2024-2034 (MMT, AGR (%), CAGR (%))
Table 57 UK Tire Derived Fuel (TDF) Market by Value, 2024-2034 (US$ Mn, AGR (%), CAGR (%))
Table 58 UK Tire Derived Fuel (TDF) Market by Volume, 2024-2034 (MMT, AGR (%), CAGR (%))
Table 59 France Tire Derived Fuel (TDF) Market by Value, 2024-2034 (US$ Mn, AGR (%), CAGR (%))
Table 60 France Tire Derived Fuel (TDF) Market by Volume, 2024-2034 (MMT, AGR (%), CAGR (%))
Table 61 Italy Tire Derived Fuel (TDF) Market by Value, 2024-2034 (US$ Mn, AGR (%), CAGR (%))
Table 62 Italy Tire Derived Fuel (TDF) Market by Volume, 2024-2034 (MMT, AGR (%), CAGR (%))
Table 63 Spain Tire Derived Fuel (TDF) Market by Value, 2024-2034 (US$ Mn, AGR (%), CAGR (%))
Table 64 Spain Tire Derived Fuel (TDF) Market by Volume, 2024-2034 (MMT, AGR (%), CAGR (%))
Table 65 Rest of Europe Tire Derived Fuel (TDF) Market by Value, 2024-2034 (US$ Mn, AGR (%), CAGR (%))
Table 66 Rest of Europe Tire Derived Fuel (TDF) Market by Volume, 2024-2034 (MMT, AGR (%), CAGR (%))
Table 67 Asia-Pacific Tire Derived Fuel (TDF) Market by Value, 2024-2034 (US$ Mn, AGR (%), CAGR (%))
Table 68 Asia-Pacific Tire Derived Fuel (TDF) Market by Volume, 2024-2034 (MMT, AGR (%), CAGR (%))
Table 69 Asia-Pacific Tire Derived Fuel (TDF) Market by Country, 2024-2034 (US$ Mn, AGR (%), CAGR (%))
Table 70 Asia-Pacific Tire Derived Fuel (TDF) Market Volume by Country, 2024-2034 (MMT, AGR (%), CAGR (%))
Table 71 Asia-Pacific Tire Derived Fuel (TDF) Market by Form, 2024-2034 (US$ Mn, AGR (%), CAGR (%))
Table 72 Asia-Pacific Tire Derived Fuel (TDF) Market by Application, 2024-2034 (US$ Mn, AGR (%), CAGR (%))
Table 73 Asia-Pacific Tire Derived Fuel (TDF) Market by Recycling Method, 2024-2034 (US$ Mn, AGR (%), CAGR (%))
Table 74 Asia-Pacific Tire Derived Fuel (TDF) Market by Tire Type, 2024-2034 (US$ Mn, AGR (%), CAGR (%))
Table 75 Asia-Pacific Tire Derived Fuel (TDF) Market by End-use, 2024-2034 (US$ Mn, AGR (%), CAGR (%))
Table 76 China Tire Derived Fuel (TDF) Market by Value, 2024-2034 (US$ Mn, AGR (%), CAGR (%))
Table 77 China Tire Derived Fuel (TDF) Market by Volume, 2024-2034 (MMT, AGR (%), CAGR (%))
Table 78 India Tire Derived Fuel (TDF) Market by Value, 2024-2034 (US$ Mn, AGR (%), CAGR (%))
Table 79 India Tire Derived Fuel (TDF) Market by Volume, 2024-2034 (MMT, AGR (%), CAGR (%))
Table 80 Japan Tire Derived Fuel (TDF) Market by Value, 2024-2034 (US$ Mn, AGR (%), CAGR (%))
Table 81 Japan Tire Derived Fuel (TDF) Market by Volume, 2024-2034 (MMT, AGR (%), CAGR (%))
Table 82 South Korea Tire Derived Fuel (TDF) Market by Value, 2024-2034 (US$ Mn, AGR (%), CAGR (%))
Table 83 South Korea Tire Derived Fuel (TDF) Market by Volume, 2024-2034 (MMT, AGR (%), CAGR (%))
Table 84 Australia Tire Derived Fuel (TDF) Market by Value, 2024-2034 (US$ Mn, AGR (%), CAGR (%))
Table 85 Australia Tire Derived Fuel (TDF) Market by Volume, 2024-2034 (MMT, AGR (%), CAGR (%))
Table 86 Rest of Asia-Pacific Tire Derived Fuel (TDF) Market by Value, 2024-2034 (US$ Mn, AGR (%), CAGR (%))
Table 87 Rest of Asia-Pacific Tire Derived Fuel (TDF) Market by Volume, 2024-2034 (MMT, AGR (%), CAGR (%))
Table 88 Middle East & Africa Tire Derived Fuel (TDF) Market by Value, 2024-2034 (US$ Mn, AGR (%), CAGR (%))
Table 89 Middle East & Africa Tire Derived Fuel (TDF) Market by Volume, 2024-2034 (MMT, AGR (%), CAGR (%))
Table 90 Middle East & Africa Tire Derived Fuel (TDF) Market by Country, 2024-2034 (US$ Mn, AGR (%), CAGR (%))
Table 91 Middle East & Africa Tire Derived Fuel (TDF) Market Volume by Country, 2024-2034 (MMT, AGR (%), CAGR (%))
Table 92 Middle East & Africa Tire Derived Fuel (TDF) Market by Form, 2024-2034 (US$ Mn, AGR (%), CAGR (%))
Table 93 Middle East & Africa Tire Derived Fuel (TDF) Market by Application, 2024-2034 (US$ Mn, AGR (%), CAGR (%))
Table 94 Middle East & Africa Tire Derived Fuel (TDF) Market by Recycling Method, 2024-2034 (US$ Mn, AGR (%), CAGR (%))
Table 95 Middle East & Africa Tire Derived Fuel (TDF) Market by Tire Type, 2024-2034 (US$ Mn, AGR (%), CAGR (%))
Table 96 Middle East & Africa Tire Derived Fuel (TDF) Market by End-use, 2024-2034 (US$ Mn, AGR (%), CAGR (%))
Table 97 GCC Tire Derived Fuel (TDF) Market by Value, 2024-2034 (US$ Mn, AGR (%), CAGR (%))
Table 98 South Africa Tire Derived Fuel (TDF) Market by Value, 2024-2034 (US$ Mn, AGR (%), CAGR (%))
Table 99 Rest of Middle East & Africa Tire Derived Fuel (TDF) Market by Value, 2024-2034 (US$ Mn, AGR (%), CAGR (%))
Table 100 Latin America Tire Derived Fuel (TDF) Market by Value, 2024-2034 (US$ Mn, AGR (%), CAGR (%))
Table 101 Latin America Tire Derived Fuel (TDF) Market by Volume, 2024-2034 (MMT, AGR (%), CAGR (%))
Table 102 Latin America Tire Derived Fuel (TDF) Market by Country, 2024-2034 (US$ Mn, AGR (%), CAGR (%))
Table 103 Latin America Tire Derived Fuel (TDF) Market Volume by Country, 2024-2034 (MMT, AGR (%), CAGR (%))
Table 104 Latin America Tire Derived Fuel (TDF) Market by Form, 2024-2034 (US$ Mn, AGR (%), CAGR (%))
Table 105 Latin America Tire Derived Fuel (TDF) Market by Application, 2024-2034 (US$ Mn, AGR (%), CAGR (%))
Table 106 Latin America Tire Derived Fuel (TDF) Market by Recycling Method, 2024-2034 (US$ Mn, AGR (%), CAGR (%))
Table 107 Latin America Tire Derived Fuel (TDF) Market by Tire Type, 2024-2034 (US$ Mn, AGR (%), CAGR (%))
Table 108 Latin America Tire Derived Fuel (TDF) Market by End-use, 2024-2034 (US$ Mn, AGR (%), CAGR (%))
Table 109 Brazil Tire Derived Fuel (TDF) Market by Value, 2024-2034 (US$ Mn, AGR (%), CAGR (%))
Table 110 Brazil Tire Derived Fuel (TDF) Market by Volume, 2024-2034 (MMT, AGR (%), CAGR (%))
Table 111 Mexico Tire Derived Fuel (TDF) Market by Value, 2024-2034 (US$ Mn, AGR (%), CAGR (%))
Table 112 Mexico Tire Derived Fuel (TDF) Market by Volume, 2024-2034 (MMT, AGR (%), CAGR (%))
Table 113 Rest of Latin America Tire Derived Fuel (TDF) Market by Value, 2024-2034 (US$ Mn, AGR (%), CAGR (%))
Table 114 Rest of Latin America Tire Derived Fuel (TDF) Market by Volume, 2024-2034 (MMT, AGR (%), CAGR (%))
Table 115 Company Ranking
Table 116 Strategic Outlook - Contract
Table 117 Babcock & Wilcox Enterprises, Inc: Key Details, (CEO, HQ, Revenue, Founded, No. of Employees, Company Type, Website, Business Segment)
Table 118 Babcock & Wilcox Enterprises, Inc: Product Benchmarking
Table 119 Babcock & Wilcox Enterprises, Inc: Strategic Outlook
Table 120 Beta Analytic Inc: Key Details, (CEO, HQ, Revenue, Founded, No. of Employees, Company Type, Website, Business Segment)
Table 121 Beta Analytic Inc: Product Benchmarking
Table 122 Emanuel Tire LLC: Key Details, (CEO, HQ, Revenue, Founded, No. of Employees, Company Type, Website, Business Segment)
Table 123 Emanuel Tire LLC: Product Benchmarking
Table 124 Emanuel Tire LLC: Strategic Outlook
Table 125 Lakin Tire: Key Details, (CEO, HQ, Revenue, Founded, No. of Employees, Company Type, Website, Business Segment)
Table 126 Lakin Tire: Product Benchmarking
Table 127 Lakin Tire: Strategic Outlook
Table 128 Liberty Tire Recycling LLC: Key Details, (CEO, HQ, Revenue, Founded, No. of Employees, Company Type, Website, Business Segment)
Table 129 Liberty Tire Recycling LLC: Product Benchmarking
Table 130 Liberty Tire Recycling LLC: Strategic Outlook
Table 131 MS Tire Recycling LLC: Key Details, (CEO, HQ, Revenue, Founded, No. of Employees, Company Type, Website, Business Segment)
Table 132 MS Tire Recycling LLC: Product Benchmarking
Table 133 Reliable Tire Disposal: Key Details, (CEO, HQ, Revenue, Founded, No. of Employees, Company Type, Website, Business Segment)
Table 134 Reliable Tire Disposal: Product Benchmarking
Table 135 Renelux Cyprus Ltd: Key Details, (CEO, HQ, Revenue, Founded, No. of Employees, Company Type, Website, Business Segment)
Table 136 Renelux Cyprus Ltd: Product Benchmarking
Table 137 Resources Pty Ltd: Key Details, (CEO, HQ, Revenue, Founded, No. of Employees, Company Type, Website, Business Segment)
Table 138 ResourceCo Pty Ltd: Product Benchmarking
Table 139 ResourceCo Pty Ltd: Strategic Outlook
Table 140 Remondis: Key Details, (CEO, HQ, Revenue, Founded, No. of Employees, Company Type, Website, Business Segment)
Table 141 Remondis: Product Benchmarking
Table 142 Tire Disposal and Recycling Inc.: Key Details, (CEO, HQ, Revenue, Founded, No. of Employees, Company Type, Website, Business Segment)
Table 143 Tire Disposal and Recycling Inc.: Product Benchmarking
Table 144 Tire Stewardship Manitoba: Key Details, (CEO, HQ, Revenue, Founded, No. of Employees, Company Type, Website, Business Segment)
Table 145 Tire Stewardship Manitoba: Product Benchmarking
Table 146 Weibold: Key Details, (CEO, HQ, Revenue, Founded, No. of Employees, Company Type, Website, Business Segment)
Table 147 Weibold: Product Benchmarking
Table 148 West Coast Rubber Recycling Inc: Key Details, (CEO, HQ, Revenue, Founded, No. of Employees, Company Type, Website, Business Segment)
Table 149 West Coast Rubber Recycling Inc: Product Benchmarking
Table 150 West Coast Rubber Recycling Inc: Strategic Outlook
Table 151 Front Range Tire Recycle Inc.: Key Details, (CEO, HQ, Revenue, Founded, No. of Employees, Company Type, Website, Business Segment)
Table 152 Front Range Tire Recycle Inc.: Product Benchmarking
図の一覧
Figure 1 Tire Derived Fuel (TDF) Market Segmentation
Figure 2 Tire Derived Fuel (TDF) Market by Form: Market Attractiveness Index
Figure 3 Tire Derived Fuel (TDF) Market by Application: Market Attractiveness Index
Figure 4 Tire Derived Fuel (TDF) Market by Recycling Method: Market Attractiveness Index
Figure 5 Tire Derived Fuel (TDF) Market by Tire Type: Market Attractiveness Index
Figure 6 Tire Derived Fuel (TDF) Market by End-Use: Market Attractiveness Index
Figure 7 Tire Derived Fuel (TDF) Market Attractiveness Index by Region
Figure 8 Tire Derived Fuel (TDF) Market: Market Dynamics
Figure 9 Clinker Capacity Worldwide in 2022
Figure 10 Global Power Generation by 2022
Figure 11 Electricity Prices Worldwide in March 2023
Figure 12 Tire Derived Fuel (TDF) Market: Porter’s Five Forces Analysis
Figure 13 Global Tire Derived Fuel (TDF) Market Share Forecast by COVID, 2024-2034 (%)
Figure 14 Global Tire Derived Fuel (TDF) Market by Region, 2024-2034 (US$ Mn, AGR (%)) (V-Shaped Recovery Scenario)
Figure 15 Global Tire Derived Fuel (TDF) Market by Region, 2024-2034 (US$ Mn, AGR (%)) (U-Shaped Recovery Scenario)
Figure 16 Global Tire Derived Fuel (TDF) Market by Region, 2024-2034 (US$ Mn, AGR (%)) (W-Shaped Recovery Scenario)
Figure 17 Global Tire Derived Fuel (TDF) Market by Region, 2024-2034 (US$ Mn, AGR (%)) (L-Shaped Recovery Scenario)
Figure 18 Tire Derived Fuel (TDF) Market: PEST Analysis
Figure 19 Tire Derived Fuel (TDF) Market by Form: Market Attractiveness Index
Figure 20 Global Tire Derived Fuel (TDF) Market by Form, 2024-2034 (US$ Mn, AGR (%))
Figure 21 Tire Derived Fuel (TDF) Market Share Forecast by Form, 2024, 2029, 2034 (%)
Figure 22 Shredded Tire Market by Region, 2024-2034 (US$ Mn, AGR (%))
Figure 23 Shredded Tire Market Share Forecast by Region, 2024 & 2034 (%)
Figure 24 Whole Tire Market by Region, 2024-2034 (US$ Mn, AGR (%))
Figure 25 Whole Tire Market Share Forecast by Region, 2024 & 2034 (%)
Figure 26 Tire Derived Fuel (TDF) Market by Application: Market Attractiveness Index
Figure 27 Global Tire Derived Fuel (TDF) Market by Application, 2024-2034 (US$ Mn, AGR (%))
Figure 28 Tire Derived Fuel (TDF) Market Share Forecast by Application, 2024, 2029, 2034 (%)
Figure 29 Energy Recovery Market by Region, 2024-2034 (US$ Mn, AGR (%))
Figure 30 Energy Recovery Market Share Forecast by Region, 2024 & 2034 (%)
Figure 31 Material Recovery Market by Region, 2024-2034 (US$ Mn, AGR (%))
Figure 32 Material Recovery Market Share Forecast by Region, 2024 & 2034 (%)
Figure 33 Chemical Processes Market by Region, 2024-2034 (US$ Mn, AGR (%))
Figure 34 Chemical Processes Market Share Forecast by Region, 2024 & 2034 (%)
Figure 35 Tire Derived Fuel (TDF) Market by Recycling Method: Market Attractiveness Index
Figure 36 Global Tire Derived Fuel (TDF) Market by Recycling Method, 2024-2034 (US$ Mn, AGR (%))
Figure 37 Tire Derived Fuel (TDF) Market Share Forecast by Recycling Method, 2024, 2029, 2034 (%)
Figure 38 Mechanical Shredding Market by Region, 2024-2034 (US$ Mn, AGR (%))
Figure 39 Mechanical Shredding Market Share Forecast by Region, 2024 & 2034 (%)
Figure 40 Pyrolysis Market by Region, 2024-2034 (US$ Mn, AGR (%))
Figure 41 Pyrolysis Market Share Forecast by Region, 2024 & 2034 (%)
Figure 42 Cement Kiln Co-Processing Market by Region, 2024-2034 (US$ Mn, AGR (%))
Figure 43 Cement Kiln Co-Processing Market Share Forecast by Region, 2024 & 2034 (%)
Figure 44 Gasification Market by Region, 2024-2034 (US$ Mn, AGR (%))
Figure 45 Gasification Market Share Forecast by Region, 2024 & 2034 (%)
Figure 46 Tire Derived Fuel (TDF) Market by Tire Type: Market Attractiveness Index
Figure 47 Global Tire Derived Fuel (TDF) Market by Tire Type, 2024-2034 (US$ Mn, AGR (%))
Figure 48 Tire Derived Fuel (TDF) Market Share Forecast by Tire Type, 2024, 2029, 2034 (%)
Figure 49 Passenger Car Tires Market by Region, 2024-2034 (US$ Mn, AGR (%))
Figure 50 Passenger Car Tires Market Share Forecast by Region, 2024 & 2034 (%)
Figure 51 Light Commercial Vehicle Tires Market by Region, 2024-2034 (US$ Mn, AGR (%))
Figure 52 Light Commercial Vehicle Tires Market Share Forecast by Region, 2024 & 2034 (%)
Figure 53 Heavy Commercial Vehicle Tires Market by Region, 2024-2034 (US$ Mn, AGR (%))
Figure 54 Heavy Commercial Vehicle Tires Market Share Forecast by Region, 2024 & 2034 (%)
Figure 55 Off-road Vehicle Tires Market by Region, 2024-2034 (US$ Mn, AGR (%))
Figure 56 Off-road Vehicle Tires Market Share Forecast by Region, 2024 & 2034 (%)
Figure 57 Other Tire Type Market by Region, 2024-2034 (US$ Mn, AGR (%))
Figure 58 Other Tire Type Market Share Forecast by Region, 2024 & 2034 (%)
Figure 59 Tire Derived Fuel (TDF) Market by End-Use: Market Attractiveness Index
Figure 60 Global Tire Derived Fuel (TDF) Market by End-use, 2024-2034 (US$ Mn, AGR (%))
Figure 61 Tire Derived Fuel (TDF) Market Share Forecast by End-Use, 2024, 2029, 2034 (%)
Figure 62 Cement Industry Market by Region, 2024-2034 (US$ Mn, AGR (%))
Figure 63 Cement Industry Market Share Forecast by Region, 2024 & 2034 (%)
Figure 64 Pulp and Paper Industry Market by Region, 2024-2034 (US$ Mn, AGR (%))
Figure 65 Pulp and Paper Industry Market Share Forecast by Region, 2024 & 2034 (%)
Figure 66 Utility and Power Generation Market by Region, 2024-2034 (US$ Mn, AGR (%))
Figure 67 Utility and Power Generation Market Share Forecast by Region, 2024 & 2034 (%)
Figure 68 Industrial Boilers Market by Region, 2024-2034 (US$ Mn, AGR (%))
Figure 69 Industrial Boilers Market Share Forecast by Region, 2024 & 2034 (%)
Figure 70 Steel Manufacturing Market by Region, 2024-2034 (US$ Mn, AGR (%))
Figure 71 Steel Manufacturing Market Share Forecast by Region, 2024 & 2034 (%)
Figure 72 Other End-use Market by Region, 2024-2034 (US$ Mn, AGR (%))
Figure 73 Other End-use Market Share Forecast by Region, 2024 & 2034 (%)
Figure 74 Tire Derived Fuel (TDF) Market Forecast by Region 2024 and 2034 (Revenue, CAGR%)
Figure 75 Tire Derived Fuel (TDF) Market Share Forecast by Region 2024, 2029, 2034 (%)
Figure 76 Tire Derived Fuel (TDF) Market by Region, 2024-2034 (US$ Million, AGR %)
Figure 77 North America Tire Derived Fuel (TDF) Market Attractiveness Index
Figure 78 North America Tire Derived Fuel (TDF) Market by Region, 2024, 2029 & 2034 (US$ Million)
Figure 79 North America Tire Derived Fuel (TDF) Market by Value, 2024-2034 (US$ Mn, AGR (%))
Figure 80 North America Tire Derived Fuel (TDF) Market by Volume, 2024-2034 (US$ Mn, AGR (%))
Figure 81 North America Tire Derived Fuel (TDF) Market by Country, 2024-2034 (US$ Mn, AGR (%))
Figure 82 North America Tire Derived Fuel (TDF) Market Volume by Country, 2024-2034 (US$ Mn, AGR (%))
Figure 83 North America Tire Derived Fuel (TDF) Market Share Forecast by Country, 2024 & 2034 (%)
Figure 84 North America Tire Derived Fuel (TDF) Market by Form, 2024-2034 (US$ Mn, AGR (%))
Figure 85 North America Tire Derived Fuel (TDF) Market Share Forecast Form, 2024 & 2034 (%)
Figure 86 North America Tire Derived Fuel (TDF) Market by Application, 2024-2034 (US$ Mn, AGR (%))
Figure 87 North America Tire Derived Fuel (TDF) Market Share Forecast by Application, 2024 & 2034 (%)
Figure 88 North America Tire Derived Fuel (TDF) Market by Recycling Method, 2024-2034 (US$ Mn, AGR (%))
Figure 89 North America Tire Derived Fuel (TDF) Market Share Forecast by Recycling Method, 2024 & 2034 (%)
Figure 90 North America Tire Derived Fuel (TDF) Market by Tire Type, 2024-2034 (US$ Mn, AGR (%))
Figure 91 North America Tire Derived Fuel (TDF) Market Share Forecast by Tire Type, 2024 & 2034 (%)
Figure 92 North America Tire Derived Fuel (TDF) Market by End-use, 2024-2034 (US$ Mn, AGR (%))
Figure 93 North America Tire Derived Fuel (TDF) Market Share Forecast by End-Use, 2024 & 2034 (%)
Figure 94 US Tire Derived Fuel (TDF) Market by Value, 2024-2034 (US$ Mn, AGR (%))
Figure 95 US Tire Derived Fuel (TDF) Market by Volume, 2024-2034 (MMT, AGR (%))
Figure 96 Canada Tire Derived Fuel (TDF) Market by Value, 2024-2034 (US$ Mn, AGR (%))
Figure 97 Canada Tire Derived Fuel (TDF) Market by Volume, 2024-2034 (MMT, AGR (%))
Figure 98 Europe Tire Derived Fuel (TDF) Market Attractiveness Index
Figure 99 Europe Tire Derived Fuel (TDF) Market by Region, 2024, 2029 & 2034 (US$ Million)
Figure 100 Europe Tire Derived Fuel (TDF) Market by Value, 2024-2034 (US$ Mn, AGR (%))
Figure 101 Europe Tire Derived Fuel (TDF) Market by Volume, 2024-2034 (MMT, AGR (%))
Figure 102 Europe Tire Derived Fuel (TDF) Market by Country, 2024-2034 (US$ Mn, AGR (%))
Figure 103 Europe Tire Derived Fuel (TDF) Market Volume by Country, 2024-2034 (MMT, AGR (%))
Figure 104 Europe Tire Derived Fuel (TDF) Market Share Forecast by Country, 2024 & 2034 (%)
Figure 105 Europe Tire Derived Fuel (TDF) Market by Form, 2024-2034 (US$ Mn, AGR (%))
Figure 106 Europe Tire Derived Fuel (TDF) Market Share Forecast Form, 2024 & 2034 (%)
Figure 107 Europe Tire Derived Fuel (TDF) Market by Application, 2024-2034 (US$ Mn, AGR (%))
Figure 108 Europe Tire Derived Fuel (TDF) Market Share Forecast by Application, 2024 & 2034 (%)
Figure 109 Europe Tire Derived Fuel (TDF) Market by Recycling Method, 2024-2034 (US$ Mn, AGR (%))
Figure 110 Europe Tire Derived Fuel (TDF) Market Share Forecast by Recycling Method, 2024 & 2034 (%)
Figure 111 Europe Tire Derived Fuel (TDF) Market by Tire Type, 2024-2034 (US$ Mn, AGR (%))
Figure 112 Europe Tire Derived Fuel (TDF) Market Share Forecast by Tire Type, 2024 & 2034 (%)
Figure 113 Europe Tire Derived Fuel (TDF) Market by End-use, 2024-2034 (US$ Mn, AGR (%))
Figure 114 Europe Tire Derived Fuel (TDF) Market Share Forecast by End-Use, 2024 & 2034 (%)
Figure 115 Germany Tire Derived Fuel (TDF) Market by Value, 2024-2034 (US$ Mn, AGR (%))
Figure 116 Germany Tire Derived Fuel (TDF) Market by Volume, 2024-2034 (MMT, AGR (%))
Figure 117 UK Tire Derived Fuel (TDF) Market by Value, 2024-2034 (US$ Mn, AGR (%))
Figure 118 UK Tire Derived Fuel (TDF) Market by Volume, 2024-2034 (MMT, AGR (%))
Figure 119 France Tire Derived Fuel (TDF) Market by Value, 2024-2034 (US$ Mn, AGR (%))
Figure 120 France Tire Derived Fuel (TDF) Market by Volume, 2024-2034 (MMT, AGR (%))
Figure 121 Italy Tire Derived Fuel (TDF) Market by Value, 2024-2034 (US$ Mn, AGR (%))
Figure 122 Italy Tire Derived Fuel (TDF) Market by Volume, 2024-2034 (MMT, AGR (%))
Figure 123 Spain Tire Derived Fuel (TDF) Market by Value, 2024-2034 (US$ Mn, AGR (%))
Figure 124 Spain Tire Derived Fuel (TDF) Market by Volume, 2024-2034 (MMT, AGR (%))
Figure 125 Rest of Europe Tire Derived Fuel (TDF) Market by Value, 2024-2034 (US$ Mn, AGR (%))
Figure 126 Rest of Europe Tire Derived Fuel (TDF) Market by Volume, 2024-2034 (MMT, AGR (%))
Figure 127 Asia-Pacific Tire Derived Fuel (TDF) Market Attractiveness Index
Figure 128 Asia-Pacific Tire Derived Fuel (TDF) Market by Region, 2024, 2029 & 2034 (US$ Million)
Figure 129 Asia-Pacific Tire Derived Fuel (TDF) Market by Value, 2024-2034 (US$ Mn, AGR (%))
Figure 130 Asia-Pacific Tire Derived Fuel (TDF) Market by Volume, 2024-2034 (MMT, AGR (%))
Figure 131 Asia-Pacific Tire Derived Fuel (TDF) Market by Country, 2024-2034 (US$ Mn, AGR (%))
Figure 132 Asia-Pacific Tire Derived Fuel (TDF) Market Volume by Country, 2024-2034 (MMT, AGR (%))
Figure 133 Asia-Pacific Tire Derived Fuel (TDF) Market Share Forecast by Country, 2024 & 2034 (%)
Figure 134 Asia-Pacific Tire Derived Fuel (TDF) Market by Form, 2024-2034 (US$ Mn, AGR (%))
Figure 135 Asia-Pacific Tire Derived Fuel (TDF) Market Share Forecast Form, 2024 & 2034 (%)
Figure 136 Asia-Pacific Tire Derived Fuel (TDF) Market by Application, 2024-2034 (US$ Mn, AGR (%))
Figure 137 Asia-Pacific Tire Derived Fuel (TDF) Market Share Forecast by Application, 2024 & 2034 (%)
Figure 138 Asia-Pacific Tire Derived Fuel (TDF) Market by Recycling Method, 2024-2034 (US$ Mn, AGR (%))
Figure 139 Asia-Pacific Tire Derived Fuel (TDF) Market Share Forecast by Recycling Method, 2024 & 2034 (%)
Figure 140 Asia-Pacific Tire Derived Fuel (TDF) Market by Tire Type, 2024-2034 (US$ Mn, AGR (%))
Figure 141 Asia-Pacific Tire Derived Fuel (TDF) Market Share Forecast by Tire Type, 2024 & 2034 (%)
Figure 142 Asia-Pacific Tire Derived Fuel (TDF) Market by End-use, 2024-2034 (US$ Mn, AGR (%))
Figure 143 Asia-Pacific Tire Derived Fuel (TDF) Market Share Forecast by End-Use, 2024 & 2034 (%)
Figure 144 China Tire Derived Fuel (TDF) Market by Value, 2024-2034 (US$ Mn, AGR (%))
Figure 145 China Tire Derived Fuel (TDF) Market by Volume, 2024-2034 (MMT, AGR (%))
Figure 146 India Tire Derived Fuel (TDF) Market by Value, 2024-2034 (US$ Mn, AGR (%))
Figure 147 India Tire Derived Fuel (TDF) Market by Volume, 2024-2034 (MMT, AGR (%))
Figure 148 Japan Tire Derived Fuel (TDF) Market by Value, 2024-2034 (US$ Mn, AGR (%))
Figure 149 Japan Tire Derived Fuel (TDF) Market by Volume, 2024-2034 (MMT, AGR (%))
Figure 150 South Korea Tire Derived Fuel (TDF) Market by Value, 2024-2034 (US$ Mn, AGR (%))
Figure 151 South Korea Tire Derived Fuel (TDF) Market by Volume, 2024-2034 (MMT, AGR (%))
Figure 152 Australia Tire Derived Fuel (TDF) Market by Value, 2024-2034 (US$ Mn, AGR (%))
Figure 153 Australia Tire Derived Fuel (TDF) Market by Volume, 2024-2034 (MMT, AGR (%))
Figure 154 Rest of Asia-Pacific Tire Derived Fuel (TDF) Market by Value, 2024-2034 (US$ Mn, AGR (%))
Figure 155 Rest of Asia-Pacific Tire Derived Fuel (TDF) Market by Volume, 2024-2034 (MMT, AGR (%))
Figure 156 Middle East and Africa Tire Derived Fuel (TDF) Market Attractiveness Index
Figure 157 Middle East and Africa Tire Derived Fuel (TDF) Market by Region, 2024, 2029 & 2034 (US$ Million)
Figure 158 Middle East & Africa Tire Derived Fuel (TDF) Market by Value, 2024-2034 (US$ Mn, AGR (%))
Figure 159 Middle East & Africa Tire Derived Fuel (TDF) Market by Volume, 2024-2034 (MMT, AGR (%))
Figure 160 Middle East & Africa Tire Derived Fuel (TDF) Market by Country, 2024-2034 (US$ Mn, AGR (%))
Figure 161 Middle East & Africa Tire Derived Fuel (TDF) Market Volume by Country, 2024-2034 (MMT, AGR (%))
Figure 162 Middle East and Africa Tire Derived Fuel (TDF) Market Share Forecast by Country, 2024 & 2034 (%)
Figure 163 Middle East & Africa Tire Derived Fuel (TDF) Market by Form, 2024-2034 (US$ Mn, AGR (%))
Figure 164 Middle East and Africa Tire Derived Fuel (TDF) Market Share Forecast Form, 2024 & 2034 (%)
Figure 165 Middle East & Africa Tire Derived Fuel (TDF) Market by Application, 2024-2034 (US$ Mn, AGR (%))
Figure 166 Middle East and Africa Tire Derived Fuel (TDF) Market Share Forecast by Application, 2024 & 2034 (%)
Figure 167 Middle East & Africa Tire Derived Fuel (TDF) Market by Recycling Method, 2024-2034 (US$ Mn, AGR (%))
Figure 168 Middle East and Africa Tire Derived Fuel (TDF) Market Share Forecast by Recycling Method, 2024 & 2034 (%)
Figure 169 Middle East & Africa Tire Derived Fuel (TDF) Market by Tire Type, 2024-2034 (US$ Mn, AGR (%))
Figure 170 Middle East and Africa Tire Derived Fuel (TDF) Market Share Forecast by Tire Type, 2024 & 2034 (%)
Figure 171 Middle East & Africa Tire Derived Fuel (TDF) Market by End-use, 2024-2034 (US$ Mn, AGR (%))
Figure 172 Middle East and Africa Tire Derived Fuel (TDF) Market Share Forecast by End-Use, 2024 & 2034 (%)
Figure 173 GCC Tire Derived Fuel (TDF) Market by Value, 2024-2034 (US$ Mn, AGR (%))
Figure 174 South Africa Tire Derived Fuel (TDF) Market by Value, 2024-2034 (US$ Mn, AGR (%))
Figure 175 Rest of Middle East & Africa Tire Derived Fuel (TDF) Market by Value, 2024-2034 (US$ Mn, AGR (%))
Figure 176 Latin America Tire Derived Fuel (TDF) Market Attractiveness Index
Figure 177 Latin America Tire Derived Fuel (TDF) Market by Region, 2024, 2029 & 2034 (US$ Million)
Figure 178 Latin America Tire Derived Fuel (TDF) Market by Value, 2024-2034 (US$ Mn, AGR (%))
Figure 179 Latin America Tire Derived Fuel (TDF) Market by Volume, 2024-2034 (MMT, AGR (%))
Figure 180 Latin America Tire Derived Fuel (TDF) Market by Country, 2024-2034 (US$ Mn, AGR (%))
Figure 181 Latin America Tire Derived Fuel (TDF) Market Volume by Country, 2024-2034 (MMT, AGR (%))
Figure 182 Latin America Tire Derived Fuel (TDF) Market Share Forecast by Country, 2024 & 2034 (%)
Figure 183 Latin America Tire Derived Fuel (TDF) Market by Form, 2024-2034 (US$ Mn, AGR (%))
Figure 184 Latin America Tire Derived Fuel (TDF) Market Share Forecast Form, 2024 & 2034 (%)
Figure 185 Latin America Tire Derived Fuel (TDF) Market by Application, 2024-2034 (US$ Mn, AGR (%))
Figure 186 Latin America Tire Derived Fuel (TDF) Market Share Forecast by Application, 2024 & 2034 (%)
Figure 187 Latin America Tire Derived Fuel (TDF) Market by Recycling Method, 2024-2034 (US$ Mn, AGR (%))
Figure 188 Latin America Tire Derived Fuel (TDF) Market Share Forecast by Recycling Method, 2024 & 2034 (%)
Figure 189 Latin America Tire Derived Fuel (TDF) Market by Tire Type, 2024-2034 (US$ Mn, AGR (%))
Figure 190 Latin America Tire Derived Fuel (TDF) Market Share Forecast by Tire Type, 2024 & 2034 (%)
Figure 191 Latin America Tire Derived Fuel (TDF) Market by End-use, 2024-2034 (US$ Mn, AGR (%))
Figure 192 Latin America Tire Derived Fuel (TDF) Market Share Forecast by End-Use, 2024 & 2034 (%)
Figure 193 Brazil Tire Derived Fuel (TDF) Market by Value, 2024-2034 (US$ Mn, AGR (%))
Figure 194 Brazil Tire Derived Fuel (TDF) Market by Volume, 2024-2034 (MMT, AGR (%))
Figure 195 Mexico Tire Derived Fuel (TDF) Market by Value, 2024-2034 (US$ Mn, AGR (%))
Figure 196 Mexico Tire Derived Fuel (TDF) Market by Volume, 2024-2034 (MMT, AGR (%))
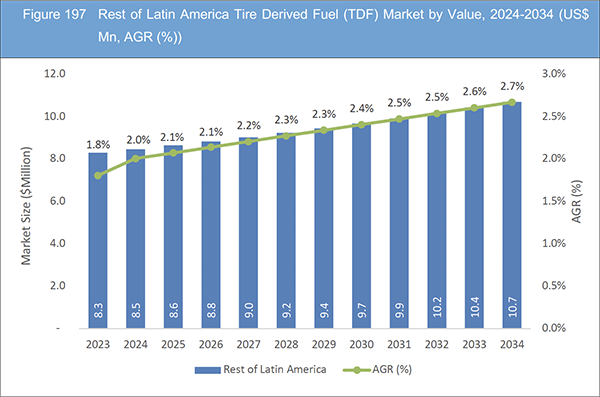
Figure 197 Rest of Latin America Tire Derived Fuel (TDF) Market by Value, 2024-2034 (US$ Mn, AGR (%))
Figure 198 Rest of Latin America Tire Derived Fuel (TDF) Market by Volume, 2024-2034 (MMT, AGR (%))
Figure 199 Babcock & Wilcox Enterprises, Inc.: Net Revenue, 2018-2022 (US$ Million, AGR%)
Figure 200 Babcock & Wilcox Enterprises, Inc.: R&D, 2018-2022 (US$ Million, AGR%)
Figure 201 Babcock & Wilcox Enterprises, Inc.: Regional Revenue Share, 2022 (%)
Figure 202 Babcock & Wilcox Enterprises, Inc.: Business Segment Revenue Share, 2022 (%)
ページTOPに戻る
Summary
Report Details
The Tire Derived Fuel (TDF) Market Report 2024-2034: This report will prove invaluable to leading firms striving for new revenue pockets if they wish to better understand the industry and its underlying dynamics. It will be useful for companies that would like to expand into different industries or to expand their existing operations in a new region.
Public Awareness and Corporate Sustainability Initiatives
Increasing public awareness of environmental issues and corporate sustainability initiatives drive the adoption of TDF. Consumers and businesses alike are increasingly conscious of the environmental impact of their activities. Industries incorporating TDF into their operations demonstrate a commitment to sustainable practices, enhancing their corporate image. Major corporations, such as Michelin, actively participate in tire recycling and TDF initiatives, aligning with global sustainability goals and fostering a positive market environment for the growth of tire-derived fuel.
Global Shift Towards Renewable Energy Sources and Cleaner Production Methods
The global shift towards renewable energy sources and cleaner production methods supports the TDF market’s growth. As industries aim to reduce their carbon footprint, TDF emerges as a renewable and low-carbon energy source. This aligns with the objectives of the renewable energy transition, emphasizing sustainable practices. In countries like Denmark, TDF contributes to the renewable energy mix, serving as a bridge between traditional fossil fuels and a cleaner, more sustainable energy future.
What Questions Should You Ask before Buying a Market Research Report?
• How is the tire derived fuel (TDF) market evolving?
• What is driving and restraining the tire derived fuel (TDF) market?
• How will each tire derived fuel (TDF) submarket segment grow over the forecast period and how much revenue will these submarkets account for in 2034?
• How will the market shares for each tire derived fuel (TDF) submarket develop from 2024 to 2034?
• What will be the main driver for the overall market from 2024 to 2034?
• Will leading tire derived fuel (TDF) markets broadly follow the macroeconomic dynamics, or will individual national markets outperform others?
• How will the market shares of the national markets change by 2034 and which geographical region will lead the market in 2034?
• Who are the leading players and what are their prospects over the forecast period?
• What are the tire derived fuel (TDF) projects for these leading companies?
• How will the industry evolve during the period between 2024 and 2034? What are the implications of tire derived fuel (TDF) projects taking place now and over the next 10 years?
• Is there a greater need for product commercialisation to further scale the tire derived fuel (TDF) market?
• Where is the tire derived fuel (TDF) market heading and how can you ensure you are at the forefront of the market?
• What are the best investment options for new product and service lines?
• What are the key prospects for moving companies into a new growth path and C-suite?
You need to discover how this will impact the tire derived fuel (TDF) market today, and over the next 10 years:
• Our 413-page report provides 152 tables and 202 charts/graphs exclusively to you.
• The report highlights key lucrative areas in the industry so you can target them – NOW.
• It contains in-depth analysis of global, regional and national sales and growth.
• It highlights for you the key successful trends, changes and revenue projections made by your competitors.
This report tells you TODAY how the tire derived fuel (TDF) market will develop in the next 10 years, and in line with the variations in COVID-19 economic recession and bounce. This market is more critical now than at any point over the last 10 years.
Forecasts to 2034 and other analyses reveal commercial prospects
• In addition to revenue forecasting to 2034, our new study provides you with recent results, growth rates, and market shares.
• You will find original analyses, with business outlooks and developments.
• Discover qualitative analyses (including market dynamics, drivers, opportunities, restraints and challenges), cost structure, impact of rising tire derived fuel (TDF) prices and recent developments.
This report includes data analysis and invaluable insight into how COVID-19 will affect the industry and your company. Four COVID-19 recovery patterns and their impact, namely, “V”, “L”, “W” and “U” are discussed in this report.
Segments Covered in the Report
Market Segment by Form
• Shredded Tire
• Whole Tire
Market Segment by Application
• Energy Recovery
• Material Recovery
• Chemical Processes
Market Segment by Recycling Method
• Mechanical Shredding
• Pyrolysis
• Cement Kiln Co-Processing
• Gasification
Market Segment by Tire Type
• Passenger Car Tires
• Light Commercial Vehicle Tires
• Heavy Commercial Vehicle Tires
• Off-road Vehicle Tires
• Other Tire Type
Market Segment by End-use
• Cement Industry
• Pulp and Paper Industry
• Utility and Power Generation
• Industrial Boilers
• Steel Manufacturing
• Other End-use
In addition to the revenue predictions for the overall world market and segments, you will also find revenue forecasts for four regional and 20 leading national markets:
North America
• U.S.
• Canada
Europe
• Germany
• Spain
• United Kingdom
• France
• Italy
• Rest of Europe
Asia Pacific
• China
• Japan
• India
• Australia
• South Korea
• Rest of Asia Pacific
Latin America
• Brazil
• Mexico
• Rest of Latin America
Middle East & Africa
• GCC
• South Africa
• Rest of Middle East & Africa
The report also includes profiles and for some of the leading companies in the Tire Derived Fuel (TDF) Market, 2024 to 2034, with a focus on this segment of these companies’ operations.
Leading companies profiled in the report
• Babcock & Wilcox Enterprises, Inc
• Beta Analytic Inc
• Emanuel Tire LLC
• Front Range Tire Recycle Inc.
• Lakin Tire
• Liberty Tire Recycling LLC
• MS Tire Recycling LLC
• Reliable Tire Disposal
• Remondis
• Renelux Cyprus Ltd
• ResourceCo Pty Ltd
• Tire Disposal and Recycling Inc.
• Tire Stewardship Manitoba
• Weibold
• West Coast Rubber Recycling Inc
Overall world revenue for Tire Derived Fuel (TDF) Market, 2024 to 2034 in terms of value the market will surpass US$408.0 million in 2024, our work calculates. We predict strong revenue growth through to 2034. Our work identifies which organizations hold the greatest potential. Discover their capabilities, progress, and commercial prospects, helping you stay ahead.
How will the Tire Derived Fuel (TDF) Market, 2024 to 2034 report help you?
In summary, our 410+ page report provides you with the following knowledge:
• Revenue forecasts to 2034 for Tire Derived Fuel (TDF) Market, 2024 to 2034 Market, with forecasts for market value, market volume, form, application, recycling method, tire type, and end-use, each forecast at a global and regional level – discover the industry’s prospects, finding the most lucrative places for investments and revenues.
• Revenue forecasts to 2034 for four regional and 20 key national markets – See forecasts for the Tire Derived Fuel (TDF) Market, 2024 to 2034 market in North America, Europe, Asia-Pacific, Latin America and Middle East & Africa. Also forecasted is the market in the US, Canada, Brazil, Germany, France, UK, Italy, China, India, Japan, and Australia among other prominent economies.
• Prospects for established firms and those seeking to enter the market – including company profiles for 15 of the major companies involved in the Tire Derived Fuel (TDF) Market, 2024 to 2034.
Find quantitative and qualitative analyses with independent predictions. Receive information that only our report contains, staying informed with invaluable business intelligence.
Information found nowhere else
With our new report, you are less likely to fall behind in knowledge or miss out on opportunities. See how our work could benefit your research, analyses, and decisions. Visiongain’s study is for everybody needing commercial analyses for the Tire Derived Fuel (TDF) Market, 2024 to 2034, market-leading companies. You will find data, trends and predictions.
ページTOPに戻る
Table of Contents
Table of Contents
1 Report Overview
1.1 Objectives of the Study
1.2 Introduction to Tire Derived Fuel (TDF) Market
1.3 What This Report Delivers
1.4 Why You Should Read This Report
1.5 Key Questions Answered by This Analytical Report
1.6 Who Is This Report for?
1.7 Methodology
1.7.1 Market Definitions
1.7.2 Market Evaluation & Forecasting Methodology
1.7.3 Data Validation
1.7.3.1 Primary Research
1.7.3.2 Secondary Research
1.8 Frequently Asked Questions (FAQs)
1.9 Associated Visiongain Reports
1.10 About Visiongain
2 Executive Summary
3 Market Overview
3.1 Key Findings
3.2 Market Dynamics
3.2.1 Market Driving Factors
3.2.1.1 Tire-derived Fuel is a Valuable Fuel Source for Cement, Steel, and Power Generation
3.2.1.2 The Abundance of Waste Tires Provides a Reliable and Consistent Feedstock for Tire-derived Fuel Production
3.2.1.3 The Benefits of Tire-Derived Fuel in Terms of Waste Reduction, Energy Recovery, and Environmental Sustainability
3.2.2 Market Restraining Factors
3.2.2.1 The Availability and Cost-Effectiveness of Alternative Fuels or Energy Sources
3.2.2.2 Fluctuations in Energy Prices, Market Demand Can Impact the Economic Viability of Tire-derived Fuel Projects
3.2.2.3 Economic Considerations May Pose a Challenge to the Widespread Adoption of Tire Derived Fuel
3.2.3 Market Opportunities
3.2.3.1 Technological Advancements in Pyrolysis and Gasification
3.2.3.2 Government Incentives, Subsidies, and Supportive Policies
3.2.3.3 The Continuous Growth in Global Tire Production and Disposal Rates Ensures a Steady Supply of Raw Materials for Tire-derived Fuel Production.
3.3 Porter’s Five Forces Analysis
3.3.1 Bargaining Power of Suppliers (Medium)
3.3.2 Bargaining Power of Buyers (Medium)
3.3.3 Competitive Rivalry (Medium)
3.3.4 Threat from Substitutes (High)
3.3.5 Threat of New Entrants (Low)
3.4 COVID-19 Impact Analysis
3.4.1 “V-Shaped Recovery”
3.4.2 “U-Shaped Recovery”
3.4.3 “W-Shaped Recovery”
3.4.4 “L-Shaped Recovery”
3.5 PEST Analysis
4 Tire Derived Fuel (TDF) Market Analysis by Form
4.1 Key Findings
4.2 Form Segment: Market Attractiveness Index
4.3 Tire Derived Fuel (TDF) Market Size Estimation and Forecast by Form
4.4 Shredded Tire
4.4.1 Market Size by Region, 2024-2034 (US$ Million)
4.4.2 Market Share by Region, 2024 & 2034 (%)
4.5 Whole Tire
4.5.1 Market Size by Region, 2024-2034 (US$ Million)
4.5.2 Market Share by Region, 2024 & 2034 (%)
5 Tire Derived Fuel (TDF) Market Analysis by Application
5.1 Key Findings
5.2 Application Segment: Market Attractiveness Index
5.3 Tire Derived Fuel (TDF) Market Size Estimation and Forecast by Application
5.4 Energy Recovery
5.4.1 Market Size by Region, 2024-2034 (US$ Million)
5.4.2 Market Share by Region, 2024 & 2034 (%)
5.5 Material Recovery
5.5.1 Market Size by Region, 2024-2034 (US$ Million)
5.5.2 Market Share by Region, 2024 & 2034 (%)
5.6 Chemical Processes
5.6.1 Market Size by Region, 2024-2034 (US$ Million)
5.6.2 Market Share by Region, 2024 & 2034 (%)
6 Tire Derived Fuel (TDF) Market Analysis by Recycling Method
6.1 Key Findings
6.2 Recycling Method Segment: Market Attractiveness Index
6.3 Tire Derived Fuel (TDF) Market Size Estimation and Forecast by Recycling Method
6.4 Mechanical Shredding
6.4.1 Market Size by Region, 2024-2034 (US$ Million)
6.4.2 Market Share by Region, 2024 & 2034 (%)
6.5 Pyrolysis
6.5.1 Market Size by Region, 2024-2034 (US$ Million)
6.5.2 Market Share by Region, 2024 & 2034 (%)
6.6 Cement Kiln Co-Processing
6.6.1 Market Size by Region, 2024-2034 (US$ Million)
6.6.2 Market Share by Region, 2024 & 2034 (%)
6.7 Gasification
6.7.1 Market Size by Region, 2024-2034 (US$ Million)
6.7.2 Market Share by Region, 2024 & 2034 (%)
7 Tire Derived Fuel (TDF) Market Analysis by Tire Type
7.1 Key Findings
7.2 Tire Type Segment: Market Attractiveness Index
7.3 Tire Derived Fuel (TDF) Market Size Estimation and Forecast by Tire Type
7.4 Passenger Car Tires
7.4.1 Market Size by Region, 2024-2034 (US$ Million)
7.4.2 Market Share by Region, 2024 & 2034 (%)
7.5 Light Commercial Vehicle Tires
7.5.1 Market Size by Region, 2024-2034 (US$ Million)
7.5.2 Market Share by Region, 2024 & 2034 (%)
7.6 Heavy Commercial Vehicle Tires
7.6.1 Market Size by Region, 2024-2034 (US$ Million)
7.6.2 Market Share by Region, 2024 & 2034 (%)
7.7 Off-road Vehicle Tires
7.7.1 Market Size by Region, 2024-2034 (US$ Million)
7.7.2 Market Share by Region, 2024 & 2034 (%)
7.8 Other Tire Type
7.8.1 Market Size by Region, 2024-2034 (US$ Million)
7.8.2 Market Share by Region, 2024 & 2034 (%)
8 Tire Derived Fuel (TDF) Market Analysis by End-Use
8.1 Key Findings
8.2 End-Use Segment: Market Attractiveness Index
8.3 Tire Derived Fuel (TDF) Market Size Estimation and Forecast by Tire Type
8.4 Cement Industry
8.4.1 Market Size by Region, 2024-2034 (US$ Million)
8.4.2 Market Share by Region, 2024 & 2034 (%)
8.5 Pulp and Paper Industry
8.5.1 Market Size by Region, 2024-2034 (US$ Million)
8.5.2 Market Share by Region, 2024 & 2034 (%)
8.6 Utility and Power Generation
8.6.1 Market Size by Region, 2024-2034 (US$ Million)
8.6.2 Market Share by Region, 2024 & 2034 (%)
8.7 Industrial Boilers
8.7.1 Market Size by Region, 2024-2034 (US$ Million)
8.7.2 Market Share by Region, 2024 & 2034 (%)
8.8 Steel Manufacturing
8.8.1 Market Size by Region, 2024-2034 (US$ Million)
8.8.2 Market Share by Region, 2024 & 2034 (%)
8.9 Other End-use
8.9.1 Market Size by Region, 2024-2034 (US$ Million)
8.9.2 Market Share by Region, 2024 & 2034 (%)
9 Tire Derived Fuel (TDF) Market Analysis by Region
9.1 Key Findings
9.2 Regional Market Size Estimation and Forecast
10 North America Tire Derived Fuel (TDF) Market Analysis
10.1 Key Findings
10.2 North America Tire Derived Fuel (TDF) Market Attractiveness Index
10.3 North America Tire Derived Fuel (TDF) Market by Country, 2024, 2029 & 2034 (US$ Million)
10.4 North America Tire Derived Fuel (TDF) Market Size Estimation and Forecast
10.5 North America Tire Derived Fuel (TDF) Market Size Estimation and Forecast by Country
10.6 North America Tire Derived Fuel (TDF) Market Size Estimation and Forecast by Form
10.7 North America Tire Derived Fuel (TDF) Market Size Estimation and Forecast by Application
10.8 North America Tire Derived Fuel (TDF) Market Size Estimation and Forecast by Recycling Method
10.9 North America Tire Derived Fuel (TDF) Market Size Estimation and Forecast by Tire Type
10.10 North America Tire Derived Fuel (TDF) Market Size Estimation and Forecast by End-Use
10.11 U.S. Tire Derived Fuel (TDF) Market Analysis
10.12 Canada Tire Derived Fuel (TDF) Market Analysis
11 Europe Tire Derived Fuel (TDF) Market Analysis
11.1 Key Findings
11.2 Europe Tire Derived Fuel (TDF) Market Attractiveness Index
11.3 Europe Tire Derived Fuel (TDF) Market by Country, 2024, 2029 & 2034 (US$ Million)
11.4 Europe Tire Derived Fuel (TDF) Market Size Estimation and Forecast
11.5 Europe Tire Derived Fuel (TDF) Market Size Estimation and Forecast by Country
11.6 Europe Tire Derived Fuel (TDF) Market Size Estimation and Forecast by Form
11.7 Europe Tire Derived Fuel (TDF) Market Size Estimation and Forecast by Application
11.8 Europe Tire Derived Fuel (TDF) Market Size Estimation and Forecast by Recycling Method
11.9 Europe Tire Derived Fuel (TDF) Market Size Estimation and Forecast by Tire Type
11.10 Europe Tire Derived Fuel (TDF) Market Size Estimation and Forecast by End-Use
11.11 Germany Tire Derived Fuel (TDF) Market Analysis
11.12 UK Tire Derived Fuel (TDF) Market Analysis
11.13 France Tire Derived Fuel (TDF) Market Analysis
11.14 Italy Tire Derived Fuel (TDF) Market Analysis
11.15 Spain Tire Derived Fuel (TDF) Market Analysis
11.16 Rest of Europe Tire Derived Fuel (TDF) Market Analysis
12 Asia-Pacific Tire Derived Fuel (TDF) Market Analysis
12.1 Key Findings
12.2 Asia-Pacific Tire Derived Fuel (TDF) Market Attractiveness Index
12.3 Asia-Pacific Tire Derived Fuel (TDF) Market by Country, 2024, 2029 & 2034 (US$ Million)
12.4 Asia-Pacific Tire Derived Fuel (TDF) Market Size Estimation and Forecast
12.5 Asia-Pacific Tire Derived Fuel (TDF) Market Size Estimation and Forecast by Country
12.6 Asia-Pacific Tire Derived Fuel (TDF) Market Size Estimation and Forecast by Form
12.7 Asia-Pacific Tire Derived Fuel (TDF) Market Size Estimation and Forecast by Application
12.8 Asia-Pacific Tire Derived Fuel (TDF) Market Size Estimation and Forecast by Recycling Method
12.9 Asia-Pacific Tire Derived Fuel (TDF) Market Size Estimation and Forecast by Tire Type
12.10 Asia-Pacific Tire Derived Fuel (TDF) Market Size Estimation and Forecast by End-Use
12.11 China Tire Derived Fuel (TDF) Market Analysis
12.12 India Tire Derived Fuel (TDF) Market Analysis
12.13 Japan Tire Derived Fuel (TDF) Market Analysis
12.14 South Korea Tire Derived Fuel (TDF) Market Analysis
12.15 Australia Tire Derived Fuel (TDF) Market Analysis
12.16 Rest of Asia-Pacific Tire Derived Fuel (TDF) Market Analysis
13 Middle East and Africa Tire Derived Fuel (TDF) Market Analysis
13.1 Key Findings
13.2 Middle East and Africa Tire Derived Fuel (TDF) Market Attractiveness Index
13.3 Middle East and Africa Tire Derived Fuel (TDF) Market by Country, 2024, 2029 & 2034 (US$ Million)
13.4 Middle East and Africa Tire Derived Fuel (TDF) Market Size Estimation and Forecast
13.5 Middle East and Africa Tire Derived Fuel (TDF) Market Size Estimation and Forecast by Country
13.6 Middle East and Africa Tire Derived Fuel (TDF) Market Size Estimation and Forecast by Form
13.7 Middle East and Africa Tire Derived Fuel (TDF) Market Size Estimation and Forecast by Application
13.8 Middle East and Africa Tire Derived Fuel (TDF) Market Size Estimation and Forecast by Recycling Method
13.9 Middle East and Africa Tire Derived Fuel (TDF) Market Size Estimation and Forecast by Tire Type
13.10 Middle East and Africa Tire Derived Fuel (TDF) Market Size Estimation and Forecast by End-Use
13.11 GCC Tire Derived Fuel (TDF) Market Analysis
13.12 South Africa Tire Derived Fuel (TDF) Market Analysis
13.13 Rest of Middle East & Africa Tire Derived Fuel (TDF) Market Analysis
14 Latin America Tire Derived Fuel (TDF) Market Analysis
14.1 Key Findings
14.2 Latin America Tire Derived Fuel (TDF) Market Attractiveness Index
14.3 Latin America Tire Derived Fuel (TDF) Market by Country, 2024, 2029 & 2034 (US$ Million)
14.4 Latin America Tire Derived Fuel (TDF) Market Size Estimation and Forecast
14.5 Latin America Tire Derived Fuel (TDF) Market Size Estimation and Forecast by Country
14.6 Latin America Tire Derived Fuel (TDF) Market Size Estimation and Forecast by Form
14.7 Latin America Tire Derived Fuel (TDF) Market Size Estimation and Forecast by Application
14.8 Latin America Tire Derived Fuel (TDF) Market Size Estimation and Forecast by Recycling Method
14.9 Latin America Tire Derived Fuel (TDF) Market Size Estimation and Forecast by Tire Type
14.10 Latin America Tire Derived Fuel (TDF) Market Size Estimation and Forecast by End-Use
14.11 Brazil Tire Derived Fuel (TDF) Market Analysis
14.12 Mexico Tire Derived Fuel (TDF) Market Analysis
14.13 Rest of Latin America Tire Derived Fuel (TDF) Market Analysis
15 Company Profiles
15.1 Competitive Landscape, 2022
15.2 Strategic Outlook
15.3 Babcock & Wilcox Enterprises, Inc
15.3.1 Company Snapshot
15.3.2 Company Overview
15.3.3 Financial Analysis
15.3.3.1 Net Revenue, 2018-2022
15.3.3.2 R&D, 2018-2022
15.3.3.3 Regional Revenue Share, 2022 (%)
15.3.3.4 Business Segment Revenue Share, 2022 (%)
15.3.4 Product Benchmarking
15.3.5 Strategic Outlook
15.4 Beta Analytic Inc
15.4.1 Company Snapshot
15.4.2 Company Overview
15.4.3 Product Benchmarking
15.5 Emanuel Tire LLC
15.5.1 Company Snapshot
15.5.2 Company Overview
15.5.3 Product Benchmarking
15.5.4 Strategic Outlook
15.6 Lakin Tire
15.6.1 Company Snapshot
15.6.2 Company Overview
15.6.3 Product Benchmarking
15.6.4 Strategic Outlook
15.7 Liberty Tire Recycling LLC
15.7.1 Company Snapshot
15.7.2 Company Overview
15.7.3 Product Benchmarking
15.7.4 Strategic Outlook
15.8 MS Tire Recycling LLC
15.8.1 Company Snapshot
15.8.2 Company Overview
15.8.3 Product Benchmarking
15.9 Reliable Tire Disposal
15.9.1 Company Snapshot
15.9.2 Company Overview
15.9.3 Product Benchmarking
15.10 Renelux Cyprus Ltd
15.10.1 Company Snapshot
15.10.2 Company Overview
15.10.3 Product Benchmarking
15.11 ResourceCo Pty Ltd
15.11.1 Company Snapshot
15.11.2 Company Overview
15.11.3 Product Benchmarking
15.11.4 Strategic Outlook
15.12 Remondis
15.12.1 Company Snapshot
15.12.2 Company Overview
15.12.3 Product Benchmarking
15.13 Tire Disposal and Recycling Inc.
15.13.1 Company Snapshot
15.13.2 Company Overview
15.13.3 Product Benchmarking
15.14 Tire Stewardship Manitoba
15.14.1 Company Snapshot
15.14.2 Company Overview
15.14.3 Product Benchmarking
15.15 Weibold
15.15.1 Company Snapshot
15.15.2 Company Overview
15.15.3 Product Benchmarking
15.16 West Coast Rubber Recycling Inc
15.16.1 Company Snapshot
15.16.2 Company Overview
15.16.3 Product Benchmarking
15.16.4 Strategic Outlook
15.17 Front Range Tire Recycle Inc.
15.17.1 Company Snapshot
15.17.2 Company Overview
15.17.3 Product Benchmarking
16 Conclusion and Recommendations
16.1 Concluding Remarks from Visiongain
16.2 Recommendations for Market Players
ページTOPに戻る
List of Tables/Graphs
List of Tables
Table 1 Tire Derived Fuel (TDF) Market Snapshot, 2024 & 2034 (US$ Million, CAGR %)
Table 2 Crude steel production by region
Table 3 Global Tire Derived Fuel (TDF) Market by Region, 2024-2034 (US$ Mn, AGR (%), CAGR (%)) (V-Shaped Recovery Scenario)
Table 4 Global Tire Derived Fuel (TDF) Market by Region, 2024-2034 (US$ Mn, AGR (%), CAGR (%)) (U-Shaped Recovery Scenario)
Table 5 Global Tire Derived Fuel (TDF) Market by Region, 2024-2034 (US$ Mn, AGR (%), CAGR (%)) (W-Shaped Recovery Scenario)
Table 6 Global Tire Derived Fuel (TDF) Market by Region, 2024-2034 (US$ Mn, AGR (%), CAGR (%)) (L-Shaped Recovery Scenario)
Table 7 Global Tire Derived Fuel (TDF) Market by Form, 2024-2034 (US$ Mn, AGR (%), CAGR (%))
Table 8 Shredded Tire Market by Region, 2024-2034 (US$ Mn, AGR (%), CAGR (%))
Table 9 Whole Tire Market by Region, 2024-2034 (US$ Mn, AGR (%), CAGR (%))
Table 10 Global Tire Derived Fuel (TDF) Market by Application, 2024-2034 (US$ Mn, AGR (%), CAGR (%))
Table 11 Energy Recovery Market by Region, 2024-2034 (US$ Mn, AGR (%), CAGR (%))
Table 12 Material Recovery Market by Region, 2024-2034 (US$ Mn, AGR (%), CAGR (%))
Table 13 Chemical Processes Market by Region, 2024-2034 (US$ Mn, AGR (%), CAGR (%))
Table 14 Global Tire Derived Fuel (TDF) Market by Recycling Method, 2024-2034 (US$ Mn, AGR (%), CAGR (%))
Table 15 Mechanical Shredding Market by Region, 2024-2034 (US$ Mn, AGR (%), CAGR (%))
Table 16 Pyrolysis Market by Region, 2024-2034 (US$ Mn, AGR (%), CAGR (%))
Table 17 Cement Kiln Co-Processing Market by Region, 2024-2034 (US$ Mn, AGR (%), CAGR (%))
Table 18 Gasification Market by Region, 2024-2034 (US$ Mn, AGR (%), CAGR (%))
Table 19 Global Tire Derived Fuel (TDF) Market by Tire Type, 2024-2034 (US$ Mn, AGR (%), CAGR (%))
Table 20 Passenger Car Tires Market by Region, 2024-2034 (US$ Mn, AGR (%), CAGR (%))
Table 21 Light Commercial Vehicle Tires Market by Region, 2024-2034 (US$ Mn, AGR (%), CAGR (%))
Table 22 Heavy Commercial Vehicle Tires Market by Region, 2024-2034 (US$ Mn, AGR (%), CAGR (%))
Table 23 Off-road Vehicle Tires Market by Region, 2024-2034 (US$ Mn, AGR (%), CAGR (%))
Table 24 Other Tire Type Market by Region, 2024-2034 (US$ Mn, AGR (%), CAGR (%))
Table 25 Global Tire Derived Fuel (TDF) Market by End-use, 2024-2034 (US$ Mn, AGR (%), CAGR (%))
Table 26 Cement Industry Market by Region, 2024-2034 (US$ Mn, AGR (%), CAGR (%))
Table 27 Pulp and Paper Industry Market by Region, 2024-2034 (US$ Mn, AGR (%), CAGR (%))
Table 28 Utility and Power Generation Market by Region, 2024-2034 (US$ Mn, AGR (%), CAGR (%))
Table 29 Industrial Boilers Market by Region, 2024-2034 (US$ Mn, AGR (%), CAGR (%))
Table 30 Steel Manufacturing Market by Region, 2024-2034 (US$ Mn, AGR (%), CAGR (%))
Table 31 Other End-use Market by Region, 2024-2034 (US$ Mn, AGR (%), CAGR (%))
Table 32 Tire Derived Fuel (TDF) Market Forecast by Region, 2024-2034 (US$ Million, AGR%, CAGR%)
Table 33 North America Tire Derived Fuel (TDF) Market by Value, 2024-2034 (US$ Mn, AGR (%), CAGR (%))
Table 34 North America Tire Derived Fuel (TDF) Market by Volume, 2024-2034 (US$ Mn, AGR (%), CAGR (%))
Table 35 North America Tire Derived Fuel (TDF) Market by Country, 2024-2034 (US$ Mn, AGR (%), CAGR (%))
Table 36 North America Tire Derived Fuel (TDF) Market Volume by Country, 2024-2034 (US$ Mn, AGR (%), CAGR (%))
Table 37 North America Tire Derived Fuel (TDF) Market by Form, 2024-2034 (US$ Mn, AGR (%), CAGR (%))
Table 38 North America Tire Derived Fuel (TDF) Market by Application, 2024-2034 (US$ Mn, AGR (%), CAGR (%))
Table 39 North America Tire Derived Fuel (TDF) Market by Recycling Method, 2024-2034 (US$ Mn, AGR (%), CAGR (%))
Table 40 North America Tire Derived Fuel (TDF) Market by Tire Type, 2024-2034 (US$ Mn, AGR (%), CAGR (%))
Table 41 North America Tire Derived Fuel (TDF) Market by End-use, 2024-2034 (US$ Mn, AGR (%), CAGR (%))
Table 42 US Tire Derived Fuel (TDF) Market by Value, 2024-2034 (US$ Mn, AGR (%), CAGR (%))
Table 43 US Tire Derived Fuel (TDF) Market by Volume, 2024-2034 (MMT, AGR (%), CAGR (%))
Table 44 Canada Tire Derived Fuel (TDF) Market by Value, 2024-2034 (US$ Mn, AGR (%), CAGR (%))
Table 45 Canada Tire Derived Fuel (TDF) Market by Volume, 2024-2034 (MMT, AGR (%), CAGR (%))
Table 46 Europe Tire Derived Fuel (TDF) Market by Value, 2024-2034 (US$ Mn, AGR (%), CAGR (%))
Table 47 Europe Tire Derived Fuel (TDF) Market by Volume, 2024-2034 (MMT, AGR (%), CAGR (%))
Table 48 Europe Tire Derived Fuel (TDF) Market by Country, 2024-2034 (US$ Mn, AGR (%), CAGR (%))
Table 49 Europe Tire Derived Fuel (TDF) Market Volume by Country, 2024-2034 (MMT, AGR (%), CAGR (%))
Table 50 Europe Tire Derived Fuel (TDF) Market by Form, 2024-2034 (US$ Mn, AGR (%), CAGR (%))
Table 51 Europe Tire Derived Fuel (TDF) Market by Application, 2024-2034 (US$ Mn, AGR (%), CAGR (%))
Table 52 Europe Tire Derived Fuel (TDF) Market by Recycling Method, 2024-2034 (US$ Mn, AGR (%), CAGR (%))
Table 53 Europe Tire Derived Fuel (TDF) Market by Tire Type, 2024-2034 (US$ Mn, AGR (%), CAGR (%))
Table 54 Europe Tire Derived Fuel (TDF) Market by End-use, 2024-2034 (US$ Mn, AGR (%), CAGR (%))
Table 55 Germany Tire Derived Fuel (TDF) Market by Value, 2024-2034 (US$ Mn, AGR (%), CAGR (%))
Table 56 Germany Tire Derived Fuel (TDF) Market by Volume, 2024-2034 (MMT, AGR (%), CAGR (%))
Table 57 UK Tire Derived Fuel (TDF) Market by Value, 2024-2034 (US$ Mn, AGR (%), CAGR (%))
Table 58 UK Tire Derived Fuel (TDF) Market by Volume, 2024-2034 (MMT, AGR (%), CAGR (%))
Table 59 France Tire Derived Fuel (TDF) Market by Value, 2024-2034 (US$ Mn, AGR (%), CAGR (%))
Table 60 France Tire Derived Fuel (TDF) Market by Volume, 2024-2034 (MMT, AGR (%), CAGR (%))
Table 61 Italy Tire Derived Fuel (TDF) Market by Value, 2024-2034 (US$ Mn, AGR (%), CAGR (%))
Table 62 Italy Tire Derived Fuel (TDF) Market by Volume, 2024-2034 (MMT, AGR (%), CAGR (%))
Table 63 Spain Tire Derived Fuel (TDF) Market by Value, 2024-2034 (US$ Mn, AGR (%), CAGR (%))
Table 64 Spain Tire Derived Fuel (TDF) Market by Volume, 2024-2034 (MMT, AGR (%), CAGR (%))
Table 65 Rest of Europe Tire Derived Fuel (TDF) Market by Value, 2024-2034 (US$ Mn, AGR (%), CAGR (%))
Table 66 Rest of Europe Tire Derived Fuel (TDF) Market by Volume, 2024-2034 (MMT, AGR (%), CAGR (%))
Table 67 Asia-Pacific Tire Derived Fuel (TDF) Market by Value, 2024-2034 (US$ Mn, AGR (%), CAGR (%))
Table 68 Asia-Pacific Tire Derived Fuel (TDF) Market by Volume, 2024-2034 (MMT, AGR (%), CAGR (%))
Table 69 Asia-Pacific Tire Derived Fuel (TDF) Market by Country, 2024-2034 (US$ Mn, AGR (%), CAGR (%))
Table 70 Asia-Pacific Tire Derived Fuel (TDF) Market Volume by Country, 2024-2034 (MMT, AGR (%), CAGR (%))
Table 71 Asia-Pacific Tire Derived Fuel (TDF) Market by Form, 2024-2034 (US$ Mn, AGR (%), CAGR (%))
Table 72 Asia-Pacific Tire Derived Fuel (TDF) Market by Application, 2024-2034 (US$ Mn, AGR (%), CAGR (%))
Table 73 Asia-Pacific Tire Derived Fuel (TDF) Market by Recycling Method, 2024-2034 (US$ Mn, AGR (%), CAGR (%))
Table 74 Asia-Pacific Tire Derived Fuel (TDF) Market by Tire Type, 2024-2034 (US$ Mn, AGR (%), CAGR (%))
Table 75 Asia-Pacific Tire Derived Fuel (TDF) Market by End-use, 2024-2034 (US$ Mn, AGR (%), CAGR (%))
Table 76 China Tire Derived Fuel (TDF) Market by Value, 2024-2034 (US$ Mn, AGR (%), CAGR (%))
Table 77 China Tire Derived Fuel (TDF) Market by Volume, 2024-2034 (MMT, AGR (%), CAGR (%))
Table 78 India Tire Derived Fuel (TDF) Market by Value, 2024-2034 (US$ Mn, AGR (%), CAGR (%))
Table 79 India Tire Derived Fuel (TDF) Market by Volume, 2024-2034 (MMT, AGR (%), CAGR (%))
Table 80 Japan Tire Derived Fuel (TDF) Market by Value, 2024-2034 (US$ Mn, AGR (%), CAGR (%))
Table 81 Japan Tire Derived Fuel (TDF) Market by Volume, 2024-2034 (MMT, AGR (%), CAGR (%))
Table 82 South Korea Tire Derived Fuel (TDF) Market by Value, 2024-2034 (US$ Mn, AGR (%), CAGR (%))
Table 83 South Korea Tire Derived Fuel (TDF) Market by Volume, 2024-2034 (MMT, AGR (%), CAGR (%))
Table 84 Australia Tire Derived Fuel (TDF) Market by Value, 2024-2034 (US$ Mn, AGR (%), CAGR (%))
Table 85 Australia Tire Derived Fuel (TDF) Market by Volume, 2024-2034 (MMT, AGR (%), CAGR (%))
Table 86 Rest of Asia-Pacific Tire Derived Fuel (TDF) Market by Value, 2024-2034 (US$ Mn, AGR (%), CAGR (%))
Table 87 Rest of Asia-Pacific Tire Derived Fuel (TDF) Market by Volume, 2024-2034 (MMT, AGR (%), CAGR (%))
Table 88 Middle East & Africa Tire Derived Fuel (TDF) Market by Value, 2024-2034 (US$ Mn, AGR (%), CAGR (%))
Table 89 Middle East & Africa Tire Derived Fuel (TDF) Market by Volume, 2024-2034 (MMT, AGR (%), CAGR (%))
Table 90 Middle East & Africa Tire Derived Fuel (TDF) Market by Country, 2024-2034 (US$ Mn, AGR (%), CAGR (%))
Table 91 Middle East & Africa Tire Derived Fuel (TDF) Market Volume by Country, 2024-2034 (MMT, AGR (%), CAGR (%))
Table 92 Middle East & Africa Tire Derived Fuel (TDF) Market by Form, 2024-2034 (US$ Mn, AGR (%), CAGR (%))
Table 93 Middle East & Africa Tire Derived Fuel (TDF) Market by Application, 2024-2034 (US$ Mn, AGR (%), CAGR (%))
Table 94 Middle East & Africa Tire Derived Fuel (TDF) Market by Recycling Method, 2024-2034 (US$ Mn, AGR (%), CAGR (%))
Table 95 Middle East & Africa Tire Derived Fuel (TDF) Market by Tire Type, 2024-2034 (US$ Mn, AGR (%), CAGR (%))
Table 96 Middle East & Africa Tire Derived Fuel (TDF) Market by End-use, 2024-2034 (US$ Mn, AGR (%), CAGR (%))
Table 97 GCC Tire Derived Fuel (TDF) Market by Value, 2024-2034 (US$ Mn, AGR (%), CAGR (%))
Table 98 South Africa Tire Derived Fuel (TDF) Market by Value, 2024-2034 (US$ Mn, AGR (%), CAGR (%))
Table 99 Rest of Middle East & Africa Tire Derived Fuel (TDF) Market by Value, 2024-2034 (US$ Mn, AGR (%), CAGR (%))
Table 100 Latin America Tire Derived Fuel (TDF) Market by Value, 2024-2034 (US$ Mn, AGR (%), CAGR (%))
Table 101 Latin America Tire Derived Fuel (TDF) Market by Volume, 2024-2034 (MMT, AGR (%), CAGR (%))
Table 102 Latin America Tire Derived Fuel (TDF) Market by Country, 2024-2034 (US$ Mn, AGR (%), CAGR (%))
Table 103 Latin America Tire Derived Fuel (TDF) Market Volume by Country, 2024-2034 (MMT, AGR (%), CAGR (%))
Table 104 Latin America Tire Derived Fuel (TDF) Market by Form, 2024-2034 (US$ Mn, AGR (%), CAGR (%))
Table 105 Latin America Tire Derived Fuel (TDF) Market by Application, 2024-2034 (US$ Mn, AGR (%), CAGR (%))
Table 106 Latin America Tire Derived Fuel (TDF) Market by Recycling Method, 2024-2034 (US$ Mn, AGR (%), CAGR (%))
Table 107 Latin America Tire Derived Fuel (TDF) Market by Tire Type, 2024-2034 (US$ Mn, AGR (%), CAGR (%))
Table 108 Latin America Tire Derived Fuel (TDF) Market by End-use, 2024-2034 (US$ Mn, AGR (%), CAGR (%))
Table 109 Brazil Tire Derived Fuel (TDF) Market by Value, 2024-2034 (US$ Mn, AGR (%), CAGR (%))
Table 110 Brazil Tire Derived Fuel (TDF) Market by Volume, 2024-2034 (MMT, AGR (%), CAGR (%))
Table 111 Mexico Tire Derived Fuel (TDF) Market by Value, 2024-2034 (US$ Mn, AGR (%), CAGR (%))
Table 112 Mexico Tire Derived Fuel (TDF) Market by Volume, 2024-2034 (MMT, AGR (%), CAGR (%))
Table 113 Rest of Latin America Tire Derived Fuel (TDF) Market by Value, 2024-2034 (US$ Mn, AGR (%), CAGR (%))
Table 114 Rest of Latin America Tire Derived Fuel (TDF) Market by Volume, 2024-2034 (MMT, AGR (%), CAGR (%))
Table 115 Company Ranking
Table 116 Strategic Outlook - Contract
Table 117 Babcock & Wilcox Enterprises, Inc: Key Details, (CEO, HQ, Revenue, Founded, No. of Employees, Company Type, Website, Business Segment)
Table 118 Babcock & Wilcox Enterprises, Inc: Product Benchmarking
Table 119 Babcock & Wilcox Enterprises, Inc: Strategic Outlook
Table 120 Beta Analytic Inc: Key Details, (CEO, HQ, Revenue, Founded, No. of Employees, Company Type, Website, Business Segment)
Table 121 Beta Analytic Inc: Product Benchmarking
Table 122 Emanuel Tire LLC: Key Details, (CEO, HQ, Revenue, Founded, No. of Employees, Company Type, Website, Business Segment)
Table 123 Emanuel Tire LLC: Product Benchmarking
Table 124 Emanuel Tire LLC: Strategic Outlook
Table 125 Lakin Tire: Key Details, (CEO, HQ, Revenue, Founded, No. of Employees, Company Type, Website, Business Segment)
Table 126 Lakin Tire: Product Benchmarking
Table 127 Lakin Tire: Strategic Outlook
Table 128 Liberty Tire Recycling LLC: Key Details, (CEO, HQ, Revenue, Founded, No. of Employees, Company Type, Website, Business Segment)
Table 129 Liberty Tire Recycling LLC: Product Benchmarking
Table 130 Liberty Tire Recycling LLC: Strategic Outlook
Table 131 MS Tire Recycling LLC: Key Details, (CEO, HQ, Revenue, Founded, No. of Employees, Company Type, Website, Business Segment)
Table 132 MS Tire Recycling LLC: Product Benchmarking
Table 133 Reliable Tire Disposal: Key Details, (CEO, HQ, Revenue, Founded, No. of Employees, Company Type, Website, Business Segment)
Table 134 Reliable Tire Disposal: Product Benchmarking
Table 135 Renelux Cyprus Ltd: Key Details, (CEO, HQ, Revenue, Founded, No. of Employees, Company Type, Website, Business Segment)
Table 136 Renelux Cyprus Ltd: Product Benchmarking
Table 137 Resources Pty Ltd: Key Details, (CEO, HQ, Revenue, Founded, No. of Employees, Company Type, Website, Business Segment)
Table 138 ResourceCo Pty Ltd: Product Benchmarking
Table 139 ResourceCo Pty Ltd: Strategic Outlook
Table 140 Remondis: Key Details, (CEO, HQ, Revenue, Founded, No. of Employees, Company Type, Website, Business Segment)
Table 141 Remondis: Product Benchmarking
Table 142 Tire Disposal and Recycling Inc.: Key Details, (CEO, HQ, Revenue, Founded, No. of Employees, Company Type, Website, Business Segment)
Table 143 Tire Disposal and Recycling Inc.: Product Benchmarking
Table 144 Tire Stewardship Manitoba: Key Details, (CEO, HQ, Revenue, Founded, No. of Employees, Company Type, Website, Business Segment)
Table 145 Tire Stewardship Manitoba: Product Benchmarking
Table 146 Weibold: Key Details, (CEO, HQ, Revenue, Founded, No. of Employees, Company Type, Website, Business Segment)
Table 147 Weibold: Product Benchmarking
Table 148 West Coast Rubber Recycling Inc: Key Details, (CEO, HQ, Revenue, Founded, No. of Employees, Company Type, Website, Business Segment)
Table 149 West Coast Rubber Recycling Inc: Product Benchmarking
Table 150 West Coast Rubber Recycling Inc: Strategic Outlook
Table 151 Front Range Tire Recycle Inc.: Key Details, (CEO, HQ, Revenue, Founded, No. of Employees, Company Type, Website, Business Segment)
Table 152 Front Range Tire Recycle Inc.: Product Benchmarking
List of Figures
Figure 1 Tire Derived Fuel (TDF) Market Segmentation
Figure 2 Tire Derived Fuel (TDF) Market by Form: Market Attractiveness Index
Figure 3 Tire Derived Fuel (TDF) Market by Application: Market Attractiveness Index
Figure 4 Tire Derived Fuel (TDF) Market by Recycling Method: Market Attractiveness Index
Figure 5 Tire Derived Fuel (TDF) Market by Tire Type: Market Attractiveness Index
Figure 6 Tire Derived Fuel (TDF) Market by End-Use: Market Attractiveness Index
Figure 7 Tire Derived Fuel (TDF) Market Attractiveness Index by Region
Figure 8 Tire Derived Fuel (TDF) Market: Market Dynamics
Figure 9 Clinker Capacity Worldwide in 2022
Figure 10 Global Power Generation by 2022
Figure 11 Electricity Prices Worldwide in March 2023
Figure 12 Tire Derived Fuel (TDF) Market: Porter’s Five Forces Analysis
Figure 13 Global Tire Derived Fuel (TDF) Market Share Forecast by COVID, 2024-2034 (%)
Figure 14 Global Tire Derived Fuel (TDF) Market by Region, 2024-2034 (US$ Mn, AGR (%)) (V-Shaped Recovery Scenario)
Figure 15 Global Tire Derived Fuel (TDF) Market by Region, 2024-2034 (US$ Mn, AGR (%)) (U-Shaped Recovery Scenario)
Figure 16 Global Tire Derived Fuel (TDF) Market by Region, 2024-2034 (US$ Mn, AGR (%)) (W-Shaped Recovery Scenario)
Figure 17 Global Tire Derived Fuel (TDF) Market by Region, 2024-2034 (US$ Mn, AGR (%)) (L-Shaped Recovery Scenario)
Figure 18 Tire Derived Fuel (TDF) Market: PEST Analysis
Figure 19 Tire Derived Fuel (TDF) Market by Form: Market Attractiveness Index
Figure 20 Global Tire Derived Fuel (TDF) Market by Form, 2024-2034 (US$ Mn, AGR (%))
Figure 21 Tire Derived Fuel (TDF) Market Share Forecast by Form, 2024, 2029, 2034 (%)
Figure 22 Shredded Tire Market by Region, 2024-2034 (US$ Mn, AGR (%))
Figure 23 Shredded Tire Market Share Forecast by Region, 2024 & 2034 (%)
Figure 24 Whole Tire Market by Region, 2024-2034 (US$ Mn, AGR (%))
Figure 25 Whole Tire Market Share Forecast by Region, 2024 & 2034 (%)
Figure 26 Tire Derived Fuel (TDF) Market by Application: Market Attractiveness Index
Figure 27 Global Tire Derived Fuel (TDF) Market by Application, 2024-2034 (US$ Mn, AGR (%))
Figure 28 Tire Derived Fuel (TDF) Market Share Forecast by Application, 2024, 2029, 2034 (%)
Figure 29 Energy Recovery Market by Region, 2024-2034 (US$ Mn, AGR (%))
Figure 30 Energy Recovery Market Share Forecast by Region, 2024 & 2034 (%)
Figure 31 Material Recovery Market by Region, 2024-2034 (US$ Mn, AGR (%))
Figure 32 Material Recovery Market Share Forecast by Region, 2024 & 2034 (%)
Figure 33 Chemical Processes Market by Region, 2024-2034 (US$ Mn, AGR (%))
Figure 34 Chemical Processes Market Share Forecast by Region, 2024 & 2034 (%)
Figure 35 Tire Derived Fuel (TDF) Market by Recycling Method: Market Attractiveness Index
Figure 36 Global Tire Derived Fuel (TDF) Market by Recycling Method, 2024-2034 (US$ Mn, AGR (%))
Figure 37 Tire Derived Fuel (TDF) Market Share Forecast by Recycling Method, 2024, 2029, 2034 (%)
Figure 38 Mechanical Shredding Market by Region, 2024-2034 (US$ Mn, AGR (%))
Figure 39 Mechanical Shredding Market Share Forecast by Region, 2024 & 2034 (%)
Figure 40 Pyrolysis Market by Region, 2024-2034 (US$ Mn, AGR (%))
Figure 41 Pyrolysis Market Share Forecast by Region, 2024 & 2034 (%)
Figure 42 Cement Kiln Co-Processing Market by Region, 2024-2034 (US$ Mn, AGR (%))
Figure 43 Cement Kiln Co-Processing Market Share Forecast by Region, 2024 & 2034 (%)
Figure 44 Gasification Market by Region, 2024-2034 (US$ Mn, AGR (%))
Figure 45 Gasification Market Share Forecast by Region, 2024 & 2034 (%)
Figure 46 Tire Derived Fuel (TDF) Market by Tire Type: Market Attractiveness Index
Figure 47 Global Tire Derived Fuel (TDF) Market by Tire Type, 2024-2034 (US$ Mn, AGR (%))
Figure 48 Tire Derived Fuel (TDF) Market Share Forecast by Tire Type, 2024, 2029, 2034 (%)
Figure 49 Passenger Car Tires Market by Region, 2024-2034 (US$ Mn, AGR (%))
Figure 50 Passenger Car Tires Market Share Forecast by Region, 2024 & 2034 (%)
Figure 51 Light Commercial Vehicle Tires Market by Region, 2024-2034 (US$ Mn, AGR (%))
Figure 52 Light Commercial Vehicle Tires Market Share Forecast by Region, 2024 & 2034 (%)
Figure 53 Heavy Commercial Vehicle Tires Market by Region, 2024-2034 (US$ Mn, AGR (%))
Figure 54 Heavy Commercial Vehicle Tires Market Share Forecast by Region, 2024 & 2034 (%)
Figure 55 Off-road Vehicle Tires Market by Region, 2024-2034 (US$ Mn, AGR (%))
Figure 56 Off-road Vehicle Tires Market Share Forecast by Region, 2024 & 2034 (%)
Figure 57 Other Tire Type Market by Region, 2024-2034 (US$ Mn, AGR (%))
Figure 58 Other Tire Type Market Share Forecast by Region, 2024 & 2034 (%)
Figure 59 Tire Derived Fuel (TDF) Market by End-Use: Market Attractiveness Index
Figure 60 Global Tire Derived Fuel (TDF) Market by End-use, 2024-2034 (US$ Mn, AGR (%))
Figure 61 Tire Derived Fuel (TDF) Market Share Forecast by End-Use, 2024, 2029, 2034 (%)
Figure 62 Cement Industry Market by Region, 2024-2034 (US$ Mn, AGR (%))
Figure 63 Cement Industry Market Share Forecast by Region, 2024 & 2034 (%)
Figure 64 Pulp and Paper Industry Market by Region, 2024-2034 (US$ Mn, AGR (%))
Figure 65 Pulp and Paper Industry Market Share Forecast by Region, 2024 & 2034 (%)
Figure 66 Utility and Power Generation Market by Region, 2024-2034 (US$ Mn, AGR (%))
Figure 67 Utility and Power Generation Market Share Forecast by Region, 2024 & 2034 (%)
Figure 68 Industrial Boilers Market by Region, 2024-2034 (US$ Mn, AGR (%))
Figure 69 Industrial Boilers Market Share Forecast by Region, 2024 & 2034 (%)
Figure 70 Steel Manufacturing Market by Region, 2024-2034 (US$ Mn, AGR (%))
Figure 71 Steel Manufacturing Market Share Forecast by Region, 2024 & 2034 (%)
Figure 72 Other End-use Market by Region, 2024-2034 (US$ Mn, AGR (%))
Figure 73 Other End-use Market Share Forecast by Region, 2024 & 2034 (%)
Figure 74 Tire Derived Fuel (TDF) Market Forecast by Region 2024 and 2034 (Revenue, CAGR%)
Figure 75 Tire Derived Fuel (TDF) Market Share Forecast by Region 2024, 2029, 2034 (%)
Figure 76 Tire Derived Fuel (TDF) Market by Region, 2024-2034 (US$ Million, AGR %)
Figure 77 North America Tire Derived Fuel (TDF) Market Attractiveness Index
Figure 78 North America Tire Derived Fuel (TDF) Market by Region, 2024, 2029 & 2034 (US$ Million)
Figure 79 North America Tire Derived Fuel (TDF) Market by Value, 2024-2034 (US$ Mn, AGR (%))
Figure 80 North America Tire Derived Fuel (TDF) Market by Volume, 2024-2034 (US$ Mn, AGR (%))
Figure 81 North America Tire Derived Fuel (TDF) Market by Country, 2024-2034 (US$ Mn, AGR (%))
Figure 82 North America Tire Derived Fuel (TDF) Market Volume by Country, 2024-2034 (US$ Mn, AGR (%))
Figure 83 North America Tire Derived Fuel (TDF) Market Share Forecast by Country, 2024 & 2034 (%)
Figure 84 North America Tire Derived Fuel (TDF) Market by Form, 2024-2034 (US$ Mn, AGR (%))
Figure 85 North America Tire Derived Fuel (TDF) Market Share Forecast Form, 2024 & 2034 (%)
Figure 86 North America Tire Derived Fuel (TDF) Market by Application, 2024-2034 (US$ Mn, AGR (%))
Figure 87 North America Tire Derived Fuel (TDF) Market Share Forecast by Application, 2024 & 2034 (%)
Figure 88 North America Tire Derived Fuel (TDF) Market by Recycling Method, 2024-2034 (US$ Mn, AGR (%))
Figure 89 North America Tire Derived Fuel (TDF) Market Share Forecast by Recycling Method, 2024 & 2034 (%)
Figure 90 North America Tire Derived Fuel (TDF) Market by Tire Type, 2024-2034 (US$ Mn, AGR (%))
Figure 91 North America Tire Derived Fuel (TDF) Market Share Forecast by Tire Type, 2024 & 2034 (%)
Figure 92 North America Tire Derived Fuel (TDF) Market by End-use, 2024-2034 (US$ Mn, AGR (%))
Figure 93 North America Tire Derived Fuel (TDF) Market Share Forecast by End-Use, 2024 & 2034 (%)
Figure 94 US Tire Derived Fuel (TDF) Market by Value, 2024-2034 (US$ Mn, AGR (%))
Figure 95 US Tire Derived Fuel (TDF) Market by Volume, 2024-2034 (MMT, AGR (%))
Figure 96 Canada Tire Derived Fuel (TDF) Market by Value, 2024-2034 (US$ Mn, AGR (%))
Figure 97 Canada Tire Derived Fuel (TDF) Market by Volume, 2024-2034 (MMT, AGR (%))
Figure 98 Europe Tire Derived Fuel (TDF) Market Attractiveness Index
Figure 99 Europe Tire Derived Fuel (TDF) Market by Region, 2024, 2029 & 2034 (US$ Million)
Figure 100 Europe Tire Derived Fuel (TDF) Market by Value, 2024-2034 (US$ Mn, AGR (%))
Figure 101 Europe Tire Derived Fuel (TDF) Market by Volume, 2024-2034 (MMT, AGR (%))
Figure 102 Europe Tire Derived Fuel (TDF) Market by Country, 2024-2034 (US$ Mn, AGR (%))
Figure 103 Europe Tire Derived Fuel (TDF) Market Volume by Country, 2024-2034 (MMT, AGR (%))
Figure 104 Europe Tire Derived Fuel (TDF) Market Share Forecast by Country, 2024 & 2034 (%)
Figure 105 Europe Tire Derived Fuel (TDF) Market by Form, 2024-2034 (US$ Mn, AGR (%))
Figure 106 Europe Tire Derived Fuel (TDF) Market Share Forecast Form, 2024 & 2034 (%)
Figure 107 Europe Tire Derived Fuel (TDF) Market by Application, 2024-2034 (US$ Mn, AGR (%))
Figure 108 Europe Tire Derived Fuel (TDF) Market Share Forecast by Application, 2024 & 2034 (%)
Figure 109 Europe Tire Derived Fuel (TDF) Market by Recycling Method, 2024-2034 (US$ Mn, AGR (%))
Figure 110 Europe Tire Derived Fuel (TDF) Market Share Forecast by Recycling Method, 2024 & 2034 (%)
Figure 111 Europe Tire Derived Fuel (TDF) Market by Tire Type, 2024-2034 (US$ Mn, AGR (%))
Figure 112 Europe Tire Derived Fuel (TDF) Market Share Forecast by Tire Type, 2024 & 2034 (%)
Figure 113 Europe Tire Derived Fuel (TDF) Market by End-use, 2024-2034 (US$ Mn, AGR (%))
Figure 114 Europe Tire Derived Fuel (TDF) Market Share Forecast by End-Use, 2024 & 2034 (%)
Figure 115 Germany Tire Derived Fuel (TDF) Market by Value, 2024-2034 (US$ Mn, AGR (%))
Figure 116 Germany Tire Derived Fuel (TDF) Market by Volume, 2024-2034 (MMT, AGR (%))
Figure 117 UK Tire Derived Fuel (TDF) Market by Value, 2024-2034 (US$ Mn, AGR (%))
Figure 118 UK Tire Derived Fuel (TDF) Market by Volume, 2024-2034 (MMT, AGR (%))
Figure 119 France Tire Derived Fuel (TDF) Market by Value, 2024-2034 (US$ Mn, AGR (%))
Figure 120 France Tire Derived Fuel (TDF) Market by Volume, 2024-2034 (MMT, AGR (%))
Figure 121 Italy Tire Derived Fuel (TDF) Market by Value, 2024-2034 (US$ Mn, AGR (%))
Figure 122 Italy Tire Derived Fuel (TDF) Market by Volume, 2024-2034 (MMT, AGR (%))
Figure 123 Spain Tire Derived Fuel (TDF) Market by Value, 2024-2034 (US$ Mn, AGR (%))
Figure 124 Spain Tire Derived Fuel (TDF) Market by Volume, 2024-2034 (MMT, AGR (%))
Figure 125 Rest of Europe Tire Derived Fuel (TDF) Market by Value, 2024-2034 (US$ Mn, AGR (%))
Figure 126 Rest of Europe Tire Derived Fuel (TDF) Market by Volume, 2024-2034 (MMT, AGR (%))
Figure 127 Asia-Pacific Tire Derived Fuel (TDF) Market Attractiveness Index
Figure 128 Asia-Pacific Tire Derived Fuel (TDF) Market by Region, 2024, 2029 & 2034 (US$ Million)
Figure 129 Asia-Pacific Tire Derived Fuel (TDF) Market by Value, 2024-2034 (US$ Mn, AGR (%))
Figure 130 Asia-Pacific Tire Derived Fuel (TDF) Market by Volume, 2024-2034 (MMT, AGR (%))
Figure 131 Asia-Pacific Tire Derived Fuel (TDF) Market by Country, 2024-2034 (US$ Mn, AGR (%))
Figure 132 Asia-Pacific Tire Derived Fuel (TDF) Market Volume by Country, 2024-2034 (MMT, AGR (%))
Figure 133 Asia-Pacific Tire Derived Fuel (TDF) Market Share Forecast by Country, 2024 & 2034 (%)
Figure 134 Asia-Pacific Tire Derived Fuel (TDF) Market by Form, 2024-2034 (US$ Mn, AGR (%))
Figure 135 Asia-Pacific Tire Derived Fuel (TDF) Market Share Forecast Form, 2024 & 2034 (%)
Figure 136 Asia-Pacific Tire Derived Fuel (TDF) Market by Application, 2024-2034 (US$ Mn, AGR (%))
Figure 137 Asia-Pacific Tire Derived Fuel (TDF) Market Share Forecast by Application, 2024 & 2034 (%)
Figure 138 Asia-Pacific Tire Derived Fuel (TDF) Market by Recycling Method, 2024-2034 (US$ Mn, AGR (%))
Figure 139 Asia-Pacific Tire Derived Fuel (TDF) Market Share Forecast by Recycling Method, 2024 & 2034 (%)
Figure 140 Asia-Pacific Tire Derived Fuel (TDF) Market by Tire Type, 2024-2034 (US$ Mn, AGR (%))
Figure 141 Asia-Pacific Tire Derived Fuel (TDF) Market Share Forecast by Tire Type, 2024 & 2034 (%)
Figure 142 Asia-Pacific Tire Derived Fuel (TDF) Market by End-use, 2024-2034 (US$ Mn, AGR (%))
Figure 143 Asia-Pacific Tire Derived Fuel (TDF) Market Share Forecast by End-Use, 2024 & 2034 (%)
Figure 144 China Tire Derived Fuel (TDF) Market by Value, 2024-2034 (US$ Mn, AGR (%))
Figure 145 China Tire Derived Fuel (TDF) Market by Volume, 2024-2034 (MMT, AGR (%))
Figure 146 India Tire Derived Fuel (TDF) Market by Value, 2024-2034 (US$ Mn, AGR (%))
Figure 147 India Tire Derived Fuel (TDF) Market by Volume, 2024-2034 (MMT, AGR (%))
Figure 148 Japan Tire Derived Fuel (TDF) Market by Value, 2024-2034 (US$ Mn, AGR (%))
Figure 149 Japan Tire Derived Fuel (TDF) Market by Volume, 2024-2034 (MMT, AGR (%))
Figure 150 South Korea Tire Derived Fuel (TDF) Market by Value, 2024-2034 (US$ Mn, AGR (%))
Figure 151 South Korea Tire Derived Fuel (TDF) Market by Volume, 2024-2034 (MMT, AGR (%))
Figure 152 Australia Tire Derived Fuel (TDF) Market by Value, 2024-2034 (US$ Mn, AGR (%))
Figure 153 Australia Tire Derived Fuel (TDF) Market by Volume, 2024-2034 (MMT, AGR (%))
Figure 154 Rest of Asia-Pacific Tire Derived Fuel (TDF) Market by Value, 2024-2034 (US$ Mn, AGR (%))
Figure 155 Rest of Asia-Pacific Tire Derived Fuel (TDF) Market by Volume, 2024-2034 (MMT, AGR (%))
Figure 156 Middle East and Africa Tire Derived Fuel (TDF) Market Attractiveness Index
Figure 157 Middle East and Africa Tire Derived Fuel (TDF) Market by Region, 2024, 2029 & 2034 (US$ Million)
Figure 158 Middle East & Africa Tire Derived Fuel (TDF) Market by Value, 2024-2034 (US$ Mn, AGR (%))
Figure 159 Middle East & Africa Tire Derived Fuel (TDF) Market by Volume, 2024-2034 (MMT, AGR (%))
Figure 160 Middle East & Africa Tire Derived Fuel (TDF) Market by Country, 2024-2034 (US$ Mn, AGR (%))
Figure 161 Middle East & Africa Tire Derived Fuel (TDF) Market Volume by Country, 2024-2034 (MMT, AGR (%))
Figure 162 Middle East and Africa Tire Derived Fuel (TDF) Market Share Forecast by Country, 2024 & 2034 (%)
Figure 163 Middle East & Africa Tire Derived Fuel (TDF) Market by Form, 2024-2034 (US$ Mn, AGR (%))
Figure 164 Middle East and Africa Tire Derived Fuel (TDF) Market Share Forecast Form, 2024 & 2034 (%)
Figure 165 Middle East & Africa Tire Derived Fuel (TDF) Market by Application, 2024-2034 (US$ Mn, AGR (%))
Figure 166 Middle East and Africa Tire Derived Fuel (TDF) Market Share Forecast by Application, 2024 & 2034 (%)
Figure 167 Middle East & Africa Tire Derived Fuel (TDF) Market by Recycling Method, 2024-2034 (US$ Mn, AGR (%))
Figure 168 Middle East and Africa Tire Derived Fuel (TDF) Market Share Forecast by Recycling Method, 2024 & 2034 (%)
Figure 169 Middle East & Africa Tire Derived Fuel (TDF) Market by Tire Type, 2024-2034 (US$ Mn, AGR (%))
Figure 170 Middle East and Africa Tire Derived Fuel (TDF) Market Share Forecast by Tire Type, 2024 & 2034 (%)
Figure 171 Middle East & Africa Tire Derived Fuel (TDF) Market by End-use, 2024-2034 (US$ Mn, AGR (%))
Figure 172 Middle East and Africa Tire Derived Fuel (TDF) Market Share Forecast by End-Use, 2024 & 2034 (%)
Figure 173 GCC Tire Derived Fuel (TDF) Market by Value, 2024-2034 (US$ Mn, AGR (%))
Figure 174 South Africa Tire Derived Fuel (TDF) Market by Value, 2024-2034 (US$ Mn, AGR (%))
Figure 175 Rest of Middle East & Africa Tire Derived Fuel (TDF) Market by Value, 2024-2034 (US$ Mn, AGR (%))
Figure 176 Latin America Tire Derived Fuel (TDF) Market Attractiveness Index
Figure 177 Latin America Tire Derived Fuel (TDF) Market by Region, 2024, 2029 & 2034 (US$ Million)
Figure 178 Latin America Tire Derived Fuel (TDF) Market by Value, 2024-2034 (US$ Mn, AGR (%))
Figure 179 Latin America Tire Derived Fuel (TDF) Market by Volume, 2024-2034 (MMT, AGR (%))
Figure 180 Latin America Tire Derived Fuel (TDF) Market by Country, 2024-2034 (US$ Mn, AGR (%))
Figure 181 Latin America Tire Derived Fuel (TDF) Market Volume by Country, 2024-2034 (MMT, AGR (%))
Figure 182 Latin America Tire Derived Fuel (TDF) Market Share Forecast by Country, 2024 & 2034 (%)
Figure 183 Latin America Tire Derived Fuel (TDF) Market by Form, 2024-2034 (US$ Mn, AGR (%))
Figure 184 Latin America Tire Derived Fuel (TDF) Market Share Forecast Form, 2024 & 2034 (%)
Figure 185 Latin America Tire Derived Fuel (TDF) Market by Application, 2024-2034 (US$ Mn, AGR (%))
Figure 186 Latin America Tire Derived Fuel (TDF) Market Share Forecast by Application, 2024 & 2034 (%)
Figure 187 Latin America Tire Derived Fuel (TDF) Market by Recycling Method, 2024-2034 (US$ Mn, AGR (%))
Figure 188 Latin America Tire Derived Fuel (TDF) Market Share Forecast by Recycling Method, 2024 & 2034 (%)
Figure 189 Latin America Tire Derived Fuel (TDF) Market by Tire Type, 2024-2034 (US$ Mn, AGR (%))
Figure 190 Latin America Tire Derived Fuel (TDF) Market Share Forecast by Tire Type, 2024 & 2034 (%)
Figure 191 Latin America Tire Derived Fuel (TDF) Market by End-use, 2024-2034 (US$ Mn, AGR (%))
Figure 192 Latin America Tire Derived Fuel (TDF) Market Share Forecast by End-Use, 2024 & 2034 (%)
Figure 193 Brazil Tire Derived Fuel (TDF) Market by Value, 2024-2034 (US$ Mn, AGR (%))
Figure 194 Brazil Tire Derived Fuel (TDF) Market by Volume, 2024-2034 (MMT, AGR (%))
Figure 195 Mexico Tire Derived Fuel (TDF) Market by Value, 2024-2034 (US$ Mn, AGR (%))
Figure 196 Mexico Tire Derived Fuel (TDF) Market by Volume, 2024-2034 (MMT, AGR (%))
Figure 197 Rest of Latin America Tire Derived Fuel (TDF) Market by Value, 2024-2034 (US$ Mn, AGR (%))
Figure 198 Rest of Latin America Tire Derived Fuel (TDF) Market by Volume, 2024-2034 (MMT, AGR (%))
Figure 199 Babcock & Wilcox Enterprises, Inc.: Net Revenue, 2018-2022 (US$ Million, AGR%)
Figure 200 Babcock & Wilcox Enterprises, Inc.: R&D, 2018-2022 (US$ Million, AGR%)
Figure 201 Babcock & Wilcox Enterprises, Inc.: Regional Revenue Share, 2022 (%)
Figure 202 Babcock & Wilcox Enterprises, Inc.: Business Segment Revenue Share, 2022 (%)
ページTOPに戻る
本レポートと同分野(再生可能エネルギー)の最新刊レポート
Visiongain社のエネルギーと資源分野での最新刊レポート
本レポートと同じKEY WORD(tire)の最新刊レポート
- 本レポートと同じKEY WORDの最新刊レポートはありません。
よくあるご質問
Visiongain社はどのような調査会社ですか?
英国の調査会社ヴィジョンゲイン社(Visiongain)は、通信とエネルギーのほか、自動車や化学・医薬品、金属など、広範な市場を対象に調査を行っています。自動車市場については、市場全般に関する調査のほ... もっと見る
調査レポートの納品までの日数はどの程度ですか?
在庫のあるものは速納となりますが、平均的には 3-4日と見て下さい。
但し、一部の調査レポートでは、発注を受けた段階で内容更新をして納品をする場合もあります。
発注をする前のお問合せをお願いします。
注文の手続きはどのようになっていますか?
1)お客様からの御問い合わせをいただきます。
2)見積書やサンプルの提示をいたします。
3)お客様指定、もしくは弊社の発注書をメール添付にて発送してください。
4)データリソース社からレポート発行元の調査会社へ納品手配します。
5) 調査会社からお客様へ納品されます。最近は、pdfにてのメール納品が大半です。
お支払方法の方法はどのようになっていますか?
納品と同時にデータリソース社よりお客様へ請求書(必要に応じて納品書も)を発送いたします。
お客様よりデータリソース社へ(通常は円払い)の御振り込みをお願いします。
請求書は、納品日の日付で発行しますので、翌月最終営業日までの当社指定口座への振込みをお願いします。振込み手数料は御社負担にてお願いします。
お客様の御支払い条件が60日以上の場合は御相談ください。
尚、初めてのお取引先や個人の場合、前払いをお願いすることもあります。ご了承のほど、お願いします。
データリソース社はどのような会社ですか?
当社は、世界各国の主要調査会社・レポート出版社と提携し、世界各国の市場調査レポートや技術動向レポートなどを日本国内の企業・公官庁及び教育研究機関に提供しております。
世界各国の「市場・技術・法規制などの」実情を調査・収集される時には、データリソース社にご相談ください。
お客様の御要望にあったデータや情報を抽出する為のレポート紹介や調査のアドバイスも致します。
|
|

