バイオプロセスバリデーション市場レポート:2023-2033
Bioprocess Validation Market Report 2023-2033
レポート詳細
バイオプロセスバリデーション市場レポート 2023-2033年 :本レポートは、業界とその基礎となる原動力をより良く理解することを望むなら、新たな収益ポケットを目指す大手企業にとって... もっと見る
※上記価格は部署ライセンス(Departmental licence)価格です。
その他の価格についてはデータリソースまでお問合せください。
日本語のページは自動翻訳を利用し作成しています。
実際のレポートは英文のみでご納品いたします。

|

|
サマリー
レポート詳細
バイオプロセスバリデーション市場レポート 2023-2033年:本レポートは、業界とその基礎となる原動力をより良く理解することを望むなら、新たな収益ポケットを目指す大手企業にとって貴重なものとなるでしょう。異業種への進出や新地域での既存事業の拡大を目指す企業にも有用です。
世界的な臨床試験需要の高まり
バイオ医薬品市場は上昇傾向にあり、高齢化により医療ニーズが高まり、バイオテクノロジー、製薬、医療機器産業はこの需要を満たすために拡大しています。その結果、製品の有効性と安全性を確保するため、効果的な臨床試験の需要が高まっている。世界では、約26万6千件の公開臨床試験が進行中である。現在、米国だけでも10万5,000件以上のオープン臨床試験が実施されている。
生物製剤やその他の薬理学的薬剤がこれらの臨床試験の焦点である。臨床試験サービス市場の積極的な拡大は、金融・投資、M&A(合併・買収)活動、CRO(医薬品開発業務受託機関)の利用、機能的サービスプロバイダーの利用可能性の上昇につながっている。臨床試験サービス市場の拡大に影響を与えるさらなる変数としては、FDA(食品医薬品局)が最近実施した採用承認プロセスの簡素化、ゲノミクスの進歩、患者や疾患に合わせてカスタマイズされた遺伝子プロファイルを持つ医薬品の発売などが挙げられる。
抽出物および溶出物に関する問題
抽出物および溶出物(E&L)試験の主な目的は、医薬品や電子ニコチン供給システム(ENDS)を含むさまざまな製品の容器閉鎖システムを評価することによって、消費者にもたらされる潜在的な安全上の危険を軽減することです。溶出物試験の実施に関連する主な困難の1つは、より低い検出下限を達成する必要性が広まっていることに関連しています。これは、装置ベンダーとラボの科学者の両方にとって課題となります。
機器のメソッドとサンプル前処理技術の開発には、高度なスキルと豊富な経験を持つ熟練した知識のある分析者の関与が必要です。これは、厳しい分析評価基準値を満たすために不可欠である。さらに、最先端の質量分析装置とソフトウェアの活用は、これらの微量レベルを効果的に検出し、得られたデータを効率的に処理するために不可欠です。
市場調査レポートを購入する前にすべき質問とは?
- バイオプロセスバリデーション市場はどのように進化しているのか?
- バイオプロセスバリデーション市場の推進要因と阻害要因は何か?
- 各バイオプロセスバリデーションサブマーケットセグメントは予測期間中にどのように成長し、2033年にどれくらいの収益を占めるようになるのか?
- 2023年から2033年にかけて、各バイオプロセスバリデーションサブマーケットの市場シェアはどのように推移するのか?
- 2023年から2033年にかけて市場全体の主な牽引役は何か?
- 主要なバイオプロセスバリデーション市場はマクロ経済の動きに概ね追随するのか、それとも個々の国内市場が他を凌駕するのか?
- 2033年までに各国市場のシェアはどう変化し、2033年に市場をリードするのはどの地域か?
- 主要プレーヤーは誰か、また予測期間中の見通しは?
- これらの大手企業のバイオプロセスバリデーションプロジェクトは何か?
- 2023年から2033年の間に、業界はどのように発展していくのか?バイオプロセスバリデーションプロジェクトが
現在および今後10年間に実施されるバイオプロセスバリデーションプロジェクトにはどのような意味があるのか?
- バイオプロセスバリデーション市場をさらに拡大するために、製品の商業化の必要性は高まっているか?
- バイオプロセスバリデーション市場はどこへ向かっているのか。
- 新製品やサービスラインに最適な投資オプションは何か?
- 企業を新たな成長軌道に乗せ、C-suiteに移行させるための重要な展望とは?
このことが、現在、そして今後10年間のバイオプロセスバリデーション市場にどのような影響を与えるかを見極める必要がある:
- 315ページにわたる本レポートでは、113の表と169の図表を掲載しています。
- 本レポートでは、業界における主要な有利分野を取り上げているため、今すぐターゲットを絞ることができます。
- 本レポートには、世界、地域、国の売上と成長に関する詳細な分析が含まれています。
- 競合他社が成功した主なトレンド、変化、収益予測をハイライトしています。
本レポートは、バイオプロセスバリデーション市場が今後10年間でどのように発展するか、またCOVID-19の景気後退と好転の変動に合わせてどのように発展するかをお伝えします。この市場は、過去10年間のどの時点よりも今が重要である。
2033年までの予測やその他の分析から、商業的な展望が明らかになる
- 2033年までの収益予測に加え、直近の業績、成長率、市場シェアもご覧いただけます。
- ビジネスの展望と展開に関する独自の分析をご覧いただけます。
- 定性的分析(市場ダイナミクス、促進要因、機会、阻害要因など)、ポーターのファイブフォース分析、PEST分析、最近の動向をご覧いただけます。
本レポートには、COVID-19が業界と貴社にどのような影響を与えるかについてのデータ分析と貴重な洞察が含まれている。本レポートでは、COVID-19の4つの回収パターンとその影響、すなわち「V」、「L」、「W」、「U」について論じている。
レポート対象セグメント
試験タイプ
- 抽出性/浸出性試験
- 微生物試験
- 完全性試験
- 物理化学試験
- 適合性試験
- その他
コンポーネント
- フィルター エレメント
- メディア容器とバッグ
- 凍結融解プロセスバッグ
- バイオリアクター
- トランスファーシステム
- その他
様式
- 細胞・遺伝子治療
- ワクチン
- 血液・血漿製品
- 組織工学と再生医療
- その他
エンドユーザー
- 製薬会社
- バイオテクノロジー企業
- その他
世界市場全体と各分野の収益予測に加え、5つの地域と22の主要国市場の収益予測も掲載している:
北米
- アメリカ
- カナダ
欧州
- ドイツ
- 英国
- フランス
- イタリア
- スペイン
- ロシア
- その他の欧州
アジア太平洋
- 日本
- 中国
- インド
- オーストラリア
- 韓国
- 東南アジア
- その他のアジア太平洋地域
ラテンアメリカ
- ブラジル
- メキシコ
- その他のラテンアメリカ
MEA
- GCC
- 南アフリカ
- その他のMEA
本レポートでは、バイオプロセスバリデーション市場の2023年から2033年にかけての主要企業のプロファイルも掲載している。。
主要企業と市場成長の可能性
・ Almac Group
・ Charles River Laboratories
・ CMIC HOLDINGS Co., Ltd.
・ Cobetter Filtration Equipment Co., Ltd.
・ Cytovance Biologics
・ Cytiva
・ DOC S.r.l.
・ Eurofins Scientific
・ Lonza Group
・ Meissner Filtration Products, Inc.
・ Merck KGaA
・ Sartorius AG
・ SGS SA
・ Thermo Fisher Scientific Inc.
2023年から2033年までのバイオプロセスバリデーション市場全体の世界売上高は、金額ベースで2023年に4億9,000万米ドルを突破する。2033年まで力強い収益成長を予測。当社の調査では、最も大きな可能性を秘めた組織を特定しています。彼らの能力、進歩、商業的展望を発見し、一歩先を行くお手伝いをします。
バイオプロセスバリデーション市場、2023-2033年レポートはどのようにお役に立つでしょうか?
要約すると、310ページを超えるこのレポートは、以下の知識を提供する:
- バイオプロセスバリデーション市場の2023年から2033年までの収益予測。検査タイプ、コンポーネント、モダリティ、エンドユーザーごとの予測を世界レベルと地域レベルで掲載。
- 5つの地域と22の主要国市場の2033年までの収益予測 - 北米、欧州、アジア太平洋、中南米、MEAのバイオプロセスバリデーション市場の2023年から2033年までの予測をご覧ください。また、米国、カナダ、メキシコ、ブラジル、ドイツ、フランス、英国、イタリア、中国、インド、日本、オーストラリアなどの著名経済圏の市場も予測しています。
- 既存企業および市場参入を目指す企業の展望 - 2023年から2033年までのバイオプロセスバリデーション市場に関わる主要企業14社の企業プロファイルを含む。
独自の予測による定量的・定性的分析をご覧ください。私たちのレポートだけに含まれる情報を入手し、貴重なビジネスインテリジェンスで情報を得ることができます。
他では得られない情報
私たちの新しいレポートがあれば、知識に遅れをとったり、チャンスを逃したりする可能性が低くなります。弊社の調査レポートが貴社の調査、分析、意思決定にどのように役立つかをご覧ください。Visiongainの調査は、バイオプロセスバリデーション市場2023年から2033年、市場をリードする企業の商業分析を必要とするすべての人のためのものです。データ、トレンド、予測をご覧いただけます。
ページTOPに戻る
目次
目次
1 レポート概要
1.1 研究の目的
1.2 バイオプロセスバリデーション市場の紹介
1.3 本レポートの内容
1.4 本レポートを読むべき理由
1.5 本分析レポートが回答する主な質問は以下の通り:
1.6 本レポートの対象者
1.7 方法論
1.7.1 市場の定義
1.7.2 市場評価・予測手法
1.7.3 データの検証
1.7.3.1 一次調査
1.7.3.2 セカンダリーリサーチ
1.8 よくある質問(FAQ)
1.9 Visiongainの関連レポート
1.10 Visiongainについて
2 エグゼクティブ・サマリー
3 市場概要
3.1 主要な調査結果
3.2 市場ダイナミクス
3.2.1 市場促進要因
3.2.1.1 バイオ医薬品需要の増加
3.2.1.2 バイオプロセスバリデーションのアウトソーシング需要の増加
3.2.1.3 研究開発費の増加
3.2.1.4 世界的な臨床試験需要の増加
3.2.2 市場抑制要因
3.2.2.1 抽出物と溶出物に関する問題
3.2.2.2 先端技術の高コスト
3.2.2.3 COVID-19後の熟練労働者の不足が産業の成長を妨げる
3.2.2.4 規制上の課題
3.2.3 市場機会
3.2.3.1 新興国における成長機会
3.2.3.2 ハーモナイズされたバイオ分析試験が新たな機会を開く
3.2.3.3 デジタル時代のデータ・セキュリティとコンプライアンスが有利な成長展望をもたらす
3.2.3.4 中小企業向けのカスタマイズ・ソリューション
3.2.3.5 バイオプロセス検証のためのデジタルツイン
3.3 COVID-19インパクト分析
3.4 ポーターのファイブフォース分析
3.4.1 サプライヤーパワー
3.4.2 バイヤーパワー
3.4.3 競争ライバル
3.4.4 代替品による脅威
3.4.5 新規参入企業の脅威
3.5 PEST分析
3.5.1 バイオプロセスバリデーション市場に影響を与える政治的要因
3.5.2 バイオプロセスバリデーション市場に影響を与える経済的要因
3.5.3 バイオプロセスバリデーション市場に影響を与える社会的要因
3.5.4 バイオプロセスバリデーション市場に影響を与える技術的要因
3.6 シングルユース技術(バッグ)と容器閉鎖システムのバリデーション市場概観
3.7 バリデーションサービスの市場限界
3.8 地域別バリデーションサプライヤー選択の意思決定要因
3.9 ウイルスクリアランス検査市場(地域別)、2023年~2033年(百万米ドル、AGR %)
4 バイオプロセスバリデーション市場分析:検査タイプ別
4.1 主要な調査結果
4.2 検査タイプ別セグメント 市場魅力度指数
4.3 検査タイプ別バイオプロセスバリデーション市場規模の推定と予測
4.4 抽出性/浸出性試験
4.4.1 2023~2033年の地域別市場予測(US$ Million, AGR %)
4.4.2 地域別市場シェア、2023年・2033年 (%)
4.5 微生物検査
4.5.1 2023~2033年の地域別市場予測(US$ Million, AGR %)
4.5.2 地域別市場シェア、2023年・2033年 (%)
4.6 完全性試験
4.6.1 2023~2033年の地域別市場予測(US$ Million, AGR %)
4.6.2 地域別市場シェア、2023年・2033年 (%)
4.7 物理化学検査
4.7.1 2023~2033年の地域別市場予測(US$ Million, AGR %)
4.7.2 地域別市場シェア、2023年・2033年 (%)
4.8 適合性試験
4.8.1 2023~2033年の地域別市場予測 (百万米ドル, AGR %)
4.8.2 地域別市場シェア、2023年・2033年 (%)
4.9 その他
4.9.1 2023-2033年の地域別市場展望(US$ Million, AGR %)
4.9.2 地域別市場シェア、2023年・2033年 (%)
5 バイオプロセスバリデーション市場分析:コンポーネント別
5.1 主要な調査結果
5.2 コンポーネントセグメント 市場魅力度指数
5.3 コンポーネント別バイオプロセスバリデーション市場規模の推定と予測
5.4 フィルター要素
5.4.1 2023〜2033年の地域別市場予測(US$ Million, AGR %)
5.4.2 地域別市場シェア、2023年・2033年 (%)
5.5 メディア容器と袋
5.5.1 2023~2033年の地域別市場予測 (US$ Million, AGR %)
5.5.2 地域別市場シェア、2023年・2033年 (%)
5.6 冷凍・解凍プロセス用バッグ
5.6.1 2023~2033年の地域別市場予測 (US$ Million, AGR %)
5.6.2 地域別市場シェア、2023年・2033年 (%)
5.7 バイオリアクター
5.7.1 2023~2033年の地域別市場予測(US$ Million, AGR %)
5.7.2 地域別市場シェア、2023年・2033年 (%)
5.8 トランスファーシステム
5.8.1 2023~2033年の地域別市場予測(US$ Million, AGR %)
5.8.2 地域別市場シェア、2023年・2033年 (%)
5.9 その他
5.9.1 2023-2033年の地域別市場予測(US$ Million, AGR %)
5.9.2 地域別市場シェア、2023年・2033年 (%)
6 バイオプロセスバリデーション市場分析:モダリティ別
6.1 主要な調査結果
6.2 モダリティセグメント 市場魅力度指数
6.3 モダリティ別バイオプロセスバリデーション市場規模の推定と予測
6.4 細胞・遺伝子治療
6.4.1 2023〜2033年の地域別市場予測(US$ Million, AGR %)
6.4.2 地域別市場シェア、2023年・2033年 (%)
6.5 ワクチン
6.5.1 2023〜2033年の地域別市場予測(US$ Million, AGR %)
6.5.2 地域別市場シェア、2023年・2033年 (%)
6.6 血液・血漿製品
6.6.1 2023-2033年の地域別市場予測 (US$ Million, AGR %)
6.6.2 地域別市場シェア、2023年・2033年 (%)
6.7 組織工学と再生医療
6.7.1 2023〜2033年の地域別市場予測(US$ Million, AGR %)
6.7.2 地域別市場シェア、2023年・2033年 (%)
6.8 その他
6.8.1 2023-2033年の地域別市場予測(US$ Million, AGR %)
6.8.2 地域別市場シェア、2023年・2033年 (%)
7 バイオプロセスバリデーション市場分析:エンドユーザー別
7.1 主要な調査結果
7.2 エンドユーザーセグメント: 市場魅力度指数
7.3 エンドユーザー別バイオプロセスバリデーション市場規模の推定と予測
7.4 製薬企業
7.4.1 2023〜2033年の地域別市場予測(US$ Million, AGR %)
7.4.2 地域別市場シェア、2023年・2033年(%)
7.5 バイオテクノロジー企業
7.5.1 2023~2033年の地域別市場予測(US$ Million, AGR %)
7.5.2 地域別市場シェア、2023年・2033年(%)
7.6 その他
7.6.1 2023-2033年の地域別市場予測(US$ Million, AGR %)
7.6.2 地域別市場シェア、2023年・2033年(%)
8 バイオプロセスバリデーション市場分析:地域別
8.1 主要な調査結果
8.2 地域別市場規模の推定と予測
9 北米のバイオプロセスバリデーション市場分析
9.1 主要な調査結果
9.2 北米のバイオプロセスバリデーション市場魅力度指数
9.3 北米のバイオプロセスバリデーション市場:国別、2023年、2028年、2033年(US$ Million)
9.4 北米のバイオプロセスバリデーション市場規模推定と予測:国別
9.5 北米のバイオプロセスバリデーション市場規模推定と予測:試験タイプ別
9.6 北米のバイオプロセスバリデーション市場規模推定と予測:コンポーネント別
9.7 北米のバイオプロセスバリデーション市場規模推定と予測:様式別
9.8 北米のバイオプロセスバリデーション市場規模推定と予測:エンドユーザー別
9.9 アメリカのバイオプロセスバリデーション市場分析
9.10 カナダのバイオプロセスバリデーション市場分析
10 欧州のバイオプロセスバリデーション市場分析
10.1 主要な調査結果
10.2 欧州のバイオプロセスバリデーション市場魅力度指数
10.3 欧州のバイオプロセスバリデーション市場:国別、2023年、2028年、2033年(US$ Million)
10.4 欧州のバイオプロセスバリデーション市場規模推定と予測:国別
10.5 欧州のバイオプロセスバリデーション市場規模推定と予測:試験タイプ別
10.6 欧州のバイオプロセスバリデーション市場規模推定と予測:コンポーネント別
10.7 欧州のバイオプロセスバリデーション市場規模推定と予測:様式別
10.8 欧州のバイオプロセスバリデーション市場規模推定と予測:エンドユーザー別
10.9 ドイツのバイオプロセスバリデーション市場分析
10.10 イギリスのバイオプロセスバリデーション市場分析
10.11 フランスのバイオプロセスバリデーション市場分析
10.12 イタリアのバイオプロセスバリデーション市場分析
10.13 スペインのバイオプロセスバリデーション市場分析
10.14 ロシアのバイオプロセスバリデーション市場分析
10.15 その他の欧州のバイオプロセスバリデーション市場分析
11 アジア太平洋地域のバイオプロセスバリデーション市場分析
11.1 主要な調査結果
11.2 アジア太平洋地域のバイオプロセスバリデーション市場魅力度指数
11.3 アジア太平洋地域のバイオプロセスバリデーション市場:国別、2023年、2028年、2033年(US$ Million)
11.4 アジア太平洋地域のバイオプロセスバリデーション市場規模推定と予測:国別
11.5 アジア太平洋地域のバイオプロセスバリデーション市場規模推定と予測:試験タイプ別
11.6 アジア太平洋地域のバイオプロセスバリデーション市場規模推定と予測:コンポーネント別
11.7 アジア太平洋地域のバイオプロセスバリデーション市場規模推定と予測:様式別
11.8 アジア太平洋地域のバイオプロセスバリデーション市場規模推定と予測:エンドユーザー別
11.9 日本のバイオプロセスバリデーション市場分析
11.10 中国のバイオプロセスバリデーション市場分析
11.11 インドのバイオプロセスバリデーション市場分析
11.12 オーストラリアのバイオプロセスバリデーション市場分析
11.13 韓国のバイオプロセスバリデーション市場分析
11.14 東南アジアのバイオプロセスバリデーション市場分析
11.15 その他のアジア太平洋地域のバイオプロセスバリデーション市場分析
12 ラテンアメリカのバイオプロセスバリデーション市場分析
12.1 主要な調査結果
12.2 ラテンアメリカのバイオプロセスバリデーション市場魅力度指数
12.3 ラテンアメリカのバイオプロセスバリデーション市場:国別、2023年、2028年、2033年 (US$ Million)
12.4 ラテンアメリカのバイオプロセスバリデーション市場規模推定と予測:国別
12.5 ラテンアメリカのバイオプロセスバリデーション市場規模推定と予測:試験タイプ別
12.6 ラテンアメリカのバイオプロセスバリデーション市場規模推定と予測:コンポーネント別
12.7 ラテンアメリカのバイオプロセスバリデーション市場規模推定と予測:様式別
12.8 ラテンアメリカのバイオプロセスバリデーション市場規模推定と予測:エンドユーザー別
12.9 ブラジルのバイオプロセスバリデーション市場分析
12.10 メキシコのバイオプロセスバリデーション市場分析
12.11 その他のラテンアメリカのバイオプロセスバリデーション市場分析
13 MEAのバイオプロセスバリデーション市場分析
13.1 主要な調査結果
13.2 MEAのバイオプロセスバリデーション市場魅力度指数
13.3 MEAのバイオプロセスバリデーション市場:国別、2023年、2028年、2033年 (US$ Million)
13.4 MEAのバイオプロセスバリデーション市場規模推定と予測:国別
13.5 MEAのバイオプロセスバリデーション市場規模推定と予測:試験タイプ別
13.6 MEAのバイオプロセスバリデーション市場規模推定と予測:コンポーネント別
13.7 MEAのバイオプロセスバリデーション市場規模推定と予測:様式別
13.8 MEAのバイオプロセスバリデーション市場規模推定と予測:エンドユーザー別
13.9 GCCのバイオプロセスバリデーション市場分析
13.10 南アフリカのバイオプロセスバリデーション市場分析
13.11 その他のMEAのバイオプロセスバリデーション市場分析
14 主要企業のプロファイル
14.1 Sartorius AG
14.1.1 会社概要
14.1.2 会社概要
14.1.3 財務分析
14.1.3.1 純収入、2015-2022年
14.1.3.2 地域市場シェア、2022年
14.1.3.3 R&D、2015-2022年
14.1.4 サービス・ベンチマーク
14.1.5 戦略的展望
14.2 Charles River Laboratories
14.2.1 会社概要
14.2.2 会社概要
14.2.3 財務分析
14.2.3.1 純収入、2015-2022年
14.2.3.2 地域市場シェア、2022年
14.2.4 サービスベンチマーク
14.2.5 戦略的展望
14.3 Merck KGaA
14.3.1 会社概要
14.3.2 会社概要
14.3.3 財務分析
14.3.3.1 純収入、2015-2022年
14.3.3.2 地域市場シェア、2022年
14.3.3.3 R&D、2015-2022年
14.3.4 サービスベンチマーク
14.3.5 戦略的展望
14.4 Cytiva
14.4.1 会社概要
14.4.2 会社概要
14.4.3 サービス・ベンチマーク
14.4.4 戦略的展望
14.5 Thermo Fisher Scientific, Inc.
14.5.1 会社概要
14.5.2 会社概要
14.5.3 財務分析
14.5.3.1 純収入、2015-2022年
14.5.3.2 地域市場シェア、2022年
14.5.3.3 R&D、2015-2022年
14.5.4 サービスベンチマーク
14.5.5 戦略的展望
14.6 SGS SA
14.6.1 会社概要
14.6.2 会社概要
14.6.3 財務分析
14.6.3.1 純収入、2015年~2022年
14.6.3.2 地域市場シェア、2022年
14.6.4 サービスベンチマーク
14.6.5 戦略的展望
14.7 Eurofins Scientific
14.7.1 会社概要
14.7.2 会社概要
14.7.3 財務分析
14.7.3.1 純収入、2016-2022年
14.7.3.2 地域市場シェア、2022年
14.7.4 サービスベンチマーク
14.7.5 戦略的展望
14.8 Lonza Group
14.8.1 会社概要
14.8.2 会社概要
14.8.3 財務分析
14.8.3.1 純収入、2015-2022年
14.8.3.2 地域市場シェア、2022年
14.8.3.3 R&D、2017年〜2022年
14.8.4 サービスベンチマーク
14.8.5 戦略的展望
14.9 Almac Group
14.9.1 会社概要
14.9.2 会社概要
14.9.3 サービス・ベンチマーク
14.9.4 戦略的展望
14.10 Cobetter Filtration Equipment Co., Ltd.
14.10.1 会社概要
14.10.2 会社概要
14.10.3 サービスベンチマーク
14.11 CMIC HOLDINGS Co., Ltd.
14.11.1 会社概要
14.11.2 会社概要
14.11.3 財務分析
14.11.3.1 純収入、2015-2022年
14.11.4 サービスベンチマーク
14.11.5 戦略的展望
14.12 DOC S.r.l.
14.12.1 会社概要
14.12.2 会社概要
14.12.3 サービス・ベンチマーク
14.13 Meissner Filtration Products, Inc.
14.13.1 会社概要
14.13.2 会社概要
14.13.3 サービス・ベンチマーク
14.14 サイトバンス・バイオロジクス
14.14.1 会社概要
14.14.2 会社概要
14.14.3 サービス・ベンチマーク
14.14.4 戦略的展望
15 結論と提言
15.1 Visiongainからの結びの言葉
15.2 市場プレイヤーへの提言
ページTOPに戻る
図表リスト
表の一覧
Table 1 Bioprocess Validation Market Snapshot, 2023 & 2033 (US$ Million, CAGR %)
Table 2 Bioprocess Validation Market Forecast by Region, 2023-2033 (US$ Million, AGR%, CAGR%): "V" Shaped Recovery
Table 3 Bioprocess Validation Market Forecast by Region, 2023-2033 (US$ Million, AGR%, CAGR%): "U" Shaped Recovery
Table 4 Bioprocess Validation Market Forecast by Region, 2023-2033 (US$ Million, AGR%, CAGR%): "W" Shaped Recovery
Table 5 Bioprocess Validation Market Forecast by Region, 2023-2033 (US$ Million, AGR%, CAGR%): "L" Shaped Recovery
Table 6 Market Limitation of Validation Services
Table 1 Bioprocess Validation Market Snapshot, 2023 & 2033 (US$ million, CAGR %)
Table 2 Viral Clearance Testing Market Forecast by Region, 2023-2033 (US$ Million, AGR%, CAGR%)
Table 3 Bioprocess Validation Market Forecast by Test Type, 2023-2033 (US$ Million, AGR%, CAGR%)
Table 4 Extractable/Leachable Testing Segment Market Forecast by Region, 2023-2033 (US$ Million, AGR%, CAGR%)
Table 5 Microbiological Testing Segment Market Forecast by Region, 2023-2033 (US$ Million, AGR%, CAGR%)
Table 6 Integrity Testing Segment Market Forecast by Region, 2023-2033 (US$ Million, AGR%, CAGR%)
Table 7 Physiochemical Testing Segment Market Forecast by Region, 2023-2033 (US$ Million, AGR%, CAGR%)
Table 8 Compatibility Testing Segment Market Forecast by Region, 2023-2033 (US$ Million, AGR%, CAGR%)
Table 9 Others Segment Market Forecast by Region, 2023-2033 (US$ Million, AGR%, CAGR%)
Table 10 Bioprocess Validation Market Forecast by Component, 2023-2033 (US$ Million, AGR%, CAGR%)
Table 11 Filters Elements Segment Market Forecast by Region, 2023-2033 (US$ Million, AGR%, CAGR%)
Table 12 Media Containers and Bags Segment Market Forecast by Region, 2023-2033 (US$ Million, AGR%, CAGR%)
Table 13 Freezing and Thawing Process Bags Segment Market Forecast by Region, 2023-2033 (US$ Million, AGR%, CAGR%)
Table 14 Bioreactors Segment Market Forecast by Region, 2023-2033 (US$ Million, AGR%, CAGR%)
Table 15 Transfer Systems Segment Market Forecast by Region, 2023-2033 (US$ Million, AGR%, CAGR%)
Table 16 Others Segment Market Forecast by Region, 2023-2033 (US$ Million, AGR%, CAGR%)
Table 17 Bioprocess Validation Market Forecast by Modality, 2023-2033 (US$ Million, AGR%, CAGR%)
Table 18 Cell and Gene Therapy Segment Market Forecast by Region, 2023-2033 (US$ Million, AGR%, CAGR%)
Table 19 Vaccines Segment Market Forecast by Region, 2023-2033 (US$ Million, AGR%, CAGR%)
Table 20 Blood and Plasma Products Segment Market Forecast by Region, 2023-2033 (US$ Million, AGR%, CAGR%)
Table 21 Tissue Engineering and Regenerative Medicine Segment Market Forecast by Region, 2023-2033 (US$ Million, AGR%, CAGR%)
Table 22 Others Segment Market Forecast by Region, 2023-2033 (US$ Million, AGR%, CAGR%)
Table 23 Europe Bioprocess Validation Market Forecast by End-users, 2023-2033 (US$ Million, AGR%, CAGR%)
Table 24 Pharmaceutical Companies Segment Market Forecast by Region, 2023-2033 (US$ Million, AGR%, CAGR%)
Table 25 Biotechnology Companies Segment Market Forecast by Region, 2023-2033 (US$ Million, AGR%, CAGR%)
Table 26 Others Segment Market Forecast by Region, 2023-2033 (US$ Million, AGR%, CAGR%)
Table 27 Bioprocess Validation Market Forecast by Region, 2023-2033 (US$ Million, AGR%, CAGR%)
Table 28 North America Bioprocess Validation Market Forecast by Country, 2023-2033 (US$ Million, AGR%, CAGR%)
Table 29 North America Bioprocess Validation Market Forecast by Test Type, 2023-2033 (US$ Million, AGR%, CAGR%)
Table 30 North America Bioprocess Validation Market Forecast by Test Type, 2023-2033 (US$ Million, AGR%, CAGR%)
Table 31 North America Bioprocess Validation Market Forecast by Modality, 2023-2033 (US$ Million, AGR%, CAGR%)
Table 32 North America Bioprocess Validation Market Forecast by End-users, 2023-2033 (US$ Million, AGR%, CAGR%)
Table 33 U.S. Bioreactors Market Forecast, 2023-2033 (US$ Million, AGR%, CAGR%)
Table 34 Canada Bioreactors Market Forecast, 2023-2033 (US$ Million, AGR%, CAGR%)
Table 35 Europe Bioprocess Validation Market Forecast by Country, 2023-2033 (US$ Million, AGR%, CAGR%)
Table 36 Europe Bioprocess Validation Market Forecast by Test Type, 2023-2033 (US$ Million, AGR%, CAGR%)
Table 37 Europe Bioprocess Validation Market Forecast by Test Type, 2023-2033 (US$ Million, AGR%, CAGR%)
Table 38 Europe Bioprocess Validation Market Forecast by Modality, 2023-2033 (US$ Million, AGR%, CAGR%)
Table 39 Europe Bioprocess Validation Market Forecast by End-users, 2023-2033 (US$ Million, AGR%, CAGR%)
Table 40 Germany Bioreactors Market Forecast, 2023-2033 (US$ Million, AGR%, CAGR%)
Table 41 UK Bioreactors Market Forecast, 2023-2033 (US$ Million, AGR%, CAGR%)
Table 42 France Bioreactors Market Forecast, 2023-2033 (US$ Million, AGR%, CAGR%)
Table 43 Italy Bioreactors Market Forecast, 2023-2033 (US$ Million, AGR%, CAGR%)
Table 44 Spain Bioreactors Market Forecast, 2023-2033 (US$ Million, AGR%, CAGR%)
Table 45 Russia Bioreactors Market Forecast, 2023-2033 (US$ Million, AGR%, CAGR%)
Table 46 Rest of Europe Bioreactors Market Forecast, 2023-2033 (US$ Million, AGR%, CAGR%)
Table 47 Asia Pacific Bioprocess Validation Market Forecast by Country, 2023-2033 (US$ Million, AGR%, CAGR%)
Table 48 Asia Pacific Bioprocess Validation Market Forecast by Test Type, 2023-2033 (US$ Million, AGR%, CAGR%)
Table 49 Asia Pacific Bioprocess Validation Market Forecast by Component, 2023-2033 (US$ Million, AGR%, CAGR%)
Table 50 Asia Pacific Bioprocess Validation Market Forecast by Modality, 2023-2033 (US$ Million, AGR%, CAGR%)
Table 51 Asia Pacific Bioprocess Validation Market Forecast by End-users, 2023-2033 (US$ Million, AGR%, CAGR%)
Table 52 Japan Bioreactors Market Forecast, 2023-2033 (US$ Million, AGR%, CAGR%)
Table 53 China Bioreactors Market Forecast, 2023-2033 (US$ Million, AGR%, CAGR%)
Table 54 India Bioreactors Market Forecast, 2023-2033 (US$ Million, AGR%, CAGR%)
Table 55 Australia Bioreactors Market Forecast, 2023-2033 (US$ Million, AGR%, CAGR%)
Table 56 South Korea Bioreactors Market Forecast, 2023-2033 (US$ Million, AGR%, CAGR%)
Table 57 South-East Asia Bioreactors Market Forecast, 2023-2033 (US$ Million, AGR%, CAGR%)
Table 58 Rest of Asia Pacific Bioreactors Market Forecast, 2023-2033 (US$ Million, AGR%, CAGR%)
Table 59 Latin America Bioprocess Validation Market Forecast by Country, 2023-2033 (US$ Million, AGR%, CAGR%)
Table 60 Latin America Bioprocess Validation Market Forecast by Test Type, 2023-2033 (US$ Million, AGR%, CAGR%)
Table 61 Latin America Bioprocess Validation Market Forecast by Component, 2023-2033 (US$ Million, AGR%, CAGR%)
Table 62 Latin America Bioprocess Validation Market Forecast by Modality, 2023-2033 (US$ Million, AGR%, CAGR%)
Table 63 Latin America Bioprocess Validation Market Forecast by End-users, 2023-2033 (US$ Million, AGR%, CAGR%)
Table 64 Brazil Bioreactors Market Forecast, 2023-2033 (US$ Million, AGR%, CAGR%)
Table 65 Mexico Bioreactors Market Forecast, 2023-2033 (US$ Million, AGR%, CAGR%)
Table 66 Rest of Latin America Bioreactors Market Forecast, 2023-2033 (US$ Million, AGR%, CAGR%)
Table 67 MEA Bioprocess Validation Market Forecast by Country, 2023-2033 (US$ Million, AGR%, CAGR%)
Table 68 MEA Bioprocess Validation Market Forecast by Test Type, 2023-2033 (US$ Million, AGR%, CAGR%)
Table 69 MEA Bioprocess Validation Market Forecast by Component, 2023-2033 (US$ Million, AGR%, CAGR%)
Table 70 MEA Bioprocess Validation Market Forecast by Modality, 2023-2033 (US$ Million, AGR%, CAGR%)
Table 71 MEA Bioprocess Validation Market Forecast by End-users, 2023-2033 (US$ Million, AGR%, CAGR%)
Table 72 GCC Bioreactors Market Forecast, 2023-2033 (US$ Million, AGR%, CAGR%)
Table 73 South Africa Bioreactors Market Forecast, 2023-2033 (US$ Million, AGR%, CAGR%)
Table 74 Rest of MEA Bioreactors Market Forecast, 2023-2033 (US$ Million, AGR%, CAGR%)
Table 75 Sartorius AG: Key Details, (CEO, HQ, Revenue, Founded, No. of Employees, Company Type, Website, Business Segment)
Table 76 Sartorius AG: Service Benchmarking
Table 77 Sartorius AG: Strategic Outlook
Table 78 Charles River Laboratories: Key Details, (CEO, HQ, Revenue, Founded, No. of Employees, Company Type, Website, Business Segment)
Table 79 Charles River Laboratories: Service Benchmarking
Table 80 Charles River Laboratories: Strategic Outlook
Table 81 Merck KGaA: Key Details, (CEO, HQ, Revenue, Founded, No. of Employees, Company Type, Website, Business Segment)
Table 82 Merck KGaA: Service Benchmarking
Table 83 Merck KGaA: Strategic Outlook
Table 84 Cytiva: Key Details, (CEO, HQ, Revenue, Founded, No. of Employees, Company Type, Website, Business Segment)
Table 85 Cytiva: Service Benchmarking
Table 86 Cytiva: Strategic Outlook
Table 87 Thermo Fisher Scientific, Inc.: Key Details, (CEO, HQ, Revenue, Founded, No. of Employees, Company Type, Website, Business Segment)
Table 88 Thermo Fisher Scientific, Inc.: Service Benchmarking
Table 89 Thermo Fisher Scientific, Inc.: Strategic Outlook
Table 90 SGS SA: Key Details, (CEO, HQ, Revenue, Founded, No. of Employees, Company Type, Website, Business Segment)
Table 91 SGS SA: Service Benchmarking
Table 92 SGS SA: Strategic Outlook
Table 93 Eurofins Scientific: Key Details, (CEO, HQ, Revenue, Founded, No. of Employees, Company Type, Website, Business Segment)
Table 94 Eurofins Scientific: Service Benchmarking
Table 95 Eurofins: Strategic Outlook
Table 96 Lonza Group: Key Details, (CEO, HQ, Revenue, Founded, No. of Employees, Company Type, Website, Business Segment)
Table 97 Lonza Group: Service Benchmarking
Table 98 Lonza Group: Strategic Outlook
Table 99 Almac Group: Key Details, (CEO, HQ, Revenue, Founded, No. of Employees, Company Type, Website, Business Segment)
Table 100 Almac Group: Service Benchmarking
Table 101 Almac Group: Strategic Outlook
Table 102 Cobetter Filtration Equipment Co., Ltd.: Key Details, (CEO, HQ, Revenue, Founded, No. of Employees, Company Type, Website, Business Segment)
Table 103 Cobetter Filtration Equipment Co., Ltd.: Service Benchmarking
Table 104 CMIC HOLDINGS Co., Ltd.: Key Details, (CEO, HQ, Revenue, Founded, No. of Employees, Company Type, Website, Business Segment)
Table 105 CMIC HOLDINGS Co., Ltd.: Service Benchmarking
Table 106 CMIC HOLDINGS Co., Ltd.: Strategic Outlook
Table 107 DOC S.r.l.: Key Details, (CEO, HQ, Revenue, Founded, No. of Employees, Company Type, Website, Business Segment)
Table 108 DOC S.r.l.: Service Benchmarking
Table 109 Meissner Filtration Products, Inc.: Key Details, (CEO, HQ, Revenue, Founded, No. of Employees, Company Type, Website, Business Segment)
Table 110 Meissner Filtration Products, Inc.: Service Benchmarking
Table 111 Cytovance Biologics: Key Details, (CEO, HQ, Revenue, Founded, No. of Employees, Company Type, Website, Business Segment)
Table 112 Cytovance Biologics: Service Benchmarking
Table 113 Cytovance Biologics: Strategic Outlook
図の一覧
Figure 1 Bioprocess Validation Market Segmentation
Figure 2 Bioprocess Validation Market by Test Type: Market Attractiveness Index
Figure 3 Bioprocess Validation Market by Component: Market Attractiveness Index
Figure 4 Bioprocess Validation Market by Modality: Market Attractiveness Index
Figure 5 Bioprocess Validation Market by End-users: Market Attractiveness Index
Figure 6 Bioprocess Validation Market Attractiveness Index by Region
Figure 7 Bioprocess Validation Market: Market Dynamics
Figure 8 R&D Spending of Large Pharmaceutical Companies in $ Billion, 2022
Figure 9 Number of Clinical Trials Listed in the WHO International Clinical Trials Registry Platform, by Region, 2020-2022
Figure 10 Bioprocess Validation Market by Region, 2023-2033 (US$ Million, AGR %): “V” Shaped Recovery
Figure 11 Bioprocess Validation Market by Region, 2023-2033 (US$ Million, AGR %): “U” Shaped Recovery
Figure 12 Bioprocess Validation Market by Region, 2023-2033 (US$ Million, AGR %): “W” Shaped Recovery
Figure 13 Bioprocess Validation Market by Region, 2023-2033 (US$ Million, AGR %): “L” Shaped Recovery
Figure 14 Bioprocess Validation Market Attractiveness Index by Test Type
Figure 15 Bioprocess Validation Market Forecast by Test Type, 2023-2033 (US$ Million, AGR %)
Figure 16 Bioprocess Validation Market Share Forecast by Test Type, 2023, 2028, 2033 (%)
Figure 17 Extractable/Leachable Testing Segment Market Forecast by Region, 2023-2033 (US$ Million, AGR %)
Figure 18 Extractable/Leachable Testing Segment Market Share Forecast by Region, 2023 & 2033 (%)
Figure 19 Microbiological Testing Segment Market Forecast by Region, 2023-2033 (US$ Million, AGR %)
Figure 20 Microbiological Testing Segment Market Share Forecast by Region, 2023 & 2033 (%)
Figure 21 Integrity Testing Segment Market Forecast by Region, 2023-2033 (US$ Million, AGR %)
Figure 22 Integrity Testing Segment Market Share Forecast by Region, 2023 & 2033 (%)
Figure 23 Physiochemical Testing Segment Market Forecast by Region, 2023-2033 (US$ Million, AGR %)
Figure 24 Physiochemical Testing Segment Market Share Forecast by Region, 2023 & 2033 (%)
Figure 25 Compatibility Testing Segment Market Forecast by Region, 2023-2033 (US$ Million, AGR %)
Figure 26 Compatibility Testing Segment Market Share Forecast by Region, 2023 & 2033 (%)
Figure 27 Others Segment Market Forecast by Region, 2023-2033 (US$ Million, AGR %)
Figure 28 Others Segment Market Share Forecast by Region, 2023 & 2033 (%)
Figure 29 Bioprocess Validation Market Attractiveness Index by Test Type
Figure 30 Bioprocess Validation Market Forecast by Component, 2023-2033 (US$ Million, AGR %)
Figure 31 Bioprocess Validation Market Share Forecast by Component, 2023, 2028, 2033 (%)
Figure 32 Filters Elements Segment Market Forecast by Region, 2023-2033 (US$ Million, AGR %)
Figure 33 Filters Elements Segment Market Share Forecast by Region, 2023 & 2033 (%)
Figure 34 Media Containers and Bags Segment Market Forecast by Region, 2023-2033 (US$ Million, AGR %)
Figure 35 Media Containers and Bags Segment Market Share Forecast by Region, 2023 & 2033 (%)
Figure 36 Freezing and Thawing Process Bags Segment Market Forecast by Region, 2023-2033 (US$ Million, AGR %)
Figure 37 Freezing and Thawing Process Bags Segment Market Share Forecast by Region, 2023 & 2033 (%)
Figure 38 Bioreactors Segment Market Forecast by Region, 2023-2033 (US$ Million, AGR %)
Figure 39 Bioreactors Segment Market Share Forecast by Region, 2023 & 2033 (%)
Figure 40 Transfer Systems Segment Market Forecast by Region, 2023-2033 (US$ Million, AGR %)
Figure 41 Transfer Systems Segment Market Share Forecast by Region, 2023 & 2033 (%)
Figure 42 Others Segment Market Forecast by Region, 2023-2033 (US$ Million, AGR %)
Figure 43 Others Segment Market Share Forecast by Region, 2023 & 2033 (%)
Figure 44 Bioprocess Validation Market Attractiveness Index by Modality
Figure 45 Bioprocess Validation Market Forecast by Modality, 2023-2033 (US$ Million, AGR %)
Figure 46 Bioprocess Validation Market Share Forecast by Modality, 2023, 2028, 2033 (%)
Figure 47 Cell and Gene Therapy Segment Market Forecast by Region, 2023-2033 (US$ Million, AGR %)
Figure 48 Cell and Gene Therapy Segment Market Share Forecast by Region, 2023 & 2033 (%)
Figure 49 Vaccines Segment Market Forecast by Region, 2023-2033 (US$ Million, AGR %)
Figure 50 Vaccines Segment Market Share Forecast by Region, 2023 & 2033 (%)
Figure 51 Blood and Plasma Products Segment Market Forecast by Region, 2023-2033 (US$ Million, AGR %)
Figure 52 Blood and Plasma Products Segment Market Share Forecast by Region, 2023 & 2033 (%)
Figure 53 Tissue Engineering and Regenerative Medicine Segment Market Forecast by Region, 2023-2033 (US$ Million, AGR %)
Figure 54 Tissue Engineering and Regenerative Medicine Segment Market Share Forecast by Region, 2023 & 2033 (%)
Figure 55 Others Segment Market Forecast by Region, 2023-2033 (US$ Million, AGR %)
Figure 56 Others Segment Market Share Forecast by Region, 2023 & 2033 (%)
Figure 57 Bioprocess Validation Market Attractiveness Index by End-users
Figure 58 Bioprocess Validation Market Forecast by End-users, 2023-2033 (US$ Million, AGR %)
Figure 59 Bioprocess Validation Market Share Forecast by End-users, 2023, 2028, 2033 (%)
Figure 60 Pharmaceutical Companies Segment Market Forecast by Region, 2023-2033 (US$ Million, AGR %)
Figure 61 Pharmaceutical Companies Segment Market Share Forecast by Region, 2023 & 2033 (%)
Figure 62 Biotechnology Companies Segment Market Forecast by Region, 2023-2033 (US$ Million, AGR %)
Figure 63 Biotechnology Companies Segment Market Share Forecast by Region, 2023 & 2033 (%)
Figure 64 Others Segment Market Forecast by Region, 2023-2033 (US$ Million, AGR %)
Figure 65 Others Segment Market Share Forecast by Region, 2023 & 2033 (%)
Figure 66 Bioprocess Validation Market Forecast by Region 2023, 2028, 2033 (Revenue, CAGR%)
Figure 67 Bioprocess Validation Market Share Forecast by Region 2023, 2028, 2033 (%)
Figure 68 Bioprocess Validation Market by Region, 2023-2033 (US$ Mn)
Figure 69 North America Bioprocess Validation Market Attractiveness Index
Figure 70 North America Bioprocess Validation Market by Region, 2023, 2028 & 2033 (US$ million)
Figure 71 North America Bioprocess Validation Market Forecast by Country, 2023-2033 (US$ million)
Figure 72 North America Bioprocess Validation Market Share Forecast by Country, 2023 & 2033 (%)
Figure 73 North America Bioprocess Validation Market Forecast by Test Type, 2023-2033 (US$ Million, AGR %)
Figure 74 North America Bioprocess Validation Market Share Forecast by Test Type, 2023 & 2033 (%)
Figure 75 North America Bioprocess Validation Market Forecast by Component, 2023-2033 (US$ Million, AGR %)
Figure 76 North America Bioprocess Validation Market Share Forecast by Component, 2023 & 2033 (%)
Figure 77 North America Bioprocess Validation Market Forecast by Modality, 2023-2033 (US$ Million, AGR %)
Figure 78 North America Bioprocess Validation Market Share Forecast by Modality, 2023 & 2033 (%)
Figure 79 North America Bioprocess Validation Market Forecast by End-users, 2023-2033 (US$ Million, AGR %)
Figure 80 North America Bioprocess Validation Market Share Forecast by End-users, 2023 & 2033 (%)
Figure 81 U.S. Bioprocess Validation Market Forecast, 2023-2033 (US$ Million, AGR %)
Figure 82 Canada Bioprocess Validation Market Forecast, 2023-2033 (US$ Million, AGR %)
Figure 83 Europe Bioprocess Validation Market Attractiveness Index
Figure 84 Europe Bioprocess Validation Market by Region, 2023, 2028 & 2033 (US$ million)
Figure 85 Europe Bioprocess Validation Market Forecast by Country, 2023-2033 (US$ million)
Figure 86 Europe Bioprocess Validation Market Share Forecast by Country, 2023 & 2033 (%)
Figure 87 Europe Bioprocess Validation Market Forecast by Test Type, 2023-2033 (US$ Million, AGR %)
Figure 88 Europe Bioprocess Validation Market Share Forecast by Test Type, 2023 & 2033 (%)
Figure 89 Europe Bioprocess Validation Market Forecast by Component, 2023-2033 (US$ Million, AGR %)
Figure 90 Europe Bioprocess Validation Market Share Forecast by Component, 2023 & 2033 (%)
Figure 91 Europe Bioprocess Validation Market Forecast by Modality, 2023-2033 (US$ Million, AGR %)
Figure 92 Europe Bioprocess Validation Market Share Forecast by Modality, 2023 & 2033 (%)
Figure 93 Europe Bioprocess Validation Market Forecast by End-users, 2023-2033 (US$ Million, AGR %)
Figure 94 Europe Bioprocess Validation Market Share Forecast by End-users, 2023 & 2033 (%)
Figure 95 Germany Bioprocess Validation Market Forecast, 2023-2033 (US$ Million, AGR %)
Figure 96 UK Bioprocess Validation Market Forecast, 2023-2033 (US$ Million, AGR %)
Figure 97 France Bioprocess Validation Market Forecast, 2023-2033 (US$ Million, AGR %)
Figure 98 Italy Bioprocess Validation Market Forecast, 2023-2033 (US$ Million, AGR %)
Figure 99 Spain Bioprocess Validation Market Forecast, 2023-2033 (US$ Million, AGR %)
Figure 100 Russia Bioprocess Validation Market Forecast, 2023-2033 (US$ Million, AGR %)
Figure 101 Rest of Europe Bioprocess Validation Market Forecast, 2023-2033 (US$ Million, AGR %)
Figure 102 Asia Pacific Bioprocess Validation Market Attractiveness Index
Figure 103 Asia Pacific Bioprocess Validation Market by Region, 2023, 2028 & 2033 (US$ million)
Figure 104 Asia Pacific Bioprocess Validation Market Forecast by Country, 2023-2033 (US$ million)
Figure 105 Asia Pacific Bioprocess Validation Market Share Forecast by Country, 2023 & 2033 (%)
Figure 106 Asia Pacific Bioprocess Validation Market Forecast by Test Type, 2023-2033 (US$ Million, AGR %)
Figure 107 Asia Pacific Bioprocess Validation Market Share Forecast by Test Type, 2023 & 2033 (%)
Figure 108 Asia Pacific Bioprocess Validation Market Forecast by Component, 2023-2033 (US$ Million, AGR %)
Figure 109 Asia Pacific Bioprocess Validation Market Share Forecast by Component, 2023 & 2033 (%)
Figure 110 Asia Pacific Bioprocess Validation Market Forecast by Modality, 2023-2033 (US$ Million, AGR %)
Figure 111 Asia Pacific Bioprocess Validation Market Share Forecast by Modality, 2023 & 2033 (%)
Figure 112 Asia Pacific Bioprocess Validation Market Forecast by End-users, 2023-2033 (US$ Million, AGR %)
Figure 113 Asia Pacific Bioprocess Validation Market Share Forecast by End-users, 2023 & 2033 (%)
Figure 114 Japan Bioprocess Validation Market Forecast, 2023-2033 (US$ Million, AGR %)
Figure 115 China Bioprocess Validation Market Forecast, 2023-2033 (US$ Million, AGR %)
Figure 116 India Bioprocess Validation Market Forecast, 2023-2033 (US$ Million, AGR %)
Figure 117 Australia Bioprocess Validation Market Forecast, 2023-2033 (US$ Million, AGR %)
Figure 118 South Korea Bioprocess Validation Market Forecast, 2023-2033 (US$ Million, AGR %)
Figure 119 South-East Asia Bioprocess Validation Market Forecast, 2023-2033 (US$ Million, AGR %)
Figure 120 Rest of Asia Pacific Bioprocess Validation Market Forecast, 2023-2033 (US$ Million, AGR %)
Figure 121 Latin America Bioprocess Validation Market Attractiveness Index
Figure 122 Latin America Bioprocess Validation Market by Region, 2023, 2028 & 2033 (US$ million)
Figure 123 Latin America Bioprocess Validation Market Forecast by Country, 2023-2033 (US$ million)
Figure 124 Latin America Bioprocess Validation Market Share Forecast by Country, 2023 & 2033 (%)
Figure 125 Latin America Bioprocess Validation Market Forecast by Test Type, 2023-2033 (US$ Million, AGR %)
Figure 126 Latin America Bioprocess Validation Market Share Forecast by Test Type, 2023 & 2033 (%)
Figure 127 Latin America Bioprocess Validation Market Forecast by Component, 2023-2033 (US$ Million, AGR %)
Figure 128 Latin America Bioprocess Validation Market Share Forecast by Component, 2023 & 2033 (%)
Figure 129 Latin America Bioprocess Validation Market Forecast by Modality, 2023-2033 (US$ Million, AGR %)
Figure 130 Latin America Bioprocess Validation Market Share Forecast by Modality, 2023 & 2033 (%)
Figure 131 Latin America Bioprocess Validation Market Forecast by End-users, 2023-2033 (US$ Million, AGR %)
Figure 132 Latin America Bioprocess Validation Market Share Forecast by End-users, 2023 & 2033 (%)
Figure 133 Brazil Bioprocess Validation Market Forecast, 2023-2033 (US$ Million, AGR %)
Figure 134 Mexico Bioprocess Validation Market Forecast, 2023-2033 (US$ Million, AGR %)
Figure 135 Rest of Latin America Bioprocess Validation Market Forecast, 2023-2033 (US$ Million, AGR %)
Figure 136 MEA Bioprocess Validation Market Attractiveness Index
Figure 137 MEA Bioprocess Validation Market by Region, 2023, 2028 & 2033 (US$ million)
Figure 138 MEA Bioprocess Validation Market Forecast by Country, 2023-2033 (US$ million)
Figure 139 MEA Bioprocess Validation Market Share Forecast by Country, 2023 & 2033 (%)
Figure 140 MEA Bioprocess Validation Market Forecast by Test Type, 2023-2033 (US$ Million, AGR %)
Figure 141 MEA Bioprocess Validation Market Share Forecast by Test Type, 2023 & 2033 (%)
Figure 142 MEA Bioprocess Validation Market Forecast by Component, 2023-2033 (US$ Million, AGR %)
Figure 143 MEA Bioprocess Validation Market Share Forecast by Component, 2023 & 2033 (%)
Figure 144 MEA Bioprocess Validation Market Forecast by Modality, 2023-2033 (US$ Million, AGR %)
Figure 145 MEA Bioprocess Validation Market Share Forecast by Modality, 2023 & 2033 (%)
Figure 146 MEA Bioprocess Validation Market Forecast by End-users, 2023-2033 (US$ Million, AGR %)
Figure 147 MEA Bioprocess Validation Market Share Forecast by End-users, 2023 & 2033 (%)
Figure 148 GCC Bioprocess Validation Market Forecast, 2023-2033 (US$ Million, AGR %)
Figure 149 South Africa Bioprocess Validation Market Forecast, 2023-2033 (US$ Million, AGR %)
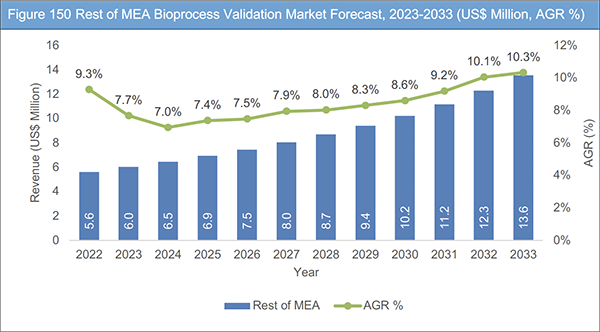
Figure 150 Rest of MEA Bioprocess Validation Market Forecast, 2023-2033 (US$ Million, AGR %)
Figure 151 Sartorius AG: Net Revenue, 2015-2022 (US$ Million, AGR%)
Figure 152 Sartorius AG: Regional Market Shares (%), 2022
Figure 153 Sartorius AG: R&D, 2015-2022 (US$ Million, AGR%)
Figure 154 Charles River Laboratories: Net Revenue, 2015-2022 (US$ Million, AGR%)
Figure 155 Charles River Laboratories: Regional Market Shares (%), 2022
Figure 156 Merck KGaA: Net Revenue, 2015-2022 (US$ Million, AGR%)
Figure 157 Merck KGaA: Regional Market Shares (%), 2022
Figure 158 Merck KGaA: R&D, 2015-2022 (US$ Million, AGR%)
Figure 159 Thermo Fisher Scientific, Inc.: Net Revenue, 2015-2022 (US$ Million, AGR%)
Figure 160 Thermo Fisher Scientific, Inc.: Regional Market Shares (%), 2022
Figure 161 Thermo Fisher Scientific, Inc.: R&D, 2015-2022 (US$ Million, AGR%)
Figure 162 SGS SA: Net Revenue, 2015-2022 (US$ Million, AGR%)
Figure 163 SGS SA: Regional Market Shares (%), 2022
Figure 164 Eurofins Scientific: Net Revenue, 2016-2022 (US$ Million, AGR%)
Figure 165 Eurofins Scientific: Regional Market Shares (%), 2022
Figure 166 Lonza Group: Net Revenue, 2015-2022 (US$ Million, AGR%)
Figure 167 Lonza Group: Regional Market Shares (%), 2022
Figure 168 Lonza Group: R&D, 2017-2022 (US$ Million, AGR%)
Figure 169 CMIC HOLDINGS Co., Ltd.: Net Revenue, 2015-2022 (US$ Million, AGR%)
ページTOPに戻る
Summary
Report Details
The Bioprocess Validation Market Report 2023-2033: This report will prove invaluable to leading firms striving for new revenue pockets if they wish to better understand the industry and its underlying dynamics. It will be useful for companies that would like to expand into different industries or to expand their existing operations in a new region.
Rising Demand for Clinical Trials Globally
The market for biopharmaceuticals is rising, there is an increase in the need for healthcare due to an ageing population, and the biotech, pharmaceutical, and medical device industries are expanding to fulfil this demand. As a result, the demand for effective clinical studies has increased in order to ensure the efficacy and safety of products. Worldwide, there are around 266 thousand open clinical trials ongoing. More than 105,000 open clinical investigations are now being conducted just in the United States.
Biologics and other pharmacological medications are the focus of these trials. Positive market growth for clinical trial services has led to an uptick in finance and investment, M&A (merger and acquisition) activity, the use of CROs (contract research organisations), and the availability of functional service providers. Further variables that influence the expansion of the clinical trial services market include the FDA’s (Food and Drug Administration) recently implemented simplification of the adoption authorization process, genomics’ advancement, and the launch of medicinal products with genetic profiles that are customised to patients or diseases.
Issues Related to Extractables and Leachable
The primary objective of Extractables and Leachables (E&L) testing is to mitigate the potential safety hazards posed to consumers of various products, including pharmaceutical medications and Electronic Nicotine Delivery Systems (ENDS), by evaluating the container closure system of these products. One of the primary difficulties associated with conducting leachables studies pertains to the prevalent necessity of achieving lower detection limits. This poses a challenge for both instrument vendors and laboratory scientists.
The development of instrument methods and sample preparation techniques necessitates the involvement of proficient and knowledgeable analysts who possess advanced skills and extensive experience. This is essential in order to meet the stringent analytical evaluation thresholds. Additionally, the utilisation of cutting-edge mass spectrometry instruments and software is imperative to effectively detect these minute levels and efficiently process the resulting data.
What Questions Should You Ask before Buying a Market Research Report?
• How is the bioprocess validation market evolving?
• What is driving and restraining the bioprocess validation market?
• How will each bioprocess validation submarket segment grow over the forecast period and how much revenue will these submarkets account for in 2033?
• How will the market shares for each bioprocess validation submarket develop from 2023 to 2033?
• What will be the main driver for the overall market from 2023 to 2033?
• Will leading bioprocess validation markets broadly follow the macroeconomic dynamics, or will individual national markets outperform others?
• How will the market shares of the national markets change by 2033 and which geographical region will lead the market in 2033?
• Who are the leading players and what are their prospects over the forecast period?
• What are the bioprocess validation projects for these leading companies?
• How will the industry evolve during the period between 2023 and 2033? What are the implications of
bioprocess validation projects taking place now and over the next 10 years?
• Is there a greater need for product commercialisation to further scale the bioprocess validation market?
• Where is the bioprocess validation market heading and how can you ensure you are at the forefront of the market?
• What are the best investment options for new product and service lines?
• What are the key prospects for moving companies into a new growth path and C-suite?
You need to discover how this will impact the bioprocess validation market today, and over the next 10 years:
• Our 315-page report provides 113 tables and 169 charts/graphs exclusively to you.
• The report highlights key lucrative areas in the industry so you can target them – NOW.
• It contains in-depth analysis of global, regional and national sales and growth.
• It highlights for you the key successful trends, changes and revenue projections made by your competitors.
This report tells you TODAY how the bioprocess validation market will develop in the next 10 years, and in line with the variations in COVID-19 economic recession and bounce. This market is more critical now than at any point over the last 10 years.
Forecasts to 2033 and other analyses reveal commercial prospects
• In addition to revenue forecasting to 2033, our new study provides you with recent results, growth rates, and market shares.
• You will find original analyses, with business outlooks and developments.
• Discover qualitative analyses (including market dynamics, drivers, opportunities, and restraints), Porter’s Five Forces Analysis, PEST Analysis and recent developments.
This report includes data analysis and invaluable insight into how COVID-19 will affect the industry and your company. Four COVID-19 recovery patterns and their impact, namely, “V”, “L”, “W” and “U” are discussed in this report.
Segments Covered in the Report
Test Type
• Extractable/Leachable Testing
• Microbiological Testing
• Integrity Testing
• Physiochemical Testing
• Compatibility Testing
• Others
Component
• Filters Elements
• Media Containers and Bags
• Freezing and Thawing Process Bags
• Bioreactors
• Transfer Systems
• Others
Modality
• Cell and Gene Therapy
• Vaccines
• Blood and Plasma Products
• Tissue Engineering and Regenerative Medicine
• Others
End-users
• Pharmaceutical Companies
• Biotechnology Companies
• Others
In addition to the revenue predictions for the overall world market and segments, you will also find revenue forecasts for five regional and 22 leading national markets:
North America
• U.S.
• Canada
Europe
• Germany
• UK
• France
• Italy
• Spain
• Russia
• Rest of Europe
Asia Pacific
• Japan
• China
• India
• Australia
• South Korea
• South-East Asia
• Rest of Asia Pacific
Latin America
• Brazil
• Mexico
• Rest of Latin America
MEA
• GCC
• South Africa
• Rest of MEA
The report also includes profiles and for some of the leading companies in the Bioprocess Validation Market, 2023 to 2033, with a focus on this segment of these companies’ operations.
Leading companies and the potential for market growth
• Almac Group
• Charles River Laboratories
• CMIC HOLDINGS Co., Ltd.
• Cobetter Filtration Equipment Co., Ltd.
• Cytovance Biologics
• Cytiva
• DOC S.r.l.
• Eurofins Scientific
• Lonza Group
• Meissner Filtration Products, Inc.
• Merck KGaA
• Sartorius AG
• SGS SA
• Thermo Fisher Scientific Inc.
Overall world revenue for Bioprocess Validation Market, 2023 to 2033 in terms of value the market will surpass US$490 million in 2023, our work calculates. We predict strong revenue growth through to 2033. Our work identifies which organizations hold the greatest potential. Discover their capabilities, progress, and commercial prospects, helping you stay ahead.
How will the Bioprocess Validation Market, 2023 to 2033 report help you?
In summary, our 310+ page report provides you with the following knowledge:
• Revenue forecasts to 2033 for Bioprocess Validation Market 2023 to 2033, with forecasts for test type, component, modality and end-users, each forecast at a global and regional level – discover the industry’s prospects, finding the most lucrative places for investments and revenues.
• Revenue forecasts to 2033 for five regional and 22 key national markets – See forecasts for the Bioprocess Validation Market, 2023 to 2033 market in North America, Europe, Asia-Pacific, Latin America, and MEA. Also forecasted is the market in the US, Canada, Mexico, Brazil, Germany, France, UK, Italy, China, India, Japan, and Australia among other prominent economies.
• Prospects for established firms and those seeking to enter the market – including company profiles for 14 of the major companies involved in the Bioprocess Validation Market, 2023 to 2033.
Find quantitative and qualitative analyses with independent predictions. Receive information that only our report contains, staying informed with invaluable business intelligence.
Information found nowhere else
With our new report, you are less likely to fall behind in knowledge or miss out on opportunities. See how our work could benefit your research, analyses, and decisions. Visiongain’s study is for everybody needing commercial analyses for the Bioprocess Validation Market 2023 to 2033, market-leading companies. You will find data, trends and predictions.
ページTOPに戻る
Table of Contents
Table of Contents
1 Report Overview
1.1 Objectives of the Study
1.2 Introduction to Bioprocess Validation Market
1.3 What This Report Delivers
1.4 Why You Should Read This Report
1.5 Key Questions Answered by This Analytical Report Include:
1.6 Who is This Report For?
1.7 Methodology
1.7.1 Market Definitions
1.7.2 Market Evaluation & Forecasting Methodology
1.7.3 Data Validation
1.7.3.1 Primary Research
1.7.3.2 Secondary Research
1.8 Frequently Asked Questions (FAQs)
1.9 Associated Visiongain Reports
1.10 About Visiongain
2 Executive Summary
3 Market Overview
3.1 Key Findings
3.2 Market Dynamics
3.2.1 Market Driving Factors
3.2.1.1 Increasing Demand for Biopharmaceuticals
3.2.1.2 Increasing Demand for Outsourcing Bioprocess Validation
3.2.1.3 Rising R&D Expenditure
3.2.1.4 Rising Demand for Clinical Trials Globally
3.2.2 Market Restraining Factors
3.2.2.1 Issues Related to Extractables and Leachable
3.2.2.2 High Cost of Advanced Technology
3.2.2.3 Shortage of Skilled Labour Post COVID-19 Hampering Industry Growth
3.2.2.4 Regulatory Challenges
3.2.3 Market Opportunities
3.2.3.1 Growth Opportunities in Emerging Economies
3.2.3.2 Harmonized Bioanalytical Testing Opens New Opportunities
3.2.3.3 Data Security and Compliance in the Digital Age to Offer Lucrative Growth Prospects
3.2.3.4 Customised Solutions for Small and Medium Enterprises (SMEs)
3.2.3.5 Digital Twins for Bioprocess Validation
3.3 COVID-19 Impact Analysis
3.4 Porter’s Five Forces Analysis
3.4.1 Supplier Power
3.4.2 Buyer Power
3.4.3 Competitive Rivalry
3.4.4 Threat from Substitutes
3.4.5 Threat of New Entrants
3.5 PEST Analysis
3.5.1 Political Factors Impacting Bioprocess Validation Market
3.5.2 Economic Factors Impacting Bioprocess Validation Market
3.5.3 Social Factors Impacting Bioprocess Validation Market
3.5.4 Technological Factors Impacting Bioprocess Validation Market
3.6 Market Overview of Single-use Technologies (Bags) and Container Closure System Validation
3.7 Market Limitation of Validation Services
3.8 Decision Making Drivers for Choosing Validation Suppliers Regionally
3.9 Viral Clearance Testing Market by Region, 2023-2033 (US$ Mn, AGR %)
4 Bioprocess Validation Market Analysis by Test Type
4.1 Key Findings
4.2 Test Type Segment: Market Attractiveness Index
4.3 Bioprocess Validation Market Size Estimation and Forecast by Test Type
4.4 Extractable/Leachable Testing
4.4.1 Market Forecast by Region, 2023-2033 (US$ Million, AGR %)
4.4.2 Market Share by Region, 2023 & 2033 (%)
4.5 Microbiological Testing
4.5.1 Market Forecast by Region, 2023-2033 (US$ Million, AGR %)
4.5.2 Market Share by Region, 2023 & 2033 (%)
4.6 Integrity Testing
4.6.1 Market Forecast by Region, 2023-2033 (US$ Million, AGR %)
4.6.2 Market Share by Region, 2023 & 2033 (%)
4.7 Physiochemical Testing
4.7.1 Market Forecast by Region, 2023-2033 (US$ Million, AGR %)
4.7.2 Market Share by Region, 2023 & 2033 (%)
4.8 Compatibility Testing
4.8.1 Market Forecast by Region, 2023-2033 (US$ Million, AGR %)
4.8.2 Market Share by Region, 2023 & 2033 (%)
4.9 Others
4.9.1 Market Forecast by Region, 2023-2033 (US$ Million, AGR %)
4.9.2 Market Share by Region, 2023 & 2033 (%)
5 Bioprocess Validation Market Analysis by Component
5.1 Key Findings
5.2 Component Segment: Market Attractiveness Index
5.3 Bioprocess Validation Market Size Estimation and Forecast by Component
5.4 Filters Elements
5.4.1 Market Forecast by Region, 2023-2033 (US$ Million, AGR %)
5.4.2 Market Share by Region, 2023 & 2033 (%)
5.5 Media Containers and Bags
5.5.1 Market Forecast by Region, 2023-2033 (US$ Million, AGR %)
5.5.2 Market Share by Region, 2023 & 2033 (%)
5.6 Freezing and Thawing Process Bags
5.6.1 Market Forecast by Region, 2023-2033 (US$ Million, AGR %)
5.6.2 Market Share by Region, 2023 & 2033 (%)
5.7 Bioreactors
5.7.1 Market Forecast by Region, 2023-2033 (US$ Million, AGR %)
5.7.2 Market Share by Region, 2023 & 2033 (%)
5.8 Transfer Systems
5.8.1 Market Forecast by Region, 2023-2033 (US$ Million, AGR %)
5.8.2 Market Share by Region, 2023 & 2033 (%)
5.9 Others
5.9.1 Market Forecast by Region, 2023-2033 (US$ Million, AGR %)
5.9.2 Market Share by Region, 2023 & 2033 (%)
6 Bioprocess Validation Market Analysis by Modality
6.1 Key Findings
6.2 Modality Segment: Market Attractiveness Index
6.3 Bioprocess Validation Market Size Estimation and Forecast by Modality
6.4 Cell and Gene Therapy
6.4.1 Market Forecast by Region, 2023-2033 (US$ Million, AGR %)
6.4.2 Market Share by Region, 2023 & 2033 (%)
6.5 Vaccines
6.5.1 Market Forecast by Region, 2023-2033 (US$ Million, AGR %)
6.5.2 Market Share by Region, 2023 & 2033 (%)
6.6 Blood and Plasma Products
6.6.1 Market Forecast by Region, 2023-2033 (US$ Million, AGR %)
6.6.2 Market Share by Region, 2023 & 2033 (%)
6.7 Tissue Engineering and Regenerative Medicine
6.7.1 Market Forecast by Region, 2023-2033 (US$ Million, AGR %)
6.7.2 Market Share by Region, 2023 & 2033 (%)
6.8 Others
6.8.1 Market Forecast by Region, 2023-2033 (US$ Million, AGR %)
6.8.2 Market Share by Region, 2023 & 2033 (%)
7 Bioprocess Validation Market Analysis by End-users
7.1 Key Findings
7.2 End-users Segment: Market Attractiveness Index
7.3 Bioprocess Validation Market Size Estimation and Forecast by End-users
7.4 Pharmaceutical Companies
7.4.1 Market Forecast by Region, 2023-2033 (US$ Million, AGR %)
7.4.2 Market Share by Region, 2023 & 2033 (%)
7.5 Biotechnology Companies
7.5.1 Market Forecast by Region, 2023-2033 (US$ Million, AGR %)
7.5.2 Market Share by Region, 2023 & 2033 (%)
7.6 Others
7.6.1 Market Forecast by Region, 2023-2033 (US$ Million, AGR %)
7.6.2 Market Share by Region, 2023 & 2033 (%)
8 Bioprocess Validation Market Analysis by Region
8.1 Key Findings
8.2 Regional Market Size Estimation and Forecast
9 North America Bioprocess Validation Market Analysis
9.1 Key Findings
9.2 North America Bioprocess Validation Market Attractiveness Index
9.3 North America Bioprocess Validation Market by Country, 2023, 2028 & 2033 (US$ Million)
9.4 North America Bioprocess Validation Market Size Estimation and Forecast by Country
9.5 North America Bioprocess Validation Market Size Estimation and Forecast by Test Type
9.6 North America Bioprocess Validation Market Size Estimation and Forecast by Component
9.7 North America Bioprocess Validation Market Size Estimation and Forecast by Modality
9.8 North America Bioprocess Validation Market Size Estimation and Forecast by End-users
9.9 U.S. Bioprocess Validation Market Analysis
9.10 Canada Bioprocess Validation Market Analysis
10 Europe Bioprocess Validation Market Analysis
10.1 Key Findings
10.2 Europe Bioprocess Validation Market Attractiveness Index
10.3 Europe Bioprocess Validation Market by Country, 2023, 2028 & 2033 (US$ Million)
10.4 Europe Bioprocess Validation Market Size Estimation and Forecast by Country
10.5 Europe Bioprocess Validation Market Size Estimation and Forecast by Test Type
10.6 Europe Bioprocess Validation Market Size Estimation and Forecast by Component
10.7 Europe Bioprocess Validation Market Size Estimation and Forecast by Modality
10.8 Europe Bioprocess Validation Market Size Estimation and Forecast by End-users
10.9 Germany Bioprocess Validation Market Analysis
10.10 UK Bioprocess Validation Market Analysis
10.11 France Bioprocess Validation Market Analysis
10.12 Italy Bioprocess Validation Market Analysis
10.13 Spain Bioprocess Validation Market Analysis
10.14 Russia Bioprocess Validation Market Analysis
10.15 Rest of Europe Bioprocess Validation Market Analysis
11 Asia Pacific Bioprocess Validation Market Analysis
11.1 Key Findings
11.2 Asia Pacific Bioprocess Validation Market Attractiveness Index
11.3 Asia Pacific Bioprocess Validation Market by Country, 2023, 2028 & 2033 (US$ Million)
11.4 Asia Pacific Bioprocess Validation Market Size Estimation and Forecast by Country
11.5 Asia Pacific Bioprocess Validation Market Size Estimation and Forecast by Test Type
11.6 Asia Pacific Bioprocess Validation Market Size Estimation and Forecast by Component
11.7 Asia Pacific Bioprocess Validation Market Size Estimation and Forecast by Modality
11.8 Asia Pacific Bioprocess Validation Market Size Estimation and Forecast by End-users
11.9 Japan Bioprocess Validation Market Analysis
11.10 China Bioprocess Validation Market Analysis
11.11 India Bioprocess Validation Market Analysis
11.12 Australia Bioprocess Validation Market Analysis
11.13 South Korea Bioprocess Validation Market Analysis
11.14 South-East Asia Bioprocess Validation Market Analysis
11.15 Rest of Asia Pacific Bioprocess Validation Market Analysis
12 Latin America Bioprocess Validation Market Analysis
12.1 Key Findings
12.2 Latin America Bioprocess Validation Market Attractiveness Index
12.3 Latin America Bioprocess Validation Market by Country, 2023, 2028 & 2033 (US$ Million)
12.4 Latin America Bioprocess Validation Market Size Estimation and Forecast by Country
12.5 Latin America Bioprocess Validation Market Size Estimation and Forecast by Test Type
12.6 Latin America Bioprocess Validation Market Size Estimation and Forecast by Component
12.7 Latin America Bioprocess Validation Market Size Estimation and Forecast by Modality
12.8 Latin America Bioprocess Validation Market Size Estimation and Forecast by End-users
12.9 Brazil Bioprocess Validation Market Analysis
12.10 Mexico Bioprocess Validation Market Analysis
12.11 Rest of Latin America Bioprocess Validation Market Analysis
13 MEA Bioprocess Validation Market Analysis
13.1 Key Findings
13.2 MEA Bioprocess Validation Market Attractiveness Index
13.3 MEA Bioprocess Validation Market by Country, 2023, 2028 & 2033 (US$ Million)
13.4 MEA Bioprocess Validation Market Size Estimation and Forecast by Country
13.5 MEA Bioprocess Validation Market Size Estimation and Forecast by Test Type
13.6 MEA Bioprocess Validation Market Size Estimation and Forecast by Component
13.7 MEA Bioprocess Validation Market Size Estimation and Forecast by Modality
13.8 MEA Bioprocess Validation Market Size Estimation and Forecast by End-users
13.9 GCC Bioprocess Validation Market Analysis
13.10 South Africa Bioprocess Validation Market Analysis
13.11 Rest of MEA Bioprocess Validation Market Analysis
14 Company Profiles
14.1 Sartorius AG
14.1.1 Company Snapshot
14.1.2 Company Overview
14.1.3 Financial Analysis
14.1.3.1 Net Revenue, 2015-2022
14.1.3.2 Regional Market Shares, 2022
14.1.3.3 R&D, 2015-2022
14.1.4 Service Benchmarking
14.1.5 Strategic Outlook
14.2 Charles River Laboratories
14.2.1 Company Snapshot
14.2.2 Company Overview
14.2.3 Financial Analysis
14.2.3.1 Net Revenue, 2015-2022
14.2.3.2 Regional Market Shares, 2022
14.2.4 Service Benchmarking
14.2.5 Strategic Outlook
14.3 Merck KGaA
14.3.1 Company Snapshot
14.3.2 Company Overview
14.3.3 Financial Analysis
14.3.3.1 Net Revenue, 2015-2022
14.3.3.2 Regional Market Shares, 2022
14.3.3.3 R&D, 2015-2022
14.3.4 Service Benchmarking
14.3.5 Strategic Outlook
14.4 Cytiva
14.4.1 Company Snapshot
14.4.2 Company Overview
14.4.3 Service Benchmarking
14.4.4 Strategic Outlook
14.5 Thermo Fisher Scientific, Inc.
14.5.1 Company Snapshot
14.5.2 Company Overview
14.5.3 Financial Analysis
14.5.3.1 Net Revenue, 2015-2022
14.5.3.2 Regional Market Shares, 2022
14.5.3.3 R&D, 2015-2022
14.5.4 Service Benchmarking
14.5.5 Strategic Outlook
14.6 SGS SA
14.6.1 Company Snapshot
14.6.2 Company Overview
14.6.3 Financial Analysis
14.6.3.1 Net Revenue, 2015-2022
14.6.3.2 Regional Market Shares, 2022
14.6.4 Service Benchmarking
14.6.5 Strategic Outlook
14.7 Eurofins Scientific
14.7.1 Company Snapshot
14.7.2 Company Overview
14.7.3 Financial Analysis
14.7.3.1 Net Revenue, 2016-2022
14.7.3.2 Regional Market Shares, 2022
14.7.4 Service Benchmarking
14.7.5 Strategic Outlook
14.8 Lonza Group
14.8.1 Company Snapshot
14.8.2 Company Overview
14.8.3 Financial Analysis
14.8.3.1 Net Revenue, 2015-2022
14.8.3.2 Regional Market Shares, 2022
14.8.3.3 R&D, 2017-2022
14.8.4 Service Benchmarking
14.8.5 Strategic Outlook
14.9 Almac Group
14.9.1 Company Snapshot
14.9.2 Company Overview
14.9.3 Service Benchmarking
14.9.4 Strategic Outlook
14.10 Cobetter Filtration Equipment Co., Ltd.
14.10.1 Company Snapshot
14.10.2 Company Overview
14.10.3 Service Benchmarking
14.11 CMIC HOLDINGS Co., Ltd.
14.11.1 Company Snapshot
14.11.2 Company Overview
14.11.3 Financial Analysis
14.11.3.1 Net Revenue, 2015-2022
14.11.4 Service Benchmarking
14.11.5 Strategic Outlook
14.12 DOC S.r.l.
14.12.1 Company Snapshot
14.12.2 Company Overview
14.12.3 Service Benchmarking
14.13 Meissner Filtration Products, Inc.
14.13.1 Company Snapshot
14.13.2 Company Overview
14.13.3 Service Benchmarking
14.14 Cytovance Biologics
14.14.1 Company Snapshot
14.14.2 Company Overview
14.14.3 Service Benchmarking
14.14.4 Strategic Outlook
15 Conclusion and Recommendations
15.1 Concluding Remarks from Visiongain
15.2 Recommendations for Market Players
ページTOPに戻る
List of Tables/Graphs
List of Tables
Table 1 Bioprocess Validation Market Snapshot, 2023 & 2033 (US$ Million, CAGR %)
Table 2 Bioprocess Validation Market Forecast by Region, 2023-2033 (US$ Million, AGR%, CAGR%): "V" Shaped Recovery
Table 3 Bioprocess Validation Market Forecast by Region, 2023-2033 (US$ Million, AGR%, CAGR%): "U" Shaped Recovery
Table 4 Bioprocess Validation Market Forecast by Region, 2023-2033 (US$ Million, AGR%, CAGR%): "W" Shaped Recovery
Table 5 Bioprocess Validation Market Forecast by Region, 2023-2033 (US$ Million, AGR%, CAGR%): "L" Shaped Recovery
Table 6 Market Limitation of Validation Services
Table 1 Bioprocess Validation Market Snapshot, 2023 & 2033 (US$ million, CAGR %)
Table 2 Viral Clearance Testing Market Forecast by Region, 2023-2033 (US$ Million, AGR%, CAGR%)
Table 3 Bioprocess Validation Market Forecast by Test Type, 2023-2033 (US$ Million, AGR%, CAGR%)
Table 4 Extractable/Leachable Testing Segment Market Forecast by Region, 2023-2033 (US$ Million, AGR%, CAGR%)
Table 5 Microbiological Testing Segment Market Forecast by Region, 2023-2033 (US$ Million, AGR%, CAGR%)
Table 6 Integrity Testing Segment Market Forecast by Region, 2023-2033 (US$ Million, AGR%, CAGR%)
Table 7 Physiochemical Testing Segment Market Forecast by Region, 2023-2033 (US$ Million, AGR%, CAGR%)
Table 8 Compatibility Testing Segment Market Forecast by Region, 2023-2033 (US$ Million, AGR%, CAGR%)
Table 9 Others Segment Market Forecast by Region, 2023-2033 (US$ Million, AGR%, CAGR%)
Table 10 Bioprocess Validation Market Forecast by Component, 2023-2033 (US$ Million, AGR%, CAGR%)
Table 11 Filters Elements Segment Market Forecast by Region, 2023-2033 (US$ Million, AGR%, CAGR%)
Table 12 Media Containers and Bags Segment Market Forecast by Region, 2023-2033 (US$ Million, AGR%, CAGR%)
Table 13 Freezing and Thawing Process Bags Segment Market Forecast by Region, 2023-2033 (US$ Million, AGR%, CAGR%)
Table 14 Bioreactors Segment Market Forecast by Region, 2023-2033 (US$ Million, AGR%, CAGR%)
Table 15 Transfer Systems Segment Market Forecast by Region, 2023-2033 (US$ Million, AGR%, CAGR%)
Table 16 Others Segment Market Forecast by Region, 2023-2033 (US$ Million, AGR%, CAGR%)
Table 17 Bioprocess Validation Market Forecast by Modality, 2023-2033 (US$ Million, AGR%, CAGR%)
Table 18 Cell and Gene Therapy Segment Market Forecast by Region, 2023-2033 (US$ Million, AGR%, CAGR%)
Table 19 Vaccines Segment Market Forecast by Region, 2023-2033 (US$ Million, AGR%, CAGR%)
Table 20 Blood and Plasma Products Segment Market Forecast by Region, 2023-2033 (US$ Million, AGR%, CAGR%)
Table 21 Tissue Engineering and Regenerative Medicine Segment Market Forecast by Region, 2023-2033 (US$ Million, AGR%, CAGR%)
Table 22 Others Segment Market Forecast by Region, 2023-2033 (US$ Million, AGR%, CAGR%)
Table 23 Europe Bioprocess Validation Market Forecast by End-users, 2023-2033 (US$ Million, AGR%, CAGR%)
Table 24 Pharmaceutical Companies Segment Market Forecast by Region, 2023-2033 (US$ Million, AGR%, CAGR%)
Table 25 Biotechnology Companies Segment Market Forecast by Region, 2023-2033 (US$ Million, AGR%, CAGR%)
Table 26 Others Segment Market Forecast by Region, 2023-2033 (US$ Million, AGR%, CAGR%)
Table 27 Bioprocess Validation Market Forecast by Region, 2023-2033 (US$ Million, AGR%, CAGR%)
Table 28 North America Bioprocess Validation Market Forecast by Country, 2023-2033 (US$ Million, AGR%, CAGR%)
Table 29 North America Bioprocess Validation Market Forecast by Test Type, 2023-2033 (US$ Million, AGR%, CAGR%)
Table 30 North America Bioprocess Validation Market Forecast by Test Type, 2023-2033 (US$ Million, AGR%, CAGR%)
Table 31 North America Bioprocess Validation Market Forecast by Modality, 2023-2033 (US$ Million, AGR%, CAGR%)
Table 32 North America Bioprocess Validation Market Forecast by End-users, 2023-2033 (US$ Million, AGR%, CAGR%)
Table 33 U.S. Bioreactors Market Forecast, 2023-2033 (US$ Million, AGR%, CAGR%)
Table 34 Canada Bioreactors Market Forecast, 2023-2033 (US$ Million, AGR%, CAGR%)
Table 35 Europe Bioprocess Validation Market Forecast by Country, 2023-2033 (US$ Million, AGR%, CAGR%)
Table 36 Europe Bioprocess Validation Market Forecast by Test Type, 2023-2033 (US$ Million, AGR%, CAGR%)
Table 37 Europe Bioprocess Validation Market Forecast by Test Type, 2023-2033 (US$ Million, AGR%, CAGR%)
Table 38 Europe Bioprocess Validation Market Forecast by Modality, 2023-2033 (US$ Million, AGR%, CAGR%)
Table 39 Europe Bioprocess Validation Market Forecast by End-users, 2023-2033 (US$ Million, AGR%, CAGR%)
Table 40 Germany Bioreactors Market Forecast, 2023-2033 (US$ Million, AGR%, CAGR%)
Table 41 UK Bioreactors Market Forecast, 2023-2033 (US$ Million, AGR%, CAGR%)
Table 42 France Bioreactors Market Forecast, 2023-2033 (US$ Million, AGR%, CAGR%)
Table 43 Italy Bioreactors Market Forecast, 2023-2033 (US$ Million, AGR%, CAGR%)
Table 44 Spain Bioreactors Market Forecast, 2023-2033 (US$ Million, AGR%, CAGR%)
Table 45 Russia Bioreactors Market Forecast, 2023-2033 (US$ Million, AGR%, CAGR%)
Table 46 Rest of Europe Bioreactors Market Forecast, 2023-2033 (US$ Million, AGR%, CAGR%)
Table 47 Asia Pacific Bioprocess Validation Market Forecast by Country, 2023-2033 (US$ Million, AGR%, CAGR%)
Table 48 Asia Pacific Bioprocess Validation Market Forecast by Test Type, 2023-2033 (US$ Million, AGR%, CAGR%)
Table 49 Asia Pacific Bioprocess Validation Market Forecast by Component, 2023-2033 (US$ Million, AGR%, CAGR%)
Table 50 Asia Pacific Bioprocess Validation Market Forecast by Modality, 2023-2033 (US$ Million, AGR%, CAGR%)
Table 51 Asia Pacific Bioprocess Validation Market Forecast by End-users, 2023-2033 (US$ Million, AGR%, CAGR%)
Table 52 Japan Bioreactors Market Forecast, 2023-2033 (US$ Million, AGR%, CAGR%)
Table 53 China Bioreactors Market Forecast, 2023-2033 (US$ Million, AGR%, CAGR%)
Table 54 India Bioreactors Market Forecast, 2023-2033 (US$ Million, AGR%, CAGR%)
Table 55 Australia Bioreactors Market Forecast, 2023-2033 (US$ Million, AGR%, CAGR%)
Table 56 South Korea Bioreactors Market Forecast, 2023-2033 (US$ Million, AGR%, CAGR%)
Table 57 South-East Asia Bioreactors Market Forecast, 2023-2033 (US$ Million, AGR%, CAGR%)
Table 58 Rest of Asia Pacific Bioreactors Market Forecast, 2023-2033 (US$ Million, AGR%, CAGR%)
Table 59 Latin America Bioprocess Validation Market Forecast by Country, 2023-2033 (US$ Million, AGR%, CAGR%)
Table 60 Latin America Bioprocess Validation Market Forecast by Test Type, 2023-2033 (US$ Million, AGR%, CAGR%)
Table 61 Latin America Bioprocess Validation Market Forecast by Component, 2023-2033 (US$ Million, AGR%, CAGR%)
Table 62 Latin America Bioprocess Validation Market Forecast by Modality, 2023-2033 (US$ Million, AGR%, CAGR%)
Table 63 Latin America Bioprocess Validation Market Forecast by End-users, 2023-2033 (US$ Million, AGR%, CAGR%)
Table 64 Brazil Bioreactors Market Forecast, 2023-2033 (US$ Million, AGR%, CAGR%)
Table 65 Mexico Bioreactors Market Forecast, 2023-2033 (US$ Million, AGR%, CAGR%)
Table 66 Rest of Latin America Bioreactors Market Forecast, 2023-2033 (US$ Million, AGR%, CAGR%)
Table 67 MEA Bioprocess Validation Market Forecast by Country, 2023-2033 (US$ Million, AGR%, CAGR%)
Table 68 MEA Bioprocess Validation Market Forecast by Test Type, 2023-2033 (US$ Million, AGR%, CAGR%)
Table 69 MEA Bioprocess Validation Market Forecast by Component, 2023-2033 (US$ Million, AGR%, CAGR%)
Table 70 MEA Bioprocess Validation Market Forecast by Modality, 2023-2033 (US$ Million, AGR%, CAGR%)
Table 71 MEA Bioprocess Validation Market Forecast by End-users, 2023-2033 (US$ Million, AGR%, CAGR%)
Table 72 GCC Bioreactors Market Forecast, 2023-2033 (US$ Million, AGR%, CAGR%)
Table 73 South Africa Bioreactors Market Forecast, 2023-2033 (US$ Million, AGR%, CAGR%)
Table 74 Rest of MEA Bioreactors Market Forecast, 2023-2033 (US$ Million, AGR%, CAGR%)
Table 75 Sartorius AG: Key Details, (CEO, HQ, Revenue, Founded, No. of Employees, Company Type, Website, Business Segment)
Table 76 Sartorius AG: Service Benchmarking
Table 77 Sartorius AG: Strategic Outlook
Table 78 Charles River Laboratories: Key Details, (CEO, HQ, Revenue, Founded, No. of Employees, Company Type, Website, Business Segment)
Table 79 Charles River Laboratories: Service Benchmarking
Table 80 Charles River Laboratories: Strategic Outlook
Table 81 Merck KGaA: Key Details, (CEO, HQ, Revenue, Founded, No. of Employees, Company Type, Website, Business Segment)
Table 82 Merck KGaA: Service Benchmarking
Table 83 Merck KGaA: Strategic Outlook
Table 84 Cytiva: Key Details, (CEO, HQ, Revenue, Founded, No. of Employees, Company Type, Website, Business Segment)
Table 85 Cytiva: Service Benchmarking
Table 86 Cytiva: Strategic Outlook
Table 87 Thermo Fisher Scientific, Inc.: Key Details, (CEO, HQ, Revenue, Founded, No. of Employees, Company Type, Website, Business Segment)
Table 88 Thermo Fisher Scientific, Inc.: Service Benchmarking
Table 89 Thermo Fisher Scientific, Inc.: Strategic Outlook
Table 90 SGS SA: Key Details, (CEO, HQ, Revenue, Founded, No. of Employees, Company Type, Website, Business Segment)
Table 91 SGS SA: Service Benchmarking
Table 92 SGS SA: Strategic Outlook
Table 93 Eurofins Scientific: Key Details, (CEO, HQ, Revenue, Founded, No. of Employees, Company Type, Website, Business Segment)
Table 94 Eurofins Scientific: Service Benchmarking
Table 95 Eurofins: Strategic Outlook
Table 96 Lonza Group: Key Details, (CEO, HQ, Revenue, Founded, No. of Employees, Company Type, Website, Business Segment)
Table 97 Lonza Group: Service Benchmarking
Table 98 Lonza Group: Strategic Outlook
Table 99 Almac Group: Key Details, (CEO, HQ, Revenue, Founded, No. of Employees, Company Type, Website, Business Segment)
Table 100 Almac Group: Service Benchmarking
Table 101 Almac Group: Strategic Outlook
Table 102 Cobetter Filtration Equipment Co., Ltd.: Key Details, (CEO, HQ, Revenue, Founded, No. of Employees, Company Type, Website, Business Segment)
Table 103 Cobetter Filtration Equipment Co., Ltd.: Service Benchmarking
Table 104 CMIC HOLDINGS Co., Ltd.: Key Details, (CEO, HQ, Revenue, Founded, No. of Employees, Company Type, Website, Business Segment)
Table 105 CMIC HOLDINGS Co., Ltd.: Service Benchmarking
Table 106 CMIC HOLDINGS Co., Ltd.: Strategic Outlook
Table 107 DOC S.r.l.: Key Details, (CEO, HQ, Revenue, Founded, No. of Employees, Company Type, Website, Business Segment)
Table 108 DOC S.r.l.: Service Benchmarking
Table 109 Meissner Filtration Products, Inc.: Key Details, (CEO, HQ, Revenue, Founded, No. of Employees, Company Type, Website, Business Segment)
Table 110 Meissner Filtration Products, Inc.: Service Benchmarking
Table 111 Cytovance Biologics: Key Details, (CEO, HQ, Revenue, Founded, No. of Employees, Company Type, Website, Business Segment)
Table 112 Cytovance Biologics: Service Benchmarking
Table 113 Cytovance Biologics: Strategic Outlook
List of Figures
Figure 1 Bioprocess Validation Market Segmentation
Figure 2 Bioprocess Validation Market by Test Type: Market Attractiveness Index
Figure 3 Bioprocess Validation Market by Component: Market Attractiveness Index
Figure 4 Bioprocess Validation Market by Modality: Market Attractiveness Index
Figure 5 Bioprocess Validation Market by End-users: Market Attractiveness Index
Figure 6 Bioprocess Validation Market Attractiveness Index by Region
Figure 7 Bioprocess Validation Market: Market Dynamics
Figure 8 R&D Spending of Large Pharmaceutical Companies in $ Billion, 2022
Figure 9 Number of Clinical Trials Listed in the WHO International Clinical Trials Registry Platform, by Region, 2020-2022
Figure 10 Bioprocess Validation Market by Region, 2023-2033 (US$ Million, AGR %): “V” Shaped Recovery
Figure 11 Bioprocess Validation Market by Region, 2023-2033 (US$ Million, AGR %): “U” Shaped Recovery
Figure 12 Bioprocess Validation Market by Region, 2023-2033 (US$ Million, AGR %): “W” Shaped Recovery
Figure 13 Bioprocess Validation Market by Region, 2023-2033 (US$ Million, AGR %): “L” Shaped Recovery
Figure 14 Bioprocess Validation Market Attractiveness Index by Test Type
Figure 15 Bioprocess Validation Market Forecast by Test Type, 2023-2033 (US$ Million, AGR %)
Figure 16 Bioprocess Validation Market Share Forecast by Test Type, 2023, 2028, 2033 (%)
Figure 17 Extractable/Leachable Testing Segment Market Forecast by Region, 2023-2033 (US$ Million, AGR %)
Figure 18 Extractable/Leachable Testing Segment Market Share Forecast by Region, 2023 & 2033 (%)
Figure 19 Microbiological Testing Segment Market Forecast by Region, 2023-2033 (US$ Million, AGR %)
Figure 20 Microbiological Testing Segment Market Share Forecast by Region, 2023 & 2033 (%)
Figure 21 Integrity Testing Segment Market Forecast by Region, 2023-2033 (US$ Million, AGR %)
Figure 22 Integrity Testing Segment Market Share Forecast by Region, 2023 & 2033 (%)
Figure 23 Physiochemical Testing Segment Market Forecast by Region, 2023-2033 (US$ Million, AGR %)
Figure 24 Physiochemical Testing Segment Market Share Forecast by Region, 2023 & 2033 (%)
Figure 25 Compatibility Testing Segment Market Forecast by Region, 2023-2033 (US$ Million, AGR %)
Figure 26 Compatibility Testing Segment Market Share Forecast by Region, 2023 & 2033 (%)
Figure 27 Others Segment Market Forecast by Region, 2023-2033 (US$ Million, AGR %)
Figure 28 Others Segment Market Share Forecast by Region, 2023 & 2033 (%)
Figure 29 Bioprocess Validation Market Attractiveness Index by Test Type
Figure 30 Bioprocess Validation Market Forecast by Component, 2023-2033 (US$ Million, AGR %)
Figure 31 Bioprocess Validation Market Share Forecast by Component, 2023, 2028, 2033 (%)
Figure 32 Filters Elements Segment Market Forecast by Region, 2023-2033 (US$ Million, AGR %)
Figure 33 Filters Elements Segment Market Share Forecast by Region, 2023 & 2033 (%)
Figure 34 Media Containers and Bags Segment Market Forecast by Region, 2023-2033 (US$ Million, AGR %)
Figure 35 Media Containers and Bags Segment Market Share Forecast by Region, 2023 & 2033 (%)
Figure 36 Freezing and Thawing Process Bags Segment Market Forecast by Region, 2023-2033 (US$ Million, AGR %)
Figure 37 Freezing and Thawing Process Bags Segment Market Share Forecast by Region, 2023 & 2033 (%)
Figure 38 Bioreactors Segment Market Forecast by Region, 2023-2033 (US$ Million, AGR %)
Figure 39 Bioreactors Segment Market Share Forecast by Region, 2023 & 2033 (%)
Figure 40 Transfer Systems Segment Market Forecast by Region, 2023-2033 (US$ Million, AGR %)
Figure 41 Transfer Systems Segment Market Share Forecast by Region, 2023 & 2033 (%)
Figure 42 Others Segment Market Forecast by Region, 2023-2033 (US$ Million, AGR %)
Figure 43 Others Segment Market Share Forecast by Region, 2023 & 2033 (%)
Figure 44 Bioprocess Validation Market Attractiveness Index by Modality
Figure 45 Bioprocess Validation Market Forecast by Modality, 2023-2033 (US$ Million, AGR %)
Figure 46 Bioprocess Validation Market Share Forecast by Modality, 2023, 2028, 2033 (%)
Figure 47 Cell and Gene Therapy Segment Market Forecast by Region, 2023-2033 (US$ Million, AGR %)
Figure 48 Cell and Gene Therapy Segment Market Share Forecast by Region, 2023 & 2033 (%)
Figure 49 Vaccines Segment Market Forecast by Region, 2023-2033 (US$ Million, AGR %)
Figure 50 Vaccines Segment Market Share Forecast by Region, 2023 & 2033 (%)
Figure 51 Blood and Plasma Products Segment Market Forecast by Region, 2023-2033 (US$ Million, AGR %)
Figure 52 Blood and Plasma Products Segment Market Share Forecast by Region, 2023 & 2033 (%)
Figure 53 Tissue Engineering and Regenerative Medicine Segment Market Forecast by Region, 2023-2033 (US$ Million, AGR %)
Figure 54 Tissue Engineering and Regenerative Medicine Segment Market Share Forecast by Region, 2023 & 2033 (%)
Figure 55 Others Segment Market Forecast by Region, 2023-2033 (US$ Million, AGR %)
Figure 56 Others Segment Market Share Forecast by Region, 2023 & 2033 (%)
Figure 57 Bioprocess Validation Market Attractiveness Index by End-users
Figure 58 Bioprocess Validation Market Forecast by End-users, 2023-2033 (US$ Million, AGR %)
Figure 59 Bioprocess Validation Market Share Forecast by End-users, 2023, 2028, 2033 (%)
Figure 60 Pharmaceutical Companies Segment Market Forecast by Region, 2023-2033 (US$ Million, AGR %)
Figure 61 Pharmaceutical Companies Segment Market Share Forecast by Region, 2023 & 2033 (%)
Figure 62 Biotechnology Companies Segment Market Forecast by Region, 2023-2033 (US$ Million, AGR %)
Figure 63 Biotechnology Companies Segment Market Share Forecast by Region, 2023 & 2033 (%)
Figure 64 Others Segment Market Forecast by Region, 2023-2033 (US$ Million, AGR %)
Figure 65 Others Segment Market Share Forecast by Region, 2023 & 2033 (%)
Figure 66 Bioprocess Validation Market Forecast by Region 2023, 2028, 2033 (Revenue, CAGR%)
Figure 67 Bioprocess Validation Market Share Forecast by Region 2023, 2028, 2033 (%)
Figure 68 Bioprocess Validation Market by Region, 2023-2033 (US$ Mn)
Figure 69 North America Bioprocess Validation Market Attractiveness Index
Figure 70 North America Bioprocess Validation Market by Region, 2023, 2028 & 2033 (US$ million)
Figure 71 North America Bioprocess Validation Market Forecast by Country, 2023-2033 (US$ million)
Figure 72 North America Bioprocess Validation Market Share Forecast by Country, 2023 & 2033 (%)
Figure 73 North America Bioprocess Validation Market Forecast by Test Type, 2023-2033 (US$ Million, AGR %)
Figure 74 North America Bioprocess Validation Market Share Forecast by Test Type, 2023 & 2033 (%)
Figure 75 North America Bioprocess Validation Market Forecast by Component, 2023-2033 (US$ Million, AGR %)
Figure 76 North America Bioprocess Validation Market Share Forecast by Component, 2023 & 2033 (%)
Figure 77 North America Bioprocess Validation Market Forecast by Modality, 2023-2033 (US$ Million, AGR %)
Figure 78 North America Bioprocess Validation Market Share Forecast by Modality, 2023 & 2033 (%)
Figure 79 North America Bioprocess Validation Market Forecast by End-users, 2023-2033 (US$ Million, AGR %)
Figure 80 North America Bioprocess Validation Market Share Forecast by End-users, 2023 & 2033 (%)
Figure 81 U.S. Bioprocess Validation Market Forecast, 2023-2033 (US$ Million, AGR %)
Figure 82 Canada Bioprocess Validation Market Forecast, 2023-2033 (US$ Million, AGR %)
Figure 83 Europe Bioprocess Validation Market Attractiveness Index
Figure 84 Europe Bioprocess Validation Market by Region, 2023, 2028 & 2033 (US$ million)
Figure 85 Europe Bioprocess Validation Market Forecast by Country, 2023-2033 (US$ million)
Figure 86 Europe Bioprocess Validation Market Share Forecast by Country, 2023 & 2033 (%)
Figure 87 Europe Bioprocess Validation Market Forecast by Test Type, 2023-2033 (US$ Million, AGR %)
Figure 88 Europe Bioprocess Validation Market Share Forecast by Test Type, 2023 & 2033 (%)
Figure 89 Europe Bioprocess Validation Market Forecast by Component, 2023-2033 (US$ Million, AGR %)
Figure 90 Europe Bioprocess Validation Market Share Forecast by Component, 2023 & 2033 (%)
Figure 91 Europe Bioprocess Validation Market Forecast by Modality, 2023-2033 (US$ Million, AGR %)
Figure 92 Europe Bioprocess Validation Market Share Forecast by Modality, 2023 & 2033 (%)
Figure 93 Europe Bioprocess Validation Market Forecast by End-users, 2023-2033 (US$ Million, AGR %)
Figure 94 Europe Bioprocess Validation Market Share Forecast by End-users, 2023 & 2033 (%)
Figure 95 Germany Bioprocess Validation Market Forecast, 2023-2033 (US$ Million, AGR %)
Figure 96 UK Bioprocess Validation Market Forecast, 2023-2033 (US$ Million, AGR %)
Figure 97 France Bioprocess Validation Market Forecast, 2023-2033 (US$ Million, AGR %)
Figure 98 Italy Bioprocess Validation Market Forecast, 2023-2033 (US$ Million, AGR %)
Figure 99 Spain Bioprocess Validation Market Forecast, 2023-2033 (US$ Million, AGR %)
Figure 100 Russia Bioprocess Validation Market Forecast, 2023-2033 (US$ Million, AGR %)
Figure 101 Rest of Europe Bioprocess Validation Market Forecast, 2023-2033 (US$ Million, AGR %)
Figure 102 Asia Pacific Bioprocess Validation Market Attractiveness Index
Figure 103 Asia Pacific Bioprocess Validation Market by Region, 2023, 2028 & 2033 (US$ million)
Figure 104 Asia Pacific Bioprocess Validation Market Forecast by Country, 2023-2033 (US$ million)
Figure 105 Asia Pacific Bioprocess Validation Market Share Forecast by Country, 2023 & 2033 (%)
Figure 106 Asia Pacific Bioprocess Validation Market Forecast by Test Type, 2023-2033 (US$ Million, AGR %)
Figure 107 Asia Pacific Bioprocess Validation Market Share Forecast by Test Type, 2023 & 2033 (%)
Figure 108 Asia Pacific Bioprocess Validation Market Forecast by Component, 2023-2033 (US$ Million, AGR %)
Figure 109 Asia Pacific Bioprocess Validation Market Share Forecast by Component, 2023 & 2033 (%)
Figure 110 Asia Pacific Bioprocess Validation Market Forecast by Modality, 2023-2033 (US$ Million, AGR %)
Figure 111 Asia Pacific Bioprocess Validation Market Share Forecast by Modality, 2023 & 2033 (%)
Figure 112 Asia Pacific Bioprocess Validation Market Forecast by End-users, 2023-2033 (US$ Million, AGR %)
Figure 113 Asia Pacific Bioprocess Validation Market Share Forecast by End-users, 2023 & 2033 (%)
Figure 114 Japan Bioprocess Validation Market Forecast, 2023-2033 (US$ Million, AGR %)
Figure 115 China Bioprocess Validation Market Forecast, 2023-2033 (US$ Million, AGR %)
Figure 116 India Bioprocess Validation Market Forecast, 2023-2033 (US$ Million, AGR %)
Figure 117 Australia Bioprocess Validation Market Forecast, 2023-2033 (US$ Million, AGR %)
Figure 118 South Korea Bioprocess Validation Market Forecast, 2023-2033 (US$ Million, AGR %)
Figure 119 South-East Asia Bioprocess Validation Market Forecast, 2023-2033 (US$ Million, AGR %)
Figure 120 Rest of Asia Pacific Bioprocess Validation Market Forecast, 2023-2033 (US$ Million, AGR %)
Figure 121 Latin America Bioprocess Validation Market Attractiveness Index
Figure 122 Latin America Bioprocess Validation Market by Region, 2023, 2028 & 2033 (US$ million)
Figure 123 Latin America Bioprocess Validation Market Forecast by Country, 2023-2033 (US$ million)
Figure 124 Latin America Bioprocess Validation Market Share Forecast by Country, 2023 & 2033 (%)
Figure 125 Latin America Bioprocess Validation Market Forecast by Test Type, 2023-2033 (US$ Million, AGR %)
Figure 126 Latin America Bioprocess Validation Market Share Forecast by Test Type, 2023 & 2033 (%)
Figure 127 Latin America Bioprocess Validation Market Forecast by Component, 2023-2033 (US$ Million, AGR %)
Figure 128 Latin America Bioprocess Validation Market Share Forecast by Component, 2023 & 2033 (%)
Figure 129 Latin America Bioprocess Validation Market Forecast by Modality, 2023-2033 (US$ Million, AGR %)
Figure 130 Latin America Bioprocess Validation Market Share Forecast by Modality, 2023 & 2033 (%)
Figure 131 Latin America Bioprocess Validation Market Forecast by End-users, 2023-2033 (US$ Million, AGR %)
Figure 132 Latin America Bioprocess Validation Market Share Forecast by End-users, 2023 & 2033 (%)
Figure 133 Brazil Bioprocess Validation Market Forecast, 2023-2033 (US$ Million, AGR %)
Figure 134 Mexico Bioprocess Validation Market Forecast, 2023-2033 (US$ Million, AGR %)
Figure 135 Rest of Latin America Bioprocess Validation Market Forecast, 2023-2033 (US$ Million, AGR %)
Figure 136 MEA Bioprocess Validation Market Attractiveness Index
Figure 137 MEA Bioprocess Validation Market by Region, 2023, 2028 & 2033 (US$ million)
Figure 138 MEA Bioprocess Validation Market Forecast by Country, 2023-2033 (US$ million)
Figure 139 MEA Bioprocess Validation Market Share Forecast by Country, 2023 & 2033 (%)
Figure 140 MEA Bioprocess Validation Market Forecast by Test Type, 2023-2033 (US$ Million, AGR %)
Figure 141 MEA Bioprocess Validation Market Share Forecast by Test Type, 2023 & 2033 (%)
Figure 142 MEA Bioprocess Validation Market Forecast by Component, 2023-2033 (US$ Million, AGR %)
Figure 143 MEA Bioprocess Validation Market Share Forecast by Component, 2023 & 2033 (%)
Figure 144 MEA Bioprocess Validation Market Forecast by Modality, 2023-2033 (US$ Million, AGR %)
Figure 145 MEA Bioprocess Validation Market Share Forecast by Modality, 2023 & 2033 (%)
Figure 146 MEA Bioprocess Validation Market Forecast by End-users, 2023-2033 (US$ Million, AGR %)
Figure 147 MEA Bioprocess Validation Market Share Forecast by End-users, 2023 & 2033 (%)
Figure 148 GCC Bioprocess Validation Market Forecast, 2023-2033 (US$ Million, AGR %)
Figure 149 South Africa Bioprocess Validation Market Forecast, 2023-2033 (US$ Million, AGR %)
Figure 150 Rest of MEA Bioprocess Validation Market Forecast, 2023-2033 (US$ Million, AGR %)
Figure 151 Sartorius AG: Net Revenue, 2015-2022 (US$ Million, AGR%)
Figure 152 Sartorius AG: Regional Market Shares (%), 2022
Figure 153 Sartorius AG: R&D, 2015-2022 (US$ Million, AGR%)
Figure 154 Charles River Laboratories: Net Revenue, 2015-2022 (US$ Million, AGR%)
Figure 155 Charles River Laboratories: Regional Market Shares (%), 2022
Figure 156 Merck KGaA: Net Revenue, 2015-2022 (US$ Million, AGR%)
Figure 157 Merck KGaA: Regional Market Shares (%), 2022
Figure 158 Merck KGaA: R&D, 2015-2022 (US$ Million, AGR%)
Figure 159 Thermo Fisher Scientific, Inc.: Net Revenue, 2015-2022 (US$ Million, AGR%)
Figure 160 Thermo Fisher Scientific, Inc.: Regional Market Shares (%), 2022
Figure 161 Thermo Fisher Scientific, Inc.: R&D, 2015-2022 (US$ Million, AGR%)
Figure 162 SGS SA: Net Revenue, 2015-2022 (US$ Million, AGR%)
Figure 163 SGS SA: Regional Market Shares (%), 2022
Figure 164 Eurofins Scientific: Net Revenue, 2016-2022 (US$ Million, AGR%)
Figure 165 Eurofins Scientific: Regional Market Shares (%), 2022
Figure 166 Lonza Group: Net Revenue, 2015-2022 (US$ Million, AGR%)
Figure 167 Lonza Group: Regional Market Shares (%), 2022
Figure 168 Lonza Group: R&D, 2017-2022 (US$ Million, AGR%)
Figure 169 CMIC HOLDINGS Co., Ltd.: Net Revenue, 2015-2022 (US$ Million, AGR%)
ページTOPに戻る
本レポートと同じKEY WORD()の最新刊レポート
- 本レポートと同じKEY WORDの最新刊レポートはありません。
よくあるご質問
Visiongain社はどのような調査会社ですか?
英国の調査会社ヴィジョンゲイン社(Visiongain)は、通信とエネルギーのほか、自動車や化学・医薬品、金属など、広範な市場を対象に調査を行っています。自動車市場については、市場全般に関する調査のほ... もっと見る
調査レポートの納品までの日数はどの程度ですか?
在庫のあるものは速納となりますが、平均的には 3-4日と見て下さい。
但し、一部の調査レポートでは、発注を受けた段階で内容更新をして納品をする場合もあります。
発注をする前のお問合せをお願いします。
注文の手続きはどのようになっていますか?
1)お客様からの御問い合わせをいただきます。
2)見積書やサンプルの提示をいたします。
3)お客様指定、もしくは弊社の発注書をメール添付にて発送してください。
4)データリソース社からレポート発行元の調査会社へ納品手配します。
5) 調査会社からお客様へ納品されます。最近は、pdfにてのメール納品が大半です。
お支払方法の方法はどのようになっていますか?
納品と同時にデータリソース社よりお客様へ請求書(必要に応じて納品書も)を発送いたします。
お客様よりデータリソース社へ(通常は円払い)の御振り込みをお願いします。
請求書は、納品日の日付で発行しますので、翌月最終営業日までの当社指定口座への振込みをお願いします。振込み手数料は御社負担にてお願いします。
お客様の御支払い条件が60日以上の場合は御相談ください。
尚、初めてのお取引先や個人の場合、前払いをお願いすることもあります。ご了承のほど、お願いします。
データリソース社はどのような会社ですか?
当社は、世界各国の主要調査会社・レポート出版社と提携し、世界各国の市場調査レポートや技術動向レポートなどを日本国内の企業・公官庁及び教育研究機関に提供しております。
世界各国の「市場・技術・法規制などの」実情を調査・収集される時には、データリソース社にご相談ください。
お客様の御要望にあったデータや情報を抽出する為のレポート紹介や調査のアドバイスも致します。
|
|


