洋上風力発電市場レポート:2024-2034
Offshore Wind Power Market Report 2024-2034
レポート詳細
洋上風力発電市場レポート 2024-2034 :本レポートは、業界とその根底にあるダイナミクスをよりよく理解したいと望むなら、新たな収益ポケットを目指している大手企業にとって貴重なも... もっと見る
※上記価格は部署ライセンス(Departmental licence)価格です。
その他の価格についてはデータリソースまでお問合せください。
日本語のページは自動翻訳を利用し作成しています。
実際のレポートは英文のみでご納品いたします。
サマリー
レポート詳細
洋上風力発電市場レポート 2024-2034:本レポートは、業界とその根底にあるダイナミクスをよりよく理解したいと望むなら、新たな収益ポケットを目指している大手企業にとって貴重なものとなるでしょう。異業種への進出や、新たな地域での既存事業の拡大を目指す企業にも有用です。
高まるクリーンなエネルギー源への需要
世界中の多くの政府は、気候変動と闘い、エネルギー安全保障を促進するために、よりクリーンなエネルギー源に移行することの重要性を認識している。その結果、再生可能エネルギー・プロジェクトへの投資を促進するための支援政策、インセンティブ、規制が実施されている。気候変動の影響に対する意識の高まりは、よりクリーンなエネルギー源に対する官民の需要の高まりにつながっている。人々や企業が二酸化炭素排出量を意識するようになるにつれ、従来の化石燃料に代わるものを求めるようになっている。
多くの大企業や企業が持続可能性の目標を掲げ、二酸化炭素排出量の削減や再生可能エネルギーの導入を表明している。このような企業行動の変化は、再生可能エネルギー・プロジェクトへの投資を促進し、多くの場合、再生可能エネルギー・プロバイダーとの電力購入契約(PPA)を通じている。再生可能エネルギー産業は、さまざまな国で雇用創出と経済成長の大きな原動力となってきた。産業が拡大するにつれ、製造、設置、メンテナンス、研究開発などの分野で雇用機会が創出され続けている。
洋上風力発電の課題
洋上風力タービンは過酷な海洋環境で稼働するため、腐食、生物付着、極端な気象条件への暴露といった技術的な課題が生じる可能性がある。このような状況に耐えられる技術を開発し、維持することは極めて重要である。洋上風力タービンの設置とメンテナンスは、複雑で高価なプロセスである。タービンはしばしば深海に設置されるため、設置はより困難でコストがかかる。洋上風力発電プロジェクトの長期的な実行可能性にとって、費用対効果が高く効率的な設置・メンテナンス戦略の開発は極めて重要である。洋上風力タービンの基礎の設計は非常に重要である。海底の状態や水深が異なれば、単杭、ジャケット、浮体構造物など、さまざまなタイプの基礎が必要になる。これらの基礎の安定性と耐久性を確保することは、技術的に重要な課題である。大型風力タービンのコンポーネントを洋上まで輸送し、洋上で組み立てることは、論理的に困難な場合がある。輸送には専門の船舶が必要であり、コストとダウンタイムを最小限に抑えるためには、効率的なロジスティクス計画が極めて重要である。
市場調査レポートを購入する前にすべき質問とは?
- 洋上風力発電市場はどのように進化しているのか?
- 洋上風力発電市場の推進要因と抑制要因は何か?
- 予測期間中、洋上風力発電の各サブ市場セグメントはどのように成長し、2034年にこれらのサブ市場の売上はいくらになるのか?
- 2024年から2034年にかけて、洋上風力発電の各サブマーケットの市場シェアはどのように推移するのか?
- 2024年から2034年までの市場全体の主な牽引役は何か?
- 洋上風力発電の主要市場はマクロ経済の動きに概ね追随するのか、それとも個々の国市場が他を凌駕するのか?
- 2034年までに各国市場のシェアはどのように変化し、2034年にはどの地域が市場をリードするのか?
- 主要プレーヤーと予測期間中の見通しは?
- これらの大手企業の洋上風力発電プロジェクトは?
- 2024年から2034年の間に、産業はどのように発展するのか?現在および今後10年間に実施される洋上風力発電プロジェクトにはどのような意味があるのか?
- 洋上風力発電市場をさらに拡大するために、製品の商業化の必要性は高まっているのか?
- 洋上風力発電市場はどこに向かっているのか、そしてどのようにすれば市場の最前線に立つことができるのか?
洋上風力発電市場に現在、そして今後10年間、どのような影響があるのかを知る必要があります:
- 本レポートは271ページにわたり、92の表と136の図表を掲載しています。
- 本レポートでは、風力発電業界における主要な有望分野を取り上げているため、今すぐターゲットを絞ることができます。
- 世界、地域、国の売上と成長に関する詳細な分析が含まれています。
- 競合他社が成功した主なトレンド、変化、収益予測をハイライトしています。
本レポートは、洋上風力発電市場が今後10年間でどのように発展し、COVID-19の景気後退と好転の変動に合わせて変化するかをお伝えします。この市場は、過去10年間のどの時点よりも今が重要である。
2034年までの予測およびその他の分析により商業的展望が明らかに
- 2034年までの収益予測に加え、最新の業績、成長率、市場シェアを提供します。
- ビジネスの展望と展開に関する独自の分析をご覧いただけます。
- 定性分析(市場ダイナミクス、促進要因、機会、阻害要因、課題を含む)、ポーターズファイブフォース分析、PEST分析、最近の動向をご覧いただけます。
レポート対象セグメント
場所見通し
- 浅海域
- 移行期水域
- 深層水域
コンポーネント見通し
- タービン
- 電気インフラ
- 下部構造
- その他
世界市場全体とセグメント別の収益予測に加え、主要15カ国市場の収益予測も掲載しています:
主要国の展望
- 中国
- 英国
- ドイツ
- オランダ
- デンマーク
- ベルギー
- フランス
- ベトナム
- 台湾
- 日本
- スウェーデン
- 韓国
- フィンランド
- アメリカ
- イタリア
- その他の地域
.png)
また、2024年から2034年までの洋上風力発電市場における主要企業のプロファイルも掲載している。
主要企業と市場成長の可能性
• ABB
• Doosan Enerbility
• General Electric Company
• Goldwind
• Nexans
• Nordex SE
• RENOVA, Inc.
• Shanghai Electric
• Siemens Gamesa Renewable Energy
• Vestas
2024年から2034年までの洋上風力発電市場の世界全体の売上高は、金額ベースでは2023年に460億米ドルを突破する。2034年まで力強い収益成長を予測。当調査では、最も大きな可能性を秘めた企業を特定しています。彼らの能力、進歩、商業的展望を発見し、一歩先を行くための一助としてください。
洋上風力発電市場、2024年から2034年市場レポートはどのようにお役に立ちますか?
要約すると、弊社の270ページを超えるレポートは以下の知識を提供します:
- 洋上風力発電市場、2024年から2034年までの収益予測 世界および主要国レベルでの場所、構成要素、各予測 - 業界の展望を発見し、投資と収益に最も有利な場所を見つける。
- 15の主要国市場の2034年までの収益予測 - 中国、英国、ドイツ、オランダ、デンマーク、ベルギー、フランス、ベトナム、台湾、日本、スウェーデン、韓国、フィンランド、米国、イタリア、その他の地域の2024年から2034年までの洋上風力発電市場の予測をご覧ください。
- 既存企業および市場参入を目指す企業の展望 - 洋上風力発電市場に関わる主要企業10社の企業プロファイルを含む。
独自の予測による定量的・定性的分析をご覧ください。私たちのレポートだけに含まれる情報を入手し、貴重なビジネスインテリジェンスで情報を得ることができます。
他では得られない情報
私たちの新しいレポートがあれば、知識に遅れをとったり、チャンスを逃したりする可能性が低くなります。弊社のレポートが貴社の調査、分析、意思決定にどのように役立つかをご覧ください。Visiongainの調査は、洋上風力発電市場、2024年から2034年、市場をリードする企業の商業分析を必要とするすべての人のためのものです。データ、トレンド、予測をご覧いただけます。
ページTOPに戻る
目次
目次
1 レポートの概要
1.1 調査の目的
1.2 洋上風力発電市場の紹介
1.3 本レポートの内容
1.4 本レポートを読むべき理由
1.5 本分析レポートが回答する主な質問
1.6 本レポートは誰のためのものか?
1.7 方法論
1.7.1 市場の定義
1.7.2 市場評価・予測手法
1.7.3 データの検証
1.7.3.1 一次調査
1.7.3.2 セカンダリーリサーチ
1.8 よくある質問(FAQ)
1.9 Visiongainの関連レポート
1.10 Visiongainについて
2 エグゼクティブサマリー
3 市場概要
3.1 主要な調査結果
3.2 市場ダイナミクス
3.2.1 市場促進要因
3.2.1.1 洋上風力発電に有利な政策が市場を牽引
3.2.1.2 洋上風力タービン技術の進歩
3.2.2 市場抑制要因
3.2.2.1 洋上風力発電に伴う高い資本コスト
3.2.2.2 洋上風力発電産業に関連する課題
3.2.3 市場機会
3.2.3.1 炭素排出削減のための政府の取り組み
3.2.3.2 成長する再生可能エネルギー産業
3.3 COVID-19影響分析
3.4 ポーターのファイブフォース分析
3.4.1 サプライヤーの交渉力
3.4.2 買い手の交渉力
3.4.3 競争上のライバル関係
3.4.4 代替品による脅威
3.4.5 新規参入企業の脅威
4 洋上風力発電市場分析:場所別
4.1 主な調査結果
4.2 場所セグメント 市場魅力度指数
4.3 場所別洋上風力発電市場規模の推定と予測
4.4 浅海域
4.4.1 2024〜2034年の地域別市場規模(US$ Billion)
4.4.2 地域別市場シェア、2024年・2034年(%)
4.5 移行期水域
4.5.1 2024〜2034年の地域別市場規模(US$ Billion)
4.5.2 地域別市場シェア、2024年・2034年(%)
4.6 深層水域
4.6.1 2024~2034年の地域別市場規模(US$ Billion)
4.6.2 地域別市場シェア、2024年・2034年(%)
5 洋上風力発電市場分析:コンポーネント別
5.1 主要調査結果
5.2 コンポーネントセグメント 市場魅力度指数
5.3 コンポーネント別洋上風力発電市場規模の推定と予測
5.4 タービン
5.4.1 2024〜2034年の地域別市場規模(US$ Billion)
5.4.2 地域別市場シェア、2024年・2034年(%)
5.5 電気インフラ
5.5.1 2024〜2034年の地域別市場規模(US$ Billion)
5.5.2 地域別市場シェア、2024年・2034年(%)
5.6 サブストラクチャー
5.6.1 2024〜2034年の地域別市場規模(US$ Billion)
5.6.2 地域別市場シェア、2024年・2034年(%)
5.7 その他の部品
5.7.1 2024〜2034年の地域別市場規模(US$ Billion)
5.7.2 地域別市場シェア、2024年・2034年(%)
6 洋上風力発電市場分析:地域別
6.1 主要な調査結果
6.2 地域別市場規模の推定と予測
7 中国の洋上風力発電市場分析
7.1 主要な調査結果
7.2 中国の洋上風力発電の場所別市場規模推定と予測
7.3 中国の洋上風力発電のコンポーネント別市場規模推定と予測
7.4 中国の洋上風力発電市場の分析
7.4.1 中国沖でハイブリッド浮体式風力発電プロジェクトが明らかに
7.4.2 風力発電と太陽光発電の目標達成に向け順調な中国
7.4.3 CEEC初の洋上風力発電プロジェクトが承認される
8 英国の洋上風力発電市場分析
8.1 主要な調査結果
8.2 イギリスの洋上風力発電の場所別市場規模推定と予測
8.3 イギリスの洋上風力発電のコンポーネント別市場規模推定と予測
8.4 イギリスの洋上風力発電 市場分析
8.4.1 世界最大の洋上風力発電プロジェクトがイギリス送電網への給電を開始
8.4.2 イギリスの洋上風力発電産業
9 ドイツの洋上風力発電市場の分析
9.1 主要な調査結果
9.2 ドイツの洋上風力発電の場所別市場規模推定と予測
9.3 ドイツの洋上風力発電のコンポーネント別市場規模推定と予測
9.4 ドイツの洋上風力発電市場の分析
9.4.1 洋上風力エネルギー開発
9.4.2 洋上風力エネルギーはオフショア拡張が目標
9.4.3 洋上風力発電プロジェクトにおける活動
10 オランダの洋上風力発電市場分析
10.1 主要な調査結果
10.2 オランダの洋上風力発電の場所別市場規模推定と予測
10.3 オランダの洋上風力発電のコンポーネント別市場規模推定と予測
10.4 オランダの洋上風力発電市場分析
10.4.1 風力エネルギー目標
10.4.2 オランダは2050年に70GWの洋上風力発電目標を設定
11 デンマークの洋上風力発電市場分析
11.1 主要な調査結果
11.2 デンマークの洋上風力発電の場所別市場規模推定と予測
11.3 デンマークの洋上風力発電のコンポーネント別市場規模推定と予測
11.4 デンマークの洋上風力発電市場分析
11.4.1 バッテンフォールがデンマークの次期洋上風力発電所から最初の電力を供給
11.4.2 日本とデンマークは浮体式洋上風力発電技術で協力する
12 ベルギーの洋上風力発電市場分析
12.1 主要な調査結果
12.2 ベルギーの洋上風力発電の場所別市場規模推定と予測
12.3 ベルギーの洋上風力発電のコンポーネント別市場規模推定と予測
12.4 ベルギーの洋上風力発電市場分析
12.4.1 ベルギーの洋上風力エネルギー
13 フランスの洋上風力発電市場分析
13.1 主要な調査結果
13.2 フランスの洋上風力発電の場所別市場規模推定と予測
13.3 フランスの洋上風力発電のコンポーネント別市場規模推定と予測
13.4 フランスの洋上風力発電市場の分析
13.4.1 フランスの洋上風力発電分野
13.4.2 ENGIEとEDPRの合弁事業の増加
14 ベトナムの洋上風力発電市場分析
14.1 主要な調査結果
14.2 ベトナムの洋上風力発電の場所別市場規模推定と予測
14.3 ベトナムの洋上風力発電のコンポーネント別市場規模推定と予測
14.4 ベトナムの洋上風力発電市場分析
14.4.1 ベトナムの洋上風力発電の成長に向けて覚書が締結された
14.4.2 ベトナムの洋上風力発電と開発政策
15 台湾の洋上風力発電市場の分析
15.1 主要な調査結果
15.2 台湾の洋上風力発電の場所別市場規模推定と予測
15.3 台湾の洋上風力発電のコンポーネント別市場規模推定と予測
15.4 台湾の洋上風力発電市場の分析
16 日本の洋上風力発電市場の分析
16.1 主要な調査結果
16.2 日本の洋上風力発電の場所別市場規模推定と予測
16.3 日本の洋上風力発電のコンポーネント別市場規模推定と予測
16.4 日本の洋上風力発電市場の分析
16.4.1 洋上風力発電大国を目指す日本
17 スウェーデンの洋上風力発電市場分析
17.1 主要な調査結果
17.2 スウェーデンの洋上風力発電の場所別市場規模推定と予測
17.3 スウェーデンの洋上風力発電のコンポーネント別市場規模推定と予測
17.4 スウェーデンの洋上風力発電市場分析
17.4.1 スウェーデン、ヴァッテンフォールの洋上風力発電プロジェクトを却下
17.4.2 洋上風力エネルギーの見通し
18 韓国の洋上風力発電市場分析
18.1 主要な調査結果
18.2 韓国の洋上風力発電の場所別市場規模推定と予測
18.3 韓国の洋上風力発電のコンポーネント別市場規模推定と予測
18.4 韓国の洋上風力発電市場分析
18.4.1 532MWの韓国洋上風力発電プロジェクトが前進
18.4.2 韓国で数ギガワットの新しい洋上風力発電プロジェクトの計画が発表される
19 フィンランドの洋上風力発電市場の分析
19.1 主要な調査結果
19.2 フィンランドの洋上風力発電の場所別市場規模推定と予測
19.3 フィンランドの洋上風力発電のコンポーネント別市場規模推定と予測
19.4 フィンランドの洋上風力発電市場分析
19.4.1 フィンランドは2023~2024年に600万kWの洋上風力発電を入札予定
20 アメリカの洋上風力発電市場分析
20.1 主要な調査結果
20.2 アメリカの洋上風力発電の場所別市場規模推定と予測
20.3 アメリカの洋上風力発電のコンポーネント別市場規模推定と予測
20.4 アメリカの洋上風力発電市場分析
20.4.1 シーメンス・ガメサが米国における2億米ドルの洋上風力タービンブレード工場計画を中止
21 イタリアの洋上風力発電市場の分析
21.1 主要調査結果
21.2 イタリアの洋上風力発電の場所別市場規模推定と予測
21.3 イタリアの洋上風力発電のコンポーネント別市場規模推定と予測
21.4 イタリアの洋上風力発電市場分析
21.4.1 イタリア初の洋上風力発電所の開発者
21.4.2 レナンティスとBlueFloat、イタリアで550万kWの洋上風力発電を目指す
22 その他の地域の洋上風力発電市場分析
22.1 主要な調査結果
22.2 世界のその他の地域の洋上風力発電の場所別市場規模推定と予測
22.3 世界のその他の地域の洋上風力発電のコンポーネント別市場規模推定と予測
22.4 その他の地域の洋上風力発電市場分析
22.4.1 国内
23 会社概要
23.1 General Electric Company
23.1.1 会社概要
23.1.2 会社概要
23.1.3 財務分析
23.1.3.1 純収入、2018-2022年
23.1.3.2 売上総利益、2018年〜2022年
23.1.3.3 営業利益、2018-2022年
23.1.3.4 純利益、2018-2022年
23.1.3.5 地域別売上高、2022年
23.1.3.6 セグメント別売上高、2022年
23.1.4 製品ベンチマーク
23.1.5 戦略的展望
23.2 Vestas
23.2.1 会社概要
23.2.2 会社概要
23.2.3 財務分析
23.2.3.1 純収入、2018年〜2022年
23.2.3.2 売上総利益、2018年〜2022年
23.2.3.3 研究開発費、2018年~2022年
23.2.4 製品ベンチマーク
23.2.5 戦略的展望
23.3 Siemens Gamesa Renewable Energy
23.3.1 会社概要
23.3.2 会社概要
23.3.3 製品ベンチマーク
23.3.4 戦略的展望
23.4 ABB
23.4.1 会社概要
23.4.2 会社概要
23.4.3 財務分析
23.4.3.1 純収入、2018年〜2022年
23.4.3.2 地域市場シェア、2022年
23.4.3.3 セグメント市場シェア、2022年
23.4.4 製品ベンチマーク
23.4.5 戦略的展望
23.5 Goldwind
23.5.1 会社概要
23.5.2 会社概要
23.5.3 財務分析
23.5.3.1 純収入、2018年〜2022年
23.5.3.2 セグメント市場シェア、2022年
23.5.4 製品ベンチマーク
23.5.5 戦略的展望
23.6 Doosan Enerbility
23.6.1 会社概要
23.6.2 会社概要
23.6.3 製品ベンチマーク
23.6.4 戦略的展望
23.7 Nordex SE
23.7.1 会社概要
23.7.2 会社概要
23.7.3 財務分析
23.7.3.1 純収入、2018年~2022年
23.7.3.2 地域市場シェア、2022年
23.7.3.3 セグメント市場シェア、2022年
23.7.4 製品ベンチマーク
23.8 Nexans
23.8.1 会社概要
23.8.2 会社概要
23.8.3 財務分析
23.8.3.1 純収入、2018年~2022年
23.8.3.2 地域市場シェア、2022年
23.8.3.3 セグメント市場シェア、2022年
23.8.4 製品ベンチマーク
23.8.5 戦略的展望
23.9 Shanghai Electric
23.9.1 会社概要
23.9.2 会社概要
23.9.3 財務分析
23.9.3.1 純収入、2018年~2022年
23.9.3.2 セグメント市場シェア、2022年
23.9.4 製品ベンチマーク
23.9.5 戦略的展望
23.10 RENOVA, Inc.
23.10.1 会社概要
23.10.2 会社概要
23.10.3 製品ベンチマーク
23.10.4 戦略的展望
24 結論と提言
24.1 Visiongainからの結びの言葉
24.2 市場プレイヤーへの提言
ページTOPに戻る
図表リスト
表の一覧
Table 1 Offshore Wind Power Market Snapshot, 2024 & 2034 (US$ Billion, CAGR %)
Table 2 Offshore Wind Power Market Forecast by Region, 2024-2034 (US$ Billion, AGR%, CAGR%): “V” Shaped Recovery
Table 3 Offshore Wind Power Market Forecast by Region, 2024-2034 (US$ Billion, AGR%, CAGR%): “U” Shaped Recovery
Table 4 Offshore Wind Power Market Forecast by Region, 2024-2034 (US$ Billion, AGR%, CAGR%): “W” Shaped Recovery
Table 5 Offshore Wind Power Market Forecast by Region, 2024-2034 (US$ Billion, AGR%, CAGR%): “L” Shaped Recovery
Table 6 Offshore Wind Power Market Forecast by Location, 2024-2034 (US$ Billion, AGR%, CAGR%)
Table 7 Shallow Water Segment Market Forecast by Region, 2024-2034 (US$ Billion, AGR%, CAGR%)
Table 8 Transitional Water Segment Market Forecast by Region, 2024-2034 (US$ Billion, AGR%, CAGR%)
Table 9 Deep Water Segment Market Forecast by Region, 2024-2034 (US$ Billion, AGR%, CAGR%)
Table 10 Offshore Wind Power Market Forecast by Component, 2024-2034 (US$ Billion, AGR%, CAGR%)
Table 11 Turbines Segment Market Forecast by Region, 2024-2034 (US$ Billion, AGR%, CAGR%)
Table 12 Electrical Infrastructure Segment Market Forecast by Region, 2024-2034 (US$ Billion, AGR%, CAGR%)
Table 13 Substructure Segment Market Forecast by Region, 2024-2034 (US$ Billion, AGR%, CAGR%)
Table 14 Other Components Segment Market Forecast by Region, 2024-2034 (US$ Billion, AGR%, CAGR%)
Table 15 Offshore Wind Power Market Forecast by Region, 2024-2034 (US$ Billion, AGR%, CAGR%)
Table 16 China Offshore Wind Power Market Forecast by Location, 2024-2034 (US$ Billion, AGR%, CAGR%)
Table 17 China Offshore Wind Power Market Forecast by Component, 2024-2034 (US$ Billion, AGR%, CAGR%)
Table 18 China Offshore Wind Power Market Forecast, 2024-2034 (US$ Billion, AGR%, CAGR%)
Table 19 UK Offshore Wind Power Market Forecast by Location, 2024-2034 (US$ Billion, AGR%, CAGR%)
Table 20 UK Offshore Wind Power Market Forecast by Component, 2024-2034 (US$ Billion, AGR%, CAGR%)
Table 21 UK Offshore Wind Power Market Forecast, 2024-2034 (US$ Billion, AGR%, CAGR%)
Table 22 Germany Offshore Wind Power Market Forecast by Location, 2024-2034 (US$ Billion, AGR%, CAGR%)
Table 23 Germany Offshore Wind Power Market Forecast by Component, 2024-2034 (US$ Billion, AGR%, CAGR%)
Table 24 Germany Offshore Wind Power Market Forecast, 2024-2034 (US$ Billion, AGR%, CAGR%)
Table 25 Netherlands Offshore Wind Power Market Forecast by Location, 2024-2034 (US$ Billion, AGR%, CAGR%)
Table 26 Netherlands Offshore Wind Power Market Forecast by Component, 2024-2034 (US$ Billion, AGR%, CAGR%)
Table 27 Netherlands Offshore Wind Power Market Forecast, 2024-2034 (US$ Billion, AGR%, CAGR%)
Table 28 Denmark Offshore Wind Power Market Forecast by Location, 2024-2034 (US$ Billion, AGR%, CAGR%)
Table 29 Denmark Offshore Wind Power Market Forecast by Component, 2024-2034 (US$ Billion, AGR%, CAGR%)
Table 30 Denmark Offshore Wind Power Market Forecast, 2024-2034 (US$ Billion, AGR%, CAGR%)
Table 31 Belgium Offshore Wind Power Market Forecast by Location, 2024-2034 (US$ Billion, AGR%, CAGR%)
Table 32 Belgium Offshore Wind Power Market Forecast by Component, 2024-2034 (US$ Billion, AGR%, CAGR%)
Table 33 Belgium Offshore Wind Power Market Forecast, 2024-2034 (US$ Billion, AGR%, CAGR%)
Table 34 France Offshore Wind Power Market Forecast by Location, 2024-2034 (US$ Billion, AGR%, CAGR%)
Table 35 France Offshore Wind Power Market Forecast by Component, 2024-2034 (US$ Billion, AGR%, CAGR%)
Table 36 France Offshore Wind Power Market Forecast, 2024-2034 (US$ Billion, AGR%, CAGR%)
Table 37 Vietnam Offshore Wind Power Market Forecast by Location, 2024-2034 (US$ Billion, AGR%, CAGR%)
Table 38 Vietnam Offshore Wind Power Market Forecast by Component, 2024-2034 (US$ Billion, AGR%, CAGR%)
Table 39 Vietnam Offshore Wind Power Market Forecast, 2024-2034 (US$ Billion, AGR%, CAGR%)
Table 40 Taiwan Offshore Wind Power Market Forecast by Location, 2024-2034 (US$ Billion, AGR%, CAGR%)
Table 41 Taiwan Offshore Wind Power Market Forecast by Component, 2024-2034 (US$ Billion, AGR%, CAGR%)
Table 42 Taiwan Offshore Wind Power Market Forecast, 2024-2034 (US$ Billion, AGR%, CAGR%)
Table 43 Japan Offshore Wind Power Market Forecast by Location, 2024-2034 (US$ Billion, AGR%, CAGR%)
Table 44 Japan Offshore Wind Power Market Forecast by Component, 2024-2034 (US$ Billion, AGR%, CAGR%)
Table 45 Japan Offshore Wind Power Market Forecast, 2024-2034 (US$ Billion, AGR%, CAGR%)
Table 46 Sweden Offshore Wind Power Market Forecast by Location, 2024-2034 (US$ Billion, AGR%, CAGR%)
Table 47 Sweden Offshore Wind Power Market Forecast by Component, 2024-2034 (US$ Billion, AGR%, CAGR%)
Table 48 Sweden Offshore Wind Power Market Forecast, 2024-2034 (US$ Billion, AGR%, CAGR%)
Table 49 South Korea Offshore Wind Power Market Forecast by Location, 2024-2034 (US$ Billion, AGR%, CAGR%)
Table 50 South Korea Offshore Wind Power Market Forecast by Component, 2024-2034 (US$ Billion, AGR%, CAGR%)
Table 51 South Korea Offshore Wind Power Market Forecast, 2024-2034 (US$ Billion, AGR%, CAGR%)
Table 52 Finland Offshore Wind Power Market Forecast by Location, 2024-2034 (US$ Billion, AGR%, CAGR%)
Table 53 Finland Offshore Wind Power Market Forecast by Component, 2024-2034 (US$ Billion, AGR%, CAGR%)
Table 54 Finland Offshore Wind Power Market Forecast, 2024-2034 (US$ Billion, AGR%, CAGR%)
Table 55 USA Offshore Wind Power Market Forecast by Location, 2024-2034 (US$ Billion, AGR%, CAGR%)
Table 56 USA Offshore Wind Power Market Forecast by Component, 2024-2034 (US$ Billion, AGR%, CAGR%)
Table 57 USA Offshore Wind Power Market Forecast, 2024-2034 (US$ Billion, AGR%, CAGR%)
Table 58 Italy Offshore Wind Power Market Forecast by Location, 2024-2034 (US$ Billion, AGR%, CAGR%)
Table 59 Italy Offshore Wind Power Market Forecast by Component, 2024-2034 (US$ Billion, AGR%, CAGR%)
Table 60 Italy Offshore Wind Power Market Forecast, 2024-2034 (US$ Billion, AGR%, CAGR%)
Table 61 Rest of the World Offshore Wind Power Market Forecast by Location, 2024-2034 (US$ Billion, AGR%, CAGR%)
Table 62 Rest of the World Offshore Wind Power Market Forecast by Component, 2024-2034 (US$ Billion, AGR%, CAGR%)
Table 63 Rest of the World Offshore Wind Power Market Forecast, 2024-2034 (US$ Billion, AGR%, CAGR%)
Table 64 General Electric Company: Key Details, (CEO, HQ, Revenue, Founded, No. of Employees, Company Type, Website, Business Segment)
Table 65 General Electric Company: Product Benchmarking
Table 66 General Electric Company: Strategic Outlook
Table 67 Vestas: Key Details, (CEO, HQ, Revenue, Founded, No. of Employees, Company Type, Website, Business Segment)
Table 68 Vestas: Product Benchmarking
Table 69 Vestas: Strategic Outlook
Table 70 Siemens Gamesa Renewable Energy: Key Details, (CEO, HQ, Revenue, Founded, No. of Employees, Company Type, Website, Business Segment)
Table 71 Siemens Gamesa Renewable Energy: Product Benchmarking
Table 72 Siemens Gamesa Renewable Energy: Strategic Outlook
Table 73 ABB: Key Details, (CEO, HQ, Revenue, Founded, No. of Employees, Company Type, Website, Business Segment)
Table 74 ABB: Product Benchmarking
Table 75 ABB: Strategic Outlook
Table 76 Goldwind: Key Details, (CEO, HQ, Revenue, Founded, No. of Employees, Company Type, Website, Business Segment)
Table 77 Goldwind: Product Benchmarking
Table 78 Goldwind: Strategic Outlook
Table 79 Doosan Enerbility: Key Details, (CEO, HQ, Revenue, Founded, No. of Employees, Company Type, Website, Business Segment)
Table 80 Doosan Enerbility: Product Benchmarking
Table 81 Doosan Enerbility: Strategic Outlook
Table 82 Nordex SE: Key Details, (CEO, HQ, Revenue, Founded, No. of Employees, Company Type, Website, Business Segment)
Table 83 Nordex SE: Product Benchmarking
Table 84 Nexans: Key Details, (CEO, HQ, Revenue, Founded, No. of Employees, Company Type, Website, Business Segment)
Table 85 Nexans: Product Benchmarking
Table 86 Nexans: Strategic Outlook
Table 87 Shanghai Electric: Key Details, (CEO, HQ, Revenue, Founded, No. of Employees, Company Type, Website, Business Segment)
Table 88 Shanghai Electric: Product Benchmarking
Table 89 Shanghai Electric: Strategic Outlook
Table 90 RENOVA, Inc.: Key Details, (CEO, HQ, Revenue, Founded, No. of Employees, Company Type, Website, Business Segment)
Table 91 RENOVA, Inc.: Product Benchmarking
Table 92 RENOVA, Inc.: Strategic Outlook
図の一覧
Figure 1 Offshore Wind Power Market Segmentation
Figure 2 Offshore Wind Power Market by Product: Market Attractiveness Index
Figure 3 Offshore Wind Power Market by Application: Market Attractiveness Index
Figure 4 Offshore Wind Power Market: Market Dynamics
Figure 5 Offshore Wind Power Market by Region, 2024-2034 (US$ Billion, AGR %): “V” Shaped Recovery
Figure 6 Offshore Wind Power Market by Region, 2024-2034 (US$ Billion, AGR %): “U” Shaped Recovery
Figure 7 Offshore Wind Power Market by Region, 2024-2034 (US$ Billion, AGR %): “W” Shaped Recovery
Figure 8 Offshore Wind Power Market by Region, 2024-2034 (US$ Billion, AGR %): “L” Shaped Recovery
Figure 9 Offshore Wind Power Market: Porter’s Five Forces Analysis
Figure 10 Offshore Wind Power Market by Location: Market Attractiveness Index
Figure 11 Offshore Wind Power Market Forecast by Product, 2024-2034 (US$ Billion, AGR %)
Figure 12 Offshore Wind Power Market Share Forecast by Product, 2024, 2029, 2034 (%)
Figure 13 Shallow Water Segment Market Forecast by Region, 2024-2034 (US$ Billion, AGR %)
Figure 14 Shallow Water Segment Market Share Forecast by Region, 2024 & 2034 (%)
Figure 15 Transitional Water Segment Market Forecast by Region, 2024-2034 (US$ Billion, AGR %)
Figure 16 Transitional Water Segment Market Share Forecast by Region, 2024 & 2034 (%)
Figure 17 Deep Water Segment Market Forecast by Region, 2024-2034 (US$ Billion, AGR %)
Figure 18 Deep Water Segment Market Share Forecast by Region, 2024 & 2034 (%)
Figure 19 Offshore Wind Power Market by Component: Market Attractiveness Index
Figure 20 Offshore Wind Power Market Forecast by Component, 2024-2034 (US$ Billion, AGR %)
Figure 21 Offshore Wind Power Market Share Forecast by Component, 2024, 2029, 2034 (%)
Figure 22 Turbines Segment Market Forecast by Region, 2024-2034 (US$ Billion, AGR %)
Figure 23 Turbines Segment Market Share Forecast by Region, 2024 & 2034 (%)
Figure 24 Electrical Infrastructure Segment Market Forecast by Region, 2024-2034 (US$ Billion, AGR %)
Figure 25 Electrical Infrastructure Segment Market Share Forecast by Region, 2024 & 2034 (%)
Figure 26 Substructure Segment Market Forecast by Region, 2024-2034 (US$ Billion, AGR %)
Figure 27 Substructure Segment Market Share Forecast by Region, 2024 & 2034 (%)
Figure 28 Other Components Segment Market Forecast by Region, 2024-2034 (US$ Billion, AGR %)
Figure 29 Other Components Segment Market Share Forecast by Region, 2024 & 2034 (%)
Figure 30 Offshore Wind Power Market Forecast by Region 2024 and 2034 (USD Million, CAGR%)
Figure 31 Offshore Wind Power Market Share Forecast by Region, 2024 (%)
Figure 32 Offshore Wind Power Market Share Forecast by Region, 2029 (%)
Figure 33 Offshore Wind Power Market Share Forecast by Region, 2034 (%)
Figure 34 Offshore Wind Power Market by Region, 2024-2034 (US$ Billion, AGR %)
Figure 35 China Offshore Wind Power Market Forecast by Location, 2024-2034 (US$ Billion, AGR %)
Figure 36 China Offshore Wind Power Market Share Forecast by Location, 2024 & 2034 (%)
Figure 37 China Offshore Wind Power Market Forecast by Component, 2024-2034 (US$ Billion, AGR %)
Figure 38 China Offshore Wind Power Market Share Forecast by Component, 2024 & 2034 (%)
Figure 39 China Offshore Wind Power Market Forecast, 2024-2034 (US$ Billion, AGR %)
Figure 40 UK Offshore Wind Power Market Forecast by Location, 2024-2034 (US$ Billion, AGR %)
Figure 41 UK Offshore Wind Power Market Share Forecast by Location, 2024 & 2034 (%)
Figure 42 UK Offshore Wind Power Market Forecast by Component, 2024-2034 (US$ Billion, AGR %)
Figure 43 UK Offshore Wind Power Market Share Forecast by Component, 2024 & 2034 (%)
Figure 44 UK Offshore Wind Power Market Forecast, 2024-2034 (US$ Billion, AGR %)
Figure 45 Germany Offshore Wind Power Market Forecast by Location, 2024-2034 (US$ Billion, AGR %)
Figure 46 Germany Offshore Wind Power Market Share Forecast by Location, 2024 & 2034 (%)
Figure 47 Germany Offshore Wind Power Market Forecast by Component, 2024-2034 (US$ Billion, AGR %)
Figure 48 Germany Offshore Wind Power Market Share Forecast by Component, 2024 & 2034 (%)
Figure 49 Germany Offshore Wind Power Market Forecast, 2024-2034 (US$ Billion, AGR %)
Figure 50 Netherlands Offshore Wind Power Market Forecast by Location, 2024-2034 (US$ Billion, AGR %)
Figure 51 Netherlands Offshore Wind Power Market Share Forecast by Location, 2024 & 2034 (%)
Figure 52 Netherlands Offshore Wind Power Market Forecast by Component, 2024-2034 (US$ Billion, AGR %)
Figure 53 Netherlands Offshore Wind Power Market Share Forecast by Component, 2024 & 2034 (%)
Figure 54 Netherlands Offshore Wind Power Market Forecast, 2024-2034 (US$ Billion, AGR %)
Figure 55 Denmark Offshore Wind Power Market Forecast by Location, 2024-2034 (US$ Billion, AGR %)
Figure 56 Denmark Offshore Wind Power Market Share Forecast by Location, 2024 & 2034 (%)
Figure 57 Denmark Offshore Wind Power Market Forecast by Component, 2024-2034 (US$ Billion, AGR %)
Figure 58 Denmark Offshore Wind Power Market Share Forecast by Component, 2024 & 2034 (%)
Figure 59 Denmark Offshore Wind Power Market Forecast, 2024-2034 (US$ Billion, AGR %)
Figure 60 Belgium Offshore Wind Power Market Forecast by Location, 2024-2034 (US$ Billion, AGR %)
Figure 61 Belgium Offshore Wind Power Market Share Forecast by Location, 2024 & 2034 (%)
Figure 62 Belgium Offshore Wind Power Market Forecast by Component, 2024-2034 (US$ Billion, AGR %)
Figure 63 Belgium Offshore Wind Power Market Share Forecast by Component, 2024 & 2034 (%)
Figure 64 Belgium Offshore Wind Power Market Forecast, 2024-2034 (US$ Billion, AGR %)
Figure 65 France Offshore Wind Power Market Forecast by Location, 2024-2034 (US$ Billion, AGR %)
Figure 66 France Offshore Wind Power Market Share Forecast by Location, 2024 & 2034 (%)
Figure 67 France Offshore Wind Power Market Forecast by Component, 2024-2034 (US$ Billion, AGR %)
Figure 68 France Offshore Wind Power Market Share Forecast by Component, 2024 & 2034 (%)
Figure 69 France Offshore Wind Power Market Forecast, 2024-2034 (US$ Billion, AGR %)
Figure 70 Vietnam Offshore Wind Power Market Forecast by Location, 2024-2034 (US$ Billion, AGR %)
Figure 71 Vietnam Offshore Wind Power Market Share Forecast by Location, 2024 & 2034 (%)
Figure 72 Vietnam Offshore Wind Power Market Forecast by Component, 2024-2034 (US$ Billion, AGR %)
Figure 73 Vietnam Offshore Wind Power Market Share Forecast by Component, 2024 & 2034 (%)
Figure 74 Vietnam Offshore Wind Power Market Forecast, 2024-2034 (US$ Billion, AGR %)
Figure 75 Taiwan Offshore Wind Power Market Forecast by Location, 2024-2034 (US$ Billion, AGR %)
Figure 76 Taiwan Offshore Wind Power Market Share Forecast by Location, 2024 & 2034 (%)
Figure 77 Taiwan Offshore Wind Power Market Forecast by Component, 2024-2034 (US$ Billion, AGR %)
Figure 78 Taiwan Offshore Wind Power Market Share Forecast by Component, 2024 & 2034 (%)
Figure 79 Taiwan Offshore Wind Power Market Forecast, 2024-2034 (US$ Billion, AGR %)
Figure 80 Japan Offshore Wind Power Market Forecast by Location, 2024-2034 (US$ Billion, AGR %)
Figure 81 Japan Offshore Wind Power Market Share Forecast by Location, 2024 & 2034 (%)
Figure 82 Japan Offshore Wind Power Market Forecast by Component, 2024-2034 (US$ Billion, AGR %)
Figure 83 Japan Offshore Wind Power Market Share Forecast by Component, 2024 & 2034 (%)
Figure 84 Japan Offshore Wind Power Market Forecast, 2024-2034 (US$ Billion, AGR %)
Figure 85 Sweden Offshore Wind Power Market Forecast by Location, 2024-2034 (US$ Billion, AGR %)
Figure 86 Sweden Offshore Wind Power Market Share Forecast by Location, 2024 & 2034 (%)
Figure 87 Sweden Offshore Wind Power Market Forecast by Component, 2024-2034 (US$ Billion, AGR %)
Figure 88 Sweden Offshore Wind Power Market Share Forecast by Component, 2024 & 2034 (%)
Figure 89 Sweden Offshore Wind Power Market Forecast, 2024-2034 (US$ Billion, AGR %)
Figure 90 South Korea Offshore Wind Power Market Forecast by Location, 2024-2034 (US$ Billion, AGR %)
Figure 91 South Korea Offshore Wind Power Market Share Forecast by Location, 2024 & 2034 (%)
Figure 92 South Korea Offshore Wind Power Market Forecast by Component, 2024-2034 (US$ Billion, AGR %)
Figure 93 South Korea Offshore Wind Power Market Share Forecast by Component, 2024 & 2034 (%)
Figure 94 South Korea Offshore Wind Power Market Forecast, 2024-2034 (US$ Billion, AGR %)
Figure 95 Finland Offshore Wind Power Market Forecast by Location, 2024-2034 (US$ Billion, AGR %)
Figure 96 Finland Offshore Wind Power Market Share Forecast by Location, 2024 & 2034 (%)
Figure 97 Finland Offshore Wind Power Market Forecast by Component, 2024-2034 (US$ Billion, AGR %)
Figure 98 Finland Offshore Wind Power Market Share Forecast by Component, 2024 & 2034 (%)
Figure 99 Finland Offshore Wind Power Market Forecast, 2024-2034 (US$ Billion, AGR %)
Figure 100 USA Offshore Wind Power Market Forecast by Location, 2024-2034 (US$ Billion, AGR %)
Figure 101 USA Offshore Wind Power Market Share Forecast by Location, 2024 & 2034 (%)
Figure 102 USA Offshore Wind Power Market Forecast by Component, 2024-2034 (US$ Billion, AGR %)
Figure 103 USA Offshore Wind Power Market Share Forecast by Component, 2024 & 2034 (%)
Figure 104 USA Offshore Wind Power Market Forecast, 2024-2034 (US$ Billion, AGR %)
Figure 105 Italy Offshore Wind Power Market Forecast by Location, 2024-2034 (US$ Billion, AGR %)
Figure 106 Italy Offshore Wind Power Market Share Forecast by Location, 2024 & 2034 (%)
Figure 107 Italy Offshore Wind Power Market Forecast by Component, 2024-2034 (US$ Billion, AGR %)
Figure 108 Italy Offshore Wind Power Market Share Forecast by Component, 2024 & 2034 (%)
Figure 109 Italy Offshore Wind Power Market Forecast, 2024-2034 (US$ Billion, AGR %)
Figure 110 Rest of the World Offshore Wind Power Market Forecast by Location, 2024-2034 (US$ Billion, AGR %)
Figure 111 Rest of the World Offshore Wind Power Market Share Forecast by Location, 2024 & 2034 (%)
Figure 112 Rest of the World Offshore Wind Power Market Forecast by Component, 2024-2034 (US$ Billion, AGR %)
Figure 113 Rest of the World Offshore Wind Power Market Share Forecast by Component, 2024 & 2034 (%)
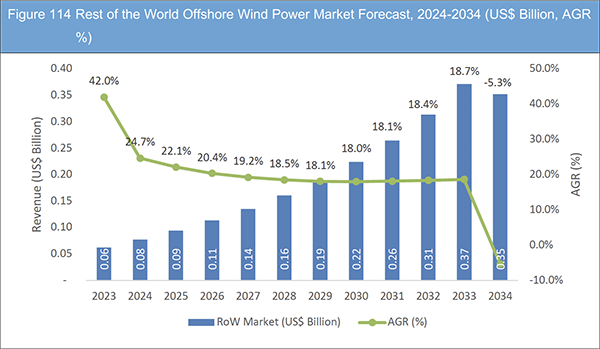
Figure 114 Rest of the World Offshore Wind Power Market Forecast, 2024-2034 (US$ Billion, AGR %)
Figure 115 General Electric Company: Net Revenue, 2018-2022 (US$ Million, AGR%)
Figure 116 General Electric Company: Gross Profit, 2018-2022 (US$ Million, AGR%)
Figure 117 General Electric Company: Operating Income, 2018-2022 (US$ Million, AGR%)
Figure 118 General Electric Company: Net Income, 2018-2022 (US$ Million, AGR%)
Figure 119 General Electric Company: Regional Revenue, 2022
Figure 120 General Electric Company: Segment Revenue, 2022
Figure 121 Vestas: Net Revenue, 2018-2022 (US$ Million, AGR%)
Figure 122 Vestas: Gross Profit, 2018-2022 (US$ Million, AGR%)
Figure 123 Vestas: R&D Expense, 2018-2022 (US$ Million, AGR%)
Figure 124 ABB: Net Revenue, 2018-2022 (US$ Million, AGR%)
Figure 125 ABB: Regional Market Shares, 2022
Figure 126 ABB: Segment Market Shares, 2022
Figure 127 Goldwind: Net Revenue, 2018-2022 (US$ Million, AGR%)
Figure 128 Goldwind: Segment Market Shares, 2022
Figure 129 Nordex SE: Net Revenue, 2018-2022 (US$ Million, AGR%)
Figure 130 Nordex SE: Regional Market Shares, 2022
Figure 131 Nordex SE: Segment Market Shares, 2022
Figure 132 Nexans: Net Revenue, 2018-2022 (US$ Million, AGR%)
Figure 133 Nexans: Regional Market Shares, 2022
Figure 134 Nexans: Segment Market Shares, 2022
Figure 135 Shanghai Electric: Net Revenue, 2018-2022 (US$ Million, AGR%)
Figure 136 Shanghai Electric: Segment Market Shares, 2022
ページTOPに戻る
Summary
Report Details
The Offshore Wind Power Market Report 2024-2034: This report will prove invaluable to leading firms striving for new revenue pockets if they wish to better understand the industry and its underlying dynamics. It will be useful for companies that would like to expand into different industries or to expand their existing operations in a new region.
Growing Demand for Cleaner Energy Sources
Many governments around the world have recognised the importance of transitioning to cleaner energy sources to combat climate change and promote energy security. As a result, they are implementing supportive policies, incentives, and regulations to encourage investment in renewable energy projects. Growing awareness of the impacts of climate change has led to increased public and private demand for cleaner energy sources. As people and businesses become more conscious of their carbon footprint, they are seeking alternatives to traditional fossil fuels.
Many large corporations and businesses are adopting sustainability goals, pledging to reduce their carbon emissions and embrace renewable energy. This shift in corporate behaviour is driving investments in renewable energy projects, often through power purchase agreements (PPAs) with renewable energy providers. The renewable energy industry has been a significant driver of job creation and economic growth in various countries. As the industry expands, it continues to create job opportunities in areas such as manufacturing, installation, maintenance, and research and development.
Challenges Associated with Offshore Wind Power Industry
Offshore wind turbines operate in a harsh marine environment, which can lead to technical challenges such as corrosion, biofouling, and exposure to extreme weather conditions. Developing and maintaining technologies that can withstand these conditions is crucial. Installing and maintaining offshore wind turbines is a complex and expensive process. The turbines are often located in deep waters, making installation more challenging and costly. Developing cost-effective and efficient installation and maintenance strategies is crucial for the long-term viability of offshore wind projects. The design of foundations for offshore wind turbines is critical. Different seabed conditions and water depths require various foundation types, such as monopiles, jackets, or floating structures. Ensuring the stability and durability of these foundations is a significant technical challenge. Transporting large wind turbine components to offshore locations and assembling them at sea can be logistically challenging. Specialised vessels are needed for transportation, and efficient logistics planning is crucial to minimise costs and downtime.
What Questions Should You Ask before Buying a Market Research Report?
• How is the offshore wind power market evolving?
• What is driving and restraining the offshore wind power market?
• How will each offshore wind power submarket segment grow over the forecast period and how much revenue will these submarkets account for in 2034?
• How will the market shares for each offshore wind power submarket develops from 2024 to 2034?
• What will be the main driver for the overall market from 2024 to 2034?
• Will leading offshore wind power markets broadly follow the macroeconomic dynamics, or will individual national markets outperform others?
• How will the market shares of the national markets change by 2034 and which geographical region will lead the market in 2034?
• Who are the leading players and what are their prospects over the forecast period?
• What are the offshore wind power projects for these leading companies?
• How will the industry evolve during the period between 2024 and 2034? What are the implications of offshore wind power projects taking place now and over the next 10 years?
• Is there a greater need for product commercialisation to further scale the offshore wind power market?
• Where is the offshore wind power market heading and how can you ensure you are at the forefront of the market?
You need to discover how this will impact the offshore wind power market today, and over the next 10 years:
• Our 271-page report provides 92 tables and 136 charts/graphs exclusively to you.
• The report highlights key lucrative areas in the industry so you can target them – NOW.
• It contains in-depth analysis of global, regional and national sales and growth.
• It highlights for you the key successful trends, changes and revenue projections made by your competitors.
This report tells you TODAY how the offshore wind power market will develop in the next 10 years, and in line with the variations in COVID-19 economic recession and bounce. This market is more critical now than at any point over the last 10 years.
Forecasts to 2034 and other analyses reveal commercial prospects
• In addition to revenue forecasting to 2034, our new study provides you with recent results, growth rates, and market shares.
• You will find original analyses, with business outlooks and developments.
• Discover qualitative analyses (including market dynamics, drivers, opportunities, restraints, and challenges), porters five forces analysis, PEST analysis, and recent developments.
Segments Covered in the Report
Location Outlook
• Shallow Water
• Transitional Water
• Deep Water
Component Outlook
• Turbines
• Electrical Infrastructure
• Substructure
• Others
In addition to the revenue predictions for the overall world market and segments, you will also find revenue forecasts for 15 leading national markets:
Key Country Outlook
• China
• UK
• Germany
• Netherlands
• Denmark
• Belgium
• France
• Vietnam
• Taiwan
• Japan
• Sweden
• South Korea
• Finland
• USA
• Italy
• Rest of the World
The report also includes profiles and for some of the leading companies in the Offshore Wind Power Market, 2024 to 2034, with a focus on this segment of these companies’ operations.
Leading companies and the potential for market growth
• ABB
• Doosan Enerbility
• General Electric Company
• Goldwind
• Nexans
• Nordex SE
• RENOVA, Inc.
• Shanghai Electric
• Siemens Gamesa Renewable Energy
• Vestas
Overall world revenue for Offshore Wind Power Market, 2024 to 2034 in terms of value the market will surpass US$46 billion in 2023, our work calculates. We predict strong revenue growth through to 2034. Our work identifies which organisations hold the greatest potential. Discover their capabilities, progress, and commercial prospects, helping you stay ahead.
How will the Offshore Wind Power Market, 2024 to 2034 Market report help you?
In summary, our 270+ page report provides you with the following knowledge:
• Revenue forecasts to 2034 for Offshore Wind Power Market, 2024 to 2034 Market, with forecasts for location, component, and each forecast at a global, and key country level – discover the industry’s prospects, finding the most lucrative places for investments and revenues.
• Revenue forecasts to 2034 for 15 key national markets – See forecasts for the Offshore Wind Power Market, 2024 to 2034 market in China, UK, Germany, Netherlands, Denmark, Belgium, France, Vietnam, Taiwan, Japan, Sweden, South Korea, Finland, USA, Italy, and Rest of the World.
• Prospects for established firms and those seeking to enter the market – including company profiles for 10 of the major companies involved in the Offshore Wind Power Market.
Find quantitative and qualitative analyses with independent predictions. Receive information that only our report contains, staying informed with invaluable business intelligence.
Information found nowhere else
With our new report, you are less likely to fall behind in knowledge or miss out on opportunities. See how our work could benefit your research, analyses, and decisions. Visiongain’s study is for everybody needing commercial analyses for the Offshore Wind Power Market, 2024 to 2034, market-leading companies. You will find data, trends and predictions.
ページTOPに戻る
Table of Contents
Table of Contents
1 Report Overview
1.1 Objectives of the Study
1.2 Introduction to Offshore Wind Power Market
1.3 What This Report Delivers
1.4 Why You Should Read This Report
1.5 Key Questions Answered by This Analytical Report
1.6 Who is This Report for?
1.7 Methodology
1.7.1 Market Definitions
1.7.2 Market Evaluation & Forecasting Methodology
1.7.3 Data Validation
1.7.3.1 Primary Research
1.7.3.2 Secondary Research
1.8 Frequently Asked Questions (FAQs)
1.9 Associated Visiongain Reports
1.10 About Visiongain
2 Executive Summary
3 Market Overview
3.1 Key Findings
3.2 Market Dynamics
3.2.1 Market Driving Factors
3.2.1.1 Offshore Wind Power Favourable Policies to Drive the Market
3.2.1.2 Advancements in Offshore Wind Turbine Technology
3.2.2 Market Restraining Factors
3.2.2.1 High Capital Cost Associated With Offshore Wind Power
3.2.2.2 Challenges Associated with Offshore Wind Power Industry
3.2.3 Market Opportunities
3.2.3.1 Government Initiatives To Reduce Carbon Emissions
3.2.3.2 Growing Renewable Energy Industry
3.3 COVID-19 Impact Analysis
3.4 Porter’s Five Forces Analysis
3.4.1 Bargaining Power of Suppliers
3.4.2 Bargaining Power of Buyers
3.4.3 Competitive Rivalry
3.4.4 Threat from Substitutes
3.4.5 Threat of New Entrants
4 Offshore Wind Power Market Analysis by Location
4.1 Key Findings
4.2 Location Segment: Market Attractiveness Index
4.3 Offshore Wind Power Market Size Estimation and Forecast by Location
4.4 Shallow Water
4.4.1 Market Size by Region, 2024-2034 (US$ Billion)
4.4.2 Market Share by Region, 2024 & 2034 (%)
4.5 Transitional Water
4.5.1 Market Size by Region, 2024-2034 (US$ Billion)
4.5.2 Market Share by Region, 2024 & 2034 (%)
4.6 Deep Water
4.6.1 Market Size by Region, 2024-2034 (US$ Billion)
4.6.2 Market Share by Region, 2024 & 2034 (%)
5 Offshore Wind Power Market Analysis by Component
5.1 Key Findings
5.2 Component Segment: Market Attractiveness Index
5.3 Offshore Wind Power Market Size Estimation and Forecast by Component
5.4 Turbines
5.4.1 Market Size by Region, 2024-2034 (US$ Billion)
5.4.2 Market Share by Region, 2024 & 2034 (%)
5.5 Electrical Infrastructure
5.5.1 Market Size by Region, 2024-2034 (US$ Billion)
5.5.2 Market Share by Region, 2024 & 2034 (%)
5.6 Substructure
5.6.1 Market Size by Region, 2024-2034 (US$ Billion)
5.6.2 Market Share by Region, 2024 & 2034 (%)
5.7 Other Components
5.7.1 Market Size by Region, 2024-2034 (US$ Billion)
5.7.2 Market Share by Region, 2024 & 2034 (%)
6 Offshore Wind Power Market Analysis by Region
6.1 Key Findings
6.2 Regional Market Size Estimation and Forecast
7 China Offshore Wind Power Market Analysis
7.1 Key Findings
7.2 China Offshore Wind Power Market Size Estimation and Forecast by Location
7.3 China Offshore Wind Power Market Size Estimation and Forecast by Component
7.4 China Offshore Wind Power Market Analysis
7.4.1 Hybrid Floating Wind Project Revealed Offshore China
7.4.2 Country on Track to Hit Wind and Solar Targets
7.4.3 CEEC’s First Offshore Wind Power Project Has Been Approved
8 UK Offshore Wind Power Market Analysis
8.1 Key Findings
8.2 UK Offshore Wind Power Market Size Estimation and Forecast by Location
8.3 UK Offshore Wind Power Market Size Estimation and Forecast by Component
8.4 UK Offshore Wind Power Market Analysis
8.4.1 World’s Largest Offshore Windfarm Project Starts Powering UK Grid
8.4.2 UK Offshore Wind Power Industry
9 Germany Offshore Wind Power Market Analysis
9.1 Key Findings
9.2 Germany Offshore Wind Power Market Size Estimation and Forecast by Location
9.3 Germany Offshore Wind Power Market Size Estimation and Forecast by Component
9.4 Germany Offshore Wind Power Market Analysis
9.4.1 Offshore Wind Energy Development
9.4.2 Offshore Expansion Targets Offshore Wind Energy
9.4.3 Activities in Offshore Wind Energy Projects
10 Netherlands Offshore Wind Power Market Analysis
10.1 Key Findings
10.2 Netherlands Offshore Wind Power Market Size Estimation and Forecast by Location
10.3 Netherlands Offshore Wind Power Market Size Estimation and Forecast by Component
10.4 Netherlands Offshore Wind Power Market Analysis
10.4.1 Wind Energy Targets
10.4.2 Netherlands Sets 70 GW Offshore Wind Target for 2050
11 Denmark Offshore Wind Power Market Analysis
11.1 Key Findings
11.2 Denmark Offshore Wind Power Market Size Estimation and Forecast by Location
11.3 Denmark Offshore Wind Power Market Size Estimation and Forecast by Component
11.4 Denmark Offshore Wind Power Market Analysis
11.4.1 Vattenfall Supplies First Power From Denmark’s Next Offshore Wind Farm
11.4.2 Japan, Denmark to Collaborate on Floating Offshore Wind Technology
12 Belgium Offshore Wind Power Market Analysis
12.1 Key Findings
12.2 Belgium Offshore Wind Power Market Size Estimation and Forecast by Location
12.3 Belgium Offshore Wind Power Market Size Estimation and Forecast by Component
12.4 Belgium Offshore Wind Power Market Analysis
12.4.1 Belgium Offshore Wind Energy
13 France Offshore Wind Power Market Analysis
13.1 Key Findings
13.2 France Offshore Wind Power Market Size Estimation and Forecast by Location
13.3 France Offshore Wind Power Market Size Estimation and Forecast by Component
13.4 France Offshore Wind Power Market Analysis
13.4.1 Offshore Wind Power Sector In France
13.4.2 ENGIE-EDPR Joint Venture on The Rise
14 Vietnam Offshore Wind Power Market Analysis
14.1 Key Findings
14.2 Vietnam Offshore Wind Power Market Size Estimation and Forecast by Location
14.3 Vietnam Offshore Wind Power Market Size Estimation and Forecast by Component
14.4 Vietnam Offshore Wind Power Market Analysis
14.4.1 MOU Finalized to Grow Offshore Wind Power in Vietnam
14.4.2 Offshore Wind Power and Development Policies in Vietnam
15 Taiwan Offshore Wind Power Market Analysis
15.1 Key Findings
15.2 Taiwan Offshore Wind Power Market Size Estimation and Forecast by Location
15.3 Taiwan Offshore Wind Power Market Size Estimation and Forecast by Component
15.4 Taiwan Offshore Wind Power Market Analysis
16 Japan Offshore Wind Power Market Analysis
16.1 Key Findings
16.2 Japan Offshore Wind Power Market Size Estimation and Forecast by Location
16.3 Japan Offshore Wind Power Market Size Estimation and Forecast by Component
16.4 Japan Offshore Wind Power Market Analysis
16.4.1 Japan Aims to Become Major Offshore Wind Energy Producer
17 Sweden Offshore Wind Power Market Analysis
17.1 Key Findings
17.2 Sweden Offshore Wind Power Market Size Estimation and Forecast by Location
17.3 Sweden Offshore Wind Power Market Size Estimation and Forecast by Component
17.4 Sweden Offshore Wind Power Market Analysis
17.4.1 Sweden Nixes Vattenfall’s Offshore Wind Project
17.4.2 Offshore Wind Energy Outlook
18 South Korea Offshore Wind Power Market Analysis
18.1 Key Findings
18.2 South Korea Offshore Wind Power Market Size Estimation and Forecast by Location
18.3 South Korea Offshore Wind Power Market Size Estimation and Forecast by Component
18.4 South Korea Offshore Wind Power Market Analysis
18.4.1 532 MW South Korean Offshore Wind Project Moves Forward
18.4.2 Plans Unveiled for New Multi-Gigawatt Offshore Wind Project in South Korea
19 Finland Offshore Wind Power Market Analysis
19.1 Key Findings
19.2 Finland Offshore Wind Power Market Size Estimation and Forecast by Location
19.3 Finland Offshore Wind Power Market Size Estimation and Forecast by Component
19.4 Finland Offshore Wind Power Market Analysis
19.4.1 Finland to Tender 6,000 MW of Offshore Wind Power in 2023-2024
20 USA Offshore Wind Power Market Analysis
20.1 Key Findings
20.2 USA Offshore Wind Power Market Size Estimation and Forecast by Location
20.3 USA Offshore Wind Power Market Size Estimation and Forecast by Component
20.4 USA Offshore Wind Power Market Analysis
20.4.1 Siemens Gamesa Halts Plans for USD 200 Million Offshore Wind Turbine Blade Factory in US
21 Italy Offshore Wind Power Market Analysis
21.1 Key Findings
21.2 Italy Offshore Wind Power Market Size Estimation and Forecast by Location
21.3 Italy Offshore Wind Power Market Size Estimation and Forecast by Component
21.4 Italy Offshore Wind Power Market Analysis
21.4.1 Developer of Italy’s First Offshore Wind Farm
21.4.2 Renantis, BlueFloat Target 5.5 GW Offshore Wind in Italy
22 Rest of the World Offshore Wind Power Market Analysis
22.1 Key Findings
22.2 Rest of the World Offshore Wind Power Market Size Estimation and Forecast by Location
22.3 Rest of the World Offshore Wind Power Market Size Estimation and Forecast by Component
22.4 Rest of the World Offshore Wind Power Market Analysis
22.4.1 Home
23 Company Profiles
23.1 General Electric Company
23.1.1 Company Snapshot
23.1.2 Company Overview
23.1.3 Financial Analysis
23.1.3.1 Net Revenue, 2018-2022
23.1.3.2 Gross Profit, 2018-2022
23.1.3.3 Operating Income, 2018-2022
23.1.3.4 Net Income, 2018-2022
23.1.3.5 Regional Revenue, 2022
23.1.3.6 Segment Revenue, 2022
23.1.4 Product Benchmarking
23.1.5 Strategic Outlook
23.2 Vestas
23.2.1 Company Snapshot
23.2.2 Company Overview
23.2.3 Financial Analysis
23.2.3.1 Net Revenue, 2018-2022
23.2.3.2 Gross Profit, 2018-2022
23.2.3.3 R&D Expense, 2018-2022
23.2.4 Product Benchmarking
23.2.5 Strategic Outlook
23.3 Siemens Gamesa Renewable Energy
23.3.1 Company Snapshot
23.3.2 Company Overview
23.3.3 Product Benchmarking
23.3.4 Strategic Outlook
23.4 ABB
23.4.1 Company Snapshot
23.4.2 Company Overview
23.4.3 Financial Analysis
23.4.3.1 Net Revenue, 2018-2022
23.4.3.2 Regional Market Shares, 2022
23.4.3.3 Segment Market Shares, 2022
23.4.4 Product Benchmarking
23.4.5 Strategic Outlook
23.5 Goldwind
23.5.1 Company Snapshot
23.5.2 Company Overview
23.5.3 Financial Analysis
23.5.3.1 Net Revenue, 2018-2022
23.5.3.2 Segment Market Shares, 2022
23.5.4 Product Benchmarking
23.5.5 Strategic Outlook
23.6 Doosan Enerbility
23.6.1 Company Snapshot
23.6.2 Company Overview
23.6.3 Product Benchmarking
23.6.4 Strategic Outlook
23.7 Nordex SE
23.7.1 Company Snapshot
23.7.2 Company Overview
23.7.3 Financial Analysis
23.7.3.1 Net Revenue, 2018-2022
23.7.3.2 Regional Market Shares, 2022
23.7.3.3 Segment Market Shares, 2022
23.7.4 Product Benchmarking
23.8 Nexans
23.8.1 Company Snapshot
23.8.2 Company Overview
23.8.3 Financial Analysis
23.8.3.1 Net Revenue, 2018-2022
23.8.3.2 Regional Market Shares, 2022
23.8.3.3 Segment Market Shares, 2022
23.8.4 Product Benchmarking
23.8.5 Strategic Outlook
23.9 Shanghai Electric
23.9.1 Company Snapshot
23.9.2 Company Overview
23.9.3 Financial Analysis
23.9.3.1 Net Revenue, 2018-2022
23.9.3.2 Segment Market Shares, 2022
23.9.4 Product Benchmarking
23.9.5 Strategic Outlook
23.10 RENOVA, Inc.
23.10.1 Company Snapshot
23.10.2 Company Overview
23.10.3 Product Benchmarking
23.10.4 Strategic Outlook
24 Conclusion and Recommendations
24.1 Concluding Remarks from Visiongain
24.2 Recommendations for Market Players
ページTOPに戻る
List of Tables/Graphs
List of Tables
Table 1 Offshore Wind Power Market Snapshot, 2024 & 2034 (US$ Billion, CAGR %)
Table 2 Offshore Wind Power Market Forecast by Region, 2024-2034 (US$ Billion, AGR%, CAGR%): “V” Shaped Recovery
Table 3 Offshore Wind Power Market Forecast by Region, 2024-2034 (US$ Billion, AGR%, CAGR%): “U” Shaped Recovery
Table 4 Offshore Wind Power Market Forecast by Region, 2024-2034 (US$ Billion, AGR%, CAGR%): “W” Shaped Recovery
Table 5 Offshore Wind Power Market Forecast by Region, 2024-2034 (US$ Billion, AGR%, CAGR%): “L” Shaped Recovery
Table 6 Offshore Wind Power Market Forecast by Location, 2024-2034 (US$ Billion, AGR%, CAGR%)
Table 7 Shallow Water Segment Market Forecast by Region, 2024-2034 (US$ Billion, AGR%, CAGR%)
Table 8 Transitional Water Segment Market Forecast by Region, 2024-2034 (US$ Billion, AGR%, CAGR%)
Table 9 Deep Water Segment Market Forecast by Region, 2024-2034 (US$ Billion, AGR%, CAGR%)
Table 10 Offshore Wind Power Market Forecast by Component, 2024-2034 (US$ Billion, AGR%, CAGR%)
Table 11 Turbines Segment Market Forecast by Region, 2024-2034 (US$ Billion, AGR%, CAGR%)
Table 12 Electrical Infrastructure Segment Market Forecast by Region, 2024-2034 (US$ Billion, AGR%, CAGR%)
Table 13 Substructure Segment Market Forecast by Region, 2024-2034 (US$ Billion, AGR%, CAGR%)
Table 14 Other Components Segment Market Forecast by Region, 2024-2034 (US$ Billion, AGR%, CAGR%)
Table 15 Offshore Wind Power Market Forecast by Region, 2024-2034 (US$ Billion, AGR%, CAGR%)
Table 16 China Offshore Wind Power Market Forecast by Location, 2024-2034 (US$ Billion, AGR%, CAGR%)
Table 17 China Offshore Wind Power Market Forecast by Component, 2024-2034 (US$ Billion, AGR%, CAGR%)
Table 18 China Offshore Wind Power Market Forecast, 2024-2034 (US$ Billion, AGR%, CAGR%)
Table 19 UK Offshore Wind Power Market Forecast by Location, 2024-2034 (US$ Billion, AGR%, CAGR%)
Table 20 UK Offshore Wind Power Market Forecast by Component, 2024-2034 (US$ Billion, AGR%, CAGR%)
Table 21 UK Offshore Wind Power Market Forecast, 2024-2034 (US$ Billion, AGR%, CAGR%)
Table 22 Germany Offshore Wind Power Market Forecast by Location, 2024-2034 (US$ Billion, AGR%, CAGR%)
Table 23 Germany Offshore Wind Power Market Forecast by Component, 2024-2034 (US$ Billion, AGR%, CAGR%)
Table 24 Germany Offshore Wind Power Market Forecast, 2024-2034 (US$ Billion, AGR%, CAGR%)
Table 25 Netherlands Offshore Wind Power Market Forecast by Location, 2024-2034 (US$ Billion, AGR%, CAGR%)
Table 26 Netherlands Offshore Wind Power Market Forecast by Component, 2024-2034 (US$ Billion, AGR%, CAGR%)
Table 27 Netherlands Offshore Wind Power Market Forecast, 2024-2034 (US$ Billion, AGR%, CAGR%)
Table 28 Denmark Offshore Wind Power Market Forecast by Location, 2024-2034 (US$ Billion, AGR%, CAGR%)
Table 29 Denmark Offshore Wind Power Market Forecast by Component, 2024-2034 (US$ Billion, AGR%, CAGR%)
Table 30 Denmark Offshore Wind Power Market Forecast, 2024-2034 (US$ Billion, AGR%, CAGR%)
Table 31 Belgium Offshore Wind Power Market Forecast by Location, 2024-2034 (US$ Billion, AGR%, CAGR%)
Table 32 Belgium Offshore Wind Power Market Forecast by Component, 2024-2034 (US$ Billion, AGR%, CAGR%)
Table 33 Belgium Offshore Wind Power Market Forecast, 2024-2034 (US$ Billion, AGR%, CAGR%)
Table 34 France Offshore Wind Power Market Forecast by Location, 2024-2034 (US$ Billion, AGR%, CAGR%)
Table 35 France Offshore Wind Power Market Forecast by Component, 2024-2034 (US$ Billion, AGR%, CAGR%)
Table 36 France Offshore Wind Power Market Forecast, 2024-2034 (US$ Billion, AGR%, CAGR%)
Table 37 Vietnam Offshore Wind Power Market Forecast by Location, 2024-2034 (US$ Billion, AGR%, CAGR%)
Table 38 Vietnam Offshore Wind Power Market Forecast by Component, 2024-2034 (US$ Billion, AGR%, CAGR%)
Table 39 Vietnam Offshore Wind Power Market Forecast, 2024-2034 (US$ Billion, AGR%, CAGR%)
Table 40 Taiwan Offshore Wind Power Market Forecast by Location, 2024-2034 (US$ Billion, AGR%, CAGR%)
Table 41 Taiwan Offshore Wind Power Market Forecast by Component, 2024-2034 (US$ Billion, AGR%, CAGR%)
Table 42 Taiwan Offshore Wind Power Market Forecast, 2024-2034 (US$ Billion, AGR%, CAGR%)
Table 43 Japan Offshore Wind Power Market Forecast by Location, 2024-2034 (US$ Billion, AGR%, CAGR%)
Table 44 Japan Offshore Wind Power Market Forecast by Component, 2024-2034 (US$ Billion, AGR%, CAGR%)
Table 45 Japan Offshore Wind Power Market Forecast, 2024-2034 (US$ Billion, AGR%, CAGR%)
Table 46 Sweden Offshore Wind Power Market Forecast by Location, 2024-2034 (US$ Billion, AGR%, CAGR%)
Table 47 Sweden Offshore Wind Power Market Forecast by Component, 2024-2034 (US$ Billion, AGR%, CAGR%)
Table 48 Sweden Offshore Wind Power Market Forecast, 2024-2034 (US$ Billion, AGR%, CAGR%)
Table 49 South Korea Offshore Wind Power Market Forecast by Location, 2024-2034 (US$ Billion, AGR%, CAGR%)
Table 50 South Korea Offshore Wind Power Market Forecast by Component, 2024-2034 (US$ Billion, AGR%, CAGR%)
Table 51 South Korea Offshore Wind Power Market Forecast, 2024-2034 (US$ Billion, AGR%, CAGR%)
Table 52 Finland Offshore Wind Power Market Forecast by Location, 2024-2034 (US$ Billion, AGR%, CAGR%)
Table 53 Finland Offshore Wind Power Market Forecast by Component, 2024-2034 (US$ Billion, AGR%, CAGR%)
Table 54 Finland Offshore Wind Power Market Forecast, 2024-2034 (US$ Billion, AGR%, CAGR%)
Table 55 USA Offshore Wind Power Market Forecast by Location, 2024-2034 (US$ Billion, AGR%, CAGR%)
Table 56 USA Offshore Wind Power Market Forecast by Component, 2024-2034 (US$ Billion, AGR%, CAGR%)
Table 57 USA Offshore Wind Power Market Forecast, 2024-2034 (US$ Billion, AGR%, CAGR%)
Table 58 Italy Offshore Wind Power Market Forecast by Location, 2024-2034 (US$ Billion, AGR%, CAGR%)
Table 59 Italy Offshore Wind Power Market Forecast by Component, 2024-2034 (US$ Billion, AGR%, CAGR%)
Table 60 Italy Offshore Wind Power Market Forecast, 2024-2034 (US$ Billion, AGR%, CAGR%)
Table 61 Rest of the World Offshore Wind Power Market Forecast by Location, 2024-2034 (US$ Billion, AGR%, CAGR%)
Table 62 Rest of the World Offshore Wind Power Market Forecast by Component, 2024-2034 (US$ Billion, AGR%, CAGR%)
Table 63 Rest of the World Offshore Wind Power Market Forecast, 2024-2034 (US$ Billion, AGR%, CAGR%)
Table 64 General Electric Company: Key Details, (CEO, HQ, Revenue, Founded, No. of Employees, Company Type, Website, Business Segment)
Table 65 General Electric Company: Product Benchmarking
Table 66 General Electric Company: Strategic Outlook
Table 67 Vestas: Key Details, (CEO, HQ, Revenue, Founded, No. of Employees, Company Type, Website, Business Segment)
Table 68 Vestas: Product Benchmarking
Table 69 Vestas: Strategic Outlook
Table 70 Siemens Gamesa Renewable Energy: Key Details, (CEO, HQ, Revenue, Founded, No. of Employees, Company Type, Website, Business Segment)
Table 71 Siemens Gamesa Renewable Energy: Product Benchmarking
Table 72 Siemens Gamesa Renewable Energy: Strategic Outlook
Table 73 ABB: Key Details, (CEO, HQ, Revenue, Founded, No. of Employees, Company Type, Website, Business Segment)
Table 74 ABB: Product Benchmarking
Table 75 ABB: Strategic Outlook
Table 76 Goldwind: Key Details, (CEO, HQ, Revenue, Founded, No. of Employees, Company Type, Website, Business Segment)
Table 77 Goldwind: Product Benchmarking
Table 78 Goldwind: Strategic Outlook
Table 79 Doosan Enerbility: Key Details, (CEO, HQ, Revenue, Founded, No. of Employees, Company Type, Website, Business Segment)
Table 80 Doosan Enerbility: Product Benchmarking
Table 81 Doosan Enerbility: Strategic Outlook
Table 82 Nordex SE: Key Details, (CEO, HQ, Revenue, Founded, No. of Employees, Company Type, Website, Business Segment)
Table 83 Nordex SE: Product Benchmarking
Table 84 Nexans: Key Details, (CEO, HQ, Revenue, Founded, No. of Employees, Company Type, Website, Business Segment)
Table 85 Nexans: Product Benchmarking
Table 86 Nexans: Strategic Outlook
Table 87 Shanghai Electric: Key Details, (CEO, HQ, Revenue, Founded, No. of Employees, Company Type, Website, Business Segment)
Table 88 Shanghai Electric: Product Benchmarking
Table 89 Shanghai Electric: Strategic Outlook
Table 90 RENOVA, Inc.: Key Details, (CEO, HQ, Revenue, Founded, No. of Employees, Company Type, Website, Business Segment)
Table 91 RENOVA, Inc.: Product Benchmarking
Table 92 RENOVA, Inc.: Strategic Outlook
List of Figures
Figure 1 Offshore Wind Power Market Segmentation
Figure 2 Offshore Wind Power Market by Product: Market Attractiveness Index
Figure 3 Offshore Wind Power Market by Application: Market Attractiveness Index
Figure 4 Offshore Wind Power Market: Market Dynamics
Figure 5 Offshore Wind Power Market by Region, 2024-2034 (US$ Billion, AGR %): “V” Shaped Recovery
Figure 6 Offshore Wind Power Market by Region, 2024-2034 (US$ Billion, AGR %): “U” Shaped Recovery
Figure 7 Offshore Wind Power Market by Region, 2024-2034 (US$ Billion, AGR %): “W” Shaped Recovery
Figure 8 Offshore Wind Power Market by Region, 2024-2034 (US$ Billion, AGR %): “L” Shaped Recovery
Figure 9 Offshore Wind Power Market: Porter’s Five Forces Analysis
Figure 10 Offshore Wind Power Market by Location: Market Attractiveness Index
Figure 11 Offshore Wind Power Market Forecast by Product, 2024-2034 (US$ Billion, AGR %)
Figure 12 Offshore Wind Power Market Share Forecast by Product, 2024, 2029, 2034 (%)
Figure 13 Shallow Water Segment Market Forecast by Region, 2024-2034 (US$ Billion, AGR %)
Figure 14 Shallow Water Segment Market Share Forecast by Region, 2024 & 2034 (%)
Figure 15 Transitional Water Segment Market Forecast by Region, 2024-2034 (US$ Billion, AGR %)
Figure 16 Transitional Water Segment Market Share Forecast by Region, 2024 & 2034 (%)
Figure 17 Deep Water Segment Market Forecast by Region, 2024-2034 (US$ Billion, AGR %)
Figure 18 Deep Water Segment Market Share Forecast by Region, 2024 & 2034 (%)
Figure 19 Offshore Wind Power Market by Component: Market Attractiveness Index
Figure 20 Offshore Wind Power Market Forecast by Component, 2024-2034 (US$ Billion, AGR %)
Figure 21 Offshore Wind Power Market Share Forecast by Component, 2024, 2029, 2034 (%)
Figure 22 Turbines Segment Market Forecast by Region, 2024-2034 (US$ Billion, AGR %)
Figure 23 Turbines Segment Market Share Forecast by Region, 2024 & 2034 (%)
Figure 24 Electrical Infrastructure Segment Market Forecast by Region, 2024-2034 (US$ Billion, AGR %)
Figure 25 Electrical Infrastructure Segment Market Share Forecast by Region, 2024 & 2034 (%)
Figure 26 Substructure Segment Market Forecast by Region, 2024-2034 (US$ Billion, AGR %)
Figure 27 Substructure Segment Market Share Forecast by Region, 2024 & 2034 (%)
Figure 28 Other Components Segment Market Forecast by Region, 2024-2034 (US$ Billion, AGR %)
Figure 29 Other Components Segment Market Share Forecast by Region, 2024 & 2034 (%)
Figure 30 Offshore Wind Power Market Forecast by Region 2024 and 2034 (USD Million, CAGR%)
Figure 31 Offshore Wind Power Market Share Forecast by Region, 2024 (%)
Figure 32 Offshore Wind Power Market Share Forecast by Region, 2029 (%)
Figure 33 Offshore Wind Power Market Share Forecast by Region, 2034 (%)
Figure 34 Offshore Wind Power Market by Region, 2024-2034 (US$ Billion, AGR %)
Figure 35 China Offshore Wind Power Market Forecast by Location, 2024-2034 (US$ Billion, AGR %)
Figure 36 China Offshore Wind Power Market Share Forecast by Location, 2024 & 2034 (%)
Figure 37 China Offshore Wind Power Market Forecast by Component, 2024-2034 (US$ Billion, AGR %)
Figure 38 China Offshore Wind Power Market Share Forecast by Component, 2024 & 2034 (%)
Figure 39 China Offshore Wind Power Market Forecast, 2024-2034 (US$ Billion, AGR %)
Figure 40 UK Offshore Wind Power Market Forecast by Location, 2024-2034 (US$ Billion, AGR %)
Figure 41 UK Offshore Wind Power Market Share Forecast by Location, 2024 & 2034 (%)
Figure 42 UK Offshore Wind Power Market Forecast by Component, 2024-2034 (US$ Billion, AGR %)
Figure 43 UK Offshore Wind Power Market Share Forecast by Component, 2024 & 2034 (%)
Figure 44 UK Offshore Wind Power Market Forecast, 2024-2034 (US$ Billion, AGR %)
Figure 45 Germany Offshore Wind Power Market Forecast by Location, 2024-2034 (US$ Billion, AGR %)
Figure 46 Germany Offshore Wind Power Market Share Forecast by Location, 2024 & 2034 (%)
Figure 47 Germany Offshore Wind Power Market Forecast by Component, 2024-2034 (US$ Billion, AGR %)
Figure 48 Germany Offshore Wind Power Market Share Forecast by Component, 2024 & 2034 (%)
Figure 49 Germany Offshore Wind Power Market Forecast, 2024-2034 (US$ Billion, AGR %)
Figure 50 Netherlands Offshore Wind Power Market Forecast by Location, 2024-2034 (US$ Billion, AGR %)
Figure 51 Netherlands Offshore Wind Power Market Share Forecast by Location, 2024 & 2034 (%)
Figure 52 Netherlands Offshore Wind Power Market Forecast by Component, 2024-2034 (US$ Billion, AGR %)
Figure 53 Netherlands Offshore Wind Power Market Share Forecast by Component, 2024 & 2034 (%)
Figure 54 Netherlands Offshore Wind Power Market Forecast, 2024-2034 (US$ Billion, AGR %)
Figure 55 Denmark Offshore Wind Power Market Forecast by Location, 2024-2034 (US$ Billion, AGR %)
Figure 56 Denmark Offshore Wind Power Market Share Forecast by Location, 2024 & 2034 (%)
Figure 57 Denmark Offshore Wind Power Market Forecast by Component, 2024-2034 (US$ Billion, AGR %)
Figure 58 Denmark Offshore Wind Power Market Share Forecast by Component, 2024 & 2034 (%)
Figure 59 Denmark Offshore Wind Power Market Forecast, 2024-2034 (US$ Billion, AGR %)
Figure 60 Belgium Offshore Wind Power Market Forecast by Location, 2024-2034 (US$ Billion, AGR %)
Figure 61 Belgium Offshore Wind Power Market Share Forecast by Location, 2024 & 2034 (%)
Figure 62 Belgium Offshore Wind Power Market Forecast by Component, 2024-2034 (US$ Billion, AGR %)
Figure 63 Belgium Offshore Wind Power Market Share Forecast by Component, 2024 & 2034 (%)
Figure 64 Belgium Offshore Wind Power Market Forecast, 2024-2034 (US$ Billion, AGR %)
Figure 65 France Offshore Wind Power Market Forecast by Location, 2024-2034 (US$ Billion, AGR %)
Figure 66 France Offshore Wind Power Market Share Forecast by Location, 2024 & 2034 (%)
Figure 67 France Offshore Wind Power Market Forecast by Component, 2024-2034 (US$ Billion, AGR %)
Figure 68 France Offshore Wind Power Market Share Forecast by Component, 2024 & 2034 (%)
Figure 69 France Offshore Wind Power Market Forecast, 2024-2034 (US$ Billion, AGR %)
Figure 70 Vietnam Offshore Wind Power Market Forecast by Location, 2024-2034 (US$ Billion, AGR %)
Figure 71 Vietnam Offshore Wind Power Market Share Forecast by Location, 2024 & 2034 (%)
Figure 72 Vietnam Offshore Wind Power Market Forecast by Component, 2024-2034 (US$ Billion, AGR %)
Figure 73 Vietnam Offshore Wind Power Market Share Forecast by Component, 2024 & 2034 (%)
Figure 74 Vietnam Offshore Wind Power Market Forecast, 2024-2034 (US$ Billion, AGR %)
Figure 75 Taiwan Offshore Wind Power Market Forecast by Location, 2024-2034 (US$ Billion, AGR %)
Figure 76 Taiwan Offshore Wind Power Market Share Forecast by Location, 2024 & 2034 (%)
Figure 77 Taiwan Offshore Wind Power Market Forecast by Component, 2024-2034 (US$ Billion, AGR %)
Figure 78 Taiwan Offshore Wind Power Market Share Forecast by Component, 2024 & 2034 (%)
Figure 79 Taiwan Offshore Wind Power Market Forecast, 2024-2034 (US$ Billion, AGR %)
Figure 80 Japan Offshore Wind Power Market Forecast by Location, 2024-2034 (US$ Billion, AGR %)
Figure 81 Japan Offshore Wind Power Market Share Forecast by Location, 2024 & 2034 (%)
Figure 82 Japan Offshore Wind Power Market Forecast by Component, 2024-2034 (US$ Billion, AGR %)
Figure 83 Japan Offshore Wind Power Market Share Forecast by Component, 2024 & 2034 (%)
Figure 84 Japan Offshore Wind Power Market Forecast, 2024-2034 (US$ Billion, AGR %)
Figure 85 Sweden Offshore Wind Power Market Forecast by Location, 2024-2034 (US$ Billion, AGR %)
Figure 86 Sweden Offshore Wind Power Market Share Forecast by Location, 2024 & 2034 (%)
Figure 87 Sweden Offshore Wind Power Market Forecast by Component, 2024-2034 (US$ Billion, AGR %)
Figure 88 Sweden Offshore Wind Power Market Share Forecast by Component, 2024 & 2034 (%)
Figure 89 Sweden Offshore Wind Power Market Forecast, 2024-2034 (US$ Billion, AGR %)
Figure 90 South Korea Offshore Wind Power Market Forecast by Location, 2024-2034 (US$ Billion, AGR %)
Figure 91 South Korea Offshore Wind Power Market Share Forecast by Location, 2024 & 2034 (%)
Figure 92 South Korea Offshore Wind Power Market Forecast by Component, 2024-2034 (US$ Billion, AGR %)
Figure 93 South Korea Offshore Wind Power Market Share Forecast by Component, 2024 & 2034 (%)
Figure 94 South Korea Offshore Wind Power Market Forecast, 2024-2034 (US$ Billion, AGR %)
Figure 95 Finland Offshore Wind Power Market Forecast by Location, 2024-2034 (US$ Billion, AGR %)
Figure 96 Finland Offshore Wind Power Market Share Forecast by Location, 2024 & 2034 (%)
Figure 97 Finland Offshore Wind Power Market Forecast by Component, 2024-2034 (US$ Billion, AGR %)
Figure 98 Finland Offshore Wind Power Market Share Forecast by Component, 2024 & 2034 (%)
Figure 99 Finland Offshore Wind Power Market Forecast, 2024-2034 (US$ Billion, AGR %)
Figure 100 USA Offshore Wind Power Market Forecast by Location, 2024-2034 (US$ Billion, AGR %)
Figure 101 USA Offshore Wind Power Market Share Forecast by Location, 2024 & 2034 (%)
Figure 102 USA Offshore Wind Power Market Forecast by Component, 2024-2034 (US$ Billion, AGR %)
Figure 103 USA Offshore Wind Power Market Share Forecast by Component, 2024 & 2034 (%)
Figure 104 USA Offshore Wind Power Market Forecast, 2024-2034 (US$ Billion, AGR %)
Figure 105 Italy Offshore Wind Power Market Forecast by Location, 2024-2034 (US$ Billion, AGR %)
Figure 106 Italy Offshore Wind Power Market Share Forecast by Location, 2024 & 2034 (%)
Figure 107 Italy Offshore Wind Power Market Forecast by Component, 2024-2034 (US$ Billion, AGR %)
Figure 108 Italy Offshore Wind Power Market Share Forecast by Component, 2024 & 2034 (%)
Figure 109 Italy Offshore Wind Power Market Forecast, 2024-2034 (US$ Billion, AGR %)
Figure 110 Rest of the World Offshore Wind Power Market Forecast by Location, 2024-2034 (US$ Billion, AGR %)
Figure 111 Rest of the World Offshore Wind Power Market Share Forecast by Location, 2024 & 2034 (%)
Figure 112 Rest of the World Offshore Wind Power Market Forecast by Component, 2024-2034 (US$ Billion, AGR %)
Figure 113 Rest of the World Offshore Wind Power Market Share Forecast by Component, 2024 & 2034 (%)
Figure 114 Rest of the World Offshore Wind Power Market Forecast, 2024-2034 (US$ Billion, AGR %)
Figure 115 General Electric Company: Net Revenue, 2018-2022 (US$ Million, AGR%)
Figure 116 General Electric Company: Gross Profit, 2018-2022 (US$ Million, AGR%)
Figure 117 General Electric Company: Operating Income, 2018-2022 (US$ Million, AGR%)
Figure 118 General Electric Company: Net Income, 2018-2022 (US$ Million, AGR%)
Figure 119 General Electric Company: Regional Revenue, 2022
Figure 120 General Electric Company: Segment Revenue, 2022
Figure 121 Vestas: Net Revenue, 2018-2022 (US$ Million, AGR%)
Figure 122 Vestas: Gross Profit, 2018-2022 (US$ Million, AGR%)
Figure 123 Vestas: R&D Expense, 2018-2022 (US$ Million, AGR%)
Figure 124 ABB: Net Revenue, 2018-2022 (US$ Million, AGR%)
Figure 125 ABB: Regional Market Shares, 2022
Figure 126 ABB: Segment Market Shares, 2022
Figure 127 Goldwind: Net Revenue, 2018-2022 (US$ Million, AGR%)
Figure 128 Goldwind: Segment Market Shares, 2022
Figure 129 Nordex SE: Net Revenue, 2018-2022 (US$ Million, AGR%)
Figure 130 Nordex SE: Regional Market Shares, 2022
Figure 131 Nordex SE: Segment Market Shares, 2022
Figure 132 Nexans: Net Revenue, 2018-2022 (US$ Million, AGR%)
Figure 133 Nexans: Regional Market Shares, 2022
Figure 134 Nexans: Segment Market Shares, 2022
Figure 135 Shanghai Electric: Net Revenue, 2018-2022 (US$ Million, AGR%)
Figure 136 Shanghai Electric: Segment Market Shares, 2022
ページTOPに戻る
よくあるご質問
Visiongain社はどのような調査会社ですか?
英国の調査会社ヴィジョンゲイン社(Visiongain)は、通信とエネルギーのほか、自動車や化学・医薬品、金属など、広範な市場を対象に調査を行っています。自動車市場については、市場全般に関する調査のほ... もっと見る
調査レポートの納品までの日数はどの程度ですか?
在庫のあるものは速納となりますが、平均的には 3-4日と見て下さい。
但し、一部の調査レポートでは、発注を受けた段階で内容更新をして納品をする場合もあります。
発注をする前のお問合せをお願いします。
注文の手続きはどのようになっていますか?
1)お客様からの御問い合わせをいただきます。
2)見積書やサンプルの提示をいたします。
3)お客様指定、もしくは弊社の発注書をメール添付にて発送してください。
4)データリソース社からレポート発行元の調査会社へ納品手配します。
5) 調査会社からお客様へ納品されます。最近は、pdfにてのメール納品が大半です。
お支払方法の方法はどのようになっていますか?
納品と同時にデータリソース社よりお客様へ請求書(必要に応じて納品書も)を発送いたします。
お客様よりデータリソース社へ(通常は円払い)の御振り込みをお願いします。
請求書は、納品日の日付で発行しますので、翌月最終営業日までの当社指定口座への振込みをお願いします。振込み手数料は御社負担にてお願いします。
お客様の御支払い条件が60日以上の場合は御相談ください。
尚、初めてのお取引先や個人の場合、前払いをお願いすることもあります。ご了承のほど、お願いします。
データリソース社はどのような会社ですか?
当社は、世界各国の主要調査会社・レポート出版社と提携し、世界各国の市場調査レポートや技術動向レポートなどを日本国内の企業・公官庁及び教育研究機関に提供しております。
世界各国の「市場・技術・法規制などの」実情を調査・収集される時には、データリソース社にご相談ください。
お客様の御要望にあったデータや情報を抽出する為のレポート紹介や調査のアドバイスも致します。
|
|

