3D細胞培養と3Dバイオプリンティング市場レポート:2023-2033
3D Cell Culture and 3D Bioprinting Market Report 2023-2033
レポート詳細
3D細胞培養と3Dバイオプリンティング市場レポート 2023-2033 : 本レポートは、業界とその基礎となる原動力をよりよく理解したい場合、新たな収益ポケットを目指す大手企業にとって貴重... もっと見る
※上記価格は部署ライセンス(Departmental licence)価格です。
その他の価格についてはデータリソースまでお問合せください。
日本語のページは自動翻訳を利用し作成しています。
実際のレポートは英文のみでご納品いたします。

|

|
サマリー
レポート詳細
3D細胞培養と3Dバイオプリンティング市場レポート 2023-2033: 本レポートは、業界とその基礎となる原動力をよりよく理解したい場合、新たな収益ポケットを目指す大手企業にとって貴重なものとなるでしょう。異業種への進出や新規地域での既存事業の拡大を目指す企業にも有用です。
ベンチサイドとベッドサイドのギャップを埋める
3D細胞培養とバイオプリンティング技術の臨床応用は急成長しており、患者中心のヘルスケアソリューションの新時代の到来を告げている。移植可能な組織、人工臓器、パーソナライズされた移植片は、外科手術に革命をもたらし、より安全で効果的な介入を提供する。さらに、これらの技術は、がん、神経変性疾患、心血管疾患など、さまざまな疾患の研究・治療に計り知れない可能性を秘めている。規制機関がこうした革新的なアプローチをますます受け入れるようになっていることから、市場は臨床分野で大きく成長する素地が整っている。
ヘルスケアと製薬の枠を超える
ヘルスケアと製薬業界が3D細胞培養とバイオプリンティング市場の主な牽引役である一方、補助的なセクターも大きな利益を得る態勢を整えている。例えば、化粧品・スキンケア業界は、3D皮膚モデルを有効性テストに活用しており、より安全で効果的な製品の開発を可能にしている。さらに、食品・飲料業界では、培養肉生産における3Dバイオプリンティングの可能性を探っており、従来の畜産に代わる持続可能な選択肢を提供している。このように用途が多様化することで、市場規模が拡大し、関係者に新たな収益の道が開かれることになる。
市場調査レポートを購入する前にすべき質問とは?
- 3D細胞培養と3Dバイオプリンティング市場はどのように進化しているのか?
- 3D細胞培養・3Dバイオプリンティング市場の推進要因と抑制要因は何か?
- 3D細胞培養および3Dバイオプリンティングの各サブ市場セグメントは予測期間中にどのように成長し、2033年にこれらのサブ市場が占める売上はいくらになるのか?
- 2023年から2033年にかけて、3D細胞培養と3Dバイオプリンティングの各サブマーケットの市場シェアはどのように推移するのか?
- 2023年から2033年にかけて、市場全体の主な牽引役は何になるのか?
- 主要な3D細胞培養・3Dバイオプリンティング市場はマクロ経済の動きに大枠で追随するのか、それとも個々の国内市場が他を凌駕するのか?
- 2033年までに各国市場のシェアはどのように変化し、2033年に市場をリードするのはどの地域か?
- 主要プレイヤーは誰で、予測期間中の見通しは?
- これらの主要企業の3D細胞培養および3Dバイオプリンティング事業は何か?
- 2023年から2033年の間に、業界はどのように進化するのか?また
3D細胞培養と3Dバイオプリンティングのプロジェクトは現在、そして今後10年間にどのような意味を持つのか?
- 3D細胞培養と3Dバイオプリンティング市場をさらに拡大するために、製品の商業化の必要性は高まっていますか?
- 3D細胞培養と3Dバイオプリンティング市場はどこに向かっているのか、そしてどのようにすれば市場の最前線に立てるのか?
- 新製品やサービスラインに対する最適な投資オプションは何か?
- 企業を新たな成長軌道に乗せ、C-suiteに移行させるための重要な展望とは?
このことが3D細胞培養と3Dバイオプリンティング市場に現在、そして今後10年間でどのような影響を与えるかを見極める必要がある:
- 243ページにわたる本レポートでは、98の表と133の図表を掲載しています。
- 本レポートは、業界における主要な有利分野にハイライトを当てているため、今すぐターゲットを絞ることができます。
- 世界、地域、国の売上と成長に関する詳細な分析が含まれています。
- 競合他社が成功した主なトレンド、変化、収益予測をハイライトしています。
本レポートは、3D細胞培養と3Dバイオプリンティング市場が今後10年間にどのように発展するか、またCOVID-19の景気後退と好転の変動に合わせてどのように発展するかをお伝えします。この市場は、過去10年間のどの時点よりも今が重要である。
2033年までの予測やその他の分析から、商業的な展望が明らかになる
- 2033年までの収益予測に加え、直近の業績、成長率、市場シェアもご覧いただけます。
- ビジネスの展望と展開に関する独自の分析をご覧いただけます。
- 定性的分析(市場ダイナミクス、促進要因、機会、阻害要因など)、ポーターのファイブフォース分析、PEST分析、最近の動向をご覧いただけます。
本レポートには、COVID-19が業界と貴社にどのような影響を与えるかについてのデータ分析と貴重な洞察が含まれている。本レポートでは、COVID-19の4つの回収パターンとその影響、すなわち「V」、「L」、「W」、「U」について論じている。
レポート対象セグメント
技術
- 足場ベース
- スキャフォールドフリー
- マイクロ流体ベース
- 磁気浮上
- 3Dバイオプリンティング
- その他
用途
- がん・幹細胞研究
- 創薬・毒性試験
- 組織工学・再生医療
エンドユーザー
- 製薬・バイオテクノロジー企業
- 学術機関
- 研究所
- その他
世界市場全体と各分野の収益予測に加え、5つの地域と22の主要国市場の収益予測も掲載している:
北米
- アメリカ
- カナダ
欧州
- ドイツ
- 英国
- フランス
- イタリア
- スペイン
- その他の欧州
アジア太平洋
- 日本
- 中国
- インド
- オーストラリア
- 韓国
- その他のアジア太平洋地域
ラテンアメリカ
- ブラジル
- メキシコ
- その他のラテンアメリカ
MEA
- GCC
- 南アフリカ
- その他のMEA
本レポートでは、3D細胞培養と3Dバイオプリンティング市場の2023年から2033年までの主要企業のプロファイルも掲載している。
主要企業と市場成長の可能性
・ Aspect Biosystems Ltd.
・ CELLINK
・ CN Bio Innovations Ltd.
・ Corning Incorporated
・ CYFUSE BIOMEDICAL K.K.
・ GeSiM
・ InSphero
・ Lonza
・ Merck KGaA
・ Organovo Holdings Inc.
・ REPROCELL Inc.
・ Thermo Fisher Scientific Inc.
・ ENVISIONTEC
3D細胞培養と3Dバイオプリンティング市場の2023年から2033年までの世界全体の売上高は、金額ベースでは2023年に22億米ドルを突破する。2033年まで力強い収益成長を予測。当研究所では、最も大きな可能性を秘めた組織を特定しています。各組織の能力、進捗状況、商業的展望を把握し、一歩先を行くための一助としてください。
3D細胞培養と3Dバイオプリンティング市場、2023年から2033年までのレポートはどのように役立ちますか?
要約すると、240ページを超えるこのレポートは、以下の知識を提供する:
- 3D細胞培養と3Dバイオプリンティング市場の2023年から2033年までの収益予測、技術、用途、エンドユーザーごとの予測を世界と地域レベルで掲載 - 業界の将来性を発見し、投資と収益に最も有利な場所を見つけることができます。
- 5つの地域と22の主要国市場の2033年までの収益予測 - 北米、欧州、アジア太平洋、中南米、MEAの3D細胞培養と3Dバイオプリンティング市場の2023年から2033年までの市場予測をご覧ください。また、米国、カナダ、メキシコ、ブラジル、ドイツ、フランス、英国、イタリア、中国、インド、日本、オーストラリアなどの著名経済圏の市場も予測しています。
- 既存企業および市場参入を目指す企業の展望 - 3D細胞培養および3Dバイオプリンティング市場に関わる主要企業13社の企業プロファイルを含む、2023年から2033年までの市場。
独自の予測による定量的・定性的分析をご覧ください。私たちのレポートだけに含まれる情報を入手し、貴重なビジネスインテリジェンスで情報を得ることができます。
他にはない情報
私たちの新しいレポートがあれば、知識に遅れをとったり、チャンスを逃したりする可能性が低くなります。Visiongainのこの調査レポートは、3D細胞培養と3Dバイオプリンティング市場の2023年から2033年にかけての商業分析を必要とするすべての方々を対象としています。Visiongainの調査は、3D細胞培養と3Dバイオプリンティング市場2023年から2033年、市場をリードする企業の商業分析を必要とするすべての人のためのものです。データ、トレンド、予測をご覧いただけます。
ページTOPに戻る
目次
目次
1 レポート概要
1.1 研究の目的
1.2 3D細胞培養と3Dバイオプリンティング市場の紹介
1.3 本レポートの内容
1.4 本レポートを読むべき理由
1.5 本分析レポートが回答する主な質問は以下の通り
1.6 本レポートの対象者
1.7 方法論
1.7.1 市場の定義
1.7.2 市場評価・予測手法
1.7.3 データの検証
1.7.3.1 一次調査
1.7.3.2 セカンダリーリサーチ
1.8 よくある質問(FAQ)
1.9 Visiongainの関連レポート
1.10 Visiongainについて
2 エグゼクティブ・サマリー
3 市場概要
3.1 主要な調査結果
3.2 市場ダイナミクス
3.2.1 市場促進要因
3.2.1.1 医薬品開発需要の高まり
3.2.1.2 臓器移植のための3Dバイオプリンティング
3.2.1.3 幹細胞研究の増加が市場成長を牽引
3.2.1.4 がん研究における3D細胞培養モデルの利用
3.2.2 市場抑制要因
3.2.2.1 複雑な臓器構造の開発
3.2.2.2 リアルな血管網の開発
3.2.2.3 バイオプリンターの高コストと操作上の制限
3.2.3 市場機会
3.2.3.1 生体適合性と印刷可能なバイオ材料の開発
3.2.3.2 3Dバイオプリンティングの商業化と大量生産の増加
3.2.3.3 有利な成長機会を提供する新製品発表と共同研究の増加
3.2.3.4 3Dバイオプリンティングにおける人工知能の利用
3.3 COVID-19の影響分析
3.4 ポーターのファイブフォース分析
3.4.1 サプライヤーの力
3.4.2 バイヤーパワー
3.4.3 競争ライバル
3.4.4 代替品による脅威
3.4.5 新規参入企業の脅威
3.5 PEST分析
4 3D細胞培養と3Dバイオプリンティング市場分析:技術別
4.1 主要な調査結果
4.2 技術セグメント 市場魅力度指数
4.3 3D細胞培養と3Dバイオプリンティングの技術別市場規模推定と予測
4.4 足場ベース
4.4.1 2023〜2033年の地域別市場予測(US$ Million, AGR %)
4.4.2 地域別市場シェア、2023年・2033年 (%)
4.5 無足場
4.5.1 2023~2033年の地域別市場予測(US$ Million, AGR %)
4.5.2 地域別市場シェア、2023年・2033年 (%)
4.6 マイクロ流体ベース
4.6.1 2023~2033年の地域別市場予測(US$ Million, AGR %)
4.6.2 地域別市場シェア、2023年・2033年 (%)
4.7 磁気浮上
4.7.1 2023~2033年の地域別市場展望(US$ Million, AGR %)
4.7.2 地域別市場シェア、2023年・2033年 (%)
4.8 3Dバイオプリンティング
4.8.1 2023~2033年の地域別市場予測(US$ Million, AGR %)
4.8.2 地域別市場シェア、2023年・2033年 (%)
4.9 その他
4.9.1 2023〜2033年の地域別市場予測(US$ Million, AGR %)
4.9.2 地域別市場シェア、2023年・2033年 (%)
5 3D細胞培養と3Dバイオプリンティング市場分析:用途別
5.1 主要な調査結果
5.2 用途セグメント 市場魅力度指数
5.3 3D細胞培養と3Dバイオプリンティングの用途別市場規模推定と予測
5.4 癌・幹細胞研究
5.4.1 2023〜2033年の地域別市場予測(US$ Million, AGR %)
5.4.2 地域別市場シェア、2023年・2033年 (%)
5.5 創薬・毒性試験
5.5.1 2023〜2033年の地域別市場予測(US$ Million, AGR %)
5.5.2 地域別市場シェア、2023年・2033年(%)
5.6 組織工学・再生医療
5.6.1 2023〜2033年の地域別市場予測(US$ Million, AGR %)
5.6.2 地域別市場シェア、2023年・2033年(%)
6 3D細胞培養と3Dバイオプリンティング市場分析:エンドユーザー別
6.1 主要調査結果
6.2 エンドユーザーセグメント: 市場魅力度指数
6.3 3D細胞培養と3Dバイオプリンティングのエンドユーザー別市場規模推定と予測
6.4 製薬・バイオテクノロジー企業
6.4.1 2023-2033年の地域別市場予測(US$ Million, AGR %)
6.4.2 地域別市場シェア、2023年・2033年(%)
6.5 学術機関
6.5.1 2023年~2033年の地域別市場予測(US$ Million, AGR %)
6.5.2 地域別市場シェア、2023年・2033年(%)
6.6 研究所
6.6.1 2023〜2033年の地域別市場予測(US$ Million, AGR %)
6.6.2 地域別市場シェア、2023年・2033年(%)
6.7 その他
6.7.1 2023〜2033年の地域別市場予測(US$ Million, AGR %)
6.7.2 地域別市場シェア、2023年&2033年(%)
7 3D細胞培養と3Dバイオプリンティング市場分析:地域別
7.1 主要な調査結果
7.2 地域別市場規模の推定と予測
8 北米の3D細胞培養と3Dバイオプリンティング市場分析
8.1 主要な調査結果
8.2 北米の3D細胞培養と3Dバイオプリンティング市場魅力度指数
8.3 北米の3D細胞培養と3Dバイオプリンティングの国別市場、2023年、2028年、2033年 (US$ Million)
8.4 北米の3D細胞培養と3Dバイオプリンティング市場規模推定と予測:国別
8.5 北米の3D細胞培養と3Dバイオプリンティング市場規模推定と予測:技術別
8.6 北米の3D細胞培養と3Dバイオプリンティング市場規模推定と予測:用途別
8.7 北米の3D細胞培養と3Dバイオプリンティング市場規模推定と予測:エンドユーザー別
8.8 米国の3D細胞培養と3Dバイオプリンティング市場分析
8.9 カナダの3D細胞培養と3Dバイオプリンティング市場分析
9 欧州の3D細胞培養と3Dバイオプリンティング市場分析
9.1 主要な調査結果
9.2 欧州の3D細胞培養と3Dバイオプリンティング市場魅力度指数
9.3 欧州の3D細胞培養と3Dバイオプリンティングの国別市場、2023年、2028年、2033年 (US$百万)
9.4 欧州の3D細胞培養と3Dバイオプリンティング市場規模推定と予測:国別
9.5 欧州の3D細胞培養と3Dバイオプリンティング市場規模推定と予測:技術別
9.6 欧州の3D細胞培養と3Dバイオプリンティング市場規模推定と予測:用途別
9.7 欧州の3D細胞培養と3Dバイオプリンティング市場規模推定と予測:エンドユーザー別
9.8 ドイツの3D細胞培養と3Dバイオプリンティング市場分析
9.9 イギリスの3D細胞培養と3Dバイオプリンティング市場分析
9.10 フランスの3D細胞培養と3Dバイオプリンティング市場分析
9.11 イタリアの3D細胞培養と3Dバイオプリンティング市場分析
9.12 スペインの3D細胞培養と3Dバイオプリンティング市場分析
9.13 ロシアの3D細胞培養と3Dバイオプリンティング市場分析
9.14 その他の欧州の3D細胞培養と3Dバイオプリンティング市場分析
10 アジア太平洋地域の3D細胞培養と3Dバイオプリンティング市場分析
10.1 主要な調査結果
10.2 アジア太平洋地域の3D細胞培養と3Dバイオプリンティング市場魅力度指数
10.3 アジア太平洋地域の3D細胞培養と3Dバイオプリンティングの国別市場、2023年、2028年、2033年 (US$ Million)
10.4 アジア太平洋地域の3D細胞培養と3Dバイオプリンティング市場規模推定と予測:国別
10.5 アジア太平洋地域の3D細胞培養と3Dバイオプリンティング市場規模推定と予測:技術別
10.6 アジア太平洋地域の3D細胞培養と3Dバイオプリンティング市場規模推定と予測:用途別
10.7 アジア太平洋地域の3D細胞培養と3Dバイオプリンティング市場規模推定と予測:エンドユーザー別
10.8 日本の3D細胞培養と3Dバイオプリンティング市場分析
10.9 中国の3D細胞培養と3Dバイオプリンティング市場分析
10.10 インドの3D細胞培養と3Dバイオプリンティング市場分析
10.11 オーストラリアの3D細胞培養と3Dバイオプリンティング市場分析
10.12 韓国の3D細胞培養と3Dバイオプリンティング市場分析
10.13 東南アジアの3D細胞培養と3Dバイオプリンティング市場分析
10.14 その他のアジア太平洋地域の3D細胞培養と3Dバイオプリンティング市場分析
11 ラテンアメリカの3D細胞培養と3Dバイオプリンティング市場分析
11.1 主要な調査結果
11.2 ラテンアメリカの3D細胞培養と3Dバイオプリンティング市場魅力度指数
11.3 ラテンアメリカの3D細胞培養と3Dバイオプリンティングの国別市場、2023年、2028年、2033年(US$ Million)
11.4 ラテンアメリカの3D細胞培養と3Dバイオプリンティング市場規模推定と予測:国別
11.5 ラテンアメリカの3D細胞培養と3Dバイオプリンティング市場規模推定と予測:技術別
11.6 ラテンアメリカの3D細胞培養と3Dバイオプリンティング市場規模推定と予測:用途別
11.7 ラテンアメリカの3D細胞培養と3Dバイオプリンティング市場規模推定と予測:エンドユーザー別
11.8 ブラジルの3D細胞培養と3Dバイオプリンティング市場分析
11.9 メキシコの3D細胞培養と3Dバイオプリンティング市場分析
11.10 その他のラテンアメリカの3D細胞培養と3Dバイオプリンティング市場分析
12 MEAの3D細胞培養と3Dバイオプリンティング市場分析
12.1 主要な調査結果
12.2 MEAの3D細胞培養と3Dバイオプリンティング市場魅力度指数
12.3 MEAの3D細胞培養と3Dバイオプリンティングの国別市場、2023年、2028年、2033年(US$ Million)
12.4 MEAの3D細胞培養と3Dバイオプリンティング市場規模推定と予測:国別
12.5 MEAの3D細胞培養と3Dバイオプリンティング市場規模推定と予測:技術別
12.6 MEAの3D細胞培養と3Dバイオプリンティング市場規模推定と予測:用途別
12.7 MEAの3D細胞培養と3Dバイオプリンティング市場規模推定と予測:エンドユーザー別
12.8 GCCの3D細胞培養と3Dバイオプリンティング市場分析
12.9 南アフリカの3D細胞培養と3Dバイオプリンティング市場分析
12.10 その他のMEAの3D細胞培養と3Dバイオプリンティング市場分析
13 企業のプロフィール
13.1 3D Biotek LLC
13.1.1 会社概要
13.1.2 会社概要
13.1.3 製品ベンチマーク
13.2 Aspect Biosystems Ltd.
13.2.1 会社概要
13.2.2 会社概要
13.2.3 製品ベンチマーク
13.2.4 戦略的展望
13.3 CELLINK
13.3.1 会社概要
13.3.2 会社概要
13.3.3 製品ベンチマーク
13.3.4 戦略的展望
13.4 CN Bio Innovations Ltd.
13.4.1 会社概要
13.4.2 会社概要
13.4.3 製品ベンチマーク
13.4.4 戦略的展望
13.5 Corning Incorporated
13.5.1 会社概要
13.5.2 会社概要
13.5.3 財務分析
13.5.3.1 純収入、2018-2022年
13.5.3.2 R&D、2018年〜2022年
13.5.4 製品ベンチマーク
13.5.5 戦略的展望
13.6 CYFUSE BIOMEDICAL K.K.
13.6.1 会社概要
13.6.2 会社概要
13.6.3 製品ベンチマーク
13.7 GeSiM
13.7.1 会社概要
13.7.2 会社概要
13.7.3 製品ベンチマーク
13.8 InSphero
13.8.1 会社概要
13.8.2 会社概要
13.8.3 製品ベンチマーク
13.8.4 戦略的展望
13.9 Lonza
13.9.1 会社概要
13.9.2 会社概要
13.9.3 財務分析
13.9.3.1 純収入、2018-2022年
13.9.3.2 地域市場シェア、2022年
13.9.3.3 R&D、2018年〜2022年
13.9.4 製品ベンチマーク
13.10 Merck KGaA
13.10.1 会社概要
13.10.2 会社概要
13.10.3 財務分析
13.10.3.1 純収入、2018年~2022年
13.10.3.2 地域市場シェア、2022年
13.10.3.3 R&D、2018年〜2022年
13.10.4 製品ベンチマーク
13.11 Organovo Holdings Inc.
13.11.1 会社概要
13.11.2 会社概要
13.11.3 製品ベンチマーク
13.11.4 戦略的展望
13.12 REPROCELL Inc.
13.12.1 会社概要
13.12.2 会社概要
13.12.3 製品ベンチマーク
13.13 Thermo Fisher Scientific Inc.
13.13.1 会社概要
13.13.2 会社概要
13.13.3 財務分析
13.13.3.1 純収入、2018-2022年
13.13.3.2 地域市場シェア、2022年
13.13.3.3 R&D、2018年〜2022年
13.13.4 製品ベンチマーク
13.14 ENVISIONTEC
13.14.1 会社概要
13.14.2 会社概要
13.14.3 製品ベンチマーク
14 結論と提言
14.1 Visiongainからの結びの言葉
14.2 市場プレイヤーへの提言
ページTOPに戻る
図表リスト
表の一覧
Table 1 3D Cell Culture and 3D Bioprinting Market Snapshot, 2023 & 2033 (US$ million, CAGR %)
Table 2 3D Cell Culture and 3D Bioprinting Market Forecast by Region, 2023-2033 (US$ Million, AGR%, CAGR%): "V" Shaped Recovery
Table 3 3D Cell Culture and 3D Bioprinting Market Forecast by Region, 2023-2033 (US$ Million, AGR%, CAGR%): "U" Shaped Recovery
Table 4 3D Cell Culture and 3D Bioprinting Market Forecast by Region, 2023-2033 (US$ Million, AGR%, CAGR%): "W" Shaped Recovery
Table 5 3D Cell Culture and 3D Bioprinting Market Forecast by Region, 2023-2033 (US$ Million, AGR%, CAGR%): "L" Shaped Recovery
Table 6 3D Cell Culture and 3D Bioprinting Market Forecast by Technology, 2023-2033 (US$ Million, AGR%, CAGR%)
Table 7 Scaffold-based Segment Market Forecast by Region, 2023-2033 (US$ Million, AGR%, CAGR%)
Table 8 Scaffold-free Segment Market Forecast by Region, 2023-2033 (US$ Million, AGR%, CAGR%)
Table 9 Microfluidics-based Segment Market Forecast by Region, 2023-2033 (US$ Million, AGR%, CAGR%)
Table 10 Magnetic Levitation Segment Market Forecast by Region, 2023-2033 (US$ Million, AGR%, CAGR%)
Table 11 3D Bioprinting Segment Market Forecast by Region, 2023-2033 (US$ Million, AGR%, CAGR%)
Table 12 Others Segment Market Forecast by Region, 2023-2033 (US$ Million, AGR%, CAGR%)
Table 13 3D Cell Culture and 3D Bioprinting Market Forecast by Application, 2023-2033 (US$ Million, AGR%, CAGR%)
Table 14 Cancer and Stem Cell Research Segment Market Forecast by Region, 2023-2033 (US$ Million, AGR%, CAGR%)
Table 15 Drug Discovery and Toxicology Testing Segment Market Forecast by Region, 2023-2033 (US$ Million, AGR%, CAGR%)
Table 16 Tissue Engineering and Regenerative Medicine Segment Market Forecast by Region, 2023-2033 (US$ Million, AGR%, CAGR%)
Table 17 3D Cell Culture and 3D Bioprinting Market Forecast by End-users, 2023-2033 (US$ Million, AGR%, CAGR%)
Table 18 Pharmaceutical & Biotechnology Companies Segment Market Forecast by Region, 2023-2033 (US$ Million, AGR%, CAGR%)
Table 19 Academic Institutes Segment Market Forecast by Region, 2023-2033 (US$ Million, AGR%, CAGR%)
Table 20 Research Laboratories Segment Market Forecast by Region, 2023-2033 (US$ Million, AGR%, CAGR%)
Table 21 Others Segment Market Forecast by Region, 2023-2033 (US$ Million, AGR%, CAGR%)
Table 22 3D Cell Culture and 3D Bioprinting Market Forecast by Region, 2023-2033 (US$ Million, AGR%, CAGR%)
Table 23 North America 3D Cell Culture and 3D Bioprinting Market Forecast by Country, 2023-2033 (US$ Million, AGR%, CAGR%)
Table 24 North America 3D Cell Culture and 3D Bioprinting Market Forecast by Technology, 2023-2033 (US$ Million, AGR%, CAGR%)
Table 25 North America 3D Cell Culture and 3D Bioprinting Market Forecast by Application, 2023-2033 (US$ Million, AGR%, CAGR%)
Table 26 North America 3D Cell Culture and 3D Bioprinting Market Forecast by End-users, 2023-2033 (US$ Million, AGR%, CAGR%)
Table 27 U.S. 3D Cell Culture and 3D Bioprinting Market Forecast, 2023-2033 (US$ Million, AGR%, CAGR%)
Table 28 Canada 3D Cell Culture and 3D Bioprinting Market Forecast, 2023-2033 (US$ Million, AGR%, CAGR%)
Table 29 Europe 3D Cell Culture and 3D Bioprinting Market Forecast by Country, 2023-2033 (US$ Million, AGR%, CAGR%)
Table 30 Europe 3D Cell Culture and 3D Bioprinting Market Forecast by Technology, 2023-2033 (US$ Million, AGR%, CAGR%)
Table 31 Europe 3D Cell Culture and 3D Bioprinting Market Forecast by Application, 2023-2033 (US$ Million, AGR%, CAGR%)
Table 32 Europe 3D Cell Culture and 3D Bioprinting Market Forecast by End-users, 2023-2033 (US$ Million, AGR%, CAGR%)
Table 33 Germany 3D Cell Culture and 3D Bioprinting Market Forecast, 2023-2033 (US$ Million, AGR%, CAGR%)
Table 34 UK 3D Cell Culture and 3D Bioprinting Market Forecast, 2023-2033 (US$ Million, AGR%, CAGR%)
Table 35 France 3D Cell Culture and 3D Bioprinting Market Forecast, 2023-2033 (US$ Million, AGR%, CAGR%)
Table 36 Italy 3D Cell Culture and 3D Bioprinting Market Forecast, 2023-2033 (US$ Million, AGR%, CAGR%)
Table 37 Spain 3D Cell Culture and 3D Bioprinting Market Forecast, 2023-2033 (US$ Million, AGR%, CAGR%)
Table 38 Russia 3D Cell Culture and 3D Bioprinting Market Forecast, 2023-2033 (US$ Million, AGR%, CAGR%)
Table 39 Rest of Europe 3D Cell Culture and 3D Bioprinting Market Forecast, 2023-2033 (US$ Million, AGR%, CAGR%)
Table 40 Asia Pacific 3D Cell Culture and 3D Bioprinting Market Forecast by Country, 2023-2033 (US$ Million, AGR%, CAGR%)
Table 41 Asia Pacific 3D Cell Culture and 3D Bioprinting Market Forecast by Application, 2023-2033 (US$ Million, AGR%, CAGR%)
Table 42 Asia Pacific 3D Cell Culture and 3D Bioprinting Market Forecast by Application, 2023-2033 (US$ Million, AGR%, CAGR%)
Table 43 Asia Pacific 3D Cell Culture and 3D Bioprinting Market Forecast by End-users, 2023-2033 (US$ Million, AGR%, CAGR%)
Table 44 Japan 3D Cell Culture and 3D Bioprinting Market Forecast, 2023-2033 (US$ Million, AGR%, CAGR%)
Table 45 China 3D Cell Culture and 3D Bioprinting Market Forecast, 2023-2033 (US$ Million, AGR%, CAGR%)
Table 46 India 3D Cell Culture and 3D Bioprinting Market Forecast, 2023-2033 (US$ Million, AGR%, CAGR%)
Table 47 Australia 3D Cell Culture and 3D Bioprinting Market Forecast, 2023-2033 (US$ Million, AGR%, CAGR%)
Table 48 South Korea 3D Cell Culture and 3D Bioprinting Market Forecast, 2023-2033 (US$ Million, AGR%, CAGR%)
Table 49 South-East Asia 3D Cell Culture and 3D Bioprinting Market Forecast, 2023-2033 (US$ Million, AGR%, CAGR%)
Table 50 Rest of Asia Pacific 3D Cell Culture and 3D Bioprinting Market Forecast, 2023-2033 (US$ Million, AGR%, CAGR%)
Table 51 Latin America 3D Cell Culture and 3D Bioprinting Market Forecast by Country, 2023-2033 (US$ Million, AGR%, CAGR%)
Table 52 Latin America 3D Cell Culture and 3D Bioprinting Market Forecast by Technology, 2023-2033 (US$ Million, AGR%, CAGR%)
Table 53 Latin America 3D Cell Culture and 3D Bioprinting Market Forecast by Application, 2023-2033 (US$ Million, AGR%, CAGR%)
Table 54 Latin America 3D Cell Culture and 3D Bioprinting Market Forecast by End-users, 2023-2033 (US$ Million, AGR%, CAGR%)
Table 55 Brazil 3D Cell Culture and 3D Bioprinting Market Forecast, 2023-2033 (US$ Million, AGR%, CAGR%)
Table 56 Mexico 3D Cell Culture and 3D Bioprinting Market Forecast, 2023-2033 (US$ Million, AGR%, CAGR%)
Table 57 Rest of Latin America 3D Cell Culture and 3D Bioprinting Market Forecast, 2023-2033 (US$ Million, AGR%, CAGR%)
Table 58 MEA 3D Cell Culture and 3D Bioprinting Market Forecast by Country, 2023-2033 (US$ Million, AGR%, CAGR%)
Table 59 MEA 3D Cell Culture and 3D Bioprinting Market Forecast by Technology, 2023-2033 (US$ Million, AGR%, CAGR%)
Table 60 MEA 3D Cell Culture and 3D Bioprinting Market Forecast by Application, 2023-2033 (US$ Million, AGR%, CAGR%)
Table 61 MEA 3D Cell Culture and 3D Bioprinting Market Forecast by End-users, 2023-2033 (US$ Million, AGR%, CAGR%)
Table 62 GCC 3D Cell Culture and 3D Bioprinting Market Forecast, 2023-2033 (US$ Million, AGR%, CAGR%)
Table 63 South Africa 3D Cell Culture and 3D Bioprinting Market Forecast, 2023-2033 (US$ Million, AGR%, CAGR%)
Table 64 Rest of MEA 3D Cell Culture and 3D Bioprinting Market Forecast, 2023-2033 (US$ Million, AGR%, CAGR%)
Table 65 3D Biotek LLC: Key Details, (CEO, HQ, Revenue, Founded, No. of Employees, Company Type, Website, Business Segment)
Table 66 3D Biotek LLC: Product Benchmarking
Table 67 Aspect Biosystems Ltd.: Key Details, (CEO, HQ, Revenue, Founded, No. of Employees, Company Type, Website, Business Segment)
Table 68 Aspect Biosystems Ltd.: Product Benchmarking
Table 69 Aspect Biosystems Ltd.: Strategic Outlook
Table 70 CELLINK: Key Details, (CEO, HQ, Revenue, Founded, No. of Employees, Company Type, Website, Business Segment)
Table 71 CELLINK: Product Benchmarking
Table 72 CELLINK: Strategic Outlook
Table 73 CN Bio Innovations Ltd.: Key Details, (CEO, HQ, Revenue, Founded, No. of Employees, Company Type, Website, Business Segment)
Table 74 CN Bio Innovations Ltd.: Product Benchmarking
Table 75 CN Bio Innovations Ltd.: Strategic Outlook
Table 76 Corning Incorporated: Key Details, (CEO, HQ, Revenue, Founded, No. of Employees, Company Type, Website, Business Segment)
Table 77 Corning Incorporated: Product Benchmarking
Table 78 Corning Incorporated: Strategic Outlook
Table 79 CYFUSE BIOMEDICAL K.K.: Key Details, (CEO, HQ, Revenue, Founded, No. of Employees, Company Type, Website, Business Segment)
Table 80 CYFUSE BIOMEDICAL K.K.: Product Benchmarking
Table 81 GeSiM: Key Details, (CEO, HQ, Revenue, Founded, No. of Employees, Company Type, Website, Business Segment)
Table 82 GeSiM: Product Benchmarking
Table 83 InSphero: Key Details, (CEO, HQ, Revenue, Founded, No. of Employees, Company Type, Website, Business Segment)
Table 84 InSphero: Product Benchmarking
Table 85 InSphero: Strategic Outlook
Table 86 Lonza: Key Details, (CEO, HQ, Revenue, Founded, No. of Employees, Company Type, Website, Business Segment)
Table 87 Lonza: Product Benchmarking
Table 88 Merck KGaA: Key Details, (CEO, HQ, Revenue, Founded, No. of Employees, Company Type, Website, Business Segment)
Table 89 Merck KGaA: Product Benchmarking
Table 90 Organovo Holdings Inc.: Key Details, (CEO, HQ, Revenue, Founded, No. of Employees, Company Type, Website, Business Segment)
Table 91 Organovo Holdings Inc.: Product Benchmarking
Table 92 Organovo Holdings Inc.: Strategic Outlook
Table 93 REPROCELL Inc.: Key Details, (CEO, HQ, Revenue, Founded, No. of Employees, Company Type, Website, Business Segment)
Table 94 REPROCELL Inc.: Product Benchmarking
Table 95 Thermo Fisher Scientific Inc.: Key Details, (CEO, HQ, Revenue, Founded, No. of Employees, Company Type, Website, Business Segment)
Table 96 Thermo Fisher Scientific Inc.: Product Benchmarking
Table 97 ENVISIONTEC: Key Details, (CEO, HQ, Revenue, Founded, No. of Employees, Company Type, Website, Business Segment)
Table 98 ENVISIONTEC: Product Benchmarking
図の一覧
Figure 1 3D Cell Culture and 3D Bioprinting Market Segmentation
Figure 2 3D Cell Culture and 3D Bioprinting Market by Technology: Market Attractiveness Index
Figure 3 3D Cell Culture and 3D Bioprinting Market by Application: Market Attractiveness Index
Figure 4 3D Cell Culture and 3D Bioprinting Market by End-users: Market Attractiveness Index
Figure 5 3D Cell Culture and 3D Bioprinting Market Attractiveness Index by Region
Figure 6 3D Cell Culture and 3D Bioprinting Market: Market Dynamics
Figure 7 3D Cell Culture and 3D Bioprinting Market by Region, 2023-2033 (US$ Million, AGR %): “V” Shaped Recovery
Figure 8 3D Cell Culture and 3D Bioprinting Market by Region, 2023-2033 (US$ Million, AGR %): “U” Shaped Recovery
Figure 9 3D Cell Culture and 3D Bioprinting Market by Region, 2023-2033 (US$ Million, AGR %): “W” Shaped Recovery
Figure 10 3D Cell Culture and 3D Bioprinting Market by Region, 2023-2033 (US$ Million, AGR %): “L” Shaped Recovery
Figure 11 3D Cell Culture and 3D Bioprinting Market: Porter’s Five Forces Analysis
Figure 12 3D Cell Culture and 3D Bioprinting Market: PEST Analysis
Figure 13 3D Cell Culture and 3D Bioprinting Market Attractiveness Index by Technology
Figure 14 3D Cell Culture and 3D Bioprinting Market Forecast by Technology, 2023-2033 (US$ Million, AGR %)
Figure 15 3D Cell Culture and 3D Bioprinting Market Share Forecast by Technology, 2023, 2028, 2033 (%)
Figure 16 Scaffold-based Segment Market Forecast by Region, 2023-2033 (US$ Million, AGR %)
Figure 17 Scaffold-based Segment Market Share Forecast by Region, 2023 & 2033 (%)
Figure 18 Scaffold-free Segment Market Forecast by Region, 2023-2033 (US$ Million, AGR %)
Figure 19 Scaffold-free Segment Market Share Forecast by Region, 2023 & 2033 (%)
Figure 20 Microfluidics-based Segment Market Forecast by Region, 2023-2033 (US$ Million, AGR %)
Figure 21 Microfluidics-based Segment Market Share Forecast by Region, 2023 & 2033 (%)
Figure 22 Magnetic Levitation Segment Market Forecast by Region, 2023-2033 (US$ Million, AGR %)
Figure 23 Magnetic Levitation Segment Market Share Forecast by Region, 2023 & 2033 (%)
Figure 24 3D Bioprinting Segment Market Forecast by Region, 2023-2033 (US$ Million, AGR %)
Figure 25 3D Bioprinting Segment Market Share Forecast by Region, 2023 & 2033 (%)
Figure 26 Others Segment Market Forecast by Region, 2023-2033 (US$ Million, AGR %)
Figure 27 Others Segment Market Share Forecast by Region, 2023 & 2033 (%)
Figure 28 3D Cell Culture and 3D Bioprinting Market Attractiveness Index by Technology
Figure 29 3D Cell Culture and 3D Bioprinting Market Forecast by Application, 2023-2033 (US$ Million, AGR %)
Figure 30 3D Cell Culture and 3D Bioprinting Market Share Forecast by Application, 2023, 2028, 2033 (%)
Figure 31 Cancer and Stem Cell Research Segment Market Forecast by Region, 2023-2033 (US$ Million, AGR %)
Figure 32 Cancer and Stem Cell Research Segment Market Share Forecast by Region, 2023 & 2033 (%)
Figure 33 Drug Discovery and Toxicology Testing Segment Market Forecast by Region, 2023-2033 (US$ Million, AGR %)
Figure 34 Drug Discovery and Toxicology Testing Segment Market Share Forecast by Region, 2023 & 2033 (%)
Figure 35 Tissue Engineering and Regenerative Medicine Segment Market Forecast by Region, 2023-2033 (US$ Million, AGR %)
Figure 36 Tissue Engineering and Regenerative Medicine Segment Market Share Forecast by Region, 2023 & 2033 (%)
Figure 37 3D Cell Culture and 3D Bioprinting Market Attractiveness Index by End-users
Figure 38 3D Cell Culture and 3D Bioprinting Market Forecast by End-users, 2023-2033 (US$ Million, AGR %)
Figure 39 3D Cell Culture and 3D Bioprinting Market Share Forecast by End-users, 2023, 2028, 2033 (%)
Figure 40 Pharmaceutical & Biotechnology Companies Segment Market Forecast by Region, 2023-2033 (US$ Million, AGR %)
Figure 41 Pharmaceutical & Biotechnology Companies Segment Market Share Forecast by Region, 2023 & 2033 (%)
Figure 42 Academic Institutes Segment Market Forecast by Region, 2023-2033 (US$ Million, AGR %)
Figure 43 Academic Institutes Segment Market Share Forecast by Region, 2023 & 2033 (%)
Figure 44 Research Laboratories Segment Market Forecast by Region, 2023-2033 (US$ Million, AGR %)
Figure 45 Research Laboratories Segment Market Share Forecast by Region, 2023 & 2033 (%)
Figure 46 Others Segment Market Forecast by Region, 2023-2033 (US$ Million, AGR %)
Figure 47 Others Segment Market Share Forecast by Region, 2023 & 2033 (%)
Figure 48 3D Cell Culture and 3D Bioprinting Market Forecast by Region 2023, 2028, 2033 (Revenue, CAGR%)
Figure 49 3D Cell Culture and 3D Bioprinting Market Share Forecast by Region 2023, 2028, 2033 (%)
Figure 50 3D Cell Culture and 3D Bioprinting Market by Region, 2023-2033 (US$ Mn)
Figure 51 North America 3D Cell Culture and 3D Bioprinting Market Attractiveness Index
Figure 52 North America 3D Cell Culture and 3D Bioprinting Market by Region, 2023, 2028 & 2033 (US$ million)
Figure 53 North America 3D Cell Culture and 3D Bioprinting Market Forecast by Country, 2023-2033 (US$ million)
Figure 54 North America 3D Cell Culture and 3D Bioprinting Market Share Forecast by Country, 2023 & 2033 (%)
Figure 55 North America 3D Cell Culture and 3D Bioprinting Market Forecast by Technology, 2023-2033 (US$ Million, AGR %)
Figure 56 North America 3D Cell Culture and 3D Bioprinting Market Share Forecast by Technology, 2023 & 2033 (%)
Figure 57 North America 3D Cell Culture and 3D Bioprinting Market Forecast by Application, 2023-2033 (US$ Million, AGR %)
Figure 58 North America 3D Cell Culture and 3D Bioprinting Market Share Forecast by Application, 2023 & 2033 (%)
Figure 59 North America 3D Cell Culture and 3D Bioprinting Market Forecast by End-users, 2023-2033 (US$ Million, AGR %)
Figure 60 North America 3D Cell Culture and 3D Bioprinting Market Share Forecast by End-users, 2023 & 2033 (%)
Figure 61 U.S. 3D Cell Culture and 3D Bioprinting Market Forecast, 2023-2033 (US$ Million, AGR %)
Figure 62 Canada 3D Cell Culture and 3D Bioprinting Market Forecast, 2023-2033 (US$ Million, AGR %)
Figure 63 Europe 3D Cell Culture and 3D Bioprinting Market Attractiveness Index
Figure 64 Europe 3D Cell Culture and 3D Bioprinting Market by Region, 2023, 2028 & 2033 (US$ million)
Figure 65 Europe 3D Cell Culture and 3D Bioprinting Market Forecast by Country, 2023-2033 (US$ million)
Figure 66 Europe 3D Cell Culture and 3D Bioprinting Market Share Forecast by Country, 2023 & 2033 (%)
Figure 67 Europe 3D Cell Culture and 3D Bioprinting Market Forecast by Technology, 2023-2033 (US$ Million, AGR %)
Figure 68 Europe 3D Cell Culture and 3D Bioprinting Market Share Forecast by Technology, 2023 & 2033 (%)
Figure 69 Europe 3D Cell Culture and 3D Bioprinting Market Forecast by Application, 2023-2033 (US$ Million, AGR %)
Figure 70 Europe 3D Cell Culture and 3D Bioprinting Market Share Forecast by Application, 2023 & 2033 (%)
Figure 71 Europe 3D Cell Culture and 3D Bioprinting Market Forecast by End-users, 2023-2033 (US$ Million, AGR %)
Figure 72 Europe 3D Cell Culture and 3D Bioprinting Market Share Forecast by End-users, 2023 & 2033 (%)
Figure 73 Germany 3D Cell Culture and 3D Bioprinting Market Forecast, 2023-2033 (US$ Million, AGR %)
Figure 74 UK 3D Cell Culture and 3D Bioprinting Market Forecast, 2023-2033 (US$ Million, AGR %)
Figure 75 France 3D Cell Culture and 3D Bioprinting Market Forecast, 2023-2033 (US$ Million, AGR %)
Figure 76 Italy 3D Cell Culture and 3D Bioprinting Market Forecast, 2023-2033 (US$ Million, AGR %)
Figure 77 Spain 3D Cell Culture and 3D Bioprinting Market Forecast, 2023-2033 (US$ Million, AGR %)
Figure 78 Russia 3D Cell Culture and 3D Bioprinting Market Forecast, 2023-2033 (US$ Million, AGR %)
Figure 79 Rest of Europe 3D Cell Culture and 3D Bioprinting Market Forecast, 2023-2033 (US$ Million, AGR %)
Figure 80 Asia Pacific 3D Cell Culture and 3D Bioprinting Market Attractiveness Index
Figure 81 Asia Pacific 3D Cell Culture and 3D Bioprinting Market by Region, 2023, 2028 & 2033 (US$ million)
Figure 82 Asia Pacific 3D Cell Culture and 3D Bioprinting Market Forecast by Country, 2023-2033 (US$ million)
Figure 83 Asia Pacific 3D Cell Culture and 3D Bioprinting Market Share Forecast by Country, 2023 & 2033 (%)
Figure 84 Asia Pacific 3D Cell Culture and 3D Bioprinting Market Forecast by Technology, 2023-2033 (US$ Million, AGR %)
Figure 85 Asia Pacific 3D Cell Culture and 3D Bioprinting Market Share Forecast by Technology, 2023 & 2033 (%)
Figure 86 Asia Pacific 3D Cell Culture and 3D Bioprinting Market Forecast by Application, 2023-2033 (US$ Million, AGR %)
Figure 87 Asia Pacific 3D Cell Culture and 3D Bioprinting Market Share Forecast by Application, 2023 & 2033 (%)
Figure 88 Asia Pacific 3D Cell Culture and 3D Bioprinting Market Forecast by End-users, 2023-2033 (US$ Million, AGR %)
Figure 89 Asia Pacific 3D Cell Culture and 3D Bioprinting Market Share Forecast by End-users, 2023 & 2033 (%)
Figure 90 Japan 3D Cell Culture and 3D Bioprinting Market Forecast, 2023-2033 (US$ Million, AGR %)
Figure 91 China 3D Cell Culture and 3D Bioprinting Market Forecast, 2023-2033 (US$ Million, AGR %)
Figure 92 India 3D Cell Culture and 3D Bioprinting Market Forecast, 2023-2033 (US$ Million, AGR %)
Figure 93 Australia 3D Cell Culture and 3D Bioprinting Market Forecast, 2023-2033 (US$ Million, AGR %)
Figure 94 South Korea 3D Cell Culture and 3D Bioprinting Market Forecast, 2023-2033 (US$ Million, AGR %)
Figure 95 South-East Asia 3D Cell Culture and 3D Bioprinting Market Forecast, 2023-2033 (US$ Million, AGR %)
Figure 96 Rest of Asia Pacific 3D Cell Culture and 3D Bioprinting Market Forecast, 2023-2033 (US$ Million, AGR %)
Figure 97 Latin America 3D Cell Culture and 3D Bioprinting Market Attractiveness Index
Figure 98 Latin America 3D Cell Culture and 3D Bioprinting Market by Region, 2023, 2028 & 2033 (US$ million)
Figure 99 Latin America 3D Cell Culture and 3D Bioprinting Market Forecast by Country, 2023-2033 (US$ million)
Figure 100 Latin America 3D Cell Culture and 3D Bioprinting Market Share Forecast by Country, 2023 & 2033 (%)
Figure 101 Latin America 3D Cell Culture and 3D Bioprinting Market Forecast by Technology, 2023-2033 (US$ Million, AGR %)
Figure 102 Latin America 3D Cell Culture and 3D Bioprinting Market Share Forecast by Technology, 2023 & 2033 (%)
Figure 103 Latin America 3D Cell Culture and 3D Bioprinting Market Forecast by Application, 2023-2033 (US$ Million, AGR %)
Figure 104 Latin America 3D Cell Culture and 3D Bioprinting Market Share Forecast by Application, 2023 & 2033 (%)
Figure 105 Latin America 3D Cell Culture and 3D Bioprinting Market Forecast by End-users, 2023-2033 (US$ Million, AGR %)
Figure 106 Latin America 3D Cell Culture and 3D Bioprinting Market Share Forecast by End-users, 2023 & 2033 (%)
Figure 107 Brazil 3D Cell Culture and 3D Bioprinting Market Forecast, 2023-2033 (US$ Million, AGR %)
Figure 108 Mexico 3D Cell Culture and 3D Bioprinting Market Forecast, 2023-2033 (US$ Million, AGR %)
Figure 109 Rest of Latin America 3D Cell Culture and 3D Bioprinting Market Forecast, 2023-2033 (US$ Million, AGR %)
Figure 110 MEA 3D Cell Culture and 3D Bioprinting Market Attractiveness Index
Figure 111 MEA 3D Cell Culture and 3D Bioprinting Market by Region, 2023, 2028 & 2033 (US$ million)
Figure 112 MEA 3D Cell Culture and 3D Bioprinting Market Forecast by Country, 2023-2033 (US$ million)
Figure 113 MEA 3D Cell Culture and 3D Bioprinting Market Share Forecast by Country, 2023 & 2033 (%)
Figure 114 MEA 3D Cell Culture and 3D Bioprinting Market Forecast by Technology, 2023-2033 (US$ Million, AGR %)
Figure 115 MEA 3D Cell Culture and 3D Bioprinting Market Share Forecast by Technology, 2023 & 2033 (%)
Figure 116 MEA 3D Cell Culture and 3D Bioprinting Market Forecast by Application, 2023-2033 (US$ Million, AGR %)
Figure 117 MEA 3D Cell Culture and 3D Bioprinting Market Share Forecast by Application, 2023 & 2033 (%)
Figure 118 MEA 3D Cell Culture and 3D Bioprinting Market Forecast by End-users, 2023-2033 (US$ Million, AGR %)
Figure 119 MEA 3D Cell Culture and 3D Bioprinting Market Share Forecast by End-users, 2023 & 2033 (%)
Figure 120 GCC 3D Cell Culture and 3D Bioprinting Market Forecast, 2023-2033 (US$ Million, AGR %)
Figure 121 South Africa 3D Cell Culture and 3D Bioprinting Market Forecast, 2023-2033 (US$ Million, AGR %)
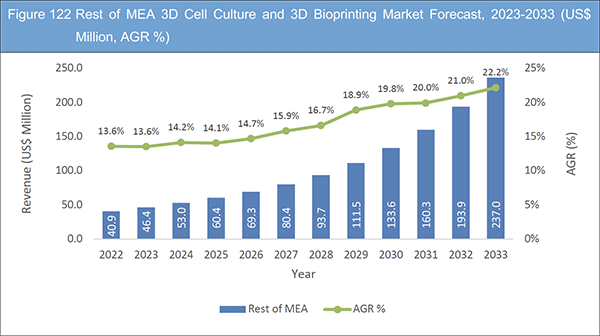
Figure 122 Rest of MEA 3D Cell Culture and 3D Bioprinting Market Forecast, 2023-2033 (US$ Million, AGR %)
Figure 123 Corning Incorporated: Net Revenue, 2018-2022 (US$ million, AGR%)
Figure 124 Corning Incorporated: R&D, 2018-2022 (US$ million, AGR%)
Figure 125 Lonza: Net Revenue, 2018-2022 (US$ million, AGR%)
Figure 126 Lonza: Regional Market Shares (%), 2022
Figure 127 Lonza: R&D, 2018-2022 (US$ million, AGR%)
Figure 128 Merck KGaA: Net Revenue, 2018-2022 (US$ million, AGR%)
Figure 129 Merck KGaA: Regional Market Shares (%), 2022
Figure 130 Merck KGaA: R&D, 2018-2022 (US$ million, AGR%)
Figure 131 Thermo Fisher Scientific Inc.: Net Revenue, 2018-2022 (US$ million, AGR%)
Figure 132 Thermo Fisher Scientific Inc.: Regional Market Shares (%), 2022
Figure 133 Thermo Fisher Scientific Inc.: R&D, 2018-2022 (US$ million, AGR%)
ページTOPに戻る
Summary
Report Details
The 3D Cell Culture and 3D Bioprinting Market Report 2023-2033: This report will prove invaluable to leading firms striving for new revenue pockets if they wish to better understand the industry and its underlying dynamics. It will be useful for companies that would like to expand into different industries or to expand their existing operations in a new region.
Bridging the Gap between Bench and Bedside
The clinical applications of 3D cell culture and bioprinting technologies are burgeoning, heralding a new era of patient-centric healthcare solutions. Implantable tissues, artificial organs, and personalized grafts are poised to revolutionize surgical procedures, offering safer and more effective interventions. Moreover, these technologies hold immense potential for the study and treatment of a wide array of diseases, including cancer, neurodegenerative disorders, and cardiovascular conditions. With regulatory bodies becoming increasingly receptive to these innovative approaches, the market is primed for substantial growth in the clinical sector.
Beyond Healthcare and Pharmaceuticals
While healthcare and pharmaceutical industries are the primary drivers of the 3D cell culture and bioprinting market, ancillary sectors are also poised to reap substantial benefits. The cosmetics and skincare industry, for instance, is capitalizing on 3D skin models for efficacy testing, enabling the development of safer and more effective products. Additionally, the food and beverage sector is exploring the potential of 3D bioprinting in cultured meat production, offering a sustainable alternative to traditional livestock farming. This diversification of applications signifies a broader market reach and opens up new revenue streams for stakeholders.
What Questions Should You Ask before Buying a Market Research Report?
• How is the 3D cell culture and 3D bioprinting market evolving?
• What is driving and restraining the 3D cell culture and 3D bioprinting market?
• How will each 3D cell culture and 3D bioprinting submarket segment grow over the forecast period and how much revenue will these submarkets account for in 2033?
• How will the market shares for each 3D cell culture and 3D bioprinting submarket develop from 2023 to 2033?
• What will be the main driver for the overall market from 2023 to 2033?
• Will leading 3D cell culture and 3D bioprinting markets broadly follow the macroeconomic dynamics, or will individual national markets outperform others?
• How will the market shares of the national markets change by 2033 and which geographical region will lead the market in 2033?
• Who are the leading players and what are their prospects over the forecast period?
• What are the 3D cell culture and 3D bioprinting projects for these leading companies?
• How will the industry evolve during the period between 2023 and 2033? What are the implications of
3D cell culture and 3D bioprinting projects taking place now and over the next 10 years?
• Is there a greater need for product commercialisation to further scale the 3D cell culture and 3D bioprinting market?
• Where is the 3D cell culture and 3D bioprinting market heading and how can you ensure you are at the forefront of the market?
• What are the best investment options for new product and service lines?
• What are the key prospects for moving companies into a new growth path and C-suite?
You need to discover how this will impact the 3D cell culture and 3D bioprinting market today, and over the next 10 years:
• Our 243-page report provides 98 tables and 133 charts/graphs exclusively to you.
• The report highlights key lucrative areas in the industry so you can target them – NOW.
• It contains in-depth analysis of global, regional and national sales and growth.
• It highlights for you the key successful trends, changes and revenue projections made by your competitors.
This report tells you TODAY how the 3D cell culture and 3D bioprinting market will develop in the next 10 years, and in line with the variations in COVID-19 economic recession and bounce. This market is more critical now than at any point over the last 10 years.
Forecasts to 2033 and other analyses reveal commercial prospects
• In addition to revenue forecasting to 2033, our new study provides you with recent results, growth rates, and market shares.
• You will find original analyses, with business outlooks and developments.
• Discover qualitative analyses (including market dynamics, drivers, opportunities, and restraints), Porter’s Five Forces Analysis, PEST Analysis and recent developments.
This report includes data analysis and invaluable insight into how COVID-19 will affect the industry and your company. Four COVID-19 recovery patterns and their impact, namely, “V”, “L”, “W” and “U” are discussed in this report.
Segments Covered in the Report
Technology
• Scaffold-based
• Scaffold-free
• Microfluidics-based
• Magnetic Levitation
• 3D Bioprinting
• Others
Application
• Cancer and Stem Cell Research
• Drug Discovery and Toxicology Testing
• Tissue Engineering and Regenerative Medicine
End-users
• Pharmaceutical & Biotechnology Companies
• Academic Institutes
• Research Laboratories
• Others
In addition to the revenue predictions for the overall world market and segments, you will also find revenue forecasts for five regional and 22 leading national markets:
North America
• U.S.
• Canada
Europe
• Germany
• UK
• France
• Italy
• Spain
• Rest of Europe
Asia Pacific
• Japan
• China
• India
• Australia
• South Korea
• Rest of Asia Pacific
Latin America
• Brazil
• Mexico
• Rest of Latin America
MEA
• GCC
• South Africa
• Rest of MEA
The report also includes profiles and for some of the leading companies in the 3D Cell Culture and 3D Bioprinting Market, 2023 to 2033, with a focus on this segment of these companies’ operations.
Leading companies and the potential for market growth
• Aspect Biosystems Ltd.
• CELLINK
• CN Bio Innovations Ltd.
• Corning Incorporated
• CYFUSE BIOMEDICAL K.K.
• GeSiM
• InSphero
• Lonza
• Merck KGaA
• Organovo Holdings Inc.
• REPROCELL Inc.
• Thermo Fisher Scientific Inc.
• ENVISIONTEC
Overall world revenue for 3D Cell Culture and 3D Bioprinting Market, 2023 to 2033 in terms of value the market will surpass US$2,200 million in 2023, our work calculates. We predict strong revenue growth through to 2033. Our work identifies which organizations hold the greatest potential. Discover their capabilities, progress, and commercial prospects, helping you stay ahead.
How will the 3D Cell Culture and 3D Bioprinting Market, 2023 to 2033 report help you?
In summary, our 240+ page report provides you with the following knowledge:
• Revenue forecasts to 2033 for 3D Cell Culture and 3D Bioprinting Market 2023 to 2033, with forecasts for technology, application, and end-users, each forecast at a global and regional level – discover the industry’s prospects, finding the most lucrative places for investments and revenues.
• Revenue forecasts to 2033 for five regional and 22 key national markets – See forecasts for the 3D Cell Culture and 3D Bioprinting Market, 2023 to 2033 market in North America, Europe, Asia-Pacific, Latin America, and MEA. Also forecasted is the market in the US, Canada, Mexico, Brazil, Germany, France, UK, Italy, China, India, Japan, and Australia among other prominent economies.
• Prospects for established firms and those seeking to enter the market – including company profiles for 13 of the major companies involved in the 3D Cell Culture and 3D Bioprinting Market, 2023 to 2033.
Find quantitative and qualitative analyses with independent predictions. Receive information that only our report contains, staying informed with invaluable business intelligence.
Information found nowhere else
With our new report, you are less likely to fall behind in knowledge or miss out on opportunities. See how our work could benefit your research, analyses, and decisions. Visiongain’s study is for everybody needing commercial analyses for the 3D Cell Culture and 3D Bioprinting Market 2023 to 2033, market-leading companies. You will find data, trends and predictions.
ページTOPに戻る
Table of Contents
Table of Contents
1 Report Overview
1.1 Objectives of the Study
1.2 Introduction to 3D Cell Culture and 3D Bioprinting Market
1.3 What This Report Delivers
1.4 Why You Should Read This Report
1.5 Key Questions Answered by This Analytical Report Include:
1.6 Who is This Report For?
1.7 Methodology
1.7.1 Market Definitions
1.7.2 Market Evaluation & Forecasting Methodology
1.7.3 Data Validation
1.7.3.1 Primary Research
1.7.3.2 Secondary Research
1.8 Frequently Asked Questions (FAQs)
1.9 Associated Visiongain Reports
1.10 About Visiongain
2 Executive Summary
3 Market Overview
3.1 Key Findings
3.2 Market Dynamics
3.2.1 Market Driving Factors
3.2.1.1 Rising Demand for Drug Development
3.2.1.2 3D Bioprinting for Organ Transplanting
3.2.1.3 Rising Stem Cell Research Driving Market Growth
3.2.1.4 Use of 3D Cell Culture Model in Cancer Research
3.2.2 Market Restraining Factors
3.2.2.1 Development of Complex Organ Structures
3.2.2.2 Development of Realistic Vascular Networks
3.2.2.3 High Cost and Operational Limitations of Bioprinters
3.2.3 Market Opportunities
3.2.3.1 Development of Biocompatible and Printable Biomaterials
3.2.3.2 Rising Commercialization and Mass Production in 3D Bioprinting
3.2.3.3 Increase in New Product Launches and Collaborations to Offer Lucrative Growth Opportunities
3.2.3.4 Use of Artificial Intelligence in 3D Bioprinting
3.3 COVID-19 Impact Analysis
3.4 Porter’s Five Forces Analysis
3.4.1 Supplier Power
3.4.2 Buyer Power
3.4.3 Competitive Rivalry
3.4.4 Threat from Substitutes
3.4.5 Threat of New Entrants
3.5 PEST Analysis
4 3D Cell Culture and 3D Bioprinting Market Analysis by Technology
4.1 Key Findings
4.2 Technology Segment: Market Attractiveness Index
4.3 3D Cell Culture and 3D Bioprinting Market Size Estimation and Forecast by Technology
4.4 Scaffold-based
4.4.1 Market Forecast by Region, 2023-2033 (US$ Million, AGR %)
4.4.2 Market Share by Region, 2023 & 2033 (%)
4.5 Scaffold-free
4.5.1 Market Forecast by Region, 2023-2033 (US$ Million, AGR %)
4.5.2 Market Share by Region, 2023 & 2033 (%)
4.6 Microfluidics-based
4.6.1 Market Forecast by Region, 2023-2033 (US$ Million, AGR %)
4.6.2 Market Share by Region, 2023 & 2033 (%)
4.7 Magnetic Levitation
4.7.1 Market Forecast by Region, 2023-2033 (US$ Million, AGR %)
4.7.2 Market Share by Region, 2023 & 2033 (%)
4.8 3D Bioprinting
4.8.1 Market Forecast by Region, 2023-2033 (US$ Million, AGR %)
4.8.2 Market Share by Region, 2023 & 2033 (%)
4.9 Others
4.9.1 Market Forecast by Region, 2023-2033 (US$ Million, AGR %)
4.9.2 Market Share by Region, 2023 & 2033 (%)
5 3D Cell Culture and 3D Bioprinting Market Analysis by Application
5.1 Key Findings
5.2 Application Segment: Market Attractiveness Index
5.3 3D Cell Culture and 3D Bioprinting Market Size Estimation and Forecast by Application
5.4 Cancer and Stem Cell Research
5.4.1 Market Forecast by Region, 2023-2033 (US$ Million, AGR %)
5.4.2 Market Share by Region, 2023 & 2033 (%)
5.5 Drug Discovery and Toxicology Testing
5.5.1 Market Forecast by Region, 2023-2033 (US$ Million, AGR %)
5.5.2 Market Share by Region, 2023 & 2033 (%)
5.6 Tissue Engineering and Regenerative Medicine
5.6.1 Market Forecast by Region, 2023-2033 (US$ Million, AGR %)
5.6.2 Market Share by Region, 2023 & 2033 (%)
6 3D Cell Culture and 3D Bioprinting Market Analysis by End-users
6.1 Key Findings
6.2 End-users Segment: Market Attractiveness Index
6.3 3D Cell Culture and 3D Bioprinting Market Size Estimation and Forecast by End-users
6.4 Pharmaceutical & Biotechnology Companies
6.4.1 Market Forecast by Region, 2023-2033 (US$ Million, AGR %)
6.4.2 Market Share by Region, 2023 & 2033 (%)
6.5 Academic Institutes
6.5.1 Market Forecast by Region, 2023-2033 (US$ Million, AGR %)
6.5.2 Market Share by Region, 2023 & 2033 (%)
6.6 Research Laboratories
6.6.1 Market Forecast by Region, 2023-2033 (US$ Million, AGR %)
6.6.2 Market Share by Region, 2023 & 2033 (%)
6.7 Others
6.7.1 Market Forecast by Region, 2023-2033 (US$ Million, AGR %)
6.7.2 Market Share by Region, 2023 & 2033 (%)
7 3D Cell Culture and 3D Bioprinting Market Analysis by Region
7.1 Key Findings
7.2 Regional Market Size Estimation and Forecast
8 North America 3D Cell Culture and 3D Bioprinting Market Analysis
8.1 Key Findings
8.2 North America 3D Cell Culture and 3D Bioprinting Market Attractiveness Index
8.3 North America 3D Cell Culture and 3D Bioprinting Market by Country, 2023, 2028 & 2033 (US$ Million)
8.4 North America 3D Cell Culture and 3D Bioprinting Market Size Estimation and Forecast by Country
8.5 North America 3D Cell Culture and 3D Bioprinting Market Size Estimation and Forecast by Technology
8.6 North America 3D Cell Culture and 3D Bioprinting Market Size Estimation and Forecast by Application
8.7 North America 3D Cell Culture and 3D Bioprinting Market Size Estimation and Forecast by End-users
8.8 U.S. 3D Cell Culture and 3D Bioprinting Market Analysis
8.9 Canada 3D Cell Culture and 3D Bioprinting Market Analysis
9 Europe 3D Cell Culture and 3D Bioprinting Market Analysis
9.1 Key Findings
9.2 Europe 3D Cell Culture and 3D Bioprinting Market Attractiveness Index
9.3 Europe 3D Cell Culture and 3D Bioprinting Market by Country, 2023, 2028 & 2033 (US$ Million)
9.4 Europe 3D Cell Culture and 3D Bioprinting Market Size Estimation and Forecast by Country
9.5 Europe 3D Cell Culture and 3D Bioprinting Market Size Estimation and Forecast by Technology
9.6 Europe 3D Cell Culture and 3D Bioprinting Market Size Estimation and Forecast by Application
9.7 Europe 3D Cell Culture and 3D Bioprinting Market Size Estimation and Forecast by End-users
9.8 Germany 3D Cell Culture and 3D Bioprinting Market Analysis
9.9 UK 3D Cell Culture and 3D Bioprinting Market Analysis
9.10 France 3D Cell Culture and 3D Bioprinting Market Analysis
9.11 Italy 3D Cell Culture and 3D Bioprinting Market Analysis
9.12 Spain 3D Cell Culture and 3D Bioprinting Market Analysis
9.13 Russia 3D Cell Culture and 3D Bioprinting Market Analysis
9.14 Rest of Europe 3D Cell Culture and 3D Bioprinting Market Analysis
10 Asia Pacific 3D Cell Culture and 3D Bioprinting Market Analysis
10.1 Key Findings
10.2 Asia Pacific 3D Cell Culture and 3D Bioprinting Market Attractiveness Index
10.3 Asia Pacific 3D Cell Culture and 3D Bioprinting Market by Country, 2023, 2028 & 2033 (US$ Million)
10.4 Asia Pacific 3D Cell Culture and 3D Bioprinting Market Size Estimation and Forecast by Country
10.5 Asia Pacific 3D Cell Culture and 3D Bioprinting Market Size Estimation and Forecast by Technology
10.6 Asia Pacific 3D Cell Culture and 3D Bioprinting Market Size Estimation and Forecast by Application
10.7 Asia Pacific 3D Cell Culture and 3D Bioprinting Market Size Estimation and Forecast by End-users
10.8 Japan 3D Cell Culture and 3D Bioprinting Market Analysis
10.9 China 3D Cell Culture and 3D Bioprinting Market Analysis
10.10 India 3D Cell Culture and 3D Bioprinting Market Analysis
10.11 Australia 3D Cell Culture and 3D Bioprinting Market Analysis
10.12 South Korea 3D Cell Culture and 3D Bioprinting Market Analysis
10.13 South-East Asia 3D Cell Culture and 3D Bioprinting Market Analysis
10.14 Rest of Asia Pacific 3D Cell Culture and 3D Bioprinting Market Analysis
11 Latin America 3D Cell Culture and 3D Bioprinting Market Analysis
11.1 Key Findings
11.2 Latin America 3D Cell Culture and 3D Bioprinting Market Attractiveness Index
11.3 Latin America 3D Cell Culture and 3D Bioprinting Market by Country, 2023, 2028 & 2033 (US$ Million)
11.4 Latin America 3D Cell Culture and 3D Bioprinting Market Size Estimation and Forecast by Country
11.5 Latin America 3D Cell Culture and 3D Bioprinting Market Size Estimation and Forecast by Technology
11.6 Latin America 3D Cell Culture and 3D Bioprinting Market Size Estimation and Forecast by Application
11.7 Latin America 3D Cell Culture and 3D Bioprinting Market Size Estimation and Forecast by End-users
11.8 Brazil 3D Cell Culture and 3D Bioprinting Market Analysis
11.9 Mexico 3D Cell Culture and 3D Bioprinting Market Analysis
11.10 Rest of Latin America 3D Cell Culture and 3D Bioprinting Market Analysis
12 MEA 3D Cell Culture and 3D Bioprinting Market Analysis
12.1 Key Findings
12.2 MEA 3D Cell Culture and 3D Bioprinting Market Attractiveness Index
12.3 MEA 3D Cell Culture and 3D Bioprinting Market by Country, 2023, 2028 & 2033 (US$ Million)
12.4 MEA 3D Cell Culture and 3D Bioprinting Market Size Estimation and Forecast by Country
12.5 MEA 3D Cell Culture and 3D Bioprinting Market Size Estimation and Forecast by Technology
12.6 MEA 3D Cell Culture and 3D Bioprinting Market Size Estimation and Forecast by Application
12.7 MEA 3D Cell Culture and 3D Bioprinting Market Size Estimation and Forecast by End-users
12.8 GCC 3D Cell Culture and 3D Bioprinting Market Analysis
12.9 South Africa 3D Cell Culture and 3D Bioprinting Market Analysis
12.10 Rest of MEA 3D Cell Culture and 3D Bioprinting Market Analysis
13 Company Profiles
13.1 3D Biotek LLC
13.1.1 Company Snapshot
13.1.2 Company Overview
13.1.3 Product Benchmarking
13.2 Aspect Biosystems Ltd.
13.2.1 Company Snapshot
13.2.2 Company Overview
13.2.3 Product Benchmarking
13.2.4 Strategic Outlook
13.3 CELLINK
13.3.1 Company Snapshot
13.3.2 Company Overview
13.3.3 Product Benchmarking
13.3.4 Strategic Outlook
13.4 CN Bio Innovations Ltd.
13.4.1 Company Snapshot
13.4.2 Company Overview
13.4.3 Product Benchmarking
13.4.4 Strategic Outlook
13.5 Corning Incorporated
13.5.1 Company Snapshot
13.5.2 Company Overview
13.5.3 Financial Analysis
13.5.3.1 Net Revenue, 2018-2022
13.5.3.2 R&D, 2018-2022
13.5.4 Product Benchmarking
13.5.5 Strategic Outlook
13.6 CYFUSE BIOMEDICAL K.K.
13.6.1 Company Snapshot
13.6.2 Company Overview
13.6.3 Product Benchmarking
13.7 GeSiM
13.7.1 Company Snapshot
13.7.2 Company Overview
13.7.3 Product Benchmarking
13.8 InSphero
13.8.1 Company Snapshot
13.8.2 Company Overview
13.8.3 Product Benchmarking
13.8.4 Strategic Outlook
13.9 Lonza
13.9.1 Company Snapshot
13.9.2 Company Overview
13.9.3 Financial Analysis
13.9.3.1 Net Revenue, 2018-2022
13.9.3.2 Regional Market Shares, 2022
13.9.3.3 R&D, 2018-2022
13.9.4 Product Benchmarking
13.10 Merck KGaA
13.10.1 Company Snapshot
13.10.2 Company Overview
13.10.3 Financial Analysis
13.10.3.1 Net Revenue, 2018-2022
13.10.3.2 Regional Market Shares, 2022
13.10.3.3 R&D, 2018-2022
13.10.4 Product Benchmarking
13.11 Organovo Holdings Inc.
13.11.1 Company Snapshot
13.11.2 Company Overview
13.11.3 Product Benchmarking
13.11.4 Strategic Outlook
13.12 REPROCELL Inc.
13.12.1 Company Snapshot
13.12.2 Company Overview
13.12.3 Product Benchmarking
13.13 Thermo Fisher Scientific Inc.
13.13.1 Company Snapshot
13.13.2 Company Overview
13.13.3 Financial Analysis
13.13.3.1 Net Revenue, 2018-2022
13.13.3.2 Regional Market Shares, 2022
13.13.3.3 R&D, 2018-2022
13.13.4 Product Benchmarking
13.14 ENVISIONTEC
13.14.1 Company Snapshot
13.14.2 Company Overview
13.14.3 Product Benchmarking
14 Conclusion and Recommendations
14.1 Concluding Remarks from Visiongain
14.2 Recommendations for Market Players
ページTOPに戻る
List of Tables/Graphs
List of Tables
Table 1 3D Cell Culture and 3D Bioprinting Market Snapshot, 2023 & 2033 (US$ million, CAGR %)
Table 2 3D Cell Culture and 3D Bioprinting Market Forecast by Region, 2023-2033 (US$ Million, AGR%, CAGR%): "V" Shaped Recovery
Table 3 3D Cell Culture and 3D Bioprinting Market Forecast by Region, 2023-2033 (US$ Million, AGR%, CAGR%): "U" Shaped Recovery
Table 4 3D Cell Culture and 3D Bioprinting Market Forecast by Region, 2023-2033 (US$ Million, AGR%, CAGR%): "W" Shaped Recovery
Table 5 3D Cell Culture and 3D Bioprinting Market Forecast by Region, 2023-2033 (US$ Million, AGR%, CAGR%): "L" Shaped Recovery
Table 6 3D Cell Culture and 3D Bioprinting Market Forecast by Technology, 2023-2033 (US$ Million, AGR%, CAGR%)
Table 7 Scaffold-based Segment Market Forecast by Region, 2023-2033 (US$ Million, AGR%, CAGR%)
Table 8 Scaffold-free Segment Market Forecast by Region, 2023-2033 (US$ Million, AGR%, CAGR%)
Table 9 Microfluidics-based Segment Market Forecast by Region, 2023-2033 (US$ Million, AGR%, CAGR%)
Table 10 Magnetic Levitation Segment Market Forecast by Region, 2023-2033 (US$ Million, AGR%, CAGR%)
Table 11 3D Bioprinting Segment Market Forecast by Region, 2023-2033 (US$ Million, AGR%, CAGR%)
Table 12 Others Segment Market Forecast by Region, 2023-2033 (US$ Million, AGR%, CAGR%)
Table 13 3D Cell Culture and 3D Bioprinting Market Forecast by Application, 2023-2033 (US$ Million, AGR%, CAGR%)
Table 14 Cancer and Stem Cell Research Segment Market Forecast by Region, 2023-2033 (US$ Million, AGR%, CAGR%)
Table 15 Drug Discovery and Toxicology Testing Segment Market Forecast by Region, 2023-2033 (US$ Million, AGR%, CAGR%)
Table 16 Tissue Engineering and Regenerative Medicine Segment Market Forecast by Region, 2023-2033 (US$ Million, AGR%, CAGR%)
Table 17 3D Cell Culture and 3D Bioprinting Market Forecast by End-users, 2023-2033 (US$ Million, AGR%, CAGR%)
Table 18 Pharmaceutical & Biotechnology Companies Segment Market Forecast by Region, 2023-2033 (US$ Million, AGR%, CAGR%)
Table 19 Academic Institutes Segment Market Forecast by Region, 2023-2033 (US$ Million, AGR%, CAGR%)
Table 20 Research Laboratories Segment Market Forecast by Region, 2023-2033 (US$ Million, AGR%, CAGR%)
Table 21 Others Segment Market Forecast by Region, 2023-2033 (US$ Million, AGR%, CAGR%)
Table 22 3D Cell Culture and 3D Bioprinting Market Forecast by Region, 2023-2033 (US$ Million, AGR%, CAGR%)
Table 23 North America 3D Cell Culture and 3D Bioprinting Market Forecast by Country, 2023-2033 (US$ Million, AGR%, CAGR%)
Table 24 North America 3D Cell Culture and 3D Bioprinting Market Forecast by Technology, 2023-2033 (US$ Million, AGR%, CAGR%)
Table 25 North America 3D Cell Culture and 3D Bioprinting Market Forecast by Application, 2023-2033 (US$ Million, AGR%, CAGR%)
Table 26 North America 3D Cell Culture and 3D Bioprinting Market Forecast by End-users, 2023-2033 (US$ Million, AGR%, CAGR%)
Table 27 U.S. 3D Cell Culture and 3D Bioprinting Market Forecast, 2023-2033 (US$ Million, AGR%, CAGR%)
Table 28 Canada 3D Cell Culture and 3D Bioprinting Market Forecast, 2023-2033 (US$ Million, AGR%, CAGR%)
Table 29 Europe 3D Cell Culture and 3D Bioprinting Market Forecast by Country, 2023-2033 (US$ Million, AGR%, CAGR%)
Table 30 Europe 3D Cell Culture and 3D Bioprinting Market Forecast by Technology, 2023-2033 (US$ Million, AGR%, CAGR%)
Table 31 Europe 3D Cell Culture and 3D Bioprinting Market Forecast by Application, 2023-2033 (US$ Million, AGR%, CAGR%)
Table 32 Europe 3D Cell Culture and 3D Bioprinting Market Forecast by End-users, 2023-2033 (US$ Million, AGR%, CAGR%)
Table 33 Germany 3D Cell Culture and 3D Bioprinting Market Forecast, 2023-2033 (US$ Million, AGR%, CAGR%)
Table 34 UK 3D Cell Culture and 3D Bioprinting Market Forecast, 2023-2033 (US$ Million, AGR%, CAGR%)
Table 35 France 3D Cell Culture and 3D Bioprinting Market Forecast, 2023-2033 (US$ Million, AGR%, CAGR%)
Table 36 Italy 3D Cell Culture and 3D Bioprinting Market Forecast, 2023-2033 (US$ Million, AGR%, CAGR%)
Table 37 Spain 3D Cell Culture and 3D Bioprinting Market Forecast, 2023-2033 (US$ Million, AGR%, CAGR%)
Table 38 Russia 3D Cell Culture and 3D Bioprinting Market Forecast, 2023-2033 (US$ Million, AGR%, CAGR%)
Table 39 Rest of Europe 3D Cell Culture and 3D Bioprinting Market Forecast, 2023-2033 (US$ Million, AGR%, CAGR%)
Table 40 Asia Pacific 3D Cell Culture and 3D Bioprinting Market Forecast by Country, 2023-2033 (US$ Million, AGR%, CAGR%)
Table 41 Asia Pacific 3D Cell Culture and 3D Bioprinting Market Forecast by Application, 2023-2033 (US$ Million, AGR%, CAGR%)
Table 42 Asia Pacific 3D Cell Culture and 3D Bioprinting Market Forecast by Application, 2023-2033 (US$ Million, AGR%, CAGR%)
Table 43 Asia Pacific 3D Cell Culture and 3D Bioprinting Market Forecast by End-users, 2023-2033 (US$ Million, AGR%, CAGR%)
Table 44 Japan 3D Cell Culture and 3D Bioprinting Market Forecast, 2023-2033 (US$ Million, AGR%, CAGR%)
Table 45 China 3D Cell Culture and 3D Bioprinting Market Forecast, 2023-2033 (US$ Million, AGR%, CAGR%)
Table 46 India 3D Cell Culture and 3D Bioprinting Market Forecast, 2023-2033 (US$ Million, AGR%, CAGR%)
Table 47 Australia 3D Cell Culture and 3D Bioprinting Market Forecast, 2023-2033 (US$ Million, AGR%, CAGR%)
Table 48 South Korea 3D Cell Culture and 3D Bioprinting Market Forecast, 2023-2033 (US$ Million, AGR%, CAGR%)
Table 49 South-East Asia 3D Cell Culture and 3D Bioprinting Market Forecast, 2023-2033 (US$ Million, AGR%, CAGR%)
Table 50 Rest of Asia Pacific 3D Cell Culture and 3D Bioprinting Market Forecast, 2023-2033 (US$ Million, AGR%, CAGR%)
Table 51 Latin America 3D Cell Culture and 3D Bioprinting Market Forecast by Country, 2023-2033 (US$ Million, AGR%, CAGR%)
Table 52 Latin America 3D Cell Culture and 3D Bioprinting Market Forecast by Technology, 2023-2033 (US$ Million, AGR%, CAGR%)
Table 53 Latin America 3D Cell Culture and 3D Bioprinting Market Forecast by Application, 2023-2033 (US$ Million, AGR%, CAGR%)
Table 54 Latin America 3D Cell Culture and 3D Bioprinting Market Forecast by End-users, 2023-2033 (US$ Million, AGR%, CAGR%)
Table 55 Brazil 3D Cell Culture and 3D Bioprinting Market Forecast, 2023-2033 (US$ Million, AGR%, CAGR%)
Table 56 Mexico 3D Cell Culture and 3D Bioprinting Market Forecast, 2023-2033 (US$ Million, AGR%, CAGR%)
Table 57 Rest of Latin America 3D Cell Culture and 3D Bioprinting Market Forecast, 2023-2033 (US$ Million, AGR%, CAGR%)
Table 58 MEA 3D Cell Culture and 3D Bioprinting Market Forecast by Country, 2023-2033 (US$ Million, AGR%, CAGR%)
Table 59 MEA 3D Cell Culture and 3D Bioprinting Market Forecast by Technology, 2023-2033 (US$ Million, AGR%, CAGR%)
Table 60 MEA 3D Cell Culture and 3D Bioprinting Market Forecast by Application, 2023-2033 (US$ Million, AGR%, CAGR%)
Table 61 MEA 3D Cell Culture and 3D Bioprinting Market Forecast by End-users, 2023-2033 (US$ Million, AGR%, CAGR%)
Table 62 GCC 3D Cell Culture and 3D Bioprinting Market Forecast, 2023-2033 (US$ Million, AGR%, CAGR%)
Table 63 South Africa 3D Cell Culture and 3D Bioprinting Market Forecast, 2023-2033 (US$ Million, AGR%, CAGR%)
Table 64 Rest of MEA 3D Cell Culture and 3D Bioprinting Market Forecast, 2023-2033 (US$ Million, AGR%, CAGR%)
Table 65 3D Biotek LLC: Key Details, (CEO, HQ, Revenue, Founded, No. of Employees, Company Type, Website, Business Segment)
Table 66 3D Biotek LLC: Product Benchmarking
Table 67 Aspect Biosystems Ltd.: Key Details, (CEO, HQ, Revenue, Founded, No. of Employees, Company Type, Website, Business Segment)
Table 68 Aspect Biosystems Ltd.: Product Benchmarking
Table 69 Aspect Biosystems Ltd.: Strategic Outlook
Table 70 CELLINK: Key Details, (CEO, HQ, Revenue, Founded, No. of Employees, Company Type, Website, Business Segment)
Table 71 CELLINK: Product Benchmarking
Table 72 CELLINK: Strategic Outlook
Table 73 CN Bio Innovations Ltd.: Key Details, (CEO, HQ, Revenue, Founded, No. of Employees, Company Type, Website, Business Segment)
Table 74 CN Bio Innovations Ltd.: Product Benchmarking
Table 75 CN Bio Innovations Ltd.: Strategic Outlook
Table 76 Corning Incorporated: Key Details, (CEO, HQ, Revenue, Founded, No. of Employees, Company Type, Website, Business Segment)
Table 77 Corning Incorporated: Product Benchmarking
Table 78 Corning Incorporated: Strategic Outlook
Table 79 CYFUSE BIOMEDICAL K.K.: Key Details, (CEO, HQ, Revenue, Founded, No. of Employees, Company Type, Website, Business Segment)
Table 80 CYFUSE BIOMEDICAL K.K.: Product Benchmarking
Table 81 GeSiM: Key Details, (CEO, HQ, Revenue, Founded, No. of Employees, Company Type, Website, Business Segment)
Table 82 GeSiM: Product Benchmarking
Table 83 InSphero: Key Details, (CEO, HQ, Revenue, Founded, No. of Employees, Company Type, Website, Business Segment)
Table 84 InSphero: Product Benchmarking
Table 85 InSphero: Strategic Outlook
Table 86 Lonza: Key Details, (CEO, HQ, Revenue, Founded, No. of Employees, Company Type, Website, Business Segment)
Table 87 Lonza: Product Benchmarking
Table 88 Merck KGaA: Key Details, (CEO, HQ, Revenue, Founded, No. of Employees, Company Type, Website, Business Segment)
Table 89 Merck KGaA: Product Benchmarking
Table 90 Organovo Holdings Inc.: Key Details, (CEO, HQ, Revenue, Founded, No. of Employees, Company Type, Website, Business Segment)
Table 91 Organovo Holdings Inc.: Product Benchmarking
Table 92 Organovo Holdings Inc.: Strategic Outlook
Table 93 REPROCELL Inc.: Key Details, (CEO, HQ, Revenue, Founded, No. of Employees, Company Type, Website, Business Segment)
Table 94 REPROCELL Inc.: Product Benchmarking
Table 95 Thermo Fisher Scientific Inc.: Key Details, (CEO, HQ, Revenue, Founded, No. of Employees, Company Type, Website, Business Segment)
Table 96 Thermo Fisher Scientific Inc.: Product Benchmarking
Table 97 ENVISIONTEC: Key Details, (CEO, HQ, Revenue, Founded, No. of Employees, Company Type, Website, Business Segment)
Table 98 ENVISIONTEC: Product Benchmarking
List of Figures
Figure 1 3D Cell Culture and 3D Bioprinting Market Segmentation
Figure 2 3D Cell Culture and 3D Bioprinting Market by Technology: Market Attractiveness Index
Figure 3 3D Cell Culture and 3D Bioprinting Market by Application: Market Attractiveness Index
Figure 4 3D Cell Culture and 3D Bioprinting Market by End-users: Market Attractiveness Index
Figure 5 3D Cell Culture and 3D Bioprinting Market Attractiveness Index by Region
Figure 6 3D Cell Culture and 3D Bioprinting Market: Market Dynamics
Figure 7 3D Cell Culture and 3D Bioprinting Market by Region, 2023-2033 (US$ Million, AGR %): “V” Shaped Recovery
Figure 8 3D Cell Culture and 3D Bioprinting Market by Region, 2023-2033 (US$ Million, AGR %): “U” Shaped Recovery
Figure 9 3D Cell Culture and 3D Bioprinting Market by Region, 2023-2033 (US$ Million, AGR %): “W” Shaped Recovery
Figure 10 3D Cell Culture and 3D Bioprinting Market by Region, 2023-2033 (US$ Million, AGR %): “L” Shaped Recovery
Figure 11 3D Cell Culture and 3D Bioprinting Market: Porter’s Five Forces Analysis
Figure 12 3D Cell Culture and 3D Bioprinting Market: PEST Analysis
Figure 13 3D Cell Culture and 3D Bioprinting Market Attractiveness Index by Technology
Figure 14 3D Cell Culture and 3D Bioprinting Market Forecast by Technology, 2023-2033 (US$ Million, AGR %)
Figure 15 3D Cell Culture and 3D Bioprinting Market Share Forecast by Technology, 2023, 2028, 2033 (%)
Figure 16 Scaffold-based Segment Market Forecast by Region, 2023-2033 (US$ Million, AGR %)
Figure 17 Scaffold-based Segment Market Share Forecast by Region, 2023 & 2033 (%)
Figure 18 Scaffold-free Segment Market Forecast by Region, 2023-2033 (US$ Million, AGR %)
Figure 19 Scaffold-free Segment Market Share Forecast by Region, 2023 & 2033 (%)
Figure 20 Microfluidics-based Segment Market Forecast by Region, 2023-2033 (US$ Million, AGR %)
Figure 21 Microfluidics-based Segment Market Share Forecast by Region, 2023 & 2033 (%)
Figure 22 Magnetic Levitation Segment Market Forecast by Region, 2023-2033 (US$ Million, AGR %)
Figure 23 Magnetic Levitation Segment Market Share Forecast by Region, 2023 & 2033 (%)
Figure 24 3D Bioprinting Segment Market Forecast by Region, 2023-2033 (US$ Million, AGR %)
Figure 25 3D Bioprinting Segment Market Share Forecast by Region, 2023 & 2033 (%)
Figure 26 Others Segment Market Forecast by Region, 2023-2033 (US$ Million, AGR %)
Figure 27 Others Segment Market Share Forecast by Region, 2023 & 2033 (%)
Figure 28 3D Cell Culture and 3D Bioprinting Market Attractiveness Index by Technology
Figure 29 3D Cell Culture and 3D Bioprinting Market Forecast by Application, 2023-2033 (US$ Million, AGR %)
Figure 30 3D Cell Culture and 3D Bioprinting Market Share Forecast by Application, 2023, 2028, 2033 (%)
Figure 31 Cancer and Stem Cell Research Segment Market Forecast by Region, 2023-2033 (US$ Million, AGR %)
Figure 32 Cancer and Stem Cell Research Segment Market Share Forecast by Region, 2023 & 2033 (%)
Figure 33 Drug Discovery and Toxicology Testing Segment Market Forecast by Region, 2023-2033 (US$ Million, AGR %)
Figure 34 Drug Discovery and Toxicology Testing Segment Market Share Forecast by Region, 2023 & 2033 (%)
Figure 35 Tissue Engineering and Regenerative Medicine Segment Market Forecast by Region, 2023-2033 (US$ Million, AGR %)
Figure 36 Tissue Engineering and Regenerative Medicine Segment Market Share Forecast by Region, 2023 & 2033 (%)
Figure 37 3D Cell Culture and 3D Bioprinting Market Attractiveness Index by End-users
Figure 38 3D Cell Culture and 3D Bioprinting Market Forecast by End-users, 2023-2033 (US$ Million, AGR %)
Figure 39 3D Cell Culture and 3D Bioprinting Market Share Forecast by End-users, 2023, 2028, 2033 (%)
Figure 40 Pharmaceutical & Biotechnology Companies Segment Market Forecast by Region, 2023-2033 (US$ Million, AGR %)
Figure 41 Pharmaceutical & Biotechnology Companies Segment Market Share Forecast by Region, 2023 & 2033 (%)
Figure 42 Academic Institutes Segment Market Forecast by Region, 2023-2033 (US$ Million, AGR %)
Figure 43 Academic Institutes Segment Market Share Forecast by Region, 2023 & 2033 (%)
Figure 44 Research Laboratories Segment Market Forecast by Region, 2023-2033 (US$ Million, AGR %)
Figure 45 Research Laboratories Segment Market Share Forecast by Region, 2023 & 2033 (%)
Figure 46 Others Segment Market Forecast by Region, 2023-2033 (US$ Million, AGR %)
Figure 47 Others Segment Market Share Forecast by Region, 2023 & 2033 (%)
Figure 48 3D Cell Culture and 3D Bioprinting Market Forecast by Region 2023, 2028, 2033 (Revenue, CAGR%)
Figure 49 3D Cell Culture and 3D Bioprinting Market Share Forecast by Region 2023, 2028, 2033 (%)
Figure 50 3D Cell Culture and 3D Bioprinting Market by Region, 2023-2033 (US$ Mn)
Figure 51 North America 3D Cell Culture and 3D Bioprinting Market Attractiveness Index
Figure 52 North America 3D Cell Culture and 3D Bioprinting Market by Region, 2023, 2028 & 2033 (US$ million)
Figure 53 North America 3D Cell Culture and 3D Bioprinting Market Forecast by Country, 2023-2033 (US$ million)
Figure 54 North America 3D Cell Culture and 3D Bioprinting Market Share Forecast by Country, 2023 & 2033 (%)
Figure 55 North America 3D Cell Culture and 3D Bioprinting Market Forecast by Technology, 2023-2033 (US$ Million, AGR %)
Figure 56 North America 3D Cell Culture and 3D Bioprinting Market Share Forecast by Technology, 2023 & 2033 (%)
Figure 57 North America 3D Cell Culture and 3D Bioprinting Market Forecast by Application, 2023-2033 (US$ Million, AGR %)
Figure 58 North America 3D Cell Culture and 3D Bioprinting Market Share Forecast by Application, 2023 & 2033 (%)
Figure 59 North America 3D Cell Culture and 3D Bioprinting Market Forecast by End-users, 2023-2033 (US$ Million, AGR %)
Figure 60 North America 3D Cell Culture and 3D Bioprinting Market Share Forecast by End-users, 2023 & 2033 (%)
Figure 61 U.S. 3D Cell Culture and 3D Bioprinting Market Forecast, 2023-2033 (US$ Million, AGR %)
Figure 62 Canada 3D Cell Culture and 3D Bioprinting Market Forecast, 2023-2033 (US$ Million, AGR %)
Figure 63 Europe 3D Cell Culture and 3D Bioprinting Market Attractiveness Index
Figure 64 Europe 3D Cell Culture and 3D Bioprinting Market by Region, 2023, 2028 & 2033 (US$ million)
Figure 65 Europe 3D Cell Culture and 3D Bioprinting Market Forecast by Country, 2023-2033 (US$ million)
Figure 66 Europe 3D Cell Culture and 3D Bioprinting Market Share Forecast by Country, 2023 & 2033 (%)
Figure 67 Europe 3D Cell Culture and 3D Bioprinting Market Forecast by Technology, 2023-2033 (US$ Million, AGR %)
Figure 68 Europe 3D Cell Culture and 3D Bioprinting Market Share Forecast by Technology, 2023 & 2033 (%)
Figure 69 Europe 3D Cell Culture and 3D Bioprinting Market Forecast by Application, 2023-2033 (US$ Million, AGR %)
Figure 70 Europe 3D Cell Culture and 3D Bioprinting Market Share Forecast by Application, 2023 & 2033 (%)
Figure 71 Europe 3D Cell Culture and 3D Bioprinting Market Forecast by End-users, 2023-2033 (US$ Million, AGR %)
Figure 72 Europe 3D Cell Culture and 3D Bioprinting Market Share Forecast by End-users, 2023 & 2033 (%)
Figure 73 Germany 3D Cell Culture and 3D Bioprinting Market Forecast, 2023-2033 (US$ Million, AGR %)
Figure 74 UK 3D Cell Culture and 3D Bioprinting Market Forecast, 2023-2033 (US$ Million, AGR %)
Figure 75 France 3D Cell Culture and 3D Bioprinting Market Forecast, 2023-2033 (US$ Million, AGR %)
Figure 76 Italy 3D Cell Culture and 3D Bioprinting Market Forecast, 2023-2033 (US$ Million, AGR %)
Figure 77 Spain 3D Cell Culture and 3D Bioprinting Market Forecast, 2023-2033 (US$ Million, AGR %)
Figure 78 Russia 3D Cell Culture and 3D Bioprinting Market Forecast, 2023-2033 (US$ Million, AGR %)
Figure 79 Rest of Europe 3D Cell Culture and 3D Bioprinting Market Forecast, 2023-2033 (US$ Million, AGR %)
Figure 80 Asia Pacific 3D Cell Culture and 3D Bioprinting Market Attractiveness Index
Figure 81 Asia Pacific 3D Cell Culture and 3D Bioprinting Market by Region, 2023, 2028 & 2033 (US$ million)
Figure 82 Asia Pacific 3D Cell Culture and 3D Bioprinting Market Forecast by Country, 2023-2033 (US$ million)
Figure 83 Asia Pacific 3D Cell Culture and 3D Bioprinting Market Share Forecast by Country, 2023 & 2033 (%)
Figure 84 Asia Pacific 3D Cell Culture and 3D Bioprinting Market Forecast by Technology, 2023-2033 (US$ Million, AGR %)
Figure 85 Asia Pacific 3D Cell Culture and 3D Bioprinting Market Share Forecast by Technology, 2023 & 2033 (%)
Figure 86 Asia Pacific 3D Cell Culture and 3D Bioprinting Market Forecast by Application, 2023-2033 (US$ Million, AGR %)
Figure 87 Asia Pacific 3D Cell Culture and 3D Bioprinting Market Share Forecast by Application, 2023 & 2033 (%)
Figure 88 Asia Pacific 3D Cell Culture and 3D Bioprinting Market Forecast by End-users, 2023-2033 (US$ Million, AGR %)
Figure 89 Asia Pacific 3D Cell Culture and 3D Bioprinting Market Share Forecast by End-users, 2023 & 2033 (%)
Figure 90 Japan 3D Cell Culture and 3D Bioprinting Market Forecast, 2023-2033 (US$ Million, AGR %)
Figure 91 China 3D Cell Culture and 3D Bioprinting Market Forecast, 2023-2033 (US$ Million, AGR %)
Figure 92 India 3D Cell Culture and 3D Bioprinting Market Forecast, 2023-2033 (US$ Million, AGR %)
Figure 93 Australia 3D Cell Culture and 3D Bioprinting Market Forecast, 2023-2033 (US$ Million, AGR %)
Figure 94 South Korea 3D Cell Culture and 3D Bioprinting Market Forecast, 2023-2033 (US$ Million, AGR %)
Figure 95 South-East Asia 3D Cell Culture and 3D Bioprinting Market Forecast, 2023-2033 (US$ Million, AGR %)
Figure 96 Rest of Asia Pacific 3D Cell Culture and 3D Bioprinting Market Forecast, 2023-2033 (US$ Million, AGR %)
Figure 97 Latin America 3D Cell Culture and 3D Bioprinting Market Attractiveness Index
Figure 98 Latin America 3D Cell Culture and 3D Bioprinting Market by Region, 2023, 2028 & 2033 (US$ million)
Figure 99 Latin America 3D Cell Culture and 3D Bioprinting Market Forecast by Country, 2023-2033 (US$ million)
Figure 100 Latin America 3D Cell Culture and 3D Bioprinting Market Share Forecast by Country, 2023 & 2033 (%)
Figure 101 Latin America 3D Cell Culture and 3D Bioprinting Market Forecast by Technology, 2023-2033 (US$ Million, AGR %)
Figure 102 Latin America 3D Cell Culture and 3D Bioprinting Market Share Forecast by Technology, 2023 & 2033 (%)
Figure 103 Latin America 3D Cell Culture and 3D Bioprinting Market Forecast by Application, 2023-2033 (US$ Million, AGR %)
Figure 104 Latin America 3D Cell Culture and 3D Bioprinting Market Share Forecast by Application, 2023 & 2033 (%)
Figure 105 Latin America 3D Cell Culture and 3D Bioprinting Market Forecast by End-users, 2023-2033 (US$ Million, AGR %)
Figure 106 Latin America 3D Cell Culture and 3D Bioprinting Market Share Forecast by End-users, 2023 & 2033 (%)
Figure 107 Brazil 3D Cell Culture and 3D Bioprinting Market Forecast, 2023-2033 (US$ Million, AGR %)
Figure 108 Mexico 3D Cell Culture and 3D Bioprinting Market Forecast, 2023-2033 (US$ Million, AGR %)
Figure 109 Rest of Latin America 3D Cell Culture and 3D Bioprinting Market Forecast, 2023-2033 (US$ Million, AGR %)
Figure 110 MEA 3D Cell Culture and 3D Bioprinting Market Attractiveness Index
Figure 111 MEA 3D Cell Culture and 3D Bioprinting Market by Region, 2023, 2028 & 2033 (US$ million)
Figure 112 MEA 3D Cell Culture and 3D Bioprinting Market Forecast by Country, 2023-2033 (US$ million)
Figure 113 MEA 3D Cell Culture and 3D Bioprinting Market Share Forecast by Country, 2023 & 2033 (%)
Figure 114 MEA 3D Cell Culture and 3D Bioprinting Market Forecast by Technology, 2023-2033 (US$ Million, AGR %)
Figure 115 MEA 3D Cell Culture and 3D Bioprinting Market Share Forecast by Technology, 2023 & 2033 (%)
Figure 116 MEA 3D Cell Culture and 3D Bioprinting Market Forecast by Application, 2023-2033 (US$ Million, AGR %)
Figure 117 MEA 3D Cell Culture and 3D Bioprinting Market Share Forecast by Application, 2023 & 2033 (%)
Figure 118 MEA 3D Cell Culture and 3D Bioprinting Market Forecast by End-users, 2023-2033 (US$ Million, AGR %)
Figure 119 MEA 3D Cell Culture and 3D Bioprinting Market Share Forecast by End-users, 2023 & 2033 (%)
Figure 120 GCC 3D Cell Culture and 3D Bioprinting Market Forecast, 2023-2033 (US$ Million, AGR %)
Figure 121 South Africa 3D Cell Culture and 3D Bioprinting Market Forecast, 2023-2033 (US$ Million, AGR %)
Figure 122 Rest of MEA 3D Cell Culture and 3D Bioprinting Market Forecast, 2023-2033 (US$ Million, AGR %)
Figure 123 Corning Incorporated: Net Revenue, 2018-2022 (US$ million, AGR%)
Figure 124 Corning Incorporated: R&D, 2018-2022 (US$ million, AGR%)
Figure 125 Lonza: Net Revenue, 2018-2022 (US$ million, AGR%)
Figure 126 Lonza: Regional Market Shares (%), 2022
Figure 127 Lonza: R&D, 2018-2022 (US$ million, AGR%)
Figure 128 Merck KGaA: Net Revenue, 2018-2022 (US$ million, AGR%)
Figure 129 Merck KGaA: Regional Market Shares (%), 2022
Figure 130 Merck KGaA: R&D, 2018-2022 (US$ million, AGR%)
Figure 131 Thermo Fisher Scientific Inc.: Net Revenue, 2018-2022 (US$ million, AGR%)
Figure 132 Thermo Fisher Scientific Inc.: Regional Market Shares (%), 2022
Figure 133 Thermo Fisher Scientific Inc.: R&D, 2018-2022 (US$ million, AGR%)
ページTOPに戻る
本レポートと同じKEY WORD()の最新刊レポート
- 本レポートと同じKEY WORDの最新刊レポートはありません。
よくあるご質問
Visiongain社はどのような調査会社ですか?
英国の調査会社ヴィジョンゲイン社(Visiongain)は、通信とエネルギーのほか、自動車や化学・医薬品、金属など、広範な市場を対象に調査を行っています。自動車市場については、市場全般に関する調査のほ... もっと見る
調査レポートの納品までの日数はどの程度ですか?
在庫のあるものは速納となりますが、平均的には 3-4日と見て下さい。
但し、一部の調査レポートでは、発注を受けた段階で内容更新をして納品をする場合もあります。
発注をする前のお問合せをお願いします。
注文の手続きはどのようになっていますか?
1)お客様からの御問い合わせをいただきます。
2)見積書やサンプルの提示をいたします。
3)お客様指定、もしくは弊社の発注書をメール添付にて発送してください。
4)データリソース社からレポート発行元の調査会社へ納品手配します。
5) 調査会社からお客様へ納品されます。最近は、pdfにてのメール納品が大半です。
お支払方法の方法はどのようになっていますか?
納品と同時にデータリソース社よりお客様へ請求書(必要に応じて納品書も)を発送いたします。
お客様よりデータリソース社へ(通常は円払い)の御振り込みをお願いします。
請求書は、納品日の日付で発行しますので、翌月最終営業日までの当社指定口座への振込みをお願いします。振込み手数料は御社負担にてお願いします。
お客様の御支払い条件が60日以上の場合は御相談ください。
尚、初めてのお取引先や個人の場合、前払いをお願いすることもあります。ご了承のほど、お願いします。
データリソース社はどのような会社ですか?
当社は、世界各国の主要調査会社・レポート出版社と提携し、世界各国の市場調査レポートや技術動向レポートなどを日本国内の企業・公官庁及び教育研究機関に提供しております。
世界各国の「市場・技術・法規制などの」実情を調査・収集される時には、データリソース社にご相談ください。
お客様の御要望にあったデータや情報を抽出する為のレポート紹介や調査のアドバイスも致します。
|
|

