炭素回収・輸送・貯蔵市場レポート:2023-2033
Carbon Capture, Transportation & Storage Market Report 2023-2033
レポート詳細
炭素回収・輸送・貯蔵市場レポート 2023-2033 : 本レポートは、業界とその基礎となる原動力をよりよく理解することを望むなら、新たな収益ポケットを目指す大手企業にとって貴重なもの... もっと見る
※上記価格は部署ライセンス(Departmental licence)価格です。
その他の価格についてはデータリソースまでお問合せください。
日本語のページは自動翻訳を利用し作成しています。
実際のレポートは英文のみでご納品いたします。

|

|
サマリー
レポート詳細
炭素回収・輸送・貯蔵市場レポート 2023-2033: 本レポートは、業界とその基礎となる原動力をよりよく理解することを望むなら、新たな収益ポケットを目指す大手企業にとって貴重なものとなるでしょう。異業種への進出や新地域での既存事業の拡大を目指す企業にも有用です。
先駆的な炭素削減: CCTSソリューションの緊急性
気候変動と環境への悪影響に対する意識の高まりが、炭素回収・輸送・貯蔵(CCTS)市場を前進させている。地球の気温が上昇し、温室効果ガスの排出量が増え続ける中、大気中のCO2濃度を下げる必要性は否定できないものとなっている。CCTS技術は、様々な産業から排出される炭素を回収し、大気中への放出を防止し、安全な長期貯蔵を確保することで、気候変動を緩和する積極的なアプローチを提供する。
コンプライアンスとその先へ 野心的な排出目標への対応
パリ協定のような国際協定によって設定された野心的な排出削減目標は、産業界に炭素回収・貯留ソリューションの採用を促している。これらの目標を達成するために、多くの政府や組織が二酸化炭素排出量を削減するためにCCTS技術に注目している。CCTS市場は、産業界がCO2排出量を大幅に削減し、世界的な持続可能性への取り組みに貢献するための実行可能な道を提供することで、こうした義務に応えている。
市場調査レポートを購入する前にすべき質問とは?
- 炭素回収・輸送・貯蔵市場はどのように進化しているのか?
- 炭素回収・輸送・貯蔵市場の推進要因と阻害要因は何か?
- 炭素回収・輸送・貯蔵の各サブ市場は予測期間中にどのように成長し、2033年にはどれくらいの売上を占めるようになるのか?
- 2023年から2033年にかけて、炭素回収・輸送・貯蔵の各サブマーケットの市場シェアはどのように推移するか?
- 2023年から2033年にかけて、市場全体を牽引する主な要因は何か?
- 主要な炭素回収・輸送・貯蔵市場はマクロ経済の動きにおおむね追随するのか、それとも個々の国別市場が他を凌駕するのか。
- 2033年までに各国市場のシェアはどう変化し、2033年に市場をリードするのはどの地域か?
- 主要プレーヤーは誰で、予測期間中の見通しは?
- 主要企業の炭素回収・輸送・貯蔵プロジェクトとは?
- 2023年から2033年の間に、この業界はどのように発展していくのか?炭素回収・輸送・貯蔵プロジェクトは、現在、そして今後10年間でどのような意味を持つのか?
- 炭素回収・輸送・貯蔵市場をさらに拡大するために、製品の商業化の必要性は高まっているか?
- 炭素回収・輸送・貯蔵市場はどこに向かっているのか、そしてどのようにすれば市場の最前線に立てるのか?
- 新製品やサービスラインに対する最適な投資オプションは何か?
- 企業を新たな成長軌道に乗せ、C-suiteに移行させるための重要な展望とは?
このことが、現在、そして今後10年間の炭素回収・輸送・貯蔵市場にどのような影響を与えるかを見極める必要がある:
- 435ページにわたる本レポートでは、120の表と199の図表を掲載しています。
- 本レポートは、業界の主要な儲かる分野にハイライトを当てているため、今すぐターゲットを絞ることができます。
- 世界、地域、国の売上と成長に関する詳細な分析が含まれています。
- 競合他社が成功した主なトレンド、変化、収益予測をハイライトしています。
本レポートは、炭素回収・輸送・貯蔵市場が今後10年間でどのように発展するか、またCOVID-19の景気後退と好転の変動に合わせてどのように発展するかをお伝えします。この市場は、過去10年間のどの時点よりも今が重要である。
2033年までの予測やその他の分析から、商業的な展望が明らかになる
- 2033年までの収益予測に加え、直近の業績、成長率、市場シェアもご覧いただけます。
- ビジネスの展望と展開に関する独自の分析をご覧いただけます。
- 質的分析(市場力学、促進要因、機会、阻害要因、課題を含む)、コスト構造、炭素回収・輸送・貯蔵価格上昇の影響、最新動向をご覧いただけます。
本レポートには、COVID-19が業界と貴社にどのような影響を与えるかについてのデータ分析と貴重な洞察が含まれている。本レポートでは、COVID-19の4つの回収パターンとその影響、すなわち「V」、「L」、「W」、「U」について論じている。
レポート対象セグメント
事業タイプ別市場セグメント
- CCSテクノロジー
- CCSサービス
輸送別市場セグメント
- パイプラインシステム
- 船舶輸送会社
- 自動車輸送会社
サービス別市場セグメント
- 炭素回収サービス
- 炭素貯蔵サービス
- 炭素回収輸送サービス
- その他サービス
供給源別市場セグメント
- 発電
- 産業部門
- 運輸部門
- 建設部門
- その他
技術別市場セグメント
- 産業用分離回収技術
- 固有分離技術
- OXY燃料燃焼捕捉技術
- 燃焼後捕捉技術
- 燃焼前捕捉技術
- その他の技術
世界市場全体とセグメント別の収益予測に加え、4つの地域と20の主要国市場の収益予測も掲載しています:
北米
- アメリカ
- カナダ
欧州
- ドイツ
- ロシア
- イギリス
- フランス
- イタリア
- その他の欧州
アジア太平洋
- 中国
- 日本
- インド
- オーストラリア
- 韓国
- その他のアジア太平洋地域
ラテンアメリカ
- ブラジル
- メキシコ
- その他のラテンアメリカ
中東・アフリカ
- GCC
- 南アフリカ
- その他の中東・アフリカ
また、本報告書では、炭素回収・輸送・貯蔵市場の2023年から2033年にかけての主要企業のプロファイルと、これらの企業の事業のこのセグメントに焦点を当てたいくつかの企業についても掲載している。
主要企業と市場成長の可能性
・ Aker Carbon Capture
・ Carbon Clean Solutions
・ Carbon Engineering Ltd.
・ Climeworks AG
・ Enbridge Inc.
・ Enterprise Products Partners L.P.
・ Equinor ASA
・ Global Thermostat
・ Kinder Morgan, Inc.
・ Magellan Midstream Partners
・ Occidental Petroleum Corporation
・ Plains All American Pipeline, L.P.
・ Royal Dutch Shell Plc
・ TC Energy Corporation
・ The Williams Companies, Inc.
炭素回収・輸送・貯蔵市場の2023年から2033年までの世界全体の売上高(金額ベース)は、2023年に38億8,340万米ドルを突破する。また、2033年まで収益は力強く成長すると予測している。当研究所では、最も大きな可能性を秘めた組織を特定する。彼らの能力、進歩、商業的展望を発見し、一歩先を行くお手伝いをします。
このレポートは炭素回収・輸送・貯蔵市場の2023-2033年について調査・分析した報告書です。
要約すると、430ページを超えるこのレポートは、以下のような知識を提供する:
- 炭素回収・輸送・貯蔵市場の2023年から2033年までの収益予測 世界と地域レベルのビジネスタイプ、輸送、サービス、供給源、技術、各予測を掲載 - 業界の展望を発見し、投資と収益に最も有利な場所を見つけます。
- 4つの地域と20の主要国市場の2033年までの収益予測 - 北米、欧州、アジア太平洋、中南米、中東・アフリカの炭素回収・輸送・貯蔵市場の2023年から2033年までの予測をご覧ください。また、米国、カナダ、ブラジル、ドイツ、フランス、英国、イタリア、中国、インド、日本、オーストラリアなどの主要経済圏の市場も予測しています。
-既存企業および市場参入を目指す企業の展望 - 炭素回収・輸送・貯蔵市場に関わる主要企業15社の2023年から2033年までの企業プロファイルを含む。
独自の予測による定量的・定性的分析をご覧ください。私たちのレポートだけに含まれる情報を入手し、貴重なビジネスインテリジェンスで情報を得ることができます。
他にはない情報
私たちの新しいレポートがあれば、知識に遅れをとったり、チャンスを逃したりする可能性が低くなります。Visiongainの調査レポートが貴社の調査、分析、意思決定にどのように役立つかをご覧ください。Visiongainのこの調査レポートは、炭素回収・輸送・貯蔵市場(2023年~2033年)に関する商業分析を必要とするすべての人、市場のリーディングカンパニーを対象としています。データ、トレンド、予測をご覧いただけます。
ページTOPに戻る
目次
目次
1 レポート概要
1.1 調査の目的
1.2 炭素回収・輸送・貯留市場の紹介
1.3 本レポートの特徴
1.4 本レポートを読むべき理由
1.5 本分析レポートが回答する主な質問
1.6 本レポートの対象者
1.7 方法論
1.7.1 市場の定義
1.7.2 市場評価・予測手法
1.7.3 データの検証
1.7.3.1 一次調査
1.7.3.2 セカンダリーリサーチ
1.8 よくある質問(FAQ)
1.9 Visiongainの関連レポート
1.10 Visiongainについて
2 エグゼクティブ・サマリー
3 市場の概要
3.1 主要な調査結果
3.2 市場ダイナミクス
3.2.1 市場牽引要因
3.2.1.1 炭素回収技術による追加発電が市場成長の原動力
3.2.1.2 炭素回収・貯留(Ccs)事業の拡大が熟練技術者の需要急増を促進する
3.2.1.3 CO2排出量削減への関心の高まりが市場成長を促進する
3.2.2 市場抑制要因
3.2.2.1 炭素回収・貯留の資本コストの高さが市場成長の妨げに
3.2.2.2 長期的なCO2貯留容量が不透明であることが市場成長の阻害要因
3.2.2.3 CO2の輸送と貯蔵は潜在的な危険をもたらす
3.2.3 市場機会
3.2.3.1 炭素貯留・輸送プロジェクトに政府の資金援助とインセンティブが利用可能
3.2.3.2 炭素回収・輸送・貯蔵のための新しく効率的な技術開発への投資の増加
3.2.3.3 地域における多数の今後のプロジェクト
3.3 ポーターのファイブフォース分析
3.3.1 サプライヤーの交渉力(中)
3.3.2 買い手の交渉力(高)
3.3.3 競争力(中)
3.3.4 代替品による脅威(低~中)
3.3.5 新規参入の脅威(低)
3.4 COVID-19の影響分析
3.4.1 "V字型回復"
3.4.2 "U字型回復"
3.4.3 "W字型回復"
3.4.4 "L字型回復"
3.5 PEST分析
4 炭素回収・輸送・貯蔵市場分析:事業タイプ別
4.1 主要な調査結果
4.2 事業タイプ別セグメント 市場魅力度指数
4.3 事業タイプ別炭素回収・輸送・貯蔵市場規模の推定と予測
4.4 CCS技術
4.4.1 2023〜2033年の地域別市場規模(US$ Million)
4.4.2 地域別市場シェア、2023年・2033年(%)
4.5 CCSサービス
4.5.1 2023~2033年の地域別市場規模(US$ Million)
4.5.2 地域別市場シェア、2023年・2033年(%)
5 炭素回収・輸送・貯蔵市場分析:輸送サービス別
5.1 主要調査結果
5.2 輸送サービスセグメント 市場魅力度指数
5.3 輸送サービス別の炭素回収・輸送・貯蔵市場規模の推定と予測
5.4 パイプラインシステム
5.4.1 2023〜2033年の地域別市場規模(US$ Million)
5.4.2 地域別市場シェア、2023年・2033年(%)
5.5 船舶運搬船
5.5.1 2023年~2033年の地域別市場規模(US$ Million)
5.5.2 地域別市場シェア、2023年・2033年(%)
5.6 自動車運搬船
5.6.1 2023~2033年の地域別市場規模(US$ Million)
5.6.2 地域別市場シェア、2023年・2033年 (%)
6 炭素回収・輸送・貯蔵市場分析:サービス別
6.1 主要調査結果
6.2 サービスセグメント 市場魅力度指数
6.3 炭素回収・輸送・貯蔵のサービス別市場規模推定と予測
6.4 炭素回収サービス
6.4.1 2023〜2033年の地域別市場規模(US$ Million)
6.4.2 地域別市場シェア、2023年・2033年(%)
6.5 炭素貯蔵サービス
6.5.1 2023~2033年の地域別市場規模(US$ Million)
6.5.2 地域別市場シェア、2023年・2033年(%)
6.6 炭素回収輸送サービス
6.6.1 2023〜2033年の地域別市場規模(US$ Million)
6.6.2 地域別市場シェア、2023年・2033年(%)
6.7 その他のサービス
6.7.1 2023~2033年の地域別市場規模(US$ Million)
6.7.2 地域別市場シェア、2023年・2033年(%)
7 炭素回収・輸送・貯蔵市場分析:供給源別
7.1 主要調査結果
7.2 供給源セグメント 市場魅力度指数
7.3 炭素回収・輸送・貯蔵の発生源別市場規模推定と予測
7.4 発電
7.4.1 2023〜2033年の地域別市場規模(US$ Million)
7.4.2 地域別市場シェア、2023年・2033年(%)
7.5 産業部門
7.5.1 2023年~2033年の地域別市場規模(US$ Million)
7.5.2 地域別市場シェア、2023年・2033年(%)
7.6 運輸セクター
7.6.1 2023〜2033年の地域別市場規模(US$ Million)
7.6.2 地域別市場シェア、2023年・2033年(%)
7.7 建設セクター
7.7.1 2023〜2033年の地域別市場規模(US$ Million)
7.7.2 地域別市場シェア、2023年・2033年(%)
7.8 その他の情報源
7.8.1 2023~2033年の地域別市場規模(US$ Million)
7.8.2 地域別市場シェア、2023年・2033年(%)
8 炭素回収・輸送・貯蔵市場分析:技術別
8.1 主要調査結果
8.2 技術セグメント 市場魅力度指数
8.3 炭素回収・輸送・貯蔵の技術別市場規模推定と予測
8.4 産業用分離回収技術
8.4.1 2023〜2033年の地域別市場規模(US$ Million)
8.4.2 地域別市場シェア、2023年・2033年(%)
8.5 固有分離技術
8.5.1 2023~2033年の地域別市場規模(US$ Million)
8.5.2 地域別市場シェア、2023年・2033年(%)
8.6 OXY燃料燃焼捕捉技術
8.6.1 2023~2033年の地域別市場規模(US$ Million)
8.6.2 地域別市場シェア、2023年・2033年(%)
8.7 燃焼後回収技術
8.7.1 2023~2033年の地域別市場規模(US$ Million)
8.7.2 地域別市場シェア、2023年・2033年(%)
8.8 燃焼前捕捉技術
8.8.1 2023~2033年の地域別市場規模(US$ Million)
8.8.2 地域別市場シェア、2023年・2033年(%)
8.9 その他の技術
8.9.1 2023~2033年の地域別市場規模(US$ Million)
8.9.2 地域別市場シェア、2023年・2033年 (%)
9 炭素回収・輸送・貯蔵市場分析:地域別
9.1 主要な調査結果
9.2 地域別市場規模の推定と予測
10 北米の炭素回収・輸送・貯蔵市場分析
10.1 主要な調査結果
10.2 北米の炭素回収・輸送・貯蔵市場魅力度指数
10.3 北米の炭素回収・輸送・貯蔵市場の国別市場規模、2023年、2028年、2033年(US$ Million)
10.4 北米の炭素回収・輸送・貯蔵市場規模の推定と予測
10.5 北米の炭素回収・輸送・貯蔵市場規模推定と予測:国別
10.6 北米の炭素回収・輸送・貯蔵市場規模推定と予測:事業タイプ別
10.7 北米の炭素回収・輸送・貯蔵市場規模推定と予測:輸送サービス別
10.8 北米の炭素回収・輸送・貯蔵市場規模推定と予測:サービス別
10.9 北米の炭素回収・輸送・貯蔵市場規模推定と予測:供給源別
10.10 北米の炭素回収・輸送・貯蔵市場規模推定と予測:技術別
10.11 アメリカの炭素回収・輸送・貯蔵市場分析
10.12 カナダの炭素回収・輸送・貯蔵市場分析
11 欧州の炭素回収・輸送・貯蔵市場分析
11.1 主要な調査結果
11.2 欧州の炭素回収・輸送・貯蔵市場魅力度指数
11.3 欧州の炭素回収・輸送・貯蔵の国別市場、2023年、2028年、2033年(US$ Million)
11.4 欧州の炭素回収・輸送・貯蔵市場規模推定と予測
11.5 欧州の炭素回収・輸送・貯蔵市場規模推定と予測:国別
11.6 欧州の炭素回収・輸送・貯蔵市場規模推定と予測:事業タイプ別
11.7 欧州の炭素回収・輸送・貯蔵市場規模推定と予測:輸送サービス別
11.8 欧州の炭素回収・輸送・貯蔵市場規模推定と予測:サービス別
11.9 欧州の炭素回収・輸送・貯蔵市場規模推定と予測:供給源別
11.10 欧州の炭素回収・輸送・貯蔵市場規模推定と予測:技術別
11.11 ドイツの炭素回収・輸送・貯蔵市場分析
11.12 イギリスの炭素回収・輸送・貯蔵市場分析
11.13 フランスの炭素回収・輸送・貯蔵市場分析
11.14 イタリアの炭素回収・輸送・貯蔵市場分析
11.15 ロシアの炭素回収・輸送・貯蔵市場分析
11.16 その他の欧州の炭素回収・輸送・貯蔵市場分析
12 アジア太平洋地域の炭素回収・輸送・貯蔵市場分析
12.1 主要な調査結果
12.2 アジア太平洋地域の炭素回収・輸送・貯蔵市場の魅力度指数
12.3 アジア太平洋地域の炭素回収・輸送・貯蔵の国別市場、2023年、2028年、2033年(US$ Million)
12.4 アジア太平洋地域の炭素回収・輸送・貯蔵市場の推定と予測
12.5 アジア太平洋地域の炭素回収・輸送・貯蔵市場規模推定と予測:国別
12.6 アジア太平洋地域の炭素回収・輸送・貯蔵市場規模推定と予測:事業タイプ別
12.7 アジア太平洋地域の炭素回収・輸送・貯蔵市場規模推定と予測:輸送サービス別
12.8 アジア太平洋地域の炭素回収・輸送・貯蔵市場規模推定と予測:サービス別
12.9 アジア太平洋地域の炭素回収・輸送・貯蔵市場規模推定と予測:供給源別
12.10 アジア太平洋地域の炭素回収・輸送・貯蔵市場規模推定と予測:技術別
12.11 中国の炭素回収・輸送・貯蔵市場分析
12.12 インドの炭素回収・輸送・貯蔵市場分析
12.13 日本の炭素回収・輸送・貯蔵市場分析
12.14 韓国の炭素回収・輸送・貯蔵市場分析
12.15 オーストラリアの炭素回収・輸送・貯蔵市場分析
12.16 その他のアジア太平洋地域の炭素回収・輸送・貯蔵市場分析
13 中東・アフリカの炭素回収・輸送・貯蔵市場分析
13.1 主要な調査結果
13.2 中東・アフリカ炭素回収・輸送・貯蔵市場魅力度指数
13.3 中東・アフリカ炭素回収・輸送・貯蔵の国別市場、2023年、2028年、2033年 (US$ Million)
13.4 中東・アフリカ炭素回収・輸送・貯蔵市場の推定と予測
13.5 中東・アフリカ炭素回収・輸送・貯蔵市場規模推定と予測:国別
13.6 中東・アフリカ炭素回収・輸送・貯蔵市場規模推定と予測:事業タイプ別
13.7 中東・アフリカ炭素回収・輸送・貯蔵市場規模推定と予測:輸送サービス別
13.8 中東・アフリカ炭素回収・輸送・貯蔵市場規模推定と予測:サービス別
13.9 中東・アフリカ炭素回収・輸送・貯蔵市場規模推定と予測:供給源別
13.10 中東・アフリカ炭素回収・輸送・貯蔵市場規模推定と予測:技術別
13.11 GCCの炭素回収・輸送・貯蔵市場分析
13.12 南アフリカの炭素回収・輸送・貯蔵市場分析
13.13 その他の中東・アフリカ地域の炭素回収・輸送・貯蔵市場分析
14 ラテンアメリカの炭素回収・輸送・貯蔵市場分析
14.1 主要な調査結果
14.2 ラテンアメリカの炭素回収・輸送・貯蔵市場魅力度指数
14.3 ラテンアメリカの炭素回収・輸送・貯蔵市場の国別市場規模、2023年、2028年、2033年(US$ Million)
14.4 ラテンアメリカの炭素回収・輸送・貯蔵市場規模推定と予測
14.5 ラテンアメリカの炭素回収・輸送・貯蔵市場規模推定と予測:国別
14.6 ラテンアメリカの炭素回収・輸送・貯蔵市場規模推定と予測:事業タイプ別
14.7 ラテンアメリカの炭素回収・輸送・貯蔵市場規模推定と予測:輸送サービス別
14.8 ラテンアメリカの炭素回収・輸送・貯蔵市場規模推定と予測:サービス別
14.9 ラテンアメリカの炭素回収・輸送・貯蔵市場規模推定と予測:供給源別
14.10 ラテンアメリカの炭素回収・輸送・貯蔵市場規模推定と予測:技術別
14.11 ブラジルの炭素回収・輸送・貯蔵市場分析
14.12 メキシコの炭素回収・輸送・貯蔵市場分析
14.13 その他のラテンアメリカの炭素回収・輸送・貯蔵市場分析
15 会社概要
15.1 競争環境、2022年
15.2 戦略的展望
15.3 Carbon Clean Solutions
15.3.1 会社概要
15.3.2 会社概要
15.3.3 製品ベンチマーク
15.3.4 戦略的展望
15.4 Carbon Engineering Ltd.
15.4.1 会社概要
15.4.2 会社概要
15.4.3 製品ベンチマーク
15.5 Climeworks AG
15.5.1 会社概要
15.5.2 会社概要
15.5.3 製品ベンチマーク
15.5.4 戦略的展望
15.6 Global Thermostat
15.6.1 企業スナップショット
15.6.2 会社概要
15.6.3 製品ベンチマーク
15.6.4 戦略的展望
15.7 Aker Carbon Capture
15.7.1 会社概要
15.7.2 会社概要
15.7.3 製品ベンチマーク
15.7.4 戦略的展望
15.8 Occidental Petroleum Corporation
15.8.1 会社概要
15.8.2 会社概要
15.8.3 財務分析
15.8.3.1 純収入、2018-2022年
15.8.3.2 R&D、2018年~2022年
15.8.3.3 地域別収益シェア、2022年(%)
15.8.3.4 事業セグメント収益シェア、2022年(%)
15.8.4 製品ベンチマーク
15.8.5 戦略的展望
15.9 Equinor ASA
15.9.1 会社概要
15.9.2 会社概要
15.9.3 財務分析
15.9.3.1 純収入、2018年~2022年
15.9.3.2 R&D、2018年~2022年
15.9.3.3 地域別収益シェア、2022年(%)
15.9.3.4 事業セグメント収益シェア、2022年(%)
15.9.4 製品ベンチマーク
15.9.5 戦略的展望
15.10 Royal Dutch Shell Plc
15.10.1 会社概要
15.10.2 会社概要
15.10.3 財務分析
15.10.3.1 純収入、2018年~2022年
15.10.3.2 R&D、2018年~2022年
15.10.3.3 地域別収入シェア、2022年(%)
15.10.3.4 事業セグメント収益シェア、2022年(%)
15.10.4 製品ベンチマーク
15.10.5 戦略的展望
15.11 Kinder Morgan, Inc.
15.11.1 会社概要
15.11.2 会社概要
15.11.3 財務分析
15.11.3.1 純収入、2018年~2022年
15.11.3.2 地域別収益シェア、2022年(%)
15.11.3.3 事業セグメント別売上シェア、2022年(%)
15.11.4 製品ベンチマーク
15.11.5 戦略的展望
15.12 TC Energy Corporation
15.12.1 会社概要
15.12.2 会社概要
15.12.3 財務分析
15.12.3.1 純収入、2018-2022年
15.12.3.2 地域別収益シェア、2022年(%)
15.12.3.3 事業セグメント別売上シェア、2022年(%)
15.12.4 製品ベンチマーク
15.12.5 戦略的展望
15.13 Enbridge Inc.
15.13.1 会社概要
15.13.2 会社概要
15.13.3 財務分析
15.13.3.1 純収入, 2018-2022
15.13.3.2 地域別収入シェア、2022年(%)
15.13.3.3 事業セグメント別売上シェア、2022年(%)
15.13.4 製品ベンチマーク
15.13.5 戦略的展望
15.14 Magellan Midstream Partners
15.14.1 会社概要
15.14.2 会社概要
15.14.3 財務分析
15.14.3.1 純収入、2018年~2022年
15.14.3.2 事業セグメント収益シェア、2022年(%)
15.14.4 製品ベンチマーク
15.15 Enterprise Products Partners L.P.
15.15.1 会社概要
15.15.2 会社概要
15.15.3 財務分析
15.15.3.1 純収入、2018年~2022年
15.15.3.2 事業セグメント収益シェア、2022年(%)
15.15.4 製品ベンチマーク
15.15.5 戦略的展望
15.16 Plains All American Pipeline, L.P.
15.16.1 会社概要
15.16.2 会社概要
15.16.3 財務分析
15.16.3.1 純収入、2018年~2022年
15.16.3.2 地域別収入シェア、2022年(%)
15.16.3.3 事業セグメント別売上シェア、2022年(%)
15.16.4 製品ベンチマーク
15.16.5 戦略的展望
15.17 The Williams Companies, Inc.
15.17.1 会社概要
15.17.2 会社概要
15.17.3 財務分析
15.17.3.1 純収入、2018-2022年
15.17.4 製品ベンチマーク
16 結論と提言
16.1 Visiongainからの結びの言葉
16.2 市場プレイヤーへの提言
ページTOPに戻る
図表リスト
表の一覧
Table 1 Carbon Capture, Transportation & Storage Market Snapshot, 2023 & 2033 (US$ Million, CAGR %)
Table 2 Global Carbon Capture, Transportation & Storage Market by Region, 2023-2033 (US$ Mn, AGR (%), CAGR (%)) (V-Shaped Recovery Scenario)
Table 3 Global Carbon Capture, Transportation & Storage Market by Region, 2023-2033 (US$ Mn, AGR (%), CAGR (%)) (U-Shaped Recovery Scenario)
Table 4 Global Carbon Capture, Transportation & Storage Market by Region, 2023-2033 (US$ Mn, AGR (%), CAGR (%)) (W-Shaped Recovery Scenario)
Table 5 Global Carbon Capture, Transportation & Storage Market by Region, 2023-2033 (US$ Mn, AGR (%), CAGR (%)) (L-Shaped Recovery Scenario)
Table 6 Global Carbon Capture, Transportation & Storage Market by Business Type, 2023-2033 (US$ Mn, AGR (%), CAGR (%))
Table 7 CCS Technology Market by Region, 2023-2033 (US$ Mn, AGR (%), CAGR (%))
Table 8 CCS Services Market by Region, 2023-2033 (US$ Mn, AGR (%), CAGR (%))
Table 9 Global Carbon Capture, Transportation & Storage Market by Transportation, 2023-2033 (US$ Mn, AGR (%), CAGR (%))
Table 10 Pipeline System Market by Region, 2023-2033 (US$ Mn, AGR (%), CAGR (%))
Table 11 Ship Carrier Market by Region, 2023-2033 (US$ Mn, AGR (%), CAGR (%))
Table 12 Motor Carrier Market by Region, 2023-2033 (US$ Mn, AGR (%), CAGR (%))
Table 13 Global Carbon Capture, Transportation & Storage Market by Service, 2023-2033 (US$ Mn, AGR (%), CAGR (%))
Table 14 Carbon Capture Services Market by Region, 2023-2033 (US$ Mn, AGR (%), CAGR (%))
Table 15 Carbon Storage Services Market by Region, 2023-2033 (US$ Mn, AGR (%), CAGR (%))
Table 16 Carbon Capture Transportation Services Market by Region, 2023-2033 (US$ Mn, AGR (%), CAGR (%))
Table 17 Other Services Market by Region, 2023-2033 (US$ Mn, AGR (%), CAGR (%))
Table 18 Global Carbon Capture, Transportation & Storage Market by Source, 2023-2033 (US$ Mn, AGR (%), CAGR (%))
Table 19 Power Generation Market by Region, 2023-2033 (US$ Mn, AGR (%), CAGR (%))
Table 20 Industrial Sector Market by Region, 2023-2033 (US$ Mn, AGR (%), CAGR (%))
Table 21 Transport Sector Market by Region, 2023-2033 (US$ Mn, AGR (%), CAGR (%))
Table 22 Construction Sector Market by Region, 2023-2033 (US$ Mn, AGR (%), CAGR (%))
Table 23 Other Sources Market by Region, 2023-2033 (US$ Mn, AGR (%), CAGR (%))
Table 24 Global Carbon Capture, Transportation & Storage Market by Technology, 2023-2033 (US$ Mn, AGR (%), CAGR (%))
Table 25 Industrial Separation Capture Technology Market by Region, 2023-2033 (US$ Mn, AGR (%), CAGR (%))
Table 26 Inherent Separation Technology Market by Region, 2023-2033 (US$ Mn, AGR (%), CAGR (%))
Table 27 OXY-Fuel Combustion Capture Technology Market by Region, 2023-2033 (US$ Mn, AGR (%), CAGR (%))
Table 28 Post-Combustion Capture Technology Market by Region, 2023-2033 (US$ Mn, AGR (%), CAGR (%))
Table 29 Pre-Combustion Capture Technology Market by Region, 2023-2033 (US$ Mn, AGR (%), CAGR (%))
Table 30 Other Technology Market by Region, 2023-2033 (US$ Mn, AGR (%), CAGR (%))
Table 31 Carbon Capture, Transportation & Storage Market Forecast by Region, 2023-2033 (US$ Million, AGR%, CAGR%)
Table 32 North America Carbon Capture, Transportation & Storage Market by Value, 2023-2033 (US$ Mn, AGR (%), CAGR (%))
Table 33 North America Carbon Capture, Transportation & Storage Market by Country, 2023-2033 (US$ Mn, AGR (%), CAGR (%))
Table 34 North America Carbon Capture, Transportation & Storage Market by Business Type, 2023-2033 (US$ Mn, AGR (%), CAGR (%))
Table 35 North America Carbon Capture, Transportation & Storage Market by Transportation, 2023-2033 (US$ Mn, AGR (%), CAGR (%))
Table 36 North America Carbon Capture, Transportation & Storage Market by Service, 2023-2033 (US$ Mn, AGR (%), CAGR (%))
Table 37 North America Carbon Capture, Transportation & Storage Market by Source, 2023-2033 (US$ Mn, AGR (%), CAGR (%))
Table 38 North America Carbon Capture, Transportation & Storage Market by Technology, 2023-2033 (US$ Mn, AGR (%), CAGR (%))
Table 39 US Carbon Capture, Transportation & Storage Market by Value, 2023-2033 (US$ Mn, AGR (%), CAGR (%))
Table 40 Canada Carbon Capture, Transportation & Storage Market by Value, 2023-2033 (US$ Mn, AGR (%), CAGR (%))
Table 41 Europe Carbon Capture, Transportation & Storage Market by Value, 2023-2033 (US$ Mn, AGR (%), CAGR (%))
Table 42 Europe Carbon Capture, Transportation & Storage Market by Country, 2023-2033 (US$ Mn, AGR (%), CAGR (%))
Table 43 Europe Carbon Capture, Transportation & Storage Market by Business Type, 2023-2033 (US$ Mn, AGR (%), CAGR (%))
Table 44 Europe Carbon Capture, Transportation & Storage Market by Transportation, 2023-2033 (US$ Mn, AGR (%), CAGR (%))
Table 45 Europe Carbon Capture, Transportation & Storage Market by Service, 2023-2033 (US$ Mn, AGR (%), CAGR (%))
Table 46 Europe Carbon Capture, Transportation & Storage Market by Source, 2023-2033 (US$ Mn, AGR (%), CAGR (%))
Table 47 Europe Carbon Capture, Transportation & Storage Market by Technology, 2023-2033 (US$ Mn, AGR (%), CAGR (%))
Table 48 Germany Carbon Capture, Transportation & Storage Market by Value, 2023-2033 (US$ Mn, AGR (%), CAGR (%))
Table 49 UK Carbon Capture, Transportation & Storage Market by Value, 2023-2033 (US$ Mn, AGR (%), CAGR (%))
Table 50 France Carbon Capture, Transportation & Storage Market by Value, 2023-2033 (US$ Mn, AGR (%), CAGR (%))
Table 51 Italy Carbon Capture, Transportation & Storage Market by Value, 2023-2033 (US$ Mn, AGR (%), CAGR (%))
Table 52 Russia Carbon Capture, Transportation & Storage Market by Value, 2023-2033 (US$ Mn, AGR (%), CAGR (%))
Table 53 Rest of Europe Carbon Capture, Transportation & Storage Market by Value, 2023-2033 (US$ Mn, AGR (%), CAGR (%))
Table 54 Asia-Pacific Carbon Capture, Transportation & Storage Market by Value, 2023-2033 (US$ Mn, AGR (%), CAGR (%))
Table 55 Asia-Pacific Carbon Capture, Transportation & Storage Market by Country, 2023-2033 (US$ Mn, AGR (%), CAGR (%))
Table 56 Asia-Pacific Carbon Capture, Transportation & Storage Market by Business Type, 2023-2033 (US$ Mn, AGR (%), CAGR (%))
Table 57 Asia-Pacific Carbon Capture, Transportation & Storage Market by Transportation, 2023-2033 (US$ Mn, AGR (%), CAGR (%))
Table 58 Asia-Pacific Carbon Capture, Transportation & Storage Market by Service, 2023-2033 (US$ Mn, AGR (%), CAGR (%))
Table 59 Asia-Pacific Carbon Capture, Transportation & Storage Market by Source, 2023-2033 (US$ Mn, AGR (%), CAGR (%))
Table 60 Asia-Pacific Carbon Capture, Transportation & Storage Market by Technology, 2023-2033 (US$ Mn, AGR (%), CAGR (%))
Table 61 China Carbon Capture, Transportation & Storage Market by Value, 2023-2033 (US$ Mn, AGR (%), CAGR (%))
Table 62 India Carbon Capture, Transportation & Storage Market by Value, 2023-2033 (US$ Mn, AGR (%), CAGR (%))
Table 63 Japan Carbon Capture, Transportation & Storage Market by Value, 2023-2033 (US$ Mn, AGR (%), CAGR (%))
Table 64 South Korea Carbon Capture, Transportation & Storage Market by Value, 2023-2033 (US$ Mn, AGR (%), CAGR (%))
Table 65 Australia Carbon Capture, Transportation & Storage Market by Value, 2023-2033 (US$ Mn, AGR (%), CAGR (%))
Table 66 Rest of Asia-Pacific Carbon Capture, Transportation & Storage Market by Value, 2023-2033 (US$ Mn, AGR (%), CAGR (%))
Table 67 Middle East & Africa Carbon Capture, Transportation & Storage Market by Value, 2023-2033 (US$ Mn, AGR (%), CAGR (%))
Table 68 Middle East & Africa Carbon Capture, Transportation & Storage Market by Country, 2023-2033 (US$ Mn, AGR (%), CAGR (%))
Table 69 Middle East & Africa Carbon Capture, Transportation & Storage Market by Business Type, 2023-2033 (US$ Mn, AGR (%), CAGR (%))
Table 70 Middle East & Africa Carbon Capture, Transportation & Storage Market by Transportation, 2023-2033 (US$ Mn, AGR (%), CAGR (%))
Table 71 Middle East & Africa Carbon Capture, Transportation & Storage Market by Service, 2023-2033 (US$ Mn, AGR (%), CAGR (%))
Table 72 Middle East & Africa Carbon Capture, Transportation & Storage Market by Source, 2023-2033 (US$ Mn, AGR (%), CAGR (%))
Table 73 Middle East & Africa Carbon Capture, Transportation & Storage Market by Technology, 2023-2033 (US$ Mn, AGR (%), CAGR (%))
Table 74 GCC Carbon Capture, Transportation & Storage Market by Value, 2023-2033 (US$ Mn, AGR (%), CAGR (%))
Table 75 South Africa Carbon Capture, Transportation & Storage Market by Value, 2023-2033 (US$ Mn, AGR (%), CAGR (%))
Table 76 Rest of Middle East & Africa Carbon Capture, Transportation & Storage Market by Value, 2023-2033 (US$ Mn, AGR (%), CAGR (%))
Table 77 Latin America Carbon Capture, Transportation & Storage Market by Value, 2023-2033 (US$ Mn, AGR (%), CAGR (%))
Table 78 Latin America Carbon Capture, Transportation & Storage Market by Country, 2023-2033 (US$ Mn, AGR (%), CAGR (%))
Table 79 Latin America Carbon Capture, Transportation & Storage Market by Business Type, 2023-2033 (US$ Mn, AGR (%), CAGR (%))
Table 80 Latin America Carbon Capture, Transportation & Storage Market by Transportation, 2023-2033 (US$ Mn, AGR (%), CAGR (%))
Table 81 Latin America Carbon Capture, Transportation & Storage Market by Service, 2023-2033 (US$ Mn, AGR (%), CAGR (%))
Table 82 Latin America Carbon Capture, Transportation & Storage Market by Source, 2023-2033 (US$ Mn, AGR (%), CAGR (%))
Table 83 Latin America Carbon Capture, Transportation & Storage Market by Technology, 2023-2033 (US$ Mn, AGR (%), CAGR (%))
Table 84 Brazil Carbon Capture, Transportation & Storage Market by Value, 2023-2033 (US$ Mn, AGR (%), CAGR (%))
Table 85 Mexico Carbon Capture, Transportation & Storage Market by Value, 2023-2033 (US$ Mn, AGR (%), CAGR (%))
Table 86 Rest of Latin America Carbon Capture, Transportation & Storage Market by Value, 2023-2033 (US$ Mn, AGR (%), CAGR (%))
Table 87 Strategic Outlook - Contract
Table 88 Carbon Clean Solutions: Key Details, (CEO, HQ, Revenue, Founded, No. of Employees, Company Type, Website, Business Segment)
Table 89 Carbon Clean Solutions: Product Benchmarking
Table 90 Carbon Clean Solutions: Strategic Outlook
Table 91 Carbon Engineering Ltd.: Key Details, (CEO, HQ, Revenue, Founded, No. of Employees, Company Type, Website, Business Segment)
Table 92 Carbon Engineering Ltd.: Product Benchmarking
Table 93 Climeworks AG: Key Details, (CEO, HQ, Revenue, Founded, No. of Employees, Company Type, Website, Business Segment)
Table 94 Climeworks AG: Strategic Outlook
Table 95 Global Thermostat: Key Details, (CEO, HQ, Revenue, Founded, No. of Employees, Company Type, Website, Business Segment)
Table 96 Global Thermostat: Product Benchmarking
Table 97 Global Thermostat: Strategic Outlook
Table 98 Aker Carbon Capture: Key Details, (CEO, HQ, Revenue, Founded, No. of Employees, Company Type, Website, Business Segment)
Table 99 Aker Carbon Capture: Product Benchmarking
Table 100 Aker Carbon Capture: Strategic Outlook
Table 101 Occidental Petroleum Corporation: Key Details, (CEO, HQ, Revenue, Founded, No. of Employees, Company Type, Website, Business Segment)
Table 102 Occidental Petroleum Corporation: Product Benchmarking
Table 103 Occidental Petroleum Corporation: Strategic Outlook
Table 104 Equinor ASA: Key Details, (CEO, HQ, Revenue, Founded, No. of Employees, Company Type, Website, Business Segment)
Table 105 Equinor ASA: Strategic Outlook
Table 106 Royal Dutch Shell Plc: Key Details, (CEO, HQ, Revenue, Founded, No. of Employees, Company Type, Website, Business Segment)
Table 107 Royal Dutch Shell Plc: Strategic Outlook
Table 108 Kinder Morgan, Inc.: Key Details, (CEO, HQ, Revenue, Founded, No. of Employees, Company Type, Website, Business Segment)
Table 109 Kinder Morgan, Inc: Strategic Outlook
Table 110 TC Energy Corporation: Key Details, (CEO, HQ, Revenue, Founded, No. of Employees, Company Type, Website, Business Segment)
Table 111 TC Energy Corporation: Product Benchmarking
Table 112 TC Energy Corporation: Strategic Outlook
Table 113 Enbridge Inc.: Key Details, (CEO, HQ, Revenue, Founded, No. of Employees, Company Type, Website, Business Segment)
Table 114 Enbridge Inc: Strategic Outlook
Table 115 Magellan Midstream Partners: Key Details, (CEO, HQ, Revenue, Founded, No. of Employees, Company Type, Website, Business Segment)
Table 116 Enterprise Products Partners L.P.: Key Details, (CEO, HQ, Revenue, Founded, No. of Employees, Company Type, Website, Business Segment)
Table 117 Enterprise Products Partners L.P: Strategic Outlook
Table 118 Plains All American Pipeline, L.P.: Key Details, (CEO, HQ, Revenue, Founded, No. of Employees, Company Type, Website, Business Segment)
Table 119 Plains All American Pipeline, L.P: Strategic Outlook
Table 120 The Williams Companies, Inc.: Key Details, (CEO, HQ, Revenue, Founded, No. of Employees, Company Type, Website, Business Segment)
図の一覧
Figure 1 Carbon Capture, Transportation & Storage Market Segmentation
Figure 2 Carbon Capture, Transportation & Storage Market by Business Type: Market Attractiveness Index
Figure 3 Carbon Capture, Transportation & Storage Market by Transportation Services: Market Attractiveness Index
Figure 4 Carbon Capture, Transportation & Storage Market by Service: Market Attractiveness Index
Figure 5 Carbon Capture, Transportation & Storage Market by Source: Market Attractiveness Index
Figure 6 Carbon Capture, Transportation & Storage Market by Technology: Market Attractiveness Index
Figure 7 Carbon Capture, Transportation & Storage Market Attractiveness Index by Region
Figure 8 Carbon Capture, Transportation & Storage Market: Market Dynamics
Figure 9 Power Generation from Carbon Capture Technologies Forecast
Figure 10 Carbon Capture, Transportation & Storage Market: Porter’s Five Forces Analysis
Figure 11 Global Carbon Capture, Transportation & Storage Market Share Forecast by COVID, 2023-2033 (%)
Figure 12 Global Carbon Capture, Transportation & Storage Market by Region, 2023-2033 (US$ Mn, AGR (%)) (V-Shaped Recovery Scenario)
Figure 13 Global Carbon Capture, Transportation & Storage Market by Region, 2023-2033 (US$ Mn, AGR (%)) (U-Shaped Recovery Scenario)
Figure 14 Global Carbon Capture, Transportation & Storage Market by Region, 2023-2033 (US$ Mn, AGR (%)) (W-Shaped Recovery Scenario)
Figure 15 Global Carbon Capture, Transportation & Storage Market by Region, 2023-2033 (US$ Mn, AGR (%)) (L-Shaped Recovery Scenario)
Figure 16 Carbon Capture, Transportation & Storage Market: PEST Analysis
Figure 17 Carbon Capture, Transportation & Storage Market by Business Type: Market Attractiveness Index
Figure 18 Global Carbon Capture, Transportation & Storage Market by Business Type, 2023-2033 (US$ Mn, AGR (%))
Figure 19 Carbon Capture, Transportation & Storage Market Share Forecast by Business Type, 2023, 2028, 2033 (%)
Figure 20 CCS Technology Market by Region, 2023-2033 (US$ Mn, AGR (%))
Figure 21 CCS Technology Market Share Forecast by Region, 2023 & 2033 (%)
Figure 22 CCS Services Market by Region, 2023-2033 (US$ Mn, AGR (%))
Figure 23 CCS Services Market Share Forecast by Region, 2023 & 2033 (%)
Figure 24 Carbon Capture, Transportation & Storage Market by Transportation Services: Market Attractiveness Index
Figure 25 Global Carbon Capture, Transportation & Storage Market by Transportation, 2023-2033 (US$ Mn, AGR (%))
Figure 26 Carbon Capture, Transportation & Storage Market Share Forecast by Transportation Services, 2023, 2028, 2033 (%)
Figure 27 Pipeline System Market by Region, 2023-2033 (US$ Mn, AGR (%))
Figure 28 Pipeline System Market Share Forecast by Region, 2023 & 2033 (%)
Figure 29 Ship Carrier Market by Region, 2023-2033 (US$ Mn, AGR (%))
Figure 30 Ship Carrier Market Share Forecast by Region, 2023 & 2033 (%)
Figure 31 Motor Carrier Market by Region, 2023-2033 (US$ Mn, AGR (%))
Figure 32 Motor Carrier Market Share Forecast by Region, 2023 & 2033 (%)
Figure 33 Carbon Capture, Transportation & Storage Market by Service: Market Attractiveness Index
Figure 34 Global Carbon Capture, Transportation & Storage Market by Service, 2023-2033 (US$ Mn, AGR (%))
Figure 35 Carbon Capture, Transportation & Storage Market Share Forecast by Service, 2023, 2028, 2033 (%)
Figure 36 Carbon Capture Services Market by Region, 2023-2033 (US$ Mn, AGR (%))
Figure 37 Carbon Capture Services Market Share Forecast by Region, 2023 & 2033 (%)
Figure 38 Carbon Storage Services Market by Region, 2023-2033 (US$ Mn, AGR (%))
Figure 39 Carbon Storage Services Market Share Forecast by Region, 2023 & 2033 (%)
Figure 40 Carbon Capture Transportation Services Market by Region, 2023-2033 (US$ Mn, AGR (%))
Figure 41 Carbon Capture Transportation Services Market Share Forecast by Region, 2023 & 2033 (%)
Figure 42 Other Services Market by Region, 2023-2033 (US$ Mn, AGR (%))
Figure 43 Other Services Market Share Forecast by Region, 2023 & 2033 (%)
Figure 44 Carbon Capture, Transportation & Storage Market by Source: Market Attractiveness Index
Figure 45 Global Carbon Capture, Transportation & Storage Market by Source, 2023-2033 (US$ Mn, AGR (%))
Figure 46 Carbon Capture, Transportation & Storage Market Share Forecast by Source, 2023, 2028, 2033 (%)
Figure 47 Power Generation Market by Region, 2023-2033 (US$ Mn, AGR (%))
Figure 48 Power Generation Market Share Forecast by Region, 2023 & 2033 (%)
Figure 49 Industrial Sector Market by Region, 2023-2033 (US$ Mn, AGR (%))
Figure 50 Industrial Sector Market Share Forecast by Region, 2023 & 2033 (%)
Figure 51 Transport Sector Market by Region, 2023-2033 (US$ Mn, AGR (%))
Figure 52 Transport Sector Market Share Forecast by Region, 2023 & 2033 (%)
Figure 53 Construction Sector Market by Region, 2023-2033 (US$ Mn, AGR (%))
Figure 54 Construction Sector Market Share Forecast by Region, 2023 & 2033 (%)
Figure 55 Other Sources Market by Region, 2023-2033 (US$ Mn, AGR (%))
Figure 56 Other Sources Market Share Forecast by Region, 2023 & 2033 (%)
Figure 57 Carbon Capture, Transportation & Storage Market by Technology: Market Attractiveness Index
Figure 58 Global Carbon Capture, Transportation & Storage Market by Technology, 2023-2033 (US$ Mn, AGR (%))
Figure 59 Carbon Capture, Transportation & Storage Market Share Forecast by Technology, 2023, 2028, 2033 (%)
Figure 60 Industrial Separation Capture Technology Market by Region, 2023-2033 (US$ Mn, AGR (%))
Figure 61 Industrial Separation Capture Technology Market Share Forecast by Region, 2023 & 2033 (%)
Figure 62 Inherent Separation Technology Market by Region, 2023-2033 (US$ Mn, AGR (%))
Figure 63 Inherent Separation Technology Market Share Forecast by Region, 2023 & 2033 (%)
Figure 64 OXY-Fuel Combustion Capture Technology Market by Region, 2023-2033 (US$ Mn, AGR (%))
Figure 65 OXY-Fuel Combustion Capture Technology Market Share Forecast by Region, 2023 & 2033 (%)
Figure 66 Post-Combustion Capture Technology Market by Region, 2023-2033 (US$ Mn, AGR (%))
Figure 67 Post-Combustion Capture Technology Market Share Forecast by Region, 2023 & 2033 (%)
Figure 68 Pre-Combustion Capture Technology Market by Region, 2023-2033 (US$ Mn, AGR (%))
Figure 69 Pre-Combustion Capture Technology Market Share Forecast by Region, 2023 & 2033 (%)
Figure 70 Other Technology Market by Region, 2023-2033 (US$ Mn, AGR (%))
Figure 71 Other Technology Market Share Forecast by Region, 2023 & 2033 (%)
Figure 72 Carbon Capture, Transportation & Storage Market Forecast by Region 2023 and 2033 (Revenue, CAGR%)
Figure 73 Carbon Capture, Transportation & Storage Market Share Forecast by Region 2023, 2028, 2033 (%)
Figure 74 Carbon Capture, Transportation & Storage Market by Region, 2023-2033 (US$ Million, AGR %)
Figure 75 North America Carbon Capture, Transportation & Storage Market Attractiveness Index
Figure 76 North America Carbon Capture, Transportation & Storage Market by Region, 2023, 2028 & 2033 (US$ Million)
Figure 77 North America Carbon Capture, Transportation & Storage Market by Value, 2023-2033 (US$ Mn, AGR (%))
Figure 78 North America Carbon Capture, Transportation & Storage Market by Country, 2023-2033 (US$ Mn, AGR (%))
Figure 79 North America Carbon Capture, Transportation & Storage Market Share Forecast by Country, 2023 & 2033 (%)
Figure 80 North America Carbon Capture, Transportation & Storage Market by Business Type, 2023-2033 (US$ Mn, AGR (%))
Figure 81 North America Carbon Capture, Transportation & Storage Market Share Forecast Business Type, 2023 & 2033 (%)
Figure 82 North America Carbon Capture, Transportation & Storage Market by Transportation, 2023-2033 (US$ Mn, AGR (%))
Figure 83 North America Carbon Capture, Transportation & Storage Market Share Forecast by Transportation Services, 2023 & 2033 (%)
Figure 84 North America Carbon Capture, Transportation & Storage Market by Service, 2023-2033 (US$ Mn, AGR (%))
Figure 85 North America Carbon Capture, Transportation & Storage Market Share Forecast by Service, 2023 & 2033 (%)
Figure 86 North America Carbon Capture, Transportation & Storage Market by Source, 2023-2033 (US$ Mn, AGR (%))
Figure 87 North America Carbon Capture, Transportation & Storage Market Share Forecast by Source, 2023 & 2033 (%)
Figure 88 North America Carbon Capture, Transportation & Storage Market by Technology, 2023-2033 (US$ Mn, AGR (%))
Figure 89 North America Carbon Capture, Transportation & Storage Market Share Forecast by Technology, 2023 & 2033 (%)
Figure 90 US Carbon Capture, Transportation & Storage Market by Value, 2023-2033 (US$ Mn, AGR (%))
Figure 91 Canada Carbon Capture, Transportation & Storage Market by Value, 2023-2033 (US$ Mn, AGR (%))
Figure 92 Europe Carbon Capture, Transportation & Storage Market Attractiveness Index
Figure 93 Europe Carbon Capture, Transportation & Storage Market by Region, 2023, 2028 & 2033 (US$ Million)
Figure 94 Europe Carbon Capture, Transportation & Storage Market by Value, 2023-2033 (US$ Mn, AGR (%))
Figure 95 Europe Carbon Capture, Transportation & Storage Market by Country, 2023-2033 (US$ Mn, AGR (%))
Figure 96 Europe Carbon Capture, Transportation & Storage Market Share Forecast by Country, 2023 & 2033 (%)
Figure 97 Europe Carbon Capture, Transportation & Storage Market by Business Type, 2023-2033 (US$ Mn, AGR (%))
Figure 98 Europe Carbon Capture, Transportation & Storage Market Share Forecast Business Type, 2023 & 2033 (%)
Figure 99 Europe Carbon Capture, Transportation & Storage Market by Transportation, 2023-2033 (US$ Mn, AGR (%))
Figure 100 Europe Carbon Capture, Transportation & Storage Market Share Forecast by Transportation Services, 2023 & 2033 (%)
Figure 101 Europe Carbon Capture, Transportation & Storage Market by Service, 2023-2033 (US$ Mn, AGR (%))
Figure 102 Europe Carbon Capture, Transportation & Storage Market Share Forecast by Service, 2023 & 2033 (%)
Figure 103 Europe Carbon Capture, Transportation & Storage Market by Source, 2023-2033 (US$ Mn, AGR (%))
Figure 104 Europe Carbon Capture, Transportation & Storage Market Share Forecast by Source, 2023 & 2033 (%)
Figure 105 Europe Carbon Capture, Transportation & Storage Market by Technology, 2023-2033 (US$ Mn, AGR (%))
Figure 106 Europe Carbon Capture, Transportation & Storage Market Share Forecast by Technology, 2023 & 2033 (%)
Figure 107 Germany Carbon Capture, Transportation & Storage Market by Value, 2023-2033 (US$ Mn, AGR (%))
Figure 108 UK Carbon Capture, Transportation & Storage Market by Value, 2023-2033 (US$ Mn, AGR (%))
Figure 109 France Carbon Capture, Transportation & Storage Market by Value, 2023-2033 (US$ Mn, AGR (%))
Figure 110 Italy Carbon Capture, Transportation & Storage Market by Value, 2023-2033 (US$ Mn, AGR (%))
Figure 111 Russia Carbon Capture, Transportation & Storage Market by Value, 2023-2033 (US$ Mn, AGR (%))
Figure 112 Rest of Europe Carbon Capture, Transportation & Storage Market by Value, 2023-2033 (US$ Mn, AGR (%))
Figure 113 Asia-Pacific Carbon Capture, Transportation & Storage Market Attractiveness Index
Figure 114 Asia-Pacific Carbon Capture, Transportation & Storage Market by Region, 2023, 2028 & 2033 (US$ Million)
Figure 115 Asia-Pacific Carbon Capture, Transportation & Storage Market by Value, 2023-2033 (US$ Mn, AGR (%))
Figure 116 Asia-Pacific Carbon Capture, Transportation & Storage Market by Country, 2023-2033 (US$ Mn, AGR (%))
Figure 117 Asia-Pacific Carbon Capture, Transportation & Storage Market Share Forecast by Country, 2023 & 2033 (%)
Figure 118 Asia-Pacific Carbon Capture, Transportation & Storage Market by Business Type, 2023-2033 (US$ Mn, AGR (%))
Figure 119 Asia-Pacific Carbon Capture, Transportation & Storage Market Share Forecast Business Type, 2023 & 2033 (%)
Figure 120 Asia-Pacific Carbon Capture, Transportation & Storage Market by Transportation, 2023-2033 (US$ Mn, AGR (%))
Figure 121 Asia-Pacific Carbon Capture, Transportation & Storage Market Share Forecast by Transportation Services, 2023 & 2033 (%)
Figure 122 Asia-Pacific Carbon Capture, Transportation & Storage Market by Service, 2023-2033 (US$ Mn, AGR (%))
Figure 123 Asia-Pacific Carbon Capture, Transportation & Storage Market Share Forecast by Service, 2023 & 2033 (%)
Figure 124 Asia-Pacific Carbon Capture, Transportation & Storage Market by Source, 2023-2033 (US$ Mn, AGR (%))
Figure 125 Asia-Pacific Carbon Capture, Transportation & Storage Market Share Forecast by Source, 2023 & 2033 (%)
Figure 126 Asia-Pacific Carbon Capture, Transportation & Storage Market by Technology, 2023-2033 (US$ Mn, AGR (%))
Figure 127 Asia-Pacific Carbon Capture, Transportation & Storage Market Share Forecast by Technology, 2023 & 2033 (%)
Figure 128 China Carbon Capture, Transportation & Storage Market by Value, 2023-2033 (US$ Mn, AGR (%))
Figure 129 India Carbon Capture, Transportation & Storage Market by Value, 2023-2033 (US$ Mn, AGR (%))
Figure 130 Japan Carbon Capture, Transportation & Storage Market by Value, 2023-2033 (US$ Mn, AGR (%))
Figure 131 South Korea Carbon Capture, Transportation & Storage Market by Value, 2023-2033 (US$ Mn, AGR (%))
Figure 132 Australia Carbon Capture, Transportation & Storage Market by Value, 2023-2033 (US$ Mn, AGR (%))
Figure 133 Rest of Asia-Pacific Carbon Capture, Transportation & Storage Market by Value, 2023-2033 (US$ Mn, AGR (%))
Figure 134 Middle East and Africa Carbon Capture, Transportation & Storage Market Attractiveness Index
Figure 135 Middle East and Africa Carbon Capture, Transportation & Storage Market by Region, 2023, 2028 & 2033 (US$ Million)
Figure 136 Middle East & Africa Carbon Capture, Transportation & Storage Market by Value, 2023-2033 (US$ Mn, AGR (%))
Figure 137 Middle East & Africa Carbon Capture, Transportation & Storage Market by Country, 2023-2033 (US$ Mn, AGR (%))
Figure 138 Middle East and Africa Carbon Capture, Transportation & Storage Market Share Forecast by Country, 2023 & 2033 (%)
Figure 139 Middle East & Africa Carbon Capture, Transportation & Storage Market by Business Type, 2023-2033 (US$ Mn, AGR (%))
Figure 140 Middle East and Africa Carbon Capture, Transportation & Storage Market Share Forecast Business Type, 2023 & 2033 (%)
Figure 141 Middle East & Africa Carbon Capture, Transportation & Storage Market by Transportation, 2023-2033 (US$ Mn, AGR (%))
Figure 142 Middle East and Africa Carbon Capture, Transportation & Storage Market Share Forecast by Transportation Services, 2023 & 2033 (%)
Figure 143 Middle East & Africa Carbon Capture, Transportation & Storage Market by Service, 2023-2033 (US$ Mn, AGR (%))
Figure 144 Middle East and Africa Carbon Capture, Transportation & Storage Market Share Forecast by Service, 2023 & 2033 (%)
Figure 145 Middle East & Africa Carbon Capture, Transportation & Storage Market by Source, 2023-2033 (US$ Mn, AGR (%))
Figure 146 Middle East and Africa Carbon Capture, Transportation & Storage Market Share Forecast by Source, 2023 & 2033 (%)
Figure 147 Middle East & Africa Carbon Capture, Transportation & Storage Market by Technology, 2023-2033 (US$ Mn, AGR (%))
Figure 148 Middle East and Africa Carbon Capture, Transportation & Storage Market Share Forecast by Technology, 2023 & 2033 (%)
Figure 149 GCC Carbon Capture, Transportation & Storage Market by Value, 2023-2033 (US$ Mn, AGR (%))
Figure 150 South Africa Carbon Capture, Transportation & Storage Market by Value, 2023-2033 (US$ Mn, AGR (%))
Figure 151 Rest of Middle East & Africa Carbon Capture, Transportation & Storage Market by Value, 2023-2033 (US$ Mn, AGR (%))
Figure 152 Latin America Carbon Capture, Transportation & Storage Market Attractiveness Index
Figure 153 Latin America Carbon Capture, Transportation & Storage Market by Region, 2023, 2028 & 2033 (US$ Million)
Figure 154 Latin America Carbon Capture, Transportation & Storage Market by Value, 2023-2033 (US$ Mn, AGR (%))
Figure 155 Latin America Carbon Capture, Transportation & Storage Market by Country, 2023-2033 (US$ Mn, AGR (%))
Figure 156 Latin America Carbon Capture, Transportation & Storage Market Share Forecast by Country, 2023 & 2033 (%)
Figure 157 Latin America Carbon Capture, Transportation & Storage Market by Business Type, 2023-2033 (US$ Mn, AGR (%))
Figure 158 Latin America Carbon Capture, Transportation & Storage Market Share Forecast Business Type, 2023 & 2033 (%)
Figure 159 Latin America Carbon Capture, Transportation & Storage Market by Transportation, 2023-2033 (US$ Mn, AGR (%))
Figure 160 Latin America Carbon Capture, Transportation & Storage Market Share Forecast by Transportation Services, 2023 & 2033 (%)
Figure 161 Latin America Carbon Capture, Transportation & Storage Market by Service, 2023-2033 (US$ Mn, AGR (%))
Figure 162 Latin America Carbon Capture, Transportation & Storage Market Share Forecast by Service, 2023 & 2033 (%)
Figure 163 Latin America Carbon Capture, Transportation & Storage Market by Source, 2023-2033 (US$ Mn, AGR (%))
Figure 164 Latin America Carbon Capture, Transportation & Storage Market Share Forecast by Source, 2023 & 2033 (%)
Figure 165 Latin America Carbon Capture, Transportation & Storage Market by Technology, 2023-2033 (US$ Mn, AGR (%))
Figure 166 Latin America Carbon Capture, Transportation & Storage Market Share Forecast by Technology, 2023 & 2033 (%)
Figure 167 Brazil Carbon Capture, Transportation & Storage Market by Value, 2023-2033 (US$ Mn, AGR (%))
Figure 168 Mexico Carbon Capture, Transportation & Storage Market by Value, 2023-2033 (US$ Mn, AGR (%))
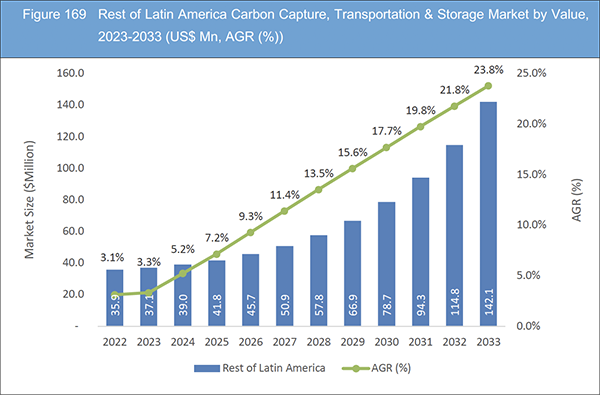
Figure 169 Rest of Latin America Carbon Capture, Transportation & Storage Market by Value, 2023-2033 (US$ Mn, AGR (%))
Figure 170 Carbon Capture, Transportation & Storage Market: Company Share, 2022
Figure 171 Occidental Petroleum Corporation.: Net Revenue, 2018-2022 (US$ Million, AGR%)
Figure 172 Occidental Petroleum Corporation. R&D, 2018-2022 (US$ Million, AGR%)
Figure 173 Occidental Petroleum Corporation.: Regional Revenue Share, 2022 (%)
Figure 174 Occidental Petroleum Corporation.: Business Segment Revenue Share, 2022 (%)
Figure 175 Equinor ASA.: Net Revenue, 2018-2022 (US$ Million, AGR%)
Figure 176 Equinor ASA.: R&D, 2018-2022 (US$ Million, AGR%)
Figure 177 Equinor ASA.: Regional Revenue Share, 2022 (%)
Figure 178 Equinor ASA.: Business Segment Revenue Share, 2022 (%)
Figure 179 Royal Dutch Shell Plc.: Net Revenue, 2018-2022 (US$ Million, AGR%)
Figure 180 Royal Dutch Shell Plc.: R&D, 2018-2022 (US$ Million, AGR%)
Figure 181 Royal Dutch Shell Plc.: Regional Revenue Share, 2022 (%)
Figure 182 Royal Dutch Shell Plc.: Business Segment Revenue Share, 2022 (%)
Figure 183 Kinder Morgan, Inc.: Net Revenue, 2018-2022 (US$ Million, AGR%)
Figure 184 Kinder Morgan, Inc.: Regional Revenue Share, 2022 (%)
Figure 185 Kinder Morgan, Inc.: Business Segment Revenue Share, 2022 (%)
Figure 186 TC Energy Corporation.: Net Revenue, 2018-2022 (US$ Million, AGR%)
Figure 187 TC Energy Corporation.: Regional Revenue Share, 2022 (%)
Figure 188 TC Energy Corporation.: Business Segment Revenue Share, 2022 (%)
Figure 189 Enbridge Inc.: Net Revenue, 2018-2022 (US$ Million, AGR%)
Figure 190 Enbridge Inc.: Regional Revenue Share, 2022 (%)
Figure 191 Enbridge Inc.: Business Segment Revenue Share, 2022 (%)
Figure 192 Magellan Midstream Partners. Net Revenue, 2018-2022 (US$ Million, AGR%)
Figure 193 Magellan Midstream Partners. Business Segment Revenue Share, 2022 (%)
Figure 194 Enterprise Products Partners L.P.: Net Revenue, 2018-2022 (US$ Million, AGR%)
Figure 195 Enterprise Products Partners L.P.: Business Segment Revenue Share, 2022 (%)
Figure 196 Plains All American Pipeline, L.P.: Net Revenue, 2018-2022 (US$ Million, AGR%)
Figure 197 Plains All American Pipeline, L.P.: Regional Revenue Share, 2022 (%)
Figure 198 Plains All American Pipeline, L.P.: Business Segment Revenue Share, 2022 (%)
Figure 199 The Williams Companies, Inc.: Net Revenue, 2018-2022 (US$ Million, AGR%)
ページTOPに戻る
Summary
Report Details
The Carbon Capture, Transportation & Storage Market Report 2023-2033: This report will prove invaluable to leading firms striving for new revenue pockets if they wish to better understand the industry and its underlying dynamics. It will be useful for companies that would like to expand into different industries or to expand their existing operations in a new region.
Pioneering Carbon Mitigation: Urgency in CCTS Solutions
The increasing awareness of climate change and its detrimental effects on the environment has propelled the carbon capture, transportation & storage (CCTS) market forward. As global temperatures rise and greenhouse gas emissions continue to escalate, the imperative to reduce CO2 levels in the atmosphere has become undeniable. CCTS technologies offer a proactive approach to mitigating climate change by capturing carbon emissions from various industries, preventing their release into the atmosphere, and ensuring safe long-term storage.
Compliance and Beyond: Meeting Ambitious Emission Targets
Ambitious emission reduction targets set by international agreements like the Paris Agreement have prompted industries to adopt carbon capture and storage solutions. To achieve these targets, many governments and organizations are turning to CCTS technologies to help lower their carbon footprints. The CCTS market responds to these mandates by offering viable pathways for industries to significantly cut their CO2 emissions and contribute to global sustainability efforts.
What Questions Should You Ask before Buying a Market Research Report?
• How is the carbon capture, transportation & storage market evolving?
• What is driving and restraining the carbon capture, transportation & storage market?
• How will each carbon capture, transportation & storage submarket segment grow over the forecast period and how much revenue will these submarkets account for in 2033?
• How will the market shares for each carbon capture, transportation & storage submarket develop from 2023 to 2033?
• What will be the main driver for the overall market from 2023 to 2033?
• Will leading carbon capture, transportation & storage markets broadly follow the macroeconomic dynamics, or will individual national markets outperform others?
• How will the market shares of the national markets change by 2033 and which geographical region will lead the market in 2033?
• Who are the leading players and what are their prospects over the forecast period?
• What are the carbon capture, transportation & storage projects for these leading companies?
• How will the industry evolve during the period between 2023 and 2033? What are the implications of carbon capture, transportation & storage projects taking place now and over the next 10 years?
• Is there a greater need for product commercialisation to further scale the carbon capture, transportation & storage market?
• Where is the carbon capture, transportation & storage market heading and how can you ensure you are at the forefront of the market?
• What are the best investment options for new product and service lines?
• What are the key prospects for moving companies into a new growth path and C-suite?
You need to discover how this will impact the carbon capture, transportation & storage market today, and over the next 10 years:
• Our 435-page report provides 120 tables and 199 charts/graphs exclusively to you.
• The report highlights key lucrative areas in the industry so you can target them – NOW.
• It contains in-depth analysis of global, regional and national sales and growth.
• It highlights for you the key successful trends, changes and revenue projections made by your competitors.
This report tells you TODAY how the carbon capture, transportation & storage market will develop in the next 10 years, and in line with the variations in COVID-19 economic recession and bounce. This market is more critical now than at any point over the last 10 years.
Forecasts to 2033 and other analyses reveal commercial prospects
• In addition to revenue forecasting to 2033, our new study provides you with recent results, growth rates, and market shares.
• You will find original analyses, with business outlooks and developments.
• Discover qualitative analyses (including market dynamics, drivers, opportunities, restraints and challenges), cost structure, impact of rising carbon capture, transportation & storage prices and recent developments.
This report includes data analysis and invaluable insight into how COVID-19 will affect the industry and your company. Four COVID-19 recovery patterns and their impact, namely, “V”, “L”, “W” and “U” are discussed in this report.
Segments Covered in the Report
Market Segment by Business Type
• CCS Technology
• CCS Services
Market Segment by Transportation
• Pipeline System
• Ship Carrier
• Motor Carrier
Market Segment by Service
• Carbon Capture Services
• Carbon Storage Services
• Carbon Capture Transportation Services
• Other Services
Market Segment by Source
• Power Generation
• Industrial Sector
• Transport Sector
• Construction Sector
• Other Sources
Market Segment by Technology
• Industrial Separation Capture Technology
• Inherent Separation Technology
• OXY-Fuel Combustion Capture Technology
• Post-Combustion Capture Technology
• Pre-Combustion Capture Technology
• Other Technology
In addition to the revenue predictions for the overall world market and segments, you will also find revenue forecasts for four regional and 20 leading national markets:
North America
• U.S.
• Canada
Europe
• Germany
• Russia
• United Kingdom
• France
• Italy
• Rest of Europe
Asia Pacific
• China
• Japan
• India
• Australia
• South Korea
• Rest of Asia Pacific
Latin America
• Brazil
• Mexico
• Rest of Latin America
Middle East & Africa
• GCC
• South Africa
• Rest of Middle East & Africa
The report also includes profiles and for some of the leading companies in the Carbon Capture, Transportation & Storage Market, 2023 to 2033, with a focus on this segment of these companies’ operations.
Leading companies and the potential for market growth
• Aker Carbon Capture
• Carbon Clean Solutions
• Carbon Engineering Ltd.
• Climeworks AG
• Enbridge Inc.
• Enterprise Products Partners L.P.
• Equinor ASA
• Global Thermostat
• Kinder Morgan, Inc.
• Magellan Midstream Partners
• Occidental Petroleum Corporation
• Plains All American Pipeline, L.P.
• Royal Dutch Shell Plc
• TC Energy Corporation
• The Williams Companies, Inc.
Overall world revenue for Carbon Capture, Transportation & Storage Market, 2023 to 2033 in terms of value the market will surpass US$3,883.4 million in 2023, our work calculates. We predict strong revenue growth through to 2033. Our work identifies which organizations hold the greatest potential. Discover their capabilities, progress, and commercial prospects, helping you stay ahead.
How will the Carbon Capture, Transportation & Storage Market, 2023 to 2033 report help you?
In summary, our 430+ page report provides you with the following knowledge:
• Revenue forecasts to 2033 for Carbon Capture, Transportation & Storage Market, 2023 to 2033 Market, with forecasts for Business Type, Transportation, Service, Source, Technology and, each forecast at a global and regional level – discover the industry’s prospects, finding the most lucrative places for investments and revenues.
• Revenue forecasts to 2033 for four regional and 20 key national markets – See forecasts for the Carbon Capture, Transportation & Storage Market, 2023 to 2033 market in North America, Europe, Asia-Pacific, Latin America and Middle East & Africa. Also forecasted is the market in the US, Canada, Brazil, Germany, France, UK, Italy, China, India, Japan, and Australia among other prominent economies.
• Prospects for established firms and those seeking to enter the market – including company profiles for 15 of the major companies involved in the carbon capture, transportation & storage market, 2023 to 2033.
Find quantitative and qualitative analyses with independent predictions. Receive information that only our report contains, staying informed with invaluable business intelligence.
Information found nowhere else
With our new report, you are less likely to fall behind in knowledge or miss out on opportunities. See how our work could benefit your research, analyses, and decisions. Visiongain’s study is for everybody needing commercial analyses for the Carbon Capture, Transportation & Storage Market, 2023 to 2033, market-leading companies. You will find data, trends and predictions.
ページTOPに戻る
Table of Contents
Table of Contents
1 Report Overview
1.1 Objectives of the Study
1.2 Introduction to Carbon Capture, Transportation & Storage Market
1.3 What This Report Delivers
1.4 Why You Should Read This Report
1.5 Key Questions Answered by This Analytical Report
1.6 Who Is This Report for?
1.7 Methodology
1.7.1 Market Definitions
1.7.2 Market Evaluation & Forecasting Methodology
1.7.3 Data Validation
1.7.3.1 Primary Research
1.7.3.2 Secondary Research
1.8 Frequently Asked Questions (FAQs)
1.9 Associated Visiongain Reports
1.10 About Visiongain
2 Executive Summary
3 Market Overview
3.1 Key Findings
3.2 Market Dynamics
3.2.1 Market Driving Factors
3.2.1.1 Carbon Capture Technologies Generate Additional Power Can Drive the Market Growth
3.2.1.2 The Implementation of Increased Carbon Capture and Storage (Ccs) Operations Would Drive a Surge in Demand for Skilled Technicians
3.2.1.3 Growing Focus on Reducing CO2 Emissions Driving the Market Growth
3.2.2 Market Restraining Factors
3.2.2.1 High Capital Cost of Carbon Capture and Storage Hinder the Market Growth
3.2.2.2 Long-Term Storage Capacity for CO2 is Uncertain Hinder the Market Growth
3.2.2.3 CO2 Transport and Storage Poses Potential Hazards
3.2.3 Market Opportunities
3.2.3.1 Government Funding and Incentives are Available for Carbon Storage and Transportation Projects
3.2.3.2 Increasing Investments in Developing Newer and Efficient Technology for Carbon Capture, Storage, and Transportation
3.2.3.3 Large Number of Upcoming Projects in Regions
3.3 Porter’s Five Forces Analysis
3.3.1 Bargaining Power of Suppliers (Medium)
3.3.2 Bargaining Power of Buyers (High)
3.3.3 Competitive Rivalry (Medium)
3.3.4 Threat from Substitutes (Low to Medium)
3.3.5 Threat of New Entrants (Low)
3.4 COVID-19 Impact Analysis
3.4.1 “V-Shaped Recovery”
3.4.2 “U-Shaped Recovery”
3.4.3 “W-Shaped Recovery”
3.4.4 “L-Shaped Recovery”
3.5 PEST Analysis
4 Carbon Capture, Transportation & Storage Market Analysis by Business Type
4.1 Key Findings
4.2 Business Type Segment: Market Attractiveness Index
4.3 Carbon Capture, Transportation & Storage Market Size Estimation and Forecast by Business Type
4.4 CCS Technology
4.4.1 Market Size by Region, 2023-2033 (US$ Million)
4.4.2 Market Share by Region, 2023 & 2033 (%)
4.5 CCS Services
4.5.1 Market Size by Region, 2023-2033 (US$ Million)
4.5.2 Market Share by Region, 2023 & 2033 (%)
5 Carbon Capture, Transportation & Storage Market Analysis by Transportation Services
5.1 Key Findings
5.2 Transportation Services Segment: Market Attractiveness Index
5.3 Carbon Capture, Transportation & Storage Market Size Estimation and Forecast by Transportation Services
5.4 Pipeline System
5.4.1 Market Size by Region, 2023-2033 (US$ Million)
5.4.2 Market Share by Region, 2023 & 2033 (%)
5.5 Ship Carrier
5.5.1 Market Size by Region, 2023-2033 (US$ Million)
5.5.2 Market Share by Region, 2023 & 2033 (%)
5.6 Motor Carrier
5.6.1 Market Size by Region, 2023-2033 (US$ Million)
5.6.2 Market Share by Region, 2023 & 2033 (%)
6 Carbon Capture, Transportation & Storage Market Analysis by Service
6.1 Key Findings
6.2 Service Segment: Market Attractiveness Index
6.3 Carbon Capture, Transportation & Storage Market Size Estimation and Forecast by Service
6.4 Carbon Capture Services
6.4.1 Market Size by Region, 2023-2033 (US$ Million)
6.4.2 Market Share by Region, 2023 & 2033 (%)
6.5 Carbon Storage Services
6.5.1 Market Size by Region, 2023-2033 (US$ Million)
6.5.2 Market Share by Region, 2023 & 2033 (%)
6.6 Carbon Capture Transportation Services
6.6.1 Market Size by Region, 2023-2033 (US$ Million)
6.6.2 Market Share by Region, 2023 & 2033 (%)
6.7 Other Services
6.7.1 Market Size by Region, 2023-2033 (US$ Million)
6.7.2 Market Share by Region, 2023 & 2033 (%)
7 Carbon Capture, Transportation & Storage Market Analysis by Source
7.1 Key Findings
7.2 Source Segment: Market Attractiveness Index
7.3 Carbon Capture, Transportation & Storage Market Size Estimation and Forecast by Source
7.4 Power Generation
7.4.1 Market Size by Region, 2023-2033 (US$ Million)
7.4.2 Market Share by Region, 2023 & 2033 (%)
7.5 Industrial Sector
7.5.1 Market Size by Region, 2023-2033 (US$ Million)
7.5.2 Market Share by Region, 2023 & 2033 (%)
7.6 Transport Sector
7.6.1 Market Size by Region, 2023-2033 (US$ Million)
7.6.2 Market Share by Region, 2023 & 2033 (%)
7.7 Construction Sector
7.7.1 Market Size by Region, 2023-2033 (US$ Million)
7.7.2 Market Share by Region, 2023 & 2033 (%)
7.8 Other Sources
7.8.1 Market Size by Region, 2023-2033 (US$ Million)
7.8.2 Market Share by Region, 2023 & 2033 (%)
8 Carbon Capture, Transportation & Storage Market Analysis by Technology
8.1 Key Findings
8.2 Technology Segment: Market Attractiveness Index
8.3 Carbon Capture, Transportation & Storage Market Size Estimation and Forecast by Technology
8.4 Industrial Separation Capture Technology
8.4.1 Market Size by Region, 2023-2033 (US$ Million)
8.4.2 Market Share by Region, 2023 & 2033 (%)
8.5 Inherent Separation Technology
8.5.1 Market Size by Region, 2023-2033 (US$ Million)
8.5.2 Market Share by Region, 2023 & 2033 (%)
8.6 OXY-Fuel Combustion Capture Technology
8.6.1 Market Size by Region, 2023-2033 (US$ Million)
8.6.2 Market Share by Region, 2023 & 2033 (%)
8.7 Post-Combustion Capture Technology
8.7.1 Market Size by Region, 2023-2033 (US$ Million)
8.7.2 Market Share by Region, 2023 & 2033 (%)
8.8 Pre-Combustion Capture Technology
8.8.1 Market Size by Region, 2023-2033 (US$ Million)
8.8.2 Market Share by Region, 2023 & 2033 (%)
8.9 Other Technology
8.9.1 Market Size by Region, 2023-2033 (US$ Million)
8.9.2 Market Share by Region, 2023 & 2033 (%)
9 Carbon Capture, Transportation & Storage Market Analysis by Region
9.1 Key Findings
9.2 Regional Market Size Estimation and Forecast
10 North America Carbon Capture, Transportation & Storage Market Analysis
10.1 Key Findings
10.2 North America Carbon Capture, Transportation & Storage Market Attractiveness Index
10.3 North America Carbon Capture, Transportation & Storage Market by Country, 2023, 2028 & 2033 (US$ Million)
10.4 North America Carbon Capture, Transportation & Storage Market Size Estimation and Forecast
10.5 North America Carbon Capture, Transportation & Storage Market Size Estimation and Forecast by Country
10.6 North America Carbon Capture, Transportation & Storage Market Size Estimation and Forecast by Business Type
10.7 North America Carbon Capture, Transportation & Storage Market Size Estimation and Forecast by Transportation Services
10.8 North America Carbon Capture, Transportation & Storage Market Size Estimation and Forecast by Service
10.9 North America Carbon Capture, Transportation & Storage Market Size Estimation and Forecast by Source
10.10 North America Carbon Capture, Transportation & Storage Market Size Estimation and Forecast by Technology
10.11 U.S. Carbon Capture, Transportation & Storage Market Analysis
10.12 Canada Carbon Capture, Transportation & Storage Market Analysis
11 Europe Carbon Capture, Transportation & Storage Market Analysis
11.1 Key Findings
11.2 Europe Carbon Capture, Transportation & Storage Market Attractiveness Index
11.3 Europe Carbon Capture, Transportation & Storage Market by Country, 2023, 2028 & 2033 (US$ Million)
11.4 Europe Carbon Capture, Transportation & Storage Market Size Estimation and Forecast
11.5 Europe Carbon Capture, Transportation & Storage Market Size Estimation and Forecast by Country
11.6 Europe Carbon Capture, Transportation & Storage Market Size Estimation and Forecast by Business Type
11.7 Europe Carbon Capture, Transportation & Storage Market Size Estimation and Forecast by Transportation Services
11.8 Europe Carbon Capture, Transportation & Storage Market Size Estimation and Forecast by Service
11.9 Europe Carbon Capture, Transportation & Storage Market Size Estimation and Forecast by Source
11.10 Europe Carbon Capture, Transportation & Storage Market Size Estimation and Forecast by Technology
11.11 Germany Carbon Capture, Transportation & Storage Market Analysis
11.12 UK Carbon Capture, Transportation & Storage Market Analysis
11.13 France Carbon Capture, Transportation & Storage Market Analysis
11.14 Italy Carbon Capture, Transportation & Storage Market Analysis
11.15 Russia Carbon Capture, Transportation & Storage Market Analysis
11.16 Rest of Europe Carbon Capture, Transportation & Storage Market Analysis
12 Asia-Pacific Carbon Capture, Transportation & Storage Market Analysis
12.1 Key Findings
12.2 Asia-Pacific Carbon Capture, Transportation & Storage Market Attractiveness Index
12.3 Asia-Pacific Carbon Capture, Transportation & Storage Market by Country, 2023, 2028 & 2033 (US$ Million)
12.4 Asia-Pacific Carbon Capture, Transportation & Storage Market Size Estimation and Forecast
12.5 Asia-Pacific Carbon Capture, Transportation & Storage Market Size Estimation and Forecast by Country
12.6 Asia-Pacific Carbon Capture, Transportation & Storage Market Size Estimation and Forecast by Business Type
12.7 Asia-Pacific Carbon Capture, Transportation & Storage Market Size Estimation and Forecast by Transportation Services
12.8 Asia-Pacific Carbon Capture, Transportation & Storage Market Size Estimation and Forecast by Service
12.9 Asia-Pacific Carbon Capture, Transportation & Storage Market Size Estimation and Forecast by Source
12.10 Asia-Pacific Carbon Capture, Transportation & Storage Market Size Estimation and Forecast by Technology
12.11 China Carbon Capture, Transportation & Storage Market Analysis
12.12 India Carbon Capture, Transportation & Storage Market Analysis
12.13 Japan Carbon Capture, Transportation & Storage Market Analysis
12.14 South Korea Carbon Capture, Transportation & Storage Market Analysis
12.15 Australia Carbon Capture, Transportation & Storage Market Analysis
12.16 Rest of Asia-Pacific Carbon Capture, Transportation & Storage Market Analysis
13 Middle East and Africa Carbon Capture, Transportation & Storage Market Analysis
13.1 Key Findings
13.2 Middle East and Africa Carbon Capture, Transportation & Storage Market Attractiveness Index
13.3 Middle East and Africa Carbon Capture, Transportation & Storage Market by Country, 2023, 2028 & 2033 (US$ Million)
13.4 Middle East and Africa Carbon Capture, Transportation & Storage Market Size Estimation and Forecast
13.5 Middle East and Africa Carbon Capture, Transportation & Storage Market Size Estimation and Forecast by Country
13.6 Middle East and Africa Carbon Capture, Transportation & Storage Market Size Estimation and Forecast by Business Type
13.7 Middle East and Africa Carbon Capture, Transportation & Storage Market Size Estimation and Forecast by Transportation Services
13.8 Middle East and Africa Carbon Capture, Transportation & Storage Market Size Estimation and Forecast by Service
13.9 Middle East and Africa Carbon Capture, Transportation & Storage Market Size Estimation and Forecast by Source
13.10 Middle East and Africa Carbon Capture, Transportation & Storage Market Size Estimation and Forecast by Technology
13.11 GCC Carbon Capture, Transportation & Storage Market Analysis
13.12 South Africa Carbon Capture, Transportation & Storage Market Analysis
13.13 Rest of Middle East & Africa Carbon Capture, Transportation & Storage Market Analysis
14 Latin America Carbon Capture, Transportation & Storage Market Analysis
14.1 Key Findings
14.2 Latin America Carbon Capture, Transportation & Storage Market Attractiveness Index
14.3 Latin America Carbon Capture, Transportation & Storage Market by Country, 2023, 2028 & 2033 (US$ Million)
14.4 Latin America Carbon Capture, Transportation & Storage Market Size Estimation and Forecast
14.5 Latin America Carbon Capture, Transportation & Storage Market Size Estimation and Forecast by Country
14.6 Latin America Carbon Capture, Transportation & Storage Market Size Estimation and Forecast by Business Type
14.7 Latin America Carbon Capture, Transportation & Storage Market Size Estimation and Forecast by Transportation Services
14.8 Latin America Carbon Capture, Transportation & Storage Market Size Estimation and Forecast by Service
14.9 Latin America Carbon Capture, Transportation & Storage Market Size Estimation and Forecast by Source
14.10 Latin America Carbon Capture, Transportation & Storage Market Size Estimation and Forecast by Technology
14.11 Brazil Carbon Capture, Transportation & Storage Market Analysis
14.12 Mexico Carbon Capture, Transportation & Storage Market Analysis
14.13 Rest of Latin America Carbon Capture, Transportation & Storage Market Analysis
15 Company Profiles
15.1 Competitive Landscape, 2022
15.2 Strategic Outlook
15.3 Carbon Clean Solutions
15.3.1 Company Snapshot
15.3.2 Company Overview
15.3.3 Product Benchmarking
15.3.4 Strategic Outlook
15.4 Carbon Engineering Ltd.
15.4.1 Company Snapshot
15.4.2 Company Overview
15.4.3 Product Benchmarking
15.5 Climeworks AG
15.5.1 Company Snapshot
15.5.2 Company Overview
15.5.3 Product Benchmarking
15.5.4 Strategic Outlook
15.6 Global Thermostat
15.6.1 Company Snapshot
15.6.2 Company Overview
15.6.3 Product Benchmarking
15.6.4 Strategic Outlook
15.7 Aker Carbon Capture
15.7.1 Company Snapshot
15.7.2 Company Overview
15.7.3 Product Benchmarking
15.7.4 Strategic Outlook
15.8 Occidental Petroleum Corporation
15.8.1 Company Snapshot
15.8.2 Company Overview
15.8.3 Financial Analysis
15.8.3.1 Net Revenue, 2018-2022
15.8.3.2 R&D, 2018-2022
15.8.3.3 Regional Revenue Share, 2022 (%)
15.8.3.4 Business Segment Revenue Share, 2022 (%)
15.8.4 Product Benchmarking
15.8.5 Strategic Outlook
15.9 Equinor ASA
15.9.1 Company Snapshot
15.9.2 Company Overview
15.9.3 Financial Analysis
15.9.3.1 Net Revenue, 2018-2022
15.9.3.2 R&D, 2018-2022
15.9.3.3 Regional Revenue Share, 2022 (%)
15.9.3.4 Business Segment Revenue Share, 2022 (%)
15.9.4 Product Benchmarking
15.9.5 Strategic Outlook
15.10 Royal Dutch Shell Plc
15.10.1 Company Snapshot
15.10.2 Company Overview
15.10.3 Financial Analysis
15.10.3.1 Net Revenue, 2018-2022
15.10.3.2 R&D, 2018-2022
15.10.3.3 Regional Revenue Share, 2022 (%)
15.10.3.4 Business Segment Revenue Share, 2022 (%)
15.10.4 Product Benchmarking
15.10.5 Strategic Outlook
15.11 Kinder Morgan, Inc.
15.11.1 Company Snapshot
15.11.2 Company Overview
15.11.3 Financial Analysis
15.11.3.1 Net Revenue, 2018-2022
15.11.3.2 Regional Revenue Share, 2022 (%)
15.11.3.3 Business Segment Revenue Share, 2022 (%)
15.11.4 Product Benchmarking
15.11.5 Strategic Outlook
15.12 TC Energy Corporation
15.12.1 Company Snapshot
15.12.2 Company Overview
15.12.3 Financial Analysis
15.12.3.1 Net Revenue, 2018-2022
15.12.3.2 Regional Revenue Share, 2022 (%)
15.12.3.3 Business Segment Revenue Share, 2022 (%)
15.12.4 Product Benchmarking
15.12.5 Strategic Outlook
15.13 Enbridge Inc.
15.13.1 Company Snapshot
15.13.2 Company Overview
15.13.3 Financial Analysis
15.13.3.1 Net Revenue, 2018-2022
15.13.3.2 Regional Revenue Share, 2022 (%)
15.13.3.3 Business Segment Revenue Share, 2022 (%)
15.13.4 Product Benchmarking
15.13.5 Strategic Outlook
15.14 Magellan Midstream Partners
15.14.1 Company Snapshot
15.14.2 Company Overview
15.14.3 Financial Analysis
15.14.3.1 Net Revenue, 2018-2022
15.14.3.2 Business Segment Revenue Share, 2022 (%)
15.14.4 Product Benchmarking
15.15 Enterprise Products Partners L.P.
15.15.1 Company Snapshot
15.15.2 Company Overview
15.15.3 Financial Analysis
15.15.3.1 Net Revenue, 2018-2022
15.15.3.2 Business Segment Revenue Share, 2022 (%)
15.15.4 Product Benchmarking
15.15.5 Strategic Outlook
15.16 Plains All American Pipeline, L.P.
15.16.1 Company Snapshot
15.16.2 Company Overview
15.16.3 Financial Analysis
15.16.3.1 Net Revenue, 2018-2022
15.16.3.2 Regional Revenue Share, 2022 (%)
15.16.3.3 Business Segment Revenue Share, 2022 (%)
15.16.4 Product Benchmarking
15.16.5 Strategic Outlook
15.17 The Williams Companies, Inc.
15.17.1 Company Snapshot
15.17.2 Company Overview
15.17.3 Financial Analysis
15.17.3.1 Net Revenue, 2018-2022
15.17.4 Product Benchmarking
16 Conclusion and Recommendations
16.1 Concluding Remarks from Visiongain
16.2 Recommendations for Market Players
ページTOPに戻る
List of Tables/Graphs
List of Tables
Table 1 Carbon Capture, Transportation & Storage Market Snapshot, 2023 & 2033 (US$ Million, CAGR %)
Table 2 Global Carbon Capture, Transportation & Storage Market by Region, 2023-2033 (US$ Mn, AGR (%), CAGR (%)) (V-Shaped Recovery Scenario)
Table 3 Global Carbon Capture, Transportation & Storage Market by Region, 2023-2033 (US$ Mn, AGR (%), CAGR (%)) (U-Shaped Recovery Scenario)
Table 4 Global Carbon Capture, Transportation & Storage Market by Region, 2023-2033 (US$ Mn, AGR (%), CAGR (%)) (W-Shaped Recovery Scenario)
Table 5 Global Carbon Capture, Transportation & Storage Market by Region, 2023-2033 (US$ Mn, AGR (%), CAGR (%)) (L-Shaped Recovery Scenario)
Table 6 Global Carbon Capture, Transportation & Storage Market by Business Type, 2023-2033 (US$ Mn, AGR (%), CAGR (%))
Table 7 CCS Technology Market by Region, 2023-2033 (US$ Mn, AGR (%), CAGR (%))
Table 8 CCS Services Market by Region, 2023-2033 (US$ Mn, AGR (%), CAGR (%))
Table 9 Global Carbon Capture, Transportation & Storage Market by Transportation, 2023-2033 (US$ Mn, AGR (%), CAGR (%))
Table 10 Pipeline System Market by Region, 2023-2033 (US$ Mn, AGR (%), CAGR (%))
Table 11 Ship Carrier Market by Region, 2023-2033 (US$ Mn, AGR (%), CAGR (%))
Table 12 Motor Carrier Market by Region, 2023-2033 (US$ Mn, AGR (%), CAGR (%))
Table 13 Global Carbon Capture, Transportation & Storage Market by Service, 2023-2033 (US$ Mn, AGR (%), CAGR (%))
Table 14 Carbon Capture Services Market by Region, 2023-2033 (US$ Mn, AGR (%), CAGR (%))
Table 15 Carbon Storage Services Market by Region, 2023-2033 (US$ Mn, AGR (%), CAGR (%))
Table 16 Carbon Capture Transportation Services Market by Region, 2023-2033 (US$ Mn, AGR (%), CAGR (%))
Table 17 Other Services Market by Region, 2023-2033 (US$ Mn, AGR (%), CAGR (%))
Table 18 Global Carbon Capture, Transportation & Storage Market by Source, 2023-2033 (US$ Mn, AGR (%), CAGR (%))
Table 19 Power Generation Market by Region, 2023-2033 (US$ Mn, AGR (%), CAGR (%))
Table 20 Industrial Sector Market by Region, 2023-2033 (US$ Mn, AGR (%), CAGR (%))
Table 21 Transport Sector Market by Region, 2023-2033 (US$ Mn, AGR (%), CAGR (%))
Table 22 Construction Sector Market by Region, 2023-2033 (US$ Mn, AGR (%), CAGR (%))
Table 23 Other Sources Market by Region, 2023-2033 (US$ Mn, AGR (%), CAGR (%))
Table 24 Global Carbon Capture, Transportation & Storage Market by Technology, 2023-2033 (US$ Mn, AGR (%), CAGR (%))
Table 25 Industrial Separation Capture Technology Market by Region, 2023-2033 (US$ Mn, AGR (%), CAGR (%))
Table 26 Inherent Separation Technology Market by Region, 2023-2033 (US$ Mn, AGR (%), CAGR (%))
Table 27 OXY-Fuel Combustion Capture Technology Market by Region, 2023-2033 (US$ Mn, AGR (%), CAGR (%))
Table 28 Post-Combustion Capture Technology Market by Region, 2023-2033 (US$ Mn, AGR (%), CAGR (%))
Table 29 Pre-Combustion Capture Technology Market by Region, 2023-2033 (US$ Mn, AGR (%), CAGR (%))
Table 30 Other Technology Market by Region, 2023-2033 (US$ Mn, AGR (%), CAGR (%))
Table 31 Carbon Capture, Transportation & Storage Market Forecast by Region, 2023-2033 (US$ Million, AGR%, CAGR%)
Table 32 North America Carbon Capture, Transportation & Storage Market by Value, 2023-2033 (US$ Mn, AGR (%), CAGR (%))
Table 33 North America Carbon Capture, Transportation & Storage Market by Country, 2023-2033 (US$ Mn, AGR (%), CAGR (%))
Table 34 North America Carbon Capture, Transportation & Storage Market by Business Type, 2023-2033 (US$ Mn, AGR (%), CAGR (%))
Table 35 North America Carbon Capture, Transportation & Storage Market by Transportation, 2023-2033 (US$ Mn, AGR (%), CAGR (%))
Table 36 North America Carbon Capture, Transportation & Storage Market by Service, 2023-2033 (US$ Mn, AGR (%), CAGR (%))
Table 37 North America Carbon Capture, Transportation & Storage Market by Source, 2023-2033 (US$ Mn, AGR (%), CAGR (%))
Table 38 North America Carbon Capture, Transportation & Storage Market by Technology, 2023-2033 (US$ Mn, AGR (%), CAGR (%))
Table 39 US Carbon Capture, Transportation & Storage Market by Value, 2023-2033 (US$ Mn, AGR (%), CAGR (%))
Table 40 Canada Carbon Capture, Transportation & Storage Market by Value, 2023-2033 (US$ Mn, AGR (%), CAGR (%))
Table 41 Europe Carbon Capture, Transportation & Storage Market by Value, 2023-2033 (US$ Mn, AGR (%), CAGR (%))
Table 42 Europe Carbon Capture, Transportation & Storage Market by Country, 2023-2033 (US$ Mn, AGR (%), CAGR (%))
Table 43 Europe Carbon Capture, Transportation & Storage Market by Business Type, 2023-2033 (US$ Mn, AGR (%), CAGR (%))
Table 44 Europe Carbon Capture, Transportation & Storage Market by Transportation, 2023-2033 (US$ Mn, AGR (%), CAGR (%))
Table 45 Europe Carbon Capture, Transportation & Storage Market by Service, 2023-2033 (US$ Mn, AGR (%), CAGR (%))
Table 46 Europe Carbon Capture, Transportation & Storage Market by Source, 2023-2033 (US$ Mn, AGR (%), CAGR (%))
Table 47 Europe Carbon Capture, Transportation & Storage Market by Technology, 2023-2033 (US$ Mn, AGR (%), CAGR (%))
Table 48 Germany Carbon Capture, Transportation & Storage Market by Value, 2023-2033 (US$ Mn, AGR (%), CAGR (%))
Table 49 UK Carbon Capture, Transportation & Storage Market by Value, 2023-2033 (US$ Mn, AGR (%), CAGR (%))
Table 50 France Carbon Capture, Transportation & Storage Market by Value, 2023-2033 (US$ Mn, AGR (%), CAGR (%))
Table 51 Italy Carbon Capture, Transportation & Storage Market by Value, 2023-2033 (US$ Mn, AGR (%), CAGR (%))
Table 52 Russia Carbon Capture, Transportation & Storage Market by Value, 2023-2033 (US$ Mn, AGR (%), CAGR (%))
Table 53 Rest of Europe Carbon Capture, Transportation & Storage Market by Value, 2023-2033 (US$ Mn, AGR (%), CAGR (%))
Table 54 Asia-Pacific Carbon Capture, Transportation & Storage Market by Value, 2023-2033 (US$ Mn, AGR (%), CAGR (%))
Table 55 Asia-Pacific Carbon Capture, Transportation & Storage Market by Country, 2023-2033 (US$ Mn, AGR (%), CAGR (%))
Table 56 Asia-Pacific Carbon Capture, Transportation & Storage Market by Business Type, 2023-2033 (US$ Mn, AGR (%), CAGR (%))
Table 57 Asia-Pacific Carbon Capture, Transportation & Storage Market by Transportation, 2023-2033 (US$ Mn, AGR (%), CAGR (%))
Table 58 Asia-Pacific Carbon Capture, Transportation & Storage Market by Service, 2023-2033 (US$ Mn, AGR (%), CAGR (%))
Table 59 Asia-Pacific Carbon Capture, Transportation & Storage Market by Source, 2023-2033 (US$ Mn, AGR (%), CAGR (%))
Table 60 Asia-Pacific Carbon Capture, Transportation & Storage Market by Technology, 2023-2033 (US$ Mn, AGR (%), CAGR (%))
Table 61 China Carbon Capture, Transportation & Storage Market by Value, 2023-2033 (US$ Mn, AGR (%), CAGR (%))
Table 62 India Carbon Capture, Transportation & Storage Market by Value, 2023-2033 (US$ Mn, AGR (%), CAGR (%))
Table 63 Japan Carbon Capture, Transportation & Storage Market by Value, 2023-2033 (US$ Mn, AGR (%), CAGR (%))
Table 64 South Korea Carbon Capture, Transportation & Storage Market by Value, 2023-2033 (US$ Mn, AGR (%), CAGR (%))
Table 65 Australia Carbon Capture, Transportation & Storage Market by Value, 2023-2033 (US$ Mn, AGR (%), CAGR (%))
Table 66 Rest of Asia-Pacific Carbon Capture, Transportation & Storage Market by Value, 2023-2033 (US$ Mn, AGR (%), CAGR (%))
Table 67 Middle East & Africa Carbon Capture, Transportation & Storage Market by Value, 2023-2033 (US$ Mn, AGR (%), CAGR (%))
Table 68 Middle East & Africa Carbon Capture, Transportation & Storage Market by Country, 2023-2033 (US$ Mn, AGR (%), CAGR (%))
Table 69 Middle East & Africa Carbon Capture, Transportation & Storage Market by Business Type, 2023-2033 (US$ Mn, AGR (%), CAGR (%))
Table 70 Middle East & Africa Carbon Capture, Transportation & Storage Market by Transportation, 2023-2033 (US$ Mn, AGR (%), CAGR (%))
Table 71 Middle East & Africa Carbon Capture, Transportation & Storage Market by Service, 2023-2033 (US$ Mn, AGR (%), CAGR (%))
Table 72 Middle East & Africa Carbon Capture, Transportation & Storage Market by Source, 2023-2033 (US$ Mn, AGR (%), CAGR (%))
Table 73 Middle East & Africa Carbon Capture, Transportation & Storage Market by Technology, 2023-2033 (US$ Mn, AGR (%), CAGR (%))
Table 74 GCC Carbon Capture, Transportation & Storage Market by Value, 2023-2033 (US$ Mn, AGR (%), CAGR (%))
Table 75 South Africa Carbon Capture, Transportation & Storage Market by Value, 2023-2033 (US$ Mn, AGR (%), CAGR (%))
Table 76 Rest of Middle East & Africa Carbon Capture, Transportation & Storage Market by Value, 2023-2033 (US$ Mn, AGR (%), CAGR (%))
Table 77 Latin America Carbon Capture, Transportation & Storage Market by Value, 2023-2033 (US$ Mn, AGR (%), CAGR (%))
Table 78 Latin America Carbon Capture, Transportation & Storage Market by Country, 2023-2033 (US$ Mn, AGR (%), CAGR (%))
Table 79 Latin America Carbon Capture, Transportation & Storage Market by Business Type, 2023-2033 (US$ Mn, AGR (%), CAGR (%))
Table 80 Latin America Carbon Capture, Transportation & Storage Market by Transportation, 2023-2033 (US$ Mn, AGR (%), CAGR (%))
Table 81 Latin America Carbon Capture, Transportation & Storage Market by Service, 2023-2033 (US$ Mn, AGR (%), CAGR (%))
Table 82 Latin America Carbon Capture, Transportation & Storage Market by Source, 2023-2033 (US$ Mn, AGR (%), CAGR (%))
Table 83 Latin America Carbon Capture, Transportation & Storage Market by Technology, 2023-2033 (US$ Mn, AGR (%), CAGR (%))
Table 84 Brazil Carbon Capture, Transportation & Storage Market by Value, 2023-2033 (US$ Mn, AGR (%), CAGR (%))
Table 85 Mexico Carbon Capture, Transportation & Storage Market by Value, 2023-2033 (US$ Mn, AGR (%), CAGR (%))
Table 86 Rest of Latin America Carbon Capture, Transportation & Storage Market by Value, 2023-2033 (US$ Mn, AGR (%), CAGR (%))
Table 87 Strategic Outlook - Contract
Table 88 Carbon Clean Solutions: Key Details, (CEO, HQ, Revenue, Founded, No. of Employees, Company Type, Website, Business Segment)
Table 89 Carbon Clean Solutions: Product Benchmarking
Table 90 Carbon Clean Solutions: Strategic Outlook
Table 91 Carbon Engineering Ltd.: Key Details, (CEO, HQ, Revenue, Founded, No. of Employees, Company Type, Website, Business Segment)
Table 92 Carbon Engineering Ltd.: Product Benchmarking
Table 93 Climeworks AG: Key Details, (CEO, HQ, Revenue, Founded, No. of Employees, Company Type, Website, Business Segment)
Table 94 Climeworks AG: Strategic Outlook
Table 95 Global Thermostat: Key Details, (CEO, HQ, Revenue, Founded, No. of Employees, Company Type, Website, Business Segment)
Table 96 Global Thermostat: Product Benchmarking
Table 97 Global Thermostat: Strategic Outlook
Table 98 Aker Carbon Capture: Key Details, (CEO, HQ, Revenue, Founded, No. of Employees, Company Type, Website, Business Segment)
Table 99 Aker Carbon Capture: Product Benchmarking
Table 100 Aker Carbon Capture: Strategic Outlook
Table 101 Occidental Petroleum Corporation: Key Details, (CEO, HQ, Revenue, Founded, No. of Employees, Company Type, Website, Business Segment)
Table 102 Occidental Petroleum Corporation: Product Benchmarking
Table 103 Occidental Petroleum Corporation: Strategic Outlook
Table 104 Equinor ASA: Key Details, (CEO, HQ, Revenue, Founded, No. of Employees, Company Type, Website, Business Segment)
Table 105 Equinor ASA: Strategic Outlook
Table 106 Royal Dutch Shell Plc: Key Details, (CEO, HQ, Revenue, Founded, No. of Employees, Company Type, Website, Business Segment)
Table 107 Royal Dutch Shell Plc: Strategic Outlook
Table 108 Kinder Morgan, Inc.: Key Details, (CEO, HQ, Revenue, Founded, No. of Employees, Company Type, Website, Business Segment)
Table 109 Kinder Morgan, Inc: Strategic Outlook
Table 110 TC Energy Corporation: Key Details, (CEO, HQ, Revenue, Founded, No. of Employees, Company Type, Website, Business Segment)
Table 111 TC Energy Corporation: Product Benchmarking
Table 112 TC Energy Corporation: Strategic Outlook
Table 113 Enbridge Inc.: Key Details, (CEO, HQ, Revenue, Founded, No. of Employees, Company Type, Website, Business Segment)
Table 114 Enbridge Inc: Strategic Outlook
Table 115 Magellan Midstream Partners: Key Details, (CEO, HQ, Revenue, Founded, No. of Employees, Company Type, Website, Business Segment)
Table 116 Enterprise Products Partners L.P.: Key Details, (CEO, HQ, Revenue, Founded, No. of Employees, Company Type, Website, Business Segment)
Table 117 Enterprise Products Partners L.P: Strategic Outlook
Table 118 Plains All American Pipeline, L.P.: Key Details, (CEO, HQ, Revenue, Founded, No. of Employees, Company Type, Website, Business Segment)
Table 119 Plains All American Pipeline, L.P: Strategic Outlook
Table 120 The Williams Companies, Inc.: Key Details, (CEO, HQ, Revenue, Founded, No. of Employees, Company Type, Website, Business Segment)
List of Figures
Figure 1 Carbon Capture, Transportation & Storage Market Segmentation
Figure 2 Carbon Capture, Transportation & Storage Market by Business Type: Market Attractiveness Index
Figure 3 Carbon Capture, Transportation & Storage Market by Transportation Services: Market Attractiveness Index
Figure 4 Carbon Capture, Transportation & Storage Market by Service: Market Attractiveness Index
Figure 5 Carbon Capture, Transportation & Storage Market by Source: Market Attractiveness Index
Figure 6 Carbon Capture, Transportation & Storage Market by Technology: Market Attractiveness Index
Figure 7 Carbon Capture, Transportation & Storage Market Attractiveness Index by Region
Figure 8 Carbon Capture, Transportation & Storage Market: Market Dynamics
Figure 9 Power Generation from Carbon Capture Technologies Forecast
Figure 10 Carbon Capture, Transportation & Storage Market: Porter’s Five Forces Analysis
Figure 11 Global Carbon Capture, Transportation & Storage Market Share Forecast by COVID, 2023-2033 (%)
Figure 12 Global Carbon Capture, Transportation & Storage Market by Region, 2023-2033 (US$ Mn, AGR (%)) (V-Shaped Recovery Scenario)
Figure 13 Global Carbon Capture, Transportation & Storage Market by Region, 2023-2033 (US$ Mn, AGR (%)) (U-Shaped Recovery Scenario)
Figure 14 Global Carbon Capture, Transportation & Storage Market by Region, 2023-2033 (US$ Mn, AGR (%)) (W-Shaped Recovery Scenario)
Figure 15 Global Carbon Capture, Transportation & Storage Market by Region, 2023-2033 (US$ Mn, AGR (%)) (L-Shaped Recovery Scenario)
Figure 16 Carbon Capture, Transportation & Storage Market: PEST Analysis
Figure 17 Carbon Capture, Transportation & Storage Market by Business Type: Market Attractiveness Index
Figure 18 Global Carbon Capture, Transportation & Storage Market by Business Type, 2023-2033 (US$ Mn, AGR (%))
Figure 19 Carbon Capture, Transportation & Storage Market Share Forecast by Business Type, 2023, 2028, 2033 (%)
Figure 20 CCS Technology Market by Region, 2023-2033 (US$ Mn, AGR (%))
Figure 21 CCS Technology Market Share Forecast by Region, 2023 & 2033 (%)
Figure 22 CCS Services Market by Region, 2023-2033 (US$ Mn, AGR (%))
Figure 23 CCS Services Market Share Forecast by Region, 2023 & 2033 (%)
Figure 24 Carbon Capture, Transportation & Storage Market by Transportation Services: Market Attractiveness Index
Figure 25 Global Carbon Capture, Transportation & Storage Market by Transportation, 2023-2033 (US$ Mn, AGR (%))
Figure 26 Carbon Capture, Transportation & Storage Market Share Forecast by Transportation Services, 2023, 2028, 2033 (%)
Figure 27 Pipeline System Market by Region, 2023-2033 (US$ Mn, AGR (%))
Figure 28 Pipeline System Market Share Forecast by Region, 2023 & 2033 (%)
Figure 29 Ship Carrier Market by Region, 2023-2033 (US$ Mn, AGR (%))
Figure 30 Ship Carrier Market Share Forecast by Region, 2023 & 2033 (%)
Figure 31 Motor Carrier Market by Region, 2023-2033 (US$ Mn, AGR (%))
Figure 32 Motor Carrier Market Share Forecast by Region, 2023 & 2033 (%)
Figure 33 Carbon Capture, Transportation & Storage Market by Service: Market Attractiveness Index
Figure 34 Global Carbon Capture, Transportation & Storage Market by Service, 2023-2033 (US$ Mn, AGR (%))
Figure 35 Carbon Capture, Transportation & Storage Market Share Forecast by Service, 2023, 2028, 2033 (%)
Figure 36 Carbon Capture Services Market by Region, 2023-2033 (US$ Mn, AGR (%))
Figure 37 Carbon Capture Services Market Share Forecast by Region, 2023 & 2033 (%)
Figure 38 Carbon Storage Services Market by Region, 2023-2033 (US$ Mn, AGR (%))
Figure 39 Carbon Storage Services Market Share Forecast by Region, 2023 & 2033 (%)
Figure 40 Carbon Capture Transportation Services Market by Region, 2023-2033 (US$ Mn, AGR (%))
Figure 41 Carbon Capture Transportation Services Market Share Forecast by Region, 2023 & 2033 (%)
Figure 42 Other Services Market by Region, 2023-2033 (US$ Mn, AGR (%))
Figure 43 Other Services Market Share Forecast by Region, 2023 & 2033 (%)
Figure 44 Carbon Capture, Transportation & Storage Market by Source: Market Attractiveness Index
Figure 45 Global Carbon Capture, Transportation & Storage Market by Source, 2023-2033 (US$ Mn, AGR (%))
Figure 46 Carbon Capture, Transportation & Storage Market Share Forecast by Source, 2023, 2028, 2033 (%)
Figure 47 Power Generation Market by Region, 2023-2033 (US$ Mn, AGR (%))
Figure 48 Power Generation Market Share Forecast by Region, 2023 & 2033 (%)
Figure 49 Industrial Sector Market by Region, 2023-2033 (US$ Mn, AGR (%))
Figure 50 Industrial Sector Market Share Forecast by Region, 2023 & 2033 (%)
Figure 51 Transport Sector Market by Region, 2023-2033 (US$ Mn, AGR (%))
Figure 52 Transport Sector Market Share Forecast by Region, 2023 & 2033 (%)
Figure 53 Construction Sector Market by Region, 2023-2033 (US$ Mn, AGR (%))
Figure 54 Construction Sector Market Share Forecast by Region, 2023 & 2033 (%)
Figure 55 Other Sources Market by Region, 2023-2033 (US$ Mn, AGR (%))
Figure 56 Other Sources Market Share Forecast by Region, 2023 & 2033 (%)
Figure 57 Carbon Capture, Transportation & Storage Market by Technology: Market Attractiveness Index
Figure 58 Global Carbon Capture, Transportation & Storage Market by Technology, 2023-2033 (US$ Mn, AGR (%))
Figure 59 Carbon Capture, Transportation & Storage Market Share Forecast by Technology, 2023, 2028, 2033 (%)
Figure 60 Industrial Separation Capture Technology Market by Region, 2023-2033 (US$ Mn, AGR (%))
Figure 61 Industrial Separation Capture Technology Market Share Forecast by Region, 2023 & 2033 (%)
Figure 62 Inherent Separation Technology Market by Region, 2023-2033 (US$ Mn, AGR (%))
Figure 63 Inherent Separation Technology Market Share Forecast by Region, 2023 & 2033 (%)
Figure 64 OXY-Fuel Combustion Capture Technology Market by Region, 2023-2033 (US$ Mn, AGR (%))
Figure 65 OXY-Fuel Combustion Capture Technology Market Share Forecast by Region, 2023 & 2033 (%)
Figure 66 Post-Combustion Capture Technology Market by Region, 2023-2033 (US$ Mn, AGR (%))
Figure 67 Post-Combustion Capture Technology Market Share Forecast by Region, 2023 & 2033 (%)
Figure 68 Pre-Combustion Capture Technology Market by Region, 2023-2033 (US$ Mn, AGR (%))
Figure 69 Pre-Combustion Capture Technology Market Share Forecast by Region, 2023 & 2033 (%)
Figure 70 Other Technology Market by Region, 2023-2033 (US$ Mn, AGR (%))
Figure 71 Other Technology Market Share Forecast by Region, 2023 & 2033 (%)
Figure 72 Carbon Capture, Transportation & Storage Market Forecast by Region 2023 and 2033 (Revenue, CAGR%)
Figure 73 Carbon Capture, Transportation & Storage Market Share Forecast by Region 2023, 2028, 2033 (%)
Figure 74 Carbon Capture, Transportation & Storage Market by Region, 2023-2033 (US$ Million, AGR %)
Figure 75 North America Carbon Capture, Transportation & Storage Market Attractiveness Index
Figure 76 North America Carbon Capture, Transportation & Storage Market by Region, 2023, 2028 & 2033 (US$ Million)
Figure 77 North America Carbon Capture, Transportation & Storage Market by Value, 2023-2033 (US$ Mn, AGR (%))
Figure 78 North America Carbon Capture, Transportation & Storage Market by Country, 2023-2033 (US$ Mn, AGR (%))
Figure 79 North America Carbon Capture, Transportation & Storage Market Share Forecast by Country, 2023 & 2033 (%)
Figure 80 North America Carbon Capture, Transportation & Storage Market by Business Type, 2023-2033 (US$ Mn, AGR (%))
Figure 81 North America Carbon Capture, Transportation & Storage Market Share Forecast Business Type, 2023 & 2033 (%)
Figure 82 North America Carbon Capture, Transportation & Storage Market by Transportation, 2023-2033 (US$ Mn, AGR (%))
Figure 83 North America Carbon Capture, Transportation & Storage Market Share Forecast by Transportation Services, 2023 & 2033 (%)
Figure 84 North America Carbon Capture, Transportation & Storage Market by Service, 2023-2033 (US$ Mn, AGR (%))
Figure 85 North America Carbon Capture, Transportation & Storage Market Share Forecast by Service, 2023 & 2033 (%)
Figure 86 North America Carbon Capture, Transportation & Storage Market by Source, 2023-2033 (US$ Mn, AGR (%))
Figure 87 North America Carbon Capture, Transportation & Storage Market Share Forecast by Source, 2023 & 2033 (%)
Figure 88 North America Carbon Capture, Transportation & Storage Market by Technology, 2023-2033 (US$ Mn, AGR (%))
Figure 89 North America Carbon Capture, Transportation & Storage Market Share Forecast by Technology, 2023 & 2033 (%)
Figure 90 US Carbon Capture, Transportation & Storage Market by Value, 2023-2033 (US$ Mn, AGR (%))
Figure 91 Canada Carbon Capture, Transportation & Storage Market by Value, 2023-2033 (US$ Mn, AGR (%))
Figure 92 Europe Carbon Capture, Transportation & Storage Market Attractiveness Index
Figure 93 Europe Carbon Capture, Transportation & Storage Market by Region, 2023, 2028 & 2033 (US$ Million)
Figure 94 Europe Carbon Capture, Transportation & Storage Market by Value, 2023-2033 (US$ Mn, AGR (%))
Figure 95 Europe Carbon Capture, Transportation & Storage Market by Country, 2023-2033 (US$ Mn, AGR (%))
Figure 96 Europe Carbon Capture, Transportation & Storage Market Share Forecast by Country, 2023 & 2033 (%)
Figure 97 Europe Carbon Capture, Transportation & Storage Market by Business Type, 2023-2033 (US$ Mn, AGR (%))
Figure 98 Europe Carbon Capture, Transportation & Storage Market Share Forecast Business Type, 2023 & 2033 (%)
Figure 99 Europe Carbon Capture, Transportation & Storage Market by Transportation, 2023-2033 (US$ Mn, AGR (%))
Figure 100 Europe Carbon Capture, Transportation & Storage Market Share Forecast by Transportation Services, 2023 & 2033 (%)
Figure 101 Europe Carbon Capture, Transportation & Storage Market by Service, 2023-2033 (US$ Mn, AGR (%))
Figure 102 Europe Carbon Capture, Transportation & Storage Market Share Forecast by Service, 2023 & 2033 (%)
Figure 103 Europe Carbon Capture, Transportation & Storage Market by Source, 2023-2033 (US$ Mn, AGR (%))
Figure 104 Europe Carbon Capture, Transportation & Storage Market Share Forecast by Source, 2023 & 2033 (%)
Figure 105 Europe Carbon Capture, Transportation & Storage Market by Technology, 2023-2033 (US$ Mn, AGR (%))
Figure 106 Europe Carbon Capture, Transportation & Storage Market Share Forecast by Technology, 2023 & 2033 (%)
Figure 107 Germany Carbon Capture, Transportation & Storage Market by Value, 2023-2033 (US$ Mn, AGR (%))
Figure 108 UK Carbon Capture, Transportation & Storage Market by Value, 2023-2033 (US$ Mn, AGR (%))
Figure 109 France Carbon Capture, Transportation & Storage Market by Value, 2023-2033 (US$ Mn, AGR (%))
Figure 110 Italy Carbon Capture, Transportation & Storage Market by Value, 2023-2033 (US$ Mn, AGR (%))
Figure 111 Russia Carbon Capture, Transportation & Storage Market by Value, 2023-2033 (US$ Mn, AGR (%))
Figure 112 Rest of Europe Carbon Capture, Transportation & Storage Market by Value, 2023-2033 (US$ Mn, AGR (%))
Figure 113 Asia-Pacific Carbon Capture, Transportation & Storage Market Attractiveness Index
Figure 114 Asia-Pacific Carbon Capture, Transportation & Storage Market by Region, 2023, 2028 & 2033 (US$ Million)
Figure 115 Asia-Pacific Carbon Capture, Transportation & Storage Market by Value, 2023-2033 (US$ Mn, AGR (%))
Figure 116 Asia-Pacific Carbon Capture, Transportation & Storage Market by Country, 2023-2033 (US$ Mn, AGR (%))
Figure 117 Asia-Pacific Carbon Capture, Transportation & Storage Market Share Forecast by Country, 2023 & 2033 (%)
Figure 118 Asia-Pacific Carbon Capture, Transportation & Storage Market by Business Type, 2023-2033 (US$ Mn, AGR (%))
Figure 119 Asia-Pacific Carbon Capture, Transportation & Storage Market Share Forecast Business Type, 2023 & 2033 (%)
Figure 120 Asia-Pacific Carbon Capture, Transportation & Storage Market by Transportation, 2023-2033 (US$ Mn, AGR (%))
Figure 121 Asia-Pacific Carbon Capture, Transportation & Storage Market Share Forecast by Transportation Services, 2023 & 2033 (%)
Figure 122 Asia-Pacific Carbon Capture, Transportation & Storage Market by Service, 2023-2033 (US$ Mn, AGR (%))
Figure 123 Asia-Pacific Carbon Capture, Transportation & Storage Market Share Forecast by Service, 2023 & 2033 (%)
Figure 124 Asia-Pacific Carbon Capture, Transportation & Storage Market by Source, 2023-2033 (US$ Mn, AGR (%))
Figure 125 Asia-Pacific Carbon Capture, Transportation & Storage Market Share Forecast by Source, 2023 & 2033 (%)
Figure 126 Asia-Pacific Carbon Capture, Transportation & Storage Market by Technology, 2023-2033 (US$ Mn, AGR (%))
Figure 127 Asia-Pacific Carbon Capture, Transportation & Storage Market Share Forecast by Technology, 2023 & 2033 (%)
Figure 128 China Carbon Capture, Transportation & Storage Market by Value, 2023-2033 (US$ Mn, AGR (%))
Figure 129 India Carbon Capture, Transportation & Storage Market by Value, 2023-2033 (US$ Mn, AGR (%))
Figure 130 Japan Carbon Capture, Transportation & Storage Market by Value, 2023-2033 (US$ Mn, AGR (%))
Figure 131 South Korea Carbon Capture, Transportation & Storage Market by Value, 2023-2033 (US$ Mn, AGR (%))
Figure 132 Australia Carbon Capture, Transportation & Storage Market by Value, 2023-2033 (US$ Mn, AGR (%))
Figure 133 Rest of Asia-Pacific Carbon Capture, Transportation & Storage Market by Value, 2023-2033 (US$ Mn, AGR (%))
Figure 134 Middle East and Africa Carbon Capture, Transportation & Storage Market Attractiveness Index
Figure 135 Middle East and Africa Carbon Capture, Transportation & Storage Market by Region, 2023, 2028 & 2033 (US$ Million)
Figure 136 Middle East & Africa Carbon Capture, Transportation & Storage Market by Value, 2023-2033 (US$ Mn, AGR (%))
Figure 137 Middle East & Africa Carbon Capture, Transportation & Storage Market by Country, 2023-2033 (US$ Mn, AGR (%))
Figure 138 Middle East and Africa Carbon Capture, Transportation & Storage Market Share Forecast by Country, 2023 & 2033 (%)
Figure 139 Middle East & Africa Carbon Capture, Transportation & Storage Market by Business Type, 2023-2033 (US$ Mn, AGR (%))
Figure 140 Middle East and Africa Carbon Capture, Transportation & Storage Market Share Forecast Business Type, 2023 & 2033 (%)
Figure 141 Middle East & Africa Carbon Capture, Transportation & Storage Market by Transportation, 2023-2033 (US$ Mn, AGR (%))
Figure 142 Middle East and Africa Carbon Capture, Transportation & Storage Market Share Forecast by Transportation Services, 2023 & 2033 (%)
Figure 143 Middle East & Africa Carbon Capture, Transportation & Storage Market by Service, 2023-2033 (US$ Mn, AGR (%))
Figure 144 Middle East and Africa Carbon Capture, Transportation & Storage Market Share Forecast by Service, 2023 & 2033 (%)
Figure 145 Middle East & Africa Carbon Capture, Transportation & Storage Market by Source, 2023-2033 (US$ Mn, AGR (%))
Figure 146 Middle East and Africa Carbon Capture, Transportation & Storage Market Share Forecast by Source, 2023 & 2033 (%)
Figure 147 Middle East & Africa Carbon Capture, Transportation & Storage Market by Technology, 2023-2033 (US$ Mn, AGR (%))
Figure 148 Middle East and Africa Carbon Capture, Transportation & Storage Market Share Forecast by Technology, 2023 & 2033 (%)
Figure 149 GCC Carbon Capture, Transportation & Storage Market by Value, 2023-2033 (US$ Mn, AGR (%))
Figure 150 South Africa Carbon Capture, Transportation & Storage Market by Value, 2023-2033 (US$ Mn, AGR (%))
Figure 151 Rest of Middle East & Africa Carbon Capture, Transportation & Storage Market by Value, 2023-2033 (US$ Mn, AGR (%))
Figure 152 Latin America Carbon Capture, Transportation & Storage Market Attractiveness Index
Figure 153 Latin America Carbon Capture, Transportation & Storage Market by Region, 2023, 2028 & 2033 (US$ Million)
Figure 154 Latin America Carbon Capture, Transportation & Storage Market by Value, 2023-2033 (US$ Mn, AGR (%))
Figure 155 Latin America Carbon Capture, Transportation & Storage Market by Country, 2023-2033 (US$ Mn, AGR (%))
Figure 156 Latin America Carbon Capture, Transportation & Storage Market Share Forecast by Country, 2023 & 2033 (%)
Figure 157 Latin America Carbon Capture, Transportation & Storage Market by Business Type, 2023-2033 (US$ Mn, AGR (%))
Figure 158 Latin America Carbon Capture, Transportation & Storage Market Share Forecast Business Type, 2023 & 2033 (%)
Figure 159 Latin America Carbon Capture, Transportation & Storage Market by Transportation, 2023-2033 (US$ Mn, AGR (%))
Figure 160 Latin America Carbon Capture, Transportation & Storage Market Share Forecast by Transportation Services, 2023 & 2033 (%)
Figure 161 Latin America Carbon Capture, Transportation & Storage Market by Service, 2023-2033 (US$ Mn, AGR (%))
Figure 162 Latin America Carbon Capture, Transportation & Storage Market Share Forecast by Service, 2023 & 2033 (%)
Figure 163 Latin America Carbon Capture, Transportation & Storage Market by Source, 2023-2033 (US$ Mn, AGR (%))
Figure 164 Latin America Carbon Capture, Transportation & Storage Market Share Forecast by Source, 2023 & 2033 (%)
Figure 165 Latin America Carbon Capture, Transportation & Storage Market by Technology, 2023-2033 (US$ Mn, AGR (%))
Figure 166 Latin America Carbon Capture, Transportation & Storage Market Share Forecast by Technology, 2023 & 2033 (%)
Figure 167 Brazil Carbon Capture, Transportation & Storage Market by Value, 2023-2033 (US$ Mn, AGR (%))
Figure 168 Mexico Carbon Capture, Transportation & Storage Market by Value, 2023-2033 (US$ Mn, AGR (%))
Figure 169 Rest of Latin America Carbon Capture, Transportation & Storage Market by Value, 2023-2033 (US$ Mn, AGR (%))
Figure 170 Carbon Capture, Transportation & Storage Market: Company Share, 2022
Figure 171 Occidental Petroleum Corporation.: Net Revenue, 2018-2022 (US$ Million, AGR%)
Figure 172 Occidental Petroleum Corporation. R&D, 2018-2022 (US$ Million, AGR%)
Figure 173 Occidental Petroleum Corporation.: Regional Revenue Share, 2022 (%)
Figure 174 Occidental Petroleum Corporation.: Business Segment Revenue Share, 2022 (%)
Figure 175 Equinor ASA.: Net Revenue, 2018-2022 (US$ Million, AGR%)
Figure 176 Equinor ASA.: R&D, 2018-2022 (US$ Million, AGR%)
Figure 177 Equinor ASA.: Regional Revenue Share, 2022 (%)
Figure 178 Equinor ASA.: Business Segment Revenue Share, 2022 (%)
Figure 179 Royal Dutch Shell Plc.: Net Revenue, 2018-2022 (US$ Million, AGR%)
Figure 180 Royal Dutch Shell Plc.: R&D, 2018-2022 (US$ Million, AGR%)
Figure 181 Royal Dutch Shell Plc.: Regional Revenue Share, 2022 (%)
Figure 182 Royal Dutch Shell Plc.: Business Segment Revenue Share, 2022 (%)
Figure 183 Kinder Morgan, Inc.: Net Revenue, 2018-2022 (US$ Million, AGR%)
Figure 184 Kinder Morgan, Inc.: Regional Revenue Share, 2022 (%)
Figure 185 Kinder Morgan, Inc.: Business Segment Revenue Share, 2022 (%)
Figure 186 TC Energy Corporation.: Net Revenue, 2018-2022 (US$ Million, AGR%)
Figure 187 TC Energy Corporation.: Regional Revenue Share, 2022 (%)
Figure 188 TC Energy Corporation.: Business Segment Revenue Share, 2022 (%)
Figure 189 Enbridge Inc.: Net Revenue, 2018-2022 (US$ Million, AGR%)
Figure 190 Enbridge Inc.: Regional Revenue Share, 2022 (%)
Figure 191 Enbridge Inc.: Business Segment Revenue Share, 2022 (%)
Figure 192 Magellan Midstream Partners. Net Revenue, 2018-2022 (US$ Million, AGR%)
Figure 193 Magellan Midstream Partners. Business Segment Revenue Share, 2022 (%)
Figure 194 Enterprise Products Partners L.P.: Net Revenue, 2018-2022 (US$ Million, AGR%)
Figure 195 Enterprise Products Partners L.P.: Business Segment Revenue Share, 2022 (%)
Figure 196 Plains All American Pipeline, L.P.: Net Revenue, 2018-2022 (US$ Million, AGR%)
Figure 197 Plains All American Pipeline, L.P.: Regional Revenue Share, 2022 (%)
Figure 198 Plains All American Pipeline, L.P.: Business Segment Revenue Share, 2022 (%)
Figure 199 The Williams Companies, Inc.: Net Revenue, 2018-2022 (US$ Million, AGR%)
ページTOPに戻る
本レポートと同じKEY WORD(carbon)の最新刊レポート
- 本レポートと同じKEY WORDの最新刊レポートはありません。
よくあるご質問
Visiongain社はどのような調査会社ですか?
英国の調査会社ヴィジョンゲイン社(Visiongain)は、通信とエネルギーのほか、自動車や化学・医薬品、金属など、広範な市場を対象に調査を行っています。自動車市場については、市場全般に関する調査のほ... もっと見る
調査レポートの納品までの日数はどの程度ですか?
在庫のあるものは速納となりますが、平均的には 3-4日と見て下さい。
但し、一部の調査レポートでは、発注を受けた段階で内容更新をして納品をする場合もあります。
発注をする前のお問合せをお願いします。
注文の手続きはどのようになっていますか?
1)お客様からの御問い合わせをいただきます。
2)見積書やサンプルの提示をいたします。
3)お客様指定、もしくは弊社の発注書をメール添付にて発送してください。
4)データリソース社からレポート発行元の調査会社へ納品手配します。
5) 調査会社からお客様へ納品されます。最近は、pdfにてのメール納品が大半です。
お支払方法の方法はどのようになっていますか?
納品と同時にデータリソース社よりお客様へ請求書(必要に応じて納品書も)を発送いたします。
お客様よりデータリソース社へ(通常は円払い)の御振り込みをお願いします。
請求書は、納品日の日付で発行しますので、翌月最終営業日までの当社指定口座への振込みをお願いします。振込み手数料は御社負担にてお願いします。
お客様の御支払い条件が60日以上の場合は御相談ください。
尚、初めてのお取引先や個人の場合、前払いをお願いすることもあります。ご了承のほど、お願いします。
データリソース社はどのような会社ですか?
当社は、世界各国の主要調査会社・レポート出版社と提携し、世界各国の市場調査レポートや技術動向レポートなどを日本国内の企業・公官庁及び教育研究機関に提供しております。
世界各国の「市場・技術・法規制などの」実情を調査・収集される時には、データリソース社にご相談ください。
お客様の御要望にあったデータや情報を抽出する為のレポート紹介や調査のアドバイスも致します。
|
|


