EVバッテリー再利用市場レポート:2023-2033
EV Battery Reuse Market Report 2023-2033
レポート詳細
EVバッテリー再利用市場レポート 2023-2033年: 本レポートは、業界とその基礎となる原動力をよりよく理解することを望むなら、新たな収益ポケットを目指す大手企業にとって貴重なもの... もっと見る
※上記価格は部署ライセンス(Departmental licence)価格です。
その他の価格についてはデータリソースまでお問合せください。
日本語のページは自動翻訳を利用し作成しています。
実際のレポートは英文のみでご納品いたします。

|

|
サマリー
レポート詳細
EVバッテリー再利用市場レポート 2023-2033年:本レポートは、業界とその基礎となる原動力をよりよく理解することを望むなら、新たな収益ポケットを目指す大手企業にとって貴重なものとなるでしょう。異業種への進出や新規地域での既存事業の拡大を目指す企業にも有用です。
電池廃棄物の循環型ソリューションの開拓
世界の電気自動車(EV)バッテリー再利用市場の主な推進要因のひとつは、環境の持続可能性と資源保護を重視する傾向が強まっていることである。EVの普及が進むにつれ、使用済みバッテリーの廃棄とそれに伴う環境への影響に対する懸念が高まっている。EVバッテリーを二次用途に再利用することで、原料採取の必要性が軽減され、リチウムやコバルトなどの貴重な資源への負担が軽減される。このアプローチは循環型経済の原則に沿い、廃棄物の発生を最小限に抑え、電池部品のライフサイクルを延長する。世界中の政府、規制機関、産業界がカーボンフットプリントを最小限に抑える必要性を認識しており、バッテリー再利用は持続可能なエネルギー転換を達成するための重要な戦略となっている。
バッテリーセカンドライフで経済価値を引き出す
世界のEVバッテリー再利用市場では、経済性が大きな推進要因となっている。使用済みEVバッテリーを定置用エネルギー貯蔵などの二次用途に再利用することで、これらのコンポーネントの有用性が自動車での初期使用よりも拡大し、経済的価値が生まれます。企業や消費者は、再利用バッテリーを活用したコスト効率の高いエネルギー貯蔵ソリューションの恩恵を受け、新しいバッテリーを購入する必要性を減らすことができます。さらに、原材料調達への依存が減ることで、EV業界のコスト安定にも貢献する。バッテリーの製造コストは依然としてEVの製造費用のかなりの部分を占めているため、バッテリーの再利用は持続可能性を促進しながら収益性を達成する上で戦略的優位性を提供する。
市場調査レポートを購入する前にすべき質問とは?
- EVバッテリー再利用市場はどのように進化しているのか?
- EVバッテリー再利用市場を牽引している要因と抑制している要因は何か?
- 予測期間中、EVバッテリー再利用の各サブマーケットセグメントはどのように成長し、2033年にはどれくらいの売上を占めるようになるのか?
- 2023年から2033年にかけて、EVバッテリー再利用の各サブマーケットの市場シェアはどのように推移するのか?
- 2023年から2033年にかけて市場全体を牽引する主な要因は何か?
- EV用バッテリー再利用の主要市場は、マクロ経済の動きに概ね追随するのか、それとも個々の国別市場が他を凌駕するのか?
- 2033年までに各国市場のシェアはどう変化し、2033年に市場をリードするのはどの地域か?
- 主要プレーヤーと予測期間中の見通しは?
- 主要企業のEVバッテリー再利用プロジェクトとは?
- 2023年から2033年の間に、産業はどのように発展するのか?現在および今後10年間に行われるEVバッテリーの再利用プロジェクトにはどのような意味があるのか?
- EVバッテリー再利用市場をさらに拡大するために、製品化の必要性は高まっているか?
- EVバッテリー再利用市場の方向性と、市場の最前線に立つための方法とは?
- 新製品や新サービスへの最適な投資方法とは?
- 企業を新たな成長軌道に乗せ、C-suiteに移行させるための重要な展望とは?
EV用バッテリー再利用市場が、現在、そして今後10年間でどのような影響を受けるかを見極める必要がある:
- 358ページにわたる本レポートでは、120の表と164の図表を掲載しています。
- 本レポートでは、業界における主要な有利分野を取り上げているため、今すぐターゲットを絞ることができます。
- 本レポートには、世界、地域、国の売上と成長に関する詳細な分析が含まれています。
- 競合他社が成功させた主なトレンド、変化、収益予測をハイライトしています。
本レポートは、EV用バッテリー再利用市場が今後10年間でどのように発展するか、またCOVID-19の景気後退と好転の変動に合わせてどのように発展するかをお伝えします。この市場は、過去10年間のどの時点よりも今が重要です。
2033年までの予測やその他の分析から、商業的な展望が明らかになる
- 2033年までの収益予測に加え、直近の業績、成長率、市場シェアもご覧いただけます。
- ビジネスの展望と展開に関する独自の分析をご覧いただけます。
- 質的分析(市場ダイナミクス、促進要因、機会、阻害要因、課題を含む)、コスト構造、EVバッテリーの再利用価格上昇の影響、最新動向をご覧いただけます。
本レポートには、COVID-19が業界と貴社にどのような影響を与えるかについてのデータ分析と貴重な洞察が含まれている。本レポートでは、COVID-19の4つの回収パターンとその影響、すなわち「V」、「L」、「W」、「U」について論じている。
レポート対象セグメント
自動車タイプ別市場セグメント
- 乗用車
- 商用車
- その他の車両タイプ
用途別市場セグメント
- エネルギー貯蔵
- 基地局
- 低速車両
- EV充電ステーション
供給源別市場セグメント
- バッテリー電気自動車(BEV)
- ハイブリッド電気自動車(HEV)
- プラグインハイブリッド車(PHEV)
- 燃料電池電気自動車(FCEV)
- その他の供給源
電池タイプ別市場セグメント
- リン酸鉄リチウム
- リチウムマンガン酸化物
- リチウム・ニッケル・コバルト・アルミニウム酸化物
- リチウム-ニッケル-マンガン-コバルト
- チタン酸リチウム酸化物
- その他の電池タイプ
世界市場全体とセグメント別の収益予測に加え、4つの地域と20の主要国市場の収益予測も掲載しています:
北米
- アメリカ
- カナダ
欧州
- ドイツ
- オランダ
- イギリス
- フランス
- ノルウェー
- その他の欧州
アジア太平洋
- 中国
- 日本
- インド
- オーストラリア
- 韓国
- その他のアジア太平洋地域
ラテンアメリカ
- ブラジル
- メキシコ
- その他ラテンアメリカ
中東・アフリカ
- GCC
- 南アフリカ
- その他の中東・アフリカ
このレポートには、EVバッテリー再利用市場の2023年から2033年の主要企業のプロフィールと、これらの企業の事業のこのセグメントに焦点を当てた一部の企業のプロフィールも含まれています。
主要企業と市場成長の可能性
・ B2U Storage Solutions
・ Battery Loop AB
・ Connected Energy Ltd
・ Evyon
・ Moment Energy
・ Nissan Motor Co. Ltd
・ Octave BV
・ Re Purpose Energy, Inc.
・ Renault Group
・ Spiers New Technologies Inc
・ Stena Metall AB
・ Tesla, Inc.
2023年から2033年までのEV用バッテリー再利用市場の世界全体の売上高は、金額ベースで2023年に13億6700万米ドルを突破する。2033年まで収益が力強く成長すると予測。当調査では、最も大きな可能性を秘めた組織を特定しています。彼らの能力、進歩、商業的展望を発見し、一歩先を行くお手伝いをします。
EVバッテリー再利用市場、2023-2033年レポートはどのように役立つのか?
要約すると、350ページを超えるこのレポートは、以下の知識を提供する:
- EVバッテリー再利用市場、2023年から2033年までの収益予測 自動車タイプ、用途、供給源、バッテリータイプ、それぞれの予測を世界と地域レベルで掲載 - 業界の展望を発見し、投資と収益に最も有利な場所を見つけることができます。
- 4つの地域と20の主要国市場の2033年までの収益予測 - 北米、ヨーロッパ、アジア太平洋、ラテンアメリカ、中東&アフリカのEVバッテリー再利用市場2023年から2033年までの市場予測をご覧ください。また、米国、カナダ、ブラジル、ドイツ、フランス、英国、ノルウェー、オランダ、中国、インド、日本、オーストラリアなどの主要経済圏の市場も予測しています。
- 既存企業および市場参入を目指す企業の展望 - EVバッテリー再利用市場に関わる主要企業12社の企業プロファイルを含む、2023年から2033年までの展望。
独自の予測による定量的・定性的分析をご覧ください。私たちのレポートだけに含まれる情報を入手し、貴重なビジネスインテリジェンスで情報を得ることができます。
他にはない情報
私たちの新しいレポートがあれば、知識に遅れをとったり、チャンスを逃したりする可能性が低くなります。弊社の調査レポートが貴社の調査、分析、意思決定にどのように役立つかをご覧ください。Visiongainの調査は、EVバッテリー再利用市場、2023年から2033年、市場をリードする企業の商業分析を必要とするすべての人のためのものです。データ、トレンド、予測をご覧いただけます。
ページTOPに戻る
目次
目次
1 レポート概要
1.1 研究の目的
1.2 EVバッテリー再利用市場の紹介
1.3 本レポートの内容
1.4 本レポートを読むべき理由
1.5 本分析レポートが回答する主な質問
1.6 本レポートは誰のためのものか?
1.7 調査方法
1.7.1 市場の定義
1.7.2 市場評価・予測手法
1.7.3 データ検証
1.7.3.1 一次調査
1.7.3.2 セカンダリーリサーチ
1.8 よくある質問(FAQ)
1.9 Visiongainの関連レポート
1.10 Visiongainについて
2 エグゼクティブ・サマリー
2.1 セグメント分析
2.1.1 車種別セグメント市場魅力度指数
2.1.2 用途別セグメント市場魅力度指数
2.1.3 出典セグメント:市場魅力度指数市場魅力度指数
2.1.4 電池タイプセグメント:市場魅力度指数市場魅力度指数
2.2 地域別分析
3 市場概要
3.1 主要な調査結果
3.2 市場ダイナミクス
3.2.1 市場促進要因
3.2.1.1 政府の取り組みとインセンティブ
3.2.1.2 電気自動車(EV)の普及拡大がEVバッテリー再利用市場の重要な促進要因
3.2.1.3 気候変動、汚染、資源枯渇に対する懸念が、持続可能な実践への注力を強めている
3.2.2 市場の阻害要因
3.2.2.1 高い初期投資コスト
3.2.2.2 電池再製造のためのインフラが限られている
3.2.2.3 複雑な規制とコンプライアンス上の課題
3.2.3 市場機会
3.2.3.1 電池再製造技術の進歩
3.2.3.2 サーキュラー・エコノミー・モデルの出現
3.2.3.3 エネルギー貯蔵ソリューションの採用増加
3.3 COVID-19の影響分析
3.3.1 V字型回収
3.3.2 W字型回収
3.3.3 U字型回収
3.3.4 L字型回復
3.4 ポーターのファイブフォース分析
3.4.1 サプライヤーの交渉力(中〜高)
3.4.2 買い手の交渉力(中)
3.4.3 競争力(高)
3.4.4 代替品による脅威(低)
3.4.5 新規参入企業の脅威(低)
3.5 PEST分析
3.5.1 政治的要因
3.5.2 経済的要因
3.5.3 社会的要因
3.5.4 技術的要因
4 EVバッテリー再利用市場分析車:両タイプ別
4.1 主要調査結果
4.2 車種別セグメント 市場魅力度指数
4.3 EVバッテリー再利用の車両タイプ別市場規模推定と予測
4.4 乗用車市場
4.4.1 2023〜2033年の地域別市場規模(US$ Million)
4.4.2 地域別市場シェア、2023年・2033年(%)
4.5 商用車市場
4.5.1 2023〜2033年の地域別市場規模(US$ Million)
4.5.2 地域別市場シェア、2023年・2033年(%)
4.6 その他の車両タイプ市場
4.6.1 2023〜2033年の地域別市場規模(US$ Million)
4.6.2 地域別市場シェア、2023年・2033年(%)
5 EVバッテリー再利用市場分析:用途別
5.1 主要調査結果
5.2 アプリケーションセグメント 市場魅力度指数
5.3 EVバッテリー再利用の用途別市場規模推定と予測
5.4 エネルギー貯蔵市場
5.4.1 2023〜2033年の地域別市場規模(US$ Million)
5.4.2 地域別市場シェア、2023年・2033年(%)
5.5 基地局市場
5.5.1 2023~2033年の地域別市場規模(US$ Million)
5.5.2 地域別市場シェア、2023年・2033年(%)
5.6 低速車両市場
5.6.1 2023〜2033年の地域別市場規模(US$ Million)
5.6.2 地域別市場シェア、2023年・2033年(%)
5.7 EV充電ステーション
5.7.1 2023〜2033年の地域別市場規模(US$ Million)
5.7.2 地域別市場シェア、2023年・2033年(%)
6 EVバッテリー再利用市場別分析:供給源
6.1 主要調査結果
6.2 供給源セグメント 市場魅力度指数
6.3 EVバッテリー再利用のソース別市場規模推定と予測
6.4 バッテリー電気自動車(BEV)市場
6.4.1 2023〜2033年の地域別市場規模(US$ Million)
6.4.2 地域別市場シェア、2023年・2033年 (%)
6.5 ハイブリッド車(HEV)市場
6.5.1 2023〜2033年の地域別市場規模(US$ Million)
6.5.2 地域別市場シェア、2023年・2033年 (%)
6.6 プラグインハイブリッド車(PHEV)市場
6.6.1 2023~2033年の地域別市場規模(US$ Million)
6.6.2 地域別市場シェア、2023年・2033年 (%)
6.7 燃料電池電気自動車(FCEV)市場
6.7.1 2023~2033年の地域別市場規模(US$ Million)
6.7.2 地域別市場シェア、2023年・2033年(%)
6.8 その他のソース市場
6.8.1 2023〜2033年の地域別市場規模(US$ Million)
6.8.2 地域別市場シェア、2023年・2033年(%)
7 EV用バッテリー再利用市場分析:バッテリータイプ別
7.1 主要な調査結果
7.2 電池タイプ別セグメント 市場魅力度指数
7.3 EVバッテリー再利用の電池タイプ別市場規模推定と予測
7.4 リン酸鉄リチウム市場
7.4.1 2023~2033年の地域別市場規模(US$ Million)
7.4.2 2023年・2033年の地域別市場シェア(%)
7.5 酸化リチウムマンガン市場
7.5.1 2023年~2033年の地域別市場規模(US$ Million)
7.5.2 2023年・2033年の地域別市場シェア(%)
7.6 酸化リチウム・ニッケル・コバルト・アルミニウム市場
7.6.1 2023~2033年の地域別市場規模(US$ Million)
7.6.2 地域別市場シェア、2023年・2033年(%)
7.7 リチウム・ニッケル・マンガン・コバルト市場
7.7.1 2023~2033年の地域別市場規模(US$ Million)
7.7.2 地域別市場シェア、2023年・2033年(%)
7.8 チタン酸リチウム酸化物市場
7.8.1 2023~2033年の地域別市場規模(US$ Million)
7.8.2 2023年・2033年の地域別市場シェア(%)
7.9 その他の電池タイプ市場
7.9.1 2023~2033年の地域別市場規模(US$ Million)
7.9.2 地域別市場シェア、2023年・2033年(%)
8 EVバッテリー再利用市場分析:地域別
8.1 主要な調査結果
8.2 地域別市場規模の推定と予測
9 北米EVバッテリー再利用市場分析
9.1 主要な調査結果
9.2 北米のEVバッテリー再利用市場魅力度指数
9.3 北米のEVバッテリー再利用市場:国別、2023年、2028年、2033年(US$ Million)
9.4 北米のEVバッテリー再利用市場規模推定と予測:金額ベース
9.5 北米のEVバッテリー再利用市場規模推定と予測:国別
9.6 北米のEVバッテリー再利用市場規模推定と予測:車両タイプ別
9.7 北米のEVバッテリー再利用市場規模推定と予測:用途別
9.8 北米のEVバッテリー再利用市場規模推定と予測:供給源別
9.9 北米のEVバッテリー再利用市場規模推定と予測:バッテリータイプ別
9.10 米国のEVバッテリー再利用市場
9.11 カナダのEVバッテリー再利用市場
10 欧州のEVバッテリー再利用市場分析
10.1 主要な調査結果
10.2 欧州EVバッテリー再利用市場魅力度指数
10.3 欧州のEVバッテリー再利用市場:国別、2023年、2028年、2033年(US$ Million)
10.4 欧州のEVバッテリー再利用市場規模推定と予測:金額ベース
10.5 欧州のEVバッテリー再利用市場規模推定と予測:国別
10.6 欧州のEVバッテリー再利用市場規模推定と予測:車両タイプ別
10.7 欧州のEVバッテリー再利用市場規模推定と予測:用途別
10.8 欧州のEVバッテリー再利用市場規模推定と予測:供給源別
10.9 欧州のEVバッテリー再利用市場規模推定と予測:バッテリータイプ別
10.10 ドイツのEVバッテリー再利用市場
10.11 イギリスのEVバッテリー再利用市場
10.12 フランスのEVバッテリー再利用市場
10.13 ノルウェーのEVバッテリー再利用市場
10.14 オランダのEVバッテリー再利用市場
10.15 その他の欧州のEVバッテリー再利用市場
11 アジア太平洋地域のEVバッテリー再利用市場分析
11.1 主要な調査結果
11.2 アジア太平洋地域のEVバッテリー再利用市場魅力度指数
11.3 アジア太平洋地域のEVバッテリー再利用市場:国別、2023年、2028年、2033年(US$ Million)
11.4 アジア太平洋地域のEVバッテリー再利用市場規模推定と予測:金額ベース
11.5 アジア太平洋地域のEVバッテリー再利用市場規模推定と予測:国別
11.6 アジア太平洋地域のEVバッテリー再利用市場規模推定と予測:車両タイプ別
11.7 アジア太平洋地域のEVバッテリー再利用市場規模推定と予測:用途別
11.8 アジア太平洋地域のEVバッテリー再利用市場規模推定と予測:供給源別
11.9 アジア太平洋地域のEVバッテリー再利用市場規模推定と予測:バッテリータイプ別
11.10 中国のEVバッテリー再利用市場
11.11 インドのEVバッテリー再利用市場
11.12 日本のEVバッテリーリユース市場
11.13 韓国のEVバッテリーリユース市場
11.14 オーストラリアのEV電池リユース市場
11.15 その他のアジア太平洋地域のEVバッテリー再利用市場
12 中東・アフリカのEVバッテリー再利用市場分析
12.1 主要な調査結果
12.2 中東・アフリカのEVバッテリー再利用市場魅力度指数
12.3 中東・アフリカのEVバッテリー再利用市場:国別、2023年、2028年、2033年(US$ Million)
12.4 中東・アフリカのEVバッテリー再利用市場規模推定と予測:金額ベース
12.5 中東・アフリカのEVバッテリー再利用市場規模推定と予測:国別
12.6 中東・アフリカのEVバッテリー再利用市場規模推定と予測:車両タイプ別
12.7 中東・アフリカのEVバッテリー再利用市場規模推定と予測:用途別
12.8 中東・アフリカのEVバッテリー再利用市場規模推定と予測:供給源別
12.9 中東・アフリカのEVバッテリー再利用市場規模推定と予測:バッテリータイプ別
12.10 GCCのEVバッテリー再利用市場
12.11 南アフリカのEVバッテリー再利用市場
12.12 その他の中東・アフリカ地域のEVバッテリー再利用市場
13 ラテンアメリカのEVバッテリー再利用市場分析
13.1 主要な調査結果
13.2 ラテンアメリカのEVバッテリー再利用市場魅力度指数
13.3 ラテンアメリカのEVバッテリー再利用市場:国別、2023年、2028年、2033年(US$ Million)
13.4 ラテンアメリカのEVバッテリー再利用市場規模推定と予測:金額ベース
13.5 ラテンアメリカのEVバッテリー再利用市場規模推定と予測:国別
13.6 ラテンアメリカのEVバッテリー再利用市場規模推定と予測:車両タイプ別
13.7 ラテンアメリカのEVバッテリー再利用市場規模推定と予測:用途別
13.8 ラテンアメリカのEVバッテリー再利用市場規模推定と予測:供給源別
13.9 ラテンアメリカのEVバッテリー再利用市場規模推定と予測:バッテリータイプ別
13.10 ブラジルのEVバッテリー再利用市場
13.11 メキシコのEVバッテリー再利用市場
13.12 その他のラテンアメリカのEVバッテリー再利用市場
14 主要企業のプロファイル
14.1 競争環境、2022年
14.2 戦略的展望
14.3 Second Life EV Batteries Ltd
14.3.1 会社概要
14.3.2 会社概要
14.3.3 製品ベンチマーク
14.4 Tesla, Inc.
14.4.1 会社概要
14.4.2 会社概要
14.4.3 財務分析
14.4.3.1 純収入、2018-2022年
14.4.3.2 R&D、2018年~2022年
14.4.3.3 地域別収益シェア、2022年(%)
14.4.3.4 事業セグメント収益シェア、2022年(%)
14.4.4 製品ベンチマーク
14.4.5 戦略的展望
14.5 Re Purpose Energy, Inc.
14.5.1 会社概要
14.5.2 会社概要
14.5.3 製品ベンチマーク
14.6 Spiers New Technologies Inc
14.6.1 会社概要
14.6.2 会社概要
14.6.3 製品ベンチマーク
14.7 Nissan Motor Co. Ltd
14.7.1 会社概要
14.7.2 会社概要
14.7.3 財務分析
14.7.3.1 純収入、2018-2022年
14.7.3.2 地域別収益シェア、2022年(%)
14.7.4 製品ベンチマーク
14.7.5 戦略的展望
14.8 Renault Group
14.8.1 会社概要
14.8.2 会社概要
14.8.3 財務分析
14.8.3.1 純収入、2018-2022年
14.8.3.2 R&D、2018年〜2022年
14.8.3.3 事業セグメント収益シェア、2022年(%)
14.8.4 製品ベンチマーク
14.8.5 戦略的展望
14.9 Stena Metall AB
14.9.1 会社概要
14.9.2 会社概要
14.9.3 製品ベンチマーク
14.9.4 戦略的展望
14.10 B2U Storage Solutions
14.10.1 会社概要
14.10.2 会社概要
14.10.3 製品ベンチマーク
14.10.4 戦略的展望
14.11 Moment Energy
14.11.1 会社概要
14.11.2 会社概要
14.11.3 製品ベンチマーク
14.11.4 戦略的展望
14.12 Connected Energy Ltd
14.12.1 会社概要
14.12.2 会社概要
14.12.3 製品ベンチマーク
14.13 Evyon
14.13.1 会社概要
14.13.2 会社概要
14.13.3 製品ベンチマーク
14.13.4 戦略的展望
14.14 Battery Loop AB
14.14.1 会社概要
14.14.2 会社概要
14.14.3 製品ベンチマーク
14.14.4 戦略的展望
14.15 Octave BV.
14.15.1 会社概要
14.15.2 会社概要
14.15.3 製品ベンチマーク
15 結論と提言
15.1 Visiongainからの結びの言葉
15.2 市場プレイヤーへの提言
ページTOPに戻る
図表リスト
表の一覧
Table 1 EV Battery Reuse Market Snapshot, 2023 & 2033 (US$ Million, CAGR %)
Table 2 Global EV Battery Reuse Market Forecast, 2023-2033 (US$ Mn, AGR (%), CAGR (%)) (V-Shaped Recovery Scenario)
Table 3 Global EV Battery Reuse Market by Region, 2023-2033 (US$ Mn, AGR (%), CAGR (%)) (V-Shaped Recovery Scenario)
Table 4 Global EV Battery Reuse Market Forecast, 2023-2033 (US$ Mn, AGR (%), CAGR (%)) (W-Shaped Recovery Scenario)
Table 5 Global EV Battery Reuse Market by Region, 2023-2033 (US$ Mn, AGR (%), CAGR (%)) (W-Shaped Recovery Scenario)
Table 6 Global EV Battery Reuse Market Forecast, 2023-2033 (US$ Mn, AGR (%), CAGR (%)) (U-Shaped Recovery Scenario)
Table 7 Global EV Battery Reuse Market by Region, 2023-2033 (US$ Mn, AGR (%), CAGR (%)) (U-Shaped Recovery Scenario)
Table 8 Global EV Battery Reuse Market Forecast, 2023-2033 (US$ Mn, AGR (%), CAGR (%)) (L-Shaped Recovery Scenario)
Table 9 Global EV Battery Reuse Market by Region, 2023-2033 (US$ Mn, AGR (%), CAGR (%)) (L-Shaped Recovery Scenario)
Table 10 Global EV Battery Reuse Market by Vehicle Type, 2023-2033 (US$ Mn, AGR (%), CAGR (%))
Table 11 Passenger Cars Market by Region, 2023-2033 (US$ Mn, AGR (%), CAGR (%))
Table 12 Commercial Vehicles Market by Region, 2023-2033 (US$ Mn, AGR (%), CAGR (%))
Table 13 Other Vehicle Type Market by Region, 2023-2033 (US$ Mn, AGR (%), CAGR (%))
Table 14 Global EV Battery Reuse Market by Application, 2023-2033 (US$ Mn, AGR (%), CAGR (%))
Table 15 Energy Storage Market by Region, 2023-2033 (US$ Mn, AGR (%), CAGR (%))
Table 16 Base Stations Market by Region, 2023-2033 (US$ Mn, AGR (%), CAGR (%))
Table 17 Low Speed Vehicles Market by Region, 2023-2033 (US$ Mn, AGR (%), CAGR (%))
Table 18 EV Charging Stations Market by Region, 2023-2033 (US$ Mn, AGR (%), CAGR (%))
Table 19 Global EV Battery Reuse Market by Source, 2023-2033 (US$ Mn, AGR (%), CAGR (%))
Table 20 Battery Electric Vehicles (BEVs) Market by Region, 2023-2033 (US$ Mn, AGR (%), CAGR (%))
Table 21 Hybrid Electric Vehicle (HEV) Market by Region, 2023-2033 (US$ Mn, AGR (%), CAGR (%))
Table 22 Plug-in Hybrid Electric Vehicle (PHEV) Market by Region, 2023-2033 (US$ Mn, AGR (%), CAGR (%))
Table 23 Fuel Cell Electric Vehicle (FCEV) Market by Region, 2023-2033 (US$ Mn, AGR (%), CAGR (%))
Table 24 Other Sources Market by Region, 2023-2033 (US$ Mn, AGR (%), CAGR (%))
Table 25 Global EV Battery Reuse Market by Battery Type, 2023-2033 (US$ Mn, AGR (%), CAGR (%))
Table 26 Lithium-Iron Phosphate Market by Region, 2023-2033 (US$ Mn, AGR (%), CAGR (%))
Table 27 Lithium-Manganese Oxide Market by Region, 2023-2033 (US$ Mn, AGR (%), CAGR (%))
Table 28 Lithium-Nickel-Cobalt-Aluminium Oxide Market by Region, 2023-2033 (US$ Mn, AGR (%), CAGR (%))
Table 29 Lithium-Nickel-Manganese Cobalt Market by Region, 2023-2033 (US$ Mn, AGR (%), CAGR (%))
Table 30 Lithium-Titanate Oxide Market by Region, 2023-2033 (US$ Mn, AGR (%), CAGR (%))
Table 31 Other Battery Type Market by Region, 2023-2033 (US$ Mn, AGR (%), CAGR (%))
Table 32 Global EV Battery Reuse Market Forecast, 2023-2033 (US$ Mn, AGR (%), CAGR (%))
Table 33 Global EV Battery Reuse Market by Region, 2023-2033 (US$ Mn, AGR (%), CAGR (%))
Table 34 Global EV Battery Reuse Market by Vehicle Type, 2023-2033 (US$ Mn, AGR (%), CAGR (%))
Table 35 Global EV Battery Reuse Market by Application, 2023-2033 (US$ Mn, AGR (%), CAGR (%))
Table 36 Global EV Battery Reuse Market by Source, 2023-2033 (US$ Mn, AGR (%), CAGR (%))
Table 37 Global EV Battery Reuse Market by Battery Type, 2023-2033 (US$ Mn, AGR (%), CAGR (%))
Table 38 North America EV Battery Reuse Market by Value, 2023-2033 (US$ Mn, AGR (%), CAGR (%))
Table 39 North America EV Battery Reuse Market by Country, 2023-2033 (US$ Mn, AGR (%), CAGR (%))
Table 40 North America EV Battery Reuse Market by Vehicle Type, 2023-2033 (US$ Mn, AGR (%), CAGR (%))
Table 41 North America EV Battery Reuse Market by Application, 2023-2033 (US$ Mn, AGR (%), CAGR (%))
Table 42 North America EV Battery Reuse Market by Source, 2023-2033 (US$ Mn, AGR (%), CAGR (%))
Table 43 North America EV Battery Reuse Market by Battery Type, 2023-2033 (US$ Mn, AGR (%), CAGR (%))
Table 44 US EV Battery Reuse Market by Value, 2023-2033 (US$ Mn, AGR (%), CAGR (%))
Table 45 Canada EV Battery Reuse Market by Value, 2023-2033 (US$ Mn, AGR (%), CAGR (%))
Table 46 Europe EV Battery Reuse Market by Value, 2023-2033 (US$ Mn, AGR (%), CAGR (%))
Table 47 Europe EV Battery Reuse Market by Country, 2023-2033 (US$ Mn, AGR (%), CAGR (%))
Table 48 Europe EV Battery Reuse Market by Vehicle Type, 2023-2033 (US$ Mn, AGR (%), CAGR (%))
Table 49 Europe EV Battery Reuse Market by Application, 2023-2033 (US$ Mn, AGR (%), CAGR (%))
Table 50 Europe EV Battery Reuse Market by Source, 2023-2033 (US$ Mn, AGR (%), CAGR (%))
Table 51 Europe EV Battery Reuse Market by Battery Type, 2023-2033 (US$ Mn, AGR (%), CAGR (%))
Table 52 Germany EV Battery Reuse Market by Value, 2023-2033 (US$ Mn, AGR (%), CAGR (%))
Table 53 UK EV Battery Reuse Market by Value, 2023-2033 (US$ Mn, AGR (%), CAGR (%))
Table 54 France EV Battery Reuse Market by Value, 2023-2033 (US$ Mn, AGR (%), CAGR (%))
Table 55 Norway EV Battery Reuse Market by Value, 2023-2033 (US$ Mn, AGR (%), CAGR (%))
Table 56 Netherlands EV Battery Reuse Market by Value, 2023-2033 (US$ Mn, AGR (%), CAGR (%))
Table 57 Rest of Europe EV Battery Reuse Market by Value, 2023-2033 (US$ Mn, AGR (%), CAGR (%))
Table 58 Asia-Pacific EV Battery Reuse Market by Value, 2023-2033 (US$ Mn, AGR (%), CAGR (%))
Table 59 Asia-Pacific EV Battery Reuse Market by Country, 2023-2033 (US$ Mn, AGR (%), CAGR (%))
Table 60 Asia-Pacific EV Battery Reuse Market by Vehicle Type, 2023-2033 (US$ Mn, AGR (%), CAGR (%))
Table 61 Asia-Pacific EV Battery Reuse Market by Application, 2023-2033 (US$ Mn, AGR (%), CAGR (%))
Table 62 Asia-Pacific EV Battery Reuse Market by Source, 2023-2033 (US$ Mn, AGR (%), CAGR (%))
Table 63 Asia-Pacific EV Battery Reuse Market by Battery Type, 2023-2033 (US$ Mn, AGR (%), CAGR (%))
Table 64 China EV Battery Reuse Market by Value, 2023-2033 (US$ Mn, AGR (%), CAGR (%))
Table 65 India EV Battery Reuse Market by Value, 2023-2033 (US$ Mn, AGR (%), CAGR (%))
Table 66 Japan EV Battery Reuse Market by Value, 2023-2033 (US$ Mn, AGR (%), CAGR (%))
Table 67 South Korea EV Battery Reuse Market by Value, 2023-2033 (US$ Mn, AGR (%), CAGR (%))
Table 68 Australia EV Battery Reuse Market by Value, 2023-2033 (US$ Mn, AGR (%), CAGR (%))
Table 69 Rest of Asia-Pacific EV Battery Reuse Market by Value, 2023-2033 (US$ Mn, AGR (%), CAGR (%))
Table 70 Middle East & Africa EV Battery Reuse Market by Value, 2023-2033 (US$ Mn, AGR (%), CAGR (%))
Table 71 Middle East & Africa EV Battery Reuse Market by Country, 2023-2033 (US$ Mn, AGR (%), CAGR (%))
Table 72 Middle East & Africa EV Battery Reuse Market by Vehicle Type, 2023-2033 (US$ Mn, AGR (%), CAGR (%))
Table 73 Middle East & Africa EV Battery Reuse Market by Application, 2023-2033 (US$ Mn, AGR (%), CAGR (%))
Table 74 Middle East & Africa EV Battery Reuse Market by Source, 2023-2033 (US$ Mn, AGR (%), CAGR (%))
Table 75 Middle East & Africa EV Battery Reuse Market by Battery Type, 2023-2033 (US$ Mn, AGR (%), CAGR (%))
Table 76 GCC EV Battery Reuse Market by Value, 2023-2033 (US$ Mn, AGR (%), CAGR (%))
Table 77 South Africa EV Battery Reuse Market by Value, 2023-2033 (US$ Mn, AGR (%), CAGR (%))
Table 78 Rest of Middle East & Africa EV Battery Reuse Market by Value, 2023-2033 (US$ Mn, AGR (%), CAGR (%))
Table 79 Latin America EV Battery Reuse Market by Value, 2023-2033 (US$ Mn, AGR (%), CAGR (%))
Table 80 Latin America EV Battery Reuse Market by Country, 2023-2033 (US$ Mn, AGR (%), CAGR (%))
Table 81 Latin America EV Battery Reuse Market by Vehicle Type, 2023-2033 (US$ Mn, AGR (%), CAGR (%))
Table 82 Latin America EV Battery Reuse Market by Application, 2023-2033 (US$ Mn, AGR (%), CAGR (%))
Table 83 Latin America EV Battery Reuse Market by Source, 2023-2033 (US$ Mn, AGR (%), CAGR (%))
Table 84 Latin America EV Battery Reuse Market by Battery Type, 2023-2033 (US$ Mn, AGR (%), CAGR (%))
Table 85 Brazil EV Battery Reuse Market by Value, 2023-2033 (US$ Mn, AGR (%), CAGR (%))
Table 86 Mexico EV Battery Reuse Market by Value, 2023-2033 (US$ Mn, AGR (%), CAGR (%))
Table 87 Rest of Latin America EV Battery Reuse Market by Value, 2023-2033 (US$ Mn, AGR (%), CAGR (%))
Table 88 Strategic Outlook
Table 89 Second Life EV Batteries Ltd: Key Details, (CEO, HQ, Revenue, Founded, No. of Employees, Company Type, Website, Business Segment)
Table 90 Second Life EV Batteries Ltd: Product Benchmarking
Table 91 Tesla, Inc: Key Details, (CEO, HQ, Revenue, Founded, No. of Employees, Company Type, Website, Business Segment)
Table 92 Tesla, Inc: Strategic Outlook
Table 93 Re Purpose Energy, Inc: Key Details, (CEO, HQ, Revenue, Founded, No. of Employees, Company Type, Website, Business Segment)
Table 94 Spiers New Technologies Inc.: Key Details, (CEO, HQ, Revenue, Founded, No. of Employees, Company Type, Website, Business Segment)
Table 95 Spiers New Technologies Inc: Product Benchmarking
Table 96 Nissan Motor Co. Ltd: Key Details, (CEO, HQ, Revenue, Founded, No. of Employees, Company Type, Website, Business Segment)
Table 97 Nissan Motor Co. Ltd: Product Benchmarking
Table 98 Nissan Motor Co. Ltd: Strategic Outlook
Table 99 Renault Group: Key Details, (CEO, HQ, Revenue, Founded, No. of Employees, Company Type, Website, Business Segment)
Table 100 Renault Group: Product Benchmarking
Table 101 Renault Group: Strategic Outlook
Table 102 Stena Metall AB: Key Details, (CEO, HQ, Revenue, Founded, No. of Employees, Company Type, Website, Business Segment)
Table 103 Stena Metall AB: Product Benchmarking
Table 104 Stena Metall AB: Strategic Outlook
Table 105 B2U Storage Solutions: Key Details, (CEO, HQ, Revenue, Founded, No. of Employees, Company Type, Website, Business Segment)
Table 106 B2U Storage Solutions: Product Benchmarking
Table 107 B2U Storage Solutions: Strategic Outlook
Table 108 Moment Energy: Key Details, (CEO, HQ, Revenue, Founded, No. of Employees, Company Type, Website, Business Segment)
Table 109 Moment Energy: Product Benchmarking
Table 110 Moment Energy: Strategic Outlook
Table 111 Connected Energy Ltd: Key Details, (CEO, HQ, Revenue, Founded, No. of Employees, Company Type, Website, Business Segment)
Table 112 Connected Energy Ltd: Product Benchmarking
Table 113 Evyon; Key Details, (CEO, HQ, Revenue, Founded, No. of Employees, Company Type, Website, Business Segment)
Table 114 Evyon: Product Benchmarking
Table 115 Evyon: Strategic Outlook
Table 116 Battery Loop AB : Key Details, (CEO, HQ, Revenue, Founded, No. of Employees, Company Type, Website, Business Segment)
Table 117 Battery Loop AB : Product Benchmarking
Table 118 Battery Loop AB : Strategic Outlook
Table 119 Octave BV.: Key Details, (CEO, HQ, Revenue, Founded, No. of Employees, Company Type, Website, Business Segment)
Table 120 Octave BV.: Product Benchmarking
図の一覧
Figure 1 EV Battery Reuse Market Segmentation
Figure 2 EV Battery Reuse Market by Vehicle Type: Market Attractiveness Index
Figure 3 EV Battery Reuse Market by Application: Market Attractiveness Index
Figure 4 EV Battery Reuse Market by Source: Market Attractiveness Index
Figure 5 EV Battery Reuse Market by Indication: Market Attractiveness Index
Figure 6 EV Battery Reuse Market Attractiveness Index by Region
Figure 7 EV Battery Reuse Market: Market Dynamics
Figure 8 Global EV Battery Reuse Market Share Forecast by COVID, 2023-2033 (%)
Figure 9 Global EV Battery Reuse Market Forecast, 2023-2033 (US$ Mn, AGR (%)) (V-Shaped Recovery Scenario)
Figure 10 Global EV Battery Reuse Market by Region, 2023-2033 (US$ Mn, AGR (%)) (V-Shaped Recovery Scenario)
Figure 11 Global EV Battery Reuse Market Forecast, 2023-2033 (US$ Mn, AGR (%)) (W-Shaped Recovery Scenario)
Figure 12 Global EV Battery Reuse Market by Region, 2023-2033 (US$ Mn, AGR (%)) (W-Shaped Recovery Scenario)
Figure 13 Global EV Battery Reuse Market Forecast, 2023-2033 (US$ Mn, AGR (%)) (U-Shaped Recovery Scenario)
Figure 14 Global EV Battery Reuse Market by Region, 2023-2033 (US$ Mn, AGR (%)) (U-Shaped Recovery Scenario)
Figure 15 Global EV Battery Reuse Market Forecast, 2023-2033 (US$ Mn, AGR (%)) (L-Shaped Recovery Scenario)
Figure 16 Global EV Battery Reuse Market by Region, 2023-2033 (US$ Mn, AGR (%)) (L-Shaped Recovery Scenario)
Figure 17 EV Battery Reuse Market: Porter’s Five Forces Analysis
Figure 18 EV Battery Reuse Market: PEST Analysis
Figure 19 EV Battery Reuse Market by Vehicle Type: Market Attractiveness Index
Figure 20 Global EV Battery Reuse Market by Vehicle Type, 2023-2033 (US$ Mn, AGR (%))
Figure 21 Passenger Cars Market by Region, 2023-2033 (US$ Mn, AGR (%))
Figure 22 Vehicle Type Segment Market Share Forecast by Region, 2023 & 2033 (%)
Figure 23 Commercial Vehicles Market by Region, 2023-2033 (US$ Mn, AGR (%))
Figure 24 Vehicle Type Segment Market Share Forecast by Region, 2023 & 2033 (%)
Figure 25 Other Vehicle Type Market by Region, 2023-2033 (US$ Mn, AGR (%))
Figure 26 Vehicle Type Segment Market Share Forecast by Region, 2023 & 2033 (%)
Figure 27 EV Battery Reuse Market by Application: Market Attractiveness Index
Figure 28 Global EV Battery Reuse Market by Application, 2023-2033 (US$ Mn, AGR (%))
Figure 29 Global EV Battery Reuse Market Share Forecast by Application, 2023-2033 (%)
Figure 30 Energy Storage Market by Region, 2023-2033 (US$ Mn, AGR (%))
Figure 31 Application Segment Market Share Forecast by Region, 2023 & 2033 (%)
Figure 32 Base Stations Market by Region, 2023-2033 (US$ Mn, AGR (%))
Figure 33 Application Segment Market Share Forecast by Region, 2023 & 2033 (%)
Figure 34 Low Speed Vehicles Market by Region, 2023-2033 (US$ Mn, AGR (%))
Figure 35 Application Segment Market Share Forecast by Region, 2023 & 2033 (%)
Figure 36 EV Charging Stations Market by Region, 2023-2033 (US$ Mn, AGR (%))
Figure 37 Application Segment Market Share Forecast by Region, 2023 & 2033 (%)
Figure 38 EV Battery Reuse Market by Source: Market Attractiveness Index
Figure 39 Global EV Battery Reuse Market by Source, 2023-2033 (US$ Mn, AGR (%))
Figure 40 Global EV Battery Reuse Market Share Forecast by Source, 2023-2033 (%)
Figure 41 Battery Electric Vehicles (BEVs) Market by Region, 2023-2033 (US$ Mn, AGR (%))
Figure 42 Source Segment Market Share Forecast by Region, 2023 & 2033 (%)
Figure 43 Hybrid Electric Vehicle (HEV) Market by Region, 2023-2033 (US$ Mn, AGR (%))
Figure 44 Source Segment Market Share Forecast by Region, 2023 & 2033 (%)
Figure 45 Plug-in Hybrid Electric Vehicle (PHEV) Market by Region, 2023-2033 (US$ Mn, AGR (%))
Figure 46 Source Segment Market Share Forecast by Region, 2023 & 2033 (%)
Figure 47 Fuel Cell Electric Vehicle (FCEV) Market by Region, 2023-2033 (US$ Mn, AGR (%))
Figure 48 Source Segment Market Share Forecast by Region, 2023 & 2033 (%)
Figure 49 Other Sources Market by Region, 2023-2033 (US$ Mn, AGR (%))
Figure 50 Source Segment Market Share Forecast by Region, 2023 & 2033 (%)
Figure 51 EV Battery Reuse Market by Indication: Market Attractiveness Index
Figure 52 Global EV Battery Reuse Market by Battery Type, 2023-2033 (US$ Mn, AGR (%))
Figure 53 Global EV Battery Reuse Market Share Forecast by Battery Type, 2023-2033 (%)
Figure 54 Lithium-Iron Phosphate Market by Region, 2023-2033 (US$ Mn, AGR (%))
Figure 55 Battery Type Segment Market Share Forecast by Region, 2023 & 2033 (%)
Figure 56 Lithium-Manganese Oxide Market by Region, 2023-2033 (US$ Mn, AGR (%))
Figure 57 Battery Type Segment Market Share Forecast by Region, 2023 & 2033 (%)
Figure 58 Lithium-Nickel-Cobalt-Aluminium Oxide Market by Region, 2023-2033 (US$ Mn, AGR (%))
Figure 59 Battery Type Segment Market Share Forecast by Region, 2023 & 2033 (%)
Figure 60 Lithium-Nickel-Manganese Cobalt Market by Region, 2023-2033 (US$ Mn, AGR (%))
Figure 61 Battery Type Segment Market Share Forecast by Region, 2023 & 2033 (%)
Figure 62 Lithium-Titanate Oxide Market by Region, 2023-2033 (US$ Mn, AGR (%))
Figure 63 Battery Type Segment Market Share Forecast by Region, 2023 & 2033 (%)
Figure 64 Other Battery Type Market by Region, 2023-2033 (US$ Mn, AGR (%))
Figure 65 Battery Type Segment Market Share Forecast by Region, 2023 & 2033 (%)
Figure 66 Global EV Battery Reuse Market Forecast, 2023-2033 (US$ Mn, AGR (%))
Figure 67 Global EV Battery Reuse Market by Region, 2023-2033 (US$ Mn, AGR (%))
Figure 68 Global EV Battery Reuse Market by Vehicle Type, 2023-2033 (US$ Mn, AGR (%))
Figure 69 Global EV Battery Reuse Market by Application, 2023-2033 (US$ Mn, AGR (%))
Figure 70 Global EV Battery Reuse Market by Source, 2023-2033 (US$ Mn, AGR (%))
Figure 71 Global EV Battery Reuse Market by Battery Type, 2023-2033 (US$ Mn, AGR (%))
Figure 72 North America EV Battery Reuse Market Attractiveness Index
Figure 73 North America EV Battery Reuse Market by Region, 2023, 2028 & 2033 (US$ Million)
Figure 74 North America EV Battery Reuse Market by Value, 2023-2033 (US$ Mn, AGR (%))
Figure 75 North America EV Battery Reuse Market by Country, 2023-2033 (US$ Mn, AGR (%))
Figure 76 North America EV Battery Reuse Market Share Forecast by Country, 2023-2033 (%)
Figure 77 North America EV Battery Reuse Market by Vehicle Type, 2023-2033 (US$ Mn, AGR (%))
Figure 78 North America EV Battery Reuse Market Share Forecast by Vehicle Type, 2023-2033 (%)
Figure 79 North America EV Battery Reuse Market by Application, 2023-2033 (US$ Mn, AGR (%))
Figure 80 North America EV Battery Reuse Market Share Forecast by Application, 2023-2033 (%)
Figure 81 North America EV Battery Reuse Market by Source, 2023-2033 (US$ Mn, AGR (%))
Figure 82 North America EV Battery Reuse Market Share Forecast by Source, 2023-2033 (%)
Figure 83 North America EV Battery Reuse Market by Battery Type, 2023-2033 (US$ Mn, AGR (%))
Figure 84 North America EV Battery Reuse Market Share Forecast by Battery Type, 2023-2033 (%)
Figure 85 US EV Battery Reuse Market by Value, 2023-2033 (US$ Mn, AGR (%))
Figure 86 Canada EV Battery Reuse Market by Value, 2023-2033 (US$ Mn, AGR (%))
Figure 87 Europe EV Battery Reuse Market Attractiveness Index
Figure 88 Europe EV Battery Reuse Market by Region, 2023, 2028 & 2033 (US$ Million)
Figure 89 Europe EV Battery Reuse Market by Value, 2023-2033 (US$ Mn, AGR (%))
Figure 90 Europe EV Battery Reuse Market by Country, 2023-2033 (US$ Mn, AGR (%))
Figure 91 Europe EV Battery Reuse Market Share Forecast by Country, 2023-2033 (%)
Figure 92 Europe EV Battery Reuse Market by Vehicle Type, 2023-2033 (US$ Mn, AGR (%))
Figure 93 Europe EV Battery Reuse Market Share Forecast by Vehicle Type, 2023-2033 (%)
Figure 94 Europe EV Battery Reuse Market by Application, 2023-2033 (US$ Mn, AGR (%))
Figure 95 Europe EV Battery Reuse Market Share Forecast by Application, 2023-2033 (%)
Figure 96 Europe EV Battery Reuse Market by Source, 2023-2033 (US$ Mn, AGR (%))
Figure 97 Europe EV Battery Reuse Market Share Forecast by Source, 2023-2033 (%)
Figure 98 Europe EV Battery Reuse Market by Battery Type, 2023-2033 (US$ Mn, AGR (%))
Figure 99 Europe EV Battery Reuse Market Share Forecast by Battery Type, 2023-2033 (%)
Figure 100 Germany EV Battery Reuse Market by Value, 2023-2033 (US$ Mn, AGR (%))
Figure 101 UK EV Battery Reuse Market by Value, 2023-2033 (US$ Mn, AGR (%))
Figure 102 France EV Battery Reuse Market by Value, 2023-2033 (US$ Mn, AGR (%))
Figure 103 Norway EV Battery Reuse Market by Value, 2023-2033 (US$ Mn, AGR (%))
Figure 104 Netherlands EV Battery Reuse Market by Value, 2023-2033 (US$ Mn, AGR (%))
Figure 105 Rest of Europe EV Battery Reuse Market by Value, 2023-2033 (US$ Mn, AGR (%))
Figure 106 Asia Pacific EV Battery Reuse Market Attractiveness Index
Figure 107 Asia Pacific EV Battery Reuse Market by Region, 2023, 2028 & 2033 (US$ Million)
Figure 108 Asia-Pacific EV Battery Reuse Market by Value, 2023-2033 (US$ Mn, AGR (%))
Figure 109 Asia-Pacific EV Battery Reuse Market by Country, 2023-2033 (US$ Mn, AGR (%))
Figure 110 Asia-Pacific EV Battery Reuse Market Share Forecast by Country, 2023-2033 (%)
Figure 111 Asia-Pacific EV Battery Reuse Market by Vehicle Type, 2023-2033 (US$ Mn, AGR (%))
Figure 112 Asia-Pacific EV Battery Reuse Market Share Forecast by Vehicle Type, 2023-2033 (%)
Figure 113 Asia-Pacific EV Battery Reuse Market by Application, 2023-2033 (US$ Mn, AGR (%))
Figure 114 Asia-Pacific EV Battery Reuse Market Share Forecast by Application, 2023-2033 (%)
Figure 115 Asia-Pacific EV Battery Reuse Market by Source, 2023-2033 (US$ Mn, AGR (%))
Figure 116 Asia-Pacific EV Battery Reuse Market Share Forecast by Source, 2023-2033 (%)
Figure 117 Asia-Pacific EV Battery Reuse Market by Battery Type, 2023-2033 (US$ Mn, AGR (%))
Figure 118 Asia-Pacific EV Battery Reuse Market Share Forecast by Battery Type, 2023-2033 (%)
Figure 119 China EV Battery Reuse Market by Value, 2023-2033 (US$ Mn, AGR (%))
Figure 120 India EV Battery Reuse Market by Value, 2023-2033 (US$ Mn, AGR (%))
Figure 121 Japan EV Battery Reuse Market by Value, 2023-2033 (US$ Mn, AGR (%))
Figure 122 South Korea EV Battery Reuse Market by Value, 2023-2033 (US$ Mn, AGR (%))
Figure 123 Australia EV Battery Reuse Market by Value, 2023-2033 (US$ Mn, AGR (%))
Figure 124 Rest of Asia-Pacific EV Battery Reuse Market by Value, 2023-2033 (US$ Mn, AGR (%))
Figure 125 Middle East & Africa EV Battery Reuse Market Attractiveness Index
Figure 126 Middle East & Africa EV Battery Reuse Market by Region, 2023, 2028 & 2033 (US$ Million)
Figure 127 Middle East & Africa EV Battery Reuse Market by Value, 2023-2033 (US$ Mn, AGR (%))
Figure 128 Middle East & Africa EV Battery Reuse Market by Country, 2023-2033 (US$ Mn, AGR (%))
Figure 129 Middle East & Africa EV Battery Reuse Market by Vehicle Type, 2023-2033 (US$ Mn, AGR (%))
Figure 130 Middle East & Africa EV Battery Reuse Market Share Forecast by Vehicle Type, 2023-2033 (%)
Figure 131 Middle East & Africa EV Battery Reuse Market by Application, 2023-2033 (US$ Mn, AGR (%))
Figure 132 Middle East & Africa EV Battery Reuse Market Share Forecast by Application, 2023-2033 (%)
Figure 133 Middle East & Africa EV Battery Reuse Market by Source, 2023-2033 (US$ Mn, AGR (%))
Figure 134 Middle East & Africa EV Battery Reuse Market Share Forecast by Source, 2023-2033 (%)
Figure 135 Middle East & Africa EV Battery Reuse Market by Battery Type, 2023-2033 (US$ Mn, AGR (%))
Figure 136 Middle East & Africa EV Battery Reuse Market Share Forecast by Battery Type, 2023-2033 (%)
Figure 137 GCC EV Battery Reuse Market by Value, 2023-2033 (US$ Mn, AGR (%))
Figure 138 South Africa EV Battery Reuse Market by Value, 2023-2033 (US$ Mn, AGR (%))
Figure 139 Rest of Middle East & Africa EV Battery Reuse Market by Value, 2023-2033 (US$ Mn, AGR (%))
Figure 140 Latin America EV Battery Reuse Market Attractiveness Index
Figure 141 Latin America EV Battery Reuse Market by Region, 2023, 2028 & 2033 (US$ Million)
Figure 142 Latin America EV Battery Reuse Market by Value, 2023-2033 (US$ Mn, AGR (%))
Figure 143 Latin America EV Battery Reuse Market by Country, 2023-2033 (US$ Mn, AGR (%))
Figure 144 Latin America EV Battery Reuse Market by Vehicle Type, 2023-2033 (US$ Mn, AGR (%))
Figure 145 Latin America EV Battery Reuse Market Share Forecast by Vehicle Type, 2023-2033 (%)
Figure 146 Latin America EV Battery Reuse Market by Application, 2023-2033 (US$ Mn, AGR (%))
Figure 147 Latin America EV Battery Reuse Market Share Forecast by Application, 2023-2033 (%)
Figure 148 Latin America EV Battery Reuse Market by Source, 2023-2033 (US$ Mn, AGR (%))
Figure 149 Latin America EV Battery Reuse Market Share Forecast by Source, 2023-2033 (%)
Figure 150 Latin America EV Battery Reuse Market by Battery Type, 2023-2033 (US$ Mn, AGR (%))
Figure 151 Latin America EV Battery Reuse Market Share Forecast by Battery Type, 2023-2033 (%)
Figure 152 Brazil EV Battery Reuse Market by Value, 2023-2033 (US$ Mn, AGR (%))
Figure 153 Mexico EV Battery Reuse Market by Value, 2023-2033 (US$ Mn, AGR (%))
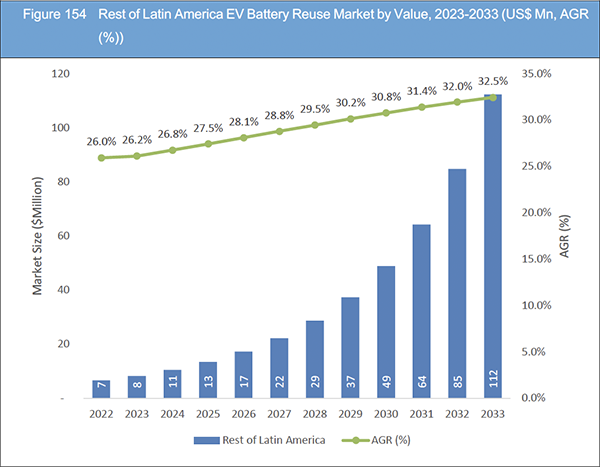
Figure 154 Rest of Latin America EV Battery Reuse Market by Value, 2023-2033 (US$ Mn, AGR (%))
Figure 155 EV Battery Reuse Market: Company Share, 2022
Figure 156 Tesla, Inc.: Net Revenue, 2018-2022 (US$ Million, AGR%)
Figure 157 Tesla, Inc.: R&D, 2018-2022 (US$ Million, AGR%)
Figure 158 Tesla, Inc.: Regional Revenue Share, 2022 (%)
Figure 159 Tesla, Inc.: Business Segment Revenue Share, 2022 (%)
Figure 160 Nissan Motor Co. Ltd.: Net Revenue, 2018-2022 (US$ Million, AGR%)
Figure 161 Nissan Motor Co. Ltd.: Regional Revenue Share, 2022 (%)
Figure 162 Renault Group.: Net Revenue, 2018-2022 (US$ Million, AGR%)
Figure 163 Renault Group.: R&D, 2018-2022 (US$ Million, AGR%)
Figure 164 Renault Group.: Business Segment Revenue Share, 2022 (%)
ページTOPに戻る
Summary
Report Details
The EV Battery Reuse Market Report 2023-2033: This report will prove invaluable to leading firms striving for new revenue pockets if they wish to better understand the industry and its underlying dynamics. It will be useful for companies that would like to expand into different industries or to expand their existing operations in a new region.
Pioneering Circular Solutions for Battery Waste
One of the primary driving factors for the global electric vehicle (EV) battery reuse market is the increasing emphasis on environmental sustainability and resource conservation. As the adoption of EVs grows, concerns about the disposal of spent batteries and the associated environmental impact have heightened. Reusing EV batteries for secondary applications mitigates the need for raw materials extraction, reducing the strain on valuable resources like lithium and cobalt. This approach aligns with the principles of the circular economy, minimizing waste generation and extending the lifecycle of battery components. Governments, regulatory bodies, and industries worldwide recognize the imperative to minimize carbon footprints, making battery reuse a crucial strategy for achieving sustainable energy transitions.
Unlocking Economic Value through Battery Second-Life
Economic viability serves as a significant driving factor in the global EV battery reuse market. Repurposing spent EV batteries for secondary applications, such as stationary energy storage, creates economic value by extending the utility of these components beyond their initial use in vehicles. Businesses and consumers benefit from cost-effective energy storage solutions that leverage repurposed batteries, reducing the need for new battery purchases. Moreover, the reduced reliance on raw material acquisition contributes to cost stability in the EV industry. As the cost of battery manufacturing remains a substantial portion of EV production expenses, battery reuse provides a strategic advantage in achieving profitability while promoting sustainability.
What Questions Should You Ask before Buying a Market Research Report?
• How is the EV battery reuse market evolving?
• What is driving and restraining the EV battery reuse market?
• How will each EV battery reuse submarket segment grow over the forecast period and how much revenue will these submarkets account for in 2033?
• How will the market shares for each EV battery reuse submarket develop from 2023 to 2033?
• What will be the main driver for the overall market from 2023 to 2033?
• Will leading EV battery reuse markets broadly follow the macroeconomic dynamics, or will individual national markets outperform others?
• How will the market shares of the national markets change by 2033 and which geographical region will lead the market in 2033?
• Who are the leading players and what are their prospects over the forecast period?
• What are the EV battery reuse projects for these leading companies?
• How will the industry evolve during the period between 2023 and 2033? What are the implications of EV battery reuse projects taking place now and over the next 10 years?
• Is there a greater need for product commercialisation to further scale the EV battery reuse market?
• Where is the EV battery reuse market heading and how can you ensure you are at the forefront of the market?
• What are the best investment options for new product and service lines?
• What are the key prospects for moving companies into a new growth path and C-suite?
You need to discover how this will impact the EV battery reuse market today, and over the next 10 years:
• Our 358-page report provides 120 tables and 164 charts/graphs exclusively to you.
• The report highlights key lucrative areas in the industry so you can target them – NOW.
• It contains in-depth analysis of global, regional and national sales and growth.
• It highlights for you the key successful trends, changes and revenue projections made by your competitors.
This report tells you TODAY how the EV battery reuse market will develop in the next 10 years, and in line with the variations in COVID-19 economic recession and bounce. This market is more critical now than at any point over the last 10 years.
Forecasts to 2033 and other analyses reveal commercial prospects
• In addition to revenue forecasting to 2033, our new study provides you with recent results, growth rates, and market shares.
• You will find original analyses, with business outlooks and developments.
• Discover qualitative analyses (including market dynamics, drivers, opportunities, restraints and challenges), cost structure, impact of rising EV battery reuse prices and recent developments.
This report includes data analysis and invaluable insight into how COVID-19 will affect the industry and your company. Four COVID-19 recovery patterns and their impact, namely, “V”, “L”, “W” and “U” are discussed in this report.
Segments Covered in the Report
Market Segment by Vehicle Type
• Passenger Cars
• Commercial Vehicles
• Other Vehicle Type
Market Segment by Application
• Energy Storage
• Base Stations
• Low Speed Vehicles
• EV Charging Stations
Market Segment by Source
• Battery Electric Vehicles (BEVs)
• Hybrid Electric Vehicle (HEV)
• Plug-in Hybrid Electric Vehicle (PHEV)
• Fuel Cell Electric Vehicle (FCEV)
• Other Sources
Market Segment by Battery Type
• Lithium-Iron Phosphate
• Lithium-Manganese Oxide
• Lithium-Nickel-Cobalt-Aluminium Oxide
• Lithium-Nickel-Manganese Cobalt
• Lithium-Titanate Oxide
• Other Battery Type
In addition to the revenue predictions for the overall world market and segments, you will also find revenue forecasts for four regional and 20 leading national markets:
North America
• U.S.
• Canada
Europe
• Germany
• Netherlands
• United Kingdom
• France
• Norway
• Rest of Europe
Asia Pacific
• China
• Japan
• India
• Australia
• South Korea
• Rest of Asia Pacific
Latin America
• Brazil
• Mexico
• Rest of Latin America
Middle East & Africa
• GCC
• South Africa
• Rest of Middle East & Africa
The report also includes profiles and for some of the leading companies in the EV Battery Reuse Market, 2023 to 2033, with a focus on this segment of these companies’ operations.
Leading companies and the potential for market growth
• B2U Storage Solutions
• Battery Loop AB
• Connected Energy Ltd
• Evyon
• Moment Energy
• Nissan Motor Co. Ltd
• Octave BV
• Re Purpose Energy, Inc.
• Renault Group
• Spiers New Technologies Inc
• Stena Metall AB
• Tesla, Inc.
Overall world revenue for EV Battery Reuse Market, 2023 to 2033 in terms of value the market will surpass US$1,367 million in 2023, our work calculates. We predict strong revenue growth through to 2033. Our work identifies which organizations hold the greatest potential. Discover their capabilities, progress, and commercial prospects, helping you stay ahead.
How will the EV Battery Reuse Market, 2023 to 2033 report help you?
In summary, our 350+ page report provides you with the following knowledge:
• Revenue forecasts to 2033 for EV Battery Reuse Market, 2023 to 2033 Market, with forecasts for vehicle type, application, source, battery type, each forecast at a global and regional level – discover the industry’s prospects, finding the most lucrative places for investments and revenues.
• Revenue forecasts to 2033 for four regional and 20 key national markets – See forecasts for the EV Battery Reuse Market, 2023 to 2033 market in North America, Europe, Asia-Pacific, Latin America and Middle East & Africa. Also forecasted is the market in the US, Canada, Brazil, Germany, France, UK, Norway, Netherlands, China, India, Japan, and Australia among other prominent economies.
• Prospects for established firms and those seeking to enter the market – including company profiles for 12 of the major companies involved in the EV Battery Reuse Market, 2023 to 2033.
Find quantitative and qualitative analyses with independent predictions. Receive information that only our report contains, staying informed with invaluable business intelligence.
Information found nowhere else
With our new report, you are less likely to fall behind in knowledge or miss out on opportunities. See how our work could benefit your research, analyses, and decisions. Visiongain’s study is for everybody needing commercial analyses for the EV Battery Reuse Market, 2023 to 2033, market-leading companies. You will find data, trends and predictions.
ページTOPに戻る
Table of Contents
Table of Contents
1 Report Overview
1.1 Objectives of the Study
1.2 Introduction to EV Battery Reuse Market
1.3 What This Report Delivers
1.4 Why You Should Read This Report
1.5 Key Questions Answered by This Analytical Report
1.6 Who Is This Report for?
1.7 Research Methodology
1.7.1 Market Definitions
1.7.2 Market Evaluation & Forecasting Methodology
1.7.3 Data Validation
1.7.3.1 Primary Research
1.7.3.2 Secondary Research
1.8 Frequently Asked Questions (FAQs)
1.9 Associated Visiongain Reports
1.10 About Visiongain
2 Executive Summary
2.1 Segment Analysis
2.1.1 Vehicle Type Segment: Market Attractiveness Index
2.1.2 Application Segment: Market Attractiveness Index
2.1.3 Source Segment: Market Attractiveness Index
2.1.4 Battery Type Segment: Market Attractiveness Index
2.2 Regional Analysis
3 Market Overview
3.1 Key Findings
3.2 Market Dynamics
3.2.1 Market Driving Factors
3.2.1.1 Government Initiatives and Incentives
3.2.1.2 The Increasing Adoption of Electric Vehicles (EVs) Is a Significant Driver for the EV Battery Reuse Market
3.2.1.3 Concerns About Climate Change, Pollution, and Resource Depletion Have Intensified the Focus on Sustainable Practices
3.2.2 Market Restraints
3.2.2.1 High Initial Investment Costs
3.2.2.2 Limited Infrastructure for Battery Remanufacturing
3.2.2.3 Complex Regulations and Compliance Challenges
3.2.3 Market Opportunities
3.2.3.1 Advancements in Battery Remanufacturing Technologies
3.2.3.2 Emergence of Circular Economy Models
3.2.3.3 Increasing Adoption of Energy Storage Solutions
3.3 COVID-19 Impact Analysis
3.3.1 V-Shaped Recovery
3.3.2 W-Shaped Recovery
3.3.3 U-Shaped Recovery
3.3.4 L-Shaped Recovery
3.4 Porter’s Five Forces Analysis
3.4.1 Bargaining Power of Suppliers (Moderate to High)
3.4.2 Bargaining Power of Buyers (Moderate)
3.4.3 Competitive Rivalry (High)
3.4.4 Threat from Substitutes (Low)
3.4.5 Threat of New Entrants (Low)
3.5 PEST Analysis
3.5.1 Political Factors
3.5.2 Economic Factors:
3.5.3 Social Factors:
3.5.4 Technological Factors:
4 EV Battery Reuse Market Analysis by Vehicle Type
4.1 Key Findings
4.2 Vehicle Type Segment: Market Attractiveness Index
4.3 EV Battery Reuse Market Size Estimation and Forecast by Vehicle Type
4.4 Passenger Cars Market
4.4.1 Market Size by Region, 2023-2033 (US$ Million)
4.4.2 Market Share by Region, 2023 & 2033 (%)
4.5 Commercial Vehicles Market
4.5.1 Market Size by Region, 2023-2033 (US$ Million)
4.5.2 Market Share by Region, 2023 & 2033 (%)
4.6 Other Vehicle Type Market
4.6.1 Market Size by Region, 2023-2033 (US$ Million)
4.6.2 Market Share by Region, 2023 & 2033 (%)
5 EV Battery Reuse Market Analysis by Application
5.1 Key Findings
5.2 Application Segment: Market Attractiveness Index
5.3 EV Battery Reuse Market Size Estimation and Forecast by Application
5.4 Energy Storage Market
5.4.1 Market Size by Region, 2023-2033 (US$ Million)
5.4.2 Market Share by Region, 2023 & 2033 (%)
5.5 Base Stations Market
5.5.1 Market Size by Region, 2023-2033 (US$ Million)
5.5.2 Market Share by Region, 2023 & 2033 (%)
5.6 Low Speed Vehicles Market
5.6.1 Market Size by Region, 2023-2033 (US$ Million)
5.6.2 Market Share by Region, 2023 & 2033 (%)
5.7 EV Charging Stations
5.7.1 Market Size by Region, 2023-2033 (US$ Million)
5.7.2 Market Share by Region, 2023 & 2033 (%)
6 EV Battery Reuse Market Analysis by Source
6.1 Key Findings
6.2 Source Segment: Market Attractiveness Index
6.3 EV Battery Reuse Market Size Estimation and Forecast by Source
6.4 Battery Electric Vehicles (BEVs) Market
6.4.1 Market Size by Region, 2023-2033 (US$ Million)
6.4.2 Market Share by Region, 2023 & 2033 (%)
6.5 Hybrid Electric Vehicle (HEV) Market
6.5.1 Market Size by Region, 2023-2033 (US$ Million)
6.5.2 Market Share by Region, 2023 & 2033 (%)
6.6 Plug-in Hybrid Electric Vehicle (PHEV) Market
6.6.1 Market Size by Region, 2023-2033 (US$ Million)
6.6.2 Market Share by Region, 2023 & 2033 (%)
6.7 Fuel Cell Electric Vehicle (FCEV) Market
6.7.1 Market Size by Region, 2023-2033 (US$ Million)
6.7.2 Market Share by Region, 2023 & 2033 (%)
6.8 Other Sources Market
6.8.1 Market Size by Region, 2023-2033 (US$ Million)
6.8.2 Market Share by Region, 2023 & 2033 (%)
7 EV Battery Reuse Market Analysis by Battery Type
7.1 Key Findings
7.2 Battery Type Segment: Market Attractiveness Index
7.3 EV Battery Reuse Market Size Estimation and Forecast by Battery Type
7.4 Lithium-Iron Phosphate Market
7.4.1 Market Size by Region, 2023-2033 (US$ Million)
7.4.2 Market Share by Region, 2023 & 2033 (%)
7.5 Lithium-Manganese Oxide Market
7.5.1 Market Size by Region, 2023-2033 (US$ Million)
7.5.2 Market Share by Region, 2023 & 2033 (%)
7.6 Lithium-Nickel-Cobalt-Aluminium Oxide Market
7.6.1 Market Size by Region, 2023-2033 (US$ Million)
7.6.2 Market Share by Region, 2023 & 2033 (%)
7.7 Lithium-Nickel-Manganese Cobalt Market
7.7.1 Market Size by Region, 2023-2033 (US$ Million)
7.7.2 Market Share by Region, 2023 & 2033 (%)
7.8 Lithium-Titanate Oxide Market
7.8.1 Market Size by Region, 2023-2033 (US$ Million)
7.8.2 Market Share by Region, 2023 & 2033 (%)
7.9 Other Battery Type Market
7.9.1 Market Size by Region, 2023-2033 (US$ Million)
7.9.2 Market Share by Region, 2023 & 2033 (%)
8 EV Battery Reuse Market Analysis by Region
8.1 Key Findings
8.2 Regional Market Size Estimation and Forecast
9 North America EV Battery Reuse Market Analysis
9.1 Key Findings
9.2 North America EV Battery Reuse Market Attractiveness Index
9.3 North America EV Battery Reuse Market by Country, 2023, 2028 & 2033 (US$ Million)
9.4 North America EV Battery Reuse Market Size Estimation and Forecast by Value
9.5 North America EV Battery Reuse Market Size Estimation and Forecast by Country
9.6 North America EV Battery Reuse Market Size Estimation and Forecast by Vehicle Type
9.7 North America EV Battery Reuse Market Size Estimation and Forecast by Application
9.8 North America EV Battery Reuse Market Size Estimation and Forecast by Source
9.9 North America EV Battery Reuse Market Size Estimation and Forecast by Battery Type
9.10 US EV Battery Reuse Market
9.11 Canada EV Battery Reuse Market
10 Europe EV Battery Reuse Market Analysis
10.1 Key Findings
10.2 Europe EV Battery Reuse Market Attractiveness Index
10.3 Europe EV Battery Reuse Market by Country, 2023, 2028 & 2033 (US$ Million)
10.4 Europe EV Battery Reuse Market Size Estimation and Forecast by Value
10.5 Europe EV Battery Reuse Market Size Estimation and Forecast by Country
10.6 Europe EV Battery Reuse Market Size Estimation and Forecast by Vehicle Type
10.7 Europe EV Battery Reuse Market Size Estimation and Forecast by Application
10.8 Europe EV Battery Reuse Market Size Estimation and Forecast by Source
10.9 Europe EV Battery Reuse Market Size Estimation and Forecast by Battery Type
10.10 Germany EV Battery Reuse Market
10.11 UK EV Battery Reuse Market
10.12 France EV Battery Reuse Market
10.13 Norway EV Battery Reuse Market
10.14 Netherlands EV Battery Reuse Market
10.15 Rest of Europe EV Battery Reuse Market
11 Asia Pacific EV Battery Reuse Market Analysis
11.1 Key Findings
11.2 Asia Pacific EV Battery Reuse Market Attractiveness Index
11.3 Asia Pacific EV Battery Reuse Market by Country, 2023, 2028 & 2033 (US$ Million)
11.4 Asia Pacific EV Battery Reuse Market Size Estimation and Forecast by Value
11.5 Asia Pacific EV Battery Reuse Market Size Estimation and Forecast by Country
11.6 Asia Pacific EV Battery Reuse Market Size Estimation and Forecast by Vehicle Type
11.7 Asia Pacific EV Battery Reuse Market Size Estimation and Forecast by Application
11.8 Asia Pacific EV Battery Reuse Market Size Estimation and Forecast by Source
11.9 Asia Pacific EV Battery Reuse Market Size Estimation and Forecast by Battery Type
11.10 China EV Battery Reuse Market
11.11 India EV Battery Reuse Market
11.12 Japan EV Battery Reuse Market
11.13 South Korea EV Battery Reuse Market
11.14 Australia EV Battery Reuse Market
11.15 Rest of Asia Pacific EV Battery Reuse Market
12 Middle East & Africa EV Battery Reuse Market Analysis
12.1 Key Findings
12.2 Middle East & Africa EV Battery Reuse Market Attractiveness Index
12.3 Middle East & Africa EV Battery Reuse Market by Country, 2023, 2028 & 2033 (US$ Million)
12.4 Middle East & Africa EV Battery Reuse Market Size Estimation and Forecast by Value
12.5 Middle East & Africa EV Battery Reuse Market Size Estimation and Forecast by Country
12.6 Middle East & Africa EV Battery Reuse Market Size Estimation and Forecast by Vehicle Type
12.7 Middle East & Africa EV Battery Reuse Market Size Estimation and Forecast by Application
12.8 Middle East & Africa EV Battery Reuse Market Size Estimation and Forecast by Source
12.9 Middle East & Africa EV Battery Reuse Market Size Estimation and Forecast by Battery type
12.10 GCC EV Battery Reuse Market
12.11 South Africa EV Battery Reuse Market
12.12 Rest of Middle East & Africa EV Battery Reuse Market
13 Latin America EV Battery Reuse Market Analysis
13.1 Key Findings
13.2 Latin America EV Battery Reuse Market Attractiveness Index
13.3 Latin America EV Battery Reuse Market by Country, 2023, 2028 & 2033 (US$ Million)
13.4 Latin America EV Battery Reuse Market Size Estimation and Forecast by Value
13.5 Latin America EV Battery Reuse Market Size Estimation and Forecast by Country
13.6 Latin America EV Battery Reuse Market Size Estimation and Forecast by Vehicle Type
13.7 Latin America EV Battery Reuse Market Size Estimation and Forecast by Application
13.8 Latin America EV Battery Reuse Market Size Estimation and Forecast by Source
13.9 Latin America EV Battery Reuse Market Size Estimation and Forecast by Battery Type
13.10 Brazil EV Battery Reuse Market
13.11 Mexico EV Battery Reuse Market
13.12 Rest of Latin America EV Battery Reuse Market
14 Company Profiles
14.1 Competitive Landscape, 2022
14.2 Strategic Outlook
14.3 Second Life EV Batteries Ltd
14.3.1 Company Snapshot
14.3.2 Company Overview
14.3.3 Product Benchmarking
14.4 Tesla, Inc.
14.4.1 Company Snapshot
14.4.2 Company Overview
14.4.3 Financial Analysis
14.4.3.1 Net Revenue, 2018-2022
14.4.3.2 R&D, 2018-2022
14.4.3.3 Regional Revenue Share, 2022 (%)
14.4.3.4 Business Segment Revenue Share, 2022 (%)
14.4.4 Product Benchmarking
14.4.5 Strategic Outlook
14.5 Re Purpose Energy, Inc.
14.5.1 Company Snapshot
14.5.2 Company Overview
14.5.3 Product Benchmarking
14.6 Spiers New Technologies Inc
14.6.1 Company Snapshot
14.6.2 Company Overview
14.6.3 Product Benchmarking
14.7 Nissan Motor Co. Ltd
14.7.1 Company Snapshot
14.7.2 Company Overview
14.7.3 Financial Analysis
14.7.3.1 Net Revenue, 2018-2022
14.7.3.2 Regional Revenue Share, 2022 (%)
14.7.4 Product Benchmarking
14.7.5 Strategic Outlook
14.8 Renault Group
14.8.1 Company Snapshot
14.8.2 Company Overview
14.8.3 Financial Analysis
14.8.3.1 Net Revenue, 2018-2022
14.8.3.2 R&D, 2018-2022
14.8.3.3 Business Segment Revenue Share, 2022 (%)
14.8.4 Product Benchmarking
14.8.5 Strategic Outlook
14.9 Stena Metall AB
14.9.1 Company Snapshot
14.9.2 Company Overview
14.9.3 Product Benchmarking
14.9.4 Strategic Outlook
14.10 B2U Storage Solutions
14.10.1 Company Snapshot
14.10.2 Company Overview
14.10.3 Product Benchmarking
14.10.4 Strategic Outlook
14.11 Moment Energy
14.11.1 Company Snapshot
14.11.2 Company Overview
14.11.3 Product Benchmarking
14.11.4 Strategic Outlook
14.12 Connected Energy Ltd
14.12.1 Company Snapshot
14.12.2 Company Overview
14.12.3 Product Benchmarking
14.13 Evyon
14.13.1 Company Snapshot
14.13.2 Company Overview
14.13.3 Product Benchmarking
14.13.4 Strategic Outlook
14.14 Battery Loop AB
14.14.1 Company Snapshot
14.14.2 Company Overview
14.14.3 Product Benchmarking
14.14.4 Strategic Outlook
14.15 Octave BV.
14.15.1 Company Snapshot
14.15.2 Company Overview
14.15.3 Product Benchmarking
15 Conclusion and Recommendations
15.1 Concluding Remarks from Visiongain
15.2 Recommendations for Market Players
ページTOPに戻る
List of Tables/Graphs
List of Tables
Table 1 EV Battery Reuse Market Snapshot, 2023 & 2033 (US$ Million, CAGR %)
Table 2 Global EV Battery Reuse Market Forecast, 2023-2033 (US$ Mn, AGR (%), CAGR (%)) (V-Shaped Recovery Scenario)
Table 3 Global EV Battery Reuse Market by Region, 2023-2033 (US$ Mn, AGR (%), CAGR (%)) (V-Shaped Recovery Scenario)
Table 4 Global EV Battery Reuse Market Forecast, 2023-2033 (US$ Mn, AGR (%), CAGR (%)) (W-Shaped Recovery Scenario)
Table 5 Global EV Battery Reuse Market by Region, 2023-2033 (US$ Mn, AGR (%), CAGR (%)) (W-Shaped Recovery Scenario)
Table 6 Global EV Battery Reuse Market Forecast, 2023-2033 (US$ Mn, AGR (%), CAGR (%)) (U-Shaped Recovery Scenario)
Table 7 Global EV Battery Reuse Market by Region, 2023-2033 (US$ Mn, AGR (%), CAGR (%)) (U-Shaped Recovery Scenario)
Table 8 Global EV Battery Reuse Market Forecast, 2023-2033 (US$ Mn, AGR (%), CAGR (%)) (L-Shaped Recovery Scenario)
Table 9 Global EV Battery Reuse Market by Region, 2023-2033 (US$ Mn, AGR (%), CAGR (%)) (L-Shaped Recovery Scenario)
Table 10 Global EV Battery Reuse Market by Vehicle Type, 2023-2033 (US$ Mn, AGR (%), CAGR (%))
Table 11 Passenger Cars Market by Region, 2023-2033 (US$ Mn, AGR (%), CAGR (%))
Table 12 Commercial Vehicles Market by Region, 2023-2033 (US$ Mn, AGR (%), CAGR (%))
Table 13 Other Vehicle Type Market by Region, 2023-2033 (US$ Mn, AGR (%), CAGR (%))
Table 14 Global EV Battery Reuse Market by Application, 2023-2033 (US$ Mn, AGR (%), CAGR (%))
Table 15 Energy Storage Market by Region, 2023-2033 (US$ Mn, AGR (%), CAGR (%))
Table 16 Base Stations Market by Region, 2023-2033 (US$ Mn, AGR (%), CAGR (%))
Table 17 Low Speed Vehicles Market by Region, 2023-2033 (US$ Mn, AGR (%), CAGR (%))
Table 18 EV Charging Stations Market by Region, 2023-2033 (US$ Mn, AGR (%), CAGR (%))
Table 19 Global EV Battery Reuse Market by Source, 2023-2033 (US$ Mn, AGR (%), CAGR (%))
Table 20 Battery Electric Vehicles (BEVs) Market by Region, 2023-2033 (US$ Mn, AGR (%), CAGR (%))
Table 21 Hybrid Electric Vehicle (HEV) Market by Region, 2023-2033 (US$ Mn, AGR (%), CAGR (%))
Table 22 Plug-in Hybrid Electric Vehicle (PHEV) Market by Region, 2023-2033 (US$ Mn, AGR (%), CAGR (%))
Table 23 Fuel Cell Electric Vehicle (FCEV) Market by Region, 2023-2033 (US$ Mn, AGR (%), CAGR (%))
Table 24 Other Sources Market by Region, 2023-2033 (US$ Mn, AGR (%), CAGR (%))
Table 25 Global EV Battery Reuse Market by Battery Type, 2023-2033 (US$ Mn, AGR (%), CAGR (%))
Table 26 Lithium-Iron Phosphate Market by Region, 2023-2033 (US$ Mn, AGR (%), CAGR (%))
Table 27 Lithium-Manganese Oxide Market by Region, 2023-2033 (US$ Mn, AGR (%), CAGR (%))
Table 28 Lithium-Nickel-Cobalt-Aluminium Oxide Market by Region, 2023-2033 (US$ Mn, AGR (%), CAGR (%))
Table 29 Lithium-Nickel-Manganese Cobalt Market by Region, 2023-2033 (US$ Mn, AGR (%), CAGR (%))
Table 30 Lithium-Titanate Oxide Market by Region, 2023-2033 (US$ Mn, AGR (%), CAGR (%))
Table 31 Other Battery Type Market by Region, 2023-2033 (US$ Mn, AGR (%), CAGR (%))
Table 32 Global EV Battery Reuse Market Forecast, 2023-2033 (US$ Mn, AGR (%), CAGR (%))
Table 33 Global EV Battery Reuse Market by Region, 2023-2033 (US$ Mn, AGR (%), CAGR (%))
Table 34 Global EV Battery Reuse Market by Vehicle Type, 2023-2033 (US$ Mn, AGR (%), CAGR (%))
Table 35 Global EV Battery Reuse Market by Application, 2023-2033 (US$ Mn, AGR (%), CAGR (%))
Table 36 Global EV Battery Reuse Market by Source, 2023-2033 (US$ Mn, AGR (%), CAGR (%))
Table 37 Global EV Battery Reuse Market by Battery Type, 2023-2033 (US$ Mn, AGR (%), CAGR (%))
Table 38 North America EV Battery Reuse Market by Value, 2023-2033 (US$ Mn, AGR (%), CAGR (%))
Table 39 North America EV Battery Reuse Market by Country, 2023-2033 (US$ Mn, AGR (%), CAGR (%))
Table 40 North America EV Battery Reuse Market by Vehicle Type, 2023-2033 (US$ Mn, AGR (%), CAGR (%))
Table 41 North America EV Battery Reuse Market by Application, 2023-2033 (US$ Mn, AGR (%), CAGR (%))
Table 42 North America EV Battery Reuse Market by Source, 2023-2033 (US$ Mn, AGR (%), CAGR (%))
Table 43 North America EV Battery Reuse Market by Battery Type, 2023-2033 (US$ Mn, AGR (%), CAGR (%))
Table 44 US EV Battery Reuse Market by Value, 2023-2033 (US$ Mn, AGR (%), CAGR (%))
Table 45 Canada EV Battery Reuse Market by Value, 2023-2033 (US$ Mn, AGR (%), CAGR (%))
Table 46 Europe EV Battery Reuse Market by Value, 2023-2033 (US$ Mn, AGR (%), CAGR (%))
Table 47 Europe EV Battery Reuse Market by Country, 2023-2033 (US$ Mn, AGR (%), CAGR (%))
Table 48 Europe EV Battery Reuse Market by Vehicle Type, 2023-2033 (US$ Mn, AGR (%), CAGR (%))
Table 49 Europe EV Battery Reuse Market by Application, 2023-2033 (US$ Mn, AGR (%), CAGR (%))
Table 50 Europe EV Battery Reuse Market by Source, 2023-2033 (US$ Mn, AGR (%), CAGR (%))
Table 51 Europe EV Battery Reuse Market by Battery Type, 2023-2033 (US$ Mn, AGR (%), CAGR (%))
Table 52 Germany EV Battery Reuse Market by Value, 2023-2033 (US$ Mn, AGR (%), CAGR (%))
Table 53 UK EV Battery Reuse Market by Value, 2023-2033 (US$ Mn, AGR (%), CAGR (%))
Table 54 France EV Battery Reuse Market by Value, 2023-2033 (US$ Mn, AGR (%), CAGR (%))
Table 55 Norway EV Battery Reuse Market by Value, 2023-2033 (US$ Mn, AGR (%), CAGR (%))
Table 56 Netherlands EV Battery Reuse Market by Value, 2023-2033 (US$ Mn, AGR (%), CAGR (%))
Table 57 Rest of Europe EV Battery Reuse Market by Value, 2023-2033 (US$ Mn, AGR (%), CAGR (%))
Table 58 Asia-Pacific EV Battery Reuse Market by Value, 2023-2033 (US$ Mn, AGR (%), CAGR (%))
Table 59 Asia-Pacific EV Battery Reuse Market by Country, 2023-2033 (US$ Mn, AGR (%), CAGR (%))
Table 60 Asia-Pacific EV Battery Reuse Market by Vehicle Type, 2023-2033 (US$ Mn, AGR (%), CAGR (%))
Table 61 Asia-Pacific EV Battery Reuse Market by Application, 2023-2033 (US$ Mn, AGR (%), CAGR (%))
Table 62 Asia-Pacific EV Battery Reuse Market by Source, 2023-2033 (US$ Mn, AGR (%), CAGR (%))
Table 63 Asia-Pacific EV Battery Reuse Market by Battery Type, 2023-2033 (US$ Mn, AGR (%), CAGR (%))
Table 64 China EV Battery Reuse Market by Value, 2023-2033 (US$ Mn, AGR (%), CAGR (%))
Table 65 India EV Battery Reuse Market by Value, 2023-2033 (US$ Mn, AGR (%), CAGR (%))
Table 66 Japan EV Battery Reuse Market by Value, 2023-2033 (US$ Mn, AGR (%), CAGR (%))
Table 67 South Korea EV Battery Reuse Market by Value, 2023-2033 (US$ Mn, AGR (%), CAGR (%))
Table 68 Australia EV Battery Reuse Market by Value, 2023-2033 (US$ Mn, AGR (%), CAGR (%))
Table 69 Rest of Asia-Pacific EV Battery Reuse Market by Value, 2023-2033 (US$ Mn, AGR (%), CAGR (%))
Table 70 Middle East & Africa EV Battery Reuse Market by Value, 2023-2033 (US$ Mn, AGR (%), CAGR (%))
Table 71 Middle East & Africa EV Battery Reuse Market by Country, 2023-2033 (US$ Mn, AGR (%), CAGR (%))
Table 72 Middle East & Africa EV Battery Reuse Market by Vehicle Type, 2023-2033 (US$ Mn, AGR (%), CAGR (%))
Table 73 Middle East & Africa EV Battery Reuse Market by Application, 2023-2033 (US$ Mn, AGR (%), CAGR (%))
Table 74 Middle East & Africa EV Battery Reuse Market by Source, 2023-2033 (US$ Mn, AGR (%), CAGR (%))
Table 75 Middle East & Africa EV Battery Reuse Market by Battery Type, 2023-2033 (US$ Mn, AGR (%), CAGR (%))
Table 76 GCC EV Battery Reuse Market by Value, 2023-2033 (US$ Mn, AGR (%), CAGR (%))
Table 77 South Africa EV Battery Reuse Market by Value, 2023-2033 (US$ Mn, AGR (%), CAGR (%))
Table 78 Rest of Middle East & Africa EV Battery Reuse Market by Value, 2023-2033 (US$ Mn, AGR (%), CAGR (%))
Table 79 Latin America EV Battery Reuse Market by Value, 2023-2033 (US$ Mn, AGR (%), CAGR (%))
Table 80 Latin America EV Battery Reuse Market by Country, 2023-2033 (US$ Mn, AGR (%), CAGR (%))
Table 81 Latin America EV Battery Reuse Market by Vehicle Type, 2023-2033 (US$ Mn, AGR (%), CAGR (%))
Table 82 Latin America EV Battery Reuse Market by Application, 2023-2033 (US$ Mn, AGR (%), CAGR (%))
Table 83 Latin America EV Battery Reuse Market by Source, 2023-2033 (US$ Mn, AGR (%), CAGR (%))
Table 84 Latin America EV Battery Reuse Market by Battery Type, 2023-2033 (US$ Mn, AGR (%), CAGR (%))
Table 85 Brazil EV Battery Reuse Market by Value, 2023-2033 (US$ Mn, AGR (%), CAGR (%))
Table 86 Mexico EV Battery Reuse Market by Value, 2023-2033 (US$ Mn, AGR (%), CAGR (%))
Table 87 Rest of Latin America EV Battery Reuse Market by Value, 2023-2033 (US$ Mn, AGR (%), CAGR (%))
Table 88 Strategic Outlook
Table 89 Second Life EV Batteries Ltd: Key Details, (CEO, HQ, Revenue, Founded, No. of Employees, Company Type, Website, Business Segment)
Table 90 Second Life EV Batteries Ltd: Product Benchmarking
Table 91 Tesla, Inc: Key Details, (CEO, HQ, Revenue, Founded, No. of Employees, Company Type, Website, Business Segment)
Table 92 Tesla, Inc: Strategic Outlook
Table 93 Re Purpose Energy, Inc: Key Details, (CEO, HQ, Revenue, Founded, No. of Employees, Company Type, Website, Business Segment)
Table 94 Spiers New Technologies Inc.: Key Details, (CEO, HQ, Revenue, Founded, No. of Employees, Company Type, Website, Business Segment)
Table 95 Spiers New Technologies Inc: Product Benchmarking
Table 96 Nissan Motor Co. Ltd: Key Details, (CEO, HQ, Revenue, Founded, No. of Employees, Company Type, Website, Business Segment)
Table 97 Nissan Motor Co. Ltd: Product Benchmarking
Table 98 Nissan Motor Co. Ltd: Strategic Outlook
Table 99 Renault Group: Key Details, (CEO, HQ, Revenue, Founded, No. of Employees, Company Type, Website, Business Segment)
Table 100 Renault Group: Product Benchmarking
Table 101 Renault Group: Strategic Outlook
Table 102 Stena Metall AB: Key Details, (CEO, HQ, Revenue, Founded, No. of Employees, Company Type, Website, Business Segment)
Table 103 Stena Metall AB: Product Benchmarking
Table 104 Stena Metall AB: Strategic Outlook
Table 105 B2U Storage Solutions: Key Details, (CEO, HQ, Revenue, Founded, No. of Employees, Company Type, Website, Business Segment)
Table 106 B2U Storage Solutions: Product Benchmarking
Table 107 B2U Storage Solutions: Strategic Outlook
Table 108 Moment Energy: Key Details, (CEO, HQ, Revenue, Founded, No. of Employees, Company Type, Website, Business Segment)
Table 109 Moment Energy: Product Benchmarking
Table 110 Moment Energy: Strategic Outlook
Table 111 Connected Energy Ltd: Key Details, (CEO, HQ, Revenue, Founded, No. of Employees, Company Type, Website, Business Segment)
Table 112 Connected Energy Ltd: Product Benchmarking
Table 113 Evyon; Key Details, (CEO, HQ, Revenue, Founded, No. of Employees, Company Type, Website, Business Segment)
Table 114 Evyon: Product Benchmarking
Table 115 Evyon: Strategic Outlook
Table 116 Battery Loop AB : Key Details, (CEO, HQ, Revenue, Founded, No. of Employees, Company Type, Website, Business Segment)
Table 117 Battery Loop AB : Product Benchmarking
Table 118 Battery Loop AB : Strategic Outlook
Table 119 Octave BV.: Key Details, (CEO, HQ, Revenue, Founded, No. of Employees, Company Type, Website, Business Segment)
Table 120 Octave BV.: Product Benchmarking
List of Figures
Figure 1 EV Battery Reuse Market Segmentation
Figure 2 EV Battery Reuse Market by Vehicle Type: Market Attractiveness Index
Figure 3 EV Battery Reuse Market by Application: Market Attractiveness Index
Figure 4 EV Battery Reuse Market by Source: Market Attractiveness Index
Figure 5 EV Battery Reuse Market by Indication: Market Attractiveness Index
Figure 6 EV Battery Reuse Market Attractiveness Index by Region
Figure 7 EV Battery Reuse Market: Market Dynamics
Figure 8 Global EV Battery Reuse Market Share Forecast by COVID, 2023-2033 (%)
Figure 9 Global EV Battery Reuse Market Forecast, 2023-2033 (US$ Mn, AGR (%)) (V-Shaped Recovery Scenario)
Figure 10 Global EV Battery Reuse Market by Region, 2023-2033 (US$ Mn, AGR (%)) (V-Shaped Recovery Scenario)
Figure 11 Global EV Battery Reuse Market Forecast, 2023-2033 (US$ Mn, AGR (%)) (W-Shaped Recovery Scenario)
Figure 12 Global EV Battery Reuse Market by Region, 2023-2033 (US$ Mn, AGR (%)) (W-Shaped Recovery Scenario)
Figure 13 Global EV Battery Reuse Market Forecast, 2023-2033 (US$ Mn, AGR (%)) (U-Shaped Recovery Scenario)
Figure 14 Global EV Battery Reuse Market by Region, 2023-2033 (US$ Mn, AGR (%)) (U-Shaped Recovery Scenario)
Figure 15 Global EV Battery Reuse Market Forecast, 2023-2033 (US$ Mn, AGR (%)) (L-Shaped Recovery Scenario)
Figure 16 Global EV Battery Reuse Market by Region, 2023-2033 (US$ Mn, AGR (%)) (L-Shaped Recovery Scenario)
Figure 17 EV Battery Reuse Market: Porter’s Five Forces Analysis
Figure 18 EV Battery Reuse Market: PEST Analysis
Figure 19 EV Battery Reuse Market by Vehicle Type: Market Attractiveness Index
Figure 20 Global EV Battery Reuse Market by Vehicle Type, 2023-2033 (US$ Mn, AGR (%))
Figure 21 Passenger Cars Market by Region, 2023-2033 (US$ Mn, AGR (%))
Figure 22 Vehicle Type Segment Market Share Forecast by Region, 2023 & 2033 (%)
Figure 23 Commercial Vehicles Market by Region, 2023-2033 (US$ Mn, AGR (%))
Figure 24 Vehicle Type Segment Market Share Forecast by Region, 2023 & 2033 (%)
Figure 25 Other Vehicle Type Market by Region, 2023-2033 (US$ Mn, AGR (%))
Figure 26 Vehicle Type Segment Market Share Forecast by Region, 2023 & 2033 (%)
Figure 27 EV Battery Reuse Market by Application: Market Attractiveness Index
Figure 28 Global EV Battery Reuse Market by Application, 2023-2033 (US$ Mn, AGR (%))
Figure 29 Global EV Battery Reuse Market Share Forecast by Application, 2023-2033 (%)
Figure 30 Energy Storage Market by Region, 2023-2033 (US$ Mn, AGR (%))
Figure 31 Application Segment Market Share Forecast by Region, 2023 & 2033 (%)
Figure 32 Base Stations Market by Region, 2023-2033 (US$ Mn, AGR (%))
Figure 33 Application Segment Market Share Forecast by Region, 2023 & 2033 (%)
Figure 34 Low Speed Vehicles Market by Region, 2023-2033 (US$ Mn, AGR (%))
Figure 35 Application Segment Market Share Forecast by Region, 2023 & 2033 (%)
Figure 36 EV Charging Stations Market by Region, 2023-2033 (US$ Mn, AGR (%))
Figure 37 Application Segment Market Share Forecast by Region, 2023 & 2033 (%)
Figure 38 EV Battery Reuse Market by Source: Market Attractiveness Index
Figure 39 Global EV Battery Reuse Market by Source, 2023-2033 (US$ Mn, AGR (%))
Figure 40 Global EV Battery Reuse Market Share Forecast by Source, 2023-2033 (%)
Figure 41 Battery Electric Vehicles (BEVs) Market by Region, 2023-2033 (US$ Mn, AGR (%))
Figure 42 Source Segment Market Share Forecast by Region, 2023 & 2033 (%)
Figure 43 Hybrid Electric Vehicle (HEV) Market by Region, 2023-2033 (US$ Mn, AGR (%))
Figure 44 Source Segment Market Share Forecast by Region, 2023 & 2033 (%)
Figure 45 Plug-in Hybrid Electric Vehicle (PHEV) Market by Region, 2023-2033 (US$ Mn, AGR (%))
Figure 46 Source Segment Market Share Forecast by Region, 2023 & 2033 (%)
Figure 47 Fuel Cell Electric Vehicle (FCEV) Market by Region, 2023-2033 (US$ Mn, AGR (%))
Figure 48 Source Segment Market Share Forecast by Region, 2023 & 2033 (%)
Figure 49 Other Sources Market by Region, 2023-2033 (US$ Mn, AGR (%))
Figure 50 Source Segment Market Share Forecast by Region, 2023 & 2033 (%)
Figure 51 EV Battery Reuse Market by Indication: Market Attractiveness Index
Figure 52 Global EV Battery Reuse Market by Battery Type, 2023-2033 (US$ Mn, AGR (%))
Figure 53 Global EV Battery Reuse Market Share Forecast by Battery Type, 2023-2033 (%)
Figure 54 Lithium-Iron Phosphate Market by Region, 2023-2033 (US$ Mn, AGR (%))
Figure 55 Battery Type Segment Market Share Forecast by Region, 2023 & 2033 (%)
Figure 56 Lithium-Manganese Oxide Market by Region, 2023-2033 (US$ Mn, AGR (%))
Figure 57 Battery Type Segment Market Share Forecast by Region, 2023 & 2033 (%)
Figure 58 Lithium-Nickel-Cobalt-Aluminium Oxide Market by Region, 2023-2033 (US$ Mn, AGR (%))
Figure 59 Battery Type Segment Market Share Forecast by Region, 2023 & 2033 (%)
Figure 60 Lithium-Nickel-Manganese Cobalt Market by Region, 2023-2033 (US$ Mn, AGR (%))
Figure 61 Battery Type Segment Market Share Forecast by Region, 2023 & 2033 (%)
Figure 62 Lithium-Titanate Oxide Market by Region, 2023-2033 (US$ Mn, AGR (%))
Figure 63 Battery Type Segment Market Share Forecast by Region, 2023 & 2033 (%)
Figure 64 Other Battery Type Market by Region, 2023-2033 (US$ Mn, AGR (%))
Figure 65 Battery Type Segment Market Share Forecast by Region, 2023 & 2033 (%)
Figure 66 Global EV Battery Reuse Market Forecast, 2023-2033 (US$ Mn, AGR (%))
Figure 67 Global EV Battery Reuse Market by Region, 2023-2033 (US$ Mn, AGR (%))
Figure 68 Global EV Battery Reuse Market by Vehicle Type, 2023-2033 (US$ Mn, AGR (%))
Figure 69 Global EV Battery Reuse Market by Application, 2023-2033 (US$ Mn, AGR (%))
Figure 70 Global EV Battery Reuse Market by Source, 2023-2033 (US$ Mn, AGR (%))
Figure 71 Global EV Battery Reuse Market by Battery Type, 2023-2033 (US$ Mn, AGR (%))
Figure 72 North America EV Battery Reuse Market Attractiveness Index
Figure 73 North America EV Battery Reuse Market by Region, 2023, 2028 & 2033 (US$ Million)
Figure 74 North America EV Battery Reuse Market by Value, 2023-2033 (US$ Mn, AGR (%))
Figure 75 North America EV Battery Reuse Market by Country, 2023-2033 (US$ Mn, AGR (%))
Figure 76 North America EV Battery Reuse Market Share Forecast by Country, 2023-2033 (%)
Figure 77 North America EV Battery Reuse Market by Vehicle Type, 2023-2033 (US$ Mn, AGR (%))
Figure 78 North America EV Battery Reuse Market Share Forecast by Vehicle Type, 2023-2033 (%)
Figure 79 North America EV Battery Reuse Market by Application, 2023-2033 (US$ Mn, AGR (%))
Figure 80 North America EV Battery Reuse Market Share Forecast by Application, 2023-2033 (%)
Figure 81 North America EV Battery Reuse Market by Source, 2023-2033 (US$ Mn, AGR (%))
Figure 82 North America EV Battery Reuse Market Share Forecast by Source, 2023-2033 (%)
Figure 83 North America EV Battery Reuse Market by Battery Type, 2023-2033 (US$ Mn, AGR (%))
Figure 84 North America EV Battery Reuse Market Share Forecast by Battery Type, 2023-2033 (%)
Figure 85 US EV Battery Reuse Market by Value, 2023-2033 (US$ Mn, AGR (%))
Figure 86 Canada EV Battery Reuse Market by Value, 2023-2033 (US$ Mn, AGR (%))
Figure 87 Europe EV Battery Reuse Market Attractiveness Index
Figure 88 Europe EV Battery Reuse Market by Region, 2023, 2028 & 2033 (US$ Million)
Figure 89 Europe EV Battery Reuse Market by Value, 2023-2033 (US$ Mn, AGR (%))
Figure 90 Europe EV Battery Reuse Market by Country, 2023-2033 (US$ Mn, AGR (%))
Figure 91 Europe EV Battery Reuse Market Share Forecast by Country, 2023-2033 (%)
Figure 92 Europe EV Battery Reuse Market by Vehicle Type, 2023-2033 (US$ Mn, AGR (%))
Figure 93 Europe EV Battery Reuse Market Share Forecast by Vehicle Type, 2023-2033 (%)
Figure 94 Europe EV Battery Reuse Market by Application, 2023-2033 (US$ Mn, AGR (%))
Figure 95 Europe EV Battery Reuse Market Share Forecast by Application, 2023-2033 (%)
Figure 96 Europe EV Battery Reuse Market by Source, 2023-2033 (US$ Mn, AGR (%))
Figure 97 Europe EV Battery Reuse Market Share Forecast by Source, 2023-2033 (%)
Figure 98 Europe EV Battery Reuse Market by Battery Type, 2023-2033 (US$ Mn, AGR (%))
Figure 99 Europe EV Battery Reuse Market Share Forecast by Battery Type, 2023-2033 (%)
Figure 100 Germany EV Battery Reuse Market by Value, 2023-2033 (US$ Mn, AGR (%))
Figure 101 UK EV Battery Reuse Market by Value, 2023-2033 (US$ Mn, AGR (%))
Figure 102 France EV Battery Reuse Market by Value, 2023-2033 (US$ Mn, AGR (%))
Figure 103 Norway EV Battery Reuse Market by Value, 2023-2033 (US$ Mn, AGR (%))
Figure 104 Netherlands EV Battery Reuse Market by Value, 2023-2033 (US$ Mn, AGR (%))
Figure 105 Rest of Europe EV Battery Reuse Market by Value, 2023-2033 (US$ Mn, AGR (%))
Figure 106 Asia Pacific EV Battery Reuse Market Attractiveness Index
Figure 107 Asia Pacific EV Battery Reuse Market by Region, 2023, 2028 & 2033 (US$ Million)
Figure 108 Asia-Pacific EV Battery Reuse Market by Value, 2023-2033 (US$ Mn, AGR (%))
Figure 109 Asia-Pacific EV Battery Reuse Market by Country, 2023-2033 (US$ Mn, AGR (%))
Figure 110 Asia-Pacific EV Battery Reuse Market Share Forecast by Country, 2023-2033 (%)
Figure 111 Asia-Pacific EV Battery Reuse Market by Vehicle Type, 2023-2033 (US$ Mn, AGR (%))
Figure 112 Asia-Pacific EV Battery Reuse Market Share Forecast by Vehicle Type, 2023-2033 (%)
Figure 113 Asia-Pacific EV Battery Reuse Market by Application, 2023-2033 (US$ Mn, AGR (%))
Figure 114 Asia-Pacific EV Battery Reuse Market Share Forecast by Application, 2023-2033 (%)
Figure 115 Asia-Pacific EV Battery Reuse Market by Source, 2023-2033 (US$ Mn, AGR (%))
Figure 116 Asia-Pacific EV Battery Reuse Market Share Forecast by Source, 2023-2033 (%)
Figure 117 Asia-Pacific EV Battery Reuse Market by Battery Type, 2023-2033 (US$ Mn, AGR (%))
Figure 118 Asia-Pacific EV Battery Reuse Market Share Forecast by Battery Type, 2023-2033 (%)
Figure 119 China EV Battery Reuse Market by Value, 2023-2033 (US$ Mn, AGR (%))
Figure 120 India EV Battery Reuse Market by Value, 2023-2033 (US$ Mn, AGR (%))
Figure 121 Japan EV Battery Reuse Market by Value, 2023-2033 (US$ Mn, AGR (%))
Figure 122 South Korea EV Battery Reuse Market by Value, 2023-2033 (US$ Mn, AGR (%))
Figure 123 Australia EV Battery Reuse Market by Value, 2023-2033 (US$ Mn, AGR (%))
Figure 124 Rest of Asia-Pacific EV Battery Reuse Market by Value, 2023-2033 (US$ Mn, AGR (%))
Figure 125 Middle East & Africa EV Battery Reuse Market Attractiveness Index
Figure 126 Middle East & Africa EV Battery Reuse Market by Region, 2023, 2028 & 2033 (US$ Million)
Figure 127 Middle East & Africa EV Battery Reuse Market by Value, 2023-2033 (US$ Mn, AGR (%))
Figure 128 Middle East & Africa EV Battery Reuse Market by Country, 2023-2033 (US$ Mn, AGR (%))
Figure 129 Middle East & Africa EV Battery Reuse Market by Vehicle Type, 2023-2033 (US$ Mn, AGR (%))
Figure 130 Middle East & Africa EV Battery Reuse Market Share Forecast by Vehicle Type, 2023-2033 (%)
Figure 131 Middle East & Africa EV Battery Reuse Market by Application, 2023-2033 (US$ Mn, AGR (%))
Figure 132 Middle East & Africa EV Battery Reuse Market Share Forecast by Application, 2023-2033 (%)
Figure 133 Middle East & Africa EV Battery Reuse Market by Source, 2023-2033 (US$ Mn, AGR (%))
Figure 134 Middle East & Africa EV Battery Reuse Market Share Forecast by Source, 2023-2033 (%)
Figure 135 Middle East & Africa EV Battery Reuse Market by Battery Type, 2023-2033 (US$ Mn, AGR (%))
Figure 136 Middle East & Africa EV Battery Reuse Market Share Forecast by Battery Type, 2023-2033 (%)
Figure 137 GCC EV Battery Reuse Market by Value, 2023-2033 (US$ Mn, AGR (%))
Figure 138 South Africa EV Battery Reuse Market by Value, 2023-2033 (US$ Mn, AGR (%))
Figure 139 Rest of Middle East & Africa EV Battery Reuse Market by Value, 2023-2033 (US$ Mn, AGR (%))
Figure 140 Latin America EV Battery Reuse Market Attractiveness Index
Figure 141 Latin America EV Battery Reuse Market by Region, 2023, 2028 & 2033 (US$ Million)
Figure 142 Latin America EV Battery Reuse Market by Value, 2023-2033 (US$ Mn, AGR (%))
Figure 143 Latin America EV Battery Reuse Market by Country, 2023-2033 (US$ Mn, AGR (%))
Figure 144 Latin America EV Battery Reuse Market by Vehicle Type, 2023-2033 (US$ Mn, AGR (%))
Figure 145 Latin America EV Battery Reuse Market Share Forecast by Vehicle Type, 2023-2033 (%)
Figure 146 Latin America EV Battery Reuse Market by Application, 2023-2033 (US$ Mn, AGR (%))
Figure 147 Latin America EV Battery Reuse Market Share Forecast by Application, 2023-2033 (%)
Figure 148 Latin America EV Battery Reuse Market by Source, 2023-2033 (US$ Mn, AGR (%))
Figure 149 Latin America EV Battery Reuse Market Share Forecast by Source, 2023-2033 (%)
Figure 150 Latin America EV Battery Reuse Market by Battery Type, 2023-2033 (US$ Mn, AGR (%))
Figure 151 Latin America EV Battery Reuse Market Share Forecast by Battery Type, 2023-2033 (%)
Figure 152 Brazil EV Battery Reuse Market by Value, 2023-2033 (US$ Mn, AGR (%))
Figure 153 Mexico EV Battery Reuse Market by Value, 2023-2033 (US$ Mn, AGR (%))
Figure 154 Rest of Latin America EV Battery Reuse Market by Value, 2023-2033 (US$ Mn, AGR (%))
Figure 155 EV Battery Reuse Market: Company Share, 2022
Figure 156 Tesla, Inc.: Net Revenue, 2018-2022 (US$ Million, AGR%)
Figure 157 Tesla, Inc.: R&D, 2018-2022 (US$ Million, AGR%)
Figure 158 Tesla, Inc.: Regional Revenue Share, 2022 (%)
Figure 159 Tesla, Inc.: Business Segment Revenue Share, 2022 (%)
Figure 160 Nissan Motor Co. Ltd.: Net Revenue, 2018-2022 (US$ Million, AGR%)
Figure 161 Nissan Motor Co. Ltd.: Regional Revenue Share, 2022 (%)
Figure 162 Renault Group.: Net Revenue, 2018-2022 (US$ Million, AGR%)
Figure 163 Renault Group.: R&D, 2018-2022 (US$ Million, AGR%)
Figure 164 Renault Group.: Business Segment Revenue Share, 2022 (%)
ページTOPに戻る
本レポートと同じKEY WORD(ev)の最新刊レポート
よくあるご質問
Visiongain社はどのような調査会社ですか?
英国の調査会社ヴィジョンゲイン社(Visiongain)は、通信とエネルギーのほか、自動車や化学・医薬品、金属など、広範な市場を対象に調査を行っています。自動車市場については、市場全般に関する調査のほ... もっと見る
調査レポートの納品までの日数はどの程度ですか?
在庫のあるものは速納となりますが、平均的には 3-4日と見て下さい。
但し、一部の調査レポートでは、発注を受けた段階で内容更新をして納品をする場合もあります。
発注をする前のお問合せをお願いします。
注文の手続きはどのようになっていますか?
1)お客様からの御問い合わせをいただきます。
2)見積書やサンプルの提示をいたします。
3)お客様指定、もしくは弊社の発注書をメール添付にて発送してください。
4)データリソース社からレポート発行元の調査会社へ納品手配します。
5) 調査会社からお客様へ納品されます。最近は、pdfにてのメール納品が大半です。
お支払方法の方法はどのようになっていますか?
納品と同時にデータリソース社よりお客様へ請求書(必要に応じて納品書も)を発送いたします。
お客様よりデータリソース社へ(通常は円払い)の御振り込みをお願いします。
請求書は、納品日の日付で発行しますので、翌月最終営業日までの当社指定口座への振込みをお願いします。振込み手数料は御社負担にてお願いします。
お客様の御支払い条件が60日以上の場合は御相談ください。
尚、初めてのお取引先や個人の場合、前払いをお願いすることもあります。ご了承のほど、お願いします。
データリソース社はどのような会社ですか?
当社は、世界各国の主要調査会社・レポート出版社と提携し、世界各国の市場調査レポートや技術動向レポートなどを日本国内の企業・公官庁及び教育研究機関に提供しております。
世界各国の「市場・技術・法規制などの」実情を調査・収集される時には、データリソース社にご相談ください。
お客様の御要望にあったデータや情報を抽出する為のレポート紹介や調査のアドバイスも致します。
|
|


