眼科医療機器市場レポート:2023-2033
Ophthalmic Devices Market Report 2023-2033
レポート詳細
眼科医療機器市場レポート 2023-2033: 本レポートは、業界とその基礎となる原動力をよりよく理解することを望むなら、新たな収益ポケットを目指す大手企業にとって貴重なものとなるで... もっと見る
※上記価格は部署ライセンス(Departmental licence)価格です。
その他の価格についてはデータリソースまでお問合せください。
日本語のページは自動翻訳を利用し作成しています。
実際のレポートは英文のみでご納品いたします。

|
サマリー
レポート詳細
眼科医療機器市場レポート 2023-2033: 本レポートは、業界とその基礎となる原動力をよりよく理解することを望むなら、新たな収益ポケットを目指す大手企業にとって貴重なものとなるでしょう。異業種への進出や新規地域での既存事業の拡大を目指す企業にも有用です。
高齢化と技術の進歩が白内障手術件数を世界的に押し上げる
過去10年間、世界的に白内障手術が大幅に増加している。白内障手術件数を押し上げている主な要因は、認知度の向上と保険適用である。さらに、高齢化人口の増加と平均寿命の延びが、先進国だけでなく新興国でも白内障手術の需要を喚起すると予想されている。2022年のCDCによると、40歳以上の米国市民の約17.2%が少なくとも片目に白内障が発見されたと報告されており、これは約2,050万人にのぼるが、そのうち白内障手術を受けて新しいレンズに交換した米国人はわずか610万人であり、白内障手術の巨大な市場可能性を示している。
さらにCDCは、2028年までに約3,000万人が白内障と診断されると予測している。WHO(世界保健機関)の2022年報告書によると、現在、50歳以上の9400万人が白内障手術で矯正可能な視力障害を抱えている。また、我々の調査では、特に先進国において、白内障手術を実施するための技術的に進歩した方法に対する需要が増加傾向にあることを示している。FLACS(フェムトセカンド・レーザー支援白内障手術)やPhaco-aspirationのような、より安全で迅速な結果を得るためにPhaco-emulsification手術に取って代わるような、よりソフトな白内障除去技術の採用と相まって、オフィスベースの白内障手術室への嗜好が高まっている。日本、中国、米国、韓国などの国々で豊かな高齢者人口が増加しているため、高級眼内レンズの需要が補完的に伸びている。
プレミアム白内障手術に対する社会的認知の高まり、プレミアム白内障手術を実施する手術センターの増加、OEMの存在に加え、支援的な償還政策が、プレミアム白内障手術市場における米国の支配を継続させる。しかし、予測期間中、ドイツ、フランス、イタリア、英国、インド、カナダ、中国、ブラジルなどの国々では、こうしたプレミアム手術の普及が進むだろう。
市場調査レポートを購入する前にすべき質問とは?
- 眼科医療機器市場はどのように進化しているのか?
- 何が眼科医療機器市場を牽引し、また抑制しているのか?
- 眼科医療機器の各サブ市場セグメントは予測期間中にどのように成長し、2033年にはどれくらいの売上を占めるようになるのか?
- 2023年から2033年にかけて、眼科医療機器の各サブマーケットの市場シェアはどのように推移するのか?
- 2023年から2033年にかけて、市場全体を牽引する主な要因は何か?
- 眼科医療機器の主要市場はマクロ経済の動きに概ね追随するのか、それとも個々の国市場が他を凌駕するのか?
- 2033年までに各国市場のシェアはどう変化し、2033年に市場をリードするのはどの地域か?
- 主要プレイヤーは誰で、予測期間中の見通しは?
- これらの大手企業の眼科医療機器プロジェクトは?
- 2023年から2033年の間に、業界はどのように進化するのか?また
眼科医療機器プロジェクトは現在、そして今後10年間でどのような意味を持つのでしょうか?
- 眼科医療機器市場をさらに拡大するために、製品の商業化の必要性は高まっていますか?
- 眼科医療機器市場はどこへ向かっているのか、そして市場の最前線に立つにはどうすればいいのか?
- 新製品やサービスラインへの最適な投資方法とは?
- 企業を新たな成長軌道に乗せ、C-suiteに移行させるための重要な展望とは?
このことが現在、そして今後10年間の眼科医療機器市場にどのような影響を与えるかを見極める必要がある:
- 519ページにわたる本レポートでは、166の表と243の図表を掲載しています。
- 本レポートは、業界における主要な有利分野にハイライトを当てているため、今すぐターゲットを絞ることができます。
- 本レポートには、世界、地域、国の売上と成長に関する詳細な分析が含まれています。
- 競合他社が成功した主なトレンド、変化、収益予測をハイライトしています。
本レポートは、眼科医療機器市場が今後10年間でどのように発展していくのか、またCOVID-19の景気後退と好転の変動に合わせてどのように発展していくのかをお伝えします。この市場は過去10年間のどの時点よりも今が重要です。
2033年までの予測やその他の分析から、商業的な展望が明らかになる
- 2033年までの収益予測に加え、直近の業績、成長率、市場シェアもご覧いただけます。
- ビジネスの展望と展開に関する独自の分析をご覧いただけます。
- 定性的分析(市場ダイナミクス、促進要因、機会、阻害要因など)、ポーターのファイブフォース分析、PEST分析、最近の動向をご覧いただけます。
本レポートには、COVID-19が業界と貴社にどのような影響を与えるかについてのデータ分析と貴重な洞察が含まれている。本レポートでは、COVID-19の4つの回収パターンとその影響、すなわち「V」、「L」、「W」、「U」について論じている。
レポート対象セグメント
ビジョンケア機器
- メガネレンズ
- コンタクトレンズ
診断ケア&モニタリング機器
- 鏡面顕微鏡
- 眼底カメラ
- 光干渉断層計
- ペリメーター
- 光学バイオメーター
- スリットランプ
- オートレフラクター
- 眼圧計
- 眼科用超音波画像診断装置
- 検眼鏡
- チャートプロジェクター
- 角膜トポグラフィーシステム
- レンズメーター
- 波面収差計
- その他
手術機器
・ 白内障手術装置
- 眼内レンズ
- 眼内レンズインジェクター
- 眼科医療機器
- フェムトセカンドレーザー白内障システム
- Nd:Yagレーザー
- ファコ乳化装置
・ 屈折矯正手術装置
- フェムトセカンドレーザー
- エキシマレーザー
- フェイキックIOL
- 屈折矯正レンズ交換 メカニカルケラトーム
- その他
・ 網膜硝子体手術器具
- 硝子体手術用プローブ
- 網膜インプラント
- 硝子体手術装置
- 硝子体手術用パック
- 光凝固レーザー
- 照明装置
・ 緑内障手術装置
- レーザー
- トラブ補助器具
- カナル手術用機器
- マイクロステント
- チューブシャント
- 結膜下ステント
・ 眼科用OR顕微鏡
・ その他
エンドユーザー
- 病院
- 診断クリニック
- フランチャイズ眼鏡店
- 眼科研究機関
- 政府機関
- 学術機関
世界市場全体とセグメント別の収益予測に加え、5つの地域と20の主要国市場の収益予測も掲載しています:
北米
- アメリカ
- カナダ
欧州
- ドイツ
- 英国
- フランス
- イタリア
- スペイン
- その他の欧州
アジア太平洋
- 日本
- 中国
- インド
- オーストラリア
- 韓国
- その他のアジア太平洋地域
ラテンアメリカ
- ブラジル
- メキシコ
- その他のラテンアメリカ
MEA
- GCC
- 南アフリカ
- その他のMEA
このレポートには、2023年から2033年までの眼科用機器市場のいくつかの主要企業のプロフィールも含まれており、これらの企業の事業のこのセグメントに焦点を当てています。
主要企業と市場成長の可能性
・ Alcon
・ CooperVision
・ Carl Zeiss Meditec
・ EssilorLuxottica
・ Glaukos Corporation
・ HAAG-STREIT GROUP
・ HEINE Optotechnik GmbH & Co. KG
・ Johnson & Johnson Vision
・ LENSAR, Inc.
・ Lumenis Be Ltd.
・ NIDEK CO., LTD.
・ Ophtec BV
・ Sight Sciences
・ Sonomed Escalon
・ STAAR SURGICAL
・ Visionix
・ Ziemer Ophthalmic Systems AG
2023年から2033年までの眼科医療機器市場全体の世界売上高(金額ベース)は、2023年に644億4,200万米ドルを突破する。2033年まで力強い収益成長を予測。当調査では、最も大きな可能性を秘めた企業を特定しています。彼らの能力、進歩、商業的展望を発見し、一歩先を行くお手伝いをします。
眼科医療機器市場、2023-2033年レポートはどのようにお役に立つでしょうか?
要約すると、510ページを超えるこのレポートは、以下の知識を提供する:
- 眼科医療機器市場の2023年から2033年までの収益予測 ビジョンケア機器、診断ケア&モニタリング機器、手術機器、エンドユーザー、各予測を世界および地域レベルで掲載 - 業界の展望を発見し、投資と収益に最も有利な場所を見つけます。
- 5つの地域と20の主要国市場の2033年までの収益予測 - 北米、欧州、アジア太平洋、中南米、MEAの眼科医療機器市場2023年から2033年までの市場予測をご覧ください。また、米国、カナダ、メキシコ、ブラジル、ドイツ、フランス、英国、イタリア、中国、インド、日本、オーストラリアなどの主要国の市場も予測しています。
- 既存企業および市場参入を目指す企業の展望 - 眼科医療機器市場に関わる主要企業17社の企業プロファイルを含む、2023年から2033年までの市場展望。
独自の予測による定量的・定性的分析をご覧ください。私たちのレポートだけに含まれる情報を入手し、貴重なビジネスインテリジェンスで情報を得ることができます。
他にはない情報
私たちの新しいレポートがあれば、知識に遅れをとったり、チャンスを逃したりする可能性が低くなります。弊社の調査レポートが貴社の調査、分析、意思決定にどのように役立つかをご覧ください。Visiongainのこの調査レポートは、眼科医療機器市場(2023年~2033年)の商業分析を必要とするすべての人、市場のリーディングカンパニーを対象としています。データ、トレンド、予測をご覧いただけます。
ページTOPに戻る
目次
目次
1 レポート概要
1.1 研究の目的
1.2 眼科医療機器市場の紹介
1.3 本レポートの内容
1.4 本レポートを読むべき理由
1.5 本分析レポートが回答する主な質問
1.6 本レポートの対象者
1.7 方法論
1.7.1 市場の定義
1.7.2 市場評価・予測手法
1.7.3 データの検証
1.7.3.1 一次調査
1.7.3.2 セカンダリーリサーチ
1.8 よくある質問(FAQ)
1.9 Visiongainの関連レポート
1.10 Visiongainについて
2 エグゼクティブ・サマリー
3 市場概要
3.1 主要な調査結果
3.2 市場ダイナミクス
3.2.1 市場促進要因
3.2.1.1 高齢化人口の増加と技術の進歩による世界的な白内障手術件数の増加
3.2.1.2 加速する子供の近視と高い近視率
3.2.1.3 技術革新が市場成長を後押ししている
3.2.1.4 アイケアサービスを統合するプライベート・エクイティ・モデル
3.2.1.5 遠隔医療と人工知能が眼科診断に革命をもたらす
3.2.1 市場抑制要因
3.2.1.1 眼科医療機器の高コストが市場成長を抑制する
3.2.1.2 最近のメディケア手術報酬の変更は一部の患者にとって十分でない可能性がある
3.2.1.3 大辞職の波と熟練労働者の恒常的不足
3.2.2 市場機会
3.2.2.1 ドライアイ治療の市場機会を捉える大手・中堅眼科医療機器メーカー
3.2.2.2 新興市場の未開発の可能性
3.2.2.3 疾患診断と治療のためのコンタクトレンズベースのセンサーは大きな機会をもたらす
3.3 COVID-19インパクト分析
3.4 ポーターのファイブフォース分析
3.4.1 サプライヤーの交渉力
3.4.2 買い手の交渉力
3.4.3 競争相手のライバル関係
3.4.4 代替品による脅威
3.4.5 新規参入企業の脅威
3.5 PEST分析
4 眼科ビジョンケア機器市場分析
4.1 主要調査結果
4.2 眼科ビジョンケアセグメント市場魅力度指数
4.3 眼科ビジョンケア機器市場シェア分析
4.4 眼科ビジョンケア機器のタイプ別市場分析
4.4.1 メガネレンズ
4.4.1.1 2023~2033年の地域別市場規模(US$ Million)
4.4.1.2 地域別市場シェア、2023年・2033年 (%)
4.4.2 コンタクトレンズ
4.4.2.1 2023~2033年の地域別市場規模(US$ Million)
4.4.2.2 地域別市場シェア、2023年・2033年 (%)
4.4.2.3 タイプ別市場規模、2023~2033年(US$ Million)
4.4.2.3.1 球面コンタクトレンズ
4.4.2.3.2 トーリックコンタクトレンズ
4.4.2.3.3 多焦点コンタクトレンズ
5 眼科診断ケア&モニタリング機器市場分析
5.1 主要調査結果
5.2 眼科診断ケア&モニタリング機器セグメント 市場魅力度指数
5.3 眼科診断ケア&モニタリング機器市場市場シェア分析
5.4 地域別市場規模の推定と予測
5.5 タイプ別眼科診断ケア&モニタリング機器セグメント
5.5.1 鏡面顕微鏡
5.5.1.1 2023~2033年の地域別市場規模(US$ Million)
5.5.1.2 地域別市場シェア、2023年・2033年 (%)
5.5.2 眼底カメラ
5.5.2.1 2023~2033年の地域別市場規模(US$ Million)
5.5.2.2 地域別市場シェア、2023年・2033年 (%)
5.5.3 光コヒーレンストモグラフィスキャナー市場(OCT)
5.5.3.1 2023〜2033年の地域別市場規模(百万米ドル)
5.5.3.2 地域別市場シェア、2023年・2033年 (%)
5.5.4 ペリメーター
5.5.4.1 2023~2033年の地域別市場規模(US$ Million)
5.5.4.2 地域別市場シェア、2023年・2033年 (%)
5.5.5 光学バイオメーター
5.5.5.1 2023~2033年の地域別市場規模(US$ Million)
5.5.5.2 地域別市場シェア、2023年・2033年 (%)
5.5.6 スリットランプ
5.5.6.1 2023~2033年の地域別市場規模(US$ Million)
5.5.6.2 地域別市場シェア、2023年・2033年 (%)
5.5.7 オートリフラクター
5.5.7.1 2023~2033年の地域別市場規模(US$ Million)
5.5.7.2 地域別市場シェア、2023年・2033年 (%)
5.5.8 トノメーター
5.5.8.1 2023年~2033年の地域別市場規模(US$ Million)
5.5.8.2 地域別市場シェア、2023年・2033年 (%)
5.5.9 眼科用超音波イメージングシステム
5.5.9.1 2023~2033年の地域別市場規模(US$ Million)
5.5.9.2 地域別市場シェア、2023年・2033年 (%)
5.5.10 検眼鏡
5.5.10.1 2023~2033年の地域別市場規模(US$ Million)
5.5.10.2 地域別市場シェア、2023年・2033年 (%)
5.5.11 チャートプロジェクター
5.5.11.1 2023~2033年の地域別市場規模(US$ Million)
5.5.11.2 地域別市場シェア、2023年・2033年 (%)
5.5.12 角膜トポグラフィーシステム
5.5.12.1 2023~2033年の地域別市場規模(US$ Million)
5.5.12.2 地域別市場シェア、2023年・2033年 (%)
5.5.13 レンズメーター
5.5.13.1 2023~2033年の地域別市場規模(US$ Million)
5.5.13.2 地域別市場シェア、2023年・2033年 (%)
5.5.14 波面収差計
5.5.14.1 2023~2033年の地域別市場規模(US$ Million)
5.5.14.2 地域別市場シェア、2023年・2033年 (%)
5.5.15 その他
5.5.15.1 2023〜2033年の地域別市場規模(US$ Million)
5.5.15.2 地域別市場シェア、2023年・2033年 (%)
6 眼科手術機器市場の分析
6.1 主要な調査結果
6.2 眼科手術機器セグメント市場魅力度指数
6.3 眼科手術機器市場シェア分析
6.4 2023-2033年の地域別市場規模(US$ Million)
6.5 眼科手術用デバイスのタイプ別市場規模の推定と予測
6.5.1 白内障手術用
6.5.1.1 地域別市場規模、2023-2033年(US$ Million)
6.5.1.2 地域別市場シェア、2023年・2033年 (%)
6.5.1.3 タイプ別市場、2023年~2033年(US$ Million)
6.5.1.3.1 眼内レンズ市場(眼内レンズ)
6.5.1.3.2 眼内注射器市場
6.5.1.3.3 粘弾性デバイス(OVDs)
6.5.1.3.4 フェムトセカンドレーザー白内障システム(FLACS)
6.5.1.3.5 ネオジム:ヤグレーザー
6.5.1.3.6 乳化吸引装置
6.5.2 網膜硝子体手術装置
6.5.2.1 2023〜2033年の地域別市場規模(US$ Million)
6.5.2.2 地域別市場シェア、2023年・2033年 (%)
6.5.2.3 タイプ別市場、2023〜2033年(US$ Million)
6.5.2.3.1 硝子体手術用プローブ
6.5.2.3.2 網膜インプラント(眼内レンズ)
6.5.2.3.3 硝子体手術装置
6.5.2.3.4 硝子体手術用パック
6.5.2.3.5 光凝固レーザー
6.5.2.3.6 照明装置
6.5.3 屈折矯正手術
6.5.3.1 2023年~2033年の地域別市場規模(US$ Million)
6.5.3.2 地域別市場シェア、2023年・2033年 (%)
6.5.3.3 タイプ別市場規模、2023年~2033年(US$ Million)
6.5.3.3.1 フェムト秒レーザー
6.5.3.3.2 エキシマレーザー
6.5.3.3.3 フェイキックIOL
6.5.3.3.4 屈折矯正レンズ交換(RLE)
6.5.3.3.5 メカニカルケラトーム
6.5.3.3.6 その他
6.5.4 緑内障手術機器
6.5.4.1 2023〜2033年の地域別市場規模(US$ Million)
6.5.4.2 地域別市場シェア、2023年・2033年(%)
6.5.4.3 タイプ別市場規模、2023〜2033年(US$ Million)
6.5.4.3.1 緑内障レーザー
6.5.4.3.2 トラブ補助器具
6.5.4.3.3 カナルサージェリーデバイス
6.5.4.3.4 結膜下シャント
6.5.4.3.5 チューブシャント
6.5.4.3.6 マイクロステント(MIGS)
6.5.5 眼科手術室(OR)用顕微鏡
6.5.5.1 2023〜2033年の地域別市場規模(US$ Million)
6.5.5.2 地域別市場シェア、2023年・2033年 (%)
6.5.6 その他の手術器具
6.5.6.1 2023~2033年の地域別市場規模(US$ Million)
6.5.6.2 地域別市場シェア、2023年・2033年 (%)
7 眼科医療機器市場:エンドユーザー別
7.1 主要調査結果
7.2 眼科機器セグメント、エンドユーザー別 市場魅力度指数
7.3 エンドユーザー別眼科手術機器市場規模推定と予測
7.4 地域別市場規模の推計と予測
7.5 病院
7.5.1 2023〜2033年の地域別市場規模(US$ Million)
7.5.2 地域別市場シェア、2023年・2033年(%)
7.6 診断クリニック
7.6.1 2023〜2033年の地域別市場規模(US$ Million)
7.6.2 地域別市場シェア、2023年・2033年(%)
7.7 フランチャイズ眼鏡店
7.7.1 地域別市場シェア、2023年・2033年 (%)
7.7.2 2023~2033年の地域別市場規模(US$ Million)
7.8 眼科研究機関
7.8.1 2023~2033年の地域別市場規模(US$ Million)
7.8.2 地域別市場シェア、2023年・2033年 (%)
7.9 政府機関
7.9.1 2023~2033年の地域別市場規模(US$ Million)
7.9.2 地域別市場シェア、2023年・2033年 (%)
7.10 学術機関
7.10.1 2023年~2033年の地域別市場規模(US$ Million)
7.10.2 地域別市場シェア、2023年・2033年 (%)
8 眼科医療機器市場分析:地域別
8.1 主要な調査結果
8.2 地域別市場規模の推定と予測
9 北米の眼科医療機器市場分析
9.1 主要な調査結果
9.2 北米の眼科医療機器市場魅力度指数
9.3 北米の眼科医療機器市場:国別、2023年、2028年、2033年(US$ Million)
9.4 北米の眼科医療機器市場規模推定と予測:国別
9.5 北米の眼科医療機器市場規模推定と予測:タイプ別
9.6 北米のビジョンケア機器市場規模推定と予測:タイプ別
9.7 北米の診断ケア&モニタリング機器市場規模推定と予測:タイプ別
9.8 北米の外科用機器市場規模推定と予測:タイプ別
9.9 北米の眼科医療機器市場規模推定と予測:エンドユーザー別
9.10 アメリカの眼科医療機器市場分析
9.11 カナダの眼科医療機器市場分析
10 欧州の眼科医療機器市場分析
10.1 主要な調査結果
10.2 欧州の眼科医療機器市場魅力度指数
10.3 欧州の眼科医療機器市場:国別、2023年、2028年、2033年 (US$ Million)
10.4 欧州の眼科医療機器市場規模推定と予測:国別
10.5 欧州の眼科医療機器市場規模推定と予測:タイプ別
10.6 欧州のビジョンケア機器市場規模推定と予測:タイプ別
10.7 欧州の診断ケア&モニタリング機器市場規模推定と予測:タイプ別
10.8 欧州の外科用機器市場規模推定と予測:タイプ別
10.9 欧州の眼科医療機器市場規模推定と市場予測:エンドユーザー別
10.10 ドイツの眼科医療機器市場分析
10.11 イギリスの眼科医療機器市場分析
10.12 フランスの眼科医療機器市場分析
10.13 イタリアお眼科医療機器市場分析
10.14 スペインの眼科医療機器市場分析
10.15 その他の欧州(ROE)の眼科医療機器市場分析
11 アジアの眼科医療機器市場分析
11.1 主要な調査結果
11.2 アジアの眼科医療機器市場魅力度指数
11.3 アジアの眼科医療機器市場:国別、2023年、2028年、2033年 (US$ Million)
11.4 アジアの眼科医療機器市場規模推定と予測:国別
11.5 アジアの眼科医療機器市場規模推定と予測:タイプ別
11.6 アジアのビジョンケア機器市場規模推定 と予測:タイプ別
11.7 アジアの診断ケア・モニタリング機器市場規模推定と予測:タイプ別
11.8 アジアの手術用機器市場規模推定と予測:タイプ別
11.9 アジアの眼科医療機器市場規模推定と市場予測:エンドユーザー別
11.10 日本の眼科医療機器市場分析
11.11 中国の眼科医療機器市場分析
11.12 インドの眼科医療機器市場分析
11.13 韓国の眼科医療機器市場分析
11.14 オーストラリアの眼科医療機器市場分析
11.15 その他のアジア太平洋地域の眼科医療機器市場分析
12 ラテンアメリカの眼科医療機器市場分析
12.1 主要な調査結果
12.2 ラテンアメリカの眼科医療機器市場魅力度指数
12.3 ラテンアメリカの眼科医療機器市場:国別、2023年、2028年、2033年 (US$ Million)
12.4 ラテンアメリカの眼科医療機器市場規模推定と予測:国別
12.5 ラテンアメリカの眼科医療機器市場規模推定と予測:タイプ別
12.6 ラテンアメリカのビジョンケア機器市場規模推定と予測:タイプ別
12.7 ラテンアメリカの診断ケア・モニタリング機器市場規模推定と予測:タイプ別
12.8 ラテンアメリカの手術用機器市場規模推定と予測:タイプ別
12.9 ラテンアメリカの眼科医療機器市場規模推定と市場予測:エンドユーザー別
12.10 ブラジルの眼科医療機器市場分析
12.11 メキシコの眼科医療機器市場分析
12.12 その他のラテンアメリカの眼科医療機器市場分析
13 中東・アフリカ眼科医療機器市場分析
13.1 主要な調査結果
13.2 中東・アフリカ眼科医療機器市場魅力度指数
13.3 中東・アフリカの眼科医療機器市場:国別、2023年、2028年、2033年 (US$ Million)
13.4 中東・アフリカの眼科医療機器市場規模推定と予測:国別
13.5 中東・アフリカの眼科医療機器市場規模推定と予測:タイプ別
13.6 中東・アフリカのビジョンケア機器市場規模推定と予測:タイプ別
13.7 中東・アフリカの診断ケア・モニタリング機器市場規模推定と予測:タイプ別
13.8 中東・アフリカの外科用機器市場規模推定と予測:タイプ別
13.9 中東・アフリカの眼科医療機器市場規模推定と予測:エンドユーザー別
13.10 GCCの眼科医療機器市場分析
13.11 南アフリカの眼科医療機器市場分析
13.12 その他のMEA眼科医療機器市場分析
14 主要企業のプロファイル
14.1 競争環境、2022年
14.2 戦略的展望
14.3 Alcon
14.3.1 会社概要
14.3.2 会社概要
14.3.3 財務分析
14.3.3.1 純収入、2017-2022年
14.3.3.2 R&D、2017-2022年
14.3.3.3 地域市場シェア、2022年
14.3.3.4 セグメント別売上高、2017-2022年
14.3.4 製品ベンチマーク
14.3.5 戦略的展望
14.4 Glaukos Corporation
14.4.1 会社概要
14.4.2 会社概要
14.4.3 財務分析
14.4.3.1 純収入、2017-2022年
14.4.3.2 R&D、2017-2022年
14.4.3.3 地域市場シェア、2022年
14.4.3.4 セグメント別売上高、2017-2022年
14.4.4 製品ベンチマーク
14.4.5 戦略的展望
14.5 STAAR SURGICAL
14.5.1 会社概要
14.5.2 会社概要
14.5.3 財務分析
14.5.3.1 純収入、2017-2022年
14.5.3.2 R&D、2017-2022年
14.5.3.3 地域市場シェア、2022年
14.5.4 製品ベンチマーク
14.5.5 戦略的展望
14.6 Ziemer Ophthalmic Systems AG
14.6.1 会社概要
14.6.2 会社概要
14.6.3 製品ベンチマーク
14.6.4 戦略的展望
14.7 Lumenis Be Ltd.
14.7.1 会社概要
14.7.2 会社概要
14.7.3 製品ベンチマーク
14.7.4 戦略的展望
14.8 Ophtec BV
14.8.1 会社概要
14.8.2 会社概要
14.8.3 製品ベンチマーク
14.8.4 戦略的展望
14.9 Carl Zeiss Meditec AG
14.9.1 会社概要
14.9.2 会社概要
14.9.3 財務分析
14.9.3.1 純収入、2017-2022年
14.9.3.2 R&D、2017-2022年
14.9.3.3 地域市場シェア、2022年
14.9.4 製品ベンチマーク
14.9.5 戦略的展望
14.10 Johnson & Johnson Vision
14.10.1 会社概要
14.10.2 会社概要
14.10.3 財務分析
14.10.3.1 純収入、2017-2022年
14.10.3.2 売上高、2017-2022年
14.10.3.3 地域市場シェア、2022年
14.10.3.4 セグメント別売上高、2017-2022年
14.10.4 製品ベンチマーク
14.10.5 戦略的展望
14.11 CooperVision
14.11.1 会社概要
14.11.2 会社概要
14.11.3 財務分析
14.11.3.1 純収入、2017-2022年
14.11.3.2 R&D、2017-2022年
14.11.3.3 地域市場シェア、2022年
14.11.4 製品ベンチマーク
14.11.5 戦略的展望
14.12 NIDEK CO., LTD.
14.12.1 会社概要
14.12.2 会社概要
14.12.3 財務分析
14.12.3.1 セグメント別売上高、2017-2022年
14.12.3.2 R&D、2017-2022年
14.12.4 製品ベンチマーク
14.12.5 戦略的展望
14.13 Sonomed Escalon
14.13.1 会社概要
14.13.2 会社概要
14.13.3 財務分析
14.13.3.1 純収入、2017-2022年
14.13.3.2 R&D、2017-2022年
14.13.3.3 地域市場シェア、2022年
14.13.4 製品ベンチマーク
14.13.5 戦略的展望
14.14 HAAG-STREIT GROUP
14.14.1 会社概要
14.14.2 会社概要
14.14.3 製品ベンチマーク
14.14.4 戦略的展望
14.15 HEINE Optotechnik GmbH & Co. KG
14.15.1 会社概要
14.15.2 会社概要
14.15.3 製品ベンチマーク
14.15.4 戦略的展望
14.16 Visionix
14.16.1 会社概要
14.16.2 会社概要
14.16.3 製品ベンチマーク
14.16.4 戦略的展望
14.17 Sight Sciences
14.17.1 会社概要
14.17.2 会社概要
14.17.3 財務分析
14.17.3.1 純収入、2017-2022年
14.17.3.2 売上高、2017-2022年
14.17.4 製品ベンチマーク
14.17.5 戦略的展望
14.18 LENSAR, Inc.
14.18.1 会社概要
14.18.2 会社概要
14.18.3 財務分析
14.18.3.1 純収入、2017-2022年
14.18.3.2 R&D、2017-2022年
14.18.3.3 地域市場シェア、2022年
14.18.4 製品ベンチマーク
14.18.5 戦略的展望
14.19 EssilorLuxottica
14.19.1 会社概要
14.19.2 会社概要
14.19.3 財務分析
14.19.3.1 純収入、2017-2022年
14.19.3.2 R&D、2017年-2022年
14.19.3.3 地域市場シェア、2022年
14.19.4 製品ベンチマーク
14.19.5 戦略的展望
15 結論と提言
15.1 Visiongainからの結びの言葉
15.2 市場プレイヤーへの提言
ページTOPに戻る
図表リスト
表の一覧
Table 1 Ophthalmic Devices Market Snapshot, 2023 & 2033 (US$ Million, CAGR %)
Table 2 Ophthalmic Devices: Recent Major Mergers/Acquisitions & Funding
Table 3 Ophthalmic Instruments : Pricing List (US$)
Table 4 Global Ophthalmologic Devices Market Forecast by Region 2022-2032 (US$ Mn, AGR%, CAGR%): "V" Shaped Recovery
Table 5 Ophthalmic Devices Market Forecast by Region 2022-2032 (US$ Million, AGR%, CAGR%): "U" Shaped Recovery
Table 6 Global Ophthalmologic Devices Market Forecast by Region 2022-2032 (US$ Million, AGR%, CAGR%): "W" Shaped Recovery
Table 7 Global Ophthalmic Devices Market Forecast by Region 2022-2032 (US$ Million, AGR%, CAGR%): "L" Shaped Recovery
Table 8 Ophthalmic Devices Market Forecast by Vision Care by Type, 2023-2033 (US$ Million, AGR%, CAGR %)
Table 9 Spectacles Lenses Market Forecast by Region, 2023-2033 (US$ Million, AGR%, CAGR %)
Table 10 Contact Lenses Market Forecast by Region, 2023-2033 (US$ Million, AGR%, CAGR %)
Table 11 Contact Lenses Market Forecast by Type, 2023-2033 (US$ Million, AGR%, CAGR %)
Table 12 Ophthalmic Diagnostics & Monitoring Devices Market Forecast by Region, 2023-2033 (US$ Million, AGR%, CAGR %)
Table 13 Diagnostic Care & Monitoring Market Forecast by Type, 2023-2033 (US$ Million, AGR%, CAGR %)
Table 14 Specular Microscope Market Forecast by Region, 2023-2033 (US$ Million, AGR%, CAGR %)
Table 15 Fundus Camera Market Forecast by Region, 2023-2033 (US$ Million, AGR%, CAGR %)
Table 16 Major Players of OCT and OCT Imaging Systems
Table 17 Optical Coherence Tomography Scanner Market Forecast by Region, 2023-2033 (US$ Million, AGR%, CAGR %)
Table 18 Major Players of Visual Field Analyzers/ Perimeter
Table 19 Perimeter Market Forecast by Region, 2023-2033, (US$ Million, AGR%, CAGR %)
Table 20 Major Players of Optimeter and Optometry Systems
Table 21 Optical Biometer Market Forecast, By Region 2023-2033 (US$ Million, AGR%, CAGR %)
Table 22 Slit Lamps Market Forecast by Region, 2023-2033 (US$ Million, AGR%, CAGR %)
Table 23 Major Players of Auto-Refractometer and Auto-Refractometer Models
Table 24 Auto-Refractor Market Forecast by Region 2023-2033 (US$ Million, AGR%, CAGR %)
Table 25 Major Players of Tonometer and Tonometer Systems
Table 26 Tonometer Market Forecast by Region 2023-2033, (US$ Million, AGR%, CAGR %)
Table 27 Major Players of AB Ultrasound Systems
Table 28 Ophthalmic Ultrasound Imaging Systems Market Forecast, By Region, 2023-2033 (US$ Million, AGR%, CAGR %)
Table 29 Ophthalmoscope Market Forecast by Region 2023-2033, (US$ Million, AGR%, CAGR %)
Table 30 Chart Projectors Market by Region, 2023-2033 (US$ Million, AGR%, CAGR %)
Table 31 Major Players of corneal Topography Systems & Models
Table 32 Corneal Topography Systems Market, 2023-2033, By Region (US$ Million, AGR%, CAGR %)
Table 33 Major Players of Lensometer & Models
Table 34 Global Lensometers Market, 2023-2033, By Region (US$ Million, AGR%, CAGR %)
Table 35 Major Players of Wavefront/ Aberrometers & Models
Table 36 Wave Front Aberrometers Market Forecast by Region, 2023-2033 (US$ Million, AGR%, CAGR %)
Table 37 Other Ophthalmic Diagnostic Device Market, 2023-2033, By Region (US$ Million, AGR%, CAGR %)
Table 38 Ophthalmic Surgical Devices Market Forecast by Region, 2023-2033 (US$ Million, AGR%, CAGR %)
Table 39 Ophthalmic Surgical Devices Market Forecast by Type, 2023-2033 (US$ Million, AGR%, CAGR %)
Table 40 Cataract Surgery Devices Market, 2023-2033 (US$ Million, AGR%, CAGR %)
Table 41 Cataract Surgical Devices Forecast Market by Type, 2023-2033 (US$ Million, AGR%, CAGR %)
Table 42 Major Players of Cataract IOLs & IOLs (including. Pipeline IOLs)
Table 43 Major Players of OVDs & Commercial OVDs
Table 44 Major Players of YAG systems & Commercial YAG systems
Table 45 Vitrectomy Surgery Market Forecast by Region, 2023-2033, (US$ Million, AGR%, CAGR %)
Table 46 Vitreoretinal Surgery Devices Market Forecast by Type, 2023-2033 (US$ Million, AGR%, CAGR %)
Table 47 Refractive Surgery Devices Market Forecast by Region 2023-2033 (US$ Million, AGR%, CAGR %)
Table 48 Refractive Surgery Devices Forecast by Type, 2023-2033 (US$ Million, AGR%, CAGR %)
Table 49 Glaucoma Surgical Devices Market, 2023-2033 (US$ Million, AGR%, CAGR %)
Table 50 Glaucoma Surgical Devices Market Forecast by Type, 2023-2033 (US$ Million, AGR%, CAGR %)
Table 51 Major Players of Glaucoma Laser Systems & the Laser Technique
Table 52 Major Players of Glaucoma Tube Shunts & Models
Table 53 Ophthalmic OR Microscope Market Forecast by Region, 2023-2033 (US$ Million, AGR%, CAGR %)
Table 54 Major Players of Optimeter and Optometry Systems
Table 55 Other Surgical Devices Market Forecast by Region, 2023-2033 (US$ Million, AGR%, CAGR %)
Table 56 Global Ophthalmic Devices Market Forecast by End-Users, 2023-2033 (US$ Million, AGR%, CAGR %)
Table 57 Global Ophthalmic Devices End-Users Market Forecast by Region, 2023-2033 (US$ Million, AGR%, CAGR %)
Table 58 Hospitals Market Forecast by Region, 2023-2033 (US$ Million, AGR%, CAGR %)
Table 59 Diagnostic Clinics Market Forecast by Region, 2023-2033 (US$ Million, AGR%, CAGR %)
Table 60 Franchise Optical Stores Market Forecast by Region, 2023-2033 (US$ Million, AGR%, CAGR %)
Table 61 Eye Research Institutes Market Forecast by Region, 2023-2033 (US$ Million, AGR%, CAGR %)
Table 62 Government Agencies Market Forecast by Region, 2023-2033 (US$ Million, AGR%, CAGR %)
Table 63 Academics Market Forecast by Region, 2023-2033 (US$ Million, AGR%, CAGR %)
Table 64 Ophthalmic Devices Market Forecast by Region 2023-2033 (US$ Million, AGR%, CAGR %)
Table 65 North America Ophthalmic Devices Market Forecast by Country, 2023-2033 (US$ Million, AGR%, CAGR %)
Table 66 North America Ophthalmic Devices Market Forecast by Type, 2023-2033 (US$ Million, AGR%, CAGR %)
Table 67 North America Vision Care Devices Market Forecast by Type, 2023-2033 (US$ Million, AGR%, CAGR %)
Table 68 North America Diagnostic Care & Monitoring Devices Market Forecast by Type, 2023-2033 (US$ Million, AGR%, CAGR %)
Table 69 North America Surgical Devices Market Forecast by Type, 2023-2033 (US$ Mn, AGR%, CAGR %)
Table 70 North America Ophthalmic Devices Market Forecast by End-Users, 2023-2033 (US$ Million, AGR%, CAGR %)
Table 71 U.S. Ophthalmic Devices Market Forecast, 2023-2033 (US$ Million, AGR%, CAGR %)
Table 72 Canada Ophthalmic Devices Market Forecast, 2023-2033 (US$ Million, AGR%, CAGR %)
Table 73 Europe Ophthalmic Devices Market Forecast by Country, 2023-2033 (US$ Mn, AGR%, CAGR %)
Table 74 Europe Ophthalmic Devices Market Forecast by Type, 2023-2033 (US$ Million, AGR%, CAGR %)
Table 75 Europe Vision Care Devices Market Forecast by Type, 2023-2033 (US$ Million, AGR%, CAGR %)
Table 76 Europe Diagnostic Care & Monitoring Devices Market Forecast by Type, 2023-2033 (US$ Million, AGR%, CAGR %)
Table 77 Europe Surgical Devices Market Forecast by Type, 2023-2033 (US$ Million, AGR%, CAGR %)
Table 78 Europe Ophthalmic Devices Market Forecast by End-Users, 2023-2033 (US$ Million, AGR%, CAGR %)
Table 79 Germany Ophthalmology Market Forecast, 2023-2033 (US$ Million, AGR%, CAGR %)
Table 80 UK Ophthalmology Market Forecast, 2023-2033 (US$ Mn, AGR%, CAGR %)
Table 81 France Ophthalmology Market Forecast, 2023-2033 (US$ Million, AGR%, CAGR %)
Table 82 Italy Ophthalmology Market Forecast, 2023-2033 (US$ Million, AGR%, CAGR %)
Table 83 Spain Ophthalmology Market Forecast, 2023-2033 (US$ Million, AGR%, CAGR %)
Table 84 Rest of Europe Ophthalmology Market Forecast, 2022-2032 (US$ Million, AGR%, CAGR %)
Table 85 Asia Pacific Ophthalmic Devices Market Forecast by Country, 2023-2033 (US$ Million, AGR%, CAGR %)
Table 86 Asia Pacific Ophthalmic Devices Market Forecast by Type, 2023-2033 (US$ Million, AGR%, CAGR %)
Table 87 Asia Pacific Vision Care Devices Market Forecast by Type, 2023-2033 (US$ Million, AGR%, CAGR %)
Table 88 Asia Pacific Diagnostic Care & Monitoring Devices Market Forecast by Type, 2023-2033 (US$ Million, AGR%, CAGR %)
Table 89 Asia Pacific Surgical Devices Market Forecast by Type, 2023-2033 (US$ Million, AGR%, CAGR %)
Table 90 Asia Pacific Ophthalmic Devices Market Forecast by End-Users, 2023-2033 (US$ Million, AGR%, CAGR %)
Table 91 Japan Ophthalmic Devices Market Forecast, 2023-2033 (US$ Million, AGR%, CAGR %)
Table 92 China Ophthalmology Market Forecast, 2023-2033 (US$ Million, AGR%, CAGR %)
Table 93 India Ophthalmology Market Forecast, 2023-2033 (US$ Million, AGR%, CAGR %)
Table 94 South Korea Ophthalmic Devices Market Forecast, 2023-2033 (US$ Million, AGR%, CAGR %)
Table 95 Australia Ophthalmologic Devices Market Forecast, 2023-2033 (US$ Million, AGR%, CAGR %)
Table 96 Rest of Asia Pacific Ophthalmology Market Forecast, 2023-2033 (US$ Million, AGR%, CAGR %)
Table 97 Latin America Ophthalmic Devices Market Forecast by Country, 2023-2033 (US$ Million, AGR%, CAGR %)
Table 98 Latin America Ophthalmic Devices Market Forecast by Type, 2023-2033 (US$ Million, AGR%, CAGR %)
Table 99 Latin America Vision Care Devices Market Forecast by Type, 2023-2033 (US$ Million, AGR%, CAGR %)
Table 100 Latin America Diagnostic Care & Monitoring Market Forecast by Type, 2023-2033 (US$ Million, AGR%, CAGR %)
Table 101 Latin America Surgical Devices Market Forecast by Type, 2023-2033 (US$ Million, AGR%, CAGR %)
Table 102 Latin America Ophthalmic Devices Market Forecast by End-Users, 2023-2033 (US$ Million, AGR%, CAGR %)
Table 103 Brazil Ophthalmic Devices Market Forecast, 2023-2033 (US$ Million, AGR%, CAGR %)
Table 104 Mexico Ophthalmologic Devices Market Forecast, 2023-2033 (US$ Million, AGR%, CAGR %)
Table 105 Rest of Latin America Ophthalmic Devices Market Forecast, 2023-2033 (US$ Million, AGR%, CAGR %)
Table 106 Middle East & Africa Ophthalmic Devices Market Forecast by Country, 2023-2033 (US$ Mn, AGR%, CAGR %)
Table 107 Middle East & Africa Ophthalmic Devices Market Forecast by Type, 2023-2033 (US$ Million, AGR%, CAGR %)
Table 108 Middle East & Africa Vision Care Devices Market Forecast by Type, 2023-2033 (US$ Million, AGR%, CAGR %)
Table 109 Middle East & Africa Diagnostic Care & Monitoring Devices Market Forecast by Type, 2023-2033 (US$ Million, AGR%, CAGR %)
Table 110 Middle East & Africa Surgical Devices Market Forecast by Type, 2023-2033 (US$ Mn, AGR%, CAGR %)
Table 111 Middle East & Africa Ophthalmic Devices Market Forecast by End-Users, 2023-2033 (US$ Million, AGR%, CAGR %)
Table 112 GCC Ophthalmic Devices Market Forecast, 2023-2033 (US$ Million, AGR%, CAGR %)
Table 113 South Africa Ophthalmic Devices Market Forecast, 2023-2033 (US$ Million, AGR%, CAGR %)
Table 114 Rest of MEA Ophthalmic Devices Market Forecast, 2023-2033 (US$ Mn, AGR%, CAGR %)
Table 115 Strategic Outlook
Table 116 Alcon: Key Details, (CEO, HQ, Revenue, Founded, No. of Employees, Company Type, Website, Business Segment)
Table 117 Alcon: Product Benchmarking
Table 118 Alcon: Strategic Outlook
Table 119 Glaukos Corporation: Key Details, (CEO, HQ, Revenue, Founded, No. of Employees, Company Type, Website, Business Segment)
Table 120 Glaukos Corp: Product Benchmarking
Table 121 Glaukos Corporation: Strategic Outlook
Table 122 STAAR SURGICAL: Key Details, (CEO, HQ, Revenue, Founded, No. of Employees, Company Type, Website, Business Segment)
Table 123 STAAR SURGICAL: Product Benchmarking
Table 124 STAAR SURGICAL: Strategic Outlook
Table 125 Ziemer Ophthalmic Systems AG: Key Details, (CEO, HQ, Revenue, Founded, No. of Employees, Company Type, Website, Business Segment)
Table 126 Ziemer Ophthalmic Systems AG: Product Benchmarking
Table 127 Ziemer Ophthalmic Systems AG: Strategic Outlook
Table 128 Lumenis Be Ltd.: Key Details, (CEO, HQ, Revenue, Founded, No. of Employees, Company Type, Website, Business Segment)
Table 129 Lumenis Be Ltd.: Product Benchmarking
Table 130 Lumenis Be Ltd.: Strategic Outlook
Table 131 Ophtec BV: Key Details, (CEO, HQ, Revenue, Founded, No. of Employees, Company Type, Website, Business Segment)
Table 132 Ophtec BV: Product Benchmarking
Table 133 Ophtec BV: Strategic Outlook
Table 134 Carl Zeiss Meditec AG: Key Details, (CEO, HQ, Revenue, Founded, No. of Employees, Company Type, Website, Business Segment)
Table 135 Carl Zeiss Meditec AG: Product Benchmarking
Table 136 Carl Zeiss Meditec AG: Strategic Outlook
Table 137 Johnson & Johnson Vision: Key Details, (CEO, HQ, Revenue, Founded, No. of Employees, Company Type, Website, Business Segment)
Table 138 Johnson & Johnson Vision: Product Benchmarking
Table 139 Johnson & Johnson Vision: Strategic Outlook
Table 140 CooperVision: Key Details, (CEO, HQ, Revenue, Founded, No. of Employees, Company Type, Website, Business Segment)
Table 141 CooperVision: Product Benchmarking
Table 142 CooperVision: Strategic Outlook
Table 143 NIDEK CO., LTD.: Key Details, (CEO, HQ, Revenue, Founded, No. of Employees, Company Type, Website, Business Segment)
Table 144 NIDEK CO., LTD.: Product Benchmarking
Table 145 NIDEK CO., LTD.: Strategic Outlook
Table 146 Sonomed Escalon : Key Details, (CEO, HQ, Revenue, Founded, No. of Employees, Company Type, Website, Business Segment)
Table 147 Sonomed Escalon: Product Benchmarking
Table 148 Sonomed Escalon: Strategic Outlook
Table 149 HAAG-STREIT GROUP: Key Details, (CEO, HQ, Revenue, Founded, No. of Employees, Company Type, Website, Business Segment)
Table 150 HAAG-STREIT Group: Product Benchmarking
Table 151 HAAG-STREIT Group: Strategic Outlook
Table 152 HEINE Optotechnik GmbH & Co. KG: Key Details, (CEO, HQ, Revenue, Founded, No. of Employees, Company Type, Website, Business Segment)
Table 153 HEINE Optotechnik GmbH & Co. KG: Product Benchmarking
Table 154 HEINE Optotechnik GmbH & Co. KG: Strategic Outlook
Table 155 Visionix: Key Details, (CEO, HQ, Revenue, Founded, No. of Employees, Company Type, Website, Business Segment)
Table 156 Visionix: Product Benchmarking
Table 157 Visionix: Strategic Outlook
Table 158 Sight Sciences: Key Details, (CEO, HQ, Revenue, Founded, No. of Employees, Company Type, Website, Business Segment)
Table 159 Sight Sciences: Product Benchmarking
Table 160 Sight Sciences: Strategic Outlook
Table 161 LENSAR, Inc.: Key Details, (CEO, HQ, Revenue, Founded, No. of Employees, Company Type, Website, Business Segment)
Table 162 LENSAR, Inc.: Product Benchmarking
Table 163 LENSAR, Inc.: Strategic Outlook
Table 164 EssilorLuxottica: Key Details, (CEO, HQ, Revenue, Founded, No. of Employees, Company Type, Website, Business Segment)
Table 165 EssilorLuxottica: Product Benchmarking
Table 166 EssilorLuxottica: Strategic Outlook
図の一覧
Figure 1 Ophthalmic Devices Market Segmentation
Figure 2 Ophthalmic Vision Care Devices by Type : Market Attractiveness Index
Figure 3 Ophthalmic Diagnostics Care & Monitoring Devices by Type: Market Attractiveness Index
Figure 4 Ophthalmic Surgical Devices by Type: Market Attractiveness Index
Figure 5 Ophthalmic Devices Market Attractiveness Index by End-users
Figure 6 Ophthalmic Devices Market Attractiveness Index by Region
Figure 7 Ophthalmic Devices Market: Market Dynamics
Figure 8 Ophthalmic Devices Market by Region, 2023-2033 (US$ Million, AGR (%), CAGR (%)): “V” Shaped Recovery
Figure 9 Ophthalmic Devices Market by Region, 2023-2033 (US$ Million, AGR% ,CAGR %): “U” Shaped Recovery
Figure 10 Ophthalmic Devices Market by Region, 2023-2033 (US$ Million, AGR %, CAGR %): “W” Shaped Recovery
Figure 11 Ophthalmic Devices Market by Region, 2023-2033 (US$ Million, AGR %, CAGR %): “L” Shaped Recovery
Figure 12 Ophthalmic Devices : Market: Porter’s Five Forces Analysis
Figure 13 Global Ophthalmic Market: PEST Analysis
Figure 14 Ophthalmic Vision Care Devices: Market Attractiveness Index
Figure 15 Spectacle Lenses Market Share, 2022 (%)
Figure 16 Contact Lenses Market Share Analysis, 2022 (%)
Figure 17 Ophthalmic Vision Care Devices Market Forecast by Type, 2023-2033 (US$ Million, AGR %)
Figure 18 Ophthalmic Vision Care Devices Market Share Forecast by Type, 2023, 2028, 2033 (%)
Figure 19 Spectacle Lenses Market Forecast by Region, 2023-2033 (US$ Million, AGR %)
Figure 20 Spectacle Lenses Market Forecast by Region, 2023 &2033 (%)
Figure 21 Contact Lenses Market Forecast by Region, 2023-2033 (US$ Million, AGR %)
Figure 22 Contact Lenses Market Forecast by Region, 2023 & 2033 (%)
Figure 23 Spherical Contact Lenses Market Forecast by Region, 2023-2033 (US$ Million, AGR %)
Figure 24 Toric Contact Lenses Market Forecast by Region, 2023-2033 (US$ Million, AGR %)
Figure 25 Multifocal Contact Lenses Market Forecast by Region, 2023-2033 (US$ Million, AGR %)
Figure 26 Ophthalmic Diagnostics Care & Monitoring Devices: Market Attractiveness Index
Figure 27 Ophthalmic Diagnostics & Monitoring Devices Market, By Market Share, 2022 (%)
Figure 28 Ophthalmic Diagnostics & Monitoring Devices Market Forecast by Region, 2023-2033 (US$ Million, AGR %)
Figure 29 Diagnostic Care & Monitoring Market Forecast by Type, 2023-2033 (US$ Million, AGR %)
Figure 30 Diagnostic Care & Monitoring Market Share Forecast by Type, 2023, 2028, 2033 (%)
Figure 31 Specular Microscope Market Forecast by Region, 2023-2033 (US$ Million, AGR %)
Figure 32 Specular Microscope Market by Region, 2023 & 2033 (%)
Figure 33 Fundus Cameras Market Forecast by Region, 2023-2033 (US$ Million, AGR %)
Figure 34 Fundus Camera Market by Region, 2023 & 2033 (%)
Figure 35 Optical Coherence Tomography Scanner Market Forecast by Region, 2023-2033 (US$ million, AGR %)
Figure 36 Optical Coherence Tomography Scanner Share Forecast by Region, 2023 & 2033 (%)
Figure 37 Perimeter Market Forecast by Region, 2023-2033 (US$ Million, AGR %)
Figure 38 Perimeter Market Share Forecast by Region, 2023 & 2033 (%)
Figure 39 Optical Biometer Market Forecast by Region, 2023-2033 (US$ million, AGR %)
Figure 40 Optical Biometer Market Share Forecast by Region, 2023 & 2033 (%)
Figure 41 Slit Lamps Market Forecast by Region, 2023-2033 (US$ Million, AGR %)
Figure 42 Slit Lamps Market Share Forecast by Region, 2023 & 2033 (%)
Figure 43 Auto-Refractor Market Forecast by Region, 2023-2033 (US$ Million, AGR %)
Figure 44 Auto-Refractor Market Share Forecast by Region, 2023 & 2033 (%)
Figure 45 Tonometer Market Forecast by Region, 2023-2033 (US$ Million, AGR %)
Figure 46 Tonometer Market Share Forecast by Region, 2023 & 2033 (%)
Figure 47 Ophthalmic Ultrasound Imaging Systems Market Forecast by Region, 2023-2033 (US$ Million, AGR %)
Figure 48 Ophthalmic Ultrasound Imaging Systems Market Share Forecast by Region, 2023 & 2033 (%)
Figure 49 Ophthalmoscope Market Forecast by Region, 2023-2033 (US$ Million, AGR %)
Figure 50 Ophthalmoscope Market Share Forecast by Region, 2023 & 2033 (%)
Figure 51 Chart Projectors Market Forecast by Region, 2023-2033 (US$ Million, AGR %)
Figure 52 Chart Projectors Market Share Forecast by Region, 2023 & 2033 (%)
Figure 53 Corneal Topography Systems Market Forecast by Region, 2023-2033 (US$ Million, AGR %)
Figure 54 Corneal Topography Systems Market Share Forecast by Region, 2023 & 2033 (%)
Figure 55 Lensometer Market Forecast by Region, 2023-2033 (US$ Million, AGR %)
Figure 56 Lensometer Market Share Forecast by Region, 2023 & 2033 (%)
Figure 57 Wave Front Aberrometers Market Forecast by Region, 2023-2033 (US$ Million, AGR %)
Figure 58 Wave Front Aberrometers Market Share Forecast by Region, 2023 & 2033 (%)
Figure 59 Others Market Forecast by Region, 2023-2033 (US$ Million, AGR %)
Figure 60 Others Market Share Forecast by Region, 2023 & 2033 (%)
Figure 61 Ophthalmic Surgical Devices: Market Attractiveness Index
Figure 62 Ophthalmic Surgical Devices Market, By Market Share, 2022 (%)
Figure 63 Ophthalmic Surgical Devices Market Forecast by Region, 2023-2033 (US$ Million, AGR %)
Figure 64 Ophthalmic Surgical Devices Market Forecast by Type, 2023-2033 (US$ Million, AGR%, CAGR %)
Figure 65 Ophthalmic Surgical Devices Market Share Forecast by Type, 2023, 2028, 2033 (%)
Figure 66 Cataract Surgery Market Forecast by Region, 2023-2033(US$ Million, AGR %)
Figure 67 Cataract Surgery Market by Region, 2023 & 2033 (%)
Figure 68 Cataract IOLs Market Forecast by Region, 2023-2033(US$ Million, AGR%)
Figure 69 IOLs Injectors Market Forecast by Region, 2023-2033(US$ Million, AGR %)
Figure 70 OVDs Market Forecast by Region, 2023-2033(US$ Million, AGR %)
Figure 71 Femtosecond Laser Cataract System (FLACS) Market Forecast by Region, 2023-2033(US$ Million, AGR %)
Figure 72 Nd: YAG Laser System Market Forecast by Region, 2023-2033(US$ Million, AGR %)
Figure 73 Phacoemulsification Devices Market Forecast by Region, 2023-2033(US$ Million, AGR%)
Figure 74 Vitrectomy Surgery Market Forecast by Region, 2023-2033(US$ million)
Figure 75 Vitrectomy Surgery Market Share Forecast by Region (%)
Figure 76 Vitrectomy Probes Market Forecast by Region, 2023-2033(US$ Million)
Figure 77 Retinal Implants (IOLs) Market Forecast by Region, 2023-2033 (US$ Million, AGR %)
Figure 78 Vitrectomy Machines Market Forecast by Region, 2023-2033 (US$ Million, AGR %)
Figure 79 Vitrectomy Packs Market Forecast by Region, 2023-2033(US$ Million, AGR %)
Figure 80 Photocoagulation Lasers Market Forecast by Region, 2023-2033(US$ Million, AGR %)
Figure 81 Illumination Devices Market Forecast by Region, 2023-2033(US$ Million, AGR %)
Figure 82 Refractive Surgery Devices Market Forecast by Region, 2023-2033 (US$ Million, AGR %)
Figure 83 Refractive Surgery Devices Market Forecast by Region, 2023 & 2033 (%)
Figure 84 Femtosecond Laser Refractive Surgery Devices Market Forecast by Region, 2023-2033(US$ Million, AGR %)
Figure 85 Excimer Laser Refractive Surgery Devices Market Forecast by Region, 2023-2033(US$ Million, AGR %)
Figure 86 Phakic IOLs Market Forecast by Region, 2023-2033(US$ Million, AGR %)
Figure 87 Refractive Lens Exchange (RLE) Market Forecast by Region, 2023-2033(US$ million)
Figure 88 Mechanical Keratome Market Forecast by Region, 2023-2033(US$ Million, AGR %)
Figure 89 Other Refractive Surgery Devices Market Forecast by Region, 2023-2033(US$ Million, AGR %)
Figure 90 Glaucoma Surgical Devices Market Forecast by Region, 2023-2033(US$ Million, AGR %)
Figure 91 Glaucoma Surgical Devices Market Forecast by Region, 2023 & 2033 (%)
Figure 92 Glaucoma Laser Surgical Devices Market Forecast by Region, 2023-2033(US$ Million, AGR %)
Figure 93 Trab Adjunctive Devices Market Forecast by Region, 2023-2033(US$ Million)
Figure 94 Canal Surgical Devices Market Forecast by Region, 2023-2033(US$ Million, AGR %)
Figure 95 Subconjunctival shunts Market Forecast by Region, 2023-2033(US$ Million, AGR %)
Figure 96 Tube Shunts Devices Market Forecast by Region, 2023-2033(US$ Million, AGR %)
Figure 97 Microstents (MIGS) Market Forecast by Region, 2023-2033 (US$ Million, AGR %)
Figure 98 Ophthalmic OR Microscope Market Forecast by Region, 2023-2033 (US$ Million, AGR %)
Figure 99 Ophthalmic OR Microscope Market Share Forecast by Region, 2023 & 2033 (%)
Figure 100 Other Surgical Devices Market Forecast by Region, 2023-2033 (US$ Million, AGR %)
Figure 101 Other Surgical Devices Market Share Forecast by Region, 2023 & 2033 (%)
Figure 102 Ophthalmic Devices Market, By End -users: Market Attractiveness Index
Figure 103 Ophthalmic Devices End-Users Market Forecast by Region, 2023-2033 (US$ Million, AGR %)
Figure 104 Hospitals Market Forecast by Region, 2023-2033 (US$ Million, AGR %)
Figure 105 Hospital Market Share Forecast by Region, 2023 & 2033 (%)
Figure 106 Diagnostic Clinics Market Forecast by Region, 2023-2033 (US$ Million, AGR %)
Figure 107 Diagnostic Clinics Forecast by Region, 2023 & 2033 (%)
Figure 108 Franchise Optical Stores Market Share Forecast by Region, 2023 & 2033 (%)
Figure 109 Franchise Optical Stores Market Forecast by Region, 2023-2033 (US$ Million, AGR %)
Figure 110 Eye Research Institutes Market Forecast by Region, 2023-2033 (US$ Million, AGR %)
Figure 111 Franchise Optical Stores Forecast by Region, 2023 & 2033 (%)
Figure 112 Government Agencies Market Forecast by Region, 2023-2033 (US$ Million, AGR %)
Figure 113 Government Institutes Market Share Forecast by Region, 2023 & 2033 (%)
Figure 114 Academics Market Share Forecast by Region, 2023 & 2033 (%)
Figure 115 Ophthalmic Devices Market Forecast by Region 2023 and 2033 (Revenue, CAGR %)
Figure 116 Ophthalmic Devices Market Share Forecast by Region 2023, 2028, 2033 (%)
Figure 117 Ophthalmic Devices Market Forecast by Region, 2023-2033 (US$ Million, AGR %)
Figure 118 North America Ophthalmic Devices Market Attractiveness Index
Figure 119 North America Ophthalmic Devices Market by Country, 2023, 2028 & 2033 (US$ Million)
Figure 120 North America Ophthalmic Devices Market Forecast by Country, 2023-2033 (US$ Million, AGR %)
Figure 121 North America Ophthalmic Devices Market Share Forecast by Country, 2023 & 2033 (%)
Figure 122 North America Ophthalmic Devices Market Forecast by Type, 2023-2033 (US$ Million, AGR %)
Figure 123 North America Ophthalmic Devices Market Share Forecast by Type, 2023 & 2033 (%)
Figure 124 North America Vision Care Devices Market Forecast by Type, 2023-2033 (US$ Million, AGR %)
Figure 125 North America Vision Care Devices Market Share Forecast by Type, 2023 & 2033 (%)
Figure 126 North America Diagnostic Care & Monitoring Devices Market Forecast by Type, 2023-2033 (US$ Million, AGR %)
Figure 127 North America Diagnostic Care & Monitoring Devices Market Share Forecast by Type, 2023 & 2033 (%)
Figure 128 North America Surgical Devices Market Share Forecast by Type, 2023 & 2033 (%)
Figure 129 North America Ophthalmic Devices Market Forecast by End-Users, 2023-2033 (US$ Million, AGR %)
Figure 130 North America Ophthalmic Devices Market Share Forecast by End-Users, 2023 & 2033 (%)
Figure 131 U.S. Ophthalmic Devices Market Forecast, 2023-2033 (US$ Million, AGR %)
Figure 132 Canada Ophthalmic Devices Market Forecast, 2023-2033 (US$ Million, AGR %)
Figure 133 Europe Ophthalmic Devices Market Attractiveness Index
Figure 134 Europe Ophthalmic Devices Market by Country, 2023, 2028 & 2033 (US$ Million)
Figure 135 Europe Ophthalmic Devices Market Forecast by Country, 2023-2033 (US$ Million, AGR %)
Figure 136 Europe Ophthalmic Devices Market Share Forecast by Country, 2023 & 2033 (%)
Figure 137 Europe Ophthalmic Devices Market Forecast by Type, 2023-2033 (US$ Million, AGR %)
Figure 138 Europe Ophthalmic Devices Market Share Forecast by Type, 2023 & 2033 (%)
Figure 139 Europe Vision Care Devices Market Forecast by Type, 2023-2033 (US$ Million, AGR %)
Figure 140 Europe Ophthalmic Vision Care Devices Market Share Forecast by Type, 2023 & 2033 (%)
Figure 141 Europe Diagnostic Care & Monitoring Devices Market Forecast by Type, 2023-2033 (US$ Million, AGR %)
Figure 142 Europe Diagnostic Care & Monitoring Devices Market Share Forecast by Type, 2023 & 2033 (%)
Figure 143 Europe Surgical Devices Market Forecast by Type, 2023-2033 (US$ Million, AGR %)
Figure 144 Europe Surgical Devices Market Share Forecast by Type, 2023 & 2033 (%)
Figure 145 Europe Ophthalmic Devices Market Forecast by End-Users, 2023-2033 (US$ Million, AGR %)
Figure 146 Europe Ophthalmic Devices Market Share Forecast by End-Users, 2023 & 2033 (%)
Figure 147 Germany Ophthalmic Devices Market Forecast, 2023-2033 (US$ Million, AGR %)
Figure 148 UK Ophthalmic Devices Market Forecast, 2023-2033 (US$ Million, AGR %)
Figure 149 France Ophthalmic Devices Market Forecast, 2023-2033 (US$ Million, AGR %)
Figure 150 Italy Ophthalmic Devices Market Forecast, 2023-2033 (US$ Million, AGR %)
Figure 151 Spain Ophthalmic Devices Market Forecast, 2023-2033 (US$ Million, AGR %)
Figure 152 Rest of Europe Ophthalmic Devices Market Forecast, 2023-2033 (US$ Million, AGR %)
Figure 153 Asia Ophthalmic Devices Market Attractiveness Index
Figure 154 Asia Ophthalmic Devices Market by Country, 2023, 2028 & 2033 (US$ Million)
Figure 155 Asia Pacific Ophthalmic Devices Market Forecast by Country, 2023-2033 (US$ Million, AGR %)
Figure 156 Asia Pacific Ophthalmic Devices Market Share Forecast by Country, 2023 & 2033 (%)
Figure 157 Asia Ophthalmic Devices Market Forecast by Type, 2023-2033 (US$ Million, AGR %)
Figure 158 Asia Ophthalmic Devices Market Share Forecast by Type, 2023 & 2033 (%)
Figure 159 Asia Ophthalmic Vision Care Devices Market Forecast by Type, 2023-2033 (US$ Million, AGR %)
Figure 160 Asia Vision Care Devices Market Share Forecast by Type, 2023 & 2033 (%)
Figure 161 Asia Diagnostic Care & Monitoring Devices Market Forecast by Type, 2023-2033 (US$ Million, AGR %)
Figure 162 Asia Ophthalmic Diagnostic Care & Monitoring Devices Market Share Forecast by Type, 2023 & 2033 (%)
Figure 163 Asia Surgical Devices Market Forecast by Type, 2023-2033 (US$ Million, AGR %)
Figure 164 Asia Surgical Devices Market Share Forecast by Type, 2023 & 2033 (%)
Figure 165 Asia Ophthalmic Devices Market Forecast by End-Users, 2023-2033 (US$ Million, AGR %)
Figure 166 Asia Ophthalmic Devices Market Share Forecast by End-Users, 2023 & 2033 (%)
Figure 167 Japan Ophthalmic Devices Market Forecast, 2023-2033 (US$ Million, AGR %)
Figure 168 China Ophthalmic Devices Market Forecast, 2023-2033 (US$ Million, AGR %)
Figure 169 India Ophthalmic Devices Market Forecast, 2023-2033 (US$ Million, AGR %)
Figure 170 South Korea Ophthalmic Devices Market Forecast, 2023-2033 (US$ Million, AGR %)
Figure 171 Australia Ophthalmic Devices Market Forecast, 2023-2033 (US$ Million, AGR %)
Figure 172 Rest of Asia Pacific Ophthalmic Devices Market Forecast, 2023-2033 (US$ Million, AGR %)
Figure 173 Latin America Ophthalmic Devices Market Attractiveness Index
Figure 174 Latin America Ophthalmic Devices Market by Country, 2023, 2028 & 2033 (US$ Million)
Figure 175 Latin America Ophthalmic Devices Market Forecast by Country, 2023-2033 (US$ Million, AGR %)
Figure 176 Latin America Ophthalmic Devices Market Share Forecast by Country, 2023 & 2033 (%)
Figure 177 Latin America Ophthalmic Devices Market Forecast by Type, 2023-2033 (US$ Million, AGR %)
Figure 178 Latin America Ophthalmic Devices Market Share Forecast by Type, 2023 & 2033 (%)
Figure 179 Latin America Vision Care Devices Market Forecast by Type, 2023-2033 (US$ Million, AGR %)
Figure 180 Latin America Vision Care Devices Market Share Forecast by Type, 2023 & 2033 (%)
Figure 181 Latin America Ophthalmic Devices Market Forecast by Diagnostic Care & Monitoring, By Type, 2023-2033 (US$ Million, AGR %)
Figure 182 Latin America Diagnostic Care & Monitoring Devices Market Share Forecast by Type, 2023 & 2033 (%)
Figure 183 Latin America Surgical Devices Market Forecast by Type, 2023-2033 (US$ Million, AGR %)
Figure 184 Latin America Surgical Devices Market Share Forecast by Type, 2023 & 2033 (%)
Figure 185 Latin America Ophthalmic Devices Market Forecast by End-Users, 2023-2033 (US$ Million, AGR %)
Figure 186 Latin America Ophthalmic Devices Market Share Forecast by End-Users, 2023 & 2033 (%)
Figure 187 Brazil Ophthalmic Devices Market Forecast, 2023-2033 (US$ Million, AGR %)
Figure 188 Mexico Ophthalmic Devices Market Forecast, 2023-2033 (US$ Million, AGR %)
Figure 189 Rest of Latin America Ophthalmic Devices Market Forecast, 2023-2033 (US$ Million, AGR %)
Figure 190 Middle East & Africa Ophthalmic Devices Market Attractiveness Index
Figure 191 Middle East & Africa Ophthalmic Devices Market by Country, 2023, 2028 & 2033 (US$ Million)
Figure 192 Middle East & Africa Ophthalmic Devices Market Forecast by Country, 2023-2033 (US$ Million, AGR %)
Figure 193 Middle East & Africa Ophthalmic Devices Market Share Forecast by Country, 2023 & 2033 (%)
Figure 194 Middle East & Africa Ophthalmic Devices Market Forecast by Type, 2023-2033 (US$ Million, AGR %)
Figure 195 Middle East & Africa Ophthalmic Devices Market Share Forecast by Type, 2023 & 2033 (%)
Figure 196 Middle East & Africa Vision Care Devices Market Forecast by Type, 2023-2033 (US$ Million, AGR %)
Figure 197 Middle East & Africa Vision Care Devices Market Share Forecast by Type, 2023 & 2033 (%)
Figure 198 Middle East & Africa Diagnostic Care & Monitoring, Devices Market Forecast by Type, 2023-2033 (US$ Million, AGR %)
Figure 199 Middle East & Africa Diagnostic Care & Monitoring Devices Market Share Forecast by, Type, 2023 & 2033 (%)
Figure 200 Middle East & Africa Surgical Devices Market Forecast by Type, 2023-2033 (US$ Million, AGR %)
Figure 201 Middle East & Africa Surgical Devices Market Share Forecast by Type, 2023 & 2033 (%)
Figure 202 Middle East & Africa Ophthalmic Devices Market Forecast by End-Users, 2023-2033 (US$ Million, AGR %)
Figure 203 Middle East & Africa Ophthalmic Devices Market Share Forecast by End-Users, 2023 & 2033 (%)
Figure 204 GCC Ophthalmic Devices Market Forecast, 2023-2033 (US$ Million, AGR %)
Figure 205 South Africa Ophthalmic Devices Market Forecast, 2023-2033 (US$ Million, AGR %)
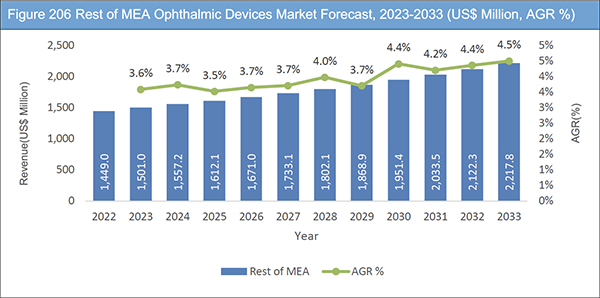
Figure 206 Rest of MEA Ophthalmic Devices Market Forecast, 2023-2033 (US$ Million, AGR %)
Figure 207 Ophthalmic Devices Market: Company Share, 2022
Figure 208 Alcon: Net Revenue, 2017-2022 (US$ Million, AGR %)
Figure 209 Alcon: R&D, 2017-2022 (US$ Million, AGR %)
Figure 210 Alcon: Regional Market Shares, 2022
Figure 211 Alcon: Surgical Vision Care Revenues, 2017-2022 (US$ Million, AGR %)
Figure 212 Alcon: Vision Care Revenues, 2017-2022 (US$ Million, AGR %)
Figure 213 Glaukos Corporation: Net Revenue, 2017-2022 (US$ Million, AGR %)
Figure 214 Glaukos Corporation: R&D, 2017-2022 (US$ Million, AGR %)
Figure 215 Glaukos Corporation: Regional Market Shares, 2022
Figure 216 Glaukos Corporation: Segmental Revenues, 2017-2022 (US$ Million, AGR %)
Figure 217 STAAR SURGICAL: Net Revenue, 2017-2022 (US$ Million, AGR %)
Figure 218 STAAR SURGICAL: R&D, 2017-2022 (US$ Million, AGR %)
Figure 219 STAAR SURGICAL: Regional Market Shares, 2022
Figure 220 Carl Zeiss Meditec AG: Company Revenue 2017-2022 (US$ Million, AGR %)
Figure 221 Carl Zeiss Meditec AG: R&D 2017-2022 (US$ Million, AGR %)
Figure 222 Carl Zeiss Meditec AG: Regional Market Shares, 2022
Figure 223 Johnson & Johnson Vision: Company Revenue 2017-2022 (US$ Million, AGR %)
Figure 224 Johnson & Johnson Vision: R&D 2017-2022 (US$ Million, AGR %)
Figure 225 Johnson & Johnson Vision: Regional Market Shares, 2022
Figure 226 Johnson & Johnson Vision: Segmental Revenue 2017-2022 (US$ Million, AGR %)
Figure 227 Johnson & Johnson Vision: Company Revenue 2017-2022 (US$ Million, AGR %)
Figure 228 CooperVision: Company Revenue 2017-2022 (US$ Million, AGR %)
Figure 229 CooperVision: R&D 2017-2022 (US$ Million, AGR %)
Figure 230 CooperVision: Regional Market Shares, 2022
Figure 231 NIDEK CO., LTD.: Company Revenue 2017-2022 (US$ Million, AGR %)
Figure 232 NIDEK CO., LTD.: Regional Market Share 2022 (%)
Figure 233 Sonomed Escalon: Company Revenue 2017-2022 (US$ Million, AGR %)
Figure 234 Sonomed Escalon.: R&D 2017-2022 (US$ Million, AGR %)
Figure 235 Sonomed Escalon: Regional Market Shares, 2022
Figure 236 Sight Sciences: Net Revenue, 2018-2022 (US$ Million, AGR %)
Figure 237 Sight Sciences: R&D Expenses, 2018-2022 (US$ Million, AGR %)
Figure 238 LENSAR, Inc.: Net Revenue, 2019-2022 (US$ Million, AGR %)
Figure 239 LENSAR Inc.: R&D Expenses, 2018-2022 (US$ Million, AGR %)
Figure 240 LENSAR Inc.: Regional Market Shares, 2022
Figure 241 EssilorLuxottica: Net Revenue, 2017-2022 (US$ Million, AGR %)
Figure 242 EssilorLuxottica: R&D, 2017-2022 (US$ Million, AGR %)
Figure 243 EssilorLuxottica Inc.: Regional Market Shares, 2022
ページTOPに戻る
Summary
Report Details
The Ophthalmic Devices Market Report 2023-2033: This report will prove invaluable to leading firms striving for new revenue pockets if they wish to better understand the industry and its underlying dynamics. It will be useful for companies that would like to expand into different industries or to expand their existing operations in a new region.
Ageing Population and Technological Advances Boosting Volume of Cataract Surgeries Globally
There has been a significant rise in the cataract surgeries in the past decade globally. Growing awareness and insurance coverage have been the primary factors boosting the cataract surgery volumes. Additionally, rise in ageing population and increased life expectancy are further anticipated to trigger the demand for cataract surgeries in developed as well as emerging countries. According to CDC in 2022, approximately 17.2 percent of the U.S. citizens above 40 years of age reported to have been detected of cataract at least in one eye which is approximately 20.5 million people of which only 6.1 million Americans had performed cataract surgery and replaced with new lenses, thus depicting huge market potential for cataract surgeries.
Moreover, CDC predicts that approximately 30 million people will be diagnosed with cataract by 2028. As per WHO (World Health Organization) 2022 report, presently 94 million people above 50 years of age have vision impairment which can be corrected through cataract surgery. Our study also shows a growing trend in demand for technologically advanced methods of conducting the cataract surgeries especially in developed countries. There has been growing preferences for office-based cataract suite coupled with adoption of softer techniques of cataract removal such as FLACS (Femtosecond Laser Assisted Cataract Surgery) and Phaco-aspiration which would replace Phaco-emulsification procedures for safer and faster outcomes. With growing affluent ageing population in countries such as Japan, China, U.S. and Korea, there has been complimentary growth in demand for premium IOLs.
Growing public awareness of premium cataract surgeries, rise in surgery centres conducting premium cataract surgeries, supportive reimbursement policies along with presence of OEMs in the country helps U.S., to continue its domination in premium cataract surgery market. However, there will be growing penetration of these premium procedures witnessed in countries such as Germany, France, Italy, U.K., India, Canada, China and Brazil during the forecast period.
What Questions Should You Ask before Buying a Market Research Report?
• How is the ophthalmic devices market evolving?
• What is driving and restraining the ophthalmic devices market?
• How will each ophthalmic devices submarket segment grow over the forecast period and how much revenue will these submarkets account for in 2033?
• How will the market shares for each ophthalmic devices submarket develop from 2023 to 2033?
• What will be the main driver for the overall market from 2023 to 2033?
• Will leading ophthalmic devices markets broadly follow the macroeconomic dynamics, or will individual national markets outperform others?
• How will the market shares of the national markets change by 2033 and which geographical region will lead the market in 2033?
• Who are the leading players and what are their prospects over the forecast period?
• What are the ophthalmic devices projects for these leading companies?
• How will the industry evolve during the period between 2023 and 2033? What are the implications of
ophthalmic devices projects taking place now and over the next 10 years?
• Is there a greater need for product commercialisation to further scale the ophthalmic devices market?
• Where is the ophthalmic devices market heading and how can you ensure you are at the forefront of the market?
• What are the best investment options for new product and service lines?
• What are the key prospects for moving companies into a new growth path and C-suite?
You need to discover how this will impact the ophthalmic devices market today, and over the next 10 years:
• Our 519-page report provides 166 tables and 243 charts/graphs exclusively to you.
• The report highlights key lucrative areas in the industry so you can target them – NOW.
• It contains in-depth analysis of global, regional and national sales and growth.
• It highlights for you the key successful trends, changes and revenue projections made by your competitors.
This report tells you TODAY how the ophthalmic devices market will develop in the next 10 years, and in line with the variations in COVID-19 economic recession and bounce. This market is more critical now than at any point over the last 10 years.
Forecasts to 2033 and other analyses reveal commercial prospects
• In addition to revenue forecasting to 2033, our new study provides you with recent results, growth rates, and market shares.
• You will find original analyses, with business outlooks and developments.
• Discover qualitative analyses (including market dynamics, drivers, opportunities, and restraints), Porter’s Five Forces Analysis, PEST Analysis and recent developments.
This report includes data analysis and invaluable insight into how COVID-19 will affect the industry and your company. Four COVID-19 recovery patterns and their impact, namely, “V”, “L”, “W” and “U” are discussed in this report.
Segments Covered in the Report
Vision Care Devices
• Spectacle Lenses
• Contact Lenses
Diagnostics Care & Monitoring Devices
• Specular Microscope
• Fundus Cameras
• Optical Coherence Tomography Scanner
• Perimeter
• Optical Biometer
• Slit Lamps
• Auto-Refractor
• Tonometer
• Ophthalmic Ultrasound Imaging Systems
• Ophthalmoscope
• Chart Projectors
• Corneal Topography Systems
• Lensometers
• Wave Front Aberrometers
• Others
Surgical Devices
• Cataract Surgery Devices
– Intraocular Lenses
– IOL Injectors
– Ophthalmic Viscoelastic Devices
– Femto-second Laser Cataract Systems
– Nd: Yag Lasers
– Phaco-emulsification Devices
• Refractive Surgery Devices
– Femto-second Laser
– Excimer Laser
– Phakic IOL
– Refractive Lens Exchange Mechanical Keratome
– Others
• Vitreoretinal Surgery Devices
– Vitrectomy Probes
– Retinal Implants
– Vitrectomy Machines
– Vitrectomy Packs
– Photo-coagulation Lasers
– Illumination Devices
• Glaucoma Surgery Devices
– Lasers
– Trab Adjunctive Devices
– Canal Surgery Devices
– Microstents
– Tube Shunts
– Sub-conjunctival Stents
• Ophthalmic OR Microscope
• Others
End-users
• Hospitals
• Diagnosis Clinics
• Franchise Optical Stores
• Eye Research Institutes
• Government Agencies
• Academics
In addition to the revenue predictions for the overall world market and segments, you will also find revenue forecasts for five regional and 20 leading national markets:
North America
• U.S.
• Canada
Europe
• Germany
• UK
• France
• Italy
• Spain
• Rest of Europe
Asia Pacific
• Japan
• China
• India
• Australia
• South Korea
• Rest of Asia Pacific
Latin America
• Brazil
• Mexico
• Rest of Latin America
MEA
• GCC
• South Africa
• Rest of MEA
The report also includes profiles and for some of the leading companies in the Ophthalmic Devices Market, 2023 to 2033, with a focus on this segment of these companies’ operations.
Leading companies and the potential for market growth
• Alcon
• CooperVision
• Carl Zeiss Meditec
• EssilorLuxottica
• Glaukos Corporation
• HAAG-STREIT GROUP
• HEINE Optotechnik GmbH & Co. KG
• Johnson & Johnson Vision
• LENSAR, Inc.
• Lumenis Be Ltd.
• NIDEK CO., LTD.
• Ophtec BV
• Sight Sciences
• Sonomed Escalon
• STAAR SURGICAL
• Visionix
• Ziemer Ophthalmic Systems AG
Overall world revenue for Ophthalmic Devices Market, 2023 to 2033 in terms of value the market will surpass US$64,442 million in 2023, our work calculates. We predict strong revenue growth through to 2033. Our work identifies which organizations hold the greatest potential. Discover their capabilities, progress, and commercial prospects, helping you stay ahead.
How will the Ophthalmic Devices Market, 2023 to 2033 report help you?
In summary, our 510+ page report provides you with the following knowledge:
• Revenue forecasts to 2033 for Ophthalmic Devices Market, 2023 to 2033 Market, with forecasts for vision care devices, diagnostics care & monitoring devices, surgical devices, end-users, each forecast at a global and regional level – discover the industry’s prospects, finding the most lucrative places for investments and revenues.
• Revenue forecasts to 2033 for five regional and 20 key national markets – See forecasts for the Ophthalmic Devices Market, 2023 to 2033 market in North America, Europe, Asia-Pacific, Latin America, and MEA. Also forecasted is the market in the US, Canada, Mexico, Brazil, Germany, France, UK, Italy, China, India, Japan, and Australia among other prominent economies.
• Prospects for established firms and those seeking to enter the market – including company profiles for 17 of the major companies involved in the Ophthalmic Devices Market, 2023 to 2033.
Find quantitative and qualitative analyses with independent predictions. Receive information that only our report contains, staying informed with invaluable business intelligence.
Information found nowhere else
With our new report, you are less likely to fall behind in knowledge or miss out on opportunities. See how our work could benefit your research, analyses, and decisions. Visiongain’s study is for everybody needing commercial analyses for the Ophthalmic Devices Market, 2023 to 2033, market-leading companies. You will find data, trends and predictions.
ページTOPに戻る
Table of Contents
Table of Contents
1 Report Overview
1.1 Objectives of the Study
1.2 Introduction to Ophthalmic Devices Market
1.3 What This Report Delivers
1.4 Why You Should Read This Report
1.5 Key Questions Answered by This Analytical Report
1.6 Who is This Report for?
1.7 Methodology
1.7.1 Market Definitions
1.7.2 Market Evaluation & Forecasting Methodology
1.7.3 Data Validation
1.7.3.1 Primary Research
1.7.3.2 Secondary Research
1.8 Frequently Asked Questions (FAQs)
1.9 Associated Visiongain Reports
1.10 About Visiongain
2 Executive Summary
3 Market Overview
3.1 Key Findings
3.2 Market Dynamics
3.2.1 Market Driving Factors
3.2.1.1 Rise in ageing population and technological advances boosting volume of cataract surgeries globally
3.2.1.2 Accelerating myopia in children and high myopia prevalence
3.2.1.3 Technological innovations are boosting the market growth
3.2.1.4 Private Equity model to consolidate the Eye Care Services
3.2.1.5 Telemedicine and Artificial Intelligence Revolutionizing Ophthalmic Diagnostics
3.2.1 Market Restraining Factors
3.2.1.1 High Costs of Ophthalmic Devices restrains the market growth
3.2.1.2 The recent change in Medicare surgery reimbursement may not be sufficient for some patients
3.2.1.3 The great resignation wave and perpetual shortage of skilled labour
3.2.2 Market Opportunities
3.2.2.1 Large and Mid-size ophthalmic medical device manufacturers seizing the market opportunity for dry eye disease treatment
3.2.2.2 Untapped Potential of Emerging Markets
3.2.2.3 Contact Lens based sensors for disease diagnosis and treatment presents an immense opportunity
3.3 COVID-19 Impact Analysis
3.4 Porter’s Five Forces Analysis
3.4.1 Bargaining Power of Suppliers
3.4.2 Bargaining Power of Buyers
3.4.3 Competitive Rivalry
3.4.4 Threat from Substitutes
3.4.5 Threat of New Entrants
3.5 PEST Analysis
4 Ophthalmic Vision Care Devices Market Analysis
4.1 Key Findings
4.2 Ophthalmic Vision Care Segment: Market Attractiveness Index
4.3 Ophthalmic Vision Care Devices by Market Share Analysis
4.4 Ophthalmic Vision Care Devices by Type
4.4.1 Spectacle Lenses
4.4.1.1 Market Size by Region, 2023-2033 (US$ Million)
4.4.1.2 Market Share by Region, 2023 & 2033 (%)
4.4.2 Contact Lenses
4.4.2.1 Market Size by Region, 2023-2033 (US$ Million)
4.4.2.2 Market Share by Region, 2023 & 2033 (%)
4.4.2.3 Market Size by Types, 2023-2033 (US$ Million)
4.4.2.3.1 Spherical Contact Lenses
4.4.2.3.2 Toric Contact Lenses
4.4.2.3.3 Multifocal Contact Lenses
5 Ophthalmic Diagnostics Care & Monitoring Devices Market Analysis
5.1 Key Findings
5.2 Ophthalmic Diagnostics Care & Monitoring Devices Segment: Market Attractiveness Index
5.3 Ophthalmic Diagnostic Care & Monitoring Market by Market Share Analysis
5.4 Regional Market Size Estimation and Forecast
5.5 Ophthalmic Diagnostics Care & Monitoring Devices Segment by Type
5.5.1 Specular Microscope
5.5.1.1 Market Size by Region, 2023-2033 (US$ Million)
5.5.1.2 Market Share by Region, 2023 & 2033 (%)
5.5.2 Fundus Cameras
5.5.2.1 Market Size by Region, 2023-2033 (US$ Million)
5.5.2.2 Market Share by Region, 2023 & 2033 (%)
5.5.3 Optical Coherence Tomography Scanner Market (OCT)
5.5.3.1 Market Size by Region, 2023-2033 (US$ mn)
5.5.3.2 Market Share by Region, 2023 & 2033 (%)
5.5.4 Perimeter
5.5.4.1 Market Size by Region, 2023-2033 (US$ Million)
5.5.4.2 Market Share by Region, 2023 & 2033 (%)
5.5.5 Optical Biometer
5.5.5.1 Market Size by Region, 2023-2033 (US$ Million)
5.5.5.2 Market Share by Region, 2023 & 2033 (%)
5.5.6 Slit Lamps
5.5.6.1 Market Size by Region, 2023-2033 (US$ Million)
5.5.6.2 Market Share by Region, 2023 & 2033 (%)
5.5.7 Auto-Refractor
5.5.7.1 Market Size by Region, 2023-2033 (US$ Million)
5.5.7.2 Market Share by Region, 2023 & 2033 (%)
5.5.8 Tonometer
5.5.8.1 Market Size by Region, 2023-2033 (US$ Million)
5.5.8.2 Market Share by Region, 2023 & 2033 (%)
5.5.9 Ophthalmic Ultrasound Imaging Systems
5.5.9.1 Market Size by Region, 2023-2033 (US$ Million)
5.5.9.2 Market Share by Region, 2023 & 2033 (%)
5.5.10 Ophthalmoscope
5.5.10.1 Market Size by Region, 2023-2033 (US$ Million)
5.5.10.2 Market Share by Region, 2023 & 2033 (%)
5.5.11 Chart Projectors
5.5.11.1 Market Size by Region, 2023-2033 (US$ Million)
5.5.11.2 Market Share by Region, 2023 & 2033 (%)
5.5.12 Corneal Topography Systems
5.5.12.1 Market Size by Region, 2023-2033 (US$ Million)
5.5.12.2 Market Share by Region, 2023 & 2033 (%)
5.5.13 Lensometer
5.5.13.1 Market Size by Region, 2023-2033 (US$ Million)
5.5.13.2 Market Share by Region, 2023 & 2033 (%)
5.5.14 Wave Front aberrometers
5.5.14.1 Market Size by Region, 2023-2033 (US$ Million)
5.5.14.2 Market Share by Region, 2023 & 2033 (%)
5.5.15 Others
5.5.15.1 Market Size by Region, 2023-2033 (US$ Million)
5.5.15.2 Market Share by Region, 2023 & 2033 (%)
6 Ophthalmic Surgical Devices Market Analysis
6.1 Key Findings
6.2 Ophthalmic Surgical Devices Segment: Market Attractiveness Index
6.3 Ophthalmic Surgical Devices by Market Share Analysis
6.4 Market Size by Region, 2023-2033 (US$ Million)
6.5 Ophthalmic Surgical Devices Market Size Estimation and Forecast by Type
6.5.1 Cataract Surgery
6.5.1.1 Market Size by Region, 2023-2033 (US$ Million)
6.5.1.2 Market Share by Region, 2023 & 2033 (%)
6.5.1.3 Market by Type, 2023 -2033 (US$ Million)
6.5.1.3.1 Intraocular Lens Market (IOLs)
6.5.1.3.2 Intraocular Injectors Market
6.5.1.3.3 Viscoelastic Devices (OVDs)
6.5.1.3.4 Femtosecond Laser Cataract Systems (FLACS)
6.5.1.3.5 Nd: YAG Lasers
6.5.1.3.6 Phacoemulsification Devices
6.5.2 Vitreoretinal Surgery Devices
6.5.2.1 Market Size by Region, 2023-2033 (US$ Million)
6.5.2.2 Market Size by Region, 2023-2033 (%)
6.5.2.3 Market by Type, 2023 -2033 (US$ Million)
6.5.2.3.1 Vitrectomy Probes
6.5.2.3.2 Retinal Implants (IOLs)
6.5.2.3.3 Vitrectomy Machines
6.5.2.3.4 Vitrectomy Packs
6.5.2.3.5 Photocoagulation Lasers
6.5.2.3.6 Illumination Devices
6.5.3 Refractive Surgery
6.5.3.1 Market Size by Region, 2023-2033 (US$ Million)
6.5.3.2 Market Share by Region, 2023 & 2033 (%)
6.5.3.3 Market Size by Type, 2023-2033 (US$ Million)
6.5.3.3.1 Femtosecond Laser
6.5.3.3.2 Excimer Laser
6.5.3.3.3 Phakic IOLs
6.5.3.3.4 Refractive Lens Exchange (RLE)
6.5.3.3.5 Mechanical Keratome
6.5.3.3.6 Others
6.5.4 Glaucoma Surgery Devices
6.5.4.1 Market Size by Region, 2023-2033 (US$ Million)
6.5.4.2 Market Share by Region, 2023 & 2033 (%)
6.5.4.3 Market Size by Type, 2023-2033 (US$ Million)
6.5.4.3.1 Glaucoma Laser
6.5.4.3.2 Trab Adjunctive Devices
6.5.4.3.3 Canal Surgical Devices
6.5.4.3.4 Subconjunctival Shunts
6.5.4.3.5 Tube Shunts
6.5.4.3.6 Microstents (MIGS)
6.5.5 Ophthalmic Operating Room (OR) Microscope
6.5.5.1 Market Size by Region, 2023-2033 (US$ Million)
6.5.5.2 Market Share by Region, 2023 & 2033 (%)
6.5.6 Other Surgical Devices
6.5.6.1 Market Size by Region, 2023-2033 (US$ Million)
6.5.6.2 Market Share by Region, 2023 & 2033 (%)
7 Ophthalmic Devices Market, By End-Users
7.1 Key Findings
7.2 Ophthalmic Devices Segment, By End-users: Market Attractiveness Index
7.3 Ophthalmic Surgical Devices Market Size Estimation and Forecast by End-users
7.4 Regional Market Size Estimation and Forecast
7.5 Hospitals
7.5.1 Market Size by Region, 2023-2033 (US$ Million)
7.5.2 Market Share by Region, 2023 & 2033 (%)
7.6 Diagnosis Clinics
7.6.1 Market Size by Region, 2023-2033 (US$ Million)
7.6.2 Market Share by Region, 2023 & 2033 (%)
7.7 Franchise Optical Stores
7.7.1 Market Share by Region, 2023 & 2033 (%)
7.7.2 Market Size by Region, 2023-2033 (US$ Million)
7.8 Eye Research Institutes
7.8.1 Market Size by Region, 2023-2033 (US$ Million)
7.8.2 Market Share by Region, 2023 & 2033 (%)
7.9 Government Agencies
7.9.1 Market Size by Region, 2023-2033 (US$ Million)
7.9.2 Market Share by Region, 2023 & 2033 (%)
7.10 Academics
7.10.1 Market Size by Region, 2023-2033 (US$ Million)
7.10.2 Market Share by Region, 2023 & 2033 (%)
8 Ophthalmic Devices Market Analysis by Region
8.1 Key Findings
8.2 Regional Market Size Estimation and Forecast
9 North America Ophthalmic Devices Market Analysis
9.1 Key Findings
9.2 North America Ophthalmic Devices Market Attractiveness Index
9.3 North America Ophthalmic Devices Market by Country, 2023, 2028 & 2033 (US$ Million)
9.4 North America Ophthalmic Devices Market Size Estimation and Forecast by Country
9.5 North America Ophthalmic Devices Market Size Estimation and Forecast by Type
9.6 North America Vision Care Devices Market Size Estimation and Forecast by Type
9.7 North America Diagnostics Care & Monitoring Market Devices Size Estimation and Forecast by Type
9.8 North America Surgical Devices Market Size Estimation and Forecast by Type
9.9 North America Ophthalmic Devices Market Size Estimation and Forecast by End-Users Market
9.10 U.S. Ophthalmic Devices Market Analysis
9.11 Canada Ophthalmic Devices Market Analysis
10 Europe Ophthalmic Devices Market Analysis
10.1 Key Findings
10.2 Europe Ophthalmic Devices Market Attractiveness Index
10.3 Europe Ophthalmic Devices Market by Country, 2023, 2028 & 2033 (US$ Million)
10.4 Europe Ophthalmic Devices Market Size Estimation and Forecast by Country
10.5 Europe Ophthalmic Devices Market Size Estimation and Forecast by Type
10.6 Europe Vision Care Devices Market Size Estimation and Forecast by Type
10.7 Europe Diagnostics Care & Monitoring Devices Market Size Estimation and Forecast by Type
10.8 Europe Surgical Devices Market Size Estimation and Forecast by Type
10.9 Europe Ophthalmic Devices Market Size Estimation and Forecast by End-Users Market
10.10 Germany Ophthalmic Devices Market Analysis
10.11 UK Ophthalmic Devices Market Analysis
10.12 France Ophthalmic Devices Market Analysis
10.13 Italy Ophthalmic Devices Market Analysis
10.14 Spain Ophthalmic Devices Market Analysis
10.15 Rest of Europe (ROE) Ophthalmic Devices Market Analysis
11 Asia Ophthalmic Devices Market Analysis
11.1 Key Findings
11.2 Asia Ophthalmic Devices Market Attractiveness Index
11.3 Asia Ophthalmic Devices Market by Country, 2023, 2028 & 2033 (US$ Million)
11.4 Asia Ophthalmic Devices Market Size Estimation and Forecast by Country
11.5 Asia Ophthalmic Devices Market Size Estimation and Forecast by Type
11.6 Asia Vision Care Devices Market Size Estimation and Forecast by Type
11.7 Asia Diagnostics Care & Monitoring Devices Market Size Estimation and Forecast by Type
11.8 Asia Surgical Devices Market Size Estimation and Forecast by Type
11.9 Asia Ophthalmic Devices Market Size Estimation and Forecast by End-Users Market
11.10 Japan Ophthalmic Devices Market Analysis
11.11 China Ophthalmic Devices Market Analysis
11.12 India Ophthalmic Devices Market Analysis
11.13 South Korea Ophthalmic Devices Market Analysis
11.14 Australia Ophthalmic Devices Market Analysis
11.15 Rest of Asia Pacific Ophthalmic Devices Market Analysis
12 Latin America Ophthalmic Devices Market Analysis
12.1 Key Findings
12.2 Latin America Ophthalmic Devices Market Attractiveness Index
12.3 Latin America Ophthalmic Devices Market by Country, 2023, 2028 & 2033 (US$ Million)
12.4 Latin America Ophthalmic Devices Market Size Estimation and Forecast by Country
12.5 Latin America Ophthalmic Devices Market Size Estimation and Forecast by Type
12.6 Latin America Vision Care Devices Market Size Estimation and Forecast by Type
12.7 Latin America Diagnostics Care & Monitoring Devices Market Size Estimation and Forecast by Type
12.8 Latin America Surgical Devices Market Size Estimation and Forecast by Type
12.9 Latin America Ophthalmic Devices Market Size Estimation and Forecast by End-Users Market
12.10 Brazil Ophthalmic Devices Market Analysis
12.11 Mexico Ophthalmic Devices Market Analysis
12.12 Rest of Latin America Ophthalmic Devices Market Analysis
13 Middle East & Africa Ophthalmic Devices Market Analysis
13.1 Key Findings
13.2 Middle East & Africa Ophthalmic Devices Market Attractiveness Index
13.3 Middle East & Africa Ophthalmic Devices Market by Country, 2023, 2028 & 2033 (US$ Million)
13.4 Middle East & Africa Ophthalmic Devices Market Size Estimation and Forecast by Country
13.5 Middle East & Africa Ophthalmic Devices Market Size Estimation and Forecast by Type
13.6 Middle East & Africa Vision Care Devices Market Size Estimation and Forecast by Type
13.7 Middle East & Africa Diagnostics Care & Monitoring Devices Market Size Estimation and Forecast by Type
13.8 Middle East & Africa Surgical Devices Market Size Estimation and Forecast by Type
13.9 Middle East & Africa Ophthalmic Devices Market Size Estimation and Forecast by End-Users Market
13.10 GCC Ophthalmic Devices Market Analysis
13.11 South Africa Ophthalmic Devices Market Analysis
13.12 Rest of MEA Ophthalmic Devices Market Analysis
14 Company Profiles
14.1 Competitive Landscape, 2022
14.2 Strategic Outlook
14.3 Alcon
14.3.1 Company Snapshot
14.3.2 Company Overview
14.3.3 Financial Analysis
14.3.3.1 Net Revenue, 2017-2022
14.3.3.2 R&D, 2017-2022
14.3.3.3 Regional Market Shares, 2022
14.3.3.4 Segmental Revenues, 2017-2022
14.3.4 Product Benchmarking
14.3.5 Strategic Outlook
14.4 Glaukos Corporation
14.4.1 Company Snapshot
14.4.2 Company Overview
14.4.3 Financial Analysis
14.4.3.1 Net Revenue, 2017-2022
14.4.3.2 R&D, 2017-2022
14.4.3.3 Regional Market Shares, 2022
14.4.3.4 Segmental Revenues, 2017-2022
14.4.4 Product Benchmarking
14.4.5 Strategic Outlook
14.5 STAAR SURGICAL
14.5.1 Company Snapshot
14.5.2 Company Overview
14.5.3 Financial Analysis
14.5.3.1 Net Revenue, 2017-2022
14.5.3.2 R&D, 2017-2022
14.5.3.3 Regional Market Shares, 2022
14.5.4 Product Benchmarking
14.5.5 Strategic Outlook
14.6 Ziemer Ophthalmic Systems AG
14.6.1 Company Snapshot
14.6.2 Company Overview
14.6.3 Product Benchmarking
14.6.4 Strategic Outlook
14.7 Lumenis Be Ltd.
14.7.1 Company Snapshot
14.7.2 Company Overview
14.7.3 Product Benchmarking
14.7.4 Strategic Outlook
14.8 Ophtec BV
14.8.1 Company Snapshot
14.8.2 Company Overview
14.8.3 Product Benchmarking
14.8.4 Strategic Outlook
14.9 Carl Zeiss Meditec AG
14.9.1 Company Snapshot
14.9.2 Company Overview
14.9.3 Financial Analysis
14.9.3.1 Net Revenue, 2017-2022
14.9.3.2 R&D, 2017-2022
14.9.3.3 Regional Market Shares, 2022
14.9.4 Product Benchmarking
14.9.5 Strategic Outlook
14.10 Johnson & Johnson Vision
14.10.1 Company Snapshot
14.10.2 Company Overview
14.10.3 Financial Analysis
14.10.3.1 Net Revenue, 2017-2022
14.10.3.2 R&D, 2017-2022
14.10.3.3 Regional Market Shares, 2022
14.10.3.4 Segmental Revenues, 2017-2022
14.10.4 Product Benchmarking
14.10.5 Strategic Outlook
14.11 CooperVision
14.11.1 Company Snapshot
14.11.2 Company Overview
14.11.3 Financial Analysis
14.11.3.1 Net Revenue, 2017-2022
14.11.3.2 R&D, 2017-2022
14.11.3.3 Regional Market Share, 2022
14.11.4 Product Benchmarking
14.11.5 Strategic Outlook
14.12 NIDEK CO., LTD.
14.12.1 Company Snapshot
14.12.2 Company Overview
14.12.3 Financial Analysis
14.12.3.1 Segmental Revenues, 2017-2022
14.12.3.2 R&D, 2017-2022
14.12.4 Product Benchmarking
14.12.5 Strategic Outlook
14.13 Sonomed Escalon
14.13.1 Company Snapshot
14.13.2 Company Overview
14.13.3 Financial Analysis
14.13.3.1 Net Revenue, 2017-2022
14.13.3.2 R&D, 2017-2022
14.13.3.3 Regional Market Shares, 2022
14.13.4 Product Benchmarking
14.13.5 Strategic Outlook
14.14 HAAG-STREIT GROUP
14.14.1 Company Snapshot
14.14.2 Company Overview
14.14.3 Product Benchmarking
14.14.4 Strategic Outlook
14.15 HEINE Optotechnik GmbH & Co. KG
14.15.1 Company Snapshot
14.15.2 Company Overview
14.15.3 Product Benchmarking
14.15.4 Strategic Outlook
14.16 Visionix
14.16.1 Company Snapshot
14.16.2 Company Overview
14.16.3 Product Benchmarking
14.16.4 Strategic Outlook
14.17 Sight Sciences
14.17.1 Company Snapshot
14.17.2 Company Overview
14.17.3 Financial Analysis
14.17.3.1 Net Revenue, 2017-2022
14.17.3.2 R&D, 2017-2022
14.17.4 Product Benchmarking
14.17.5 Strategic Outlook
14.18 LENSAR, Inc.
14.18.1 Company Snapshot
14.18.2 Company Overview
14.18.3 Financial Analysis
14.18.3.1 Net Revenue, 2017-2022
14.18.3.2 R&D, 2017-2022
14.18.3.3 Regional Market Shares, 2022
14.18.4 Product Benchmarking
14.18.5 Strategic Outlook
14.19 EssilorLuxottica
14.19.1 Company Snapshot
14.19.2 Company Overview
14.19.3 Financial Analysis
14.19.3.1 Net Revenue, 2017-2022
14.19.3.2 R&D, 2017-2022
14.19.3.3 Regional Market Shares, 2022
14.19.4 Product Benchmarking
14.19.5 Strategic Outlook
15 Conclusion and Recommendations
15.1 Concluding Remarks from Visiongain
15.2 Recommendations for Market Players
ページTOPに戻る
List of Tables/Graphs
List of Tables
Table 1 Ophthalmic Devices Market Snapshot, 2023 & 2033 (US$ Million, CAGR %)
Table 2 Ophthalmic Devices: Recent Major Mergers/Acquisitions & Funding
Table 3 Ophthalmic Instruments : Pricing List (US$)
Table 4 Global Ophthalmologic Devices Market Forecast by Region 2022-2032 (US$ Mn, AGR%, CAGR%): "V" Shaped Recovery
Table 5 Ophthalmic Devices Market Forecast by Region 2022-2032 (US$ Million, AGR%, CAGR%): "U" Shaped Recovery
Table 6 Global Ophthalmologic Devices Market Forecast by Region 2022-2032 (US$ Million, AGR%, CAGR%): "W" Shaped Recovery
Table 7 Global Ophthalmic Devices Market Forecast by Region 2022-2032 (US$ Million, AGR%, CAGR%): "L" Shaped Recovery
Table 8 Ophthalmic Devices Market Forecast by Vision Care by Type, 2023-2033 (US$ Million, AGR%, CAGR %)
Table 9 Spectacles Lenses Market Forecast by Region, 2023-2033 (US$ Million, AGR%, CAGR %)
Table 10 Contact Lenses Market Forecast by Region, 2023-2033 (US$ Million, AGR%, CAGR %)
Table 11 Contact Lenses Market Forecast by Type, 2023-2033 (US$ Million, AGR%, CAGR %)
Table 12 Ophthalmic Diagnostics & Monitoring Devices Market Forecast by Region, 2023-2033 (US$ Million, AGR%, CAGR %)
Table 13 Diagnostic Care & Monitoring Market Forecast by Type, 2023-2033 (US$ Million, AGR%, CAGR %)
Table 14 Specular Microscope Market Forecast by Region, 2023-2033 (US$ Million, AGR%, CAGR %)
Table 15 Fundus Camera Market Forecast by Region, 2023-2033 (US$ Million, AGR%, CAGR %)
Table 16 Major Players of OCT and OCT Imaging Systems
Table 17 Optical Coherence Tomography Scanner Market Forecast by Region, 2023-2033 (US$ Million, AGR%, CAGR %)
Table 18 Major Players of Visual Field Analyzers/ Perimeter
Table 19 Perimeter Market Forecast by Region, 2023-2033, (US$ Million, AGR%, CAGR %)
Table 20 Major Players of Optimeter and Optometry Systems
Table 21 Optical Biometer Market Forecast, By Region 2023-2033 (US$ Million, AGR%, CAGR %)
Table 22 Slit Lamps Market Forecast by Region, 2023-2033 (US$ Million, AGR%, CAGR %)
Table 23 Major Players of Auto-Refractometer and Auto-Refractometer Models
Table 24 Auto-Refractor Market Forecast by Region 2023-2033 (US$ Million, AGR%, CAGR %)
Table 25 Major Players of Tonometer and Tonometer Systems
Table 26 Tonometer Market Forecast by Region 2023-2033, (US$ Million, AGR%, CAGR %)
Table 27 Major Players of AB Ultrasound Systems
Table 28 Ophthalmic Ultrasound Imaging Systems Market Forecast, By Region, 2023-2033 (US$ Million, AGR%, CAGR %)
Table 29 Ophthalmoscope Market Forecast by Region 2023-2033, (US$ Million, AGR%, CAGR %)
Table 30 Chart Projectors Market by Region, 2023-2033 (US$ Million, AGR%, CAGR %)
Table 31 Major Players of corneal Topography Systems & Models
Table 32 Corneal Topography Systems Market, 2023-2033, By Region (US$ Million, AGR%, CAGR %)
Table 33 Major Players of Lensometer & Models
Table 34 Global Lensometers Market, 2023-2033, By Region (US$ Million, AGR%, CAGR %)
Table 35 Major Players of Wavefront/ Aberrometers & Models
Table 36 Wave Front Aberrometers Market Forecast by Region, 2023-2033 (US$ Million, AGR%, CAGR %)
Table 37 Other Ophthalmic Diagnostic Device Market, 2023-2033, By Region (US$ Million, AGR%, CAGR %)
Table 38 Ophthalmic Surgical Devices Market Forecast by Region, 2023-2033 (US$ Million, AGR%, CAGR %)
Table 39 Ophthalmic Surgical Devices Market Forecast by Type, 2023-2033 (US$ Million, AGR%, CAGR %)
Table 40 Cataract Surgery Devices Market, 2023-2033 (US$ Million, AGR%, CAGR %)
Table 41 Cataract Surgical Devices Forecast Market by Type, 2023-2033 (US$ Million, AGR%, CAGR %)
Table 42 Major Players of Cataract IOLs & IOLs (including. Pipeline IOLs)
Table 43 Major Players of OVDs & Commercial OVDs
Table 44 Major Players of YAG systems & Commercial YAG systems
Table 45 Vitrectomy Surgery Market Forecast by Region, 2023-2033, (US$ Million, AGR%, CAGR %)
Table 46 Vitreoretinal Surgery Devices Market Forecast by Type, 2023-2033 (US$ Million, AGR%, CAGR %)
Table 47 Refractive Surgery Devices Market Forecast by Region 2023-2033 (US$ Million, AGR%, CAGR %)
Table 48 Refractive Surgery Devices Forecast by Type, 2023-2033 (US$ Million, AGR%, CAGR %)
Table 49 Glaucoma Surgical Devices Market, 2023-2033 (US$ Million, AGR%, CAGR %)
Table 50 Glaucoma Surgical Devices Market Forecast by Type, 2023-2033 (US$ Million, AGR%, CAGR %)
Table 51 Major Players of Glaucoma Laser Systems & the Laser Technique
Table 52 Major Players of Glaucoma Tube Shunts & Models
Table 53 Ophthalmic OR Microscope Market Forecast by Region, 2023-2033 (US$ Million, AGR%, CAGR %)
Table 54 Major Players of Optimeter and Optometry Systems
Table 55 Other Surgical Devices Market Forecast by Region, 2023-2033 (US$ Million, AGR%, CAGR %)
Table 56 Global Ophthalmic Devices Market Forecast by End-Users, 2023-2033 (US$ Million, AGR%, CAGR %)
Table 57 Global Ophthalmic Devices End-Users Market Forecast by Region, 2023-2033 (US$ Million, AGR%, CAGR %)
Table 58 Hospitals Market Forecast by Region, 2023-2033 (US$ Million, AGR%, CAGR %)
Table 59 Diagnostic Clinics Market Forecast by Region, 2023-2033 (US$ Million, AGR%, CAGR %)
Table 60 Franchise Optical Stores Market Forecast by Region, 2023-2033 (US$ Million, AGR%, CAGR %)
Table 61 Eye Research Institutes Market Forecast by Region, 2023-2033 (US$ Million, AGR%, CAGR %)
Table 62 Government Agencies Market Forecast by Region, 2023-2033 (US$ Million, AGR%, CAGR %)
Table 63 Academics Market Forecast by Region, 2023-2033 (US$ Million, AGR%, CAGR %)
Table 64 Ophthalmic Devices Market Forecast by Region 2023-2033 (US$ Million, AGR%, CAGR %)
Table 65 North America Ophthalmic Devices Market Forecast by Country, 2023-2033 (US$ Million, AGR%, CAGR %)
Table 66 North America Ophthalmic Devices Market Forecast by Type, 2023-2033 (US$ Million, AGR%, CAGR %)
Table 67 North America Vision Care Devices Market Forecast by Type, 2023-2033 (US$ Million, AGR%, CAGR %)
Table 68 North America Diagnostic Care & Monitoring Devices Market Forecast by Type, 2023-2033 (US$ Million, AGR%, CAGR %)
Table 69 North America Surgical Devices Market Forecast by Type, 2023-2033 (US$ Mn, AGR%, CAGR %)
Table 70 North America Ophthalmic Devices Market Forecast by End-Users, 2023-2033 (US$ Million, AGR%, CAGR %)
Table 71 U.S. Ophthalmic Devices Market Forecast, 2023-2033 (US$ Million, AGR%, CAGR %)
Table 72 Canada Ophthalmic Devices Market Forecast, 2023-2033 (US$ Million, AGR%, CAGR %)
Table 73 Europe Ophthalmic Devices Market Forecast by Country, 2023-2033 (US$ Mn, AGR%, CAGR %)
Table 74 Europe Ophthalmic Devices Market Forecast by Type, 2023-2033 (US$ Million, AGR%, CAGR %)
Table 75 Europe Vision Care Devices Market Forecast by Type, 2023-2033 (US$ Million, AGR%, CAGR %)
Table 76 Europe Diagnostic Care & Monitoring Devices Market Forecast by Type, 2023-2033 (US$ Million, AGR%, CAGR %)
Table 77 Europe Surgical Devices Market Forecast by Type, 2023-2033 (US$ Million, AGR%, CAGR %)
Table 78 Europe Ophthalmic Devices Market Forecast by End-Users, 2023-2033 (US$ Million, AGR%, CAGR %)
Table 79 Germany Ophthalmology Market Forecast, 2023-2033 (US$ Million, AGR%, CAGR %)
Table 80 UK Ophthalmology Market Forecast, 2023-2033 (US$ Mn, AGR%, CAGR %)
Table 81 France Ophthalmology Market Forecast, 2023-2033 (US$ Million, AGR%, CAGR %)
Table 82 Italy Ophthalmology Market Forecast, 2023-2033 (US$ Million, AGR%, CAGR %)
Table 83 Spain Ophthalmology Market Forecast, 2023-2033 (US$ Million, AGR%, CAGR %)
Table 84 Rest of Europe Ophthalmology Market Forecast, 2022-2032 (US$ Million, AGR%, CAGR %)
Table 85 Asia Pacific Ophthalmic Devices Market Forecast by Country, 2023-2033 (US$ Million, AGR%, CAGR %)
Table 86 Asia Pacific Ophthalmic Devices Market Forecast by Type, 2023-2033 (US$ Million, AGR%, CAGR %)
Table 87 Asia Pacific Vision Care Devices Market Forecast by Type, 2023-2033 (US$ Million, AGR%, CAGR %)
Table 88 Asia Pacific Diagnostic Care & Monitoring Devices Market Forecast by Type, 2023-2033 (US$ Million, AGR%, CAGR %)
Table 89 Asia Pacific Surgical Devices Market Forecast by Type, 2023-2033 (US$ Million, AGR%, CAGR %)
Table 90 Asia Pacific Ophthalmic Devices Market Forecast by End-Users, 2023-2033 (US$ Million, AGR%, CAGR %)
Table 91 Japan Ophthalmic Devices Market Forecast, 2023-2033 (US$ Million, AGR%, CAGR %)
Table 92 China Ophthalmology Market Forecast, 2023-2033 (US$ Million, AGR%, CAGR %)
Table 93 India Ophthalmology Market Forecast, 2023-2033 (US$ Million, AGR%, CAGR %)
Table 94 South Korea Ophthalmic Devices Market Forecast, 2023-2033 (US$ Million, AGR%, CAGR %)
Table 95 Australia Ophthalmologic Devices Market Forecast, 2023-2033 (US$ Million, AGR%, CAGR %)
Table 96 Rest of Asia Pacific Ophthalmology Market Forecast, 2023-2033 (US$ Million, AGR%, CAGR %)
Table 97 Latin America Ophthalmic Devices Market Forecast by Country, 2023-2033 (US$ Million, AGR%, CAGR %)
Table 98 Latin America Ophthalmic Devices Market Forecast by Type, 2023-2033 (US$ Million, AGR%, CAGR %)
Table 99 Latin America Vision Care Devices Market Forecast by Type, 2023-2033 (US$ Million, AGR%, CAGR %)
Table 100 Latin America Diagnostic Care & Monitoring Market Forecast by Type, 2023-2033 (US$ Million, AGR%, CAGR %)
Table 101 Latin America Surgical Devices Market Forecast by Type, 2023-2033 (US$ Million, AGR%, CAGR %)
Table 102 Latin America Ophthalmic Devices Market Forecast by End-Users, 2023-2033 (US$ Million, AGR%, CAGR %)
Table 103 Brazil Ophthalmic Devices Market Forecast, 2023-2033 (US$ Million, AGR%, CAGR %)
Table 104 Mexico Ophthalmologic Devices Market Forecast, 2023-2033 (US$ Million, AGR%, CAGR %)
Table 105 Rest of Latin America Ophthalmic Devices Market Forecast, 2023-2033 (US$ Million, AGR%, CAGR %)
Table 106 Middle East & Africa Ophthalmic Devices Market Forecast by Country, 2023-2033 (US$ Mn, AGR%, CAGR %)
Table 107 Middle East & Africa Ophthalmic Devices Market Forecast by Type, 2023-2033 (US$ Million, AGR%, CAGR %)
Table 108 Middle East & Africa Vision Care Devices Market Forecast by Type, 2023-2033 (US$ Million, AGR%, CAGR %)
Table 109 Middle East & Africa Diagnostic Care & Monitoring Devices Market Forecast by Type, 2023-2033 (US$ Million, AGR%, CAGR %)
Table 110 Middle East & Africa Surgical Devices Market Forecast by Type, 2023-2033 (US$ Mn, AGR%, CAGR %)
Table 111 Middle East & Africa Ophthalmic Devices Market Forecast by End-Users, 2023-2033 (US$ Million, AGR%, CAGR %)
Table 112 GCC Ophthalmic Devices Market Forecast, 2023-2033 (US$ Million, AGR%, CAGR %)
Table 113 South Africa Ophthalmic Devices Market Forecast, 2023-2033 (US$ Million, AGR%, CAGR %)
Table 114 Rest of MEA Ophthalmic Devices Market Forecast, 2023-2033 (US$ Mn, AGR%, CAGR %)
Table 115 Strategic Outlook
Table 116 Alcon: Key Details, (CEO, HQ, Revenue, Founded, No. of Employees, Company Type, Website, Business Segment)
Table 117 Alcon: Product Benchmarking
Table 118 Alcon: Strategic Outlook
Table 119 Glaukos Corporation: Key Details, (CEO, HQ, Revenue, Founded, No. of Employees, Company Type, Website, Business Segment)
Table 120 Glaukos Corp: Product Benchmarking
Table 121 Glaukos Corporation: Strategic Outlook
Table 122 STAAR SURGICAL: Key Details, (CEO, HQ, Revenue, Founded, No. of Employees, Company Type, Website, Business Segment)
Table 123 STAAR SURGICAL: Product Benchmarking
Table 124 STAAR SURGICAL: Strategic Outlook
Table 125 Ziemer Ophthalmic Systems AG: Key Details, (CEO, HQ, Revenue, Founded, No. of Employees, Company Type, Website, Business Segment)
Table 126 Ziemer Ophthalmic Systems AG: Product Benchmarking
Table 127 Ziemer Ophthalmic Systems AG: Strategic Outlook
Table 128 Lumenis Be Ltd.: Key Details, (CEO, HQ, Revenue, Founded, No. of Employees, Company Type, Website, Business Segment)
Table 129 Lumenis Be Ltd.: Product Benchmarking
Table 130 Lumenis Be Ltd.: Strategic Outlook
Table 131 Ophtec BV: Key Details, (CEO, HQ, Revenue, Founded, No. of Employees, Company Type, Website, Business Segment)
Table 132 Ophtec BV: Product Benchmarking
Table 133 Ophtec BV: Strategic Outlook
Table 134 Carl Zeiss Meditec AG: Key Details, (CEO, HQ, Revenue, Founded, No. of Employees, Company Type, Website, Business Segment)
Table 135 Carl Zeiss Meditec AG: Product Benchmarking
Table 136 Carl Zeiss Meditec AG: Strategic Outlook
Table 137 Johnson & Johnson Vision: Key Details, (CEO, HQ, Revenue, Founded, No. of Employees, Company Type, Website, Business Segment)
Table 138 Johnson & Johnson Vision: Product Benchmarking
Table 139 Johnson & Johnson Vision: Strategic Outlook
Table 140 CooperVision: Key Details, (CEO, HQ, Revenue, Founded, No. of Employees, Company Type, Website, Business Segment)
Table 141 CooperVision: Product Benchmarking
Table 142 CooperVision: Strategic Outlook
Table 143 NIDEK CO., LTD.: Key Details, (CEO, HQ, Revenue, Founded, No. of Employees, Company Type, Website, Business Segment)
Table 144 NIDEK CO., LTD.: Product Benchmarking
Table 145 NIDEK CO., LTD.: Strategic Outlook
Table 146 Sonomed Escalon : Key Details, (CEO, HQ, Revenue, Founded, No. of Employees, Company Type, Website, Business Segment)
Table 147 Sonomed Escalon: Product Benchmarking
Table 148 Sonomed Escalon: Strategic Outlook
Table 149 HAAG-STREIT GROUP: Key Details, (CEO, HQ, Revenue, Founded, No. of Employees, Company Type, Website, Business Segment)
Table 150 HAAG-STREIT Group: Product Benchmarking
Table 151 HAAG-STREIT Group: Strategic Outlook
Table 152 HEINE Optotechnik GmbH & Co. KG: Key Details, (CEO, HQ, Revenue, Founded, No. of Employees, Company Type, Website, Business Segment)
Table 153 HEINE Optotechnik GmbH & Co. KG: Product Benchmarking
Table 154 HEINE Optotechnik GmbH & Co. KG: Strategic Outlook
Table 155 Visionix: Key Details, (CEO, HQ, Revenue, Founded, No. of Employees, Company Type, Website, Business Segment)
Table 156 Visionix: Product Benchmarking
Table 157 Visionix: Strategic Outlook
Table 158 Sight Sciences: Key Details, (CEO, HQ, Revenue, Founded, No. of Employees, Company Type, Website, Business Segment)
Table 159 Sight Sciences: Product Benchmarking
Table 160 Sight Sciences: Strategic Outlook
Table 161 LENSAR, Inc.: Key Details, (CEO, HQ, Revenue, Founded, No. of Employees, Company Type, Website, Business Segment)
Table 162 LENSAR, Inc.: Product Benchmarking
Table 163 LENSAR, Inc.: Strategic Outlook
Table 164 EssilorLuxottica: Key Details, (CEO, HQ, Revenue, Founded, No. of Employees, Company Type, Website, Business Segment)
Table 165 EssilorLuxottica: Product Benchmarking
Table 166 EssilorLuxottica: Strategic Outlook
List of Figures
Figure 1 Ophthalmic Devices Market Segmentation
Figure 2 Ophthalmic Vision Care Devices by Type : Market Attractiveness Index
Figure 3 Ophthalmic Diagnostics Care & Monitoring Devices by Type: Market Attractiveness Index
Figure 4 Ophthalmic Surgical Devices by Type: Market Attractiveness Index
Figure 5 Ophthalmic Devices Market Attractiveness Index by End-users
Figure 6 Ophthalmic Devices Market Attractiveness Index by Region
Figure 7 Ophthalmic Devices Market: Market Dynamics
Figure 8 Ophthalmic Devices Market by Region, 2023-2033 (US$ Million, AGR (%), CAGR (%)): “V” Shaped Recovery
Figure 9 Ophthalmic Devices Market by Region, 2023-2033 (US$ Million, AGR% ,CAGR %): “U” Shaped Recovery
Figure 10 Ophthalmic Devices Market by Region, 2023-2033 (US$ Million, AGR %, CAGR %): “W” Shaped Recovery
Figure 11 Ophthalmic Devices Market by Region, 2023-2033 (US$ Million, AGR %, CAGR %): “L” Shaped Recovery
Figure 12 Ophthalmic Devices : Market: Porter’s Five Forces Analysis
Figure 13 Global Ophthalmic Market: PEST Analysis
Figure 14 Ophthalmic Vision Care Devices: Market Attractiveness Index
Figure 15 Spectacle Lenses Market Share, 2022 (%)
Figure 16 Contact Lenses Market Share Analysis, 2022 (%)
Figure 17 Ophthalmic Vision Care Devices Market Forecast by Type, 2023-2033 (US$ Million, AGR %)
Figure 18 Ophthalmic Vision Care Devices Market Share Forecast by Type, 2023, 2028, 2033 (%)
Figure 19 Spectacle Lenses Market Forecast by Region, 2023-2033 (US$ Million, AGR %)
Figure 20 Spectacle Lenses Market Forecast by Region, 2023 &2033 (%)
Figure 21 Contact Lenses Market Forecast by Region, 2023-2033 (US$ Million, AGR %)
Figure 22 Contact Lenses Market Forecast by Region, 2023 & 2033 (%)
Figure 23 Spherical Contact Lenses Market Forecast by Region, 2023-2033 (US$ Million, AGR %)
Figure 24 Toric Contact Lenses Market Forecast by Region, 2023-2033 (US$ Million, AGR %)
Figure 25 Multifocal Contact Lenses Market Forecast by Region, 2023-2033 (US$ Million, AGR %)
Figure 26 Ophthalmic Diagnostics Care & Monitoring Devices: Market Attractiveness Index
Figure 27 Ophthalmic Diagnostics & Monitoring Devices Market, By Market Share, 2022 (%)
Figure 28 Ophthalmic Diagnostics & Monitoring Devices Market Forecast by Region, 2023-2033 (US$ Million, AGR %)
Figure 29 Diagnostic Care & Monitoring Market Forecast by Type, 2023-2033 (US$ Million, AGR %)
Figure 30 Diagnostic Care & Monitoring Market Share Forecast by Type, 2023, 2028, 2033 (%)
Figure 31 Specular Microscope Market Forecast by Region, 2023-2033 (US$ Million, AGR %)
Figure 32 Specular Microscope Market by Region, 2023 & 2033 (%)
Figure 33 Fundus Cameras Market Forecast by Region, 2023-2033 (US$ Million, AGR %)
Figure 34 Fundus Camera Market by Region, 2023 & 2033 (%)
Figure 35 Optical Coherence Tomography Scanner Market Forecast by Region, 2023-2033 (US$ million, AGR %)
Figure 36 Optical Coherence Tomography Scanner Share Forecast by Region, 2023 & 2033 (%)
Figure 37 Perimeter Market Forecast by Region, 2023-2033 (US$ Million, AGR %)
Figure 38 Perimeter Market Share Forecast by Region, 2023 & 2033 (%)
Figure 39 Optical Biometer Market Forecast by Region, 2023-2033 (US$ million, AGR %)
Figure 40 Optical Biometer Market Share Forecast by Region, 2023 & 2033 (%)
Figure 41 Slit Lamps Market Forecast by Region, 2023-2033 (US$ Million, AGR %)
Figure 42 Slit Lamps Market Share Forecast by Region, 2023 & 2033 (%)
Figure 43 Auto-Refractor Market Forecast by Region, 2023-2033 (US$ Million, AGR %)
Figure 44 Auto-Refractor Market Share Forecast by Region, 2023 & 2033 (%)
Figure 45 Tonometer Market Forecast by Region, 2023-2033 (US$ Million, AGR %)
Figure 46 Tonometer Market Share Forecast by Region, 2023 & 2033 (%)
Figure 47 Ophthalmic Ultrasound Imaging Systems Market Forecast by Region, 2023-2033 (US$ Million, AGR %)
Figure 48 Ophthalmic Ultrasound Imaging Systems Market Share Forecast by Region, 2023 & 2033 (%)
Figure 49 Ophthalmoscope Market Forecast by Region, 2023-2033 (US$ Million, AGR %)
Figure 50 Ophthalmoscope Market Share Forecast by Region, 2023 & 2033 (%)
Figure 51 Chart Projectors Market Forecast by Region, 2023-2033 (US$ Million, AGR %)
Figure 52 Chart Projectors Market Share Forecast by Region, 2023 & 2033 (%)
Figure 53 Corneal Topography Systems Market Forecast by Region, 2023-2033 (US$ Million, AGR %)
Figure 54 Corneal Topography Systems Market Share Forecast by Region, 2023 & 2033 (%)
Figure 55 Lensometer Market Forecast by Region, 2023-2033 (US$ Million, AGR %)
Figure 56 Lensometer Market Share Forecast by Region, 2023 & 2033 (%)
Figure 57 Wave Front Aberrometers Market Forecast by Region, 2023-2033 (US$ Million, AGR %)
Figure 58 Wave Front Aberrometers Market Share Forecast by Region, 2023 & 2033 (%)
Figure 59 Others Market Forecast by Region, 2023-2033 (US$ Million, AGR %)
Figure 60 Others Market Share Forecast by Region, 2023 & 2033 (%)
Figure 61 Ophthalmic Surgical Devices: Market Attractiveness Index
Figure 62 Ophthalmic Surgical Devices Market, By Market Share, 2022 (%)
Figure 63 Ophthalmic Surgical Devices Market Forecast by Region, 2023-2033 (US$ Million, AGR %)
Figure 64 Ophthalmic Surgical Devices Market Forecast by Type, 2023-2033 (US$ Million, AGR%, CAGR %)
Figure 65 Ophthalmic Surgical Devices Market Share Forecast by Type, 2023, 2028, 2033 (%)
Figure 66 Cataract Surgery Market Forecast by Region, 2023-2033(US$ Million, AGR %)
Figure 67 Cataract Surgery Market by Region, 2023 & 2033 (%)
Figure 68 Cataract IOLs Market Forecast by Region, 2023-2033(US$ Million, AGR%)
Figure 69 IOLs Injectors Market Forecast by Region, 2023-2033(US$ Million, AGR %)
Figure 70 OVDs Market Forecast by Region, 2023-2033(US$ Million, AGR %)
Figure 71 Femtosecond Laser Cataract System (FLACS) Market Forecast by Region, 2023-2033(US$ Million, AGR %)
Figure 72 Nd: YAG Laser System Market Forecast by Region, 2023-2033(US$ Million, AGR %)
Figure 73 Phacoemulsification Devices Market Forecast by Region, 2023-2033(US$ Million, AGR%)
Figure 74 Vitrectomy Surgery Market Forecast by Region, 2023-2033(US$ million)
Figure 75 Vitrectomy Surgery Market Share Forecast by Region (%)
Figure 76 Vitrectomy Probes Market Forecast by Region, 2023-2033(US$ Million)
Figure 77 Retinal Implants (IOLs) Market Forecast by Region, 2023-2033 (US$ Million, AGR %)
Figure 78 Vitrectomy Machines Market Forecast by Region, 2023-2033 (US$ Million, AGR %)
Figure 79 Vitrectomy Packs Market Forecast by Region, 2023-2033(US$ Million, AGR %)
Figure 80 Photocoagulation Lasers Market Forecast by Region, 2023-2033(US$ Million, AGR %)
Figure 81 Illumination Devices Market Forecast by Region, 2023-2033(US$ Million, AGR %)
Figure 82 Refractive Surgery Devices Market Forecast by Region, 2023-2033 (US$ Million, AGR %)
Figure 83 Refractive Surgery Devices Market Forecast by Region, 2023 & 2033 (%)
Figure 84 Femtosecond Laser Refractive Surgery Devices Market Forecast by Region, 2023-2033(US$ Million, AGR %)
Figure 85 Excimer Laser Refractive Surgery Devices Market Forecast by Region, 2023-2033(US$ Million, AGR %)
Figure 86 Phakic IOLs Market Forecast by Region, 2023-2033(US$ Million, AGR %)
Figure 87 Refractive Lens Exchange (RLE) Market Forecast by Region, 2023-2033(US$ million)
Figure 88 Mechanical Keratome Market Forecast by Region, 2023-2033(US$ Million, AGR %)
Figure 89 Other Refractive Surgery Devices Market Forecast by Region, 2023-2033(US$ Million, AGR %)
Figure 90 Glaucoma Surgical Devices Market Forecast by Region, 2023-2033(US$ Million, AGR %)
Figure 91 Glaucoma Surgical Devices Market Forecast by Region, 2023 & 2033 (%)
Figure 92 Glaucoma Laser Surgical Devices Market Forecast by Region, 2023-2033(US$ Million, AGR %)
Figure 93 Trab Adjunctive Devices Market Forecast by Region, 2023-2033(US$ Million)
Figure 94 Canal Surgical Devices Market Forecast by Region, 2023-2033(US$ Million, AGR %)
Figure 95 Subconjunctival shunts Market Forecast by Region, 2023-2033(US$ Million, AGR %)
Figure 96 Tube Shunts Devices Market Forecast by Region, 2023-2033(US$ Million, AGR %)
Figure 97 Microstents (MIGS) Market Forecast by Region, 2023-2033 (US$ Million, AGR %)
Figure 98 Ophthalmic OR Microscope Market Forecast by Region, 2023-2033 (US$ Million, AGR %)
Figure 99 Ophthalmic OR Microscope Market Share Forecast by Region, 2023 & 2033 (%)
Figure 100 Other Surgical Devices Market Forecast by Region, 2023-2033 (US$ Million, AGR %)
Figure 101 Other Surgical Devices Market Share Forecast by Region, 2023 & 2033 (%)
Figure 102 Ophthalmic Devices Market, By End -users: Market Attractiveness Index
Figure 103 Ophthalmic Devices End-Users Market Forecast by Region, 2023-2033 (US$ Million, AGR %)
Figure 104 Hospitals Market Forecast by Region, 2023-2033 (US$ Million, AGR %)
Figure 105 Hospital Market Share Forecast by Region, 2023 & 2033 (%)
Figure 106 Diagnostic Clinics Market Forecast by Region, 2023-2033 (US$ Million, AGR %)
Figure 107 Diagnostic Clinics Forecast by Region, 2023 & 2033 (%)
Figure 108 Franchise Optical Stores Market Share Forecast by Region, 2023 & 2033 (%)
Figure 109 Franchise Optical Stores Market Forecast by Region, 2023-2033 (US$ Million, AGR %)
Figure 110 Eye Research Institutes Market Forecast by Region, 2023-2033 (US$ Million, AGR %)
Figure 111 Franchise Optical Stores Forecast by Region, 2023 & 2033 (%)
Figure 112 Government Agencies Market Forecast by Region, 2023-2033 (US$ Million, AGR %)
Figure 113 Government Institutes Market Share Forecast by Region, 2023 & 2033 (%)
Figure 114 Academics Market Share Forecast by Region, 2023 & 2033 (%)
Figure 115 Ophthalmic Devices Market Forecast by Region 2023 and 2033 (Revenue, CAGR %)
Figure 116 Ophthalmic Devices Market Share Forecast by Region 2023, 2028, 2033 (%)
Figure 117 Ophthalmic Devices Market Forecast by Region, 2023-2033 (US$ Million, AGR %)
Figure 118 North America Ophthalmic Devices Market Attractiveness Index
Figure 119 North America Ophthalmic Devices Market by Country, 2023, 2028 & 2033 (US$ Million)
Figure 120 North America Ophthalmic Devices Market Forecast by Country, 2023-2033 (US$ Million, AGR %)
Figure 121 North America Ophthalmic Devices Market Share Forecast by Country, 2023 & 2033 (%)
Figure 122 North America Ophthalmic Devices Market Forecast by Type, 2023-2033 (US$ Million, AGR %)
Figure 123 North America Ophthalmic Devices Market Share Forecast by Type, 2023 & 2033 (%)
Figure 124 North America Vision Care Devices Market Forecast by Type, 2023-2033 (US$ Million, AGR %)
Figure 125 North America Vision Care Devices Market Share Forecast by Type, 2023 & 2033 (%)
Figure 126 North America Diagnostic Care & Monitoring Devices Market Forecast by Type, 2023-2033 (US$ Million, AGR %)
Figure 127 North America Diagnostic Care & Monitoring Devices Market Share Forecast by Type, 2023 & 2033 (%)
Figure 128 North America Surgical Devices Market Share Forecast by Type, 2023 & 2033 (%)
Figure 129 North America Ophthalmic Devices Market Forecast by End-Users, 2023-2033 (US$ Million, AGR %)
Figure 130 North America Ophthalmic Devices Market Share Forecast by End-Users, 2023 & 2033 (%)
Figure 131 U.S. Ophthalmic Devices Market Forecast, 2023-2033 (US$ Million, AGR %)
Figure 132 Canada Ophthalmic Devices Market Forecast, 2023-2033 (US$ Million, AGR %)
Figure 133 Europe Ophthalmic Devices Market Attractiveness Index
Figure 134 Europe Ophthalmic Devices Market by Country, 2023, 2028 & 2033 (US$ Million)
Figure 135 Europe Ophthalmic Devices Market Forecast by Country, 2023-2033 (US$ Million, AGR %)
Figure 136 Europe Ophthalmic Devices Market Share Forecast by Country, 2023 & 2033 (%)
Figure 137 Europe Ophthalmic Devices Market Forecast by Type, 2023-2033 (US$ Million, AGR %)
Figure 138 Europe Ophthalmic Devices Market Share Forecast by Type, 2023 & 2033 (%)
Figure 139 Europe Vision Care Devices Market Forecast by Type, 2023-2033 (US$ Million, AGR %)
Figure 140 Europe Ophthalmic Vision Care Devices Market Share Forecast by Type, 2023 & 2033 (%)
Figure 141 Europe Diagnostic Care & Monitoring Devices Market Forecast by Type, 2023-2033 (US$ Million, AGR %)
Figure 142 Europe Diagnostic Care & Monitoring Devices Market Share Forecast by Type, 2023 & 2033 (%)
Figure 143 Europe Surgical Devices Market Forecast by Type, 2023-2033 (US$ Million, AGR %)
Figure 144 Europe Surgical Devices Market Share Forecast by Type, 2023 & 2033 (%)
Figure 145 Europe Ophthalmic Devices Market Forecast by End-Users, 2023-2033 (US$ Million, AGR %)
Figure 146 Europe Ophthalmic Devices Market Share Forecast by End-Users, 2023 & 2033 (%)
Figure 147 Germany Ophthalmic Devices Market Forecast, 2023-2033 (US$ Million, AGR %)
Figure 148 UK Ophthalmic Devices Market Forecast, 2023-2033 (US$ Million, AGR %)
Figure 149 France Ophthalmic Devices Market Forecast, 2023-2033 (US$ Million, AGR %)
Figure 150 Italy Ophthalmic Devices Market Forecast, 2023-2033 (US$ Million, AGR %)
Figure 151 Spain Ophthalmic Devices Market Forecast, 2023-2033 (US$ Million, AGR %)
Figure 152 Rest of Europe Ophthalmic Devices Market Forecast, 2023-2033 (US$ Million, AGR %)
Figure 153 Asia Ophthalmic Devices Market Attractiveness Index
Figure 154 Asia Ophthalmic Devices Market by Country, 2023, 2028 & 2033 (US$ Million)
Figure 155 Asia Pacific Ophthalmic Devices Market Forecast by Country, 2023-2033 (US$ Million, AGR %)
Figure 156 Asia Pacific Ophthalmic Devices Market Share Forecast by Country, 2023 & 2033 (%)
Figure 157 Asia Ophthalmic Devices Market Forecast by Type, 2023-2033 (US$ Million, AGR %)
Figure 158 Asia Ophthalmic Devices Market Share Forecast by Type, 2023 & 2033 (%)
Figure 159 Asia Ophthalmic Vision Care Devices Market Forecast by Type, 2023-2033 (US$ Million, AGR %)
Figure 160 Asia Vision Care Devices Market Share Forecast by Type, 2023 & 2033 (%)
Figure 161 Asia Diagnostic Care & Monitoring Devices Market Forecast by Type, 2023-2033 (US$ Million, AGR %)
Figure 162 Asia Ophthalmic Diagnostic Care & Monitoring Devices Market Share Forecast by Type, 2023 & 2033 (%)
Figure 163 Asia Surgical Devices Market Forecast by Type, 2023-2033 (US$ Million, AGR %)
Figure 164 Asia Surgical Devices Market Share Forecast by Type, 2023 & 2033 (%)
Figure 165 Asia Ophthalmic Devices Market Forecast by End-Users, 2023-2033 (US$ Million, AGR %)
Figure 166 Asia Ophthalmic Devices Market Share Forecast by End-Users, 2023 & 2033 (%)
Figure 167 Japan Ophthalmic Devices Market Forecast, 2023-2033 (US$ Million, AGR %)
Figure 168 China Ophthalmic Devices Market Forecast, 2023-2033 (US$ Million, AGR %)
Figure 169 India Ophthalmic Devices Market Forecast, 2023-2033 (US$ Million, AGR %)
Figure 170 South Korea Ophthalmic Devices Market Forecast, 2023-2033 (US$ Million, AGR %)
Figure 171 Australia Ophthalmic Devices Market Forecast, 2023-2033 (US$ Million, AGR %)
Figure 172 Rest of Asia Pacific Ophthalmic Devices Market Forecast, 2023-2033 (US$ Million, AGR %)
Figure 173 Latin America Ophthalmic Devices Market Attractiveness Index
Figure 174 Latin America Ophthalmic Devices Market by Country, 2023, 2028 & 2033 (US$ Million)
Figure 175 Latin America Ophthalmic Devices Market Forecast by Country, 2023-2033 (US$ Million, AGR %)
Figure 176 Latin America Ophthalmic Devices Market Share Forecast by Country, 2023 & 2033 (%)
Figure 177 Latin America Ophthalmic Devices Market Forecast by Type, 2023-2033 (US$ Million, AGR %)
Figure 178 Latin America Ophthalmic Devices Market Share Forecast by Type, 2023 & 2033 (%)
Figure 179 Latin America Vision Care Devices Market Forecast by Type, 2023-2033 (US$ Million, AGR %)
Figure 180 Latin America Vision Care Devices Market Share Forecast by Type, 2023 & 2033 (%)
Figure 181 Latin America Ophthalmic Devices Market Forecast by Diagnostic Care & Monitoring, By Type, 2023-2033 (US$ Million, AGR %)
Figure 182 Latin America Diagnostic Care & Monitoring Devices Market Share Forecast by Type, 2023 & 2033 (%)
Figure 183 Latin America Surgical Devices Market Forecast by Type, 2023-2033 (US$ Million, AGR %)
Figure 184 Latin America Surgical Devices Market Share Forecast by Type, 2023 & 2033 (%)
Figure 185 Latin America Ophthalmic Devices Market Forecast by End-Users, 2023-2033 (US$ Million, AGR %)
Figure 186 Latin America Ophthalmic Devices Market Share Forecast by End-Users, 2023 & 2033 (%)
Figure 187 Brazil Ophthalmic Devices Market Forecast, 2023-2033 (US$ Million, AGR %)
Figure 188 Mexico Ophthalmic Devices Market Forecast, 2023-2033 (US$ Million, AGR %)
Figure 189 Rest of Latin America Ophthalmic Devices Market Forecast, 2023-2033 (US$ Million, AGR %)
Figure 190 Middle East & Africa Ophthalmic Devices Market Attractiveness Index
Figure 191 Middle East & Africa Ophthalmic Devices Market by Country, 2023, 2028 & 2033 (US$ Million)
Figure 192 Middle East & Africa Ophthalmic Devices Market Forecast by Country, 2023-2033 (US$ Million, AGR %)
Figure 193 Middle East & Africa Ophthalmic Devices Market Share Forecast by Country, 2023 & 2033 (%)
Figure 194 Middle East & Africa Ophthalmic Devices Market Forecast by Type, 2023-2033 (US$ Million, AGR %)
Figure 195 Middle East & Africa Ophthalmic Devices Market Share Forecast by Type, 2023 & 2033 (%)
Figure 196 Middle East & Africa Vision Care Devices Market Forecast by Type, 2023-2033 (US$ Million, AGR %)
Figure 197 Middle East & Africa Vision Care Devices Market Share Forecast by Type, 2023 & 2033 (%)
Figure 198 Middle East & Africa Diagnostic Care & Monitoring, Devices Market Forecast by Type, 2023-2033 (US$ Million, AGR %)
Figure 199 Middle East & Africa Diagnostic Care & Monitoring Devices Market Share Forecast by, Type, 2023 & 2033 (%)
Figure 200 Middle East & Africa Surgical Devices Market Forecast by Type, 2023-2033 (US$ Million, AGR %)
Figure 201 Middle East & Africa Surgical Devices Market Share Forecast by Type, 2023 & 2033 (%)
Figure 202 Middle East & Africa Ophthalmic Devices Market Forecast by End-Users, 2023-2033 (US$ Million, AGR %)
Figure 203 Middle East & Africa Ophthalmic Devices Market Share Forecast by End-Users, 2023 & 2033 (%)
Figure 204 GCC Ophthalmic Devices Market Forecast, 2023-2033 (US$ Million, AGR %)
Figure 205 South Africa Ophthalmic Devices Market Forecast, 2023-2033 (US$ Million, AGR %)
Figure 206 Rest of MEA Ophthalmic Devices Market Forecast, 2023-2033 (US$ Million, AGR %)
Figure 207 Ophthalmic Devices Market: Company Share, 2022
Figure 208 Alcon: Net Revenue, 2017-2022 (US$ Million, AGR %)
Figure 209 Alcon: R&D, 2017-2022 (US$ Million, AGR %)
Figure 210 Alcon: Regional Market Shares, 2022
Figure 211 Alcon: Surgical Vision Care Revenues, 2017-2022 (US$ Million, AGR %)
Figure 212 Alcon: Vision Care Revenues, 2017-2022 (US$ Million, AGR %)
Figure 213 Glaukos Corporation: Net Revenue, 2017-2022 (US$ Million, AGR %)
Figure 214 Glaukos Corporation: R&D, 2017-2022 (US$ Million, AGR %)
Figure 215 Glaukos Corporation: Regional Market Shares, 2022
Figure 216 Glaukos Corporation: Segmental Revenues, 2017-2022 (US$ Million, AGR %)
Figure 217 STAAR SURGICAL: Net Revenue, 2017-2022 (US$ Million, AGR %)
Figure 218 STAAR SURGICAL: R&D, 2017-2022 (US$ Million, AGR %)
Figure 219 STAAR SURGICAL: Regional Market Shares, 2022
Figure 220 Carl Zeiss Meditec AG: Company Revenue 2017-2022 (US$ Million, AGR %)
Figure 221 Carl Zeiss Meditec AG: R&D 2017-2022 (US$ Million, AGR %)
Figure 222 Carl Zeiss Meditec AG: Regional Market Shares, 2022
Figure 223 Johnson & Johnson Vision: Company Revenue 2017-2022 (US$ Million, AGR %)
Figure 224 Johnson & Johnson Vision: R&D 2017-2022 (US$ Million, AGR %)
Figure 225 Johnson & Johnson Vision: Regional Market Shares, 2022
Figure 226 Johnson & Johnson Vision: Segmental Revenue 2017-2022 (US$ Million, AGR %)
Figure 227 Johnson & Johnson Vision: Company Revenue 2017-2022 (US$ Million, AGR %)
Figure 228 CooperVision: Company Revenue 2017-2022 (US$ Million, AGR %)
Figure 229 CooperVision: R&D 2017-2022 (US$ Million, AGR %)
Figure 230 CooperVision: Regional Market Shares, 2022
Figure 231 NIDEK CO., LTD.: Company Revenue 2017-2022 (US$ Million, AGR %)
Figure 232 NIDEK CO., LTD.: Regional Market Share 2022 (%)
Figure 233 Sonomed Escalon: Company Revenue 2017-2022 (US$ Million, AGR %)
Figure 234 Sonomed Escalon.: R&D 2017-2022 (US$ Million, AGR %)
Figure 235 Sonomed Escalon: Regional Market Shares, 2022
Figure 236 Sight Sciences: Net Revenue, 2018-2022 (US$ Million, AGR %)
Figure 237 Sight Sciences: R&D Expenses, 2018-2022 (US$ Million, AGR %)
Figure 238 LENSAR, Inc.: Net Revenue, 2019-2022 (US$ Million, AGR %)
Figure 239 LENSAR Inc.: R&D Expenses, 2018-2022 (US$ Million, AGR %)
Figure 240 LENSAR Inc.: Regional Market Shares, 2022
Figure 241 EssilorLuxottica: Net Revenue, 2017-2022 (US$ Million, AGR %)
Figure 242 EssilorLuxottica: R&D, 2017-2022 (US$ Million, AGR %)
Figure 243 EssilorLuxottica Inc.: Regional Market Shares, 2022
ページTOPに戻る
関連レポート(キーワード「医療機器」)
よくあるご質問
Visiongain社はどのような調査会社ですか?
英国の調査会社ヴィジョンゲイン社(Visiongain)は、通信とエネルギーのほか、自動車や化学・医薬品、金属など、広範な市場を対象に調査を行っています。自動車市場については、市場全般に関する調査のほ... もっと見る
調査レポートの納品までの日数はどの程度ですか?
在庫のあるものは速納となりますが、平均的には 3-4日と見て下さい。
但し、一部の調査レポートでは、発注を受けた段階で内容更新をして納品をする場合もあります。
発注をする前のお問合せをお願いします。
注文の手続きはどのようになっていますか?
1)お客様からの御問い合わせをいただきます。
2)見積書やサンプルの提示をいたします。
3)お客様指定、もしくは弊社の発注書をメール添付にて発送してください。
4)データリソース社からレポート発行元の調査会社へ納品手配します。
5) 調査会社からお客様へ納品されます。最近は、pdfにてのメール納品が大半です。
お支払方法の方法はどのようになっていますか?
納品と同時にデータリソース社よりお客様へ請求書(必要に応じて納品書も)を発送いたします。
お客様よりデータリソース社へ(通常は円払い)の御振り込みをお願いします。
請求書は、納品日の日付で発行しますので、翌月最終営業日までの当社指定口座への振込みをお願いします。振込み手数料は御社負担にてお願いします。
お客様の御支払い条件が60日以上の場合は御相談ください。
尚、初めてのお取引先や個人の場合、前払いをお願いすることもあります。ご了承のほど、お願いします。
データリソース社はどのような会社ですか?
当社は、世界各国の主要調査会社・レポート出版社と提携し、世界各国の市場調査レポートや技術動向レポートなどを日本国内の企業・公官庁及び教育研究機関に提供しております。
世界各国の「市場・技術・法規制などの」実情を調査・収集される時には、データリソース社にご相談ください。
お客様の御要望にあったデータや情報を抽出する為のレポート紹介や調査のアドバイスも致します。
|
|


