次世代シーケンサー市場レポート:2023-2033
Next Generation Sequencing Market Report 2023-2033
レポート詳細
次世代シーケンサー市場レポート 2023-2033 :本レポートは、新たな収益の柱を目指す大手企業にとって、業界とその根底にある力学をより深く理解する上で貴重なものとなろう。異業種への... もっと見る
※上記価格は部署ライセンス(Departmental licence)価格です。
その他の価格についてはデータリソースまでお問合せください。
日本語のページは自動翻訳を利用し作成しています。
実際のレポートは英文のみでご納品いたします。
サマリー
レポート詳細
次世代シーケンサー市場レポート 2023-2033:本レポートは、新たな収益の柱を目指す大手企業にとって、業界とその根底にある力学をより深く理解する上で貴重なものとなろう。異業種への進出や、新たな地域での既存事業の拡大を希望する企業にとっても有用であろう。
コスト、スピード、効率の低下と高スループットが市場成長を牽引
NGS技術の主な原動力の1つは、シーケンスコストの継続的な削減です。長年にわたり、シーケンスコストは劇的に低下し、研究者や臨床医にとってより身近で手頃なものとなっています。このコスト削減により、大規模なシーケンスプロジェクトが可能になり、個別化ゲノムと精密医療の取り組みがより実現可能になりました。NGSテクノロジーは、従来のシーケンス法と比較して迅速なターンアラウンドタイムを提供します。何十億ものDNA断片を並行して生成できるため、より迅速なデータ生成が可能になります。NGSのスピードと効率性により、リアルタイムのシーケンスと臨床現場でのゲノム情報のタイムリーな解析が可能になり、遺伝性疾患の診断や治療方針の決定に役立つ。さらに、NGSテクノロジーはハイスループットシーケンスを可能にし、大量のDNAまたはRNAサンプルを同時に処理できることを意味する。ハイスループットシーケンスにより、大規模集団研究、がんゲノム研究、マイクロバイオーム研究などが促進されている。前述の要因が次世代シーケンサー市場の成長を促進している。
業界の成長を妨げる熟練専門家の不足
NGS技術には、サンプル調製、ライブラリー構築、データ解析、解釈において専門的なスキルと専門知識が必要である。トレーニングプログラムへのアクセス不足や、NGSに精通した有資格者の限られた利用可能性が、この技術の普及と活用の妨げとなる可能性がある。NGS技術には、分子生物学、遺伝学、バイオインフォマティクス、データ解析の専門知識の組み合わせが必要である。必要な学際的知識と技能を有する専門家を見つけることは、従来の研修プログラムではこれらすべての分野の包括的な教育が提供されない可能性があるため、困難なことである。
市場調査レポートを購入する前にすべき質問とは?
- 次世代シーケンサー市場はどのように進化しているのか?
- 次世代シーケンサー市場の推進要因と阻害要因は何か?
- 次世代シーケンサーの各サブマーケットセグメントは予測期間中にどのように成長し、これらのサブマーケットが2033年にどれくらいの収益を占めるのか?
- 2023年から2033年にかけて、次世代シーケンサーの各サブマーケットの市場シェアはどのように推移するのか?
- 2023年から2033年にかけて市場全体の主な牽引役は何か?
- 主要な次世代シーケンサー市場はマクロ経済ダイナミクスに概ね追随するのか、それとも個々の国内市場が他を凌駕するのか?
- 2033年までに各国市場のシェアはどう変化し、2033年に市場をリードするのはどの地域か?
- 主要プレーヤーは誰か、予測期間中の見通しは?
- これら主要企業の次世代シーケンサープロジェクトは?
- 2023年から2033年の間に業界はどのように進化するのか?現在行われている
次世代シーケンサープロジェクトは現在、そして今後10年間でどのような意味を持つのか?
- 次世代シーケンサー製造市場をさらに拡大するために、製品の商業化の必要性は高まっていますか?
- 次世代シーケンサー市場はどこに向かっているのか、そしてどのようにすれば市場の最前線に確実に立つことができるのか?
- 新製品やサービスラインに対する最適な投資オプションは何か?
- 企業を新たな成長軌道に乗せ、C-suiteに移行させるための重要な展望とは?
このことが、現在、そして今後10年間、次世代シーケンサー市場にどのような影響を与えるかを見極める必要がある:
- 24ページにわたる本レポートは、102の表と139の図表で構成されています。
- 本レポートは、業界における主要な有利分野にハイライトを当てているため、今すぐターゲットを絞ることができます。
- 世界、地域、国の売上と成長に関する詳細な分析が含まれています。
- 競合他社が成功した主なトレンド、変化、収益予測をハイライトしています。
本レポートは、次世代シーケンサー市場が今後10年間でどのように発展し、COVID-19の景気後退と好転の変動に合わせて変化するかをお伝えします。この市場は過去10年間のどの時点よりも今が重要です。
2033年までの予測やその他の分析から、商業的な展望が明らかになる
- 2033年までの収益予測に加え、直近の業績、成長率、市場シェアもご覧いただけます。
- ビジネスの展望と展開に関する独自の分析をご覧いただけます。
- 定性的分析(市場ダイナミクス、促進要因、機会、阻害要因、課題を含む)と最近の動向をご覧いただけます。
本レポートには、COVID-19が業界と貴社にどのような影響を与えるかについてのデータ分析と貴重な洞察が含まれている。本レポートでは、COVID-19の4つの回収パターンとその影響、すなわち「V」、「L」、「W」、「U」について論じている。
レポート対象セグメント
タイプ展望
- 消耗品
- バイオインフォマティクス
- シーケンスサービス
- プレシーケンスサービス
- 装置
ワークフロー
- ライブラリー調製
- シーケンス
- データ解析
用途
- 腫瘍学
- 生殖医療
- 遺伝子および希少疾患
- 消費者ゲノミクス
- アグリゲノミクスと科学捜査
- その他
エンドユーズ
- 病院および診療所
- 学術・研究機関
- 製薬・バイオテクノロジー企業
- その他
世界市場全体と各分野の収益予測に加え、5つの地域と24の主要国市場の収益予測も掲載している:
北米
- アメリカ
- カナダ
欧州
- ドイツ
- 英国
- フランス
- スペイン
- イタリア
- ロシア
- その他の欧州
アジア太平洋
- 中国
- 日本
- インド
- オーストラリア
- 韓国
- シンガポール
- その他のアジア太平洋地域
ラテンアメリカ
- ブラジル
- メキシコ
- アルゼンチン
- コロンビア
- その他のラテンアメリカ
MEA
- GCC
- 南アフリカ
- その他のMEA
本レポートでは、次世代シーケンサー市場の2023年から2033年にかけての主要企業のプロファイルも掲載しており、これらの企業の事業のこのセグメントに焦点を当てています。
主要企業と市場成長の可能性
・ Agilent Technologies, Inc.
・ Bio-Rad Laboratories, Inc.
・ Eurofins Scientific
・ F. Hoffman-La Roche Ltd
・ Illumina, Inc.
・ PerkinElmer Inc.
・ QIAGEN
・ Thermo Fisher Scientific Inc.
次世代シーケンサー市場全体の世界収益、2023年から2033年までの金額ベースで、市場は2023年に106億2,600万米ドルを超えると当研究所は算出した。2033年まで収益が力強く成長すると予測しています。当社の調査では、最も大きな可能性を秘めた組織を特定しています。彼らの能力、進歩、商業的展望を発見し、一歩先を行くお手伝いをします。
次世代シーケンサー市場、2023年から2033年までのレポートはどのように役立ちますか?
要約すると、240ページを超えるこのレポートは、以下の知識を提供する:
- 次世代シーケンサー市場の2023年から2033年までの収益予測 - タイプ、ワークフロー、アプリケーション、エンドユーザーごとの予測を世界および地域レベルで掲載 - 業界の将来性を発見し、投資や収益に最も有利な場所を見つけることができます。
- 5つの地域と24の主要国市場の2033年までの収益予測 - 次世代シーケンサー市場、2023年から2033年までの北米、ヨーロッパ、アジア太平洋、ラテンアメリカ、MEAの市場予測をご覧ください。また、米国、カナダ、メキシコ、ブラジル、アルゼンチン、コロンビア、ドイツ、フランス、英国、イタリア、中国、インド、日本、シンガポール、韓国、GCC諸国、南アフリカ、オーストラリアなどの主要経済圏の市場も予測しています。
- 既存企業および市場参入を目指す企業の展望 - 次世代シーケンサー市場に関わる主要企業8社の企業プロファイルを含む、2023年から2033年までの展望。
独自の予測による定量的・定性的分析をご覧ください。私たちのレポートだけに含まれる情報を入手し、貴重なビジネスインテリジェンスで情報を得ることができます。
他にはない情報
私たちの新しいレポートがあれば、知識に遅れをとったり、チャンスを逃したりする可能性が低くなります。弊社の調査レポートが貴社の調査、分析、意思決定にどのように役立つかをご覧ください。Visiongainの調査は、次世代シーケンサー市場、2023年から2033年、市場をリードする企業の商業分析を必要とするすべての人のためのものです。データ、トレンド、予測をご覧いただけます。
ページTOPに戻る
目次
目次
1 レポート概要
1.1 研究の目的
1.2 次世代シーケンサー市場の紹介
1.3 本レポートの内容
1.4 本レポートを読むべき理由
1.5 本分析レポートが回答する主な質問
1.6 本レポートの対象者
1.7 方法論
1.7.1 市場の定義
1.7.2 市場評価・予測手法
1.7.3 データの検証
1.7.3.1 一次調査
1.7.3.2 セカンダリーリサーチ
1.8 よくある質問(FAQ)
1.9 Visiongainの関連レポート
1.10 Visiongainについて
2 エグゼクティブ・サマリー
3 市場概要
3.1 主要な調査結果
3.2 市場ダイナミクス
3.2.1 市場促進要因
3.2.1.1 急速な技術進歩がNGS市場の成長を後押しする
3.2.1.2 研究と臨床のコラボレーションがNGS市場を拡大する可能性が高い
3.2.1.3 疾患の多様性と有病率の増加がNGS技術需要の拡大に寄与している
3.2.2 市場抑制要因
3.2.2.1 熟練した専門家の不足が市場成長を阻害している
3.2.2.2 価格圧力が次世代シーケンシング世界市場拡大の主な障害の1つになる
3.2.3 市場機会
3.2.3.1 個別化医療と精密腫瘍学が市場成長に大きな機会をもたらす
3.2.3.2 NGSが標的治療の開発を加速させたように、バイオマーカー探索と医薬品開発におけるNGSの採用
3.3 COVID-19インパクト分析
3.4 ポーターのファイブフォース分析
3.4.1 サプライヤーの交渉力
3.4.2 バイヤーの交渉力
3.4.3 競争相手のライバル関係
3.4.4 代替品による脅威
3.4.5 新規参入企業の脅威
3.5 PEST分析
4 次世代シーケンサー市場分析:タイプ別
4.1 主要な調査結果
4.2 タイプセグメント 市場魅力度指数
4.3 次世代シーケンサーのタイプ別市場規模推定と予測
4.4 消耗品
4.4.1 2023〜2033年の地域別市場規模(US$ Million)
4.4.2 地域別市場シェア、2023年・2033年(%)
4.5 バイオインフォマティクス
4.5.1 2023〜2033年の地域別市場規模(US$ Million)
4.5.2 地域別市場シェア、2023年・2033年(%)
4.6 シークエンシングサービス
4.6.1 2023~2033年の地域別市場規模(US$ Million)
4.6.2 地域別市場シェア、2023年・2033年(%)
4.7 プレシーケンスサービス
4.7.1 2023~2033年の地域別市場規模(US$ Million)
4.7.2 地域別市場シェア、2023年・2033年(%)
4.8 インスツルメンツ
4.8.1 2023~2033年の地域別市場規模(US$ Million)
4.8.2 地域別市場シェア、2023年・2033年(%)
5 次世代シーケンサー市場分析:ワークフロー別
5.1 主な調査結果
5.2 ワークフローセグメント 市場魅力度指数
5.3 ワークフロー別次世代シーケンサー市場規模の推定と予測
5.4 ライブラリー調製
5.4.1 2023〜2033年の地域別市場規模(US$ Million)
5.4.2 地域別市場シェア、2023年・2033年(%)
5.5 シークエンシング
5.5.1 2023~2033年の地域別市場規模(US$ Million)
5.5.2 地域別市場シェア、2023年・2033年(%)
5.6 データ解析
5.6.1 2023〜2033年の地域別市場規模(US$ Million)
5.6.2 地域別市場シェア、2023年・2033年 (%)
6 次世代シーケンサー市場分析:用途別
6.1 主な調査結果
6.2 用途別セグメント 市場魅力度指数
6.3 次世代シーケンサーの用途別市場規模推定と予測
6.4 がん領域
6.4.1 2023〜2033年の地域別市場規模(US$ Million)
6.4.2 地域別市場シェア、2023年・2033年(%)
6.5 リプロダクティブヘルス
6.5.1 2023〜2033年の地域別市場規模(US$ Million)
6.5.2 地域別市場シェア、2023年・2033年(%)
6.6 遺伝子疾患と希少疾患
6.6.1 2023〜2033年の地域別市場規模(US$ Million)
6.6.2 地域別市場シェア、2023年・2033年(%)
6.7 コンシューマーゲノミクス
6.7.1 2023〜2033年の地域別市場規模(US$ Million)
6.7.2 地域別市場シェア、2023年・2033年(%)
6.8 アグリゲノミクスとフォレンジック
6.8.1 2023~2033年の地域別市場規模(US$ Million)
6.8.2 地域別市場シェア、2023年・2033年(%)
6.9 その他
6.9.1 2023〜2033年の地域別市場規模(US$ Million)
6.9.2 地域別市場シェア、2023年・2033年(%)
7 次世代シーケンサー市場分析:エンドユーズ別
7.1 主要な調査結果
7.2 エンドユーズ別セグメント 市場魅力度指数
7.3 次世代シーケンサーのエンドユーザー別市場規模推定と予測
7.4 病院と診療所
7.4.1 2023〜2033年の地域別市場規模(US$ Million)
7.4.2 地域別市場シェア、2023年・2033年(%)
7.5 学術・研究機関
7.5.1 2023~2033年の地域別市場規模(US$ Million)
7.5.2 地域別市場シェア、2023年・2033年(%)
7.6 製薬・バイオテクノロジー企業
7.6.1 2023〜2033年の地域別市場規模(US$ Million)
7.6.2 地域別市場シェア、2023年・2033年(%)
7.7 その他
7.7.1 2023〜2033年の地域別市場規模(US$ Million)
7.7.2 地域別市場シェア、2023年・2033年 (%)
8 次世代シーケンサー市場分析:地域別
8.1 主要な調査結果
8.2 地域別市場規模の推定と予測
9 北米の次世代シーケンサー市場分析
9.1 主要な調査結果
9.2 北米の次世代シーケンサー市場魅力度指数
9.3 北米の次世代シーケンサー国別市場、2023年、2028年、2033年 (US$ Million)
9.4 北米の次世代シーケンサー国別市場規模推定と予測
9.5 北米の次世代シーケンサー市場規模推定と予測:タイプ別
9.6 北米の次世代シーケンサー市場規模推定と予測:ワークフロー別
9.7 北米の次世代シーケンサー市場規模推定と予測:用途別
9.8 北米の次世代シーケンサー市場規模推定と予測:エンドユーズ別別
9.9 アメリカの次世代シーケンサー市場分析
9.10 カナダの次世代シーケンサー市場分析
10 欧州の次世代シーケンサー市場分析
10.1 主要な調査結果
10.2 欧州の次世代シーケンサー市場魅力度指数
10.3 欧州の次世代シーケンサー国別市場、2023年、2028年、2033年(US$ Million)
10.4 欧州の次世代シーケンサー国別市場規模推定と予測
10.5 欧州の次世代シーケンサー市場規模推定と予測:タイプ別
10.6 欧州の次世代シーケンサー市場規模推定と予測:ワークフロー別
10.7 欧州の次世代シーケンサー市場規模推定と予測:用途別
10.8 欧州の次世代シーケンサー市場規模推定と予測:エンドユーズ別
10.9 ドイツの次世代シーケンサー市場分析
10.10 フランスの次世代シーケンサー市場分析
10.11 イギリスの次世代シーケンサー市場分析
10.12 イタリアの次世代シーケンサー市場分析
10.13 スペインの次世代シーケンサー市場分析
10.14 ロシアの次世代シーケンサー市場分析
10.15 その他の欧州の次世代シーケンサー市場分析
11 アジア太平洋地域の次世代シーケンサー市場分析
11.1 主要な調査結果
11.2 アジア太平洋地域の次世代シーケンサー市場魅力度指数
11.3 アジア太平洋地域の次世代シーケンサー国別市場、2023年、2028年、2033年(US$ Million)
11.4 アジア太平洋地域の次世代シーケンサー国別市場規模推定と予測
11.5 アジア太平洋地域の次世代シーケンサー市場規模推定と予測:タイプ別
11.6 アジア太平洋地域の次世代シーケンサー市場規模推定と予測:ワークフロー別
11.7 アジア太平洋地域の次世代シーケンサー市場規模推定と予測:用途別
11.8 アジア太平洋地域の次世代シーケンサー市場規模推定と予測:エンドユーズ別
11.9 日本の次世代シーケンサー市場分析
11.10 中国の次世代シーケンサー市場分析
11.11 インドの次世代シーケンサー市場分析
11.12 オーストラリアの次世代シーケンサー市場分析
11.13 韓国の次世代シーケンサー市場分析
11.14 シンガポールの次世代シーケンサー市場分析
11.15 その他のアジア太平洋地域の次世代シーケンサー市場分析
12 ラテンアメリカの次世代シーケンサー市場分析
12.1 主要な調査結果
12.2 ラテンアメリカの次世代シーケンサー市場魅力度指数
12.3 ラテンアメリカの次世代シーケンサー国別市場、2023年、2028年、2033年(US$ Million)
12.4 ラテンアメリカの次世代シーケンサー国別市場規模推定と予測
12.5 ラテンアメリカの次世代シーケンサー国別市場規模推定と予測
12.6 ラテンアメリカの次世代シーケンサー市場規模推定と予測:タイプ別
12.7 ラテンアメリカの次世代シーケンサー市場規模推定と予測:用途別
12.8 ラテンアメリカの次世代シーケンサー市場規模推定と予測ワークフロー別
12.9 ラテンアメリカの次世代シーケンサー市場規模推定と予測:エンドユーズ別
12.10 ブラジルの次世代シーケンサー市場分析
12.11 メキシコの次世代シーケンサー市場分析
12.12 アルゼンチンの次世代シーケンサー市場分析
12.13 コロンビアの次世代シーケンサー市場分析
12.14 その他のラテンアメリカの次世代シーケンサー市場分析
13 MEAの次世代シーケンサー市場分析
13.1 主要な調査結果
13.2 MEAの次世代シーケンサー市場魅力度指数
13.3 MEAの国別次世代シーケンサー市場(2023年、2028年、2033年)(US$ Million
13.4 MEAの次世代シーケンサー国別市場規模推定と予測
13.5 MEAの次世代シーケンサー市場規模推定と予測:タイプ別
13.6 MEAの次世代シーケンサー市場規模推定と予測:ワークフロー別
13.7 MEAの次世代シーケンサー市場規模推定と予測:用途別
13.8 MEAの次世代シーケンサー市場規模推定と予測:最終用途別
13.9 GCC諸国の次世代シーケンサー市場分析
13.10 南アフリカ諸国の次世代シーケンサー市場分析
13.11 その他のMEAの次世代シーケンサー市場の分析
14 主要企業のプロファイル
14.1 競争環境、2022年
14.2 戦略的展望
14.3 Illumina, Inc.
14.3.1 会社概要
14.3.2 会社概要
14.3.3 財務分析
14.3.3.1 純収入、2018-2022年
14.3.3.2 R&D、2018年〜2022年
14.3.3.3 地域市場シェア、2022年
14.3.4 製品ベンチマーク
14.3.5 戦略的展望
14.4 F. Hoffmann-La Roche Ltd
14.4.1 会社概要
14.4.2 会社概要
14.4.3 財務分析
14.4.3.1 純収入、2018-2022年
14.4.3.2 売上高、2018-2022年
14.4.4 製品ベンチマーク
14.4.5 戦略的展望
14.5 QIAGEN
14.5.1 会社概要
14.5.2 会社概要
14.5.3 財務分析
14.5.3.1 純収入、2018-2022年
14.5.3.2 R&D、2018-2022年
14.5.3.3 地域市場シェア、2021年
14.5.4 製品ベンチマーク
14.5.5 戦略的展望
14.6 Thermo Fisher Scientific Inc.
14.6.1 会社概要
14.6.2 会社概要
14.6.3 財務分析
14.6.3.1 純収入、2018-2022年
14.6.3.2 R&D、2018年〜2022年
14.6.3.3 地域市場シェア、2022年
14.6.4 製品ベンチマーク
14.6.5 戦略的展望
14.7 Bio-Rad Laboratories, Inc.
14.7.1 会社概要
14.7.2 会社概要
14.7.3 財務分析
14.7.3.1 純収入、2018-2022年
14.7.3.2 R&D、2018-2022年
14.7.3.3 地域市場シェア、2022年
14.7.4 製品ベンチマーク
14.7.5 戦略的展望
14.8 パーキンエルマー
14.8.1 会社概要
14.8.2 会社概要
14.8.3 製品ベンチマーク
14.8.4 戦略的展望
14.9 Eurofins Scientific
14.9.1 会社概要
14.9.2 会社概要
14.9.3 財務分析
14.9.3.1 純収入、2018-2022年
14.9.4 製品ベンチマーク
14.9.5 戦略的展望
14.10 Agilent Technologies, Inc.
14.10.1 会社概要
14.10.2 会社概要
14.10.3 財務分析
14.10.3.1 純収入、2018年~2022年
14.10.4 製品ベンチマーク
14.10.5 戦略的展望
15 結論と提言
15.1 Visiongainからの結びの言葉
15.2 市場プレイヤーへの提言
ページTOPに戻る
図表リスト
表の一覧
Table 1 Next Generation Sequencing Market Snapshot, 2023 & 2033 (US$ Million, CAGR %)
Table 2 Next Generation Sequencing Market Forecast by Region, 2023-2033 (US$ Million, AGR%, CAGR%): “V” Shaped Recovery
Table 3 Next Generation Sequencing Market Forecast by Region, 2023-2033 (US$ Million, AGR%, CAGR%): “U” Shaped Recovery
Table 4 Next Generation Sequencing Market Forecast by Region, 2023-2033 (US$ Million, AGR%, CAGR%): “W” Shaped Recovery
Table 5 Next Generation Sequencing Market Forecast by Region, 2023-2033 (US$ Million, AGR%, CAGR%): “L” Shaped Recovery
Table 6 Next Generation Sequencing Market Forecast by Type, 2023-2033 (US$ Million, AGR%, CAGR%)
Table 7 Consumables Segment Market Forecast by Region, 2023-2033 (US$ Million, AGR%, CAGR%)
Table 8 Bioinformatics Segment Market Forecast by Region, 2023-2033 (US$ Million, AGR%, CAGR%)
Table 9 Sequencing Services Segment Market Forecast by Region, 2023-2033 (US$ Million, AGR%, CAGR%)
Table 10 Pre-sequencing Services Segment Market Forecast by Region, 2023-2033 (US$ Million, AGR%, CAGR%)
Table 11 Instruments Segment Market Forecast by Region, 2023-2033 (US$ Million, AGR%, CAGR%)
Table 12 Next Generation Sequencing Market Forecast by Workflow, 2023-2033 (US$ Million, AGR%, CAGR%)
Table 13 Library Preparation Segment Market Forecast by Region, 2023-2033 (US$ Million, AGR%, CAGR%)
Table 14 Sequencing Segment Market Forecast by Region, 2023-2033 (US$ Million, AGR%, CAGR%)
Table 15 Data Analysis Segment Market Forecast by Region, 2023-2033 (US$ Million, AGR%, CAGR%)
Table 16 Next Generation Sequencing Market Forecast by Application, 2023-2033 (US$ Million, AGR%, CAGR%)
Table 17 Oncology Segment Market Forecast by Region, 2023-2033 (US$ Million, AGR%, CAGR%)
Table 18 Reproductive Health Segment Market Forecast by Region, 2023-2033 (US$ Million, AGR%, CAGR%)
Table 19 Genetic and Rare Diseases Segment Market Forecast by Region, 2023-2033 (US$ Million, AGR%, CAGR%)
Table 20 Consumer Genomics Segment Market Forecast by Region, 2023-2033 (US$ Million, AGR%, CAGR%)
Table 21 Agrigenomics and Forensics Segment Market Forecast by Region, 2023-2033 (US$ Million, AGR%, CAGR%)
Table 22 Others Segment Market Forecast by Region, 2023-2033 (US$ Million, AGR%, CAGR%)
Table 23 Next Generation Sequencing Market Forecast by End-use, 2023-2033 (US$ Million, AGR%, CAGR%)
Table 24 Hospitals and Clinics Segment Market Forecast by Region, 2023-2033 (US$ Million, AGR%, CAGR%)
Table 25 Academic and Research Institutes Segment Market Forecast by Region, 2023-2033 (US$ Million, AGR%, CAGR%)
Table 26 Pharmaceutical and Biotech Companies Segment Market Forecast by Region, 2023-2033 (US$ Million, AGR%, CAGR%)
Table 27 Others Segment Market Forecast by Region, 2023-2033 (US$ Million, AGR%, CAGR%)
Table 28 Regional Segment Market Forecast by Region, 2023-2033 (US$ Million, AGR%, CAGR%)
Table 29 North America Next Generation Sequencing Market Forecast by Country, 2023-2033 (US$ Million, AGR%, CAGR%)
Table 30 Regional Segment Market Forecast by Region, 2023-2033 (US$ Million, AGR%, CAGR%)
Table 31 North America Next Generation Sequencing Market Forecast by Workflow, 2023-2033 (US$ Million, AGR%, CAGR%)
Table 32 North America Next Generation Sequencing Market Forecast by Application, 2023-2033 (US$ Million, AGR%, CAGR%)
Table 33 North America Next Generation Sequencing Market Forecast by End-use, 2023-2033 (US$ Million, AGR%, CAGR%)
Table 34 U.S. Next Generation Sequencing Market Forecast, 2023-2033 (US$ Million, AGR%, CAGR%)
Table 35 Canada Next Generation Sequencing Market Forecast, 2023-2033 (US$ Million, AGR%, CAGR%)
Table 36 Europe Next Generation Sequencing Market Forecast by Country, 2023-2033 (US$ Million, AGR%, CAGR%)
Table 37 Europe Next Generation Sequencing Market Forecast by Type, 2023-2033 (US$ Million, AGR%, CAGR%)
Table 38 Europe Next Generation Sequencing Market Forecast by Workflow, 2023-2033 (US$ Million, AGR%, CAGR%)
Table 39 Europe Next Generation Sequencing Market Forecast by Application, 2023-2033 (US$ Million, AGR%, CAGR%)
Table 40 Europe Next Generation Sequencing Market Forecast by End-use, 2023-2033 (US$ Million, AGR%, CAGR%)
Table 41 Germany Next Generation Sequencing Market Forecast, 2023-2033 (US$ Million, AGR%, CAGR%)
Table 42 France Next Generation Sequencing Market Forecast, 2023-2033 (US$ Million, AGR%, CAGR%)
Table 43 U.K. Next Generation Sequencing Market Forecast, 2023-2033 (US$ Million, AGR%, CAGR%)
Table 44 Italy Next Generation Sequencing Market Forecast, 2023-2033 (US$ Million, AGR%, CAGR%)
Table 45 Spain Next Generation Sequencing Market Forecast, 2023-2033 (US$ Million, AGR%, CAGR%)
Table 46 Russia Next Generation Sequencing Market Forecast, 2023-2033 (US$ Million, AGR%, CAGR%)
Table 47 Rest of Europe Next Generation Sequencing Market Forecast, 2023-2033 (US$ Million, AGR%, CAGR%)
Table 48 Asia Pacific Next Generation Sequencing Market Forecast by Country, 2023-2033 (US$ Million, AGR%, CAGR%)
Table 49 Asia Pacific Next Generation Sequencing Market Forecast by Type, 2023-2033 (US$ Million, AGR%, CAGR%)
Table 50 Asia Pacific Next Generation Sequencing Market Forecast by Workflow, 2023-2033 (US$ Million, AGR%, CAGR%)
Table 51 Asia Pacific Next Generation Sequencing Market Forecast by Application, 2023-2033 (US$ Million, AGR%, CAGR%)
Table 52 Asia Pacific Next Generation Sequencing Market Forecast by End-use, 2023-2033 (US$ Million, AGR%, CAGR%)
Table 53 Japan Next Generation Sequencing Market Forecast, 2023-2033 (US$ Million, AGR%, CAGR%)
Table 54 China Next Generation Sequencing Market Forecast, 2023-2033 (US$ Million, AGR%, CAGR%)
Table 55 India Next Generation Sequencing Market Forecast, 2023-2033 (US$ Million, AGR%, CAGR%)
Table 56 Australia Next Generation Sequencing Market Forecast, 2023-2033 (US$ Million, AGR%, CAGR%)
Table 57 South Korea Next Generation Sequencing Market Forecast, 2023-2033 (US$ Million, AGR%, CAGR%)
Table 58 Singapore Next Generation Sequencing Market Forecast, 2023-2033 (US$ Million, AGR%, CAGR%)
Table 59 Rest of Asia Pacific Next Generation Sequencing Market Forecast, 2023-2033 (US$ Million, AGR%, CAGR%)
Table 60 Latin America Next Generation Sequencing Market Forecast by Country, 2023-2033 (US$ Million, AGR%, CAGR%)
Table 61 Latin America Next Generation Sequencing Market Forecast by Type, 2023-2033 (US$ Million, AGR%, CAGR%)
Table 62 Latin America Next Generation Sequencing Market Forecast by Workflow, 2023-2033 (US$ Million, AGR%, CAGR%)
Table 63 Latin America Next Generation Sequencing Market Forecast by Application, 2023-2033 (US$ Million, AGR%, CAGR%)
Table 64 Latin America Next Generation Sequencing Market Forecast by End-use, 2023-2033 (US$ Million, AGR%, CAGR%)
Table 65 Brazil Next Generation Sequencing Market Forecast, 2023-2033 (US$ Million, AGR%, CAGR%)
Table 66 Mexico Next Generation Sequencing Market Forecast, 2023-2033 (US$ Million, AGR%, CAGR%)
Table 67 Argentina Next Generation Sequencing Market Forecast, 2023-2033 (US$ Million, AGR%, CAGR%)
Table 68 Colombia Next Generation Sequencing Market Forecast, 2023-2033 (US$ Million, AGR%, CAGR%)
Table 69 Rest of Latin America Next Generation Sequencing Market Forecast, 2023-2033 (US$ Million, AGR%, CAGR%)
Table 70 MEA Next Generation Sequencing Market Forecast by Country, 2023-2033 (US$ Million, AGR%, CAGR%)
Table 71 MEA Next Generation Sequencing Market Forecast by Type, 2023-2033 (US$ Million, AGR%, CAGR%)
Table 72 MEA Next Generation Sequencing Market Forecast by Workflow, 2023-2033 (US$ Million, AGR%, CAGR%)
Table 73 MEA Next Generation Sequencing Market Forecast by Application, 2023-2033 (US$ Million, AGR%, CAGR%)
Table 74 MEA Next Generation Sequencing Market Forecast by End-use, 2023-2033 (US$ Million, AGR%, CAGR%)
Table 75 GCC Countries Next Generation Sequencing Market Forecast, 2023-2033 (US$ Million, AGR%, CAGR%)
Table 76 South Africa Next Generation Sequencing Market Forecast, 2023-2033 (US$ Million, AGR%, CAGR%)
Table 77 Rest of MEA Next Generation Sequencing Market Forecast, 2023-2033 (US$ Million, AGR%, CAGR%)
Table 78 Strategic Outlook
Table 79 Illumina Inc.: Key Details, (CEO, HQ, Revenue, Founded, No. of Employees, Company Type, Website, Business Segment)
Table 80 Illumina Inc.: Product Benchmarking
Table 81 Illumina Inc.: Strategic Outlook
Table 82 F. Hoffmann-La Roche Ltd: Key Details, (CEO, HQ, Revenue, Founded, No. of Employees, Company Type, Website, Business Segment)
Table 83 F. Hoffmann-La Roche Ltd: Product Benchmarking
Table 84 F. Hoffmann-La Roche Ltd: Strategic Outlook
Table 85 QIAGEN: Key Details, (CEO, HQ, Revenue, Founded, No. of Employees, Company Type, Website, Business Segment)
Table 86 QIAGEN: Product Benchmarking
Table 87 QIAGEN Strategic Outlook
Table 88 Thermo Fisher Scientific Inc.: Key Details, (CEO, HQ, Revenue, Founded, No. of Employees, Company Type, Website, Business Segment)
Table 89 Thermo Fisher Scientific Inc.: Product Benchmarking
Table 90 Thermo Fisher Scientific Inc.: Strategic Outlook
Table 91 Bio-Rad Laboratories, Inc.: Key Details, (CEO, HQ, Revenue, Founded, No. of Employees, Company Type, Website, Business Segment)
Table 92 Bio-Rad Laboratories, Inc.: Product Benchmarking
Table 93 Bio-Rad Laboratories, Inc.: Strategic Outlook
Table 94 PerkinElmer Inc.: Key Details, (CEO, HQ, Revenue, Founded, No. of Employees, Company Type, Website, Business Segment)
Table 95 PerkinElmer Inc.: Product Benchmarking
Table 96 PerkinElmer Inc.: Strategic Outlook
Table 97 Eurofins Scientific: Key Details, (CEO, HQ, Revenue, Founded, No. of Employees, Company Type, Website, Business Segment)
Table 98 Eurofins Scientific: Product Benchmarking
Table 99 Eurofins Scientific: Strategic Outlook
Table 100 Agilent Technologies, Inc.: Key Details, (CEO, HQ, Revenue, Founded, No. of Employees, Company Type, Website, Business Segment)
Table 101 Agilent Technologies, Inc.: Product Benchmarking
Table 102 Agilent Technologies, Inc.: Strategic Outlook
図の一覧
Figure 1 Next Generation Sequencing Market Segmentation
Figure 2 Next Generation Sequencing Market by Type: Market Attractiveness Index
Figure 3 Next Generation Sequencing Market by Workflow: Market Attractiveness Index
Figure 4 Next Generation Sequencing Market by Application: Market Attractiveness Index
Figure 5 Next Generation Sequencing Market by End-use: Market Attractiveness Index
Figure 6 Next Generation Sequencing Market Attractiveness Index, by Region
Figure 7 Next Generation Sequencing Market: Market Dynamics
Figure 8 Next Generation Sequencing Market by Region, 2023-2033 (US$ Million, AGR %): “V” Shaped Recovery
Figure 9 Next Generation Sequencing Market by Region, 2023-2033 (US$ Million, AGR %): “U” Shaped Recovery
Figure 10 Next Generation Sequencing Market by Region, 2023-2033 (US$ Million, AGR %): “W” Shaped Recovery
Figure 11 Next Generation Sequencing Market by Region, 2023-2033 (US$ Million, AGR %): “L” Shaped Recovery
Figure 12 Next Generation Sequencing Market: Porter’s Five Forces Analysis
Figure 13 Next Generation Sequencing Market: PEST Analysis
Figure 14 Next Generation Sequencing Market by Type: Market Attractiveness Index
Figure 15 Next Generation Sequencing Market Forecast by Type, 2023-2033 (US$ Million, AGR %)
Figure 16 Next Generation Sequencing Market Share Forecast by Type, 2023, 2028, 2033 (%)
Figure 17 Consumables Segment Market Forecast by Region, 2023-2033 (US$ Million, AGR %)
Figure 18 Consumables Segment Market Share Forecast by Region, 2023 & 2033 (%)
Figure 19 Bioinformatics Segment Market Forecast by Region, 2023-2033 (US$ Million, AGR %)
Figure 20 Bioinformatics Segment Market Share Forecast by Region, 2023 & 2033 (%)
Figure 21 Sequencing Services Segment Market Forecast by Region, 2023-2033 (US$ Million, AGR %)
Figure 22 Sequencing Services Segment Market Share Forecast by Region, 2023 & 2033 (%)
Figure 23 Pre-sequencing Services Segment Market Forecast by Region, 2023-2033 (US$ Million, AGR %)
Figure 24 Pre-sequencing Services Segment Market Share Forecast by Region, 2023 & 2033 (%)
Figure 25 Instruments Segment Market Forecast by Region, 2023-2033 (US$ Million, AGR %)
Figure 26 Instruments Segment Market Share Forecast by Region, 2023 & 2033 (%)
Figure 27 Next Generation Sequencing Market by Workflow: Market Attractiveness Index
Figure 28 Next Generation Sequencing Market Forecast by Workflow, 2023-2033 (US$ Million, AGR %)
Figure 29 Next Generation Sequencing Market Share Forecast by Workflow 2023, 2028, 2033 (%)
Figure 30 Library Preparation Segment Market Forecast by Region, 2023-2033 (US$ Million, AGR %)
Figure 31 Library Preparation Segment Market Share Forecast by Region, 2023 & 2033 (%)
Figure 32 Sequencing Segment Market Forecast by Region, 2023-2033 (US$ Million, AGR %)
Figure 33 Sequencing Segment Market Share Forecast by Region, 2023 & 2033 (%)
Figure 34 Data Analysis Segment Market Forecast by Region, 2023-2033 (US$ Million, AGR %)
Figure 35 Data Analysis Segment Market Share Forecast by Region, 2023 & 2033 (%)
Figure 36 Next Generation Sequencing Market by Application: Market Attractiveness Index
Figure 37 Next Generation Sequencing Market Share Forecast by Application 2023, 2028, 2033 (%)
Figure 38 Oncology Segment Market Forecast by Region, 2023-2033 (US$ Million, AGR %)
Figure 39 Oncology Segment Market Share Forecast by Region, 2023 & 2033 (%)
Figure 40 Reproductive Health Segment Market Forecast by Region, 2023-2033 (US$ Million, AGR %)
Figure 41 Reproductive Health Segment Market Share Forecast by Region, 2023 & 2033 (%)
Figure 42 Genetic and Rare Diseases Segment Market Forecast by Region, 2023-2033 (US$ Million, AGR %)
Figure 43 Genetic and Rare Diseases Segment Market Share Forecast by Region, 2023 & 2033 (%)
Figure 44 Consumer Genomics Segment Market Forecast by Region, 2023-2033 (US$ Million, AGR %)
Figure 45 Consumer Genomics Segment Market Share Forecast by Region, 2023 & 2033 (%)
Figure 46 Agrigenomics and Forensics Segment Market Forecast by Region, 2023-2033 (US$ Million, AGR %)
Figure 47 Agrigenomics and Forensics Segment Market Share Forecast by Region, 2023 & 2033 (%)
Figure 48 Others Segment Market Forecast by Region, 2023-2033 (US$ Million, AGR %)
Figure 49 Others Segment Market Share Forecast by Region, 2023 & 2033 (%)
Figure 50 Next Generation Sequencing Market by End-use: Market Attractiveness Index
Figure 51 Next Generation Sequencing Market Forecast by End-use, 2023-2033 (US$ Million, AGR %)
Figure 52 Next Generation Sequencing Market Share Forecast by End-use 2023, 2028, 2033 (%)
Figure 53 Hospitals and Clinics Segment Market Forecast by Region, 2023-2033 (US$ Million, AGR %)
Figure 54 Hospitals and Clinics Segment Market Share Forecast by Region, 2023 & 2033 (%)
Figure 55 Academic and Research Institutes Segment Market Forecast by Region, 2023-2033 (US$ Million, AGR %)
Figure 56 Academic and Research Institutes Segment Market Share Forecast by Region, 2023 & 2033 (%)
Figure 57 Pharmaceutical and Biotech Companies Segment Market Forecast by Region, 2023-2033 (US$ Million, AGR %)
Figure 58 Pharmaceutical and Biotech Companies Segment Market Share Forecast by Region, 2023 & 2033 (%)
Figure 59 Others Segment Market Forecast by Region, 2023-2033 (US$ Million, AGR %)
Figure 60 Others Segment Market Share Forecast by Region, 2023 & 2033 (%)
Figure 61 Next Generation Sequencing Market Forecast by Region 2023 and 2033 (Revenue, CAGR%)
Figure 62 Next Generation Sequencing Market Share Forecast by Region 2023, 2028, 2033 (%)
Figure 63 Next Generation Sequencing Market by Region, 2023-2033 (US$ Million, AGR %)
Figure 64 North America Next Generation Sequencing Market Attractiveness Index
Figure 65 North America Next Generation Sequencing Market by Region, 2023, 2028 & 2033 (US$ Million)
Figure 66 North America Next Generation Sequencing Market Share Forecast by Country, 2023 & 2033 (%)
Figure 67 North America Next Generation Sequencing Market Share Forecast by Type, 2023 & 2033 (%)
Figure 68 North America Next Generation Sequencing Market Share Forecast by Workflow, 2023 & 2033 (%)
Figure 69 North America Next Generation Sequencing Market Share Forecast by Application, 2023 & 2033 (%)
Figure 70 North America Next Generation Sequencing Market Share Forecast by End-use, 2023 & 2033 (%)
Figure 71 U.S. Next Generation Sequencing Market Forecast, 2023-2033 (US$ Million, AGR %)
Figure 72 Canada Next Generation Sequencing Market Forecast, 2023-2033 (US$ Million, AGR %)
Figure 73 Europe Next Generation Sequencing Market Attractiveness Index
Figure 74 Europe Next Generation Sequencing Market by Region, 2023, 2028 & 2033 (US$ Million)
Figure 75 Europe Next Generation Sequencing Market Share Forecast by Country, 2023 & 2033 (%)
Figure 76 Europe Next Generation Sequencing Market Share Forecast by Type, 2023 & 2033 (%)
Figure 77 Europe Next Generation Sequencing Market Share Forecast by Workflow, 2023 & 2033 (%)
Figure 78 Europe Next Generation Sequencing Market Share Forecast by Application, 2023 & 2033 (%)
Figure 79 Europe Next Generation Sequencing Market Share Forecast by End-use, 2023 & 2033 (%)
Figure 80 Germany Next Generation Sequencing Market Forecast, 2023-2033 (US$ Million, AGR %)
Figure 81 France Next Generation Sequencing Market Forecast, 2023-2033 (US$ Million, AGR %)
Figure 82 U.K. Next Generation Sequencing Market Forecast, 2023-2033 (US$ Million, AGR %)
Figure 83 Italy Next Generation Sequencing Market Forecast, 2023-2033 (US$ Million, AGR %)
Figure 84 Spain Next Generation Sequencing Market Forecast, 2023-2033 (US$ Million, AGR %)
Figure 85 Russia Next Generation Sequencing Market Forecast, 2023-2033 (US$ Million, AGR %)
Figure 86 Rest of Europe Next Generation Sequencing Market Forecast, 2023-2033 (US$ Million, AGR %)
Figure 87 Asia Pacific Next Generation Sequencing Market Attractiveness Index
Figure 88 Asia Pacific Next Generation Sequencing Market by Region, 2023, 2028 & 2033 (US$ Million)
Figure 89 Asia Pacific Next Generation Sequencing Market Share Forecast by Country, 2023 & 2033 (%)
Figure 90 Asia Pacific Next Generation Sequencing Market Share Forecast by Type, 2023 & 2033 (%)
Figure 91 Asia Pacific Next Generation Sequencing Market Share Forecast by Workflow, 2023 & 2033 (%)
Figure 92 Asia Pacific Next Generation Sequencing Market Share Forecast by Application, 2023 & 2033 (%)
Figure 93 Asia Pacific Next Generation Sequencing Market Share Forecast by End-use, 2023 & 2033 (%)
Figure 94 Japan Next Generation Sequencing Market Forecast, 2023-2033 (US$ Million, AGR %)
Figure 95 China Next Generation Sequencing Market Forecast, 2023-2033 (US$ Million, AGR %)
Figure 96 India Next Generation Sequencing Market Forecast, 2023-2033 (US$ Million, AGR %)
Figure 97 Australia Next Generation Sequencing Market Forecast, 2023-2033 (US$ Million, AGR %)
Figure 98 South Korea Next Generation Sequencing Market Forecast, 2023-2033 (US$ Million, AGR %)
Figure 99 Singapore Next Generation Sequencing Market Forecast, 2023-2033 (US$ Million, AGR %)
Figure 100 Rest of Asia Pacific Next Generation Sequencing Market Forecast, 2023-2033 (US$ Million, AGR %)
Figure 101 Latin America Next Generation Sequencing Market Attractiveness Index
Figure 102 Latin America Next Generation Sequencing Market by Region, 2023, 2028 & 2033 (US$ Million)
Figure 103 Latin America Next Generation Sequencing Market Share Forecast by Country, 2023 & 2033 (%)
Figure 104 Latin America Next Generation Sequencing Market Share Forecast by Type, 2023 & 2033 (%)
Figure 105 Latin America Next Generation Sequencing Market Share Forecast by Workflow, 2023 & 2033 (%)
Figure 106 Latin America Next Generation Sequencing Market Share Forecast by Application, 2023 & 2033 (%)
Figure 107 Latin America Next Generation Sequencing Market Share Forecast by End-use, 2023 & 2033 (%)
Figure 108 Brazil Next Generation Sequencing Market Forecast, 2023-2033 (US$ Million, AGR %)
Figure 109 Mexico Next Generation Sequencing Market Forecast, 2023-2033 (US$ Million, AGR %)
Figure 110 Argentina Next Generation Sequencing Market Forecast, 2023-2033 (US$ Million, AGR %)
Figure 111 Colombia Next Generation Sequencing Market Forecast, 2023-2033 (US$ Million, AGR %)
Figure 112 Rest of Latin America Next Generation Sequencing Market Forecast, 2023-2033 (US$ Million, AGR %)
Figure 113 MEA Next Generation Sequencing Market Attractiveness Index
Figure 114 MEA Next Generation Sequencing Market by Region, 2023, 2028 & 2033 (US$ Million)
Figure 115 MEA Next Generation Sequencing Market Share Forecast by Country, 2023 & 2033 (%)
Figure 116 MEA Next Generation Sequencing Market Share Forecast by Type, 2023 & 2033 (%)
Figure 117 MEA Next Generation Sequencing Market Share Forecast by Workflow, 2023 & 2033 (%)
Figure 118 MEA Next Generation Sequencing Market Share Forecast by Application, 2023 & 2033 (%)
Figure 119 MEA Next Generation Sequencing Market Share Forecast by End-use, 2023 & 2033 (%)
Figure 120 GCC Countries Next Generation Sequencing Market Forecast, 2023-2033 (US$ Million, AGR %)
Figure 121 South Africa Next Generation Sequencing Market Forecast, 2023-2033 (US$ Million, AGR %)
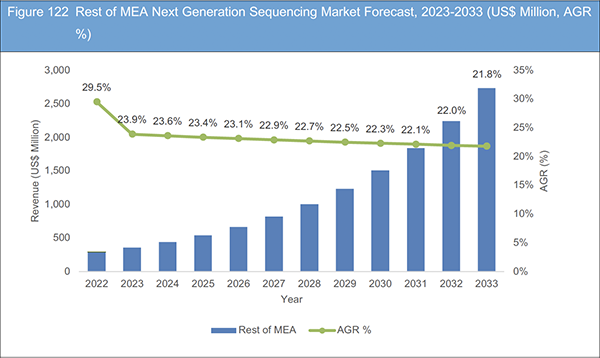
Figure 122 Rest of MEA Next Generation Sequencing Market Forecast, 2023-2033 (US$ Million, AGR %)
Figure 123 Next Generation Sequencing Market: Company Share/Ranking, 2022
Figure 124 Illumina Inc.: Net Revenue, 2018-2022 (US$ Million, AGR%)
Figure 125 Illumina Inc.: R&D, 2018-2022 (US$ Million, AGR%)
Figure 126 Illumina Inc. Regional Market Shares, 2022
Figure 127 F. Hoffmann-La Roche Ltd: Net Revenue, 2018-2022 (US$ Million, AGR%)
Figure 128 F. Hoffmann-La Roche Ltd: R&D, 2018-2022 (US$ Million, AGR%)
Figure 129 QIAGEN: Net Revenue, 2018-2022 (US$ Million, AGR%)
Figure 130 QIAGEN: R&D, 2018-2022 (US$ Million, AGR%)
Figure 131 QIAGEN: Regional Market Shares, 2021
Figure 132 Thermo Fisher Scientific Inc.: Net Revenue, 2018-2022 (US$ Million, AGR%)
Figure 133 Thermo Fisher Scientific Inc.: R&D, 2018-2022 (US$ Million, AGR%)
Figure 134 Thermo Fisher Scientific Inc.: Regional Market Shares, 2022
Figure 135 Bio-Rad Laboratories, Inc.: Net Revenue, 2018-2022 (US$ Million, AGR%)
Figure 136 Bio-Rad Laboratories, Inc.: R&D, 2018-2022 (US$ Million, AGR%)
Figure 137 Bio-Rad Laboratories, Inc.: Regional Market Shares, 2021
Figure 138 Eurofins Scientific: Net Revenue, 2018-2022 (US$ Million, AGR%)
Figure 139 Agilent Technologies, Inc.: Net Revenue, 2018-2022 (US$ Million, AGR%)
ページTOPに戻る
Summary
Report Details
The Next Generation Sequencing Market Report 2023-2033: This report will prove invaluable to leading firms striving for new revenue pockets if they wish to better understand the industry and its underlying dynamics. It will be useful for companies that would like to expand into different industries or to expand their existing operations in a new region.
Decreasing Cost, Speed and Efficiency and High Throughput Driving Market Growth
One of the primary drivers of NGS technology is the continuous reduction in sequencing costs. Over the years, the cost of sequencing has dramatically decreased, making it more accessible and affordable for researchers and clinicians. This cost reduction has enabled large-scale sequencing projects and made personalized genomics and precision medicine initiatives more feasible. NGS technology offers rapid turnaround times compared to traditional sequencing methods. It can generate billions of DNA fragments in parallel, allowing for faster data generation. The speed and efficiency of NGS have enabled real-time sequencing and the timely analysis of genomic information in clinical settings, aiding in the diagnosis of genetic disorders and informing treatment decisions. In addition, NGS technology allows for high-throughput sequencing, meaning it can process a large volume of DNA or RNA samples simultaneously. High-throughput sequencing has facilitated large-scale population studies, cancer genomics, and microbiome research, among other applications. The aforementioned factors are driving the next generation sequencing market growth.
Lack of Skilled Professional to Hamper Industry Growth
NGS technology requires specialized skills and expertise in sample preparation, library construction, data analysis, and interpretation. The lack of access to training programs and limited availability of qualified personnel proficient in NGS can hinder the widespread adoption and utilization of the technology. NGS technology requires a combination of expertise in molecular biology, genetics, bioinformatics, and data analysis. Finding professionals who possess the necessary interdisciplinary knowledge and skills can be challenging, as traditional training programs may not provide comprehensive education in all these areas.
What Questions Should You Ask before Buying a Market Research Report?
• How is the next generation sequencing market evolving?
• What is driving and restraining the next generation sequencing market?
• How will each next generation sequencing submarket segment grow over the forecast period and how much revenue will these submarkets account for in 2033?
• How will the market shares for each next generation sequencing submarket develop from 2023 to 2033?
• What will be the main driver for the overall market from 2023 to 2033?
• Will leading next generation sequencing markets broadly follow the macroeconomic dynamics, or will individual national markets outperform others?
• How will the market shares of the national markets change by 2033 and which geographical region will lead the market in 2033?
• Who are the leading players and what are their prospects over the forecast period?
• What are the next generation sequencing projects for these leading companies?
• How will the industry evolve during the period between 2023 and 2033? What are the implications of
next generation sequencing projects taking place now and over the next 10 years?
• Is there a greater need for product commercialisation to further scale the next generation sequencing manufacturing market?
• Where is the next generation sequencing market heading and how can you ensure you are at the forefront of the market?
• What are the best investment options for new product and service lines?
• What are the key prospects for moving companies into a new growth path and C-suite?
You need to discover how this will impact the next generation sequencing market today, and over the next 10 years:
• Our 24-page report provides 102 tables and 139 charts/graphs exclusively to you.
• The report highlights key lucrative areas in the industry so you can target them – NOW.
• It contains in-depth analysis of global, regional and national sales and growth.
• It highlights for you the key successful trends, changes and revenue projections made by your competitors.
This report tells you TODAY how the next generation sequencing market will develop in the next 10 years, and in line with the variations in COVID-19 economic recession and bounce. This market is more critical now than at any point over the last 10 years.
Forecasts to 2033 and other analyses reveal commercial prospects
• In addition to revenue forecasting to 2033, our new study provides you with recent results, growth rates, and market shares.
• You will find original analyses, with business outlooks and developments.
• Discover qualitative analyses (including market dynamics, drivers, opportunities, restraints and challenges) and recent developments.
This report includes data analysis and invaluable insight into how COVID-19 will affect the industry and your company. Four COVID-19 recovery patterns and their impact, namely, “V”, “L”, “W” and “U” are discussed in this report.
Segments Covered in the Report
Type Outlook
• Consumables
• Bioinformatics
• Sequencing Services
• Pre-sequencing Services
• Instruments
Workflow
• Library Preparation
• Sequencing
• Data Analysis
Application
• Oncology
• Reproductive Health
• Genetic and Rare Diseases
• Consumer Genomics
• Agrigenomics & Forensics
• Others
End-use
• Hospitals and Clinics
• Academic and Research Institutes
• Pharmaceutical and Biotech Companies
• Others
In addition to the revenue predictions for the overall world market and segments, you will also find revenue forecasts for five regional and 24 leading national markets:
North America
• U.S.
• Canada
Europe
• Germany
• UK
• France
• Spain
• Italy
• Russia
• Rest of Europe
Asia Pacific
• China
• Japan
• India
• Australia
• South Korea
• Singapore
• Rest of Asia Pacific
Latin America
• Brazil
• Mexico
• Argentina
• Colombia
• Rest of Latin America
MEA
• GCC
• South Africa
• Rest of MEA
The report also includes profiles and for some of the leading companies in the Next Generation Sequencing Market, 2023 to 2033, with a focus on this segment of these companies’ operations.
Leading companies and the potential for market growth
• Agilent Technologies, Inc.
• Bio-Rad Laboratories, Inc.
• Eurofins Scientific
• F. Hoffman-La Roche Ltd
• Illumina, Inc.
• PerkinElmer Inc.
• QIAGEN
• Thermo Fisher Scientific Inc.
Overall world revenue for Next Generation Sequencing Market, 2023 to 2033 in terms of value the market will surpass US$10,626 million in 2023, our work calculates. We predict strong revenue growth through to 2033. Our work identifies which organizations hold the greatest potential. Discover their capabilities, progress, and commercial prospects, helping you stay ahead.
How will the Next Generation Sequencing Market, 2023 to 2033 report help you?
In summary, our 240+ page report provides you with the following knowledge:
• Revenue forecasts to 2033 for Next Generation Sequencing Market, 2023 to 2033 Market, with forecasts for type, workflow, application, and end-user, each forecast at a global and regional level – discover the industry’s prospects, finding the most lucrative places for investments and revenues.
• Revenue forecasts to 2033 for five regional and 24 key national markets – See forecasts for the Next Generation Sequencing Market, 2023 to 2033 market in North America, Europe, Asia-Pacific, Latin America, and MEA. Also forecasted is the market in the US, Canada, Mexico, Brazil, Argentina, Colombia, Germany, France, UK, Italy, China, India, Japan, Singapore, South Korea, GCC Countries, South Africa, and Australia among other prominent economies.
• Prospects for established firms and those seeking to enter the market – including company profiles for 8 of the major companies involved in the Next Generation Sequencing Market, 2023 to 2033.
Find quantitative and qualitative analyses with independent predictions. Receive information that only our report contains, staying informed with invaluable business intelligence.
Information found nowhere else
With our new report, you are less likely to fall behind in knowledge or miss out on opportunities. See how our work could benefit your research, analyses, and decisions. Visiongain’s study is for everybody needing commercial analyses for the Next Generation Sequencing Market, 2023 to 2033, market-leading companies. You will find data, trends and predictions.
ページTOPに戻る
Table of Contents
Table of Contents
1 Report Overview
1.1 Objectives of the Study
1.2 Introduction to Next Generation Sequencing Market
1.3 What This Report Delivers
1.4 Why You Should Read This Report
1.5 Key Questions Answered by This Analytical Report
1.6 Who is This Report for?
1.7 Methodology
1.7.1 Market Definitions
1.7.2 Market Evaluation & Forecasting Methodology
1.7.3 Data Validation
1.7.3.1 Primary Research
1.7.3.2 Secondary Research
1.8 Frequently Asked Questions (FAQs)
1.9 Associated Visiongain Reports
1.10 About Visiongain
2 Executive Summary
3 Market Overview
3.1 Key Findings
3.2 Market Dynamics
3.2.1 Market Driving Factors
3.2.1.1 Rapid Technological Advancements is Boosting the NGS Market to Grow
3.2.1.2 Research and Clinical Collaborations is Likely to Augment the NGS market
3.2.1.3 Growing Disease Variation and Prevalence is Contributing to the Growing NGS Technology Demand
3.2.2 Market Restraining Factors
3.2.2.1 Lack of Skilled Professionals is Hampering the Market Growth
3.2.2.2 Pricing Pressure Becomes one of the Main Obstacles to the Expansion of the Global Next Generation Sequencing
3.2.3 Market Opportunities
3.2.3.1 Personalized Medicine and Precision Oncology Creates a Huge Opportunity for the Market to Grow
3.2.3.2 The adoption of NGS in Biomarker Discovery and Drug Development as NGS have Accelerated the Development of Targeted Therapies
3.3 COVID-19 Impact Analysis
3.4 Porter’s Five Forces Analysis
3.4.1 Bargaining Power of Suppliers
3.4.2 Bargaining Power of Buyers
3.4.3 Competitive Rivalry
3.4.4 Threat from Substitutes
3.4.5 Threat of New Entrants
3.5 PEST Analysis
4 Next Generation Sequencing Market Analysis by Type
4.1 Key Findings
4.2 Type Segment: Market Attractiveness Index
4.3 Next Generation Sequencing Market Size Estimation and Forecast by Type
4.4 Consumables
4.4.1 Market Size by Region, 2023-2033 (US$ Million)
4.4.2 Market Share by Region, 2023 & 2033 (%)
4.5 Bioinformatics
4.5.1 Market Size by Region, 2023-2033 (US$ Million)
4.5.2 Market Share by Region, 2023 & 2033 (%)
4.6 Sequencing Services
4.6.1 Market Size by Region, 2023-2033 (US$ Million)
4.6.2 Market Share by Region, 2023 & 2033 (%)
4.7 Pre-sequencing Services
4.7.1 Market Size by Region, 2023-2033 (US$ Million)
4.7.2 Market Share by Region, 2023 & 2033 (%)
4.8 Instruments
4.8.1 Market Size by Region, 2023-2033 (US$ Million)
4.8.2 Market Share by Region, 2023 & 2033 (%)
5 Next Generation Sequencing Market Analysis by Workflow
5.1 Key Findings
5.2 Workflow Segment: Market Attractiveness Index
5.3 Next Generation Sequencing Market Size Estimation and Forecast by Workflow
5.4 Library preparation
5.4.1 Market Size by Region, 2023-2033 (US$ Million)
5.4.2 Market Share by Region, 2023 & 2033 (%)
5.5 Sequencing
5.5.1 Market Size by Region, 2023-2033 (US$ Million)
5.5.2 Market Share by Region, 2023 & 2033 (%)
5.6 Data Analysis
5.6.1 Market Size by Region, 2023-2033 (US$ Million)
5.6.2 Market Share by Region, 2023 & 2033 (%)
6 Next Generation Sequencing Market Analysis by Application
6.1 Key Findings
6.2 Application Segment: Market Attractiveness Index
6.3 Next Generation Sequencing Market Size Estimation and Forecast by Application
6.4 Oncology
6.4.1 Market Size by Region, 2023-2033 (US$ Million)
6.4.2 Market Share by Region, 2023 & 2033 (%)
6.5 Reproductive Health
6.5.1 Market Size by Region, 2023-2033 (US$ Million)
6.5.2 Market Share by Region, 2023 & 2033 (%)
6.6 Genetic and Rare Diseases
6.6.1 Market Size by Region, 2023-2033 (US$ Million)
6.6.2 Market Share by Region, 2023 & 2033 (%)
6.7 Consumer Genomics
6.7.1 Market Size by Region, 2023-2033 (US$ Million)
6.7.2 Market Share by Region, 2023 & 2033 (%)
6.8 Agrigenomics & Forensics
6.8.1 Market Size by Region, 2023-2033 (US$ Million)
6.8.2 Market Share by Region, 2023 & 2033 (%)
6.9 Others
6.9.1 Market Size by Region, 2023-2033 (US$ Million)
6.9.2 Market Share by Region, 2023 & 2033 (%)
7 Next Generation Sequencing Market Analysis by End-use
7.1 Key Findings
7.2 End-use Segment: Market Attractiveness Index
7.3 Next Generation Sequencing Market Size Estimation and Forecast by End-use
7.4 Hospitals and Clinics
7.4.1 Market Size by Region, 2023-2033 (US$ Million)
7.4.2 Market Share by Region, 2023 & 2033 (%)
7.5 Academic and Research Institutes
7.5.1 Market Size by Region, 2023-2033 (US$ Million)
7.5.2 Market Share by Region, 2023 & 2033 (%)
7.6 Pharmaceutical and Biotech Companies
7.6.1 Market Size by Region, 2023-2033 (US$ Million)
7.6.2 Market Share by Region, 2023 & 2033 (%)
7.7 Others
7.7.1 Market Size by Region, 2023-2033 (US$ Million)
7.7.2 Market Share by Region, 2023 & 2033 (%)
8 Next Generation Sequencing Market Analysis by Region
8.1 Key Findings
8.2 Regional Market Size Estimation and Forecast
9 North America Next Generation Sequencing Market Analysis
9.1 Key Findings
9.2 North America Next Generation Sequencing Market Attractiveness Index
9.3 North America Next Generation Sequencing Market by Country, 2023, 2028 & 2033 (US$ Million)
9.4 North America Next Generation Sequencing Market Size Estimation and Forecast by Country
9.5 North America Next Generation Sequencing Market Size Estimation and Forecast by Type
9.6 North America Next Generation Sequencing Market Size Estimation and Forecast by Workflow
9.7 North America Next Generation Sequencing Market Size Estimation and Forecast by Application
9.8 North America Next Generation Sequencing Market Size Estimation and Forecast by End-use
9.9 U.S. Next Generation Sequencing Market Analysis
9.10 Canada Next Generation Sequencing Market Analysis
10 Europe Next Generation Sequencing Market Analysis
10.1 Key Findings
10.2 Europe Next Generation Sequencing Market Attractiveness Index
10.3 Europe Next Generation Sequencing Market by Country, 2023, 2028 & 2033 (US$ Million)
10.4 Europe Next Generation Sequencing Market Size Estimation and Forecast by Country
10.5 Europe Next Generation Sequencing Market Size Estimation and Forecast by Type
10.6 Europe Next Generation Sequencing Market Size Estimation and Forecast by Workflow
10.7 Europe Next Generation Sequencing Market Size Estimation and Forecast by Application
10.8 Europe Next Generation Sequencing Market Size Estimation and Forecast by End-use
10.9 Germany Next Generation Sequencing Market Analysis
10.10 France Next Generation Sequencing Market Analysis
10.11 U.K. Next Generation Sequencing Market Analysis
10.12 Italy Next Generation Sequencing Market Analysis
10.13 Spain Next Generation Sequencing Market Analysis
10.14 Russia Next Generation Sequencing Market Analysis
10.15 Rest of Europe Next Generation Sequencing Market Analysis
11 Asia Pacific Next Generation Sequencing Market Analysis
11.1 Key Findings
11.2 Asia Pacific Next Generation Sequencing Market Attractiveness Index
11.3 Asia Pacific Next Generation Sequencing Market by Country, 2023, 2028 & 2033 (US$ Million)
11.4 Asia Pacific Next Generation Sequencing Market Size Estimation and Forecast by Country
11.5 Asia Pacific Next Generation Sequencing Market Size Estimation and Forecast by Type
11.6 Asia Pacific Next Generation Sequencing Market Size Estimation and Forecast by Workflow
11.7 Asia Pacific Next Generation Sequencing Market Size Estimation and Forecast by Application
11.8 Asia Pacific Next Generation Sequencing Market Size Estimation and Forecast by End-use
11.9 Japan Next Generation Sequencing Market Analysis
11.10 China Next Generation Sequencing Market Analysis
11.11 India Next Generation Sequencing Market Analysis
11.12 Australia Next Generation Sequencing Market Analysis
11.13 South Korea Next Generation Sequencing Market Analysis
11.14 Singapore Next Generation Sequencing Market Analysis
11.15 Rest of Asia Pacific Next Generation Sequencing Market Analysis
12 Latin America Next Generation Sequencing Market Analysis
12.1 Key Findings
12.2 Latin America Next Generation Sequencing Market Attractiveness Index
12.3 Latin America Next Generation Sequencing Market by Country, 2023, 2028 & 2033 (US$ Million)
12.4 Latin America Next Generation Sequencing Market Size Estimation and Forecast by Country
12.5 Latin America Next Generation Sequencing Market Size Estimation and Forecast by Country
12.6 Latin America Next Generation Sequencing Market Size Estimation and Forecast by Type
12.7 Latin America Next Generation Sequencing Market Size Estimation and Forecast by Workflow
12.8 Latin America Next Generation Sequencing Market Size Estimation and Forecast by Application
12.9 Latin America Next Generation Sequencing Market Size Estimation and Forecast by End-use
12.10 Brazil Next Generation Sequencing Market Analysis
12.11 Mexico Next Generation Sequencing Market Analysis
12.12 Argentina Next Generation Sequencing Market Analysis
12.13 Colombia Next Generation Sequencing Market Analysis
12.14 Rest of Latin America Next Generation Sequencing Market Analysis
13 MEA Next Generation Sequencing Market Analysis
13.1 Key Findings
13.2 MEA Next Generation Sequencing Market Attractiveness Index
13.3 MEA Next Generation Sequencing Market by Country, 2023, 2028 & 2033 (US$ Million)
13.4 MEA Next Generation Sequencing Market Size Estimation and Forecast by Country
13.5 MEA Next Generation Sequencing Market Size Estimation and Forecast by Type
13.6 MEA Next Generation Sequencing Market Size Estimation and Forecast by Workflow
13.7 MEA Next Generation Sequencing Market Size Estimation and Forecast by Application
13.8 MEA Next Generation Sequencing Market Size Estimation and Forecast by End-use
13.9 GCC Countries Next Generation Sequencing Market Analysis
13.10 South Africa Countries Next Generation Sequencing Market Analysis
13.11 Rest of MEA Next Generation Sequencing Market Analysis
14 Company Profiles
14.1 Competitive Landscape, 2022
14.2 Strategic Outlook
14.3 Illumina, Inc.
14.3.1 Company Snapshot
14.3.2 Company Overview
14.3.3 Financial Analysis
14.3.3.1 Net Revenue, 2018-2022
14.3.3.2 R&D, 2018-2022
14.3.3.3 Regional Market Shares, 2022
14.3.4 Product Benchmarking
14.3.5 Strategic Outlook
14.4 F. Hoffmann-La Roche Ltd
14.4.1 Company Snapshot
14.4.2 Company Overview
14.4.3 Financial Analysis
14.4.3.1 Net Revenue, 2018-2022
14.4.3.2 R&D, 2018-2022
14.4.4 Product Benchmarking
14.4.5 Strategic Outlook
14.5 QIAGEN
14.5.1 Company Snapshot
14.5.2 Company Overview
14.5.3 Financial Analysis
14.5.3.1 Net Revenue, 2018-2022
14.5.3.2 R&D, 2018-2022
14.5.3.3 Regional Market Shares, 2021
14.5.4 Product Benchmarking
14.5.5 Strategic Outlook
14.6 Thermo Fisher Scientific Inc.
14.6.1 Company Snapshot
14.6.2 Company Overview
14.6.3 Financial Analysis
14.6.3.1 Net Revenue, 2018-2022
14.6.3.2 R&D, 2018-2022
14.6.3.3 Regional Market Shares, 2022
14.6.4 Product Benchmarking
14.6.5 Strategic Outlook
14.7 Bio-Rad Laboratories, Inc.
14.7.1 Company Snapshot
14.7.2 Company Overview
14.7.3 Financial Analysis
14.7.3.1 Net Revenue, 2018-2022
14.7.3.2 R&D, 2018-2022
14.7.3.3 Regional Market Shares, 2022
14.7.4 Product Benchmarking
14.7.5 Strategic Outlook
14.8 PerkinElmer Inc.
14.8.1 Company Snapshot
14.8.2 Company Overview
14.8.3 Product Benchmarking
14.8.4 Strategic Outlook
14.9 Eurofins Scientific
14.9.1 Company Snapshot
14.9.2 Company Overview
14.9.3 Financial Analysis
14.9.3.1 Net Revenue, 2018-2022
14.9.4 Product Benchmarking
14.9.5 Strategic Outlook
14.10 Agilent Technologies, Inc.
14.10.1 Company Snapshot
14.10.2 Company Overview
14.10.3 Financial Analysis
14.10.3.1 Net Revenue, 2018-2022
14.10.4 Product Benchmarking
14.10.5 Strategic Outlook
15 Conclusion and Recommendations
15.1 Concluding Remarks from Visiongain
15.2 Recommendations for Market Players
ページTOPに戻る
List of Tables/Graphs
List of Tables
Table 1 Next Generation Sequencing Market Snapshot, 2023 & 2033 (US$ Million, CAGR %)
Table 2 Next Generation Sequencing Market Forecast by Region, 2023-2033 (US$ Million, AGR%, CAGR%): “V” Shaped Recovery
Table 3 Next Generation Sequencing Market Forecast by Region, 2023-2033 (US$ Million, AGR%, CAGR%): “U” Shaped Recovery
Table 4 Next Generation Sequencing Market Forecast by Region, 2023-2033 (US$ Million, AGR%, CAGR%): “W” Shaped Recovery
Table 5 Next Generation Sequencing Market Forecast by Region, 2023-2033 (US$ Million, AGR%, CAGR%): “L” Shaped Recovery
Table 6 Next Generation Sequencing Market Forecast by Type, 2023-2033 (US$ Million, AGR%, CAGR%)
Table 7 Consumables Segment Market Forecast by Region, 2023-2033 (US$ Million, AGR%, CAGR%)
Table 8 Bioinformatics Segment Market Forecast by Region, 2023-2033 (US$ Million, AGR%, CAGR%)
Table 9 Sequencing Services Segment Market Forecast by Region, 2023-2033 (US$ Million, AGR%, CAGR%)
Table 10 Pre-sequencing Services Segment Market Forecast by Region, 2023-2033 (US$ Million, AGR%, CAGR%)
Table 11 Instruments Segment Market Forecast by Region, 2023-2033 (US$ Million, AGR%, CAGR%)
Table 12 Next Generation Sequencing Market Forecast by Workflow, 2023-2033 (US$ Million, AGR%, CAGR%)
Table 13 Library Preparation Segment Market Forecast by Region, 2023-2033 (US$ Million, AGR%, CAGR%)
Table 14 Sequencing Segment Market Forecast by Region, 2023-2033 (US$ Million, AGR%, CAGR%)
Table 15 Data Analysis Segment Market Forecast by Region, 2023-2033 (US$ Million, AGR%, CAGR%)
Table 16 Next Generation Sequencing Market Forecast by Application, 2023-2033 (US$ Million, AGR%, CAGR%)
Table 17 Oncology Segment Market Forecast by Region, 2023-2033 (US$ Million, AGR%, CAGR%)
Table 18 Reproductive Health Segment Market Forecast by Region, 2023-2033 (US$ Million, AGR%, CAGR%)
Table 19 Genetic and Rare Diseases Segment Market Forecast by Region, 2023-2033 (US$ Million, AGR%, CAGR%)
Table 20 Consumer Genomics Segment Market Forecast by Region, 2023-2033 (US$ Million, AGR%, CAGR%)
Table 21 Agrigenomics and Forensics Segment Market Forecast by Region, 2023-2033 (US$ Million, AGR%, CAGR%)
Table 22 Others Segment Market Forecast by Region, 2023-2033 (US$ Million, AGR%, CAGR%)
Table 23 Next Generation Sequencing Market Forecast by End-use, 2023-2033 (US$ Million, AGR%, CAGR%)
Table 24 Hospitals and Clinics Segment Market Forecast by Region, 2023-2033 (US$ Million, AGR%, CAGR%)
Table 25 Academic and Research Institutes Segment Market Forecast by Region, 2023-2033 (US$ Million, AGR%, CAGR%)
Table 26 Pharmaceutical and Biotech Companies Segment Market Forecast by Region, 2023-2033 (US$ Million, AGR%, CAGR%)
Table 27 Others Segment Market Forecast by Region, 2023-2033 (US$ Million, AGR%, CAGR%)
Table 28 Regional Segment Market Forecast by Region, 2023-2033 (US$ Million, AGR%, CAGR%)
Table 29 North America Next Generation Sequencing Market Forecast by Country, 2023-2033 (US$ Million, AGR%, CAGR%)
Table 30 Regional Segment Market Forecast by Region, 2023-2033 (US$ Million, AGR%, CAGR%)
Table 31 North America Next Generation Sequencing Market Forecast by Workflow, 2023-2033 (US$ Million, AGR%, CAGR%)
Table 32 North America Next Generation Sequencing Market Forecast by Application, 2023-2033 (US$ Million, AGR%, CAGR%)
Table 33 North America Next Generation Sequencing Market Forecast by End-use, 2023-2033 (US$ Million, AGR%, CAGR%)
Table 34 U.S. Next Generation Sequencing Market Forecast, 2023-2033 (US$ Million, AGR%, CAGR%)
Table 35 Canada Next Generation Sequencing Market Forecast, 2023-2033 (US$ Million, AGR%, CAGR%)
Table 36 Europe Next Generation Sequencing Market Forecast by Country, 2023-2033 (US$ Million, AGR%, CAGR%)
Table 37 Europe Next Generation Sequencing Market Forecast by Type, 2023-2033 (US$ Million, AGR%, CAGR%)
Table 38 Europe Next Generation Sequencing Market Forecast by Workflow, 2023-2033 (US$ Million, AGR%, CAGR%)
Table 39 Europe Next Generation Sequencing Market Forecast by Application, 2023-2033 (US$ Million, AGR%, CAGR%)
Table 40 Europe Next Generation Sequencing Market Forecast by End-use, 2023-2033 (US$ Million, AGR%, CAGR%)
Table 41 Germany Next Generation Sequencing Market Forecast, 2023-2033 (US$ Million, AGR%, CAGR%)
Table 42 France Next Generation Sequencing Market Forecast, 2023-2033 (US$ Million, AGR%, CAGR%)
Table 43 U.K. Next Generation Sequencing Market Forecast, 2023-2033 (US$ Million, AGR%, CAGR%)
Table 44 Italy Next Generation Sequencing Market Forecast, 2023-2033 (US$ Million, AGR%, CAGR%)
Table 45 Spain Next Generation Sequencing Market Forecast, 2023-2033 (US$ Million, AGR%, CAGR%)
Table 46 Russia Next Generation Sequencing Market Forecast, 2023-2033 (US$ Million, AGR%, CAGR%)
Table 47 Rest of Europe Next Generation Sequencing Market Forecast, 2023-2033 (US$ Million, AGR%, CAGR%)
Table 48 Asia Pacific Next Generation Sequencing Market Forecast by Country, 2023-2033 (US$ Million, AGR%, CAGR%)
Table 49 Asia Pacific Next Generation Sequencing Market Forecast by Type, 2023-2033 (US$ Million, AGR%, CAGR%)
Table 50 Asia Pacific Next Generation Sequencing Market Forecast by Workflow, 2023-2033 (US$ Million, AGR%, CAGR%)
Table 51 Asia Pacific Next Generation Sequencing Market Forecast by Application, 2023-2033 (US$ Million, AGR%, CAGR%)
Table 52 Asia Pacific Next Generation Sequencing Market Forecast by End-use, 2023-2033 (US$ Million, AGR%, CAGR%)
Table 53 Japan Next Generation Sequencing Market Forecast, 2023-2033 (US$ Million, AGR%, CAGR%)
Table 54 China Next Generation Sequencing Market Forecast, 2023-2033 (US$ Million, AGR%, CAGR%)
Table 55 India Next Generation Sequencing Market Forecast, 2023-2033 (US$ Million, AGR%, CAGR%)
Table 56 Australia Next Generation Sequencing Market Forecast, 2023-2033 (US$ Million, AGR%, CAGR%)
Table 57 South Korea Next Generation Sequencing Market Forecast, 2023-2033 (US$ Million, AGR%, CAGR%)
Table 58 Singapore Next Generation Sequencing Market Forecast, 2023-2033 (US$ Million, AGR%, CAGR%)
Table 59 Rest of Asia Pacific Next Generation Sequencing Market Forecast, 2023-2033 (US$ Million, AGR%, CAGR%)
Table 60 Latin America Next Generation Sequencing Market Forecast by Country, 2023-2033 (US$ Million, AGR%, CAGR%)
Table 61 Latin America Next Generation Sequencing Market Forecast by Type, 2023-2033 (US$ Million, AGR%, CAGR%)
Table 62 Latin America Next Generation Sequencing Market Forecast by Workflow, 2023-2033 (US$ Million, AGR%, CAGR%)
Table 63 Latin America Next Generation Sequencing Market Forecast by Application, 2023-2033 (US$ Million, AGR%, CAGR%)
Table 64 Latin America Next Generation Sequencing Market Forecast by End-use, 2023-2033 (US$ Million, AGR%, CAGR%)
Table 65 Brazil Next Generation Sequencing Market Forecast, 2023-2033 (US$ Million, AGR%, CAGR%)
Table 66 Mexico Next Generation Sequencing Market Forecast, 2023-2033 (US$ Million, AGR%, CAGR%)
Table 67 Argentina Next Generation Sequencing Market Forecast, 2023-2033 (US$ Million, AGR%, CAGR%)
Table 68 Colombia Next Generation Sequencing Market Forecast, 2023-2033 (US$ Million, AGR%, CAGR%)
Table 69 Rest of Latin America Next Generation Sequencing Market Forecast, 2023-2033 (US$ Million, AGR%, CAGR%)
Table 70 MEA Next Generation Sequencing Market Forecast by Country, 2023-2033 (US$ Million, AGR%, CAGR%)
Table 71 MEA Next Generation Sequencing Market Forecast by Type, 2023-2033 (US$ Million, AGR%, CAGR%)
Table 72 MEA Next Generation Sequencing Market Forecast by Workflow, 2023-2033 (US$ Million, AGR%, CAGR%)
Table 73 MEA Next Generation Sequencing Market Forecast by Application, 2023-2033 (US$ Million, AGR%, CAGR%)
Table 74 MEA Next Generation Sequencing Market Forecast by End-use, 2023-2033 (US$ Million, AGR%, CAGR%)
Table 75 GCC Countries Next Generation Sequencing Market Forecast, 2023-2033 (US$ Million, AGR%, CAGR%)
Table 76 South Africa Next Generation Sequencing Market Forecast, 2023-2033 (US$ Million, AGR%, CAGR%)
Table 77 Rest of MEA Next Generation Sequencing Market Forecast, 2023-2033 (US$ Million, AGR%, CAGR%)
Table 78 Strategic Outlook
Table 79 Illumina Inc.: Key Details, (CEO, HQ, Revenue, Founded, No. of Employees, Company Type, Website, Business Segment)
Table 80 Illumina Inc.: Product Benchmarking
Table 81 Illumina Inc.: Strategic Outlook
Table 82 F. Hoffmann-La Roche Ltd: Key Details, (CEO, HQ, Revenue, Founded, No. of Employees, Company Type, Website, Business Segment)
Table 83 F. Hoffmann-La Roche Ltd: Product Benchmarking
Table 84 F. Hoffmann-La Roche Ltd: Strategic Outlook
Table 85 QIAGEN: Key Details, (CEO, HQ, Revenue, Founded, No. of Employees, Company Type, Website, Business Segment)
Table 86 QIAGEN: Product Benchmarking
Table 87 QIAGEN Strategic Outlook
Table 88 Thermo Fisher Scientific Inc.: Key Details, (CEO, HQ, Revenue, Founded, No. of Employees, Company Type, Website, Business Segment)
Table 89 Thermo Fisher Scientific Inc.: Product Benchmarking
Table 90 Thermo Fisher Scientific Inc.: Strategic Outlook
Table 91 Bio-Rad Laboratories, Inc.: Key Details, (CEO, HQ, Revenue, Founded, No. of Employees, Company Type, Website, Business Segment)
Table 92 Bio-Rad Laboratories, Inc.: Product Benchmarking
Table 93 Bio-Rad Laboratories, Inc.: Strategic Outlook
Table 94 PerkinElmer Inc.: Key Details, (CEO, HQ, Revenue, Founded, No. of Employees, Company Type, Website, Business Segment)
Table 95 PerkinElmer Inc.: Product Benchmarking
Table 96 PerkinElmer Inc.: Strategic Outlook
Table 97 Eurofins Scientific: Key Details, (CEO, HQ, Revenue, Founded, No. of Employees, Company Type, Website, Business Segment)
Table 98 Eurofins Scientific: Product Benchmarking
Table 99 Eurofins Scientific: Strategic Outlook
Table 100 Agilent Technologies, Inc.: Key Details, (CEO, HQ, Revenue, Founded, No. of Employees, Company Type, Website, Business Segment)
Table 101 Agilent Technologies, Inc.: Product Benchmarking
Table 102 Agilent Technologies, Inc.: Strategic Outlook
List of Figures
Figure 1 Next Generation Sequencing Market Segmentation
Figure 2 Next Generation Sequencing Market by Type: Market Attractiveness Index
Figure 3 Next Generation Sequencing Market by Workflow: Market Attractiveness Index
Figure 4 Next Generation Sequencing Market by Application: Market Attractiveness Index
Figure 5 Next Generation Sequencing Market by End-use: Market Attractiveness Index
Figure 6 Next Generation Sequencing Market Attractiveness Index, by Region
Figure 7 Next Generation Sequencing Market: Market Dynamics
Figure 8 Next Generation Sequencing Market by Region, 2023-2033 (US$ Million, AGR %): “V” Shaped Recovery
Figure 9 Next Generation Sequencing Market by Region, 2023-2033 (US$ Million, AGR %): “U” Shaped Recovery
Figure 10 Next Generation Sequencing Market by Region, 2023-2033 (US$ Million, AGR %): “W” Shaped Recovery
Figure 11 Next Generation Sequencing Market by Region, 2023-2033 (US$ Million, AGR %): “L” Shaped Recovery
Figure 12 Next Generation Sequencing Market: Porter’s Five Forces Analysis
Figure 13 Next Generation Sequencing Market: PEST Analysis
Figure 14 Next Generation Sequencing Market by Type: Market Attractiveness Index
Figure 15 Next Generation Sequencing Market Forecast by Type, 2023-2033 (US$ Million, AGR %)
Figure 16 Next Generation Sequencing Market Share Forecast by Type, 2023, 2028, 2033 (%)
Figure 17 Consumables Segment Market Forecast by Region, 2023-2033 (US$ Million, AGR %)
Figure 18 Consumables Segment Market Share Forecast by Region, 2023 & 2033 (%)
Figure 19 Bioinformatics Segment Market Forecast by Region, 2023-2033 (US$ Million, AGR %)
Figure 20 Bioinformatics Segment Market Share Forecast by Region, 2023 & 2033 (%)
Figure 21 Sequencing Services Segment Market Forecast by Region, 2023-2033 (US$ Million, AGR %)
Figure 22 Sequencing Services Segment Market Share Forecast by Region, 2023 & 2033 (%)
Figure 23 Pre-sequencing Services Segment Market Forecast by Region, 2023-2033 (US$ Million, AGR %)
Figure 24 Pre-sequencing Services Segment Market Share Forecast by Region, 2023 & 2033 (%)
Figure 25 Instruments Segment Market Forecast by Region, 2023-2033 (US$ Million, AGR %)
Figure 26 Instruments Segment Market Share Forecast by Region, 2023 & 2033 (%)
Figure 27 Next Generation Sequencing Market by Workflow: Market Attractiveness Index
Figure 28 Next Generation Sequencing Market Forecast by Workflow, 2023-2033 (US$ Million, AGR %)
Figure 29 Next Generation Sequencing Market Share Forecast by Workflow 2023, 2028, 2033 (%)
Figure 30 Library Preparation Segment Market Forecast by Region, 2023-2033 (US$ Million, AGR %)
Figure 31 Library Preparation Segment Market Share Forecast by Region, 2023 & 2033 (%)
Figure 32 Sequencing Segment Market Forecast by Region, 2023-2033 (US$ Million, AGR %)
Figure 33 Sequencing Segment Market Share Forecast by Region, 2023 & 2033 (%)
Figure 34 Data Analysis Segment Market Forecast by Region, 2023-2033 (US$ Million, AGR %)
Figure 35 Data Analysis Segment Market Share Forecast by Region, 2023 & 2033 (%)
Figure 36 Next Generation Sequencing Market by Application: Market Attractiveness Index
Figure 37 Next Generation Sequencing Market Share Forecast by Application 2023, 2028, 2033 (%)
Figure 38 Oncology Segment Market Forecast by Region, 2023-2033 (US$ Million, AGR %)
Figure 39 Oncology Segment Market Share Forecast by Region, 2023 & 2033 (%)
Figure 40 Reproductive Health Segment Market Forecast by Region, 2023-2033 (US$ Million, AGR %)
Figure 41 Reproductive Health Segment Market Share Forecast by Region, 2023 & 2033 (%)
Figure 42 Genetic and Rare Diseases Segment Market Forecast by Region, 2023-2033 (US$ Million, AGR %)
Figure 43 Genetic and Rare Diseases Segment Market Share Forecast by Region, 2023 & 2033 (%)
Figure 44 Consumer Genomics Segment Market Forecast by Region, 2023-2033 (US$ Million, AGR %)
Figure 45 Consumer Genomics Segment Market Share Forecast by Region, 2023 & 2033 (%)
Figure 46 Agrigenomics and Forensics Segment Market Forecast by Region, 2023-2033 (US$ Million, AGR %)
Figure 47 Agrigenomics and Forensics Segment Market Share Forecast by Region, 2023 & 2033 (%)
Figure 48 Others Segment Market Forecast by Region, 2023-2033 (US$ Million, AGR %)
Figure 49 Others Segment Market Share Forecast by Region, 2023 & 2033 (%)
Figure 50 Next Generation Sequencing Market by End-use: Market Attractiveness Index
Figure 51 Next Generation Sequencing Market Forecast by End-use, 2023-2033 (US$ Million, AGR %)
Figure 52 Next Generation Sequencing Market Share Forecast by End-use 2023, 2028, 2033 (%)
Figure 53 Hospitals and Clinics Segment Market Forecast by Region, 2023-2033 (US$ Million, AGR %)
Figure 54 Hospitals and Clinics Segment Market Share Forecast by Region, 2023 & 2033 (%)
Figure 55 Academic and Research Institutes Segment Market Forecast by Region, 2023-2033 (US$ Million, AGR %)
Figure 56 Academic and Research Institutes Segment Market Share Forecast by Region, 2023 & 2033 (%)
Figure 57 Pharmaceutical and Biotech Companies Segment Market Forecast by Region, 2023-2033 (US$ Million, AGR %)
Figure 58 Pharmaceutical and Biotech Companies Segment Market Share Forecast by Region, 2023 & 2033 (%)
Figure 59 Others Segment Market Forecast by Region, 2023-2033 (US$ Million, AGR %)
Figure 60 Others Segment Market Share Forecast by Region, 2023 & 2033 (%)
Figure 61 Next Generation Sequencing Market Forecast by Region 2023 and 2033 (Revenue, CAGR%)
Figure 62 Next Generation Sequencing Market Share Forecast by Region 2023, 2028, 2033 (%)
Figure 63 Next Generation Sequencing Market by Region, 2023-2033 (US$ Million, AGR %)
Figure 64 North America Next Generation Sequencing Market Attractiveness Index
Figure 65 North America Next Generation Sequencing Market by Region, 2023, 2028 & 2033 (US$ Million)
Figure 66 North America Next Generation Sequencing Market Share Forecast by Country, 2023 & 2033 (%)
Figure 67 North America Next Generation Sequencing Market Share Forecast by Type, 2023 & 2033 (%)
Figure 68 North America Next Generation Sequencing Market Share Forecast by Workflow, 2023 & 2033 (%)
Figure 69 North America Next Generation Sequencing Market Share Forecast by Application, 2023 & 2033 (%)
Figure 70 North America Next Generation Sequencing Market Share Forecast by End-use, 2023 & 2033 (%)
Figure 71 U.S. Next Generation Sequencing Market Forecast, 2023-2033 (US$ Million, AGR %)
Figure 72 Canada Next Generation Sequencing Market Forecast, 2023-2033 (US$ Million, AGR %)
Figure 73 Europe Next Generation Sequencing Market Attractiveness Index
Figure 74 Europe Next Generation Sequencing Market by Region, 2023, 2028 & 2033 (US$ Million)
Figure 75 Europe Next Generation Sequencing Market Share Forecast by Country, 2023 & 2033 (%)
Figure 76 Europe Next Generation Sequencing Market Share Forecast by Type, 2023 & 2033 (%)
Figure 77 Europe Next Generation Sequencing Market Share Forecast by Workflow, 2023 & 2033 (%)
Figure 78 Europe Next Generation Sequencing Market Share Forecast by Application, 2023 & 2033 (%)
Figure 79 Europe Next Generation Sequencing Market Share Forecast by End-use, 2023 & 2033 (%)
Figure 80 Germany Next Generation Sequencing Market Forecast, 2023-2033 (US$ Million, AGR %)
Figure 81 France Next Generation Sequencing Market Forecast, 2023-2033 (US$ Million, AGR %)
Figure 82 U.K. Next Generation Sequencing Market Forecast, 2023-2033 (US$ Million, AGR %)
Figure 83 Italy Next Generation Sequencing Market Forecast, 2023-2033 (US$ Million, AGR %)
Figure 84 Spain Next Generation Sequencing Market Forecast, 2023-2033 (US$ Million, AGR %)
Figure 85 Russia Next Generation Sequencing Market Forecast, 2023-2033 (US$ Million, AGR %)
Figure 86 Rest of Europe Next Generation Sequencing Market Forecast, 2023-2033 (US$ Million, AGR %)
Figure 87 Asia Pacific Next Generation Sequencing Market Attractiveness Index
Figure 88 Asia Pacific Next Generation Sequencing Market by Region, 2023, 2028 & 2033 (US$ Million)
Figure 89 Asia Pacific Next Generation Sequencing Market Share Forecast by Country, 2023 & 2033 (%)
Figure 90 Asia Pacific Next Generation Sequencing Market Share Forecast by Type, 2023 & 2033 (%)
Figure 91 Asia Pacific Next Generation Sequencing Market Share Forecast by Workflow, 2023 & 2033 (%)
Figure 92 Asia Pacific Next Generation Sequencing Market Share Forecast by Application, 2023 & 2033 (%)
Figure 93 Asia Pacific Next Generation Sequencing Market Share Forecast by End-use, 2023 & 2033 (%)
Figure 94 Japan Next Generation Sequencing Market Forecast, 2023-2033 (US$ Million, AGR %)
Figure 95 China Next Generation Sequencing Market Forecast, 2023-2033 (US$ Million, AGR %)
Figure 96 India Next Generation Sequencing Market Forecast, 2023-2033 (US$ Million, AGR %)
Figure 97 Australia Next Generation Sequencing Market Forecast, 2023-2033 (US$ Million, AGR %)
Figure 98 South Korea Next Generation Sequencing Market Forecast, 2023-2033 (US$ Million, AGR %)
Figure 99 Singapore Next Generation Sequencing Market Forecast, 2023-2033 (US$ Million, AGR %)
Figure 100 Rest of Asia Pacific Next Generation Sequencing Market Forecast, 2023-2033 (US$ Million, AGR %)
Figure 101 Latin America Next Generation Sequencing Market Attractiveness Index
Figure 102 Latin America Next Generation Sequencing Market by Region, 2023, 2028 & 2033 (US$ Million)
Figure 103 Latin America Next Generation Sequencing Market Share Forecast by Country, 2023 & 2033 (%)
Figure 104 Latin America Next Generation Sequencing Market Share Forecast by Type, 2023 & 2033 (%)
Figure 105 Latin America Next Generation Sequencing Market Share Forecast by Workflow, 2023 & 2033 (%)
Figure 106 Latin America Next Generation Sequencing Market Share Forecast by Application, 2023 & 2033 (%)
Figure 107 Latin America Next Generation Sequencing Market Share Forecast by End-use, 2023 & 2033 (%)
Figure 108 Brazil Next Generation Sequencing Market Forecast, 2023-2033 (US$ Million, AGR %)
Figure 109 Mexico Next Generation Sequencing Market Forecast, 2023-2033 (US$ Million, AGR %)
Figure 110 Argentina Next Generation Sequencing Market Forecast, 2023-2033 (US$ Million, AGR %)
Figure 111 Colombia Next Generation Sequencing Market Forecast, 2023-2033 (US$ Million, AGR %)
Figure 112 Rest of Latin America Next Generation Sequencing Market Forecast, 2023-2033 (US$ Million, AGR %)
Figure 113 MEA Next Generation Sequencing Market Attractiveness Index
Figure 114 MEA Next Generation Sequencing Market by Region, 2023, 2028 & 2033 (US$ Million)
Figure 115 MEA Next Generation Sequencing Market Share Forecast by Country, 2023 & 2033 (%)
Figure 116 MEA Next Generation Sequencing Market Share Forecast by Type, 2023 & 2033 (%)
Figure 117 MEA Next Generation Sequencing Market Share Forecast by Workflow, 2023 & 2033 (%)
Figure 118 MEA Next Generation Sequencing Market Share Forecast by Application, 2023 & 2033 (%)
Figure 119 MEA Next Generation Sequencing Market Share Forecast by End-use, 2023 & 2033 (%)
Figure 120 GCC Countries Next Generation Sequencing Market Forecast, 2023-2033 (US$ Million, AGR %)
Figure 121 South Africa Next Generation Sequencing Market Forecast, 2023-2033 (US$ Million, AGR %)
Figure 122 Rest of MEA Next Generation Sequencing Market Forecast, 2023-2033 (US$ Million, AGR %)
Figure 123 Next Generation Sequencing Market: Company Share/Ranking, 2022
Figure 124 Illumina Inc.: Net Revenue, 2018-2022 (US$ Million, AGR%)
Figure 125 Illumina Inc.: R&D, 2018-2022 (US$ Million, AGR%)
Figure 126 Illumina Inc. Regional Market Shares, 2022
Figure 127 F. Hoffmann-La Roche Ltd: Net Revenue, 2018-2022 (US$ Million, AGR%)
Figure 128 F. Hoffmann-La Roche Ltd: R&D, 2018-2022 (US$ Million, AGR%)
Figure 129 QIAGEN: Net Revenue, 2018-2022 (US$ Million, AGR%)
Figure 130 QIAGEN: R&D, 2018-2022 (US$ Million, AGR%)
Figure 131 QIAGEN: Regional Market Shares, 2021
Figure 132 Thermo Fisher Scientific Inc.: Net Revenue, 2018-2022 (US$ Million, AGR%)
Figure 133 Thermo Fisher Scientific Inc.: R&D, 2018-2022 (US$ Million, AGR%)
Figure 134 Thermo Fisher Scientific Inc.: Regional Market Shares, 2022
Figure 135 Bio-Rad Laboratories, Inc.: Net Revenue, 2018-2022 (US$ Million, AGR%)
Figure 136 Bio-Rad Laboratories, Inc.: R&D, 2018-2022 (US$ Million, AGR%)
Figure 137 Bio-Rad Laboratories, Inc.: Regional Market Shares, 2021
Figure 138 Eurofins Scientific: Net Revenue, 2018-2022 (US$ Million, AGR%)
Figure 139 Agilent Technologies, Inc.: Net Revenue, 2018-2022 (US$ Million, AGR%)
ページTOPに戻る
Visiongain社のヘルスケアと医薬・化学品分野での最新刊レポート
本レポートと同じKEY WORD(sequencing market)の最新刊レポート
よくあるご質問
Visiongain社はどのような調査会社ですか?
英国の調査会社ヴィジョンゲイン社(Visiongain)は、通信とエネルギーのほか、自動車や化学・医薬品、金属など、広範な市場を対象に調査を行っています。自動車市場については、市場全般に関する調査のほ... もっと見る
調査レポートの納品までの日数はどの程度ですか?
在庫のあるものは速納となりますが、平均的には 3-4日と見て下さい。
但し、一部の調査レポートでは、発注を受けた段階で内容更新をして納品をする場合もあります。
発注をする前のお問合せをお願いします。
注文の手続きはどのようになっていますか?
1)お客様からの御問い合わせをいただきます。
2)見積書やサンプルの提示をいたします。
3)お客様指定、もしくは弊社の発注書をメール添付にて発送してください。
4)データリソース社からレポート発行元の調査会社へ納品手配します。
5) 調査会社からお客様へ納品されます。最近は、pdfにてのメール納品が大半です。
お支払方法の方法はどのようになっていますか?
納品と同時にデータリソース社よりお客様へ請求書(必要に応じて納品書も)を発送いたします。
お客様よりデータリソース社へ(通常は円払い)の御振り込みをお願いします。
請求書は、納品日の日付で発行しますので、翌月最終営業日までの当社指定口座への振込みをお願いします。振込み手数料は御社負担にてお願いします。
お客様の御支払い条件が60日以上の場合は御相談ください。
尚、初めてのお取引先や個人の場合、前払いをお願いすることもあります。ご了承のほど、お願いします。
データリソース社はどのような会社ですか?
当社は、世界各国の主要調査会社・レポート出版社と提携し、世界各国の市場調査レポートや技術動向レポートなどを日本国内の企業・公官庁及び教育研究機関に提供しております。
世界各国の「市場・技術・法規制などの」実情を調査・収集される時には、データリソース社にご相談ください。
お客様の御要望にあったデータや情報を抽出する為のレポート紹介や調査のアドバイスも致します。
|
|

