プレシジョンメディシン市場レポート:2023-2033
Precision Medicine Market Report 2023-2033
レポート詳細
プレシジョンメディシン市場レポート 2023-2033 : 本レポートは、業界とその基礎となる原動力をより良く理解したい場合、新たな収益ポケットを目指す大手企業にとって貴重なものとなる... もっと見る
※上記価格は部署ライセンス(Departmental licence)価格です。
その他の価格についてはデータリソースまでお問合せください。
日本語のページは自動翻訳を利用し作成しています。
実際のレポートは英文のみでご納品いたします。

|

|
サマリー
レポート詳細
プレシジョンメディシン市場レポート 2023-2033: 本レポートは、業界とその基礎となる原動力をより良く理解したい場合、新たな収益ポケットを目指す大手企業にとって貴重なものとなるでしょう。異業種への進出や新地域での既存事業の拡大を希望する企業にも有用です。
プレシジョンメディシンの応用拡大と標的治療への需要の高まり
遺伝性疾患に関しては、プレシジョンメディシンの普及が進んでいる。神経遺伝学、心血管ゲノミクス、希少疾患の遺伝子検査の領域では、この方法がより頻繁に採用されている。さらに、非侵襲的出生前検査、薬理ゲノミクス、遺伝性疾患の遺伝的リスクのスクリーニングも、プレシジョンメディシンの応用として普及してきている。また、多くの製薬会社がアルツハイマー病やパーキンソン病などの神経疾患に対する精密医療の実現に注力している。プレシジョンメディシン企業、バイオ医薬品企業、製薬企業は、標的治療を適切な候補者に提供し、プレシジョンメディシン市場の拡大をサポートするために、患者選択診断の枠組みを医薬品開発の初期段階に統合する努力を続けている。ゲノムやプロテオミクス技術、プレシジョンメディシンの利用が拡大している主な原因のひとつは、個別化医療の利点に対する理解が進んでいることである。多くの慢性疾患や病態に対する個別化治療計画には、特定の患者における特定の薬剤の適応を調査するプレシジョンメディシンを含める必要がある。
プレシジョンメディシンの高いコスト
個別化治療は製薬ビジネスにおいて確立されているが、そのコストが支払者、患者、医師のアクセスを妨げている。投資に対するリターンが保証されているにもかかわらず、これらの検査の初期費用が高いため、エンドユーザーの大多数、特に貧しい国の人々には手が届かない。その結果、製薬会社、リファレンスラボ、医療施設、CROのようなエンドユーザーは、このような診断処置のコストを負担と見なし、第三者の精密診断サービスを利用することを選択する。必然的に、現在の医療プライバシーと調査ガイドラインは、大規模な患者集団に関する膨大な量のデータ収集を可能にするには不十分であり、民間の医療システムにはそのためのインフラがないため、精密医療の価格をさらに押し上げている。
市場調査レポートを購入する前にすべき質問とは?
- プレシジョンメディシン市場はどのように進化しているのか?
- 何がプレシジョンメディシン市場を牽引し、抑制しているのか?
- ポイントオブケア診断の各サブ市場セグメントは予測期間中にどのように成長し、2033年にこれらのサブ市場の売上はどの程度になるのか?
- 2022年から2033年にかけて、プレシジョンメディシンの各サブマーケットの市場シェアはどのように推移するのか?
- 2023年から2033年にかけて市場全体を牽引する主な要因は何か?
- 主要なプレシジョンメディシン市場はマクロ経済の動きに大枠で追随するのか、それとも個々の国内市場が他を凌駕するのか。
- 2033年までに各国市場のシェアはどのように変化し、2033年に市場をリードするのはどの地域か?
- 主要プレーヤーは誰で、予測期間中の見通しは?
- これらの大手企業のプレシジョンメディシンプロジェクトは何か?
- 2023年から2033年の間に、業界はどのように発展していくのか?現在および今後10年間に行われるプレシジョンメディシンプロジェクトにはどのような意味があるのか?
- 精密医療市場をさらに拡大するために、製品の商業化の必要性は高まっているのか?
- プレシジョンメディシン市場はどこに向かい、どのようにすれば市場の最前線に立てるのか?
- 新製品やサービスラインに対する最適な投資オプションは何か?
- 企業を新たな成長軌道に乗せ、C-suiteに移行させるための重要な展望とは?
これがプレシジョンメディシン市場に現在、そして今後10年間でどのような影響を与えるかを見極める必要がある:
- 347ページにわたる本レポートでは、149の表、220のチャート、グラフを掲載しています。
- 本レポートでは、業界における主要な有利分野を取り上げているため、今すぐターゲットを絞ることができます。
- 世界、地域、国の売上と成長に関する詳細な分析が含まれています。
- 競合他社が成功した主なトレンド、変化、収益予測をハイライトしています。
本レポートは、プレシジョンメディシン市場が今後10年間でどのように発展していくのか、またCOVID-19の景気後退と好転の変動に合わせてどのように発展していくのかをお伝えします。この市場は、過去10年間のどの時点よりも今が重要である。
2033年までの予測やその他の分析から、商業的な展望が明らかになる
- 2033年までの収益予測に加え、直近の業績、成長率、市場シェアもご覧いただけます。
- ビジネスの展望と展開に関する独自の分析をご覧いただけます。
- 定性的分析(市場ダイナミクス、促進要因、機会、阻害要因、課題を含む)、コスト構造、プレシジョンメディシン価格上昇の影響、最近の動向をご覧いただけます。
本レポートには、COVID-19が業界と貴社にどのような影響を与えるかについてのデータ分析と貴重な洞察が含まれている。本レポートでは、COVID-19の4つの回収パターンとその影響、すなわち「V」、「L」、「W」、「U」について論じている。
レポート対象セグメント
製品
- 診断薬
- 遺伝子検査
- バイオマーカーに基づく検査
- その他の診断検査
- 治療薬
用途
- 腫瘍学
- 中枢神経系
- 免疫学
- 呼吸器
- その他
技術
- 創薬
- バイオインフォマティクス
- ビッグデータ解析
- 遺伝子シーケンス
- コンパニオン診断
- その他の技術
エンドユーザー
- 病院
- 診断センター
- 研究・学術機関
- その他のエンドユーザー
世界市場全体と各分野の売上予測に加え、5つの地域と25の主要国市場の売上予測も掲載しています:
北米
- アメリカ
- カナダ
欧州
- ドイツ
- 英国
- フランス
- イタリア
- スペイン
- スイス
- オランダ
- その他の欧州
アジア太平洋
- 中国
- 日本
- インド
- オーストラリア
- 韓国
- シンガポール
- その他のアジア太平洋地域
ラテンアメリカ
- ブラジル
- メキシコ
- アルゼンチン
- その他のラテンアメリカ
MEA
- GCC
- 南アフリカ
- エジプト
- その他のMEA
本レポートには、プレシジョンメディシン市場の2023年から2033年までの主要企業のプロファイルも含まれており、これらの企業の事業のこのセグメントに焦点を当てている。
主要企業と市場成長の可能性
・ Abbott
・ Abnova Corporation
・ Agilent Technologies Inc.
・ AstraZeneca
・ Bayer AG
・ Biogen
・ bioMérieux SA
・ Bristol-Myers Squibb Company
・ Danaher
・ F. Hoffmann-La Roche Ltd
・ GE HealthCare
・ GSK plc
・ Illumina, Inc.
・ Johnson & Johnson Services, Inc.
・ Laboratory Corporation of America Holdings
・ Lilly
・ Myriad Genetics Inc.
・ NanoString Technologies, Inc.
・ Novartis AG
・ Pfizer Inc.
・ Qiagen
・ Quest Diagnostics Incorporated
・ Teva Pharmaceutical Industries Ltd.
・ Thermo Fisher Scientific Inc.
プレシジョンメディシン市場全体の世界売上高、2023年~2033年、金額ベースでは、2023年に780億米ドルを突破する。2033年まで力強い収益成長を予測している。当研究所では、最大の可能性を秘めた組織を特定しています。各社の能力、進捗状況、商業的見通しを把握し、一歩先を行くための一助としてください。
プレシジョンメディシン市場、2023-2033年レポートはどのように役立つのか?
要約すると、340ページを超えるこのレポートは、以下のような知識を提供する:
- プレシジョンメディシン市場、2023年から2033年までの収益予測 製品、モード、サンプル、プラットフォーム、エンドユーザー、各予測を世界および地域レベルで掲載 - 業界の展望を発見し、投資と収益に最も有利な場所を見つけます。
- 5つの地域と25の主要国市場の2033年までの収益予測 - プレシジョンメディシン市場、北米、欧州、アジア太平洋、ラテンアメリカ、MEAの2023年から2033年までの市場予測をご覧ください。また、米国、カナダ、メキシコ、ブラジル、ドイツ、フランス、英国、イタリア、スペイン、スイス、オランダ、中国、インド、日本、オーストラリア、韓国、シンガポール、アルゼンチン、GCC、南アフリカ、エジプトなどの著名経済圏の市場も予測しています。
- 既存企業および市場参入を目指す企業の展望 - プレシジョンメディシン市場に関わる主要企業25社の企業プロファイルを含む、2023年から2033年までの展望。
独自の予測による定量的・定性的分析をご覧ください。私たちのレポートだけに含まれる情報を入手し、貴重なビジネスインテリジェンスで情報を得ることができます。
他にはない情報
私たちの新しいレポートがあれば、知識に遅れをとったり、チャンスを逃したりする可能性が低くなります。弊社のレポートが貴社の調査、分析、意思決定にどのように役立つかをご覧ください。Visiongainの調査は、プレシジョンメディシン市場、2023年から2033年、市場をリードする企業の商業分析を必要とするすべての人のためのものです。データ、トレンド、予測をご覧いただけます。
ページTOPに戻る
目次
目次
1 レポート概要
1.1 研究の目的
1.2 プレシジョンメディシン市場の紹介
1.3 本レポートの内容
1.4 本レポートを読むべき理由
1.5 本分析レポートが回答する主な質問
1.6 本レポートは誰のためのものか?
1.7 方法論
1.7.1 市場の定義
1.7.2 市場評価・予測手法
1.7.3 データの検証
1.7.3.1 一次調査
1.7.3.2 セカンダリーリサーチ
1.8 よくある質問(FAQ)
1.9 Visiongainの関連レポート
1.10 Visiongainについて
2 エグゼクティブ・サマリー
3 市場の概要
3.1 主要な調査結果
3.2 市場ダイナミクス
3.2.1 市場促進要因
3.2.1.1 世界的ながん罹患率の増加が個別化医療の需要を押し上げる
3.2.1.2 プレシジョンメディシンの適用範囲の拡大
3.2.1.3 標的療法への需要の加速
3.2.1.4 従来の "One-Size-Fits-All "治療に対するプレシジョンメディシンの優位性の高まり
3.2.2 市場抑制要因
3.2.2.1 プレシジョンメディシンの高コスト
3.2.2.2 データの相互運用性の欠如
3.2.2.3 新興国における診断分野への資金不足
3.2.3 市場機会
3.2.3.1 ヘルスケアにおけるAI利用の拡大がプレシジョンメディシン需要を押し上げる
3.2.3.2 遺伝子治療と遺伝子編集技術の受け入れ拡大
3.3 COVID-19インパクト分析
3.4 ポーターのファイブフォース分析
3.4.1 サプライヤーの交渉力
3.4.2 買い手の交渉力
3.4.3 新規参入者の脅威
3.4.4 代替品の脅威
3.4.5 競争上のライバル関係
3.5 SWOT分析
3.6 PEST分析
4 プレシジョンメディシン市場分析:製品タイプ別
4.1 主要な調査結果
4.2 製品タイプ別セグメント 市場魅力度指数
4.3 製品タイプ別プレシジョンメディシン市場規模推定と予測
4.4 診断薬
4.4.1 2023〜2033年の地域別市場規模(US$ Billion)
4.4.2 地域別市場シェア、2023年・2033年(%)
4.4.3 遺伝子検査
4.4.3.1 2023〜2033年の地域別市場規模(US$ Billion)
4.4.3.2 地域別市場シェア、2023年・2033年(%)
4.4.4 バイオマーカーに基づく検査
4.4.4.1 2023〜2033年の地域別市場規模(US$ Billion)
4.4.4.2 地域別市場シェア、2023年・2033年(%)
4.4.5 その他
4.4.5.1 2023〜2033年の地域別市場規模(US$ Billion)
4.4.5.2 地域別市場シェア、2023年・2033年(%)
4.5 治療薬
4.5.1 2023〜2033年の地域別市場規模(US$ Billion)
4.5.2 地域別市場シェア、2023年・2033年(%)
5 プレシジョンメディシン市場:用途別、2023-2033年
5.1 主要調査結果
5.2 用途別セグメント市場魅力度指数
5.3 プレシジョンメディシン市場、用途別
5.4 がん領域
5.4.1 2023〜2033年の地域別市場規模(US$ Billion)
5.4.2 地域別市場シェア、2023年・2033年(%)
5.5 中枢神経系
5.5.1 2023〜2033年の地域別市場規模(US$ Billion)
5.5.2 地域別市場シェア、2023年・2033年(%)
5.6 免疫学
5.6.1 2023〜2033年の地域別市場規模(US$ Billion)
5.6.2 地域別市場シェア、2023年・2033年(%)
5.7 呼吸器
5.7.1 2023〜2033年の地域別市場規模(US$ Billion)
5.7.2 地域別市場シェア、2023年・2033年(%)
5.8 その他
5.8.1 2023〜2033年の地域別市場規模(US$ Billion)
5.8.2 地域別市場シェア、2023年・2033年(%)
6 プレシジョンメディシン市場:技術別、2023-2033年
6.1 主要調査結果
6.2 技術セグメント市場魅力度指数
6.3 プレシジョンメディシン技術別市場規模推定と予測
6.4 創薬
6.4.1 2023〜2033年の地域別市場規模(US$ Billion)
6.4.2 地域別市場シェア、2023年・2033年(%)
6.5 バイオインフォマティクス
6.5.1 2023〜2033年の地域別市場規模(US$ Billion)
6.5.2 地域別市場シェア、2023年・2033年(%)
6.6 ビッグデータ分析
6.6.1 2023〜2033年の地域別市場規模(US$ Billion)
6.6.2 地域別市場シェア、2023年・2033年(%)
6.7 遺伝子シーケンス
6.7.1 2023〜2033年の地域別市場規模(US$ Billion)
6.7.2 地域別市場シェア、2023年・2033年(%)
6.8 コンパニオン診断薬
6.8.1 2023〜2033年の地域別市場規模(US$ Billion)
6.8.2 地域別市場シェア、2023年・2033年(%)
6.9 その他の技術
6.9.1 2023〜2033年の地域別市場規模(US$ Billion)
6.9.2 地域別市場シェア、2023年・2033年(%)
7 プレシジョンメディシン市場:エンドユーザー別、2023-2033年
7.1 主要調査結果
7.2 エンドユーザーセグメント市場魅力度指数
7.3 プレシジョンメディシン市場エンドユーザー別市場規模推定と予測
7.4 病院
7.4.1 2023〜2033年の地域別市場規模(US$ Billion)
7.4.2 地域別市場シェア、2023年・2033年(%)
7.5 診断センター
7.5.1 2023〜2033年の地域別市場規模(US$ Billion)
7.5.2 地域別市場シェア、2023年・2033年(%)
7.6 研究・学術機関
7.6.1 2023〜2033年の地域別市場規模(US$ Billion)
7.6.2 地域別市場シェア、2023年・2033年(%)
7.7 その他のエンドユーザー
7.7.1 2023〜2033年の地域別市場規模(US$ Billion)
7.7.2 地域別市場シェア、2023年・2033年(%)
8 プレシジョンメディシン市場分析:地域別
8.1 主要な調査結果
8.2 地域別市場規模の推定と予測
9 北米のプレシジョンメディシン市場分析
9.1 主要な調査結果
9.2 北米のプレシジョンメディシン市場魅力度指数
9.3 北米のプレシジョンメディシン国別市場、2023年、2028年、2033年(US$ Billion)
9.4 北米のプレシジョンメディシン市場規模推定と予測:国別
9.5 北米のプレシジョンメディシン市場規模推定と予測:製品タイプ別
9.6 北米のプレシジョンメディシン市場規模推定と予測:用途別
9.7 北米のプレシジョンメディシン市場規模推定と予測:技術別
9.8 北米のプレシジョンメディシン市場規模推定と予測:エンドユーザー別
9.9 米国のプレシジョンメディシン市場分析
9.10 カナダのプレシジョンメディシン市場分析
10 欧州のプレシジョンメディシン市場、2023-2033年
10.1 主要な調査結果
10.2 欧州のプレシジョンメディシン市場魅力度指数
10.3 欧州のプレシジョンメディシン国別市場、2023年、2028年、2033年(US$ Billion)
10.4 欧州のプレシジョンメディシン市場規模推定と予測:国別
10.5 欧州のプレシジョンメディシン市場規模推定と予測:製品タイプ別
10.6 欧州のプレシジョンメディシン市場規模推定と予測:用途別
10.7 欧州のプレシジョンメディシン市場規模推定と予測:技術別
10.8 欧州のプレシジョンメディシン市場規模推定と予測:エンドユーザー別
10.9 ドイツのプレシジョンメディシン市場分析
10.10 英国のプレシジョンメディシン市場分析
10.11 フランスのプレシジョンメディシン市場分析
10.12 イタリアのプレシジョンメディシン市場分析
10.13 スペインのプレシジョンメディシン市場分析
10.14 スイスのプレシジョンメディシン市場分析
10.15 オランダのプレシジョンメディシン市場分析
10.16 その他の欧州のプレシジョンメディシン市場分析
11 アジア太平洋地域のプレシジョンメディシン市場分析
11.1 主要な調査結果
11.2 アジア太平洋地域のプレシジョンメディシン市場魅力度指数
11.3 アジア太平洋地域のプレシジョンメディシン市場の国別市場規模、2023年、2028年、2033年(US$ Billion)
11.4 アジア太平洋地域のプレシジョンメディシン市場規模推定と予測:国別
11.5 アジア太平洋地域のプレシジョンメディシン市場規模推定と予測:製品タイプ別
11.6 アジア太平洋地域のプレシジョンメディシン市場規模推定と予測:用途別
11.7 アジア太平洋地域のプレシジョンメディシン市場規模推定と予測:技術別
11.8 アジア太平洋地域のプレシジョンメディシン市場規模推定と予測:エンドユーザー別
11.9 日本のプレシジョンメディシン市場分析
11.10 中国のプレシジョンメディシン市場分析
11.11 インドのプレシジョンメディシン市場分析
11.12 オーストラリアのプレシジョンメディシン市場分析
11.13 韓国のプレシジョンメディシン市場分析
11.14 シンガポールのプレシジョンメディシン市場分析
11.15 その他のアジア太平洋地域のプレシジョンメディシン市場分析
12 ラテンアメリカのプレシジョンメディシン市場分析
12.1 主要な調査結果
12.2 ラテンアメリカのプレシジョンメディシン市場魅力度指数
12.3 ラテンアメリカのプレシジョンメディシン国別市場、2023年、2028年、2033年(US$ Billion)
12.4 ラテンアメリカのプレシジョンメディシン市場規模推定と予測:国別
12.5 ラテンアメリカのプレシジョンメディシン市場規模推定と予測:製品タイプ別
12.6 ラテンアメリカのプレシジョンメディシン市場規模推定と予測:用途別
12.7 ラテンアメリカのプレシジョンメディシン市場規模推定と予測:技術別
12.8 ラテンアメリカのプレシジョンメディシン市場規模推定と予測:エンドユーザー別
12.9 ブラジルのプレシジョンメディシン市場分析
12.10 メキシコのプレシジョンメディシン市場分析
12.11 アルゼンチンののプレシジョンメディシン市場分析
12.12 その他のラテンアメリカのプレシジョンメディシン市場分析
13 MEAのプレシジョンメディシン市場分析
13.1 主要な調査結果
13.2 MEAのプレシジョンメディシン市場魅力度指数
13.3 MEAのプレシジョンメディシン国別市場、2023年、2028年、2033年(US$ Billion)
13.4 MEAのプレシジョンメディシン市場規模推定と予測:国別
13.5 MEAのプレシジョンメディシン市場規模推定と予測:製品タイプ別
13.6 MEAのプレシジョンメディシン市場規模推定と予測:用途別
13.7 MEAのプレシジョンメディシンの市場規模推定と予測:技術別
13.8 MEAのプレシジョンメディシン市場規模推定と予測:エンドユーザー別
13.9 GCCのプレシジョンメディシン市場分析
13.10 南アフリカのプレシジョンメディシン市場分析
13.11 エジプトのプレシジョンメディシン市場分析
13.12 その他のMEAプレシジョンメディシン市場分析
14 主要企業のプロファイル
14.1 競争環境、2022年
14.2 Pfizer Inc.
14.2.1 会社概要
14.2.2 会社概要
14.2.3 財務分析
14.2.3.1 純収入、2018-2022年
14.2.3.2 R&D、2018-2022年
14.2.3.3 地域市場シェア、2022年
14.2.4 製品ベンチマーク
14.2.5 戦略的展望
14.3 Qiagen
14.3.1 会社概要
14.3.2 会社概要
14.3.3 財務分析
14.3.3.1 純収入、2018-2022年
14.3.3.2 R&D、2018年〜2022年
14.3.3.3 地域市場シェア、2022年
14.3.4 製品ベンチマーク
14.3.5 戦略的展望
14.4 Quest Diagnostics Incorporated
14.4.1 会社概要
14.4.2 会社概要
14.4.3 財務分析
14.4.3.1 純収入、2018-2022年
14.4.4 製品ベンチマーク
14.4.5 戦略的展望
14.5 Agilent Technologies Inc.
14.5.1 会社概要
14.5.2 会社概要
14.5.3 財務分析
14.5.3.1 純収入、2018-2022年
14.5.3.2 R&D、2018年〜2022年
14.5.3.3 地域市場シェア、2022年
14.5.4 製品ベンチマーク
14.5.5 戦略的展望
14.6 Illumina, Inc.
14.6.1 会社概要
14.6.2 会社概要
14.6.3 財務分析
14.6.3.1 純収入、2018-2022年
14.6.3.2 R&D、2018年〜2022年
14.6.3.3 地域市場シェア、2022年
14.6.4 製品ベンチマーク
14.6.5 戦略的展望
14.7 Novartis AG
14.7.1 会社概要
14.7.2 会社概要
14.7.3 財務分析
14.7.3.1 純収入、2018-2022年
14.7.3.2 R&D、2018-2022年
14.7.3.3 地域市場シェア、2022年
14.7.4 製品ベンチマーク
14.7.5 戦略的展望
14.8 bioMerieux SA
14.8.1 会社概要
14.8.2 会社概要
14.8.3 財務分析
14.8.3.1 純収入、2018-2022年
14.8.3.2 R&D、2018年〜2022年
14.8.3.3 地域市場シェア、2022年
14.8.4 製品ベンチマーク
14.8.5 戦略的展望
14.9 F. Hoffmann-La Roche Ltd
14.9.1 会社概要
14.9.2 会社概要
14.9.3 財務分析
14.9.3.1 純収入、2018-2022年
14.9.3.2 R&D、2018年〜2022年
14.9.3.3 地域市場シェア、2022年
14.9.4 製品ベンチマーク
14.9.5 戦略的展望
14.10 Abbott
14.10.1 会社概要
14.10.2 会社概要
14.10.3 財務分析
14.10.3.1 純収入、2018-2022年
14.10.3.2 R&D、2018年〜2022年
14.10.3.3 地域市場シェア、2022年
14.10.4 製品ベンチマーク
14.10.5 戦略的展望
14.11 Lilly
14.11.1 会社概要
14.11.2 会社概要
14.11.3 財務分析
14.11.3.1 純収入、2018-2022年
14.11.3.2 R&D、2018-2022年
14.11.3.3 地域市場シェア、2022年
14.11.4 製品ベンチマーク
14.11.5 戦略的展望
14.12 Thermo Fisher Scientific Inc.
14.12.1 会社概要
14.12.2 会社概要
14.12.3 財務分析
14.12.3.1 純収入、2018-2022年
14.12.3.2 R&D、2018-2022年
14.12.3.3 地域市場シェア、2022年
14.12.4 製品ベンチマーク
14.12.5 戦略的展望
14.13 AstraZeneca
14.13.1 会社概要
14.13.2 会社概要
14.13.3 財務分析
14.13.3.1 純収入、2018-2022年
14.13.3.2 R&D、2018年〜2022年
14.13.3.3 地域市場シェア、2022年
14.13.4 製品ベンチマーク
14.13.5 戦略的展望
14.14 ミリアド・ジェネティクス社
14.14.1 会社概要
14.14.2 会社概要
14.14.3 財務分析
14.14.3.1 純収入、2018-2022年
14.14.3.2 R&D、2018年〜2022年
14.14.3.3 地域市場シェア、2022年
14.14.4 製品ベンチマーク
14.14.5 戦略的展望
14.15 GSK plc
14.15.1 会社概要
14.15.2 会社概要
14.15.3 財務分析
14.15.3.1 純収入、2018-2022年
14.15.3.2 R&D、2018年〜2022年
14.15.3.3 地域市場シェア、2022年
14.15.4 製品ベンチマーク
14.15.5 戦略的展望
14.16 ブリストル・マイヤーズ スクイブ社
14.16.1 会社概要
14.16.2 会社概要
14.16.3 財務分析
14.16.3.1 純収入、2018-2022年
14.16.3.2 R&D、2018年〜2022年
14.16.3.3 地域市場シェア、2022年
14.16.4 製品ベンチマーク
14.16.5 戦略的展望
14.17 ダナハー
14.17.1 会社概要
14.17.2 会社概要
14.17.3 財務分析
14.17.3.1 純収入、2018-2022年
14.17.3.2 売上高、2018-2022年
14.17.3.3 地域市場シェア、2022年
14.17.4 製品ベンチマーク
14.17.5 戦略的展望
14.18 Laboratory Corporation of America Holdings
14.18.1 会社概要
14.18.2 会社概要
14.18.3 財務分析
14.18.3.1 純収入、2018-2022年
14.18.3.2 地域市場シェア、2022年
14.18.4 製品ベンチマーク
14.18.5 戦略的展望
14.19 GE HealthCare
14.19.1 会社概要
14.19.2 会社概要
14.19.3 財務分析
14.19.3.1 純収入、2018年~2022年
14.19.3.2 地域市場シェア、2022年
14.19.4 製品ベンチマーク
14.19.5 戦略的展望
14.20 Teva Pharmaceutical Industries Ltd.
14.20.1 会社概要
14.20.2 会社概要
14.20.3 財務分析
14.20.3.1 純収入、2018年~2022年
14.20.3.2 R&D、2018年〜2022年
14.20.3.3 地域市場シェア、2022年
14.20.4 製品ベンチマーク
14.20.5 戦略的展望
14.21 NanoString Technologies, Inc.
14.21.1 会社概要
14.21.2 会社概要
14.21.3 財務分析
14.21.3.1 純収入、2018-2022年
14.21.3.2 売上高、2018-2022年
14.21.3.3 地域市場シェア、2022年
14.21.4 製品ベンチマーク
14.21.5 戦略的展望
14.22 Bayer AG
14.22.1 会社概要
14.22.2 会社概要
14.22.3 財務分析
14.22.3.1 純収入、2018-2022年
14.22.3.2 売上高、2018-2022年
14.22.3.3 地域市場シェア、2022年
14.22.4 製品ベンチマーク
14.22.5 戦略的展望
14.23 Biogen
14.23.1 会社概要
14.23.2 会社概要
14.23.3 財務分析
14.23.3.1 純収入、2018-2022年
14.23.3.2 R&D、2018年〜2022年
14.23.3.3 地域市場シェア、2022年
14.23.4 製品ベンチマーク
14.23.5 戦略的展望
14.24 Johnson & Johnson Services, Inc.
14.24.1 会社概要
14.24.2 会社概要
14.24.3 財務分析
14.24.3.1 純収入、2018-2022年
14.24.3.2 売上高、2018-2022年
14.24.3.3 地域市場シェア、2022年
14.24.4 製品ベンチマーク
14.24.5 戦略的展望
15 結論と提言
15.1 Visiongainからの結びの言葉
15.2 市場プレイヤーへの提言
ページTOPに戻る
図表リスト
表の一覧
Table 1 Precision Medicine Market Snapshot, 2023 & 2033 (US$ Billion, CAGR %)
Table 2 Precision Medicine Market Forecast by Region, 2023-2033 (US$ Billion, AGR%, CAGR%): “V” Shaped Recovery
Table 3 Precision Medicine Market Forecast by Region, 2023-2033 (US$ Billion, AGR%, CAGR%): “U” Shaped Recovery
Table 4 Precision Medicine Market Forecast by Region, 2023-2033 (US$ Billion, AGR%, CAGR%): “W” Shaped Recovery
Table 5 Precision Medicine Market Forecast by Region, 2023-2033 (US$ Billion, AGR%, CAGR%): “L” Shaped Recovery
Table 6 Precision Medicine Market Forecast by Product Type, 2023-2033 (US$ Billion, AGR%, CAGR%)
Table 7 Diagnostics Segment Market Forecast by Region, 2023-2033 (US$ Billion, AGR%, CAGR%)
Table 8 Genetic Tests Market Forecast by Region, 2023-2033 (US$ Billion, AGR%, CAGR%)
Table 9 Biomarker Based Tests Market Forecast by Region, 2023-2033 (US$ Billion, AGR%, CAGR%)
Table 10 Others Market Forecast by Region, 2023-2033 (US$ Billion, AGR%, CAGR%)
Table 11 Therapeutics Market Forecast by Region, 2023-2033 (US$ Billion, AGR%, CAGR%)
Table 12 Precision Medicine Market by Application, 2023-2033 (US$ Billion, AGR%, CAGR%)
Table 13 Oncology Market Forecast by Region, 2023-2033 (US$ Billion, AGR%, CAGR%)
Table 14 CNS Market Forecast by Region, 2023-2033 (US$ Billion, AGR%, CAGR%)
Table 15 Immunology Market Forecast by Region, 2023-2033 (US$ Billion, AGR%, CAGR%)
Table 16 Respiratory Market Forecast by Region, 2023-2033 (US$ Billion, AGR%, CAGR%)
Table 17 Others Market Forecast by Region, 2023-2033 (US$ Billion, AGR%, CAGR%)
Table 18 Precision Medicine Market Forecast by Technology, 2023-2033 (US$ Billion, AGR%, CAGR%)
Table 19 Drug Discovery Market Forecast by Region, 2023-2033 (US$ Billion, AGR%, CAGR%)
Table 20 Bioinformatics Market Forecast by Region, 2023-2033 (US$ Billion, AGR%, CAGR%)
Table 21 Big Data Analytics Market Forecast by Region, 2023-2033 (US$ Billion, AGR%, CAGR%)
Table 22 Gene Sequencing Market Forecast by Region, 2023-2033 (US$ bn, AGR%, CAGR%)
Table 23 Companion Diagnostics Market Forecast by Region, 2023-2033 (US$ Billion, AGR%, CAGR%)
Table 24 Other Technologies Market Forecast by Region, 2023-2033 (US$ Billion, AGR%, CAGR%)
Table 25 Precision Medicine Market Forecast by End-users, 2023-2033 (US$ Billion, AGR%, CAGR%)
Table 26 Hospitals Market Forecast by Region, 2023-2033 (US$ Billion, AGR%, CAGR%)
Table 27 Diagnostic Centres Market Forecast by Region, 2023-2033 (US$ Billion, AGR%, CAGR%)
Table 28 Research & academic institutes Market Forecast by Region, 2023-2033 (US$ Billion, AGR%, CAGR%)
Table 29 Other End-users Market Forecast by Region, 2023-2033 (US$ Billion, AGR%, CAGR%)
Table 30 Precision Medicine Market Forecast by Region, 2023-2033 (US$ Billion, AGR%, CAGR%)
Table 31 North America Precision Medicine Market Forecast by Country, 2023-2033 (US$ Billion, AGR%, CAGR%)
Table 32 North America Precision Medicine Market Forecast by Product Type, 2023-2033 (US$ Billion, AGR%, CAGR%)
Table 33 North America Precision Medicine Market Forecast by Application, 2023-2033 (US$ Billion, AGR%, CAGR%)
Table 34 North America Precision Medicine Market Forecast by Technology, 2023-2033 (US$ Billion, AGR%, CAGR%)
Table 35 North America Precision Medicine Market Forecast by End-users, 2023-2033 (US$ Billion, AGR%, CAGR%)
Table 36 U.S. Precision Medicine Market Forecast, 2023-2033 (US$ Billion, AGR%, CAGR%)
Table 37 Canada Precision Medicine Market Forecast, 2023-2033 (US$ Billion, AGR%, CAGR%)
Table 38 Europe Precision Medicine Market Forecast by Country, 2023-2033 (US$ Billion, AGR%, CAGR%)
Table 39 Europe Precision Medicine Market Forecast by Product Type, 2023-2033 (US$ Billion, AGR%, CAGR%)
Table 40 Europe Precision Medicine Market Forecast by Application, 2023-2033 (US$ Billion, AGR%, CAGR%)
Table 41 Europe Precision Medicine Market Forecast by Technology, 2023-2033 (US$ Billion, AGR%, CAGR%)
Table 42 Europe Precision Medicine Market Forecast by End-users, 2023-2033 (US$ Billion, AGR%, CAGR%)
Table 43 Germany Precision Medicine Market Forecast, 2023-2033 (US$ Billion, AGR%, CAGR%)
Table 44 UK Precision Medicine Market Forecast, 2023-2033 (US$ Billion, AGR%, CAGR%)
Table 45 France Precision Medicine Market Forecast, 2023-2033 (US$ Billion, AGR%, CAGR%)
Table 46 Italy Precision Medicine Market Forecast, 2023-2033 (US$ Billion, AGR%, CAGR%)
Table 47 Spain Precision Medicine Market Forecast, 2023-2033 (US$ Billion, AGR%, CAGR%)
Table 48 Switzerland Precision Medicine Market Forecast, 2023-2033 (US$ Billion, AGR%, CAGR%)
Table 49 Netherlands Precision Medicine Market Forecast, 2023-2033 (US$ Billion, AGR%, CAGR%)
Table 50 Rest of Europe Precision Medicine Market Forecast, 2023-2033 (US$ Billion, AGR%, CAGR%)
Table 51 Asia Pacific Precision Medicine Market Forecast by Country, 2023-2033 (US$ Billion, AGR%, CAGR%)
Table 52 Asia Pacific Precision Medicine Market Forecast by Product Type, 2023-2033 (US$ Billion, AGR%, CAGR%)
Table 53 Asia Pacific Precision Medicine Market Forecast by Application, 2023-2033 (US$ Billion, AGR%, CAGR%)
Table 54 Asia Pacific Precision Medicine Market Forecast by Technology, 2023-2033 (US$ Billion, AGR%, CAGR%)
Table 55 Asia Pacific Precision Medicine Market Forecast by End-users, 2023-2033 (US$ Billion, AGR%, CAGR%)
Table 56 Japan Precision Medicine Market Forecast, 2023-2033 (US$ Billion, AGR%, CAGR%)
Table 57 China Precision Medicine Market Forecast, 2023-2033 (US$ Billion, AGR%, CAGR%)
Table 58 India Precision Medicine Market Forecast, 2023-2033 (US$ Billion, AGR%, CAGR%)
Table 59 Australia Precision Medicine Market Forecast, 2023-2033 (US$ Billion, AGR%, CAGR%)
Table 60 South Korea Precision Medicine Market Forecast, 2023-2033 (US$ Billion, AGR%, CAGR%)
Table 61 Singapore Precision Medicine Market Forecast, 2023-2033 (US$ Billion, AGR%, CAGR%)
Table 62 Rest of Asia Pacific Precision Medicine Market Forecast, 2023-2033 (US$ Billion, AGR%, CAGR%)
Table 63 Latin America Precision Medicine Market Forecast by Country, 2023-2033 (US$ Billion, AGR%, CAGR%)
Table 64 Latin America Precision Medicine Market Forecast by Product Type, 2023-2033 (US$ Billion, AGR%, CAGR%)
Table 65 Latin America Precision Medicine Market Forecast by Application, 2023-2033 (US$ Billion, AGR%, CAGR%)
Table 66 Latin America Precision Medicine Market Forecast by Technology, 2023-2033 (US$ Billion, AGR%, CAGR%)
Table 67 Latin America Precision Medicine Market Forecast by End-users, 2023-2033 (US$ Billion, AGR%, CAGR%)
Table 68 Brazil Precision Medicine Market Forecast, 2023-2033 (US$ Billion, AGR%, CAGR%)
Table 69 Mexico Precision Medicine Market Forecast, 2023-2033 (US$ Billion, AGR%, CAGR%)
Table 70 Argentina Precision Medicine Market Forecast, 2023-2033 (US$ Billion, AGR%, CAGR%)
Table 71 Rest of Latin America Precision Medicine Market Forecast, 2023-2033 (US$ Billion, AGR%, CAGR%)
Table 72 MEA Precision Medicine Market Forecast by Country, 2023-2033 (US$ Billion, AGR%, CAGR%)
Table 73 MEA Precision Medicine Market Forecast by Product Type, 2023-2033 (US$ Billion, AGR%, CAGR%)
Table 74 MEA Precision Medicine Market Forecast by Application, 2023-2033 (US$ Billion, AGR%, CAGR%)
Table 75 MEA Precision Medicine Market Forecast by Technology, 2023-2033 (US$ Billion, AGR%, CAGR%)
Table 76 MEA Precision Medicine Market Forecast by End-users, 2023-2033 (US$ Billion, AGR%, CAGR%)
Table 77 GCC Precision Medicine Market Forecast, 2023-2033 (US$ Billion, AGR%, CAGR%)
Table 78 South Africa Precision Medicine Market Forecast, 2023-2033 (US$ Billion, AGR%, CAGR%)
Table 79 Egypt Precision Medicine Market Forecast, 2023-2033 (US$ Billion, AGR%, CAGR%)
Table 80 Rest of MEA Precision Medicine Market Forecast, 2023-2033 (US$ Billion, AGR%, CAGR%)
Table 81 Pfizer Inc.: Key Details, (CEO, HQ, Revenue, Founded, No. of Employees, Company Type, Website, Business Segment)
Table 82 Pfizer Inc.: Product Benchmarking
Table 83 Pfizer Inc.: Strategic Outlook
Table 84 Qiagen: Key Details, (CEO, HQ, Revenue, Founded, No. of Employees, Company Type, Website, Business Segment)
Table 85 Qiagen: Product Benchmarking
Table 86 Qiagen: Strategic Outlook
Table 87 Quest Diagnostics Incorporated: Key Details, (CEO, HQ, Revenue, Founded, No. of Employees, Company Type, Website, Business Segment)
Table 88 Quest Diagnostics Incorporated: Product Benchmarking
Table 89 Quest Diagnostics Incorporated: Strategic Outlook
Table 90 Agilent Technologies Inc.: Key Details, (CEO, HQ, Revenue, Founded, No. of Employees, Company Type, Website, Business Segment)
Table 91 Agilent Technologies Inc.: Product Benchmarking
Table 92 Agilent Technologies Inc.: Strategic Outlook
Table 93 Illumina, Inc.: Key Details, (CEO, HQ, Revenue, Founded, No. of Employees, Company Type, Website, Business Segment)
Table 94 Illumina, Inc.: Product Benchmarking
Table 95 Illumina, Inc.: Strategic Outlook
Table 96 Novartis AG: Key Details, (CEO, HQ, Revenue, Founded, No. of Employees, Company Type, Website, Business Segment)
Table 97 Novartis AG: Product Benchmarking
Table 98 Novartis AG: Strategic Outlook
Table 99 bioMerieux SA: Key Details, (CEO, HQ, Revenue, Founded, No. of Employees, Company Type, Website, Business Segment)
Table 100 bioMerieux SA: Product Benchmarking
Table 101 bioMerieux SA: Strategic Outlook
Table 102 F. Hoffmann-La Roche Ltd: Key Details, (CEO, HQ, Revenue, Founded, No. of Employees, Company Type, Website, Business Segment)
Table 103 F. Hoffmann-La Roche Ltd.: Product Benchmarking
Table 104 F. Hoffmann-La Roche Ltd.: Strategic Outlook
Table 105 Abbott : Key Details, (CEO, HQ, Revenue, Founded, No. of Employees, Company Type, Website, Business Segment)
Table 106 Abbott: Product Benchmarking
Table 107 Abbott: Strategic Outlook
Table 108 Lilly: Key Details, (CEO, HQ, Revenue, Founded, No. of Employees, Company Type, Website, Business Segment)
Table 109 Lilly: Product Benchmarking
Table 110 Lilly: Strategic Outlook
Table 111 Thermo Fisher Scientific Inc.: Key Details, (CEO, HQ, Revenue, Founded, No. of Employees, Company Type, Website, Business Segment)
Table 112 Thermo Fisher Scientific Inc.: Product Benchmarking
Table 113 Thermo Fisher Scientific Inc.: Strategic Outlook
Table 114 AstraZeneca: Key Details, (CEO, HQ, Revenue, Founded, No. of Employees, Company Type, Website, Business Segment)
Table 115 AstraZeneca: Product Benchmarking
Table 116 AstraZeneca: Strategic Outlook
Table 117 Myriad Genetics Inc.: Key Details, (CEO, HQ, Revenue, Founded, No. of Employees, Company Type, Website, Business Segment)
Table 118 Myriad Genetics Inc.: Product Benchmarking
Table 119 Myriad Genetics Inc.: Strategic Outlook
Table 120 GSK plc: Key Details, (CEO, HQ, Revenue, Founded, No. of Employees, Company Type, Website, Business Segment)
Table 121 GSK plc: Product Benchmarking
Table 122 GSK plc: Strategic Outlook
Table 123 Bristol-Myers Squibb Company Company: Key Details, (CEO, HQ, Revenue, Founded, No. of Employees, Company Type, Website, Business Segment)
Table 124 Bristol-Myers Squibb Company: Product Benchmarking
Table 125 Bristol-Myers Squibb Company: Strategic Outlook
Table 126 Danaher : Key Details, (CEO, HQ, Revenue, Founded, No. of Employees, Company Type, Website, Business Segment)
Table 127 Danaher: Product Benchmarking
Table 128 Danaher: Strategic Outlook
Table 129 Laboratory Corporation of America Holdings: Key Details, (CEO, HQ, Founded, No. of Employees, Company Type, Website, Business Segment)
Table 130 Laboratory Corporation of America Holdings: Product Benchmarking
Table 131 Laboratory Corporation of America Holdings: Strategic Outlook
Table 132 GE HealthCare: Key Details, (CEO, HQ, Revenue, Founded, No. of Employees, Company Type, Website, Business Segment)
Table 133 GE HealthCare: Product Benchmarking
Table 134 GE HealthCare: Strategic Outlook
Table 135 Teva Pharmaceutical Industries Ltd: Key Details, (CEO, HQ, Revenue, Founded, No. of Employees, Company Type, Website, Business Segment)
Table 136 Teva Pharmaceutical Industries Ltd.: Product Benchmarking
Table 137 Teva Pharmaceutical Industries Ltd.: Strategic Outlook
Table 138 NanoString Technologies, Inc.: Key Details, (CEO, HQ, Revenue, Founded, No. of Employees, Company Type, Website, Business Segment)
Table 139 NanoString Technologies, Inc.: Product Benchmarking
Table 140 NanoString Technologies, Inc.: Strategic Outlook
Table 141 Bayer AG: Key Details, (CEO, HQ, Revenue, Founded, No. of Employees, Company Type, Website, Business Segment)
Table 142 Bayer AG: Product Benchmarking
Table 143 Bayer AG: Strategic Outlook
Table 144 Biogen: Key Details, (CEO, HQ, Revenue, Founded, No. of Employees, Company Type, Website, Business Segment)
Table 145 Biogen: Product Benchmarking
Table 146 Biogen: Strategic Outlook
Table 147 Johnson & Johnson Services, Inc.: Key Details, (CEO, HQ, Revenue, Founded, No. of Employees, Company Type, Website, Business Segment)
Table 148 Johnson & Johnson Services, Inc.: Product Benchmarking
Table 149 Johnson & Johnson Services, Inc.: Strategic Outlook
図の一覧
Figure 1 Precision Medicine Market Segmentation
Figure 2 Precision Medicine Market Attractiveness Index by Region
Figure 3 Precision Medicine Market by Product Type: Market Attractiveness Index
Figure 4 Precision Medicine Market by Application: Market Attractiveness Index
Figure 5 Precision Medicine Market by Technology: Market Attractiveness Index
Figure 6 Precision Medicine Market by End-users: Market Attractiveness Index
Figure 7 Precision Medicine Market: Market Dynamics
Figure 8 Precision Medicine Market by Region, 2023-2033 (US$ Billion, AGR %): “V” Shaped Recovery
Figure 9 Precision Medicine Market by Region, 2023-2033 (US$ Billion, AGR %): “U” Shaped Recovery
Figure 10 Precision Medicine Market by Region, 2023-2033 (US$ Billion, AGR %): “W” Shaped Recovery
Figure 11 Precision Medicine Market by Region, 2023-2033 (US$ Billion, AGR %): “L” Shaped Recovery
Figure 12 Precision Medicine Market: Porter’s Five Forces Analysis
Figure 13 Global Precision Medicine Market: SWOT Analysis
Figure 14 Precision Medicine Market: PEST Analysis
Figure 15 Precision Medicine Market by Product Type: Market Attractiveness Index
Figure 16 Precision Medicine Market Forecast by Product Type, 2023-2033 (US$ Billion, AGR %)
Figure 17 Precision Medicine Market Share Forecast by Product Type, 2023, 2028, 2033 (%)
Figure 18 Diagnostics Segment Market Forecast by Region, 2023-2033 (US$ Billion, AGR %)
Figure 19 Diagnostics Segment Market Share Forecast by Region, 2023 & 2033 (%)
Figure 20 Genetic Tests Market Forecast by Region, 2023-2033 (US$ Billion)
Figure 21 Genetic Tests Market Share Forecast by Region, 2023 & 2033 (%)
Figure 22 Biomarker Based Tests Market Forecast by Region, 2023-2033 (US$ Billion)
Figure 23 Biomarker Based Tests Market Share Forecast by Region, 2023 & 2033 (%)
Figure 24 Others Market Forecast by Region, 2023-2033 (US$ Billion)
Figure 25 Others Market Share Forecast by Region, 2023 & 2033 (%)
Figure 26 Therapeutics Market Forecast by Region, 2023-2033 (US$ Billion)
Figure 27 Therapeutics Market Share Forecast by Region, 2023 & 2033 (%)
Figure 28 Precision Medicine Market by Application: Market Attractiveness Index
Figure 29 Precision Medicine Market by Application, 2023-2033 (US$ Billion)
Figure 30 Precision Medicine Market Share Forecast by Application, 2023, 2028, 2033 (%)
Figure 31 Oncology Market Forecast by Region, 2023-2033 (US$ Billion)
Figure 32 Oncology Market Share Forecast by Region, 2023 & 2033 (%)
Figure 33 CNS Market Forecast by Region, 2023-2033 (US$ Billion)
Figure 34 CNS Market Share Forecast by Region, 2023 & 2033 (%)
Figure 35 Immunology Market Forecast by Region, 2023-2033 (US$ Billion)
Figure 36 Immunology Market Share Forecast by Region, 2023 & 2033 (%)
Figure 37 Respiratory Market Forecast by Region, 2023-2033 (US$ Billion)
Figure 38 Respiratory Market Share Forecast by Region, 2023 & 2033 (%)
Figure 39 Others Market Forecast by Region, 2023-2033 (US$ Billion)
Figure 40 Others Market Share Forecast by Region, 2023 & 2033 (%)
Figure 41 Precision Medicine Market by Technology: Market Attractiveness Index
Figure 42 Precision Medicine Market Forecast by Technology, 2023-2033 (US$ Billion)
Figure 43 Precision Medicine Market Share Forecast by Technology, 2023, 2028, 2033 (%)
Figure 44 Drug Discovery Market Forecast by Region, 2023-2033 (US$ Billion)
Figure 45 Drug Discovery Market Share Forecast by Region, 2023 & 2033 (%)
Figure 46 Bioinformatics Market Forecast by Region, 2023-2033 (US$ Billion)
Figure 47 Bioinformatics Market Share Forecast by Region, 2023 & 2033 (%)
Figure 48 Big Data Analytics Market Forecast by Region, 2023-2033 (US$ Billion)
Figure 49 Big Data Analytics Market Share Forecast by Region, 2023 & 2033 (%)
Figure 50 Gene Sequencing Market Forecast by Region, 2023-2033 (US$ Billion)
Figure 51 Gene Sequencing Market Share Forecast by Region, 2023 & 2033 (%)
Figure 52 Companion Diagnostics Market Forecast by Region, 2023-2033 (US$ Billion)
Figure 53 Companion Diagnostics Market Share Forecast by Region, 2023 & 2033 (%)
Figure 54 Other Technologies Market Forecast by Region, 2023-2033 (US$ Billion)
Figure 55 Other Technologies Market Share Forecast by Region, 2023 & 2033 (%)
Figure 56 Precision Medicine Market by End-users: Market Attractiveness Index
Figure 57 Precision Medicine Market Forecast by End-users, 2023-2033 (US$ Billion)
Figure 58 Precision Medicine Market Share Forecast by End-users, 2023, 2028, 2033 (%)
Figure 59 Hospitals Market Forecast by Region, 2023-2033 (US$ Billion)
Figure 60 Hospitals Market Share Forecast by Region, 2023 & 2033 (%)
Figure 61 Diagnostic Centres Market Forecast by Region, 2023-2033 (US$ Billion)
Figure 62 Diagnostic Centres Market Share Forecast by Region, 2023 & 2033 (%)
Figure 63 Research & academic institutes Market Forecast by Region, 2023-2033 (US$ Billion)
Figure 64 Research & academic institutes Market Share Forecast by Region, 2023 & 2033 (%)
Figure 65 Other End-users Market Forecast by Region, 2023-2033 (US$ Billion)
Figure 66 Other End-users Market Share Forecast by Region, 2023 & 2033 (%)
Figure 67 Precision Medicine Market Forecast by Region 2023 and 2033 (Revenue, CAGR%)
Figure 68 Precision Medicine Market Share Forecast by Region 2023, 2028, 2033 (%)
Figure 69 Precision Medicine Market by Region, 2023-2033 (US$ Billion, AGR %)
Figure 70 North America Precision Medicine Market Attractiveness Index
Figure 71 North America Precision Medicine Market by Region, 2023, 2028 & 2033 (US$ Billion)
Figure 72 North America Precision Medicine Market Forecast by Country, 2023-2033 (US$ Billion, AGR %)
Figure 73 North America Precision Medicine Market Share Forecast by Country, 2023 & 2033 (%)
Figure 74 North America Precision Medicine Market Forecast by Product Type, 2023-2033 (US$ Billion, AGR %)
Figure 75 North America Precision Medicine Market Share Forecast by Product Type, 2023 & 2033 (%)
Figure 76 North America Precision Medicine Market Forecast by Application, 2023-2033 (US$ Billion, AGR %)
Figure 77 North America Precision Medicine Market Share Forecast by Application, 2023 & 2033 (%)
Figure 78 North America Precision Medicine Market Forecast by Technology, 2023-2033 (US$ Billion, AGR %)
Figure 79 North America Precision Medicine Market Share Forecast by Technology, 2023 & 2033 (%)
Figure 80 North America Precision Medicine Market Forecast by End-users, 2023-2033 (US$ Billion, AGR %)
Figure 81 North America Precision Medicine Market Share Forecast by End-users, 2023 & 2033 (%)
Figure 82 U.S. Precision Medicine Market Forecast, 2023-2033 (US$ Billion, AGR %)
Figure 83 Canada Precision Medicine Market Forecast, 2023-2033 (US$ Billion, AGR %)
Figure 84 Europe Precision Medicine Market Attractiveness Index
Figure 85 Europe Precision Medicine Market by Region, 2023, 2028 & 2033 (US$ Billion)
Figure 86 Europe Precision Medicine Market Forecast by Country, 2023-2033 (US$ Billion)
Figure 87 Europe Precision Medicine Market Share Forecast by Country, 2023 & 2033 (%)
Figure 88 Europe Precision Medicine Market Forecast by Product Type, 2023-2033 (US$ Billion)
Figure 89 Europe Precision Medicine Market Share Forecast by Product Type, 2023 & 2033 (%)
Figure 90 Europe Precision Medicine Market Forecast by Application, 2023-2033 (US$ Billion)
Figure 91 Europe Precision Medicine Market Share Forecast by Application, 2023 & 2033 (%)
Figure 92 Europe Precision Medicine Market Forecast by Technology, 2023-2033 (US$ Billion)
Figure 93 Europe Precision Medicine Market Share Forecast by Technology, 2023 & 2033(%)
Figure 94 Europe Precision Medicine Market Forecast by End-users, 2023-2033 (US$ Billion)
Figure 95 Europe Precision Medicine Market Share Forecast by End-users, 2023 & 2033(%)
Figure 96 Germany Precision Medicine Market Forecast, 2023-2033 (US$ Billion, AGR %)
Figure 97 UK Precision Medicine Market Forecast, 2023-2033 (US$ Billion, AGR %)
Figure 98 France Precision Medicine Market Forecast, 2023-2033 (US$ Billion, AGR %)
Figure 99 Italy Precision Medicine Market Forecast, 2023-2033 (US$ Billion, AGR %)
Figure 100 Spain Precision Medicine Market Forecast, 2023-2033 (US$ Billion, AGR %)
Figure 101 Switzerland Precision Medicine Market Forecast, 2023-2033 (US$ Billion, AGR %)
Figure 102 Netherlands Precision Medicine Market Forecast, 2023-2033 (US$ Billion, AGR %)
Figure 103 Rest of Europe Precision Medicine Market Forecast, 2023-2033 (US$ Billion, AGR %)
Figure 104 Asia Pacific Precision Medicine Market Attractiveness Index
Figure 105 Asia Pacific Precision Medicine Market by Region, 2023, 2028 & 2033 (US$ Billion)
Figure 106 Asia Pacific Precision Medicine Market Forecast by Country, 2023-2033 (US$ Billion)
Figure 107 Asia Pacific Precision Medicine Market Share Forecast by Country, 2023 & 2033 (%)
Figure 108 Asia Pacific Precision Medicine Market Forecast by Product Type, 2023-2033 (US$ Billion)
Figure 109 Asia Pacific Precision Medicine Market Share Forecast by Product Type, 2023 & 2033 (%)
Figure 110 Asia Pacific Precision Medicine Market Forecast by Application, 2023-2033 (US$ Billion)
Figure 111 Asia Pacific Precision Medicine Market Share Forecast by Application, 2023 & 2033 (%)
Figure 112 Asia Pacific Precision Medicine Market Forecast by Technology, 2023-2033 (US$ Billion)
Figure 113 Asia Pacific Precision Medicine Market Share Forecast by Technology, 2023 & 2033 (%)
Figure 114 Asia Pacific Precision Medicine Market Forecast by End-users, 2023-2033 (US$ Billion)
Figure 115 Asia Pacific Precision Medicine Market Share Forecast by End-users, 2023 & 2033 (%)
Figure 116 Japan Precision Medicine Market Forecast, 2023-2033 (US$ Billion, AGR %)
Figure 117 China Precision Medicine Market Forecast, 2023-2033 (US$ Billion, AGR %)
Figure 118 India Precision Medicine Market Forecast, 2023-2033 (US$ Billion, AGR %)
Figure 119 Australia Precision Medicine Market Forecast, 2023-2033 (US$ Billion, AGR %)
Figure 120 South Korea Precision Medicine Market Forecast, 2023-2033 (US$ Billion, AGR %)
Figure 121 Singapore Precision Medicine Market Forecast, 2023-2033 (US$ Billion, AGR %)
Figure 122 Rest of Asia Pacific Precision Medicine Market Forecast, 2023-2033 (US$ Billion, AGR %)
Figure 123 Latin America Precision Medicine Market Attractiveness Index
Figure 124 Latin America Precision Medicine Market by Region, 2023, 2028 & 2033 (US$ Billion)
Figure 125 Latin America Precision Medicine Market Forecast by Country, 2023-2033 (US$ Billion)
Figure 126 Latin America Precision Medicine Market Share Forecast by Country, 2023 & 2033 (%)
Figure 127 Latin America Precision Medicine Market Forecast by Product Type, 2023-2033 (US$ Billion)
Figure 128 Latin America Precision Medicine Market Share Forecast by Product Type, 2023 & 2033 (%)
Figure 129 Latin America Precision Medicine Market Forecast by Application, 2023-2033 (US$ Billion)
Figure 130 Latin America Precision Medicine Market Share Forecast by Application, 2023 & 2033 (%)
Figure 131 Latin America Precision Medicine Market Forecast by Technology, 2023-2033 (US$ Billion)
Figure 132 Latin America Precision Medicine Market Share Forecast by Technology, 2023 & 2033 (%)
Figure 133 Latin America Precision Medicine Market Forecast by End-users, 2023-2033 (US$ Billion)
Figure 134 Latin America Precision Medicine Market Share Forecast by End-users, 2023 & 2033 (%)
Figure 135 Brazil Precision Medicine Market Forecast, 2023-2033 (US$ Billion, AGR %)
Figure 136 Mexico Precision Medicine Market Forecast, 2023-2033 (US$ Billion, AGR %)
Figure 137 Argentina Precision Medicine Market Forecast, 2023-2033 (US$ Billion, AGR %)
Figure 138 Rest of Latin America Precision Medicine Market Forecast, 2023-2033 (US$ Billion, AGR %)
Figure 139 MEA Precision Medicine Market Attractiveness Index
Figure 140 MEA Precision Medicine Market by Region, 2023, 2028 & 2033 (US$ Billion)
Figure 141 MEA Precision Medicine Market Forecast by Country, 2023-2033 (US$ Billion)
Figure 142 MEA Precision Medicine Market Share Forecast by Country, 2023 & 2033 (%)
Figure 143 MEA Precision Medicine Market Forecast by Product Type, 2023-2033 (US$ Billion)
Figure 144 MEA Precision Medicine Market Share Forecast by Product Type, 2023 & 2033 (%)
Figure 145 MEA Precision Medicine Market Forecast by Application, 2023-2033 (US$ Billion)
Figure 146 MEA Precision Medicine Market Share Forecast by Application, 2023 & 2033 (%)
Figure 147 MEA Precision Medicine Market Forecast by Technology, 2023-2033 (US$ Billion)
Figure 148 MEA Precision Medicine Market Share Forecast by Technology, 2023 & 2033 (%)
Figure 149 MEA Precision Medicine Market Forecast by End-users, 2023-2033 (US$ Billion)
Figure 150 MEA Precision Medicine Market Share Forecast by End-users, 2023 & 2033 (%)
Figure 151 GCC Precision Medicine Market Forecast, 2023-2033 (US$ Billion, AGR %)
Figure 152 South Africa Precision Medicine Market Forecast, 2023-2033 (US$ Billion, AGR %)
Figure 153 Egypt Precision Medicine Market Forecast, 2023-2033 (US$ Billion, AGR %)
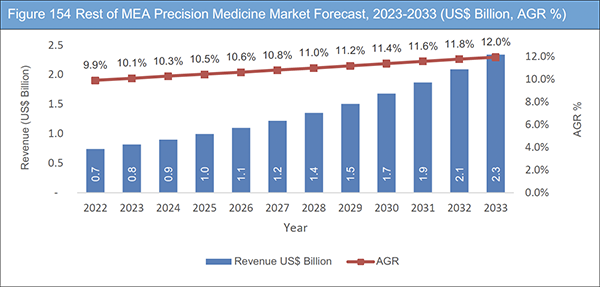
Figure 154 Rest of MEA Precision Medicine Market Forecast, 2023-2033 (US$ Billion, AGR %)
Figure 155 Precision Medicine Market: Company Share/Ranking, 2022
Figure 156 Pfizer Inc. Inc: Net Revenue, 2018-2022 (US$ Million, AGR %)
Figure 157 Pfizer Inc.: R&D, 2018-2022 (US$ Million, AGR%)
Figure 158 Pfizer Inc.: Regional Market Shares, 2022
Figure 159 Qiagen: Net Revenue, 2018-2022 (US$ Million, AGR %)
Figure 160 Qiagen: R&D, 2018-2022 (US$ Million, AGR %)
Figure 161 Qiagen: Regional Market Shares, 2022
Figure 162 Quest Diagnostics Inc.: Net Revenue, 2018-2022 (US$ Million, AGR %)
Figure 163 Agilent Technologies Inc.: Net Revenue, 2018-2022 (US$ Million, AGR %)
Figure 164 Agilent Technologies Inc.: R&D, 2018-2022 (US$ Million, AGR %)
Figure 165 Agilent Technologies Inc.: Regional Market Shares, 2022
Figure 166 Illumina, Inc.: Net Revenue, 2018-2022 (US$ Million, AGR (%)
Figure 167 Illumina, Inc.: R&D, 2018-2022 (US$ Million, AGR %)
Figure 168 Illumina, Inc.: Regional Market Shares, 2022
Figure 169 Novartis AG: Net Revenue, 2018-2022 (US$ Million, AGR %)
Figure 170 Novartis AG: R&D, 2018-2022(US$ Million, AGR %)
Figure 171 Novartis AG: Regional Market Shares, 2022
Figure 172 bioMerieux SA: Net Revenue, 2018-2022 (US$ Million, AGR %)
Figure 173 bioMerieux SA: R&D, 2018-2022 (US$ Million, AGR %)
Figure 174 bioMerieux SA: Regional Market Shares, 2022
Figure 175 F. Hoffmann-La Roche Ltd: Net Revenue, 2018-2022 (US$ Million, AGR %)
Figure 176 F. Hoffmann-La Roche Ltd: R&D, 2018-2022 (US$ Million, AGR (%))
Figure 177 F. Hoffmann-La Roche Ltd: Regional Market Shares, 2022
Figure 178 Abbott: Net Revenue, 2018-2022 (US$ Million, AGR %)
Figure 179 Abbott: R&D, 2018-2022(US$ Million, AGR %)
Figure 180 Abbott: Regional Market Shares, 2022
Figure 181 Lilly.: Net Revenue, 2018-2022 (US$ Million, AGR %)
Figure 182 Lilly.: R&D, 2018-2022 (US$ Million, AGR %)
Figure 183 Lilly.: Regional Market Shares, 2022
Figure 184 Thermo Fisher Scientific Inc..: Net Revenue, 2018-2022 (US$ Million, AGR %)
Figure 185 Thermo Fisher Scientific Inc..: R&D, 2018-2022 (US$ Million, AGR %)
Figure 186 Thermo Fisher Scientific Inc..: Regional Market Shares, 2022
Figure 187 AstraZeneca: Net Revenue, 2018-2022 (US$ Million, AGR %)
Figure 188 AstraZeneca: R&D, 2018-2022 (US$ Million, AGR %)
Figure 189 AstraZeneca.: Regional Market Shares, 2021
Figure 190 Myriad Genetics Inc.: Net Revenue, 2018-2022(US$ Million, AGR %)
Figure 191 Myriad Genetics Inc.: R&D, 2018-2022 (US$ Million, AGR %)
Figure 192 Myriad Genetics Inc.: Regional Market Shares, 2022
Figure 193 GSK plc: Net Revenue, 2018-2022(US$ Million, AGR %)
Figure 194 GSK plc: R&D, 2018-2022 (US$ Million, AGR %)
Figure 195 GSK plc: Regional Market Shares, 2022
Figure 196 Bristol-Myers Squibb Company: Net Revenue, 2018-2022(US$ Million, AGR %)
Figure 197 Bristol-Myers Squibb Company: R&D, 2018-2022 (US$ Million, AGR %)
Figure 198 Bristol-Myers Squibb Company: Regional Market Shares, 2022
Figure 199 Danaher: Net Revenue, 2018-2022 (US$ Million, AGR %)
Figure 200 Danaher: R&D, 2018-2022 (US$ Million, AGR %)
Figure 201 Danaher: Regional Market Shares, 2022
Figure 202 Laboratory Corporation of America Holdings: Net Revenue, 2018-2022 (US$ Million, AGR %)
Figure 203 Laboratory Corporation of America Holdings: Regional Market Shares, 2022
Figure 204 GE HealthCare: Net Revenue, 2018-2022 (US$ Million, AGR %)
Figure 205 GE HealthCare: Regional Market Shares, 2022
Figure 206 Teva Pharmaceutical Industries Ltd: Net Revenue, 2018-2022 (US$ Million, AGR %)
Figure 207 Teva Pharmaceutical Industries Ltd: R&D, 2018-2022 (US$ Million, AGR %)
Figure 208 Teva Pharmaceutical Industries Ltd: Regional Market Shares, 2022
Figure 209 NanoString Technologies, Inc.: Net Revenue, 2018-2022 (US$ Million, AGR %)
Figure 210 NanoString Technologies, Inc.: R&D, 2018-2022 (US$ Million, AGR %)
Figure 211 NanoString Technologies, Inc.: Regional Market Shares, 2022
Figure 212 Bayer AG: Net Revenue, 2018-2022 (US$ Million, AGR %)
Figure 213 Bayer AG: R&D, 2018-2022 (US$ Million, AGR %)
Figure 214 Bayer AG: Regional Market Shares, 2022
Figure 215 Biogen: Net Revenue, 2018-2022 (US$ Million, AGR %)
Figure 216 Biogen: R&D, 2018-2022 (US$ Million, AGR %)
Figure 217 Biogen: Regional Market Shares, 2022
Figure 218 Johnson & Johnson Services, Inc.: Net Revenue, 2018-2022 (US$ Million, AGR %)
Figure 219 Johnson & Johnson Services, Inc.: R&D, 2018-2022 (US$ Million, AGR %)
Figure 220 Johnson & Johnson Services, Inc.: Regional Market Shares, 2022
ページTOPに戻る
Summary
Report Details
The Precision Medicine Market Report 2023-2033: This report will prove invaluable to leading firms striving for new revenue pockets if they wish to better understand the industry and its underlying dynamics. It will be useful for companies that would like to expand into different industries or to expand their existing operations in a new region.
Expanding Applications of Precision Medicine and Rising Demand for Targeted Therapy
With regard to genetic disorders, precision medicine is becoming more prevalent. In the domains of neurogenetics, cardiovascular genomics, and rare illness genetic testing, this method is being employed more frequently. Additionally, non-invasive prenatal testing, pharmacogenomics, and screening genetic risk for hereditary diseases are also becoming more prevalent applications of precision medicine. A number of pharmaceutical companies are also concentrating on the creation of precision medicine for neurological conditions like Alzheimer’s and Parkinson’s disease. Pharmacological, biopharmaceutical, and pharmaceutical firms are continuously working to integrate patient-selection diagnostic frameworks into the earlier phases of drug development in order to deliver targeted therapies to the appropriate candidate and support the expansion of the precision medicine market. One of the main causes of the expanding usage of genomes and proteomics technologies as well as precision medicine is the increased understanding of the advantages of personalised medicine. Individualised treatment plans for many chronic diseases and conditions must include precision medicine, which entails the investigation of specific indications for particular medications in a given patient.
High Cost of Precision Medicine
Although personalized treatments are well-established in the pharmaceutical business, their cost continues to prevent payers, patients, and doctors from accessing them. Despite offering guaranteed returns on investment, the high initial cost of these tests makes them inaccessible to a huge majority of end users, particularly those in poor nations. As a result, end users like pharmaceutical firms, reference labs, medical facilities, and CROs who view the cost of such diagnostic procedures as a burden choose to use third-party precision diagnostic services. Inevitably, current medical privacy and investigation guidelines are inadequate to allow for the collection of enormous amounts of data on large patient populations, and private healthcare systems lack the infrastructure to do so, which drives up the price of precision medicine even more.
What Questions Should You Ask before buying a Market Research Report?
• How is the precision medicine market evolving?
• What is driving and restraining the precision medicine market?
• How will each point of care diagnostic submarket segment grow over the forecast period and how much revenue will these submarkets account for in 2033?
• How will the market shares for each precision medicine submarket develop from 2022 to 2033?
• What will be the main driver for the overall market from 2023 to 2033?
• Will leading precision medicine markets broadly follow the macroeconomic dynamics, or will individual national markets outperform others?
• How will the market shares of the national markets change by 2033 and which geographical region will lead the market in 2033?
• Who are the leading players and what are their prospects over the forecast period?
• What are the precision medicine projects for these leading companies?
• How will the industry evolve during the period between 2023 and 2033? What are the implications of precision medicine projects taking place now and over the next 10 years?
• Is there a greater need for product commercialisation to further scale the precision medicine market?
• Where is the precision medicine market heading and how can you ensure you are at the forefront of the market?
• What are the best investment options for new product and service lines?
• What are the key prospects for moving companies into a new growth path and C-suite?
You need to discover how this will impact the Precision Medicine market today, and over the next 10 years:
• Our 347-page report provides 149 tables, 220 charts, and graphs exclusively to you.
• The report highlights key lucrative areas in the industry so you can target them – NOW.
• It contains in-depth analysis of global, regional and national sales and growth.
• It highlights for you the key successful trends, changes and revenue projections made by your competitors.
This report tells you TODAY how the Precision Medicine market will develop in the next 10 years, and in line with the variations in COVID-19 economic recession and bounce. This market is more critical now than at any point over the last 10 years.
Forecasts to 2033 and other analyses reveal commercial prospects
• In addition to revenue forecasting to 2033, our new study provides you with recent results, growth rates, and market shares.
• You will find original analyses, with business outlooks and developments.
• Discover qualitative analyses (including market dynamics, drivers, opportunities, restraints and challenges), cost structure, impact of rising Precision Medicine prices and recent developments.
This report includes data analysis and invaluable insight into how COVID-19 will affect the industry and your company. Four COVID-19 recovery patterns and their impact, namely, “V”, “L”, “W” and “U” are discussed in this report.
Segments Covered in the Report
Product
• Diagnostic
– Genetic Tests
– Biomarker Based Tests
– Other Diagnostic Tests
• Therapeutics
Application
• Oncology
• CNS
• Immunology
• Respiratory
• Others
Technology
• Drug Discovery
• Bioinformatics
• Big Data Analytics
• Gene Sequencing
• Companion Diagnostics
• Other Technologies
End-user
• Hospitals
• Diagnostic Centres
• Research & Academic Institutes
• Other End-users
In addition to the revenue predictions for the overall world market and segments, you will also find revenue forecasts for five regional and 25 leading national markets:
North America
• U.S.
• Canada
Europe
• Germany
• UK
• France
• Italy
• Spain
• Switzerland
• Netherlands
• Rest of Europe
Asia Pacific
• China
• Japan
• India
• Australia
• South Korea
• Singapore
• Rest of Asia Pacific
Latin America
• Brazil
• Mexico
• Argentina
• Rest of Latin America
MEA
• GCC
• South Africa
• Egypt
• Rest of MEA
The report also includes profiles and for some of the leading companies in the Precision Medicine Market, 2023 to 2033, with a focus on this segment of these companies’ operations.
Leading companies and the potential for market growth
• Abbott
• Abnova Corporation
• Agilent Technologies Inc.
• AstraZeneca
• Bayer AG
• Biogen
• bioMérieux SA
• Bristol-Myers Squibb Company
• Danaher
• F. Hoffmann-La Roche Ltd
• GE HealthCare
• GSK plc
• Illumina, Inc.
• Johnson & Johnson Services, Inc.
• Laboratory Corporation of America Holdings
• Lilly
• Myriad Genetics Inc.
• NanoString Technologies, Inc.
• Novartis AG
• Pfizer Inc.
• Qiagen
• Quest Diagnostics Incorporated
• Teva Pharmaceutical Industries Ltd.
• Thermo Fisher Scientific Inc.
Overall world revenue for Precision Medicine Market, 2023 to 2033 in terms of value the market will surpass US$78 billion in 2023, our work calculates. We predict strong revenue growth through to 2033. Our work identifies which organizations hold the greatest potential. Discover their capabilities, progress, and commercial prospects, helping you stay ahead.
How will the Precision Medicine Market, 2023 to 2033 report help you?
In summary, our 340+ page report provides you with the following knowledge:
• Revenue forecasts to 2033 for Precision Medicine Market, 2023 to 2033 Market, with forecasts for product, mode, sample, platform, end user, each forecast at a global and regional level – discover the industry’s prospects, finding the most lucrative places for investments and revenues.
• Revenue forecasts to 2033 for five regional and 25 key national markets – See forecasts for the Precision Medicine Market, 2023 to 2033 market in North America, Europe, Asia-Pacific, Latin America, and MEA. Also forecasted is the market in the US, Canada, Mexico, Brazil, Germany, France, UK, Italy, Spain, Switzerland, Netherlands, China, India, Japan, Australia, South Korea, Singapore, Argentina, GCC, South Africa, and Egypt among other prominent economies.
• Prospects for established firms and those seeking to enter the market – including company profiles for 25 of the major companies involved in the Precision Medicine Market, 2023 to 2033.
Find quantitative and qualitative analyses with independent predictions. Receive information that only our report contains, staying informed with invaluable business intelligence.
Information found nowhere else
With our new report, you are less likely to fall behind in knowledge or miss out on opportunities. See how our work could benefit your research, analyses, and decisions. Visiongain’s study is for everybody needing commercial analyses for the Precision Medicine Market, 2023 to 2033, market-leading companies. You will find data, trends and predictions.
ページTOPに戻る
Table of Contents
Table of Contents
1 Report Overview
1.1 Objectives of the Study
1.2 Introduction to Precision Medicine Market
1.3 What This Report Delivers
1.4 Why You Should Read This Report
1.5 Key Questions Answered by This Analytical Report
1.6 Who is This Report for?
1.7 Methodology
1.7.1 Market Definitions
1.7.2 Market Evaluation & Forecasting Methodology
1.7.3 Data Validation
1.7.3.1 Primary Research
1.7.3.2 Secondary Research
1.8 Frequently Asked Questions (FAQs)
1.9 Associated Visiongain Reports
1.10 About Visiongain
2 Executive Summary
3 Market Overview
3.1 Key Findings
3.2 Market Dynamics
3.2.1 Market Driving Factors
3.2.1.1 Increasing Global Burden of Cancer Boosts the Demand for Personalized Medicine
3.2.1.2 Increase in Scope of Application of Precision Medicine
3.2.1.3 Accelerating Demand for Targeted Therapy
3.2.1.4 Growing Precedence of Precision Medicine Over Traditional Practice of “One-Size-Fits-All” Therapies
3.2.2 Market Restraining Factors
3.2.2.1 High Cost of Precision Medicine
3.2.2.2 Lack of Data Interoperability
3.2.2.3 Insufficient Funding for Diagnostics Space in the Emerging Economies
3.2.3 Market Opportunities
3.2.3.1 Growing Use of AI in Healthcare Is Boosting Demand for Precision Medicine
3.2.3.2 Growing acceptance of gene therapy and gene editing technology
3.3 COVID-19 Impact Analysis
3.4 Porter’s Five Forces Analysis
3.4.1 Bargaining Power of Supplier
3.4.2 Bargaining Power of Buyers
3.4.3 Threat of New Entrants
3.4.4 Threat from Substitutes
3.4.5 Competitive Rivalry
3.5 SWOT Analysis
3.6 PEST Analysis
4 Precision Medicine Market Analysis by Product Type
4.1 Key Findings
4.2 Product Type Segment: Market Attractiveness Index
4.3 Precision Medicine Market Size Estimation and Forecast by Product Type
4.4 Diagnostics
4.4.1 Market Size by Region, 2023-2033 (US$ Billion)
4.4.2 Market Share by Region, 2023 & 2033 (%)
4.4.3 Genetic Tests
4.4.3.1 Market Size by Region, 2023-2033 (US$ Billion)
4.4.3.2 Market Share by Region, 2023 & 2033 (%)
4.4.4 Biomarker Based Tests
4.4.4.1 Market Size by Region, 2023-2033 (US$ Billion)
4.4.4.2 Market Share by Region, 2023 & 2033 (%)
4.4.5 Others
4.4.5.1 Market Size by Region, 2023-2033 (US$ Billion)
4.4.5.2 Market Share by Region, 2023 & 2033 (%)
4.5 Therapeutics
4.5.1 Market Size by Region, 2023-2033 (US$ Billion)
4.5.2 Market Share by Region, 2023 & 2033 (%)
5 Precision Medicine Market, by Application, 2023-2033
5.1 Key Findings
5.2 Application Segment: Market Attractiveness Index
5.3 Precision Medicine Market, by Application
5.4 Oncology
5.4.1 Market Size by Region, 2023-2033 (US$ Billion)
5.4.2 Market Share by Region, 2023 & 2033 (%)
5.5 CNS
5.5.1 Market Size by Region, 2023-2033 (US$ Billion)
5.5.2 Market Share by Region, 2023 & 2033 (%)
5.6 Immunology
5.6.1 Market Size by Region, 2023-2033 (US$ Billion)
5.6.2 Market Share by Region, 2023 & 2033 (%)
5.7 Respiratory
5.7.1 Market Size by Region, 2023-2033 (US$ Billion)
5.7.2 Market Share by Region, 2023 & 2033 (%)
5.8 Others
5.8.1 Market Size by Region, 2023-2033 (US$ Billion)
5.8.2 Market Share by Region, 2023 & 2033 (%)
6 Precision Medicine Market, by Technology, 2023-2033
6.1 Key Findings
6.2 Technology Segment: Market Attractiveness Index
6.3 Precision Medicine Market Size Estimation and Forecast by Technology
6.4 Drug Discovery
6.4.1 Market Size by Region, 2023-2033 (US$ Billion)
6.4.2 Market Share by Region, 2023 & 2033 (%)
6.5 Bioinformatics
6.5.1 Market Size by Region, 2023-2033 (US$ Billion)
6.5.2 Market Share by Region, 2023 & 2033 (%)
6.6 Big Data Analytics
6.6.1 Market Size by Region, 2023-2033 (US$ Billion)
6.6.2 Market Share by Region, 2023 & 2033 (%)
6.7 Gene Sequencing
6.7.1 Market Size by Region, 2023-2033 (US$ Billion)
6.7.2 Market Share by Region, 2023 & 2033 (%)
6.8 Companion Diagnostics
6.8.1 Market Size by Region, 2023-2033 (US$ Billion)
6.8.2 Market Share by Region, 2023 & 2033 (%)
6.9 Other Technologies
6.9.1 Market Size by Region, 2023-2033 (US$ Billion)
6.9.2 Market Share by Region, 2023 & 2033 (%)
7 Precision Medicine Market, by End-users, 2023-2033
7.1 Key Findings
7.2 End-users Segment: Market Attractiveness Index
7.3 Precision Medicine Market Size Estimation and Forecast by End-users
7.4 Hospitals
7.4.1 Market Size by Region, 2023-2033 (US$ Billion)
7.4.2 Market Share by Region, 2023 & 2033 (%)
7.5 Diagnostic centres
7.5.1 Market Size by Region, 2023-2033 (US$ Billion)
7.5.2 Market Share by Region, 2023 & 2033 (%)
7.6 Research & Academic Institutes
7.6.1 Market Size by Region, 2023-2033 (US$ Billion)
7.6.2 Market Share by Region, 2023 & 2033 (%)
7.7 Other End-users
7.7.1 Market Size by Region, 2023-2033 (US$ Billion)
7.7.2 Market Share by Region, 2023 & 2033 (%)
8 Precision Medicine Market Analysis by Region
8.1 Key Findings
8.2 Regional Market Size Estimation and Forecast
9 North America Precision Medicine Market Analysis
9.1 Key Findings
9.2 North America Precision Medicine Market Attractiveness Index
9.3 North America Precision Medicine Market by Country, 2023, 2028 & 2033 (US$ Billion)
9.4 North America Precision Medicine Market Size Estimation and Forecast by Country
9.5 North America Precision Medicine Market Size Estimation and Forecast by Product Type
9.6 North America Precision Medicine Market Size Estimation and Forecast by Application
9.7 North America Precision Medicine Market Size Estimation and Forecast by Technology
9.8 North America Precision Medicine Market Size Estimation and Forecast by End-users
9.9 U.S. Precision Medicine Market Analysis
9.10 Canada Precision Medicine Market Analysis
10 Europe Precision Medicine Market, 2023-2033
10.1 Key Findings
10.2 Europe Precision Medicine Market Attractiveness Index
10.3 Europe Precision Medicine Market by Country, 2023, 2028 & 2033 (US$ Billion)
10.4 Europe Precision Medicine Market Size Estimation and Forecast by Country
10.5 Europe Precision Medicine Market Size Estimation and Forecast by Product Type
10.6 Europe Precision Medicine Market Size Estimation and Forecast by Application
10.7 Europe Precision Medicine Market Size Estimation and Forecast by Technology
10.8 Europe Precision Medicine Market Size Estimation and Forecast by End-users
10.9 Germany Precision Medicine Market Analysis
10.10 UK Precision Medicine Market Analysis
10.11 France Precision Medicine Market Analysis
10.12 Italy Precision Medicine Market Analysis
10.13 Spain Precision Medicine Market Analysis
10.14 Switzerland Precision Medicine Market Analysis
10.15 Netherlands Precision Medicine Market Analysis
10.16 Rest of Europe Precision Medicine Market Analysis
11 Asia Pacific Precision Medicine Market Analysis
11.1 Key Findings
11.2 Asia Pacific Precision Medicine Market Attractiveness Index
11.3 Asia Pacific Precision Medicine Market by Country, 2023, 2028 & 2033 (US$ Billion)
11.4 Asia Pacific Precision Medicine Market Size Estimation and Forecast by Country
11.5 Asia Pacific Precision Medicine Market Size Estimation and Forecast by Product Type
11.6 Asia Pacific Precision Medicine Market Size Estimation and Forecast by Application
11.7 Asia Pacific Precision Medicine Market Size Estimation and Forecast by Technology
11.8 Asia Pacific Precision Medicine Market Size Estimation and Forecast by End-users
11.9 Japan Precision Medicine Market Analysis
11.10 China Precision Medicine Market Analysis
11.11 India Precision Medicine Market Analysis
11.12 Australia Precision Medicine Market Analysis
11.13 South Korea Precision Medicine Market Analysis
11.14 Singapore Precision Medicine Market Analysis
11.15 Rest of Asia Pacific Precision Medicine Market Analysis
12 Latin America Precision Medicine Market Analysis
12.1 Key Findings
12.2 Latin America Precision Medicine Market Attractiveness Index
12.3 Latin America Precision Medicine Market by Country, 2023, 2028 & 2033 (US$ Billion)
12.4 Latin America Precision Medicine Market Size Estimation and Forecast by Country
12.5 Latin America Precision Medicine Market Size Estimation and Forecast by Product Type
12.6 Latin America Precision Medicine Market Size Estimation and Forecast by Application
12.7 Latin America Precision Medicine Market Size Estimation and Forecast by Technology
12.8 Latin America Precision Medicine Market Size Estimation and Forecast by End-users
12.9 Brazil Precision Medicine Market Analysis
12.10 Mexico Precision Medicine Market Analysis
12.11 Argentina Precision Medicine Market Analysis
12.12 Rest of Latin America Precision Medicine Market Analysis
13 MEA Precision Medicine Market Analysis
13.1 Key Findings
13.2 MEA Precision Medicine Market Attractiveness Index
13.3 MEA Precision Medicine Market by Country, 2023, 2028 & 2033 (US$ Billion)
13.4 MEA Precision Medicine Market Size Estimation and Forecast by Country
13.5 MEA Precision Medicine Market Size Estimation and Forecast by Product Type
13.6 MEA Precision Medicine Market Size Estimation and Forecast by Application
13.7 MEA Precision Medicine Market Size Estimation and Forecast by Technology
13.8 MEA Precision Medicine Market Size Estimation and Forecast by End-users
13.9 GCC Precision Medicine Market Analysis
13.10 South Africa Precision Medicine Market Analysis
13.11 Egypt Precision Medicine Market Analysis
13.12 Rest of MEA Precision Medicine Market Analysis
14 Company Profiles
14.1 Competitive Landscape, 2022
14.2 Pfizer Inc.
14.2.1 Company Snapshot
14.2.2 Company Overview
14.2.3 Financial Analysis
14.2.3.1 Net Revenue, 2018-2022
14.2.3.2 R&D, 2018-2022
14.2.3.3 Regional Market Shares, 2022
14.2.4 Product Benchmarking
14.2.5 Strategic Outlook
14.3 Qiagen
14.3.1 Company Snapshot
14.3.2 Company Overview
14.3.3 Financial Analysis
14.3.3.1 Net Revenue, 2018-2022
14.3.3.2 R&D, 2018-2022
14.3.3.3 Regional Market Shares, 2022
14.3.4 Product Benchmarking
14.3.5 Strategic Outlook
14.4 Quest Diagnostics Incorporated
14.4.1 Company Snapshot
14.4.2 Company Overview
14.4.3 Financial Analysis
14.4.3.1 Net Revenue, 2018-2022
14.4.4 Product Benchmarking
14.4.5 Strategic Outlook
14.5 Agilent Technologies Inc.
14.5.1 Company Snapshot
14.5.2 Company Overview
14.5.3 Financial Analysis
14.5.3.1 Net Revenue, 2018-2022
14.5.3.2 R&D, 2018-2022
14.5.3.3 Regional Market Shares, 2022
14.5.4 Product Benchmarking
14.5.5 Strategic Outlook
14.6 Illumina, Inc.
14.6.1 Company Snapshot
14.6.2 Company Overview
14.6.3 Financial Analysis
14.6.3.1 Net Revenue, 2018-2022
14.6.3.2 R&D, 2018-2022
14.6.3.3 Regional Market Shares, 2022
14.6.4 Product Benchmarking
14.6.5 Strategic Outlook
14.7 Novartis AG
14.7.1 Company Snapshot
14.7.2 Company Overview
14.7.3 Financial Analysis
14.7.3.1 Net Revenue, 2018-2022
14.7.3.2 R&D, 2018-2022
14.7.3.3 Regional Market Shares, 2022
14.7.4 Product Benchmarking
14.7.5 Strategic Outlook
14.8 bioMerieux SA
14.8.1 Company Snapshot
14.8.2 Company Overview
14.8.3 Financial Analysis
14.8.3.1 Net Revenue, 2018-2022
14.8.3.2 R&D, 2018-2022
14.8.3.3 Regional Market Shares, 2022
14.8.4 Product Benchmarking
14.8.5 Strategic Outlook
14.9 F. Hoffmann-La Roche Ltd
14.9.1 Company Snapshot
14.9.2 Company Overview
14.9.3 Financial Analysis
14.9.3.1 Net Revenue, 2018-2022
14.9.3.2 R&D, 2018-2022
14.9.3.3 Regional Market Shares, 2022
14.9.4 Product Benchmarking
14.9.5 Strategic Outlook
14.10 Abbott
14.10.1 Company Snapshot
14.10.2 Company Overview
14.10.3 Financial Analysis
14.10.3.1 Net Revenue, 2018-2022
14.10.3.2 R&D, 2018-2022
14.10.3.3 Regional Market Shares, 2022
14.10.4 Product Benchmarking
14.10.5 Strategic Outlook
14.11 Lilly
14.11.1 Company Snapshot
14.11.2 Company Overview
14.11.3 Financial Analysis
14.11.3.1 Net Revenue, 2018-2022
14.11.3.2 R&D, 2018-2022
14.11.3.3 Regional Market Shares, 2022
14.11.4 Product Benchmarking
14.11.5 Strategic Outlook
14.12 Thermo Fisher Scientific Inc.
14.12.1 Company Snapshot
14.12.2 Company Overview
14.12.3 Financial Analysis
14.12.3.1 Net Revenue, 2018-2022
14.12.3.2 R&D, 2018-2022
14.12.3.3 Regional Market Shares, 2022
14.12.4 Product Benchmarking
14.12.5 Strategic Outlook
14.13 AstraZeneca
14.13.1 Company Snapshot
14.13.2 Company Overview
14.13.3 Financial Analysis
14.13.3.1 Net Revenue, 2018-2022
14.13.3.2 R&D, 2018-2022
14.13.3.3 Regional Market Shares, 2022
14.13.4 Product Benchmarking
14.13.5 Strategic Outlook
14.14 Myriad Genetics Inc
14.14.1 Company Snapshot
14.14.2 Company Overview
14.14.3 Financial Analysis
14.14.3.1 Net Revenue, 2018-2022
14.14.3.2 R&D, 2018-2022
14.14.3.3 Regional Market Shares, 2022
14.14.4 Product Benchmarking
14.14.5 Strategic Outlook
14.15 GSK plc
14.15.1 Company Snapshot
14.15.2 Company Overview
14.15.3 Financial Analysis
14.15.3.1 Net Revenue, 2018-2022
14.15.3.2 R&D, 2018-2022
14.15.3.3 Regional Market Shares, 2022
14.15.4 Product Benchmarking
14.15.5 Strategic Outlook
14.16 Bristol-Myers Squibb Company
14.16.1 Company Snapshot
14.16.2 Company Overview
14.16.3 Financial Analysis
14.16.3.1 Net Revenue, 2018-2022
14.16.3.2 R&D, 2018-2022
14.16.3.3 Regional Market Shares, 2022
14.16.4 Product Benchmarking
14.16.5 Strategic Outlook
14.17 Danaher
14.17.1 Company Snapshot
14.17.2 Company Overview
14.17.3 Financial Analysis
14.17.3.1 Net Revenue, 2018-2022
14.17.3.2 R&D, 2018-2022
14.17.3.3 Regional Market Shares, 2022
14.17.4 Product Benchmarking
14.17.5 Strategic Outlook
14.18 Laboratory Corporation of America Holdings
14.18.1 Company Snapshot
14.18.2 Company Overview
14.18.3 Financial Analysis
14.18.3.1 Net Revenue, 2018-2022
14.18.3.2 Regional Market Shares, 2022
14.18.4 Product Benchmarking
14.18.5 Strategic Outlook
14.19 GE HealthCare
14.19.1 Company Snapshot
14.19.2 Company Overview
14.19.3 Financial Analysis
14.19.3.1 Net Revenue, 2018-2022
14.19.3.2 Regional Market Shares, 2022
14.19.4 Product Benchmarking
14.19.5 Strategic Outlook
14.20 Teva Pharmaceutical Industries Ltd.
14.20.1 Company Snapshot
14.20.2 Company Overview
14.20.3 Financial Analysis
14.20.3.1 Net Revenue, 2018-2022
14.20.3.2 R&D, 2018-2022
14.20.3.3 Regional Market Shares, 2022
14.20.4 Product Benchmarking
14.20.5 Strategic Outlook
14.21 NanoString Technologies, Inc.
14.21.1 Company Snapshot
14.21.2 Company Overview
14.21.3 Financial Analysis
14.21.3.1 Net Revenue, 2018-2022
14.21.3.2 R&D, 2018-2022
14.21.3.3 Regional Market Shares, 2022
14.21.4 Product Benchmarking
14.21.5 Strategic Outlook
14.22 Bayer AG
14.22.1 Company Snapshot
14.22.2 Company Overview
14.22.3 Financial Analysis
14.22.3.1 Net Revenue, 2018-2022
14.22.3.2 R&D, 2018-2022
14.22.3.3 Regional Market Shares, 2022
14.22.4 Product Benchmarking
14.22.5 Strategic Outlook
14.23 Biogen
14.23.1 Company Snapshot
14.23.2 Company Overview
14.23.3 Financial Analysis
14.23.3.1 Net Revenue, 2018-2022
14.23.3.2 R&D, 2018-2022
14.23.3.3 Regional Market Shares, 2022
14.23.4 Product Benchmarking
14.23.5 Strategic Outlook
14.24 Johnson & Johnson Services, Inc.
14.24.1 Company Snapshot
14.24.2 Company Overview
14.24.3 Financial Analysis
14.24.3.1 Net Revenue, 2018-2022
14.24.3.2 R&D, 2018-2022
14.24.3.3 Regional Market Shares, 2022
14.24.4 Product Benchmarking
14.24.5 Strategic Outlook
15 Conclusion and Recommendations
15.1 Concluding Remarks from Visiongain
15.2 Recommendations for Market Players
ページTOPに戻る
List of Tables/Graphs
List of Tables
Table 1 Precision Medicine Market Snapshot, 2023 & 2033 (US$ Billion, CAGR %)
Table 2 Precision Medicine Market Forecast by Region, 2023-2033 (US$ Billion, AGR%, CAGR%): “V” Shaped Recovery
Table 3 Precision Medicine Market Forecast by Region, 2023-2033 (US$ Billion, AGR%, CAGR%): “U” Shaped Recovery
Table 4 Precision Medicine Market Forecast by Region, 2023-2033 (US$ Billion, AGR%, CAGR%): “W” Shaped Recovery
Table 5 Precision Medicine Market Forecast by Region, 2023-2033 (US$ Billion, AGR%, CAGR%): “L” Shaped Recovery
Table 6 Precision Medicine Market Forecast by Product Type, 2023-2033 (US$ Billion, AGR%, CAGR%)
Table 7 Diagnostics Segment Market Forecast by Region, 2023-2033 (US$ Billion, AGR%, CAGR%)
Table 8 Genetic Tests Market Forecast by Region, 2023-2033 (US$ Billion, AGR%, CAGR%)
Table 9 Biomarker Based Tests Market Forecast by Region, 2023-2033 (US$ Billion, AGR%, CAGR%)
Table 10 Others Market Forecast by Region, 2023-2033 (US$ Billion, AGR%, CAGR%)
Table 11 Therapeutics Market Forecast by Region, 2023-2033 (US$ Billion, AGR%, CAGR%)
Table 12 Precision Medicine Market by Application, 2023-2033 (US$ Billion, AGR%, CAGR%)
Table 13 Oncology Market Forecast by Region, 2023-2033 (US$ Billion, AGR%, CAGR%)
Table 14 CNS Market Forecast by Region, 2023-2033 (US$ Billion, AGR%, CAGR%)
Table 15 Immunology Market Forecast by Region, 2023-2033 (US$ Billion, AGR%, CAGR%)
Table 16 Respiratory Market Forecast by Region, 2023-2033 (US$ Billion, AGR%, CAGR%)
Table 17 Others Market Forecast by Region, 2023-2033 (US$ Billion, AGR%, CAGR%)
Table 18 Precision Medicine Market Forecast by Technology, 2023-2033 (US$ Billion, AGR%, CAGR%)
Table 19 Drug Discovery Market Forecast by Region, 2023-2033 (US$ Billion, AGR%, CAGR%)
Table 20 Bioinformatics Market Forecast by Region, 2023-2033 (US$ Billion, AGR%, CAGR%)
Table 21 Big Data Analytics Market Forecast by Region, 2023-2033 (US$ Billion, AGR%, CAGR%)
Table 22 Gene Sequencing Market Forecast by Region, 2023-2033 (US$ bn, AGR%, CAGR%)
Table 23 Companion Diagnostics Market Forecast by Region, 2023-2033 (US$ Billion, AGR%, CAGR%)
Table 24 Other Technologies Market Forecast by Region, 2023-2033 (US$ Billion, AGR%, CAGR%)
Table 25 Precision Medicine Market Forecast by End-users, 2023-2033 (US$ Billion, AGR%, CAGR%)
Table 26 Hospitals Market Forecast by Region, 2023-2033 (US$ Billion, AGR%, CAGR%)
Table 27 Diagnostic Centres Market Forecast by Region, 2023-2033 (US$ Billion, AGR%, CAGR%)
Table 28 Research & academic institutes Market Forecast by Region, 2023-2033 (US$ Billion, AGR%, CAGR%)
Table 29 Other End-users Market Forecast by Region, 2023-2033 (US$ Billion, AGR%, CAGR%)
Table 30 Precision Medicine Market Forecast by Region, 2023-2033 (US$ Billion, AGR%, CAGR%)
Table 31 North America Precision Medicine Market Forecast by Country, 2023-2033 (US$ Billion, AGR%, CAGR%)
Table 32 North America Precision Medicine Market Forecast by Product Type, 2023-2033 (US$ Billion, AGR%, CAGR%)
Table 33 North America Precision Medicine Market Forecast by Application, 2023-2033 (US$ Billion, AGR%, CAGR%)
Table 34 North America Precision Medicine Market Forecast by Technology, 2023-2033 (US$ Billion, AGR%, CAGR%)
Table 35 North America Precision Medicine Market Forecast by End-users, 2023-2033 (US$ Billion, AGR%, CAGR%)
Table 36 U.S. Precision Medicine Market Forecast, 2023-2033 (US$ Billion, AGR%, CAGR%)
Table 37 Canada Precision Medicine Market Forecast, 2023-2033 (US$ Billion, AGR%, CAGR%)
Table 38 Europe Precision Medicine Market Forecast by Country, 2023-2033 (US$ Billion, AGR%, CAGR%)
Table 39 Europe Precision Medicine Market Forecast by Product Type, 2023-2033 (US$ Billion, AGR%, CAGR%)
Table 40 Europe Precision Medicine Market Forecast by Application, 2023-2033 (US$ Billion, AGR%, CAGR%)
Table 41 Europe Precision Medicine Market Forecast by Technology, 2023-2033 (US$ Billion, AGR%, CAGR%)
Table 42 Europe Precision Medicine Market Forecast by End-users, 2023-2033 (US$ Billion, AGR%, CAGR%)
Table 43 Germany Precision Medicine Market Forecast, 2023-2033 (US$ Billion, AGR%, CAGR%)
Table 44 UK Precision Medicine Market Forecast, 2023-2033 (US$ Billion, AGR%, CAGR%)
Table 45 France Precision Medicine Market Forecast, 2023-2033 (US$ Billion, AGR%, CAGR%)
Table 46 Italy Precision Medicine Market Forecast, 2023-2033 (US$ Billion, AGR%, CAGR%)
Table 47 Spain Precision Medicine Market Forecast, 2023-2033 (US$ Billion, AGR%, CAGR%)
Table 48 Switzerland Precision Medicine Market Forecast, 2023-2033 (US$ Billion, AGR%, CAGR%)
Table 49 Netherlands Precision Medicine Market Forecast, 2023-2033 (US$ Billion, AGR%, CAGR%)
Table 50 Rest of Europe Precision Medicine Market Forecast, 2023-2033 (US$ Billion, AGR%, CAGR%)
Table 51 Asia Pacific Precision Medicine Market Forecast by Country, 2023-2033 (US$ Billion, AGR%, CAGR%)
Table 52 Asia Pacific Precision Medicine Market Forecast by Product Type, 2023-2033 (US$ Billion, AGR%, CAGR%)
Table 53 Asia Pacific Precision Medicine Market Forecast by Application, 2023-2033 (US$ Billion, AGR%, CAGR%)
Table 54 Asia Pacific Precision Medicine Market Forecast by Technology, 2023-2033 (US$ Billion, AGR%, CAGR%)
Table 55 Asia Pacific Precision Medicine Market Forecast by End-users, 2023-2033 (US$ Billion, AGR%, CAGR%)
Table 56 Japan Precision Medicine Market Forecast, 2023-2033 (US$ Billion, AGR%, CAGR%)
Table 57 China Precision Medicine Market Forecast, 2023-2033 (US$ Billion, AGR%, CAGR%)
Table 58 India Precision Medicine Market Forecast, 2023-2033 (US$ Billion, AGR%, CAGR%)
Table 59 Australia Precision Medicine Market Forecast, 2023-2033 (US$ Billion, AGR%, CAGR%)
Table 60 South Korea Precision Medicine Market Forecast, 2023-2033 (US$ Billion, AGR%, CAGR%)
Table 61 Singapore Precision Medicine Market Forecast, 2023-2033 (US$ Billion, AGR%, CAGR%)
Table 62 Rest of Asia Pacific Precision Medicine Market Forecast, 2023-2033 (US$ Billion, AGR%, CAGR%)
Table 63 Latin America Precision Medicine Market Forecast by Country, 2023-2033 (US$ Billion, AGR%, CAGR%)
Table 64 Latin America Precision Medicine Market Forecast by Product Type, 2023-2033 (US$ Billion, AGR%, CAGR%)
Table 65 Latin America Precision Medicine Market Forecast by Application, 2023-2033 (US$ Billion, AGR%, CAGR%)
Table 66 Latin America Precision Medicine Market Forecast by Technology, 2023-2033 (US$ Billion, AGR%, CAGR%)
Table 67 Latin America Precision Medicine Market Forecast by End-users, 2023-2033 (US$ Billion, AGR%, CAGR%)
Table 68 Brazil Precision Medicine Market Forecast, 2023-2033 (US$ Billion, AGR%, CAGR%)
Table 69 Mexico Precision Medicine Market Forecast, 2023-2033 (US$ Billion, AGR%, CAGR%)
Table 70 Argentina Precision Medicine Market Forecast, 2023-2033 (US$ Billion, AGR%, CAGR%)
Table 71 Rest of Latin America Precision Medicine Market Forecast, 2023-2033 (US$ Billion, AGR%, CAGR%)
Table 72 MEA Precision Medicine Market Forecast by Country, 2023-2033 (US$ Billion, AGR%, CAGR%)
Table 73 MEA Precision Medicine Market Forecast by Product Type, 2023-2033 (US$ Billion, AGR%, CAGR%)
Table 74 MEA Precision Medicine Market Forecast by Application, 2023-2033 (US$ Billion, AGR%, CAGR%)
Table 75 MEA Precision Medicine Market Forecast by Technology, 2023-2033 (US$ Billion, AGR%, CAGR%)
Table 76 MEA Precision Medicine Market Forecast by End-users, 2023-2033 (US$ Billion, AGR%, CAGR%)
Table 77 GCC Precision Medicine Market Forecast, 2023-2033 (US$ Billion, AGR%, CAGR%)
Table 78 South Africa Precision Medicine Market Forecast, 2023-2033 (US$ Billion, AGR%, CAGR%)
Table 79 Egypt Precision Medicine Market Forecast, 2023-2033 (US$ Billion, AGR%, CAGR%)
Table 80 Rest of MEA Precision Medicine Market Forecast, 2023-2033 (US$ Billion, AGR%, CAGR%)
Table 81 Pfizer Inc.: Key Details, (CEO, HQ, Revenue, Founded, No. of Employees, Company Type, Website, Business Segment)
Table 82 Pfizer Inc.: Product Benchmarking
Table 83 Pfizer Inc.: Strategic Outlook
Table 84 Qiagen: Key Details, (CEO, HQ, Revenue, Founded, No. of Employees, Company Type, Website, Business Segment)
Table 85 Qiagen: Product Benchmarking
Table 86 Qiagen: Strategic Outlook
Table 87 Quest Diagnostics Incorporated: Key Details, (CEO, HQ, Revenue, Founded, No. of Employees, Company Type, Website, Business Segment)
Table 88 Quest Diagnostics Incorporated: Product Benchmarking
Table 89 Quest Diagnostics Incorporated: Strategic Outlook
Table 90 Agilent Technologies Inc.: Key Details, (CEO, HQ, Revenue, Founded, No. of Employees, Company Type, Website, Business Segment)
Table 91 Agilent Technologies Inc.: Product Benchmarking
Table 92 Agilent Technologies Inc.: Strategic Outlook
Table 93 Illumina, Inc.: Key Details, (CEO, HQ, Revenue, Founded, No. of Employees, Company Type, Website, Business Segment)
Table 94 Illumina, Inc.: Product Benchmarking
Table 95 Illumina, Inc.: Strategic Outlook
Table 96 Novartis AG: Key Details, (CEO, HQ, Revenue, Founded, No. of Employees, Company Type, Website, Business Segment)
Table 97 Novartis AG: Product Benchmarking
Table 98 Novartis AG: Strategic Outlook
Table 99 bioMerieux SA: Key Details, (CEO, HQ, Revenue, Founded, No. of Employees, Company Type, Website, Business Segment)
Table 100 bioMerieux SA: Product Benchmarking
Table 101 bioMerieux SA: Strategic Outlook
Table 102 F. Hoffmann-La Roche Ltd: Key Details, (CEO, HQ, Revenue, Founded, No. of Employees, Company Type, Website, Business Segment)
Table 103 F. Hoffmann-La Roche Ltd.: Product Benchmarking
Table 104 F. Hoffmann-La Roche Ltd.: Strategic Outlook
Table 105 Abbott : Key Details, (CEO, HQ, Revenue, Founded, No. of Employees, Company Type, Website, Business Segment)
Table 106 Abbott: Product Benchmarking
Table 107 Abbott: Strategic Outlook
Table 108 Lilly: Key Details, (CEO, HQ, Revenue, Founded, No. of Employees, Company Type, Website, Business Segment)
Table 109 Lilly: Product Benchmarking
Table 110 Lilly: Strategic Outlook
Table 111 Thermo Fisher Scientific Inc.: Key Details, (CEO, HQ, Revenue, Founded, No. of Employees, Company Type, Website, Business Segment)
Table 112 Thermo Fisher Scientific Inc.: Product Benchmarking
Table 113 Thermo Fisher Scientific Inc.: Strategic Outlook
Table 114 AstraZeneca: Key Details, (CEO, HQ, Revenue, Founded, No. of Employees, Company Type, Website, Business Segment)
Table 115 AstraZeneca: Product Benchmarking
Table 116 AstraZeneca: Strategic Outlook
Table 117 Myriad Genetics Inc.: Key Details, (CEO, HQ, Revenue, Founded, No. of Employees, Company Type, Website, Business Segment)
Table 118 Myriad Genetics Inc.: Product Benchmarking
Table 119 Myriad Genetics Inc.: Strategic Outlook
Table 120 GSK plc: Key Details, (CEO, HQ, Revenue, Founded, No. of Employees, Company Type, Website, Business Segment)
Table 121 GSK plc: Product Benchmarking
Table 122 GSK plc: Strategic Outlook
Table 123 Bristol-Myers Squibb Company Company: Key Details, (CEO, HQ, Revenue, Founded, No. of Employees, Company Type, Website, Business Segment)
Table 124 Bristol-Myers Squibb Company: Product Benchmarking
Table 125 Bristol-Myers Squibb Company: Strategic Outlook
Table 126 Danaher : Key Details, (CEO, HQ, Revenue, Founded, No. of Employees, Company Type, Website, Business Segment)
Table 127 Danaher: Product Benchmarking
Table 128 Danaher: Strategic Outlook
Table 129 Laboratory Corporation of America Holdings: Key Details, (CEO, HQ, Founded, No. of Employees, Company Type, Website, Business Segment)
Table 130 Laboratory Corporation of America Holdings: Product Benchmarking
Table 131 Laboratory Corporation of America Holdings: Strategic Outlook
Table 132 GE HealthCare: Key Details, (CEO, HQ, Revenue, Founded, No. of Employees, Company Type, Website, Business Segment)
Table 133 GE HealthCare: Product Benchmarking
Table 134 GE HealthCare: Strategic Outlook
Table 135 Teva Pharmaceutical Industries Ltd: Key Details, (CEO, HQ, Revenue, Founded, No. of Employees, Company Type, Website, Business Segment)
Table 136 Teva Pharmaceutical Industries Ltd.: Product Benchmarking
Table 137 Teva Pharmaceutical Industries Ltd.: Strategic Outlook
Table 138 NanoString Technologies, Inc.: Key Details, (CEO, HQ, Revenue, Founded, No. of Employees, Company Type, Website, Business Segment)
Table 139 NanoString Technologies, Inc.: Product Benchmarking
Table 140 NanoString Technologies, Inc.: Strategic Outlook
Table 141 Bayer AG: Key Details, (CEO, HQ, Revenue, Founded, No. of Employees, Company Type, Website, Business Segment)
Table 142 Bayer AG: Product Benchmarking
Table 143 Bayer AG: Strategic Outlook
Table 144 Biogen: Key Details, (CEO, HQ, Revenue, Founded, No. of Employees, Company Type, Website, Business Segment)
Table 145 Biogen: Product Benchmarking
Table 146 Biogen: Strategic Outlook
Table 147 Johnson & Johnson Services, Inc.: Key Details, (CEO, HQ, Revenue, Founded, No. of Employees, Company Type, Website, Business Segment)
Table 148 Johnson & Johnson Services, Inc.: Product Benchmarking
Table 149 Johnson & Johnson Services, Inc.: Strategic Outlook
List of Figures
Figure 1 Precision Medicine Market Segmentation
Figure 2 Precision Medicine Market Attractiveness Index by Region
Figure 3 Precision Medicine Market by Product Type: Market Attractiveness Index
Figure 4 Precision Medicine Market by Application: Market Attractiveness Index
Figure 5 Precision Medicine Market by Technology: Market Attractiveness Index
Figure 6 Precision Medicine Market by End-users: Market Attractiveness Index
Figure 7 Precision Medicine Market: Market Dynamics
Figure 8 Precision Medicine Market by Region, 2023-2033 (US$ Billion, AGR %): “V” Shaped Recovery
Figure 9 Precision Medicine Market by Region, 2023-2033 (US$ Billion, AGR %): “U” Shaped Recovery
Figure 10 Precision Medicine Market by Region, 2023-2033 (US$ Billion, AGR %): “W” Shaped Recovery
Figure 11 Precision Medicine Market by Region, 2023-2033 (US$ Billion, AGR %): “L” Shaped Recovery
Figure 12 Precision Medicine Market: Porter’s Five Forces Analysis
Figure 13 Global Precision Medicine Market: SWOT Analysis
Figure 14 Precision Medicine Market: PEST Analysis
Figure 15 Precision Medicine Market by Product Type: Market Attractiveness Index
Figure 16 Precision Medicine Market Forecast by Product Type, 2023-2033 (US$ Billion, AGR %)
Figure 17 Precision Medicine Market Share Forecast by Product Type, 2023, 2028, 2033 (%)
Figure 18 Diagnostics Segment Market Forecast by Region, 2023-2033 (US$ Billion, AGR %)
Figure 19 Diagnostics Segment Market Share Forecast by Region, 2023 & 2033 (%)
Figure 20 Genetic Tests Market Forecast by Region, 2023-2033 (US$ Billion)
Figure 21 Genetic Tests Market Share Forecast by Region, 2023 & 2033 (%)
Figure 22 Biomarker Based Tests Market Forecast by Region, 2023-2033 (US$ Billion)
Figure 23 Biomarker Based Tests Market Share Forecast by Region, 2023 & 2033 (%)
Figure 24 Others Market Forecast by Region, 2023-2033 (US$ Billion)
Figure 25 Others Market Share Forecast by Region, 2023 & 2033 (%)
Figure 26 Therapeutics Market Forecast by Region, 2023-2033 (US$ Billion)
Figure 27 Therapeutics Market Share Forecast by Region, 2023 & 2033 (%)
Figure 28 Precision Medicine Market by Application: Market Attractiveness Index
Figure 29 Precision Medicine Market by Application, 2023-2033 (US$ Billion)
Figure 30 Precision Medicine Market Share Forecast by Application, 2023, 2028, 2033 (%)
Figure 31 Oncology Market Forecast by Region, 2023-2033 (US$ Billion)
Figure 32 Oncology Market Share Forecast by Region, 2023 & 2033 (%)
Figure 33 CNS Market Forecast by Region, 2023-2033 (US$ Billion)
Figure 34 CNS Market Share Forecast by Region, 2023 & 2033 (%)
Figure 35 Immunology Market Forecast by Region, 2023-2033 (US$ Billion)
Figure 36 Immunology Market Share Forecast by Region, 2023 & 2033 (%)
Figure 37 Respiratory Market Forecast by Region, 2023-2033 (US$ Billion)
Figure 38 Respiratory Market Share Forecast by Region, 2023 & 2033 (%)
Figure 39 Others Market Forecast by Region, 2023-2033 (US$ Billion)
Figure 40 Others Market Share Forecast by Region, 2023 & 2033 (%)
Figure 41 Precision Medicine Market by Technology: Market Attractiveness Index
Figure 42 Precision Medicine Market Forecast by Technology, 2023-2033 (US$ Billion)
Figure 43 Precision Medicine Market Share Forecast by Technology, 2023, 2028, 2033 (%)
Figure 44 Drug Discovery Market Forecast by Region, 2023-2033 (US$ Billion)
Figure 45 Drug Discovery Market Share Forecast by Region, 2023 & 2033 (%)
Figure 46 Bioinformatics Market Forecast by Region, 2023-2033 (US$ Billion)
Figure 47 Bioinformatics Market Share Forecast by Region, 2023 & 2033 (%)
Figure 48 Big Data Analytics Market Forecast by Region, 2023-2033 (US$ Billion)
Figure 49 Big Data Analytics Market Share Forecast by Region, 2023 & 2033 (%)
Figure 50 Gene Sequencing Market Forecast by Region, 2023-2033 (US$ Billion)
Figure 51 Gene Sequencing Market Share Forecast by Region, 2023 & 2033 (%)
Figure 52 Companion Diagnostics Market Forecast by Region, 2023-2033 (US$ Billion)
Figure 53 Companion Diagnostics Market Share Forecast by Region, 2023 & 2033 (%)
Figure 54 Other Technologies Market Forecast by Region, 2023-2033 (US$ Billion)
Figure 55 Other Technologies Market Share Forecast by Region, 2023 & 2033 (%)
Figure 56 Precision Medicine Market by End-users: Market Attractiveness Index
Figure 57 Precision Medicine Market Forecast by End-users, 2023-2033 (US$ Billion)
Figure 58 Precision Medicine Market Share Forecast by End-users, 2023, 2028, 2033 (%)
Figure 59 Hospitals Market Forecast by Region, 2023-2033 (US$ Billion)
Figure 60 Hospitals Market Share Forecast by Region, 2023 & 2033 (%)
Figure 61 Diagnostic Centres Market Forecast by Region, 2023-2033 (US$ Billion)
Figure 62 Diagnostic Centres Market Share Forecast by Region, 2023 & 2033 (%)
Figure 63 Research & academic institutes Market Forecast by Region, 2023-2033 (US$ Billion)
Figure 64 Research & academic institutes Market Share Forecast by Region, 2023 & 2033 (%)
Figure 65 Other End-users Market Forecast by Region, 2023-2033 (US$ Billion)
Figure 66 Other End-users Market Share Forecast by Region, 2023 & 2033 (%)
Figure 67 Precision Medicine Market Forecast by Region 2023 and 2033 (Revenue, CAGR%)
Figure 68 Precision Medicine Market Share Forecast by Region 2023, 2028, 2033 (%)
Figure 69 Precision Medicine Market by Region, 2023-2033 (US$ Billion, AGR %)
Figure 70 North America Precision Medicine Market Attractiveness Index
Figure 71 North America Precision Medicine Market by Region, 2023, 2028 & 2033 (US$ Billion)
Figure 72 North America Precision Medicine Market Forecast by Country, 2023-2033 (US$ Billion, AGR %)
Figure 73 North America Precision Medicine Market Share Forecast by Country, 2023 & 2033 (%)
Figure 74 North America Precision Medicine Market Forecast by Product Type, 2023-2033 (US$ Billion, AGR %)
Figure 75 North America Precision Medicine Market Share Forecast by Product Type, 2023 & 2033 (%)
Figure 76 North America Precision Medicine Market Forecast by Application, 2023-2033 (US$ Billion, AGR %)
Figure 77 North America Precision Medicine Market Share Forecast by Application, 2023 & 2033 (%)
Figure 78 North America Precision Medicine Market Forecast by Technology, 2023-2033 (US$ Billion, AGR %)
Figure 79 North America Precision Medicine Market Share Forecast by Technology, 2023 & 2033 (%)
Figure 80 North America Precision Medicine Market Forecast by End-users, 2023-2033 (US$ Billion, AGR %)
Figure 81 North America Precision Medicine Market Share Forecast by End-users, 2023 & 2033 (%)
Figure 82 U.S. Precision Medicine Market Forecast, 2023-2033 (US$ Billion, AGR %)
Figure 83 Canada Precision Medicine Market Forecast, 2023-2033 (US$ Billion, AGR %)
Figure 84 Europe Precision Medicine Market Attractiveness Index
Figure 85 Europe Precision Medicine Market by Region, 2023, 2028 & 2033 (US$ Billion)
Figure 86 Europe Precision Medicine Market Forecast by Country, 2023-2033 (US$ Billion)
Figure 87 Europe Precision Medicine Market Share Forecast by Country, 2023 & 2033 (%)
Figure 88 Europe Precision Medicine Market Forecast by Product Type, 2023-2033 (US$ Billion)
Figure 89 Europe Precision Medicine Market Share Forecast by Product Type, 2023 & 2033 (%)
Figure 90 Europe Precision Medicine Market Forecast by Application, 2023-2033 (US$ Billion)
Figure 91 Europe Precision Medicine Market Share Forecast by Application, 2023 & 2033 (%)
Figure 92 Europe Precision Medicine Market Forecast by Technology, 2023-2033 (US$ Billion)
Figure 93 Europe Precision Medicine Market Share Forecast by Technology, 2023 & 2033(%)
Figure 94 Europe Precision Medicine Market Forecast by End-users, 2023-2033 (US$ Billion)
Figure 95 Europe Precision Medicine Market Share Forecast by End-users, 2023 & 2033(%)
Figure 96 Germany Precision Medicine Market Forecast, 2023-2033 (US$ Billion, AGR %)
Figure 97 UK Precision Medicine Market Forecast, 2023-2033 (US$ Billion, AGR %)
Figure 98 France Precision Medicine Market Forecast, 2023-2033 (US$ Billion, AGR %)
Figure 99 Italy Precision Medicine Market Forecast, 2023-2033 (US$ Billion, AGR %)
Figure 100 Spain Precision Medicine Market Forecast, 2023-2033 (US$ Billion, AGR %)
Figure 101 Switzerland Precision Medicine Market Forecast, 2023-2033 (US$ Billion, AGR %)
Figure 102 Netherlands Precision Medicine Market Forecast, 2023-2033 (US$ Billion, AGR %)
Figure 103 Rest of Europe Precision Medicine Market Forecast, 2023-2033 (US$ Billion, AGR %)
Figure 104 Asia Pacific Precision Medicine Market Attractiveness Index
Figure 105 Asia Pacific Precision Medicine Market by Region, 2023, 2028 & 2033 (US$ Billion)
Figure 106 Asia Pacific Precision Medicine Market Forecast by Country, 2023-2033 (US$ Billion)
Figure 107 Asia Pacific Precision Medicine Market Share Forecast by Country, 2023 & 2033 (%)
Figure 108 Asia Pacific Precision Medicine Market Forecast by Product Type, 2023-2033 (US$ Billion)
Figure 109 Asia Pacific Precision Medicine Market Share Forecast by Product Type, 2023 & 2033 (%)
Figure 110 Asia Pacific Precision Medicine Market Forecast by Application, 2023-2033 (US$ Billion)
Figure 111 Asia Pacific Precision Medicine Market Share Forecast by Application, 2023 & 2033 (%)
Figure 112 Asia Pacific Precision Medicine Market Forecast by Technology, 2023-2033 (US$ Billion)
Figure 113 Asia Pacific Precision Medicine Market Share Forecast by Technology, 2023 & 2033 (%)
Figure 114 Asia Pacific Precision Medicine Market Forecast by End-users, 2023-2033 (US$ Billion)
Figure 115 Asia Pacific Precision Medicine Market Share Forecast by End-users, 2023 & 2033 (%)
Figure 116 Japan Precision Medicine Market Forecast, 2023-2033 (US$ Billion, AGR %)
Figure 117 China Precision Medicine Market Forecast, 2023-2033 (US$ Billion, AGR %)
Figure 118 India Precision Medicine Market Forecast, 2023-2033 (US$ Billion, AGR %)
Figure 119 Australia Precision Medicine Market Forecast, 2023-2033 (US$ Billion, AGR %)
Figure 120 South Korea Precision Medicine Market Forecast, 2023-2033 (US$ Billion, AGR %)
Figure 121 Singapore Precision Medicine Market Forecast, 2023-2033 (US$ Billion, AGR %)
Figure 122 Rest of Asia Pacific Precision Medicine Market Forecast, 2023-2033 (US$ Billion, AGR %)
Figure 123 Latin America Precision Medicine Market Attractiveness Index
Figure 124 Latin America Precision Medicine Market by Region, 2023, 2028 & 2033 (US$ Billion)
Figure 125 Latin America Precision Medicine Market Forecast by Country, 2023-2033 (US$ Billion)
Figure 126 Latin America Precision Medicine Market Share Forecast by Country, 2023 & 2033 (%)
Figure 127 Latin America Precision Medicine Market Forecast by Product Type, 2023-2033 (US$ Billion)
Figure 128 Latin America Precision Medicine Market Share Forecast by Product Type, 2023 & 2033 (%)
Figure 129 Latin America Precision Medicine Market Forecast by Application, 2023-2033 (US$ Billion)
Figure 130 Latin America Precision Medicine Market Share Forecast by Application, 2023 & 2033 (%)
Figure 131 Latin America Precision Medicine Market Forecast by Technology, 2023-2033 (US$ Billion)
Figure 132 Latin America Precision Medicine Market Share Forecast by Technology, 2023 & 2033 (%)
Figure 133 Latin America Precision Medicine Market Forecast by End-users, 2023-2033 (US$ Billion)
Figure 134 Latin America Precision Medicine Market Share Forecast by End-users, 2023 & 2033 (%)
Figure 135 Brazil Precision Medicine Market Forecast, 2023-2033 (US$ Billion, AGR %)
Figure 136 Mexico Precision Medicine Market Forecast, 2023-2033 (US$ Billion, AGR %)
Figure 137 Argentina Precision Medicine Market Forecast, 2023-2033 (US$ Billion, AGR %)
Figure 138 Rest of Latin America Precision Medicine Market Forecast, 2023-2033 (US$ Billion, AGR %)
Figure 139 MEA Precision Medicine Market Attractiveness Index
Figure 140 MEA Precision Medicine Market by Region, 2023, 2028 & 2033 (US$ Billion)
Figure 141 MEA Precision Medicine Market Forecast by Country, 2023-2033 (US$ Billion)
Figure 142 MEA Precision Medicine Market Share Forecast by Country, 2023 & 2033 (%)
Figure 143 MEA Precision Medicine Market Forecast by Product Type, 2023-2033 (US$ Billion)
Figure 144 MEA Precision Medicine Market Share Forecast by Product Type, 2023 & 2033 (%)
Figure 145 MEA Precision Medicine Market Forecast by Application, 2023-2033 (US$ Billion)
Figure 146 MEA Precision Medicine Market Share Forecast by Application, 2023 & 2033 (%)
Figure 147 MEA Precision Medicine Market Forecast by Technology, 2023-2033 (US$ Billion)
Figure 148 MEA Precision Medicine Market Share Forecast by Technology, 2023 & 2033 (%)
Figure 149 MEA Precision Medicine Market Forecast by End-users, 2023-2033 (US$ Billion)
Figure 150 MEA Precision Medicine Market Share Forecast by End-users, 2023 & 2033 (%)
Figure 151 GCC Precision Medicine Market Forecast, 2023-2033 (US$ Billion, AGR %)
Figure 152 South Africa Precision Medicine Market Forecast, 2023-2033 (US$ Billion, AGR %)
Figure 153 Egypt Precision Medicine Market Forecast, 2023-2033 (US$ Billion, AGR %)
Figure 154 Rest of MEA Precision Medicine Market Forecast, 2023-2033 (US$ Billion, AGR %)
Figure 155 Precision Medicine Market: Company Share/Ranking, 2022
Figure 156 Pfizer Inc. Inc: Net Revenue, 2018-2022 (US$ Million, AGR %)
Figure 157 Pfizer Inc.: R&D, 2018-2022 (US$ Million, AGR%)
Figure 158 Pfizer Inc.: Regional Market Shares, 2022
Figure 159 Qiagen: Net Revenue, 2018-2022 (US$ Million, AGR %)
Figure 160 Qiagen: R&D, 2018-2022 (US$ Million, AGR %)
Figure 161 Qiagen: Regional Market Shares, 2022
Figure 162 Quest Diagnostics Inc.: Net Revenue, 2018-2022 (US$ Million, AGR %)
Figure 163 Agilent Technologies Inc.: Net Revenue, 2018-2022 (US$ Million, AGR %)
Figure 164 Agilent Technologies Inc.: R&D, 2018-2022 (US$ Million, AGR %)
Figure 165 Agilent Technologies Inc.: Regional Market Shares, 2022
Figure 166 Illumina, Inc.: Net Revenue, 2018-2022 (US$ Million, AGR (%)
Figure 167 Illumina, Inc.: R&D, 2018-2022 (US$ Million, AGR %)
Figure 168 Illumina, Inc.: Regional Market Shares, 2022
Figure 169 Novartis AG: Net Revenue, 2018-2022 (US$ Million, AGR %)
Figure 170 Novartis AG: R&D, 2018-2022(US$ Million, AGR %)
Figure 171 Novartis AG: Regional Market Shares, 2022
Figure 172 bioMerieux SA: Net Revenue, 2018-2022 (US$ Million, AGR %)
Figure 173 bioMerieux SA: R&D, 2018-2022 (US$ Million, AGR %)
Figure 174 bioMerieux SA: Regional Market Shares, 2022
Figure 175 F. Hoffmann-La Roche Ltd: Net Revenue, 2018-2022 (US$ Million, AGR %)
Figure 176 F. Hoffmann-La Roche Ltd: R&D, 2018-2022 (US$ Million, AGR (%))
Figure 177 F. Hoffmann-La Roche Ltd: Regional Market Shares, 2022
Figure 178 Abbott: Net Revenue, 2018-2022 (US$ Million, AGR %)
Figure 179 Abbott: R&D, 2018-2022(US$ Million, AGR %)
Figure 180 Abbott: Regional Market Shares, 2022
Figure 181 Lilly.: Net Revenue, 2018-2022 (US$ Million, AGR %)
Figure 182 Lilly.: R&D, 2018-2022 (US$ Million, AGR %)
Figure 183 Lilly.: Regional Market Shares, 2022
Figure 184 Thermo Fisher Scientific Inc..: Net Revenue, 2018-2022 (US$ Million, AGR %)
Figure 185 Thermo Fisher Scientific Inc..: R&D, 2018-2022 (US$ Million, AGR %)
Figure 186 Thermo Fisher Scientific Inc..: Regional Market Shares, 2022
Figure 187 AstraZeneca: Net Revenue, 2018-2022 (US$ Million, AGR %)
Figure 188 AstraZeneca: R&D, 2018-2022 (US$ Million, AGR %)
Figure 189 AstraZeneca.: Regional Market Shares, 2021
Figure 190 Myriad Genetics Inc.: Net Revenue, 2018-2022(US$ Million, AGR %)
Figure 191 Myriad Genetics Inc.: R&D, 2018-2022 (US$ Million, AGR %)
Figure 192 Myriad Genetics Inc.: Regional Market Shares, 2022
Figure 193 GSK plc: Net Revenue, 2018-2022(US$ Million, AGR %)
Figure 194 GSK plc: R&D, 2018-2022 (US$ Million, AGR %)
Figure 195 GSK plc: Regional Market Shares, 2022
Figure 196 Bristol-Myers Squibb Company: Net Revenue, 2018-2022(US$ Million, AGR %)
Figure 197 Bristol-Myers Squibb Company: R&D, 2018-2022 (US$ Million, AGR %)
Figure 198 Bristol-Myers Squibb Company: Regional Market Shares, 2022
Figure 199 Danaher: Net Revenue, 2018-2022 (US$ Million, AGR %)
Figure 200 Danaher: R&D, 2018-2022 (US$ Million, AGR %)
Figure 201 Danaher: Regional Market Shares, 2022
Figure 202 Laboratory Corporation of America Holdings: Net Revenue, 2018-2022 (US$ Million, AGR %)
Figure 203 Laboratory Corporation of America Holdings: Regional Market Shares, 2022
Figure 204 GE HealthCare: Net Revenue, 2018-2022 (US$ Million, AGR %)
Figure 205 GE HealthCare: Regional Market Shares, 2022
Figure 206 Teva Pharmaceutical Industries Ltd: Net Revenue, 2018-2022 (US$ Million, AGR %)
Figure 207 Teva Pharmaceutical Industries Ltd: R&D, 2018-2022 (US$ Million, AGR %)
Figure 208 Teva Pharmaceutical Industries Ltd: Regional Market Shares, 2022
Figure 209 NanoString Technologies, Inc.: Net Revenue, 2018-2022 (US$ Million, AGR %)
Figure 210 NanoString Technologies, Inc.: R&D, 2018-2022 (US$ Million, AGR %)
Figure 211 NanoString Technologies, Inc.: Regional Market Shares, 2022
Figure 212 Bayer AG: Net Revenue, 2018-2022 (US$ Million, AGR %)
Figure 213 Bayer AG: R&D, 2018-2022 (US$ Million, AGR %)
Figure 214 Bayer AG: Regional Market Shares, 2022
Figure 215 Biogen: Net Revenue, 2018-2022 (US$ Million, AGR %)
Figure 216 Biogen: R&D, 2018-2022 (US$ Million, AGR %)
Figure 217 Biogen: Regional Market Shares, 2022
Figure 218 Johnson & Johnson Services, Inc.: Net Revenue, 2018-2022 (US$ Million, AGR %)
Figure 219 Johnson & Johnson Services, Inc.: R&D, 2018-2022 (US$ Million, AGR %)
Figure 220 Johnson & Johnson Services, Inc.: Regional Market Shares, 2022
ページTOPに戻る
よくあるご質問
Visiongain社はどのような調査会社ですか?
英国の調査会社ヴィジョンゲイン社(Visiongain)は、通信とエネルギーのほか、自動車や化学・医薬品、金属など、広範な市場を対象に調査を行っています。自動車市場については、市場全般に関する調査のほ... もっと見る
調査レポートの納品までの日数はどの程度ですか?
在庫のあるものは速納となりますが、平均的には 3-4日と見て下さい。
但し、一部の調査レポートでは、発注を受けた段階で内容更新をして納品をする場合もあります。
発注をする前のお問合せをお願いします。
注文の手続きはどのようになっていますか?
1)お客様からの御問い合わせをいただきます。
2)見積書やサンプルの提示をいたします。
3)お客様指定、もしくは弊社の発注書をメール添付にて発送してください。
4)データリソース社からレポート発行元の調査会社へ納品手配します。
5) 調査会社からお客様へ納品されます。最近は、pdfにてのメール納品が大半です。
お支払方法の方法はどのようになっていますか?
納品と同時にデータリソース社よりお客様へ請求書(必要に応じて納品書も)を発送いたします。
お客様よりデータリソース社へ(通常は円払い)の御振り込みをお願いします。
請求書は、納品日の日付で発行しますので、翌月最終営業日までの当社指定口座への振込みをお願いします。振込み手数料は御社負担にてお願いします。
お客様の御支払い条件が60日以上の場合は御相談ください。
尚、初めてのお取引先や個人の場合、前払いをお願いすることもあります。ご了承のほど、お願いします。
データリソース社はどのような会社ですか?
当社は、世界各国の主要調査会社・レポート出版社と提携し、世界各国の市場調査レポートや技術動向レポートなどを日本国内の企業・公官庁及び教育研究機関に提供しております。
世界各国の「市場・技術・法規制などの」実情を調査・収集される時には、データリソース社にご相談ください。
お客様の御要望にあったデータや情報を抽出する為のレポート紹介や調査のアドバイスも致します。
|
|

