歯科用消耗品市場レポート:2023-2033
Dental Consumables Market Report 2023-2033
レポート詳細
歯科用消耗品市場レポート 2023-2033 :本レポートは、新たな収益源の開拓を目指すリーディングカンパニーにとって、業界とその基礎となる力学をより深く理解する上で、非常に貴重なもの... もっと見る
※上記価格は部署ライセンス(Departmental licence)価格です。
その他の価格についてはデータリソースまでお問合せください。
日本語のページは自動翻訳を利用し作成しています。
実際のレポートは英文のみでご納品いたします。

|
サマリー
レポート詳細
歯科用消耗品市場レポート 2023-2033:本レポートは、新たな収益源の開拓を目指すリーディングカンパニーにとって、業界とその基礎となる力学をより深く理解する上で、非常に貴重なものとなるでしょう。また、異業種への進出や新地域での既存事業の拡大を目指す企業にとっても有益なレポートです。
歯科疾患の発生率の上昇が業界拡大に寄与する
歯科疾患の発生率の増加も、市場の成長を後押ししています。世界保健機関(WHO)によると、う蝕は世界で最も一般的な慢性疾患の一つで、学童の60〜90%近く、成人のほぼ100%が罹患しています。さらに、歯周病の有病率も、特に高齢化社会で増加しています。また、高齢化社会では、審美歯科治療を選択する傾向が強く、歯科用消耗品の需要をさらに高めています。その結果、歯科用コンポジット、歯科用シーラント、歯科用セメントなどの修復用および予防用歯科材料の需要を中心に、歯科用消耗品の需要が増加しています。歯のホワイトニング、ベニア、矯正歯科などの審美歯科治療は、特に先進国において、患者の間でますます人気が高まっています。この傾向は、歯科インプラント、歯冠・ブリッジ、歯列矯正製品などの審美歯科用消耗品の需要を牽引しています。
限られた診療報酬と消耗品の高コストが業界の成長を阻む
歯科用消耗品や手術器具が高額であるため、必要な歯科治療を受けることができない人が多くいます。中低所得国では、歯科治療は公的保険でカバーされないことが多く、高所得国でも歯科治療費の償還政策は限られている。例えば、米国では、子供の歯科治療はメディケイドでカバーされていますが、公的保険ではカバーされていないため、患者は高額な民間保険に加入して治療を受けることになります。歯科用インプラントなどの歯科用消耗品は、高額な費用と症例の多様性から、世界の人口の大部分には手が届きません。顎の大きさ、虫歯の程度、骨の強さなどの要因が、それぞれの歯科インプラント手術の独自性に寄与しています。これに、様々な種類の製品、高価なCAD/CAM機器、開業医の所在地、個人の料金などが加わることで、患者にとって予測不可能な費用が発生し、歯科治療への意欲を低下させています。COVIDの大流行は、政府の資源をさらに圧迫し、医療政策の焦点は大流行と感染症管理に移りました。発展途上国では、口腔疾患の治療費が高く、歯科医療制度が限られているため、成人の歯の健康状態が悪くなっています。口腔疾患は生活の質に大きな影響を与えるにもかかわらず、しばしば見過ごされ、歯科疾患の数が多く、高価で効果のない臨床介入につながる。
マーケットリサーチレポートを購入する前に、どのような質問をするべきか?
- 歯科用消耗品市場はどのように進化しているのか?
- 歯科用消耗品市場を牽引し、抑制しているものは何か?
- 歯科用消耗品の各サブマーケットセグメントは予測期間中にどのように成長し、2033年にこれらのサブマーケットが占める売上はどの程度になるのか?
- 2023年から2033年にかけて、各歯科用消耗品サブマーケットの市場シェアはどのように推移するのか?
- 2023年から2033年にかけて、市場全体の主な牽引役となるのは何か?
- 主要な歯科用消耗品市場はマクロ経済ダイナミクスに広く追随するのか、それとも個々の国内市場が他を凌駕するのか?
- 2033年までに各国市場のシェアはどのように変化し、2033年に市場をリードするのはどの地域か?
- 主要プレイヤーは誰で、予測期間中の見通しはどうなっているか?
- これらの主要企業の歯科用消耗品プロジェクトはどのようなものか?
- 2023年から2033年の間に、業界はどのように進化していくのでしょうか?現在および今後10年間に実施される歯科用消耗品プロジェクトにはどのような意味があるのか?
- 歯科用消耗品市場をさらに拡大するために、製品の商業化の必要性は高まっているのか?
- 歯科用消耗品市場はどこに向かっているのか、そして市場の最前線に立つためにはどうすればよいのか?
- 新製品やサービスラインへの最適な投資方法は何か?
- 企業を新たな成長軌道に乗せ、C-suiteに移行させるための重要な展望は何か?
このことが、現在、そして今後10年間の歯科用消耗品市場にどのような影響を与えるかを見極める必要があります:
- 303ページにわたる本レポートでは、142の表と157のチャート/グラフを独占的に提供します。
- 本レポートでは、業界における主要な収益性の高い分野を取り上げており、今すぐその分野をターゲットにすることができます。
- 世界、地域、国の売上と成長に関する詳細な分析が含まれています。
- 競合他社が成功した主要なトレンド、変化、収益予測をハイライトしています。
本レポートは、歯科用消耗品市場が今後10年間にどのように発展するか、またCOVID-19の景気後退やバウンスの変動に合わせて、今日あなたにお伝えします。この市場は、過去10年間のどの時点よりも今が重要である。
2033年までの予測やその他の分析により、商業的な展望を明らかにする。
- 今回の調査では、2033年までの収益予測に加え、直近の実績、成長率、市場シェアも掲載しています。
- ビジネスの展望や展開など、独自の分析がご覧いただけます。
- 定性的分析(市場力学、促進要因、機会、阻害要因、課題など)、コスト構造、歯科用消耗品価格上昇の影響、最近の動向などをご覧いただけます。
本レポートでは、COVID-19が業界や貴社にどのような影響を与えるかについて、データ分析および貴重な知見を提供しています。COVID-19の4つの回収パターン、すなわち「V」「L」「W」「U」の回収パターンとその影響について考察しています。
報告書の対象セグメント
製品
・ 歯科用インプラント
- チタン
- ジルコニウム
・ 歯科用補綴物
- クラウン
- ブリッジ
- 義歯
- アバットメント
- その他
・ 歯科用麻酔薬
- 注射用麻酔薬
- 局所麻酔薬
・ 歯科用縫合糸
- 吸収性
- 非吸収性
・ 歯内療法用
- シェーピング&クリーニング用品
- 閉塞材料
- アクセスプリパレーション用消耗品
・ その他消耗品
- デンタルスプリント
- デンタルシーラント
- ボンディング剤
- デンタルバー
- 歯科用ディスポーザブル
エンドユーザー
- 歯科病院
- 歯科診療所
- 歯科技工所
世界市場全体およびセグメントの収益予測に加え、5つの地域および21の主要国市場の収益予測も掲載しています:
北米
- アメリカ
- カナダ
欧州
- ドイツ
- 英国
- フランス
- スペイン
- イタリア
- その他の欧州
アジア太平洋地域
- 中国
- 日本
- インド
- オーストラリア
- 韓国
- その他のアジア太平洋地域
ラテンアメリカ
- ブラジル
- メキシコ
- その他のラテンアメリカ地域
MEA
- GCC
- 南アフリカ
- その他のMEA地域
歯科用消耗品市場の2023年から2033年にかけての主要企業のプロファイルと、これらの企業のこのセグメントに焦点を当てたいくつかの企業についても記載しています。
主要企業と市場成長の可能性
・ Coltene Holding AG
・ Dentsply Sirona
・ Envista
・ 3M
・ GC Orthodontics America
・ Henry Schein
・ Ivoclar Vivadent Aktiengesellschaft
・ Patterson Companies Inc
・ Planmeca OY
・ Straumann Holdings AG
・ ZimVie (Formerly Zimmer Biomet)
歯科用消耗品市場の世界全体の収益、2023年から2033年までの金額ベースで、市場は2023年に217億5900万米ドルを突破すると、当研究所が算出しました。2033年まで収益が大きく伸びることが予測されます。当社の調査では、最も大きな可能性を秘めた企業を特定しています。彼らの能力、進歩、商業的展望を発見することで、先手を打つことができます。
歯科用消耗品市場、2023年から2033年までのレポートはどのように役立つのでしょうか?
まとめると、300ページを超えるレポートでは、以下のような知識を得ることができます:
- 歯科用消耗品市場の2023年から2033年までの収益予測(製品別、エンドユーザー別、世界・地域レベルの各予測) - 業界の展望を発見し、投資や収益に最も有利な場所を見つけることができます。
- 5つの地域と21の主要国市場の2033年までの収益予測 - 北米、ヨーロッパ、アジア太平洋、ラテンアメリカ、MEAの歯科用消耗品市場、2023年から2033年の市場予測をご覧いただけます。また、米国、カナダ、メキシコ、ブラジル、ドイツ、フランス、英国、イタリア、中国、インド、日本、オーストラリアなど、著名な経済圏の市場も予測しています。
- 歯科用消耗品市場に関わる主要企業11社の企業プロファイルを含む、2023年から2033年までの市場参入を目指す企業や既存企業の展望。
独自の予測による定量・定性分析をご覧いただけます。私たちのレポートだけが持つ情報を入手し、貴重なビジネスインテリジェンスとして情報を得ることができます。
他にはない情報
私たちの新しいレポートがあれば、知識に遅れをとったり、チャンスを逃したりする可能性は低くなります。私たちの仕事があなたの調査、分析、意思決定にどのように役立つかをご覧ください。Visiongainの研究は、歯科用消耗品市場、2023年から2033年、市場をリードする企業のための商業分析を必要とするすべての人のためのものです。データ、トレンド、予測を見つけることができます。
ページTOPに戻る
目次
目次
1 レポートの概要
1.1 調査の目的
1.2 歯科用消耗品市場の紹介
1.3 本レポートが提供するもの
1.4 本レポートを読むべき理由
1.5 本分析レポートが回答する主な質問事項
1.6 本レポートは誰のためのものか?
1.7 方法論
1.7.1 市場の定義
1.7.2 市場評価・予測手法
1.7.3 データの検証
1.7.3.1 プライマリーリサーチ
1.7.3.2 セカンダリーリサーチ
1.8 よくある質問(FAQ)
1.9 関連するVisiongainのレポート
1.10 Visiongainについて
2 エグゼクティブサマリー
3 市場の概要
3.1 主要な調査結果
3.2 マーケットダイナミクス
3.2.1 市場促進要因
3.2.1.1 歯に関する問題の発生率の増加
3.2.1.2 歯科業界における技術的進歩
3.2.1.3 美容処置の需要増加
3.2.2 市場抑制要因
3.2.2.1 保険償還の制限
3.2.2.2 消耗品のコスト高
3.2.2.3 歯科医療に対する公衆衛生の焦点と政府支出のシフト
3.2.3 市場機会
3.2.3.1 医療ツーリズム分野の成長予測
3.2.3.2 CAD/CAM技術によるデジタル化の急成長
3.3 COVID-19影響度分析
3.4 ポーターのファイブフォース分析
3.4.1 サプライヤーのバーゲニングパワー
3.4.2 バイヤーのバーゲニングパワー
3.4.3 競争力のあるライバル
3.4.4 代替品からの脅威
3.4.5 新規参入の脅威
3.5 PEST分析
4 歯科用消耗品市場分析:製品別
4.1 主要な調査結果
4.2 製品セグメント別の 市場吸引力指数
4.3 歯科用消耗品製品別市場規模推定と予測
4.4 歯科用インプラント
4.4.1 歯科インプラント別の歯科消耗品市場規模推定と予測
4.4.2 2023年~2033年、地域別市場規模(US$ Million)
4.4.3 地域別市場シェア、2023年・2033年 (%)
4.4.4 チタン
4.4.4.1 地域別市場規模、2023年~2033年(US$ Million)
4.4.4.2 地域別市場シェア、2023年・2033年 (%)
4.4.5 ジルコニウム
4.4.5.1 2023年~2033年、地域別市場規模(US$ Million)
4.4.5.2 地域別市場シェア、2023年・2033年(%) (%)
4.5 歯科用補綴物
4.5.1 歯科用消耗品の歯科補綴物別市場規模推定と予測
4.5.2 2023年~2033年、地域別市場規模(US$ Million)
4.5.3 地域別市場シェア、2023年・2033年 (%)
4.5.4 クラウン
4.5.4.1 2023年~2033年、地域別市場規模(US$ Million)
4.5.4.2 地域別市場シェア、2023年・2033年(%) (%)
4.5.5 ブリッヂ
4.5.5.1 2023年~2033年、地域別市場規模(US$ Million)
4.5.5.2 地域別市場シェア、2023年・2033年(%) (%)
4.5.6 義歯
4.5.6.1 2023年~2033年、地域別市場規模(US$ Million)
4.5.6.2 地域別市場シェア、2023年・2033年(%) (%)
4.5.7 アバットメント
4.5.7.1 2023年~2033年、地域別市場規模(US$ Million)
4.5.7.2 地域別市場シェア、2023年・2033年 (%)
4.5.8 その他
4.5.8.1 2023年~2033年、地域別市場規模(US$ Million)
4.5.8.2 地域別市場シェア、2023年・2033年(%) (%)
4.6 歯科用麻酔剤
4.6.1 歯科用消耗品の歯科麻酔薬別市場規模推定と予測
4.6.2 2023年~2033年、地域別市場規模(US$ Million)
4.6.3 地域別市場シェア、2023年・2033年 (%)
4.6.4 注射用麻酔薬
4.6.4.1 2023年~2033年、地域別市場規模(US$ Million)
4.6.4.2 地域別市場シェア、2023年・2033年 (%)
4.6.5 局所麻酔薬
4.6.5.1 2023年~2033年、地域別市場規模(US$ Million)
4.6.5.2 地域別市場シェア、2023年・2033年 (%)
4.7 歯科用縫合糸
4.7.1 歯科用消耗品の歯科用縫合糸の市場規模推定 と予測
4.7.2 2023年~2033年、地域別市場規模(US$ Million)
4.7.3 地域別市場シェア、2023年・2033年 (%)
4.7.4 吸収性
4.7.4.1 2023年~2033年、地域別市場規模(US$ Million)
4.7.4.2 地域別市場シェア、2023年・2033年 (%)
4.7.5 非吸収性
4.7.5.1 2023年~2033年、地域別市場規模(US$ Million)
4.7.5.2 地域別市場シェア、2023年・2033年(%) (%)
4.8 歯内療法
4.8.1 歯科用消耗品の歯内療法分野別市場規模推定と予測
4.8.2 2023年~2033年、地域別市場規模(US$ Million)
4.8.3 地域別市場シェア、2023年・2033年 (%)
4.8.4 シェーピングおよびクリーニング用消耗品
4.8.4.1 2023年~2033年、地域別市場規模(US$ Million)
4.8.4.2 地域別市場シェア、2023年・2033年 (%)
4.8.5 硬化用消耗品
4.8.5.1 2023年~2033年、地域別市場規模(US$ Million)
4.8.5.2 地域別市場シェア、2023年・2033年(%) (%)
4.8.6 アクセスプレパレーション用消耗品
4.8.6.1 2023年~2033年、地域別市場規模(US$ Million)
4.8.6.2 地域別市場シェア、2023年・2033年(%) (%)
4.9 その他の消耗品
4.9.1 歯科用消耗品のその他の消耗品市場規模推定と予測
4.9.2 2023年~2033年、地域別市場規模(US$ Million)
4.9.3 地域別市場シェア、2023年・2033年 (%)
4.9.4 歯科用スプリント
4.9.4.1 2023年~2033年、地域別市場規模(US$ Million)
4.9.4.2 地域別市場シェア、2023年・2033年(%) (%)
4.9.5 デンタルシーラント
4.9.5.1 2023年~2033年、地域別市場規模(US$ Million)
4.9.5.2 地域別市場シェア、2023年・2033年(%) (%)
4.9.6 接着剤
4.9.6.1 2023年~2033年、地域別市場規模(US$ Million)
4.9.6.2 地域別市場シェア、2023年・2033年(%) (%)
4.9.7 歯科用バーズ
4.9.7.1 2023年~2033年、地域別市場規模(US$ Million)
4.9.7.2 地域別市場シェア、2023年・2033年(%) (%)
4.9.8 歯科用ディスポーザブル製品
4.9.8.1 2023年~2033年、地域別市場規模(US$ Million)
4.9.8.2 地域別市場シェア、2023年・2033年(%) (%)
5 歯科用消耗品のエンドユーザー別市場分析
5.1 主要な調査結果
5.2 エンドユーザーセグメント: 市場魅力度指数
5.2.1 歯科用消耗品のエンドユーザー別市場規模推定と予測
5.2.2 2023年~2033年、地域別市場規模(US$ Million)
5.2.3 地域別市場シェア、2023年・2033年 (%)
5.2.4 歯科用病院
5.2.4.1 2023年~2033年、地域別市場規模(US$ Million)
5.2.4.2 地域別市場シェア、2023年・2033年 (%)
5.2.5 デンタルクリニック
5.2.5.1 2023年~2033年、地域別市場規模(US$ Million)
5.2.5.2 地域別市場シェア、2023年・2033年 (%)
5.2.6 デンタルラボラトリー
5.2.6.1 2023年~2033年、地域別市場規模(US$ Million)
5.2.6.2 地域別市場シェア、2023年・2033年 (%)
6 歯科用消耗品市場分析:地域別
6.1 主要な調査結果
6.2 地域別市場規模の推計と予測
7 北米の歯科用消耗品市場分析
7.1 主要な調査結果
7.2 北米の歯科用消耗品市場魅力度指数
7.3 北米の歯科用消耗品国別市場、2023年、2028年、2033年(US$ Million)
7.4 北米の歯科用消耗品市場規模推定と予測:国別
7.5 北米の歯科用消耗品市場規模推定と予測:製品別
7.5.1 北米の歯科用消耗品市場規模推定と予測:歯科用インプラント別
7.5.2 北米の歯科用消耗品市場製品別推定と予測:歯科用補綴物
7.5.3 北米の歯科用消耗品市場規模推定と予測:歯科用麻酔薬別
7.5.4 北米の歯科用消耗品市場規模推定と予測:歯科用縫合糸別
7.5.5 北米の歯科用消耗品市場規模推定と予測:歯内療法別
7.5.6 北米の歯科用消耗品市場規模推定と予測:その他の消耗品
7.6 北米の歯科用消耗品市場規模推定と予測:エンドユーザー別
7.7 米国歯科用消耗品市場分析
7.8 カナダの歯科用消耗品市場の分析
8 欧州の歯科用消耗品市場分析
8.1 主要な調査結果
8.2 欧州の歯科用消耗品市場魅力度指数
8.3 欧州の歯科用消耗品国別市場、2023年、2028年、2033年(US$ Million)
8.4 欧州の歯科用消耗品市場規模推定と予測:国別
8.5 欧州の歯科用消耗品市場規模推定と予測:製品別
8.5.1 欧州の歯科用消耗品市場規模推定と予測:歯科用インプラント別
8.5.2 欧州の歯科用消耗品市場規模推定と予測:歯科補綴物別
8.5.3 欧州の歯科用消耗品市場規模推定と予測:歯科用麻酔薬別
8.5.4 欧州の歯科用消耗品市場規模推定と予測:歯科用縫合糸
8.5.5 欧州の歯科用消耗品市場規模推定と予測:歯内療法別
8.5.6 欧州の歯科用消耗品市場規模推定と予測:その他の消耗品
8.6 欧州の歯科用消耗品市場規模推定と予測:エンドユーザー別
8.7 ドイツの歯科用消耗品市場分析
8.8 フランス歯科用消耗品市場の分析
8.9 イギリス歯科用消耗品市場分析
8.10 イタリア歯科用消耗品市場の分析
8.11 スペイン歯科用消耗品市場分析
8.12 ロシア歯科用消耗品市場分析
8.13 その他の欧州の歯科用消耗品市場分析
9 アジア太平洋地域の歯科用消耗品の市場分析
9.1 主要な調査結果
9.2 アジア太平洋地域の歯科用消耗品市場魅力度指数
9.3 アジア太平洋地域の歯科用消耗品の国別市場、2023年、2028年、2033年(US$ Million)
9.4 アジア太平洋地域の歯科用消耗品市場規模推定と予測:国別
9.5 アジア太平洋地域の歯科用消耗品市場規模推定と予測:製品別
9.5.1 アジア太平洋地域の歯科用消耗品市場規模推定と予測:歯科用インプラント別
9.5.2 アジア太平洋地域の歯科用消耗品市場規模推定と予測:歯科補綴物別
9.5.3 アジア太平洋地域の歯科用消耗品市場規模推定と予測:歯科用麻酔薬別
9.5.4 アジア太平洋地域の歯科用消耗品市場規模推定と予測:歯科用縫合糸別
9.5.5 アジア太平洋地域の歯科用消耗品市場規模推定と予測:歯内療法別
9.5.6 アジア太平洋地域の歯科用消耗品市場規模推定と予測:その他の消耗品
9.6 アジア太平洋地域の歯科用消耗品市場推定と予測:エンドユーザー別
9.7 日本の歯科用消耗品市場分析
9.8 中国歯科用消耗品市場分析
9.9 インド歯科用消耗品市場分析
9.10 オーストラリア歯科用消耗品市場分析
9.11 韓国歯科用消耗品市場の分析
9.12 その他のアジア太平洋地域の歯科用消耗品市場の分析
10 ラテンアメリカの歯科用消耗品市場分析
10.1 主要な調査結果
10.2 ラテンアメリカの歯科用消耗品市場魅力度指数
10.3 ラテンアメリカの歯科用消耗品国別市場、2023年、2028年、2033年(US$ Million)
10.4 ラテンアメリカの歯科用消耗品市場規模推定と予測:国別
10.5 ラテンアメリカの歯科用消耗品市場市場規模推定と予測:製品別
10.5.1 ラテンアメリカの歯科用消耗品市場規模推定と予測:歯科用インプラント別
10.5.2 ラテンアメリカの歯科用消耗品市場規模推定と予測:歯科補綴物別
10.5.3 ラテンアメリカの歯科用消耗品市場規模推定と予測:歯科用麻酔薬別
10.5.4 ラテンアメリカの歯科用消耗品市場規模推定と予測:歯科用縫合糸別
10.5.5 ラテンアメリカの歯科用消耗品市場規模推定と予測:歯内治療器別
10.5.6 ラテンアメリカの歯科用消耗品市場規模推定と予測:その他の消耗品
10.6 ラテンアメリカの歯科用消耗品市場規模推定と予測:エンドユーザー別
10.7 ブラジルの歯科用消耗品市場分析
10.8 メキシコ歯科用消耗品市場分析
10.9 その他のラテンアメリカの歯科用消耗品市場分析
11 MEAの歯科用消耗品市場分析
11.1 主要な調査結果
11.2 MEAの歯科用消耗品市場魅力度指数
11.3 MEAの歯科用消耗品の国別市場、2023年、2028年、2033年(US$ Million)
11.4 MEAの歯科用消耗品市場規模推定と予測:国別
11.5 MEAの歯科用消耗品市場市場規模推定と予測:製品別
11.5.1 MEAの歯科用消耗品市場規模推定と予測:歯科用インプラント別
11.5.2 MEAの歯科用消耗品市場規模推定と予測:歯科補綴物別
11.5.3 MEAの歯科用消耗品市場規模推定と予測:歯科用麻酔薬別
11.5.4 MEAの歯科用消耗品市場規模推定と予測:歯科用縫合糸別
11.5.5 MEAの歯科用消耗品市場規模推定と予測:歯内療法別
11.5.6 MEAの歯科用消耗品市場規模推定と予測:その他の消耗品
11.6 MEAの歯科用消耗品市場規模推定と予測:エンドユーザー別
11.7 GCC歯科用消耗品市場分析
11.8 南アフリカの歯科用消耗品市場の分析
11.9 その他のMEAの地域の歯科用消耗品市場の分析
12 企業プロフィール
12.1 競合状況、2022年
12.2 コルテンホールディングAG
12.2.1 企業スナップショット
12.2.2 会社概要
12.2.3 財務分析
12.2.3.1 純収益、2017年~2022年
12.2.3.2 地域別市場占有率、2022年
12.2.4 製品ベンチマーキング
12.2.5 戦略的な展望
12.3 Dentsply Sirona
12.3.1 企業スナップショット
12.3.2 会社概要
12.3.3 財務分析
12.3.3.1 純収益、2017年~2022年
12.3.3.2 R&D、2017年~2022年
12.3.3.3 地域別市場シェア、2022年
12.3.4 製品ベンチマーキング
12.3.5 戦略的な展望
12.4 Envista
12.4.1 企業スナップショット
12.4.2 会社概要
12.4.3 財務分析
12.4.3.1 純収益、2017年〜2022年
12.4.3.2 R&D、2017年~2022年
12.4.3.3 地域別市場シェア、2022年
12.4.4 製品のベンチマーキング
12.4.5 戦略的な展望
12.5 3M
12.5.1 企業スナップショット
12.5.2 会社概要
12.5.3 財務分析
12.5.3.1 純収益、2017年〜2022年
12.5.3.2 R&D、2017年〜2022年
12.5.3.3 地域別市場シェア、2022年
12.5.4 製品ベンチマーキング
12.5.5 戦略的な展望
12.6 GC Orthodontics America
12.6.1 企業スナップショット
12.6.2 会社概要
12.6.3 製品ベンチマーキング
12.6.4 戦略的な展望
12.7 Henry Schein
12.7.1 企業スナップショット
12.7.2 会社概要
12.7.3 財務分析
12.7.3.1 純収益、2017年〜2022年
12.7.3.2 地域別市場占有率、2022年
12.7.4 製品ベンチマーキング
12.7.5 戦略的な展望
12.8 Ivoclar Vivadent AG
12.8.1 企業スナップショット
12.8.2 会社概要
12.8.3 ベンチマーキング製品
12.8.4 戦略的な展望
12.9 Patterson Companies
12.9.1 企業スナップショット
12.9.2 会社概要
12.9.3 財務分析
12.9.3.1 純収益、2017年〜2022年
12.9.3.2 地域別市場占有率、2022年
12.9.4 製品のベンチマーキング
12.9.5 戦略的な展望
12.10 Planmeca OY
12.10.1 企業スナップショット
12.10.2 会社概要
12.10.3 ベンチマーキング製品
12.10.4 戦略的な展望
12.11 Straumann Holdings AG
12.11.1 企業スナップショット
12.11.2 会社概要
12.11.3 財務分析
12.11.3.1 純収益、2017年〜2022年
12.11.3.2 R&D、2017年〜2022年
12.11.3.3 地域別市場シェア、2022年
12.11.4 製品のベンチマーキング
12.11.5 戦略的な展望
12.12 ZimVie (Formerly part of Zimmer Biomet)
12.12.1 企業スナップショット
12.12.2 会社概要
12.12.3 財務分析
12.12.3.1 純収益、2018年〜2022年
12.12.3.2 R&D、2019-2022年
12.12.4 製品のベンチマーキング
12.12.5 戦略的な展望
13 結論と提言
13.1 Visiongainからの結びの言葉
13.2 市場関係者への提言
ページTOPに戻る
図表リスト
表の一覧
Table 1 Dental Consumables Market Snapshot, 2023 & 2033 (US$ Million, CAGR %)
Table 2 Dental Consumables Market Forecast by Region, 2023-2033 (US$ Million, AGR%, CAGR%): “V” Shaped Recovery
Table 3 Dental Consumables Market Forecast by Region, 2023-2033 (US$ Million, AGR%, CAGR%): “U” Shaped Recovery
Table 4 Dental Consumables Market Forecast by Region, 2023-2033 (US$ Million, AGR%, CAGR%): “W” Shaped Recovery
Table 5 Dental Consumables Market Forecast by Region, 2023-2033 (US$ Million, AGR%, CAGR%): “L” Shaped Recovery
Table 6 Dental Consumables Market Forecast by Product, 2023-2033 (US$ Million, AGR%, CAGR%)
Table 7 Dental Consumables Market Forecast by Dental Implants, 2023-2033 (US$ Million, AGR%, CAGR%)
Table 8 Dental Implants Segment Market Forecast by Region, 2023-2033 (US$ Million, AGR%, CAGR%)
Table 9 Titanium Segment Market Forecast by Region, 2023-2033 (US$ Million, AGR%, CAGR%)
Table 10 Zirconium Segment Market Forecast by Region, 2023-2033 (US$ Million, AGR%, CAGR%)
Table 11 Dental Consumables Market Forecast by Dental Prosthetics, 2023-2033 (US$ Million, AGR%, CAGR%)
Table 12 Dental Prosthetics Segment Market Forecast by Region, 2023-2033 (US$ Million, AGR%, CAGR%)
Table 13 Crowns Segment Market Forecast by Region, 2023-2033 (US$ Million, AGR%, CAGR%)
Table 14 Bridges Segment Market Forecast by Region, 2023-2033 (US$ Million, AGR%, CAGR%)
Table 15 Dentures Segment Market Forecast by Region, 2023-2033 (US$ Million, AGR%, CAGR%)
Table 16 Abutments Segment Market Forecast by Region, 2023-2033 (US$ Million, AGR%, CAGR%)
Table 17 Others Segment Market Forecast by Region, 2023-2033 (US$ Million, AGR%, CAGR%)
Table 18 Dental Consumables Market Forecast by Dental Anesthetics, 2023-2033 (US$ Million, AGR%, CAGR%)
Table 19 Dental Anesthetics Segment Market Forecast by Region, 2023-2033 (US$ Million, AGR%, CAGR%)
Table 20 Injectable Anesthetics Segment Market Forecast by Region, 2023-2033 (US$ Million, AGR%, CAGR%)
Table 21 Topical Anesthetics Segment Market Forecast by Region, 2023-2033 (US$ Million, AGR%, CAGR%)
Table 22 Dental Sutures Market Forecast by Dental Implants, 2023-2033 (US$ Million, AGR%, CAGR%)
Table 23 Dental Sutures Segment Market Forecast by Region, 2023-2033 (US$ Million, AGR%, CAGR%)
Table 24 Absorbable Segment Market Forecast by Region, 2023-2033 (US$ Million, AGR%, CAGR%)
Table 25 Non-absorbable Segment Market Forecast by Region, 2023-2033 (US$ Million, AGR%, CAGR%)
Table 26 Dental Consumables Market Forecast by Endodontics, 2023-2033 (US$ Million, AGR%, CAGR%)
Table 27 Endodontics Market Forecast by Region, 2023-2033 (US$ Million, AGR%, CAGR%)
Table 28 Shaping and cleaning consumables Market Forecast by Region, 2023-2033 (US$ Million, AGR%, CAGR%)
Table 29 Obturation consumables Market Forecast by Region, 2023-2033 (US$ Million, AGR%, CAGR%)
Table 30 Access preparation consumables Market Forecast by Region, 2023-2033 (US$ Million, AGR%, CAGR%)
Table 31 Dental Consumables Market Forecast by Other Consumables, 2023-2033 (US$ Million, AGR%, CAGR%)
Table 32 Other Consumables Market Forecast by Region, 2023-2033 (US$ Million, AGR%, CAGR%)
Table 33 Dental Splints Market Forecast by Region, 2023-2033 (US$ Million, AGR%, CAGR%)
Table 34 Dental Sealants Market Forecast by Region, 2023-2033 (US$ Million, AGR%, CAGR%)
Table 35 Bonding Agents Market Forecast by Region, 2023-2033 (US$ Million, AGR%, CAGR%)
Table 36 Dental burs Market Forecast by Region, 2023-2033 (US$ Million, AGR%, CAGR%)
Table 37 Dental Disposables Market Forecast by Region, 2023-2033 (US$ Million, AGR%, CAGR%)
Table 38 Dental Consumables Market Forecast by End-users, 2023-2033 (US$ Million, AGR%, CAGR%)
Table 39 End-users Market Forecast by Region, 2023-2033 (US$ Million, AGR%, CAGR%)
Table 40 Dental hospitals Market Forecast by Region, 2023-2033 (US$ Million, AGR%, CAGR%)
Table 41 Dental Clinics Market Forecast by Region, 2023-2033 (US$ Million, AGR%, CAGR%)
Table 42 Dental Laboratories Market Forecast by Region, 2023-2033 (US$ Million, AGR%, CAGR%)
Table 43 Dental Consumables Market Forecast by Region, 2023-2033 (US$ Million, AGR%, CAGR%)
Table 44 North America Dental Consumables Market Forecast by Country, 2023-2033 (US$ Million, AGR%, CAGR%)
Table 45 North America Dental Consumables Market Forecast by Product, 2023-2033 (US$ Million, AGR%, CAGR%)
Table 46 North America Dental Consumables Market Forecast by Dental Implants, 2023-2033 (US$ Million, AGR%, CAGR%)
Table 47 North America Dental Consumables Market Forecast by Dental Prosthetics, 2023-2033 (US$ Million, AGR%, CAGR%)
Table 48 North America Dental Consumables Market Forecast by Dental Anesthetics, 2023-2033 (US$ Million, AGR%, CAGR%)
Table 49 North America Dental Consumables Market Forecast by Dental Sutures, 2023-2033 (US$ Million, AGR%, CAGR%)
Table 50 North America Dental Consumables Market Forecast by Endodontics, 2023-2033 (US$ Million, AGR%, CAGR%)
Table 51 North America Dental Consumables Market Forecast by Other Consumables, 2023-2033 (US$ Million, AGR%, CAGR%)
Table 52 North America Dental Consumables Market Forecast by End-users, 2023-2033 (US$ Million, AGR%, CAGR%)
Table 53 U.S. Dental Consumables Market Forecast, 2023-2033 (US$ Million, AGR%, CAGR%)
Table 54 Canada Dental Consumables Market Forecast, 2023-2033 (US$ Million, AGR%, CAGR%)
Table 55 Europe Dental Consumables Market Forecast by Country, 2023-2033 (US$ Million, AGR%, CAGR%)
Table 56 Europe Dental Consumables Market Forecast by Product, 2023-2033 (US$ Million, AGR%, CAGR%)
Table 57 Europe Dental Consumables Market Forecast by Dental Implants, 2023-2033 (US$ Million, AGR%, CAGR%)
Table 58 Europe Dental Consumables Market Forecast by Dental Prosthetics, 2023-2033 (US$ Million, AGR%, CAGR%)
Table 59 Europe Dental Consumables Market Forecast by Dental Anesthetics, 2023-2033 (US$ Million, AGR%, CAGR%)
Table 60 Europe Dental Consumables Market Forecast by Dental Sutures, 2023-2033 (US$ Million, AGR%, CAGR%)
Table 61 Europe Dental Consumables Market Forecast by Endodontics, 2023-2033 (US$ Million, AGR%, CAGR%)
Table 62 Europe Dental Consumables Market Forecast by Other Consumables, 2023-2033 (US$ Million, AGR%, CAGR%)
Table 63 Europe Dental Consumables Market Forecast by End-users, 2023-2033 (US$ Million, AGR%, CAGR%)
Table 64 Germany Dental Consumables Market Forecast, 2023-2033 (US$ Million, AGR%, CAGR%)
Table 65 France Dental Consumables Market Forecast, 2023-2033 (US$ Million, AGR%, CAGR%)
Table 66 UK Dental Consumables Market Forecast, 2023-2033 (US$ Million, AGR%, CAGR%)
Table 67 Italy Dental Consumables Market Forecast, 2023-2033 (US$ Million, AGR%, CAGR%)
Table 68 Spain Dental Consumables Market Forecast, 2023-2033 (US$ Million, AGR%, CAGR%)
Table 69 Russia Dental Consumables Market Forecast, 2023-2033 (US$ Million, AGR%, CAGR%)
Table 70 Rest of Europe Dental Consumables Market Forecast, 2023-2033 (US$ Million, AGR%, CAGR%)
Table 71 Asia Pacific Dental Consumables Market Forecast by Country, 2023-2033 (US$ Million, AGR%, CAGR%)
Table 72 Asia Pacific Dental Consumables Market Forecast by Product, 2023-2033 (US$ Million, AGR%, CAGR%)
Table 73 Asia Pacific Dental Consumables Market Forecast by Dental Implants, 2023-2033 (US$ Million, AGR%, CAGR%)
Table 74 Asia Pacific Dental Consumables Market Forecast by Dental Prosthetics, 2023-2033 (US$ Million, AGR%, CAGR%)
Table 75 Asia Pacific Dental Consumables Market Forecast by Dental Anesthetics, 2023-2033 (US$ Million, AGR%, CAGR%)
Table 76 Asia Pacific Dental Consumables Market Forecast by Dental Sutures, 2023-2033 (US$ Million, AGR%, CAGR%)
Table 77 Asia Pacific Dental Consumables Market Forecast by Endodontics, 2023-2033 (US$ Million, AGR%, CAGR%)
Table 78 Asia Pacific Dental Consumables Market Forecast by Other Consumables, 2023-2033 (US$ Million, AGR%, CAGR%)
Table 79 Asia Pacific Dental Consumables Market Forecast by End-users, 2023-2033 (US$ Million, AGR%, CAGR%)
Table 80 Japan Dental Consumables Market Forecast, 2023-2033 (US$ Million, AGR%, CAGR%)
Table 81 China Dental Consumables Market Forecast, 2023-2033 (US$ Million, AGR%, CAGR%)
Table 82 India Dental Consumables Market Forecast, 2023-2033 (US$ Million, AGR%, CAGR%)
Table 83 Australia Dental Consumables Market Forecast, 2023-2033 (US$ Million, AGR%, CAGR%)
Table 84 South Korea Dental Consumables Market Forecast, 2023-2033 (US$ Million, AGR%, CAGR%)
Table 85 Rest of Asia Pacific Dental Consumables Market Forecast, 2023-2033 (US$ Million, AGR%, CAGR%)
Table 86 Latin America Dental Consumables Market Forecast by Country, 2023-2033 (US$ Million, AGR%, CAGR%)
Table 87 Latin America Dental Consumables Market Forecast by Dental Prosthetics, 2023-2033 (US$ Million, AGR%, CAGR%)
Table 88 Latin America Dental Consumables Market Forecast by Dental Implants, 2023-2033 (US$ Million, AGR%, CAGR%)
Table 89 Latin America Dental Consumables Market Forecast by Dental Prosthetics, 2023-2033 (US$ Million, AGR%, CAGR%)
Table 90 Latin America Dental Consumables Market Forecast by Dental Anesthetics, 2023-2033 (US$ Million, AGR%, CAGR%)
Table 91 Latin America Dental Consumables Market Forecast by Dental Sutures, 2023-2033 (US$ Million, AGR%, CAGR%)
Table 92 Latin America Dental Consumables Market Forecast by Endodontics, 2023-2033 (US$ Million, AGR%, CAGR%)
Table 93 Latin America Dental Consumables Market Forecast by Other Consumables, 2023-2033 (US$ Million, AGR%, CAGR%)
Table 94 Latin America Dental Consumables Market Forecast by End-users, 2023-2033 (US$ Million, AGR%, CAGR%)
Table 95 Brazil Dental Consumables Market Forecast, 2023-2033 (US$ Million, AGR%, CAGR%)
Table 96 Mexico Dental Consumables Market Forecast, 2023-2033 (US$ Million, AGR%, CAGR%)
Table 97 Rest of Latin America Dental Consumables Market Forecast, 2023-2033 (US$ Million, AGR%, CAGR%)
Table 98 MEA Dental Consumables Market Forecast by Country, 2023-2033 (US$ Million, AGR%, CAGR%)
Table 99 MEA Dental Consumables Market Forecast by Product, 2023-2033 (US$ Million, AGR%, CAGR%)
Table 100 MEA Dental Consumables Market Forecast by Dental Implants, 2023-2033 (US$ Million, AGR%, CAGR%)
Table 101 MEA Dental Consumables Market Forecast by Dental Prosthetics, 2023-2033 (US$ Million, AGR%, CAGR%)
Table 102 MEA Dental Consumables Market Forecast by Dental Anesthetics, 2023-2033 (US$ Million, AGR%, CAGR%)
Table 103 MEA Dental Consumables Market Forecast by Dental Sutures, 2023-2033 (US$ Million, AGR%, CAGR%)
Table 104 MEA Dental Consumables Market Forecast by Endodontics, 2023-2033 (US$ Million, AGR%, CAGR%)
Table 105 MEA Dental Consumables Market Forecast by Other Consumables, 2023-2033 (US$ Million, AGR%, CAGR%)
Table 106 MEA Dental Consumables Market Forecast by End-users, 2023-2033 (US$ Million, AGR%, CAGR%)
Table 107 GCC Dental Consumables Market Forecast, 2023-2033 (US$ Million, AGR%, CAGR%)
Table 108 South Africa Dental Consumables Market Forecast, 2023-2033 (US$ Million, AGR%, CAGR%)
Table 109 Rest of MEA Dental Consumables Market Forecast, 2023-2033 (US$ Million, AGR%, CAGR%)
Table 110 Coltene Holding AG: Key Details, (CEO, HQ, Revenue, Founded, No. of Employees, Company Type, Website, Business Segment)
Table 111 Coltene Holding AG: Product Benchmarking
Table 112 Coltene Holding AG: Strategic Outlook
Table 113 Dentsply Sirona: Key Details, (CEO, HQ, Revenue, Founded, No. of Employees, Company Type, Website, Business Segment)
Table 114 Dentsply Sirona: Product Benchmarking
Table 115 Dentsply Sirona: Strategic Outlook
Table 116 Envista: Key Details, (CEO, HQ, Revenue, Founded, No. of Employees, Company Type, Website, Business Segment)
Table 117 Envista: Product Benchmarking
Table 118 Envista: Strategic Outlook
Table 119 3M: Key Details, (CEO, HQ, Revenue, Founded, No. of Employees, Company Type, Website, Business Segment)
Table 120 3M: Product Benchmarking
Table 121 3M: Strategic Outlook
Table 122 GC Orthodontics America: Key Details, (CEO, HQ, Revenue, Founded, No. of Employees, Company Type, Website, Business Segment)
Table 123 GC Orthodontics America: Product Benchmarking
Table 124 GC Orthodontics America: Strategic Outlook
Table 125 11.3 Henry Schein: Key Details, (CEO, HQ, Revenue, Founded, No. of Employees, Company Type, Website, Business Segment)
Table 126 Henry Schein: Product Benchmarking
Table 127 Henry Schein: Strategic Outlook
Table 128 Ivoclar Vivadent AG: Key Details, (CEO, HQ, Revenue, Founded, No. of Employees, Company Type, Website, Business Segment)
Table 129 Ivoclar Vivadent AG: Product Benchmarking
Table 130 Ivoclar Vivadent AG: Strategic Outlook
Table 131 Patterson Companies: Key Details, (CEO, HQ, Revenue, Founded, No. of Employees, Company Type, Website, Business Segment)
Table 132 Patterson Companies: Product Benchmarking
Table 133 Patterson Companies: Strategic Outlook
Table 134 Planmeca OY: Key Details, (CEO, HQ, Revenue, Founded, No. of Employees, Company Type, Website, Business Segment)
Table 135 Planmeca OY: Product Benchmarking
Table 136 Planmeca OY: Strategic Outlook
Table 137 Straumann Holdings AG: Key Details, (CEO, HQ, Revenue, Founded, No. of Employees, Company Type, Website, Business Segment)
Table 138 Straumann Holdings AG: Product Benchmarking
Table 139 Straumann Holdings AG: Strategic Outlook
Table 140 ZimVie: Key Details, (CEO, HQ, Revenue, Founded, No. of Employees, Company Type, Website, Business Segment)
Table 141 ZimVie: Product Benchmarking
Table 142 ZimVie: Strategic Outlook
図の一覧
Figure 1 Dental Consumables Market Segmentation
Figure 2 Dental Consumables Market by Product: Market Attractiveness Index
Figure 3 Dental Consumables Market by End user: Market Attractiveness Index
Figure 4 Dental Consumables Market Attractiveness Index by Region
Figure 5 Dental Consumables Market: Market Dynamics
Figure 6 Dental Consumables Market by Region, 2023-2033 (US$ Million, AGR %): “V” Shaped Recovery
Figure 7 Dental Consumables Market by Region, 2023-2033 (US$ Million, AGR %): “U” Shaped Recovery
Figure 8 Dental Consumables Market by Region, 2023-2033 (US$ Million, AGR %): “W” Shaped Recovery
Figure 9 Dental Consumables Market by Region, 2023-2033 (US$ Million, AGR %): “L” Shaped Recovery
Figure 10 Dental Consumables Market: Porter’s Five Forces Analysis
Figure 11 Dental Consumables Market: PEST Analysis
Figure 12 Dental Consumables Market by Product: Market Attractiveness Index
Figure 13 Dental Consumables Market Forecast by Product, 2023-2033 (US$ Million, AGR %)
Figure 14 Dental Consumables Market Share Forecast by Product, 2023, 2028, 2033 (%)
Figure 15 Dental Implants Segment Market Forecast by Region, 2023-2033 (US$ Million, AGR %)
Figure 16 Dental Implants Segment Market Share Forecast by Region, 2023 & 2033 (%)
Figure 17 Titanium Segment Market Forecast by Region, 2023-2033 (US$ Million, AGR %)
Figure 18 Titanium Segment Market Share Forecast by Region, 2023 & 2033 (%)
Figure 19 Zirconium Segment Market Forecast by Region, 2023-2033 (US$ Million, AGR %)
Figure 20 Zirconium Segment Market Share Forecast by Region, 2023 & 2033 (%)
Figure 21 Dental Prosthetics Segment Market Forecast by Region, 2023-2033 (US$ Million, AGR %)
Figure 22 Dental Prosthetics Segment Market Share Forecast by Region, 2023 & 2033 (%)
Figure 23 Crowns Segment Market Forecast by Region, 2023-2033 (US$ Million, AGR %)
Figure 24 Crowns Segment Market Share Forecast by Region, 2023 & 2033 (%)
Figure 25 Bridges Segment Market Forecast by Region, 2023-2033 (US$ Million, AGR %)
Figure 26 Bridges Segment Market Share Forecast by Region, 2023 & 2033 (%)
Figure 27 Dentures Segment Market Forecast by Region, 2023-2033 (US$ Million, AGR %)
Figure 28 Dentures Segment Market Share Forecast by Region, 2023 & 2033 (%)
Figure 29 Abutments Segment Market Forecast by Region, 2023-2033 (US$ Million, AGR %)
Figure 30 Abutments Segment Market Share Forecast by Region, 2023 & 2033 (%)
Figure 31 Others Segment Market Forecast by Region, 2023-2033 (US$ Million, AGR %)
Figure 32 Others Segment Market Share Forecast by Region, 2023 & 2033 (%)
Figure 33 Dental Anesthetics Segment Market Forecast by Region, 2023-2033 (US$ Million, AGR %)
Figure 34 Dental Anesthetics Segment Market Share Forecast by Region, 2023 & 2033 (%)
Figure 35 Injectable Anesthetics Segment Market Forecast by Region, 2023-2033 (US$ Million, AGR %)
Figure 36 Injectable Anesthetics Segment Market Share Forecast by Region, 2023 & 2033 (%)
Figure 37 Topical Anesthetics Segment Market Forecast by Region, 2023-2033 (US$ Million, AGR %)
Figure 38 Topical Anesthetics Segment Market Share Forecast by Region, 2023 & 2033 (%)
Figure 39 Dental Sutures Segment Market Forecast by Region, 2023-2033 (US$ Million, AGR %)
Figure 40 Dental Sutures Segment Market Share Forecast by Region, 2023 & 2033 (%)
Figure 41 Absorbable Segment Market Forecast by Region, 2023-2033 (US$ Million, AGR %)
Figure 42 Absorbable Segment Market Share Forecast by Region, 2023 & 2033 (%)
Figure 43 Non-absorbable Segment Market Forecast by Region, 2023-2033 (US$ Million, AGR %)
Figure 44 Non-absorbable Segment Market Share Forecast by Region, 2023 & 2033 (%)
Figure 45 Endodontics Market Forecast by Region, 2023-2033 (US$ Million, AGR %)
Figure 46 Endodontics Market Share Forecast by Region, 2023 & 2033 (%)
Figure 47 Shaping and cleaning consumables Market Forecast by Region, 2023-2033 (US$ Million, AGR %)
Figure 48 Shaping and cleaning consumables Market Share Forecast by Region, 2023 & 2033 (%)
Figure 49 Obturation consumables Market Forecast by Region, 2023-2033 (US$ Million, AGR %)
Figure 50 Obturation consumables Market Share Forecast by Region, 2023 & 2033 (%)
Figure 51 Access preparation consumables Segment Market Forecast by Region, 2023-2033 (US$ Million, AGR %)
Figure 52 Access preparation consumables Segment Market Share Forecast by Region, 2023 & 2033 (%)
Figure 53 Other Consumables Market Forecast by Region, 2023-2033 (US$ Million, AGR %)
Figure 54 Other Consumables Market Share Forecast by Region, 2023 & 2033 (%)
Figure 55 Dental Splints Market Forecast by Region, 2023-2033 (US$ Million, AGR %)
Figure 56 Dental Splints Market Share Forecast by Region, 2023 & 2033 (%)
Figure 57 Dental Sealants Market Forecast by Region, 2023-2033 (US$ Million, AGR %)
Figure 58 Dental Sealants Market Share Forecast by Region, 2023 & 2033 (%)
Figure 59 Bonding Agents Market Forecast by Region, 2023-2033 (US$ Million, AGR %)
Figure 60 Bonding Agents Market Share Forecast by Region, 2023 & 2033 (%)
Figure 61 Dental burs Market Forecast by Region, 2023-2033 (US$ Million, AGR %)
Figure 62 Dental burs Market Share Forecast by Region, 2023 & 2033 (%)
Figure 63 Dental Disposables Market Forecast by Region, 2023-2033 (US$ Million, AGR %)
Figure 64 Dental Disposables Market Share Forecast by Region, 2023 & 2033 (%)
Figure 65 Dental Consumables Market by End-users: Market Attractiveness Index
Figure 66 End-users Dental Consumables Market Forecast by Region, 2023-2033 (US$ Million, AGR %)
Figure 67 End-users Market Share Forecast by Region, 2023 & 2033 (%)
Figure 68 Dental hospitals Market Forecast by Region, 2023-2033 (US$ Million, AGR %)
Figure 69 Dental hospitals Market Share Forecast by Region, 2023 & 2033 (%)
Figure 70 Dental Clinics Market Forecast by Region, 2023-2033 (US$ Million, AGR %)
Figure 71 Dental Clinics Market Share Forecast by Region, 2023 & 2033 (%)
Figure 72 Dental Laboratories Market Forecast by Region, 2023-2033 (US$ Million, AGR %)
Figure 73 Dental Laboratories Market Share Forecast by Region, 2023 & 2033 (%)
Figure 74 Dental Consumables Market Forecast by Region 2023 and 2033 (Revenue, CAGR%)
Figure 75 Dental Consumables Market Share Forecast by Region 2023, 2028, 2033 (%)
Figure 76 Dental Consumables Market by Region, 2023-2033 (US$ Million, AGR %)
Figure 77 North America Dental Consumables Market Attractiveness Index
Figure 78 North America Dental Consumables Market by Region, 2023, 2028 & 2033 (US$ Million)
Figure 79 North America Dental Consumables Market Forecast by Country, 2023-2033 (US$ Million, AGR %)
Figure 80 North America Dental Consumables Market Share Forecast by Country, 2023 & 2033 (%)
Figure 81 North America Dental Consumables Market Forecast by Product, 2023-2033 (US$ Million, AGR %)
Figure 82 North America Dental Consumables Market Share Forecast by Product, 2023 & 2033 (%)
Figure 83 North America Dental Consumables Market Forecast by End-users, 2023-2033 (US$ Million, AGR %)
Figure 84 North America Dental Consumables Market Share Forecast by End-users, 2023 & 2033 (%)
Figure 85 U.S. Dental Consumables Market Forecast, 2023-2033 (US$ Million, AGR %)
Figure 86 Canada Dental Consumables Market Forecast, 2023-2033 (US$ Million, AGR %)
Figure 87 Europe Dental Consumables Market Attractiveness Index
Figure 88 Europe Dental Consumables Market by Region, 2023, 2028 & 2033 (US$ Million)
Figure 89 Europe Dental Consumables Market Forecast by Country, 2023-2033 (US$ Million, AGR %)
Figure 90 Europe Dental Consumables Market Share Forecast by Country, 2023 & 2033 (%)
Figure 91 Europe Dental Consumables Market Forecast by Product, 2023-2033 (US$ Million, AGR %)
Figure 92 Europe Dental Consumables Market Share Forecast by Product, 2023 & 2033 (%)
Figure 93 Europe Dental Consumables Market Forecast by End-users, 2023-2033 (US$ Million, AGR %)
Figure 94 Europe Dental Consumables Market Share Forecast by End-users, 2023 & 2033 (%)
Figure 95 Germany Dental Consumables Market Forecast, 2023-2033 (US$ Million, AGR %)
Figure 96 France Dental Consumables Market Forecast, 2023-2033 (US$ Million, AGR %)
Figure 97 UK Dental Consumables Market Forecast, 2023-2033 (US$ Million, AGR %)
Figure 98 Italy Dental Consumables Market Forecast, 2023-2033 (US$ Million, AGR %)
Figure 99 Spain Dental Consumables Market Forecast, 2023-2033 (US$ Million, AGR %)
Figure 100 Russia Dental Consumables Market Forecast, 2023-2033 (US$ Million, AGR %)
Figure 101 Rest of Europe Dental Consumables Market Forecast, 2023-2033 (US$ Million, AGR %)
Figure 102 Asia Pacific Dental Consumables Market Attractiveness Index
Figure 103 Asia Pacific Dental Consumables Market by Region, 2023, 2028 & 2033 (US$ Million)
Figure 104 Asia Pacific Dental Consumables Market Forecast by Country, 2023-2033 (US$ Million, AGR %)
Figure 105 Asia Pacific Dental Consumables Market Share Forecast by Country, 2023 & 2033 (%)
Figure 106 Asia Pacific Dental Consumables Market Forecast by Product, 2023-2033 (US$ Million, AGR %)
Figure 107 Asia Pacific Dental Consumables Market Share Forecast by Product, 2023 & 2033 (%)
Figure 108 Asia Pacific Dental Consumables Market Forecast by End-users, 2023-2033 (US$ Million, AGR %)
Figure 109 Asia Pacific Dental Consumables Market Share Forecast by End-users, 2023 & 2033 (%)
Figure 110 Japan Dental Consumables Market Forecast, 2023-2033 (US$ Million, AGR %)
Figure 111 China Dental Consumables Market Forecast, 2023-2033 (US$ Million, AGR %)
Figure 112 India Dental Consumables Market Forecast, 2023-2033 (US$ Million, AGR %)
Figure 113 Australia Dental Consumables Market Forecast, 2023-2033 (US$ Million, AGR %)
Figure 114 South Korea Dental Consumables Market Forecast, 2023-2033 (US$ Million, AGR %)
Figure 115 Rest of Asia Pacific Dental Consumables Market Forecast, 2023-2033 (US$ Million, AGR %)
Figure 116 Latin America Dental Consumables Market Attractiveness Index
Figure 117 Latin America Dental Consumables Market by Region, 2023, 2028 & 2033 (US$ Million)
Figure 118 Latin America Dental Consumables Market Forecast by Country, 2023-2033 (US$ Million, AGR %)
Figure 119 Latin America Dental Consumables Market Share Forecast by Country, 2023 & 2033 (%)
Figure 120 Latin America Dental Consumables Market Forecast by Product, 2023-2033 (US$ Million, AGR %)
Figure 121 Latin America Dental Consumables Market Share Forecast by Product, 2023 & 2033 (%)
Figure 122 Latin America Dental Consumables Market Forecast by End-users, 2023-2033 (US$ Million, AGR %)
Figure 123 Latin America Dental Consumables Market Share Forecast by End-users, 2023 & 2033 (%)
Figure 124 Brazil Dental Consumables Market Forecast, 2023-2033 (US$ Million, AGR %)
Figure 125 Mexico Dental Consumables Market Forecast, 2023-2033 (US$ Million, AGR %)
Figure 126 Rest of Latin America Dental Consumables Market Forecast, 2023-2033 (US$ Million, AGR %)
Figure 127 MEA Dental Consumables Market Attractiveness Index
Figure 128 MEA Dental Consumables Market by Region, 2023, 2028 & 2033 (US$ Million)
Figure 129 MEA Dental Consumables Market Forecast by Country, 2023-2033 (US$ Million, AGR %)
Figure 130 MEA Dental Consumables Market Share Forecast by Country, 2023 & 2033 (%)
Figure 131 MEA Dental Consumables Market Forecast by Product, 2023-2033 (US$ Million, AGR %)
Figure 132 MEA Dental Consumables Market Share Forecast by Product, 2023 & 2033 (%)
Figure 133 MEA Dental Consumables Market Forecast by End-users, 2023-2033 (US$ Million, AGR %)
Figure 134 MEA Dental Consumables Market Share Forecast by End-users, 2023 & 2033 (%)
Figure 135 GCC Dental Consumables Market Forecast, 2023-2033 (US$ Million, AGR %)
Figure 136 South Africa Dental Consumables Market Forecast, 2023-2033 (US$ Million, AGR %)
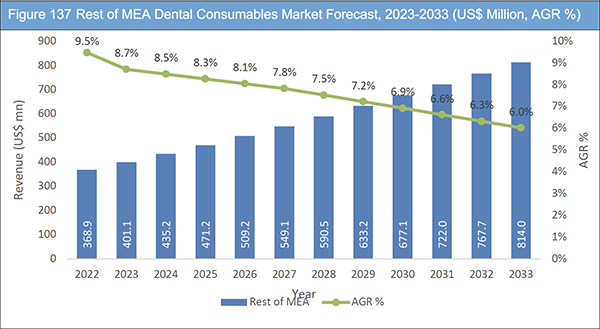
Figure 137 Rest of MEA Dental Consumables Market Forecast, 2023-2033 (US$ Million, AGR %)
Figure 138 Coltene Holding AG: Net Revenue, 2017-2022 (US$ Million, AGR%)
Figure 139 Coltene Holding AG: Regional Market Shares, 2022
Source: Visiongain, 2023
Figure 140 Dentsply Sirona: Net Revenue, 2017-2022 (US$ Million, AGR%)
Figure 141 Dentsply Sirona: R&D, 2017-2022 (US$ Million, AGR%)
Figure 142 Dentsply Sirona: Regional Market Shares, 2022
Figure 143 Envista: Net Revenue, 2017-2022 (US$ Million, AGR%)
Figure 144 Envista: R&D, 2017-2022 (US$ Million, AGR%)
Figure 145 Envista: Regional Market Shares, 2022
Figure 146 3M: Net Revenue, 2017-2022 (US$ Million, AGR%)
Figure 147 3M: R&D, 2017-2022 (US$ Million, AGR%)
Figure 148 3M: Regional Market Shares, 2022
Figure 149 Henry Schein: Net Revenue, 2017-2022 (US$ Million, AGR%)
Figure 150 Henry Schein: Regional Market Shares, 2022
Figure 151 Patterson Companies: Net Revenue, 2017-2022 (US$ Million, AGR%)
Figure 152 Patterson Companies: Regional Market Shares, 2022
Figure 153 Straumann Holdings AG: Net Revenue, 2017-2022 (US$ Million, AGR%)
Figure 154 Straumann Holdings AG: R&D, 2017-2022 (US$ Million, AGR%)
Figure 155 Straumann Holdings AG: Regional Market Shares, 2022
Figure 156 ZimVie: Net Revenue, 2018-2022 (US$ Million, AGR%)
Figure 157 ZimVie: R&D, 2019-2022 (US$ Million, AGR%)
ページTOPに戻る
Summary
Report Details
The Dental Consumables Market Report 2023-2033: This report will prove invaluable to leading firms striving for new revenue pockets if they wish to better understand the industry and its underlying dynamics. It will be useful for companies that would like to expand into different industries or to expand their existing operations in a new region.
Rising Incidence of Dental Problems to Spur Industry Expansion
The increasing prevalence of dental disorders is also fuelling the market growth. According to the World Health Organization, dental caries is one of the most common chronic diseases worldwide, affecting nearly 60-90% of school children and almost 100% of adults. Furthermore, the prevalence of periodontal diseases is also increasing, particularly in the aging population. The aging population is also more likely to opt for cosmetic dentistry procedures, further fuelling the demand for dental consumables. As a result, the demand for dental consumables is increasing, particularly for restorative and preventive dental materials such as dental composites, dental sealants, and dental cement. Cosmetic dentistry procedures such as teeth whitening, veneers, and orthodontics are becoming increasingly popular among patients, particularly in developed countries. This trend drives the demand for cosmetic dental consumables such as dental implants, dental crowns and bridges, and orthodontic products.
Limited Reimbursements and High Costs of Consumables Projected to Challenge Industry Growth
Many individuals struggle to afford necessary dental treatments due to the high costs of dental consumables and surgery instruments. In middle and low-income countries, dental care is often not covered by public insurance, and even in high-income countries, dental reimbursement policies are limited. For instance, in the U.S., dental care is covered for children under Medicaid but not under public insurance, leading patients to seek expensive private insurance policies for coverage. Dental consumable products, such as dental implants, are inaccessible to a large portion of the global population due to their high costs and case variability. Factors such as jaw size, decay extent, and bone strength contribute to the uniqueness of each dental implant procedure. This, combined with the availability of multiple ranges of products, expensive CAD/CAM instruments, practitioners’ locations, and individual fees, results in unpredictable costs for patients, reducing their willingness to opt for dental procedures. The COVID pandemic further strained government resources, shifting healthcare policy focus to the pandemic and infectious disease management. In developing countries, high treatment costs for oral diseases and limited dental care systems contribute to poor adult dental health. Often, oral diseases are overlooked, despite their significant impact on quality of life, leading to a high number of dental diseases and expensive, ineffective clinical interventions.
What Questions Should You Ask before Buying a Market Research Report?
• How is the dental consumables market evolving?
• What is driving and restraining the dental consumables market?
• How will each dental consumables submarket segment grow over the forecast period and how much revenue will these submarkets account for in 2033?
• How will the market shares for each dental consumables submarket develop from 2023 to 2033?
• What will be the main driver for the overall market from 2023 to 2033?
• Will leading dental consumables markets broadly follow the macroeconomic dynamics, or will individual national markets outperform others?
• How will the market shares of the national markets change by 2033 and which geographical region will lead the market in 2033?
• Who are the leading players and what are their prospects over the forecast period?
• What are the dental consumables projects for these leading companies?
• How will the industry evolve during the period between 2023 and 2033? What are the implications of dental consumables projects taking place now and over the next 10 years?
• Is there a greater need for product commercialisation to further scale the dental consumables market?
• Where is the dental consumables market heading and how can you ensure you are at the forefront of the market?
• What are the best investment options for new product and service lines?
• What are the key prospects for moving companies into a new growth path and C-suite?
You need to discover how this will impact the dental consumables market today, and over the next 10 years:
• Our 303-page report provides 142 tables and 157 charts/graphs exclusively to you.
• The report highlights key lucrative areas in the industry so you can target them – NOW.
• It contains in-depth analysis of global, regional and national sales and growth.
• It highlights for you the key successful trends, changes and revenue projections made by your competitors.
This report tells you TODAY how the dental consumables market will develop in the next 10 years, and in line with the variations in COVID-19 economic recession and bounce. This market is more critical now than at any point over the last 10 years.
Forecasts to 2033 and other analyses reveal commercial prospects
• In addition to revenue forecasting to 2033, our new study provides you with recent results, growth rates, and market shares.
• You will find original analyses, with business outlooks and developments.
• Discover qualitative analyses (including market dynamics, drivers, opportunities, restraints and challenges), cost structure, impact of rising dental consumables prices and recent developments.
This report includes data analysis and invaluable insight into how COVID-19 will affect the industry and your company. Four COVID-19 recovery patterns and their impact, namely, “V”, “L”, “W” and “U” are discussed in this report.
Segments Covered in the Report
Product
• Dental Implants
– Titanium
– Zirconium
• Dental Prosthetics
– Crowns
– Bridges
– Dentures
– Abutments
– Others
• Dental Anesthetics
– Injectable Anesthetics
– Topical Anesthetics
• Dental Sutures
– Absorbable
– Non-absorbable
• Endodontics
– Shaping and Cleaning Consumables
– Obturation Consumables
– Access Preparation Consumables
• Other Consumables
– Dental Splints
– Dental Sealants
– Bonding Agents
– Dental Burs
– Dental Disposables
End-user
• Dental hospitals
• Dental Clinics
• Dental laboratories
In addition to the revenue predictions for the overall world market and segments, you will also find revenue forecasts for five regional and 21 leading national markets:
North America
• U.S.
• Canada
Europe
• Germany
• UK
• France
• Spain
• Italy
• Rest of Europe
Asia Pacific
• China
• Japan
• India
• Australia
• South Korea
• Rest of Asia Pacific
Latin America
• Brazil
• Mexico
• Rest of Latin America
MEA
• GCC
• South Africa
• Rest of MEA
The report also includes profiles and for some of the leading companies in the Dental Consumables Market, 2023 to 2033, with a focus on this segment of these companies’ operations.
Leading companies and the potential for market growth
• Coltene Holding AG
• Dentsply Sirona
• Envista
• 3M
• GC Orthodontics America
• Henry Schein
• Ivoclar Vivadent Aktiengesellschaft
• Patterson Companies Inc
• Planmeca OY
• Straumann Holdings AG
• ZimVie (Formerly Zimmer Biomet)
Overall world revenue for Dental Consumables Market, 2023 to 2033 in terms of value the market will surpass US$21,759 million in 2023, our work calculates. We predict strong revenue growth through to 2033. Our work identifies which organizations hold the greatest potential. Discover their capabilities, progress, and commercial prospects, helping you stay ahead.
How will the Dental Consumables Market, 2023 to 2033 report help you?
In summary, our 300+ page report provides you with the following knowledge:
• Revenue forecasts to 2033 for Dental Consumables Market, 2023 to 2033 Market, with forecasts for product and end-users, each forecast at a global and regional level – discover the industry’s prospects, finding the most lucrative places for investments and revenues.
• Revenue forecasts to 2033 for five regional and 21 key national markets – See forecasts for the Dental Consumables Market, 2023 to 2033 market in North America, Europe, Asia-Pacific, Latin America, and MEA. Also forecasted is the market in the US, Canada, Mexico, Brazil, Germany, France, UK, Italy, China, India, Japan, and Australia among other prominent economies.
• Prospects for established firms and those seeking to enter the market – including company profiles for 11 of the major companies involved in the Dental Consumables Market, 2023 to 2033.
Find quantitative and qualitative analyses with independent predictions. Receive information that only our report contains, staying informed with invaluable business intelligence.
Information found nowhere else
With our new report, you are less likely to fall behind in knowledge or miss out on opportunities. See how our work could benefit your research, analyses, and decisions. Visiongain’s study is for everybody needing commercial analyses for the Dental Consumables Market, 2023 to 2033, market-leading companies. You will find data, trends and predictions.
ページTOPに戻る
Table of Contents
Table of Contents
1 Report Overview
1.1 Objectives of the Study
1.2 Introduction to Dental Consumables Market
1.3 What This Report Delivers
1.4 Why You Should Read This Report
1.5 Key Questions Answered by This Analytical Report
1.6 Who is This Report for?
1.7 Methodology
1.7.1 Market Definitions
1.7.2 Market Evaluation & Forecasting Methodology
1.7.3 Data Validation
1.7.3.1 Primary Research
1.7.3.2 Secondary Research
1.8 Frequently Asked Questions (FAQs)
1.9 Associated Visiongain Reports
1.10 About Visiongain
2 Executive Summary
3 Market Overview
3.1 Key Findings
3.2 Market Dynamics
3.2.1 Market Driving Factors
3.2.1.1 Rising Incidence of Dental Problems
3.2.1.2 Technological Advancements in Dental Industry
3.2.1.3 Rising Demand for Cosmetic Procedures
3.2.2 Market Restraining Factors
3.2.2.1 Limited Reimbursements
3.2.2.2 High Costs of Consumables
3.2.2.3 Shift of Public Health Focus and Government Spending Towards Management of Dental Care
3.2.3 Market Opportunities
3.2.3.1 Anticipated Growth in the Medical Tourism Sector
3.2.3.2 Surge in Digitization with CAD/CAM Technology
3.3 COVID-19 Impact Analysis
3.4 Porter’s Five Forces Analysis
3.4.1 Bargaining Power of Suppliers
3.4.2 Bargaining Power of Buyers
3.4.3 Competitive Rivalry
3.4.4 Threat from Substitutes
3.4.5 Threat of New Entrants
3.5 PEST Analysis
4 Dental Consumables Market Analysis by Product
4.1 Key Findings
4.2 Product Segment: Market Attractiveness Index
4.3 Dental Consumables Market Size Estimation and Forecast by Product
4.4 Dental Implants
4.4.1 Dental Consumables Market Size Estimation and Forecast by Dental Implants
4.4.2 Market Size by Region, 2023-2033 (US$ Million)
4.4.3 Market Share by Region, 2023 & 2033 (%)
4.4.4 Titanium
4.4.4.1 Market Size by Region, 2023-2033 (US$ Million)
4.4.4.2 Market Share by Region, 2023 & 2033 (%)
4.4.5 Zirconium
4.4.5.1 Market Size by Region, 2023-2033 (US$ Million)
4.4.5.2 Market Share by Region, 2023 & 2033 (%)
4.5 Dental Prosthetics
4.5.1 Dental Consumables Market Size Estimation and Forecast by Dental Prosthetics
4.5.2 Market Size by Region, 2023-2033 (US$ Million)
4.5.3 Market Share by Region, 2023 & 2033 (%)
4.5.4 Crowns
4.5.4.1 Market Size by Region, 2023-2033 (US$ Million)
4.5.4.2 Market Share by Region, 2023 & 2033 (%)
4.5.5 Bridges
4.5.5.1 Market Size by Region, 2023-2033 (US$ Million)
4.5.5.2 Market Share by Region, 2023 & 2033 (%)
4.5.6 Dentures
4.5.6.1 Market Size by Region, 2023-2033 (US$ Million)
4.5.6.2 Market Share by Region, 2023 & 2033 (%)
4.5.7 Abutments
4.5.7.1 Market Size by Region, 2023-2033 (US$ Million)
4.5.7.2 Market Share by Region, 2023 & 2033 (%)
4.5.8 Others
4.5.8.1 Market Size by Region, 2023-2033 (US$ Million)
4.5.8.2 Market Share by Region, 2023 & 2033 (%)
4.6 Dental Anesthetics
4.6.1 Dental Consumables Market Size Estimation and Forecast by Dental Anesthetics
4.6.2 Market Size by Region, 2023-2033 (US$ Million)
4.6.3 Market Share by Region, 2023 & 2033 (%)
4.6.4 Injectable Anesthetics
4.6.4.1 Market Size by Region, 2023-2033 (US$ Million)
4.6.4.2 Market Share by Region, 2023 & 2033 (%)
4.6.5 Topical Anesthetics
4.6.5.1 Market Size by Region, 2023-2033 (US$ Million)
4.6.5.2 Market Share by Region, 2023 & 2033 (%)
4.7 Dental Sutures
4.7.1 Dental Sutures Market Size Estimation and Forecast by Dental Implants
4.7.2 Market Size by Region, 2023-2033 (US$ Million)
4.7.3 Market Share by Region, 2023 & 2033 (%)
4.7.4 Absorbable
4.7.4.1 Market Size by Region, 2023-2033 (US$ Million)
4.7.4.2 Market Share by Region, 2023 & 2033 (%)
4.7.5 Non-absorbable
4.7.5.1 Market Size by Region, 2023-2033 (US$ Million)
4.7.5.2 Market Share by Region, 2023 & 2033 (%)
4.8 Endodontics
4.8.1 Dental Consumables Market Size Estimation and Forecast by Endodontics
4.8.2 Market Size by Region, 2023-2033 (US$ Million)
4.8.3 Market Share by Region, 2023 & 2033 (%)
4.8.4 Shaping and Cleaning Consumables
4.8.4.1 Market Size by Region, 2023-2033 (US$ Million)
4.8.4.2 Market Share by Region, 2023 & 2033 (%)
4.8.5 Obturation Consumables
4.8.5.1 Market Size by Region, 2023-2033 (US$ Million)
4.8.5.2 Market Share by Region, 2023 & 2033 (%)
4.8.6 Access Preparation Consumables
4.8.6.1 Market Size by Region, 2023-2033 (US$ Million)
4.8.6.2 Market Share by Region, 2023 & 2033 (%)
4.9 Other Consumables
4.9.1 Dental Consumables Market Size Estimation and Forecast by Other Consumables
4.9.2 Market Size by Region, 2023-2033 (US$ Million)
4.9.3 Market Share by Region, 2023 & 2033 (%)
4.9.4 Dental Splints
4.9.4.1 Market Size by Region, 2023-2033 (US$ Million)
4.9.4.2 Market Share by Region, 2023 & 2033 (%)
4.9.5 Dental Sealants
4.9.5.1 Market Size by Region, 2023-2033 (US$ Million)
4.9.5.2 Market Share by Region, 2023 & 2033 (%)
4.9.6 Bonding Agents
4.9.6.1 Market Size by Region, 2023-2033 (US$ Million)
4.9.6.2 Market Share by Region, 2023 & 2033 (%)
4.9.7 Dental Burs
4.9.7.1 Market Size by Region, 2023-2033 (US$ Million)
4.9.7.2 Market Share by Region, 2023 & 2033 (%)
4.9.8 Dental Disposables
4.9.8.1 Market Size by Region, 2023-2033 (US$ Million)
4.9.8.2 Market Share by Region, 2023 & 2033 (%)
5 Dental Consumables Market Analysis by End-users
5.1 Key Findings
5.2 End-users Segment: Market Attractiveness Index
5.2.1 Dental Consumables Market Size Estimation and Forecast by End-users
5.2.2 Market Size by Region, 2023-2033 (US$ Million)
5.2.3 Market Share by Region, 2023 & 2033 (%)
5.2.4 Dental Hospitals
5.2.4.1 Market Size by Region, 2023-2033 (US$ Million)
5.2.4.2 Market Share by Region, 2023 & 2033 (%)
5.2.5 Dental Clinics
5.2.5.1 Market Size by Region, 2023-2033 (US$ Million)
5.2.5.2 Market Share by Region, 2023 & 2033 (%)
5.2.6 Dental Laboratories
5.2.6.1 Market Size by Region, 2023-2033 (US$ Million)
5.2.6.2 Market Share by Region, 2023 & 2033 (%)
6 Dental Consumables Market Analysis by Region
6.1 Key Findings
6.2 Regional Market Size Estimation and Forecast
7 North America Dental Consumables Market Analysis
7.1 Key Findings
7.2 North America Dental Consumables Market Attractiveness Index
7.3 North America Dental Consumables Market by Country, 2023, 2028 & 2033 (US$ Million)
7.4 North America Dental Consumables Market Size Estimation and Forecast by Country
7.5 North America Dental Consumables Market Size Estimation and Forecast by Product
7.5.1 North America Dental Consumables Market Size Estimation and Forecast by Dental Implants
7.5.2 North America Dental Consumables Market Size Estimation and Forecast by Product Dental Prosthetics
7.5.3 North America Dental Consumables Market Size Estimation and Forecast by Dental Anesthetics
7.5.4 North America Dental Consumables Market Size Estimation and Forecast by Dental Sutures
7.5.5 North America Dental Consumables Market Size Estimation and Forecast by Endodontics
7.5.6 North America Dental Consumables Market Size Estimation and Forecast by Other Consumables
7.6 North America Dental Consumables Market Size Estimation and Forecast by End-users
7.7 U.S. Dental Consumables Market Analysis
7.8 Canada Dental Consumables Market Analysis
8 Europe Dental Consumables Market Analysis
8.1 Key Findings
8.2 Europe Dental Consumables Market Attractiveness Index
8.3 Europe Dental Consumables Market by Country, 2023, 2028 & 2033 (US$ Million)
8.4 Europe Dental Consumables Market Size Estimation and Forecast by Country
8.5 Europe Dental Consumables Market Size Estimation and Forecast by Product
8.5.1 Europe Dental Consumables Market Size Estimation and Forecast by Dental Implants
8.5.2 Europe Dental Consumables Market Size Estimation and Forecast by Dental Prosthetics
8.5.3 Europe Dental Consumables Market Size Estimation and Forecast by Dental Anesthetics
8.5.4 Europe Dental Consumables Market Size Estimation and Forecast by Dental Sutures
8.5.5 Europe Dental Consumables Market Size Estimation and Forecast by Endodontics
8.5.6 Europe Dental Consumables Market Size Estimation and Forecast by Other Consumables
8.6 Europe Dental Consumables Market Size Estimation and Forecast by End-users
8.7 Germany Dental Consumables Market Analysis
8.8 France Dental Consumables Market Analysis
8.9 UK Dental Consumables Market Analysis
8.10 Italy Dental Consumables Market Analysis
8.11 Spain Dental Consumables Market Analysis
8.12 Russia Dental Consumables Market Analysis
8.13 Rest of Europe Dental Consumables Market Analysis
9 Asia Pacific Dental Consumables Market Analysis
9.1 Key Findings
9.2 Asia Pacific Dental Consumables Market Attractiveness Index
9.3 Asia Pacific Dental Consumables Market by Country, 2023, 2028 & 2033 (US$ Million)
9.4 Asia Pacific Dental Consumables Market Size Estimation and Forecast by Country
9.5 Asia Pacific Dental Consumables Market Size Estimation and Forecast by Product
9.5.1 Asia Pacific Dental Consumables Market Size Estimation and Forecast by Dental Implants
9.5.2 Asia Pacific Dental Consumables Market Size Estimation and Forecast by Dental Prosthetics
9.5.3 Asia Pacific Dental Consumables Market Size Estimation and Forecast by Dental Anesthetics
9.5.4 Asia Pacific Dental Consumables Market Size Estimation and Forecast by Dental Sutures
9.5.5 Asia Pacific Dental Consumables Market Size Estimation and Forecast by Endodontics
9.5.6 Asia Pacific Dental Consumables Market Size Estimation and Forecast by Other Consumables
9.6 Asia Pacific Dental Consumables Market Size Estimation and Forecast by End-users
9.7 Japan Dental Consumables Market Analysis
9.8 China Dental Consumables Market Analysis
9.9 India Dental Consumables Market Analysis
9.10 Australia Dental Consumables Market Analysis
9.11 South Korea Dental Consumables Market Analysis
9.12 Rest of Asia Pacific Dental Consumables Market Analysis
10 Latin America Dental Consumables Market Analysis
10.1 Key Findings
10.2 Latin America Dental Consumables Market Attractiveness Index
10.3 Latin America Dental Consumables Market by Country, 2023, 2028 & 2033 (US$ Million)
10.4 Latin America Dental Consumables Market Size Estimation and Forecast by Country
10.5 Latin America Dental Consumables Market Size Estimation and Forecast by Product
10.5.1 Latin America Dental Consumables Market Size Estimation and Forecast by Dental Implants
10.5.2 Latin America Dental Consumables Market Size Estimation and Forecast by Dental Prosthetics
10.5.3 Latin America Dental Consumables Market Size Estimation and Forecast by Dental Anesthetics
10.5.4 Latin America Dental Consumables Market Size Estimation and Forecast by Dental Sutures
10.5.5 Latin America Dental Consumables Market Size Estimation and Forecast by Endodontics
10.5.6 Latin America Dental Consumables Market Size Estimation and Forecast by Other Consumables
10.6 Latin America Dental Consumables Market Size Estimation and Forecast by End-users
10.7 Brazil Dental Consumables Market Analysis
10.8 Mexico Dental Consumables Market Analysis
10.9 Rest of Latin America Dental Consumables Market Analysis
11 MEA Dental Consumables Market Analysis
11.1 Key Findings
11.2 MEA Dental Consumables Market Attractiveness Index
11.3 MEA Dental Consumables Market by Country, 2023, 2028 & 2033 (US$ Million)
11.4 MEA Dental Consumables Market Size Estimation and Forecast by Country
11.5 MEA Dental Consumables Market Size Estimation and Forecast by Product
11.5.1 MEA Dental Consumables Market Size Estimation and Forecast by Dental Implants
11.5.2 MEA Dental Consumables Market Size Estimation and Forecast by Dental Prosthetics
11.5.3 MEA Dental Consumables Market Size Estimation and Forecast by Dental Anesthetics
11.5.4 MEA Dental Consumables Market Size Estimation and Forecast by Dental Sutures
11.5.5 MEA Dental Consumables Market Size Estimation and Forecast by Endodontics
11.5.6 MEA Dental Consumables Market Size Estimation and Forecast by Other Consumables
11.6 MEA Dental Consumables Market Size Estimation and Forecast by End-users
11.7 GCC Dental Consumables Market Analysis
11.8 South Africa Dental Consumables Market Analysis
11.9 Rest of MEA Dental Consumables Market Analysis
12 Company Profiles
12.1 Competitive Landscape, 2022
12.2 Coltene Holding AG
12.2.1 Company Snapshot
12.2.2 Company Overview
12.2.3 Financial Analysis
12.2.3.1 Net Revenue, 2017-2022
12.2.3.2 Regional Market Shares, 2022
12.2.4 Product Benchmarking
12.2.5 Strategic Outlook
12.3 Dentsply Sirona
12.3.1 Company Snapshot
12.3.2 Company Overview
12.3.3 Financial Analysis
12.3.3.1 Net Revenue, 2017-2022
12.3.3.2 R&D, 2017-2022
12.3.3.3 Regional Market Shares, 2022
12.3.4 Product Benchmarking
12.3.5 Strategic Outlook
12.4 Envista
12.4.1 Company Snapshot
12.4.2 Company Overview
12.4.3 Financial Analysis
12.4.3.1 Net Revenue, 2017-2022
12.4.3.2 R&D, 2017-2022
12.4.3.3 Regional Market Shares, 2022
12.4.4 Product Benchmarking
12.4.5 Strategic Outlook
12.5 3M
12.5.1 Company Snapshot
12.5.2 Company Overview
12.5.3 Financial Analysis
12.5.3.1 Net Revenue, 2017-2022
12.5.3.2 R&D, 2017-2022
12.5.3.3 Regional Market Shares, 2022
12.5.4 Product Benchmarking
12.5.5 Strategic Outlook
12.6 GC Orthodontics America
12.6.1 Company Snapshot
12.6.2 Company Overview
12.6.3 Product Benchmarking
12.6.4 Strategic Outlook
12.7 Henry Schein
12.7.1 Company Snapshot
12.7.2 Company Overview
12.7.3 Financial Analysis
12.7.3.1 Net Revenue, 2017-2022
12.7.3.2 Regional Market Shares, 2022
12.7.4 Product Benchmarking
12.7.5 Strategic Outlook
12.8 Ivoclar Vivadent AG
12.8.1 Company Snapshot
12.8.2 Company Overview
12.8.3 Product Benchmarking
12.8.4 Strategic Outlook
12.9 Patterson Companies
12.9.1 Company Snapshot
12.9.2 Company Overview
12.9.3 Financial Analysis
12.9.3.1 Net Revenue, 2017-2022
12.9.3.2 Regional Market Shares, 2022
12.9.4 Product Benchmarking
12.9.5 Strategic Outlook
12.10 Planmeca OY
12.10.1 Company Snapshot
12.10.2 Company Overview
12.10.3 Product Benchmarking
12.10.4 Strategic Outlook
12.11 Straumann Holdings AG
12.11.1 Company Snapshot
12.11.2 Company Overview
12.11.3 Financial Analysis
12.11.3.1 Net Revenue, 2017-2022
12.11.3.2 R&D, 2017-2022
12.11.3.3 Regional Market Shares, 2022
12.11.4 Product Benchmarking
12.11.5 Strategic Outlook
12.12 ZimVie (Formerly part of Zimmer Biomet)
12.12.1 Company Snapshot
12.12.2 Company Overview
12.12.3 Financial Analysis
12.12.3.1 Net Revenue, 2018-2022
12.12.3.2 R&D, 2019-2022
12.12.4 Product Benchmarking
12.12.5 Strategic Outlook
13 Conclusion and Recommendations
13.1 Concluding Remarks from Visiongain
13.2 Recommendations for Market Players
ページTOPに戻る
List of Tables/Graphs
List of Tables
Table 1 Dental Consumables Market Snapshot, 2023 & 2033 (US$ Million, CAGR %)
Table 2 Dental Consumables Market Forecast by Region, 2023-2033 (US$ Million, AGR%, CAGR%): “V” Shaped Recovery
Table 3 Dental Consumables Market Forecast by Region, 2023-2033 (US$ Million, AGR%, CAGR%): “U” Shaped Recovery
Table 4 Dental Consumables Market Forecast by Region, 2023-2033 (US$ Million, AGR%, CAGR%): “W” Shaped Recovery
Table 5 Dental Consumables Market Forecast by Region, 2023-2033 (US$ Million, AGR%, CAGR%): “L” Shaped Recovery
Table 6 Dental Consumables Market Forecast by Product, 2023-2033 (US$ Million, AGR%, CAGR%)
Table 7 Dental Consumables Market Forecast by Dental Implants, 2023-2033 (US$ Million, AGR%, CAGR%)
Table 8 Dental Implants Segment Market Forecast by Region, 2023-2033 (US$ Million, AGR%, CAGR%)
Table 9 Titanium Segment Market Forecast by Region, 2023-2033 (US$ Million, AGR%, CAGR%)
Table 10 Zirconium Segment Market Forecast by Region, 2023-2033 (US$ Million, AGR%, CAGR%)
Table 11 Dental Consumables Market Forecast by Dental Prosthetics, 2023-2033 (US$ Million, AGR%, CAGR%)
Table 12 Dental Prosthetics Segment Market Forecast by Region, 2023-2033 (US$ Million, AGR%, CAGR%)
Table 13 Crowns Segment Market Forecast by Region, 2023-2033 (US$ Million, AGR%, CAGR%)
Table 14 Bridges Segment Market Forecast by Region, 2023-2033 (US$ Million, AGR%, CAGR%)
Table 15 Dentures Segment Market Forecast by Region, 2023-2033 (US$ Million, AGR%, CAGR%)
Table 16 Abutments Segment Market Forecast by Region, 2023-2033 (US$ Million, AGR%, CAGR%)
Table 17 Others Segment Market Forecast by Region, 2023-2033 (US$ Million, AGR%, CAGR%)
Table 18 Dental Consumables Market Forecast by Dental Anesthetics, 2023-2033 (US$ Million, AGR%, CAGR%)
Table 19 Dental Anesthetics Segment Market Forecast by Region, 2023-2033 (US$ Million, AGR%, CAGR%)
Table 20 Injectable Anesthetics Segment Market Forecast by Region, 2023-2033 (US$ Million, AGR%, CAGR%)
Table 21 Topical Anesthetics Segment Market Forecast by Region, 2023-2033 (US$ Million, AGR%, CAGR%)
Table 22 Dental Sutures Market Forecast by Dental Implants, 2023-2033 (US$ Million, AGR%, CAGR%)
Table 23 Dental Sutures Segment Market Forecast by Region, 2023-2033 (US$ Million, AGR%, CAGR%)
Table 24 Absorbable Segment Market Forecast by Region, 2023-2033 (US$ Million, AGR%, CAGR%)
Table 25 Non-absorbable Segment Market Forecast by Region, 2023-2033 (US$ Million, AGR%, CAGR%)
Table 26 Dental Consumables Market Forecast by Endodontics, 2023-2033 (US$ Million, AGR%, CAGR%)
Table 27 Endodontics Market Forecast by Region, 2023-2033 (US$ Million, AGR%, CAGR%)
Table 28 Shaping and cleaning consumables Market Forecast by Region, 2023-2033 (US$ Million, AGR%, CAGR%)
Table 29 Obturation consumables Market Forecast by Region, 2023-2033 (US$ Million, AGR%, CAGR%)
Table 30 Access preparation consumables Market Forecast by Region, 2023-2033 (US$ Million, AGR%, CAGR%)
Table 31 Dental Consumables Market Forecast by Other Consumables, 2023-2033 (US$ Million, AGR%, CAGR%)
Table 32 Other Consumables Market Forecast by Region, 2023-2033 (US$ Million, AGR%, CAGR%)
Table 33 Dental Splints Market Forecast by Region, 2023-2033 (US$ Million, AGR%, CAGR%)
Table 34 Dental Sealants Market Forecast by Region, 2023-2033 (US$ Million, AGR%, CAGR%)
Table 35 Bonding Agents Market Forecast by Region, 2023-2033 (US$ Million, AGR%, CAGR%)
Table 36 Dental burs Market Forecast by Region, 2023-2033 (US$ Million, AGR%, CAGR%)
Table 37 Dental Disposables Market Forecast by Region, 2023-2033 (US$ Million, AGR%, CAGR%)
Table 38 Dental Consumables Market Forecast by End-users, 2023-2033 (US$ Million, AGR%, CAGR%)
Table 39 End-users Market Forecast by Region, 2023-2033 (US$ Million, AGR%, CAGR%)
Table 40 Dental hospitals Market Forecast by Region, 2023-2033 (US$ Million, AGR%, CAGR%)
Table 41 Dental Clinics Market Forecast by Region, 2023-2033 (US$ Million, AGR%, CAGR%)
Table 42 Dental Laboratories Market Forecast by Region, 2023-2033 (US$ Million, AGR%, CAGR%)
Table 43 Dental Consumables Market Forecast by Region, 2023-2033 (US$ Million, AGR%, CAGR%)
Table 44 North America Dental Consumables Market Forecast by Country, 2023-2033 (US$ Million, AGR%, CAGR%)
Table 45 North America Dental Consumables Market Forecast by Product, 2023-2033 (US$ Million, AGR%, CAGR%)
Table 46 North America Dental Consumables Market Forecast by Dental Implants, 2023-2033 (US$ Million, AGR%, CAGR%)
Table 47 North America Dental Consumables Market Forecast by Dental Prosthetics, 2023-2033 (US$ Million, AGR%, CAGR%)
Table 48 North America Dental Consumables Market Forecast by Dental Anesthetics, 2023-2033 (US$ Million, AGR%, CAGR%)
Table 49 North America Dental Consumables Market Forecast by Dental Sutures, 2023-2033 (US$ Million, AGR%, CAGR%)
Table 50 North America Dental Consumables Market Forecast by Endodontics, 2023-2033 (US$ Million, AGR%, CAGR%)
Table 51 North America Dental Consumables Market Forecast by Other Consumables, 2023-2033 (US$ Million, AGR%, CAGR%)
Table 52 North America Dental Consumables Market Forecast by End-users, 2023-2033 (US$ Million, AGR%, CAGR%)
Table 53 U.S. Dental Consumables Market Forecast, 2023-2033 (US$ Million, AGR%, CAGR%)
Table 54 Canada Dental Consumables Market Forecast, 2023-2033 (US$ Million, AGR%, CAGR%)
Table 55 Europe Dental Consumables Market Forecast by Country, 2023-2033 (US$ Million, AGR%, CAGR%)
Table 56 Europe Dental Consumables Market Forecast by Product, 2023-2033 (US$ Million, AGR%, CAGR%)
Table 57 Europe Dental Consumables Market Forecast by Dental Implants, 2023-2033 (US$ Million, AGR%, CAGR%)
Table 58 Europe Dental Consumables Market Forecast by Dental Prosthetics, 2023-2033 (US$ Million, AGR%, CAGR%)
Table 59 Europe Dental Consumables Market Forecast by Dental Anesthetics, 2023-2033 (US$ Million, AGR%, CAGR%)
Table 60 Europe Dental Consumables Market Forecast by Dental Sutures, 2023-2033 (US$ Million, AGR%, CAGR%)
Table 61 Europe Dental Consumables Market Forecast by Endodontics, 2023-2033 (US$ Million, AGR%, CAGR%)
Table 62 Europe Dental Consumables Market Forecast by Other Consumables, 2023-2033 (US$ Million, AGR%, CAGR%)
Table 63 Europe Dental Consumables Market Forecast by End-users, 2023-2033 (US$ Million, AGR%, CAGR%)
Table 64 Germany Dental Consumables Market Forecast, 2023-2033 (US$ Million, AGR%, CAGR%)
Table 65 France Dental Consumables Market Forecast, 2023-2033 (US$ Million, AGR%, CAGR%)
Table 66 UK Dental Consumables Market Forecast, 2023-2033 (US$ Million, AGR%, CAGR%)
Table 67 Italy Dental Consumables Market Forecast, 2023-2033 (US$ Million, AGR%, CAGR%)
Table 68 Spain Dental Consumables Market Forecast, 2023-2033 (US$ Million, AGR%, CAGR%)
Table 69 Russia Dental Consumables Market Forecast, 2023-2033 (US$ Million, AGR%, CAGR%)
Table 70 Rest of Europe Dental Consumables Market Forecast, 2023-2033 (US$ Million, AGR%, CAGR%)
Table 71 Asia Pacific Dental Consumables Market Forecast by Country, 2023-2033 (US$ Million, AGR%, CAGR%)
Table 72 Asia Pacific Dental Consumables Market Forecast by Product, 2023-2033 (US$ Million, AGR%, CAGR%)
Table 73 Asia Pacific Dental Consumables Market Forecast by Dental Implants, 2023-2033 (US$ Million, AGR%, CAGR%)
Table 74 Asia Pacific Dental Consumables Market Forecast by Dental Prosthetics, 2023-2033 (US$ Million, AGR%, CAGR%)
Table 75 Asia Pacific Dental Consumables Market Forecast by Dental Anesthetics, 2023-2033 (US$ Million, AGR%, CAGR%)
Table 76 Asia Pacific Dental Consumables Market Forecast by Dental Sutures, 2023-2033 (US$ Million, AGR%, CAGR%)
Table 77 Asia Pacific Dental Consumables Market Forecast by Endodontics, 2023-2033 (US$ Million, AGR%, CAGR%)
Table 78 Asia Pacific Dental Consumables Market Forecast by Other Consumables, 2023-2033 (US$ Million, AGR%, CAGR%)
Table 79 Asia Pacific Dental Consumables Market Forecast by End-users, 2023-2033 (US$ Million, AGR%, CAGR%)
Table 80 Japan Dental Consumables Market Forecast, 2023-2033 (US$ Million, AGR%, CAGR%)
Table 81 China Dental Consumables Market Forecast, 2023-2033 (US$ Million, AGR%, CAGR%)
Table 82 India Dental Consumables Market Forecast, 2023-2033 (US$ Million, AGR%, CAGR%)
Table 83 Australia Dental Consumables Market Forecast, 2023-2033 (US$ Million, AGR%, CAGR%)
Table 84 South Korea Dental Consumables Market Forecast, 2023-2033 (US$ Million, AGR%, CAGR%)
Table 85 Rest of Asia Pacific Dental Consumables Market Forecast, 2023-2033 (US$ Million, AGR%, CAGR%)
Table 86 Latin America Dental Consumables Market Forecast by Country, 2023-2033 (US$ Million, AGR%, CAGR%)
Table 87 Latin America Dental Consumables Market Forecast by Dental Prosthetics, 2023-2033 (US$ Million, AGR%, CAGR%)
Table 88 Latin America Dental Consumables Market Forecast by Dental Implants, 2023-2033 (US$ Million, AGR%, CAGR%)
Table 89 Latin America Dental Consumables Market Forecast by Dental Prosthetics, 2023-2033 (US$ Million, AGR%, CAGR%)
Table 90 Latin America Dental Consumables Market Forecast by Dental Anesthetics, 2023-2033 (US$ Million, AGR%, CAGR%)
Table 91 Latin America Dental Consumables Market Forecast by Dental Sutures, 2023-2033 (US$ Million, AGR%, CAGR%)
Table 92 Latin America Dental Consumables Market Forecast by Endodontics, 2023-2033 (US$ Million, AGR%, CAGR%)
Table 93 Latin America Dental Consumables Market Forecast by Other Consumables, 2023-2033 (US$ Million, AGR%, CAGR%)
Table 94 Latin America Dental Consumables Market Forecast by End-users, 2023-2033 (US$ Million, AGR%, CAGR%)
Table 95 Brazil Dental Consumables Market Forecast, 2023-2033 (US$ Million, AGR%, CAGR%)
Table 96 Mexico Dental Consumables Market Forecast, 2023-2033 (US$ Million, AGR%, CAGR%)
Table 97 Rest of Latin America Dental Consumables Market Forecast, 2023-2033 (US$ Million, AGR%, CAGR%)
Table 98 MEA Dental Consumables Market Forecast by Country, 2023-2033 (US$ Million, AGR%, CAGR%)
Table 99 MEA Dental Consumables Market Forecast by Product, 2023-2033 (US$ Million, AGR%, CAGR%)
Table 100 MEA Dental Consumables Market Forecast by Dental Implants, 2023-2033 (US$ Million, AGR%, CAGR%)
Table 101 MEA Dental Consumables Market Forecast by Dental Prosthetics, 2023-2033 (US$ Million, AGR%, CAGR%)
Table 102 MEA Dental Consumables Market Forecast by Dental Anesthetics, 2023-2033 (US$ Million, AGR%, CAGR%)
Table 103 MEA Dental Consumables Market Forecast by Dental Sutures, 2023-2033 (US$ Million, AGR%, CAGR%)
Table 104 MEA Dental Consumables Market Forecast by Endodontics, 2023-2033 (US$ Million, AGR%, CAGR%)
Table 105 MEA Dental Consumables Market Forecast by Other Consumables, 2023-2033 (US$ Million, AGR%, CAGR%)
Table 106 MEA Dental Consumables Market Forecast by End-users, 2023-2033 (US$ Million, AGR%, CAGR%)
Table 107 GCC Dental Consumables Market Forecast, 2023-2033 (US$ Million, AGR%, CAGR%)
Table 108 South Africa Dental Consumables Market Forecast, 2023-2033 (US$ Million, AGR%, CAGR%)
Table 109 Rest of MEA Dental Consumables Market Forecast, 2023-2033 (US$ Million, AGR%, CAGR%)
Table 110 Coltene Holding AG: Key Details, (CEO, HQ, Revenue, Founded, No. of Employees, Company Type, Website, Business Segment)
Table 111 Coltene Holding AG: Product Benchmarking
Table 112 Coltene Holding AG: Strategic Outlook
Table 113 Dentsply Sirona: Key Details, (CEO, HQ, Revenue, Founded, No. of Employees, Company Type, Website, Business Segment)
Table 114 Dentsply Sirona: Product Benchmarking
Table 115 Dentsply Sirona: Strategic Outlook
Table 116 Envista: Key Details, (CEO, HQ, Revenue, Founded, No. of Employees, Company Type, Website, Business Segment)
Table 117 Envista: Product Benchmarking
Table 118 Envista: Strategic Outlook
Table 119 3M: Key Details, (CEO, HQ, Revenue, Founded, No. of Employees, Company Type, Website, Business Segment)
Table 120 3M: Product Benchmarking
Table 121 3M: Strategic Outlook
Table 122 GC Orthodontics America: Key Details, (CEO, HQ, Revenue, Founded, No. of Employees, Company Type, Website, Business Segment)
Table 123 GC Orthodontics America: Product Benchmarking
Table 124 GC Orthodontics America: Strategic Outlook
Table 125 11.3 Henry Schein: Key Details, (CEO, HQ, Revenue, Founded, No. of Employees, Company Type, Website, Business Segment)
Table 126 Henry Schein: Product Benchmarking
Table 127 Henry Schein: Strategic Outlook
Table 128 Ivoclar Vivadent AG: Key Details, (CEO, HQ, Revenue, Founded, No. of Employees, Company Type, Website, Business Segment)
Table 129 Ivoclar Vivadent AG: Product Benchmarking
Table 130 Ivoclar Vivadent AG: Strategic Outlook
Table 131 Patterson Companies: Key Details, (CEO, HQ, Revenue, Founded, No. of Employees, Company Type, Website, Business Segment)
Table 132 Patterson Companies: Product Benchmarking
Table 133 Patterson Companies: Strategic Outlook
Table 134 Planmeca OY: Key Details, (CEO, HQ, Revenue, Founded, No. of Employees, Company Type, Website, Business Segment)
Table 135 Planmeca OY: Product Benchmarking
Table 136 Planmeca OY: Strategic Outlook
Table 137 Straumann Holdings AG: Key Details, (CEO, HQ, Revenue, Founded, No. of Employees, Company Type, Website, Business Segment)
Table 138 Straumann Holdings AG: Product Benchmarking
Table 139 Straumann Holdings AG: Strategic Outlook
Table 140 ZimVie: Key Details, (CEO, HQ, Revenue, Founded, No. of Employees, Company Type, Website, Business Segment)
Table 141 ZimVie: Product Benchmarking
Table 142 ZimVie: Strategic Outlook
List of Figures
Figure 1 Dental Consumables Market Segmentation
Figure 2 Dental Consumables Market by Product: Market Attractiveness Index
Figure 3 Dental Consumables Market by End user: Market Attractiveness Index
Figure 4 Dental Consumables Market Attractiveness Index by Region
Figure 5 Dental Consumables Market: Market Dynamics
Figure 6 Dental Consumables Market by Region, 2023-2033 (US$ Million, AGR %): “V” Shaped Recovery
Figure 7 Dental Consumables Market by Region, 2023-2033 (US$ Million, AGR %): “U” Shaped Recovery
Figure 8 Dental Consumables Market by Region, 2023-2033 (US$ Million, AGR %): “W” Shaped Recovery
Figure 9 Dental Consumables Market by Region, 2023-2033 (US$ Million, AGR %): “L” Shaped Recovery
Figure 10 Dental Consumables Market: Porter’s Five Forces Analysis
Figure 11 Dental Consumables Market: PEST Analysis
Figure 12 Dental Consumables Market by Product: Market Attractiveness Index
Figure 13 Dental Consumables Market Forecast by Product, 2023-2033 (US$ Million, AGR %)
Figure 14 Dental Consumables Market Share Forecast by Product, 2023, 2028, 2033 (%)
Figure 15 Dental Implants Segment Market Forecast by Region, 2023-2033 (US$ Million, AGR %)
Figure 16 Dental Implants Segment Market Share Forecast by Region, 2023 & 2033 (%)
Figure 17 Titanium Segment Market Forecast by Region, 2023-2033 (US$ Million, AGR %)
Figure 18 Titanium Segment Market Share Forecast by Region, 2023 & 2033 (%)
Figure 19 Zirconium Segment Market Forecast by Region, 2023-2033 (US$ Million, AGR %)
Figure 20 Zirconium Segment Market Share Forecast by Region, 2023 & 2033 (%)
Figure 21 Dental Prosthetics Segment Market Forecast by Region, 2023-2033 (US$ Million, AGR %)
Figure 22 Dental Prosthetics Segment Market Share Forecast by Region, 2023 & 2033 (%)
Figure 23 Crowns Segment Market Forecast by Region, 2023-2033 (US$ Million, AGR %)
Figure 24 Crowns Segment Market Share Forecast by Region, 2023 & 2033 (%)
Figure 25 Bridges Segment Market Forecast by Region, 2023-2033 (US$ Million, AGR %)
Figure 26 Bridges Segment Market Share Forecast by Region, 2023 & 2033 (%)
Figure 27 Dentures Segment Market Forecast by Region, 2023-2033 (US$ Million, AGR %)
Figure 28 Dentures Segment Market Share Forecast by Region, 2023 & 2033 (%)
Figure 29 Abutments Segment Market Forecast by Region, 2023-2033 (US$ Million, AGR %)
Figure 30 Abutments Segment Market Share Forecast by Region, 2023 & 2033 (%)
Figure 31 Others Segment Market Forecast by Region, 2023-2033 (US$ Million, AGR %)
Figure 32 Others Segment Market Share Forecast by Region, 2023 & 2033 (%)
Figure 33 Dental Anesthetics Segment Market Forecast by Region, 2023-2033 (US$ Million, AGR %)
Figure 34 Dental Anesthetics Segment Market Share Forecast by Region, 2023 & 2033 (%)
Figure 35 Injectable Anesthetics Segment Market Forecast by Region, 2023-2033 (US$ Million, AGR %)
Figure 36 Injectable Anesthetics Segment Market Share Forecast by Region, 2023 & 2033 (%)
Figure 37 Topical Anesthetics Segment Market Forecast by Region, 2023-2033 (US$ Million, AGR %)
Figure 38 Topical Anesthetics Segment Market Share Forecast by Region, 2023 & 2033 (%)
Figure 39 Dental Sutures Segment Market Forecast by Region, 2023-2033 (US$ Million, AGR %)
Figure 40 Dental Sutures Segment Market Share Forecast by Region, 2023 & 2033 (%)
Figure 41 Absorbable Segment Market Forecast by Region, 2023-2033 (US$ Million, AGR %)
Figure 42 Absorbable Segment Market Share Forecast by Region, 2023 & 2033 (%)
Figure 43 Non-absorbable Segment Market Forecast by Region, 2023-2033 (US$ Million, AGR %)
Figure 44 Non-absorbable Segment Market Share Forecast by Region, 2023 & 2033 (%)
Figure 45 Endodontics Market Forecast by Region, 2023-2033 (US$ Million, AGR %)
Figure 46 Endodontics Market Share Forecast by Region, 2023 & 2033 (%)
Figure 47 Shaping and cleaning consumables Market Forecast by Region, 2023-2033 (US$ Million, AGR %)
Figure 48 Shaping and cleaning consumables Market Share Forecast by Region, 2023 & 2033 (%)
Figure 49 Obturation consumables Market Forecast by Region, 2023-2033 (US$ Million, AGR %)
Figure 50 Obturation consumables Market Share Forecast by Region, 2023 & 2033 (%)
Figure 51 Access preparation consumables Segment Market Forecast by Region, 2023-2033 (US$ Million, AGR %)
Figure 52 Access preparation consumables Segment Market Share Forecast by Region, 2023 & 2033 (%)
Figure 53 Other Consumables Market Forecast by Region, 2023-2033 (US$ Million, AGR %)
Figure 54 Other Consumables Market Share Forecast by Region, 2023 & 2033 (%)
Figure 55 Dental Splints Market Forecast by Region, 2023-2033 (US$ Million, AGR %)
Figure 56 Dental Splints Market Share Forecast by Region, 2023 & 2033 (%)
Figure 57 Dental Sealants Market Forecast by Region, 2023-2033 (US$ Million, AGR %)
Figure 58 Dental Sealants Market Share Forecast by Region, 2023 & 2033 (%)
Figure 59 Bonding Agents Market Forecast by Region, 2023-2033 (US$ Million, AGR %)
Figure 60 Bonding Agents Market Share Forecast by Region, 2023 & 2033 (%)
Figure 61 Dental burs Market Forecast by Region, 2023-2033 (US$ Million, AGR %)
Figure 62 Dental burs Market Share Forecast by Region, 2023 & 2033 (%)
Figure 63 Dental Disposables Market Forecast by Region, 2023-2033 (US$ Million, AGR %)
Figure 64 Dental Disposables Market Share Forecast by Region, 2023 & 2033 (%)
Figure 65 Dental Consumables Market by End-users: Market Attractiveness Index
Figure 66 End-users Dental Consumables Market Forecast by Region, 2023-2033 (US$ Million, AGR %)
Figure 67 End-users Market Share Forecast by Region, 2023 & 2033 (%)
Figure 68 Dental hospitals Market Forecast by Region, 2023-2033 (US$ Million, AGR %)
Figure 69 Dental hospitals Market Share Forecast by Region, 2023 & 2033 (%)
Figure 70 Dental Clinics Market Forecast by Region, 2023-2033 (US$ Million, AGR %)
Figure 71 Dental Clinics Market Share Forecast by Region, 2023 & 2033 (%)
Figure 72 Dental Laboratories Market Forecast by Region, 2023-2033 (US$ Million, AGR %)
Figure 73 Dental Laboratories Market Share Forecast by Region, 2023 & 2033 (%)
Figure 74 Dental Consumables Market Forecast by Region 2023 and 2033 (Revenue, CAGR%)
Figure 75 Dental Consumables Market Share Forecast by Region 2023, 2028, 2033 (%)
Figure 76 Dental Consumables Market by Region, 2023-2033 (US$ Million, AGR %)
Figure 77 North America Dental Consumables Market Attractiveness Index
Figure 78 North America Dental Consumables Market by Region, 2023, 2028 & 2033 (US$ Million)
Figure 79 North America Dental Consumables Market Forecast by Country, 2023-2033 (US$ Million, AGR %)
Figure 80 North America Dental Consumables Market Share Forecast by Country, 2023 & 2033 (%)
Figure 81 North America Dental Consumables Market Forecast by Product, 2023-2033 (US$ Million, AGR %)
Figure 82 North America Dental Consumables Market Share Forecast by Product, 2023 & 2033 (%)
Figure 83 North America Dental Consumables Market Forecast by End-users, 2023-2033 (US$ Million, AGR %)
Figure 84 North America Dental Consumables Market Share Forecast by End-users, 2023 & 2033 (%)
Figure 85 U.S. Dental Consumables Market Forecast, 2023-2033 (US$ Million, AGR %)
Figure 86 Canada Dental Consumables Market Forecast, 2023-2033 (US$ Million, AGR %)
Figure 87 Europe Dental Consumables Market Attractiveness Index
Figure 88 Europe Dental Consumables Market by Region, 2023, 2028 & 2033 (US$ Million)
Figure 89 Europe Dental Consumables Market Forecast by Country, 2023-2033 (US$ Million, AGR %)
Figure 90 Europe Dental Consumables Market Share Forecast by Country, 2023 & 2033 (%)
Figure 91 Europe Dental Consumables Market Forecast by Product, 2023-2033 (US$ Million, AGR %)
Figure 92 Europe Dental Consumables Market Share Forecast by Product, 2023 & 2033 (%)
Figure 93 Europe Dental Consumables Market Forecast by End-users, 2023-2033 (US$ Million, AGR %)
Figure 94 Europe Dental Consumables Market Share Forecast by End-users, 2023 & 2033 (%)
Figure 95 Germany Dental Consumables Market Forecast, 2023-2033 (US$ Million, AGR %)
Figure 96 France Dental Consumables Market Forecast, 2023-2033 (US$ Million, AGR %)
Figure 97 UK Dental Consumables Market Forecast, 2023-2033 (US$ Million, AGR %)
Figure 98 Italy Dental Consumables Market Forecast, 2023-2033 (US$ Million, AGR %)
Figure 99 Spain Dental Consumables Market Forecast, 2023-2033 (US$ Million, AGR %)
Figure 100 Russia Dental Consumables Market Forecast, 2023-2033 (US$ Million, AGR %)
Figure 101 Rest of Europe Dental Consumables Market Forecast, 2023-2033 (US$ Million, AGR %)
Figure 102 Asia Pacific Dental Consumables Market Attractiveness Index
Figure 103 Asia Pacific Dental Consumables Market by Region, 2023, 2028 & 2033 (US$ Million)
Figure 104 Asia Pacific Dental Consumables Market Forecast by Country, 2023-2033 (US$ Million, AGR %)
Figure 105 Asia Pacific Dental Consumables Market Share Forecast by Country, 2023 & 2033 (%)
Figure 106 Asia Pacific Dental Consumables Market Forecast by Product, 2023-2033 (US$ Million, AGR %)
Figure 107 Asia Pacific Dental Consumables Market Share Forecast by Product, 2023 & 2033 (%)
Figure 108 Asia Pacific Dental Consumables Market Forecast by End-users, 2023-2033 (US$ Million, AGR %)
Figure 109 Asia Pacific Dental Consumables Market Share Forecast by End-users, 2023 & 2033 (%)
Figure 110 Japan Dental Consumables Market Forecast, 2023-2033 (US$ Million, AGR %)
Figure 111 China Dental Consumables Market Forecast, 2023-2033 (US$ Million, AGR %)
Figure 112 India Dental Consumables Market Forecast, 2023-2033 (US$ Million, AGR %)
Figure 113 Australia Dental Consumables Market Forecast, 2023-2033 (US$ Million, AGR %)
Figure 114 South Korea Dental Consumables Market Forecast, 2023-2033 (US$ Million, AGR %)
Figure 115 Rest of Asia Pacific Dental Consumables Market Forecast, 2023-2033 (US$ Million, AGR %)
Figure 116 Latin America Dental Consumables Market Attractiveness Index
Figure 117 Latin America Dental Consumables Market by Region, 2023, 2028 & 2033 (US$ Million)
Figure 118 Latin America Dental Consumables Market Forecast by Country, 2023-2033 (US$ Million, AGR %)
Figure 119 Latin America Dental Consumables Market Share Forecast by Country, 2023 & 2033 (%)
Figure 120 Latin America Dental Consumables Market Forecast by Product, 2023-2033 (US$ Million, AGR %)
Figure 121 Latin America Dental Consumables Market Share Forecast by Product, 2023 & 2033 (%)
Figure 122 Latin America Dental Consumables Market Forecast by End-users, 2023-2033 (US$ Million, AGR %)
Figure 123 Latin America Dental Consumables Market Share Forecast by End-users, 2023 & 2033 (%)
Figure 124 Brazil Dental Consumables Market Forecast, 2023-2033 (US$ Million, AGR %)
Figure 125 Mexico Dental Consumables Market Forecast, 2023-2033 (US$ Million, AGR %)
Figure 126 Rest of Latin America Dental Consumables Market Forecast, 2023-2033 (US$ Million, AGR %)
Figure 127 MEA Dental Consumables Market Attractiveness Index
Figure 128 MEA Dental Consumables Market by Region, 2023, 2028 & 2033 (US$ Million)
Figure 129 MEA Dental Consumables Market Forecast by Country, 2023-2033 (US$ Million, AGR %)
Figure 130 MEA Dental Consumables Market Share Forecast by Country, 2023 & 2033 (%)
Figure 131 MEA Dental Consumables Market Forecast by Product, 2023-2033 (US$ Million, AGR %)
Figure 132 MEA Dental Consumables Market Share Forecast by Product, 2023 & 2033 (%)
Figure 133 MEA Dental Consumables Market Forecast by End-users, 2023-2033 (US$ Million, AGR %)
Figure 134 MEA Dental Consumables Market Share Forecast by End-users, 2023 & 2033 (%)
Figure 135 GCC Dental Consumables Market Forecast, 2023-2033 (US$ Million, AGR %)
Figure 136 South Africa Dental Consumables Market Forecast, 2023-2033 (US$ Million, AGR %)
Figure 137 Rest of MEA Dental Consumables Market Forecast, 2023-2033 (US$ Million, AGR %)
Figure 138 Coltene Holding AG: Net Revenue, 2017-2022 (US$ Million, AGR%)
Figure 139 Coltene Holding AG: Regional Market Shares, 2022
Source: Visiongain, 2023
Figure 140 Dentsply Sirona: Net Revenue, 2017-2022 (US$ Million, AGR%)
Figure 141 Dentsply Sirona: R&D, 2017-2022 (US$ Million, AGR%)
Figure 142 Dentsply Sirona: Regional Market Shares, 2022
Figure 143 Envista: Net Revenue, 2017-2022 (US$ Million, AGR%)
Figure 144 Envista: R&D, 2017-2022 (US$ Million, AGR%)
Figure 145 Envista: Regional Market Shares, 2022
Figure 146 3M: Net Revenue, 2017-2022 (US$ Million, AGR%)
Figure 147 3M: R&D, 2017-2022 (US$ Million, AGR%)
Figure 148 3M: Regional Market Shares, 2022
Figure 149 Henry Schein: Net Revenue, 2017-2022 (US$ Million, AGR%)
Figure 150 Henry Schein: Regional Market Shares, 2022
Figure 151 Patterson Companies: Net Revenue, 2017-2022 (US$ Million, AGR%)
Figure 152 Patterson Companies: Regional Market Shares, 2022
Figure 153 Straumann Holdings AG: Net Revenue, 2017-2022 (US$ Million, AGR%)
Figure 154 Straumann Holdings AG: R&D, 2017-2022 (US$ Million, AGR%)
Figure 155 Straumann Holdings AG: Regional Market Shares, 2022
Figure 156 ZimVie: Net Revenue, 2018-2022 (US$ Million, AGR%)
Figure 157 ZimVie: R&D, 2019-2022 (US$ Million, AGR%)
ページTOPに戻る
よくあるご質問
Visiongain社はどのような調査会社ですか?
英国の調査会社ヴィジョンゲイン社(Visiongain)は、通信とエネルギーのほか、自動車や化学・医薬品、金属など、広範な市場を対象に調査を行っています。自動車市場については、市場全般に関する調査のほ... もっと見る
調査レポートの納品までの日数はどの程度ですか?
在庫のあるものは速納となりますが、平均的には 3-4日と見て下さい。
但し、一部の調査レポートでは、発注を受けた段階で内容更新をして納品をする場合もあります。
発注をする前のお問合せをお願いします。
注文の手続きはどのようになっていますか?
1)お客様からの御問い合わせをいただきます。
2)見積書やサンプルの提示をいたします。
3)お客様指定、もしくは弊社の発注書をメール添付にて発送してください。
4)データリソース社からレポート発行元の調査会社へ納品手配します。
5) 調査会社からお客様へ納品されます。最近は、pdfにてのメール納品が大半です。
お支払方法の方法はどのようになっていますか?
納品と同時にデータリソース社よりお客様へ請求書(必要に応じて納品書も)を発送いたします。
お客様よりデータリソース社へ(通常は円払い)の御振り込みをお願いします。
請求書は、納品日の日付で発行しますので、翌月最終営業日までの当社指定口座への振込みをお願いします。振込み手数料は御社負担にてお願いします。
お客様の御支払い条件が60日以上の場合は御相談ください。
尚、初めてのお取引先や個人の場合、前払いをお願いすることもあります。ご了承のほど、お願いします。
データリソース社はどのような会社ですか?
当社は、世界各国の主要調査会社・レポート出版社と提携し、世界各国の市場調査レポートや技術動向レポートなどを日本国内の企業・公官庁及び教育研究機関に提供しております。
世界各国の「市場・技術・法規制などの」実情を調査・収集される時には、データリソース社にご相談ください。
お客様の御要望にあったデータや情報を抽出する為のレポート紹介や調査のアドバイスも致します。
|
|


