経鼻薬物送達技術市場レポート:2023-2033
Nasal Drug Delivery Technology Market Report 2023-2033
レポート詳細
経鼻薬物送達技術の市場レポート 2022-2033年 : 本レポートは、業界とその基礎となる力学をよりよく理解したい場合、新たな収益ポケットを目指す大手企業にとって貴重なものとなるでし... もっと見る
※上記価格は部署ライセンス(Departmental licence)価格です。
その他の価格についてはデータリソースまでお問合せください。
日本語のページは自動翻訳を利用し作成しています。
実際のレポートは英文のみでご納品いたします。

|
サマリー
レポート詳細
経鼻薬物送達技術の市場レポート 2022-2033年: 本レポートは、業界とその基礎となる力学をよりよく理解したい場合、新たな収益ポケットを目指す大手企業にとって貴重なものとなるでしょう。異業種への進出や新地域での既存事業の拡大を目指す企業にとっても有益なレポートです。
代替薬物送達方法に対する需要の高まりと製品開発の進歩が市場成長を促進する
経鼻物送達技術市場を促進する主な要因として、より優れた薬物送達方法に対する需要の急増、製品の梱包と開発の進歩などが挙げられます。さらに、アレルギー性鼻炎の有病率の上昇や喘息の患者数の増加が、市場の成長を促進すると予想されます。一方、ジェネリック鼻腔用医薬品の採用が増加し、新薬が発売されることで、市場の成長がさらに促進されると予想されます。成功する鼻腔用医薬品の開発には、製剤開発、デバイス設計、臨床試験設計、規制遵守、商業化など、さまざまな分野の専門知識が必要です。市場関係者は、効果的な点鼻薬に対する市場の需要の高まりに対応するため、契約や合併などの戦略的パートナーシップを締結しています。鼻腔用薬剤を開発している多くの製薬会社は、特定の薬剤製剤に最適化された鼻腔送達デバイスを設計・製造するためにデバイスメーカーと提携しています。
一方、医薬品の製造は、消費者の安全に関する厳しい規制のもとに行われています。また、医療機器や医薬品の承認には、長い時間と手間がかかる。新商品を市場に投入するために多大な研究開発を行う企業にとって、これはハードルの高いことです。このような厳しい規制は、予測期間中、この市場の成長を妨げると予想されます。
点鼻薬の使い過ぎによる合併症が市場成長の妨げになる可能性が高い
点鼻薬の使い過ぎは様々な副作用を引き起こす可能性があり、その中には深刻なものもある。鼻づまり、鼻血、鼻粘膜の炎症などは、点鼻薬の過剰使用による副作用の一部です。多くの人は、点鼻薬は市販薬として広く入手できるため、安全に使用できると誤解しており、点鼻薬に関連する潜在的な副作用や依存症について無知です。点鼻薬の常用者は、薬を乱用する習慣を身につけがちです。症状が悪化すると、処方された薬を服用する頻度が高くなり、薬性鼻炎という疾患になることが頻繁にあります。また、誤用した場合、鼻の内壁に穴が開く「鼻中隔穿孔(びちゅうかくせんこう)」という状態になることも少なくありません。
マーケットリサーチレポートを購入する前に、どのような質問をするべきか?
- 経鼻薬物送達技術市場はどのように進化しているのか?
- 経鼻薬物送達技術市場を牽引し、抑制しているものは何か?
- 経鼻薬物送達技術の各サブマーケットセグメントは予測期間中にどのように成長し、2033年にこれらのサブマーケットが占める収益はどの程度になるのか?
- 2023年から2033年にかけて、経鼻薬物送達技術の各サブマーケットの市場シェアはどのように推移するのか?
- 2023年から2033年にかけて、市場全体の主な牽引役となるのは何か?
- 経鼻薬物送達技術の主要市場はマクロ経済ダイナミクスに広く追随するのか、それとも個々の国別市場が他を凌駕するのか?
- 2033年までに各国市場のシェアはどのように変化し、2033年に市場をリードするのはどの地域か?
- 主要プレイヤーは誰で、予測期間中の見通しはどうなっているのか?
- これらの主要企業の経鼻薬物送達技術プロジェクトは何か?
- 2022年から2033年の間に、業界はどのように進化していくのでしょうか?現在および今後10年間に行われる経鼻薬物送達技術のプロジェクトはどのような意味を持つのか?
- 経鼻薬物送達技術市場をさらに拡大するために、製品の商業化の必要性は高まっているのか?
- 経鼻薬物送達技術市場の方向性と、市場の最前線に立つためにはどうしたらよいか?
- 新製品やサービスラインに対する最適な投資オプションは何か?
- 企業を新たな成長軌道に乗せ、C-suiteに移行させるための重要な展望は何か?
このことが、現在、そして今後10年間の経鼻薬物送達技術市場にどのような影響を与えるかを知る必要があります:
- 397ページに及ぶ本レポートでは、141の表と251のチャート/グラフを独占的に提供します。
- 本レポートでは、業界における主要な収益性の高い分野を取り上げているため、今すぐその分野をターゲットにすることができます。
- 世界、地域、国の売上と成長を詳細に分析しています。
- 競合他社が成功した主要なトレンド、変化、収益予測をハイライトしています。
本レポートは、経鼻薬物送達技術が今後10年間でどのように発展していくか、またCOVID-19の景気後退や景気回復の変動に合わせて、今日あなたにお伝えします。この市場は、過去10年間のどの時点よりも今がより重要です。
2033年までの予測やその他の分析により、商業的な展望を明らかにする。
- 今回の調査では、2033年までの収益予測に加え、直近の実績、成長率、市場シェアも掲載しています。
- ビジネスの展望や展開など、独自の分析がご覧いただけます。
- 定性的分析(市場力学、促進要因、機会、阻害要因、課題など)、コスト構造、経鼻薬物送達技術の価格上昇の影響、最近の動向などをご覧いただけます。
本レポートでは、COVID-19が業界や貴社にどのような影響を与えるかについて、データ分析および貴重な知見を提供しています。COVID-19の4つの回収パターン、すなわち「V」「L」「W」「U」の回収パターンとその影響について考察しています。
報告書の対象セグメント
容器
- 加圧容器
- 非加圧容器
システム
- 鼻腔用2剤式
- 鼻腔用複合投与
- 鼻腔用単回投与
投与形態
- 点鼻薬
- 点鼻薬・液剤
- 鼻腔用ジェル
- 鼻腔用粉末
- その他
用途
・ 呼吸器疾患
- アレルギー性鼻炎
- 鼻づまり
- 気管支喘息
- その他
・非呼吸器系疾患
- アルツハイマー型認知症
- 循環器疾患
- 神経精神医学
- その他
エンドユーザー
- 在宅医療
- 病院
- 専門医院
- 予防接種センター
- 外来手術センター
- その他
世界市場全体およびセグメントの収益予測に加え、5つの地域および29の主要国市場の収益予測も掲載しています:
北米
- アメリカ
- カナダ
欧州
- ドイツ
- 英国
- フランス
- イタリア
- スペイン
- ロシア
- オランダ
- スイス
- その他の欧州地域
アジア太平洋地域
- 日本
- 中国
- インド
- オーストラリア
- 韓国
- シンガポール
- タイ
- その他のアジア太平洋地域
ラテンアメリカ
- ブラジル
- メキシコ
- アルゼンチン
- コロンビア
- チリ
- その他のラテンアメリカ地域
MEA
- GCC
- 南アフリカ
- トルコ
- エジプト
- その他のMEAの地域
レポートには、経鼻薬物送達技術市場の2023年から2033年にかけての主要企業のプロファイルと、これらの企業のこのセグメントに焦点を当てたいくつかの企業も含まれています。
主要企業と市場成長の可能性
・ AptarGroup, Inc
・ AstraZeneca PLC
・ Bayer AG
・ Becton, Dickinson, and Company
・ Dr. Reddy’s Laboratories Ltd.
・ Flo Nasal Solution
・ GlaxoSmithKline PLC
・ H&T Presspart
・ Johnson & Johnson
・ Merck & Co., Inc.
・ Naveh Pharma Ltd
・ Nemera
・ Novartis AG
・ Neurelis Inc.
・ OptiNose, Inc.
・ Pfizer Inc.
・ PendoPharm Inc.
・ Recipharm AB
・ Teleflex, Inc.
・ Teva Pharmaceutical Industries Ltd.
経鼻薬物送達技術市場の世界全体の収益、金額ベースで2023年から2033年まで、市場は2022年に700億米ドルを突破すると、私たちの仕事は計算されます。2033年まで収益が大きく伸びることが予測されます。当社の調査では、最も大きな可能性を秘めた企業を特定しています。彼らの能力、進歩、商業的展望を知ることで、常に先を行くことができるようになります。
経鼻薬物送達技術市場、2023年から2033年までのレポートはどのように役立つのでしょうか?
要約すると、397ページのレポートでは、次のような知識を得ることができます:
- 経鼻薬物送達技術市場の2033年までの収益予測、容器、システム、剤形、用途、エンドユーザーの各予測を世界および地域レベルで掲載 - 業界の展望を発見し、投資や収益に最も有利な場所を見つけることができます。
- 5つの地域と30の主要国市場の2033年までの収益予測 - 経鼻薬物送達技術市場の2023年から2033年の市場予測を北米、欧州、アジア太平洋、中南米、MEAでご覧いただけます。また、米国、カナダ、メキシコ、ブラジル、ドイツ、フランス、英国、イタリア、中国、インド、日本、オーストラリアなどの著名な経済圏の市場も予測されています。
- 経鼻物送達技術市場に関わる主要企業20社の企業プロファイルを含む、2023年から2033年までの既存企業および市場参入を目指す企業の展望。
独自の予測による定量・定性分析をご覧いただけます。私たちのレポートだけが持つ情報を入手し、貴重なビジネスインテリジェンスとして情報を得ることができます。
他にはない情報
私たちの新しいレポートがあれば、知識に遅れをとったり、チャンスを逃したりする可能性は低くなります。私たちの仕事があなたの研究、分析、意思決定にどのように役立つかをご覧ください。Visiongainの研究は、経鼻薬物送達技術市場、2023年から2033年、市場をリードする企業のための商業分析を必要とするすべての人のためのものです。データ、トレンド、予測を見つけることができます。
ページTOPに戻る
目次
目次
1 レポートの概要
1.1 研究の目的
1.2 経鼻薬物送達技術市場の紹介
1.3 本レポートが提供するもの
1.4 本レポートを読むべき理由
1.5 本分析レポートが回答する主な疑問点
1.6 本レポートは誰のためのものなのか?
1.7 方法論
1.7.1 市場の定義
1.7.2 市場評価・予測手法
1.7.3 データの妥当性確認
1.7.3.1 一次調査
1.7.3.2 二次調査
1.8 よくある質問(FAQ)
1.9 Visiongainの関連レポート
1.10 Visiongainについて
2 エグゼクティブサマリー
3 市場の概要
3.1 主要な調査結果
3.2 マーケットダイナミクス
3.2.1 市場牽引要因
3.2.1.1 アレルギー性鼻炎の有病率の高さが需要を喚起する
3.2.1.2 多剤式点鼻薬パッケージによる複数の利点が業界の成長を促進する
3.2.1.3 慢性呼吸器疾患は市場成長を促進する
3.2.1.4 吸入・点鼻薬のジェネリック医薬品へのニーズが産業成長を促進する
3.2.1.5 呼吸器疾患医療啓発のための政府・NGOによるサポートが市場成長を促進する
3.2.1.6 高度な吸入方法による市場成長の促進
3.2.2 市場抑制要因
3.2.2.1 製品開発規制が市場成長を抑制する可能性が高い
3.2.2.2 鼻腔スプレーの使い過ぎに伴う合併症
3.2.3 市場機会
3.2.3.1 鼻腔用デバイスの新たなビジネスチャンス
3.2.3.2 鼻腔内薬物送達は、局所作用型および全身作用型薬物のための汎用性の高い投与方法として発展してきた
3.2.3.3 ジェネリック医薬品の需要増が市場成長を促進する見込み
3.2.3.4 DPI技術が鼻腔用医薬品の採用を促進する
3.3 COVID-19影響度分析
3.4 ポーターのファイブフォース分析
3.4.1 サプライヤーのバーゲニングパワー
3.4.2 バイヤーのバーゲニングパワー
3.4.3 競合他社のライバル関係
3.4.4 代替品による脅威
3.4.5 新規参入の脅威
3.5 PEST分析
4 経鼻薬物送達技術市場分析:容器別
4.1 主要な調査結果
4.2 容器セグメント 市場魅力度指数
4.3 経鼻薬物送達技術の容器別市場規模推定と予測
4.4 加圧容器
4.4.1 2023-2033年の地域別市場規模(US$ Billion)
4.4.2 地域別市場シェア、2023年・2033年(%)
4.5 非加圧容器
4.5.1 地域別市場規模、2023年~2033年(US$ Billion)
4.5.2 地域別市場シェア、2023年&2033年(%)
5 経鼻薬物送達技術市場分析:システム別
5.1 主要な調査結果
5.2 システムセグメント別 市場魅力度指数
5.3 経鼻薬物送達技術のシステム別市場規模推定と予測
5.4 鼻腔用バイドーズ
5.4.1 2023-2033年の地域別市場規模(US$ Billion)
5.4.2 地域別市場シェア、2023年・2033年(%)
5.5 鼻腔用複合投与
5.5.1 2023-2033年の地域別市場規模(US$ Billion)
5.5.2 地域別市場シェア、2023年&2033年(%)
5.6 鼻腔用単回投与
5.6.1 2023年~2033年の地域別市場規模(US$ Billion)
5.6.2 地域別市場シェア、2023年&2033年(%)
6 経鼻薬物送達技術市場分析:剤形別
6.1 主要な調査結果
6.2 剤形別市場魅力度指数
6.3 経鼻薬物送達技術の投与形態別市場規模推定と予測
6.4 鼻腔用スプレー
6.4.1 2023〜2033年の地域別市場規模(US$ Billion)
6.4.2 地域別市場シェア、2023年・2033年(%)
6.5 点鼻薬・リキッド
6.5.1 2023-2033年地域別市場規模(US$ Billion)
6.5.2 地域別市場シェア、2023年&2033年(%)
6.6 鼻腔用ジェル
6.6.1 2023-2033年の地域別市場規模(US$ Billion)
6.6.2 地域別市場シェア、2023年&2033年(%)
6.7 鼻腔用パウダー
6.7.1 2023-2033年の地域別市場規模(US$ Billion)
6.7.2 地域別市場シェア、2023年&2033年(%)
6.8 その他
6.8.1 2023年〜2033年の地域別市場規模(US$ Billion)
6.8.2 地域別市場シェア、2023年&2033年(%)
7 経鼻薬物送達技術市場分析:用途別
7.1 主要な調査結果
7.2 用途別セグメント 市場魅力度指数
7.3 経鼻薬物送達技術の用途別市場規模推定と予測
7.4 呼吸器系疾患
7.4.1 地域別市場規模、2023〜2033年(US$ Billion)
7.4.2 地域別市場シェア、2023年&2033年(%)
7.4.3 アレルギー性鼻炎
7.4.3.1 地域別市場規模、2023年~2033年(US$ Billion)
7.4.3.2 地域別市場シェア、2023年&2033年(%)
7.4.4 鼻づまり
7.4.4.1 地域別市場規模、2023年〜2033年(US$ Billion)
7.4.4.2 地域別市場シェア、2023年&2033年(%)
7.4.5 気管支喘息
7.4.5.1 シムビコートの最初のジェネリック医薬品が喘息とCOPDの治療薬としてFDAに承認される
7.4.5.2 地域別市場規模、2023年〜2033年(US$ Billion)
7.4.5.3 地域別市場シェア、2023年&2033年(%)
7.4.6 その他
7.4.6.1 COPD
7.4.6.2 ルパン、米国で呼吸器疾患用点鼻薬を上市
7.4.6.3 コビッド 19
7.4.6.4 地域別市場規模、2023-2033年(US$ Billion)
7.4.6.5 地域別市場シェア、2023年&2033年(%)
7.5 非呼吸器系疾患
7.5.1 地域別市場規模、2023年〜2033年(US$ Billion)
7.5.2 地域別市場シェア、2023年&2033年(%)
7.5.3 アルツハイマー型認知症
7.5.3.1 地域別市場規模、2023年~2033年(US$ Billion)
7.5.3.2 地域別市場シェア、2023年&2033年(%)
7.5.4 心血管系疾患
7.5.4.1 地域別市場規模、2023年〜2033年(US$ Billion)
7.5.4.2 地域別市場シェア、2023年&2033年(%)
7.5.5 神経精神科領域
7.5.5.1 地域別市場規模、2023年〜2033年(US$ Billion)
7.5.5.2 地域別市場シェア、2023年&2033年(%)
7.5.6 その他
7.5.6.1 地域別市場規模、2023年~2033年(US$ Billion)
7.5.6.2 地域別市場シェア、2023年&2033年(%)
8 経鼻薬物送達技術市場分析:エンドユーザー別
8.1 主要な調査結果
8.2 エンドユーザセグメント別 市場魅力度指数
8.3 経鼻薬物送達技術のエンドユーザー別市場規模推定と予測
8.4 ホームヘルスケア
8.4.1 地域別市場規模、2023〜2033年(US$ Billion)
8.4.2 地域別市場シェア、2023年&2033年(%)
8.5 ホスピタル
8.5.1 2023-2033年地域別市場規模(US$ Billion)
8.5.2 2023年および2033年の地域別市場シェア(%)
8.6 スペシャリティクリニック
8.6.1 2023-2033年地域別市場規模(US$ Billion)
8.6.2 地域別市場シェア、2023年&2033年(%)
8.7 ワクチン接種センター
8.7.1 2023-2033年地域別市場規模(US$ Billion)
8.7.2 地域別市場シェア、2023年&2033年(%)
8.8 外来手術センター
8.8.1 2023年~2033年の地域別市場規模(US$ Billion)
8.8.2 地域別市場シェア、2023年&2033年(%)
8.9 その他
8.9.1 2023年~2033年の地域別市場規模(US$ Billion)
8.9.2 地域別市場シェア、2023年&2033年(%)
9 経鼻薬物送達技術市場分析:地域別
9.1 主要な調査結果
9.2 地域別市場規模の推定と予測
10 北米の経鼻薬物送達技術市場分析
10.1 主要な調査結果
10.2 北米の経鼻薬物送達技術市場魅力度指数
10.3 北米経鼻薬物送達技術の国別市場:2023年、2028年、2033年(US$ Billion)
10.4 北米経鼻薬物送達技術の国別市場規模推定と予測
10.5 北米経鼻薬物送達技術の容器別市場規模推定と予測
10.6 北米経鼻薬物送達技術のシステム別市場規模推定と予測
10.7 北米経鼻薬物送達技術の剤形別市場規模推定と予測
10.8 北米経鼻薬物送達技術の用途別市場規模推定と予測
10.9 北米経鼻薬物送達技術の呼吸器疾患別市場規模推定と予測
10.10 北米経鼻薬物送達技術の非呼吸器系疾患別市場規模推定と予測
10.11 北米経鼻薬物送達技術のエンドユーザー別市場規模推定と予測
10.12 米国経鼻薬物送達技術市場分析
10.13 カナダ経鼻薬物送達技術市場の分析
11 欧州の経鼻薬物送達技術市場分析
11.1 主要な調査結果
11.2 欧州の経鼻薬物送達技術市場魅力度指数
11.3 欧州の経鼻薬物送達技術の国別市場規模、2023年、2028年&2033年(US$ Billion)
11.4 欧州の経鼻薬物送達技術の国別市場規模推定と予測
11.5 欧州の経鼻薬物送達技術の容器別市場市場規模推定と予測
11.6 欧州の経鼻薬物送達技術のシステム別市場規模推定と予測
11.7 欧州の経鼻薬物送達技術の剤形別市場規模推定と予測
11.8 欧州の経鼻薬物送達技術の用途別市場規模推定と予測
11.9 欧州の経鼻薬物送達技術の呼吸器疾患別市場規模推定と予測
11.10 欧州の経鼻薬物送達技術の非呼吸器系疾患別市場規模推定と予測
11.11 欧州の経鼻薬物送達技術のエンドユーザー別市場規模推定と予測
11.12 ドイツの経鼻薬物送達技術の市場分析
11.13 イギリスの経鼻薬物送達技術の市場分析
11.14 フランスの経鼻薬物送達技術の市場分析
11.15 イタリアの経鼻薬物送達技術の市場分析
11.16 スペイン経鼻薬物送達技術の市場分析
11.17 ロシア経鼻薬物送達技術市場の分析
11.18 オランダの経鼻薬物送達技術の市場分析
11.19 スイスの経鼻薬物送達技術の市場分析
11.20 その他の欧州の経鼻薬物送達技術の市場分析
12 アジアの経鼻薬物送達技術市場分析
12.1 主要な調査結果
12.2 経鼻薬物送達技術のアジア市場魅力度指数
12.3 アジアの経鼻薬物送達技術の国別市場、2023年、2028年、2033年(US$ Billion)
12.4 アジアの経鼻薬物送達技術の国別市場規模推定と予測
12.5 アジアの経鼻薬物送達技術の容器別市場規模推定と予測
12.6 アジアの経鼻薬物送達技術のシステム別市場規模推定と予測
12.7 アジアの経鼻薬物送達技術の剤形別市場規模推定と予測
12.8 アジアの経鼻薬物送達技術の用途別市場規模推定と予測
12.9 アジアの経鼻薬物送達技術の呼吸器疾患別市場規模推定と予測
12.10 アジアの経鼻薬物送達技術の非呼吸器系疾患別市場規模推定と予測
12.11 アジアの経鼻薬物送達技術のエンドユーザー別市場規模推定と予測
12.12 日本 経鼻薬物送達技術市場分析
12.13 中国 経鼻薬物送達技術市場の分析
12.14 インド 経鼻薬物送達技術市場の分析
12.15 オーストラリア 経鼻薬物送達技術市場の分析
12.16 韓国 経鼻薬物送達技術市場の分析
12.17 シンガポール経鼻薬物送達技術市場分析
12.18 タイ 経鼻薬物送達技術市場の分析
12.19 その他のアジア地域の経鼻薬物送達技術市場の分析
13 ラテンアメリカの経鼻薬物送達技術市場分析
13.1 主要な調査結果
13.2 ラテンアメリカの経鼻薬物送達技術市場魅力度指数
13.3 ラテンアメリカ経鼻薬物送達技術の国別市場2023年、2028年、2033年(US$ Billion)
13.4 ラテンアメリカ経鼻薬物送達技術の国別市場規模推定と予測
13.5 ラテンアメリカ経鼻薬物送達技術の容器別市場規模推定と予測
13.6 ラテンアメリカ経鼻薬物送達技術のシステム別市場規模推定と予測
13.7 ラテンアメリカ経鼻薬物送達技術の剤形別市場規模推定と予測
13.8 ラテンアメリカ経鼻薬物送達技術の用途別市場規模推定と予測
13.9 ラテンアメリカ経鼻薬物送達技術の呼吸器疾患別市場規模推定と予測
13.10 ラテンアメリカ経鼻薬物送達技術の非呼吸器系疾患別市場規模推定と予測
13.11 ラテンアメリカ経鼻薬物送達技術のエンドユーザー別市場規模推定と予測
13.12 ブラジル経鼻薬物送達技術市場分析
13.13 メキシコ経鼻薬物送達技術市場分析
13.14 アルゼンチン経鼻薬物送達技術市場の分析
13.15 コロンビアの経鼻薬物送達技術の市場分析
13.16 チリ経鼻薬物送達技術市場の分析
13.17 その他のラテンアメリカの経鼻薬物送達技術の市場分析
14 MEAの経鼻薬物送達技術市場分析
14.1 主要な調査結果
14.2 MEAの経鼻薬物送達技術市場魅力度指数
14.3 MEAの経鼻薬物送達技術の国別市場:2023年、2028年、2033年 (US$ Billion)
14.4 MEAの経鼻薬物送達技術の国別市場規模推定と予測
14.5 MEAの経鼻薬物送達技術の容器別市場規模推定と予測
14.6 MEAの経鼻薬物送達技術のシステム別市場規模推定と予測
14.7 MEAの経鼻薬物送達技術の剤形別市場規模推定と予測
14.8 MEAの経鼻薬物送達技術の用途別市場規模推定と予測
14.9 MEAの経鼻薬物送達技術の呼吸器疾患別市場規模推定と予測:
14.10 MEAの経鼻薬物送達技術の非呼吸器系疾患別市場規模推定と予測
14.11 MEAの経鼻薬物送達技術のエンドユーザー別市場規模推定と予測
14.12 GCC経鼻薬物送達技術の市場分析
14.13 南アフリカ経鼻薬物送達技術の市場分析
14.14 トルコ経鼻薬物送達技術の市場分析
14.15 エジプト経鼻薬物送達技術市場の分析
14.16 その他のMEAの経鼻薬物送達技術市場の分析
15 会社概要
15.1 競争環境、2022年
15.2 戦略的な展望
15.3 Becton, Dickinson, and Company
15.3.1 企業スナップショット
15.3.2 会社概要
15.3.3 財務分析
15.3.3.1 純収益、2017年~2022年
15.3.3.2 R&D、2017年~2022年
15.3.3.3 地域別市場シェア、2022年
15.3.3.4 セグメント別市場シェア、2022年
15.3.4 製品のベンチマーキング
15.4 GSK plc
15.4.1 企業スナップショット
15.4.2 会社概要
15.4.3 財務分析
15.4.3.1 純収益、2017-2022年
15.4.3.2 R&D、2017年〜2022年
15.4.3.3 地域別市場シェア、2022年
15.4.3.4 事業セグメント別市場シェア、2022年
15.4.4 製品のベンチマーキング
15.5 Johnson & Johnson
15.5.1 企業スナップショット
15.5.2 会社概要
15.5.3 財務分析
15.5.3.1 純収益、2017-2022年
15.5.3.2 R&D、2017年~2022年
15.5.3.3 地域別市場シェア、2022年
15.5.3.4 事業セグメント別市場シェア、2022年
15.5.4 製品のベンチマーキング
15.5.5 戦略的な展望
15.6 Merck & Co., Inc
15.6.1 企業スナップショット
15.6.2 会社概要
15.6.3 財務分析
15.6.3.1 純収益、2017年〜2022年
15.6.3.2 R&D、2017年〜2022年
15.6.3.3 地域別市場シェア、2022年
15.6.3.4 事業セグメント別市場シェア、2022年
15.6.4 製品のベンチマーキング
15.7 Novartis AG
15.7.1 企業スナップショット
15.7.2 会社概要
15.7.3 財務分析
15.7.3.1 純収益、2017-2022年
15.7.3.2 R&D、2017年〜2022年
15.7.3.3 地域別市場シェア、2022年
15.7.3.4 事業セグメント別市場シェア、2022年
15.7.4 製品のベンチマーキング
15.8 Teva Pharmaceutical Industries Ltd.
15.8.1 企業スナップショット
15.8.2 会社概要
15.8.3 財務分析
15.8.3.1 純収入、2017-2022年
15.8.3.2 R&D、2017年〜2022年
15.8.3.3 地域別市場シェア、2022年
15.8.3.4 事業セグメント別市場シェア、2022年
15.8.4 製品のベンチマーキング
15.8.5 戦略的な展望
15.9 AptarGroup, Inc
15.9.1 企業スナップショット
15.9.2 会社概要
15.9.3 財務分析
15.9.3.1 純収入、2017-2022年
15.9.3.2 R&D、2017年〜2022年
15.9.3.3 地域別市場シェア、2022年
15.9.3.4 事業セグメント別市場シェア、2022年
15.9.4 製品のベンチマーキング
15.9.5 戦略的な展望
15.10 AstraZeneca PLC
15.10.1 企業スナップショット
15.10.2 会社概要
15.10.3 財務分析
15.10.3.1 純収益、2017年〜2022年
15.10.3.2 R&D、2017年〜2022年
15.10.3.3 地域別市場シェア、2022年
15.10.3.4 事業セグメント別市場シェア、2022年
15.10.4 製品のベンチマーキング
15.10.5 戦略的な展望
15.11 Presspart Verwaltungs GmbH
15.11.1 企業スナップショット
15.11.2 会社概要
15.11.3 製品ベンチマーキング
15.11.4 戦略的な展望
15.12 Recipharm AB
15.12.1 企業スナップショット
15.12.2 会社概要
15.12.3 製品ベンチマーク
15.12.4 戦略的な展望
15.13 Neurelis Inc.
15.13.1 企業スナップショット
15.13.2 概要
15.13.3 ベンチマーキング製品
15.13.4 戦略的な展望
15.14 PendoPharm Inc.
15.14.1 企業スナップショット
15.14.2 会社概要
15.14.3 ベンチマーキング製品
15.15 Naveh Pharma Ltd.
15.15.1 企業スナップショット
15.15.2 会社概要
15.15.3 ベンチマーキング
15.16 Dr. Reddy's Laboratories
15.16.1 カンパニースナップショット
15.16.2 会社概要
15.16.3 財務分析
15.16.3.1 純収益、2017年〜2022年
15.16.3.2 R&D、2017年〜2022年
15.16.3.3 地域別市場シェア、2022年
15.16.3.4 事業セグメント別市場シェア、2022年
15.16.4 製品のベンチマーキング
15.17 Pfizer Inc
15.17.1 企業スナップショット
15.17.2 会社概要
15.17.3 財務分析
15.17.3.1 純収益、2017-2022年
15.17.3.2 R&D、2017年〜2022年
15.17.3.3 地域別市場シェア、2022年
15.17.3.4 事業セグメント別市場シェア、2022年
15.17.4 製品のベンチマーキング
15.17.5 戦略的な展望
15.18 Nemera
15.18.1 企業スナップショット
15.18.2 会社概要
15.18.3 ベンチマーキング製品
15.18.4 戦略的な展望
15.19 Teleflex Incorporated
15.19.1 企業スナップショット
15.19.2 会社概要
15.19.3 ベンチマーキング製品
15.20 Optinose US, Inc
15.20.1 カンパニースナップショット
15.20.2 会社概要
15.20.3 ベンチマーキング
15.21 Flo Nasal Solution
15.21.1 カンパニースナップショット
15.21.2 会社概要
15.21.3 製品ベンチマーク
15.22 Bayer AG
15.22.1 企業スナップショット
15.22.2 会社概要
15.22.3 財務分析
15.22.3.1 純収益、2017-2022年
15.22.3.2 R&D、2017年〜2022年
15.22.3.3 地域別市場シェア、2022年
15.22.3.4 事業セグメント別市場シェア、2022年
15.22.4 製品のベンチマーキング
16 結論と提言
16.1 Visiongainからの結びの言葉
16.2 市場関係者への提言
ページTOPに戻る
図表リスト
表の一覧
Table 1 Nasal drug delivery technology market Snapshot, 2023 & 2033 (US$ Billion, CAGR %)
Table 2 Nasal Drug Delivery Technology Market Forecast by Region, 2023-2033 (US$ Billion, AGR%, CAGR%): “V” Shaped Recovery
Table 3 Nasal Drug Delivery Technology Market Forecast by Region, 2023-2033 (US$ Billion, AGR%, CAGR%): “U” Shaped Recovery
Table 4 Nasal Drug Delivery Technology Market Forecast by Region, 2023-2033 (US$ Billion, AGR%, CAGR%): “W” Shaped Recovery
Table 5 Nasal Drug Delivery Technology Market Forecast by Region, 2023-2033 (US$ Billion, AGR%, CAGR%): “L” Shaped Recovery
Table 6 Nasal Drug Delivery Technology Market Forecast by Containers, 2023-2033 (US$ Billion, AGR%, CAGR%)
Table 1 Pressurized Containers and Commercial Drugs
Table 2 Pressurized Segment Market Forecast by Region, 2023-2033 (US$ Billion, AGR%, CAGR%)
Table 3 Non-pressurized Containers and Commercial OTC Nasal Sprays
Table 4 Non-Pressurized Segment Market Forecast by Region, 2023-2033 (US$ Billion, AGR%, CAGR%)
Table 5 Nasal Drug Delivery Technology Market Forecast by System, 2023-2033 (US$ Billion, AGR%, CAGR%)
Table 6 Nasal Bi Dose Segment Market Forecast by Region, 2023-2033 (US$ Billion, AGR%, CAGR%)
Table 7 Nasal Multi Dose Segment Market Forecast by Region, 2023-2033 (US$ Billion, AGR%, CAGR%)
Table 8 Nasal Uni Dose Segment Market Forecast by Region, 2023-2033 (US$ Billion, AGR%, CAGR%)
Table 9 Nasal Drug Delivery Technology Market Forecast by Dosage Form, 2023-2033 (US$ Billion, AGR%, CAGR%)
Table 2 Nasal Spray Segment Market Forecast by Region, 2023-2033 (US$ Billion, AGR%, CAGR%)
Table 3 Nasal Drops and Liquid Segment Market Forecast by Region, 2023-2033 (US$ Billion, AGR%, CAGR%)
Table 4 Nasal Gels Segment Market Forecast by Region, 2023-2033 (US$ Billion, AGR%, CAGR%)
Table 5 Nasal Powder Segment Market Forecast by Region, 2023-2033 (US$ Billion, AGR%, CAGR%)
Table 6 Others Segment Market Forecast by Region, 2023-2033 (US$ Billion, AGR%, CAGR%)
Table 7 Nasal Drug Delivery Technology Market Forecast by Application, 2023-2033 (US$ Billion, AGR%, CAGR%)
Table 8 Respiratory Disorders Segment Market Forecast by Region, 2023-2033 (US$ Billion, AGR%, CAGR%)
Table 9 Allergic Rhinitis Market Forecast by Region, 2023-2033 (US$ Billion, AGR%, CAGR%)
Table 10 Nasal Congestion Segment Market Forecast by Region, 2023-2033 (US$ Billion, AGR%, CAGR%)
Table 11 Asthma Segment Market Forecast by Region, 2023-2033 (US$ Billion, AGR%, CAGR%)
Table 12 Other Respiratory Disorders Segment Market Forecast by Region, 2023-2033 (US$ Billion, AGR%, CAGR%)
Table 13 Non-Respiratory Disorders Segment Market Forecast by Region, 2023-2033 (US$ Billion, AGR%, CAGR%)
Table 14 Alzheimer’s Market Forecast by Region, 2023-2033 (US$ Billion, AGR%, CAGR%)
Table 15 Cardiovascular Disorders Segment Market Forecast by Region, 2023-2033 (US$ Billion, AGR%, CAGR%)
Table 16 Neuropsychiatry Segment Market Forecast by Region, 2023-2033 (US$ Billion, AGR%, CAGR%)
Table 17 Other Non-Respiratory Disorders Segment Market Forecast by Region, 2023-2033 (US$ Billion, AGR%, CAGR%)
Table 18 Nasal Drug Delivery Technology Market Forecast by End-users, 2023-2033 (US$ Billion, AGR%, CAGR%)
Table 19 Home Health Care Segment Market Forecast by Region, 2023-2033 (US$ Billion, AGR%, CAGR%)
Table 20 Hospitals Segment Market Forecast by Region, 2023-2033 (US$ Billion, AGR%, CAGR%)
Table 21 Specialty Clinics Segment Market Forecast by Region, 2023-2033 (US$ Billion, AGR%, CAGR%)
Table 22 Vaccination Centers Segment Market Forecast by Region, 2023-2033 (US$ Billion, AGR%, CAGR%)
Table 23 Ambulatory Surgical Centers Segment Market Forecast by Region, 2023-2033 (US$ Billion, AGR%, CAGR%)
Table 24 Others Segment Market Forecast by Region, 2023-2033 (US$ Billion, AGR%, CAGR%)
Table 25 Nasal Drug Delivery Technology Market Forecast by Region, 2023-2033 (US$ Billion, AGR%, CAGR%)
Table 26 North America Nasal Drug Delivery Technology Market Forecast by Country, 2023-2033 (US$ Billion, AGR%, CAGR%)
Table 27 North America Nasal Drug Delivery Technology Market Forecast by Containers, 2023-2033 (US$ Billion, AGR%, CAGR%)
Table 28 North America Nasal Drug Delivery Technology Market Forecast by System, 2023-2033 (US$ Billion, AGR%, CAGR%)
Table 29 North America Nasal Drug Delivery Technology Market Forecast by Dosage Form, 2023-2033 (US$ Billion, AGR%, CAGR%)
Table 30 North America Nasal Drug Delivery Technology Market Forecast by Application, 2023-2033 (US$ Billion, AGR%, CAGR%)
Table 31 North America Nasal Drug Delivery Technology Market Forecast by Respiratory Diseases, 2023-2033 (US$ Billion, AGR%, CAGR%)
Table 32 North America Nasal Drug Delivery Technology Market Forecast by Non-Respiratory, 2023-2033 (US$ Billion, AGR%, CAGR%)
Table 33 North America Nasal Drug Delivery Technology Market Forecast by End-users, 2023-2033 (US$ Billion, AGR%, CAGR%)
Table 34 U.S. Nasal Drug Delivery Technology Market Forecast, 2023-2033 (US$ Billion, AGR%, CAGR%)
Table 35 Canada Nasal Drug Delivery Technology Market Forecast, 2023-2033 (US$ Billion, AGR%, CAGR%)
Table 36 European Nasal Drug Delivery Technology Market Forecast by Country, 2023-2033 (US$ Billion, AGR%, CAGR%)
Table 37 European Nasal Drug Delivery Technology Market Forecast by Containers, 2023-2033 (US$ Billion, AGR%, CAGR%)
Table 38 European Nasal Drug Delivery Technology Market Forecast by System, 2023-2033 (US$ Billion, AGR%, CAGR%)
Table 39 European Nasal Drug Delivery Technology Market Forecast by Dosage Form, 2023-2033 (US$ Billion, AGR%, CAGR%)
Table 40 European Nasal Drug Delivery Technology Market Forecast by Application, 2023-2033 (US$ Billion, AGR%, CAGR%)
Table 41 European Nasal Drug Delivery Technology Market Forecast by Respiratory Diseases, 2023-2033 (US$ Billion, AGR%, CAGR%)
Table 42 European Nasal Drug Delivery Technology Market Forecast by Non-Respiratory, 2023-2033 (US$ Billion, AGR%, CAGR%)
Table 43 European Nasal Drug Delivery Technology Market Forecast by End-users, 2023-2033 (US$ Billion, AGR%, CAGR%)
Table 44 Germany Nasal Drug Delivery Technology Market Forecast, 2023-2033 (US$ Billion, AGR%, CAGR%)
Table 45 UK Nasal Drug Delivery Technology Market Forecast, 2023-2033 (US$ Billion, AGR%, CAGR%)
Table 46 France Nasal Drug Delivery Technology Market Forecast, 2023-2033 (US$ Billion, AGR%, CAGR%)
Table 47 Italy Nasal Drug Delivery Technology Market Forecast, 2023-2033 (US$ Billion, AGR%, CAGR%)
Table 48 Spain Nasal Drug Delivery Technology Market Forecast, 2023-2033 (US$ Billion, AGR%, CAGR%)
Table 49 Russia Nasal Drug Delivery Technology Market Forecast, 2023-2033 (US$ Billion, AGR%, CAGR%)
Table 50 Netherlands Nasal Drug Delivery Technology Market Forecast, 2023-2033 (US$ Billion, AGR%, CAGR%)
Table 51 Switzerland Nasal Drug Delivery Technology Market Forecast, 2023-2033 (US$ Billion, AGR%, CAGR%)
Table 52 Rest of Europe Nasal Drug Delivery Technology Market Forecast, 2023-2033 (US$ Billion, AGR%, CAGR%)
Table 53 Asia Nasal Drug Delivery Technology Market Forecast by Country, 2023-2033 (US$ Billion, AGR%, CAGR%)
Table 54 Asia Nasal Drug Delivery Technology Market Forecast by Containers, 2023-2033 (US$ Billion, AGR%, CAGR%)
Table 55 Asia Nasal Drug Delivery Technology Market Forecast by System, 2023-2033 (US$ Billion, AGR%, CAGR%)
Table 56 Asia Nasal Drug Delivery Technology Market Forecast by Dosage Form, 2023-2033 (US$ Billion, AGR%, CAGR%)
Table 57 Asia Nasal Drug Delivery Technology Market Forecast by Application, 2023-2033 (US$ Billion, AGR%, CAGR%)
Table 58 Asia Nasal Drug Delivery Technology Market Forecast by Respiratory Diseases, 2023-2033 (US$ Billion, AGR%, CAGR%)
Table 59 Asia Nasal Drug Delivery Technology Market Forecast by Non-Respiratory, 2023-2033 (US$ Billion, AGR%, CAGR%)
Table 60 Asia Nasal Drug Delivery Technology Market Forecast by End-users, 2023-2033 (US$ Billion, AGR%, CAGR%)
Table 61 Japan Nasal Drug Delivery Technology Market Forecast, 2023-2033 (US$ Billion, AGR%, CAGR%)
Table 62 China Nasal Drug Delivery Technology Market Forecast, 2023-2033 (US$ Billion, AGR%, CAGR%)
Table 63 India Nasal Drug Delivery Technology Market Forecast, 2023-2033 (US$ Billion, AGR%, CAGR%)
Table 64 Australia Nasal Drug Delivery Technology Market Forecast, 2023-2033 (US$ Billion, AGR%, CAGR%)
Table 65 South Korea Nasal Drug Delivery Technology Market Forecast, 2023-2033 (US$ Billion, AGR%, CAGR%)
Table 66 Singapore Nasal Drug Delivery Technology Market Forecast, 2023-2033 (US$ Billion, AGR%, CAGR%)
Table 67 Thailand Nasal Drug Delivery Technology Market Forecast, 2023-2033 (US$ Billion, AGR%, CAGR%)
Table 68 Rest of Asia Nasal Drug Delivery Technology Market Forecast, 2023-2033 (US$ Billion, AGR%, CAGR%)
Table 69 Latin America Nasal Drug Delivery Technology Market Forecast by Country, 2023-2033 (US$ Billion, AGR%, CAGR%)
Table 70 Latin America Nasal Drug Delivery Technology Market Forecast by Containers, 2023-2033 (US$ Billion, AGR%, CAGR%)
Table 71 Latin America Nasal Drug Delivery Technology Market Forecast by System, 2023-2033 (US$ Billion, AGR%, CAGR%)
Table 72 Latin America Nasal Drug Delivery Technology Market Forecast by Dosage Form, 2023-2033 (US$ Billion, AGR%, CAGR%)
Table 73 Latin America Nasal Drug Delivery Technology Market Forecast by Application, 2023-2033 (US$ Billion, AGR%, CAGR%)
Table 74 Latin America Nasal Drug Delivery Technology Market Forecast by Respiratory Diseases, 2023-2033 (US$ Billion, AGR%, CAGR%)
Table 75 Latin America Nasal Drug Delivery Technology Market Forecast by Non-Respiratory, 2023-2033 (US$ Billion, AGR%, CAGR%)
Table 76 Latin America Nasal Drug Delivery Technology Market Forecast by End-users, 2023-2033 (US$ Billion, AGR%, CAGR%)
Table 77 Brazil Nasal Drug Delivery Technology Market Forecast, 2023-2033 (US$ Billion, AGR%, CAGR%)
Table 78 Mexico Nasal Drug Delivery Technology Market Forecast, 2023-2033 (US$ Billion, AGR%, CAGR%)
Table 79 Argentina Nasal Drug Delivery Technology Market Forecast, 2023-2033 (US$ Billion, AGR%, CAGR%)
Table 80 Colombia Nasal Drug Delivery Technology Market Forecast, 2023-2033 (US$ Billion, AGR%, CAGR%)
Table 81 Chile Nasal Drug Delivery Technology Market Forecast, 2023-2033 (US$ Billion, AGR%, CAGR%)
Table 82 Rest of Latin America Nasal Drug Delivery Technology Market Forecast, 2023-2033 (US$ Billion, AGR%, CAGR%)
Table 83 MEA Nasal Drug Delivery Technology Market Forecast by Country, 2023-2033 (US$ Billion, AGR%, CAGR%)
Table 84 MEA Nasal Drug Delivery Technology Market Forecast by Containers, 2023-2033 (US$ Billion, AGR%, CAGR%)
Table 85 MEA Nasal Drug Delivery Technology Market Forecast by System, 2023-2033 (US$ Billion, AGR%, CAGR%)
Table 86 MEA Nasal Drug Delivery Technology Market Forecast by Dosage Form, 2023-2033 (US$ Billion, AGR%, CAGR%)
Table 87 MEA Nasal Drug Delivery Technology Market Forecast by Application, 2023-2033 (US$ Billion, AGR%, CAGR%)
Table 88 MEA Nasal Drug Delivery Technology Market Forecast by Respiratory Diseases, 2023-2033 (US$ Billion, AGR%, CAGR%)
Table 89 MEA Nasal Drug Delivery Technology Market Forecast by Non-Respiratory, 2023-2033 (US$ Billion, AGR%, CAGR%)
Table 90 MEA Nasal Drug Delivery Technology Market Forecast by End-users, 2023-2033 (US$ Billion, AGR%, CAGR%)
Table 91 GCC Nasal Drug Delivery Technology Market Forecast, 2023-2033 (US$ Billion, AGR%, CAGR%)
Table 92 South Africa Nasal Drug Delivery Technology Market Forecast, 2023-2033 (US$ Billion, AGR%, CAGR%)
Table 93 Turkey Nasal Drug Delivery Technology Market Forecast, 2023-2033 (US$ Billion, AGR%, CAGR%)
Table 94 Egypt Nasal Drug Delivery Technology Market Forecast, 2023-2033 (US$ Billion, AGR%, CAGR%)
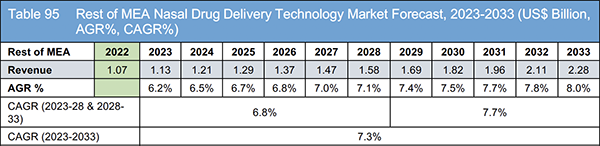
Table 95 Rest of MEA Nasal Drug Delivery Technology Market Forecast, 2023-2033 (US$ Billion, AGR%, CAGR%)
Table 96 Strategic Outlook
Table 97 Becton Dickinson and Company: Key Details, (CEO, HQ, Revenue, Founded, No. of Employees, Company Type, Website, Business Segment)
Table 98 AbbVie: Product Benchmarking
Table 99 GSK plc: Key Details, (CEO, HQ, Revenue, Founded, No. of Employees, Company Type, Website, Business Segment)
Table 100 GSK plc: Product Benchmarking
Table 101 Johnson & Johnson: Key Details, (CEO, HQ, Revenue, Founded, No. of Employees, Company Type, Website, Business Segment)
Table 102 Johnson & Johnson: Product Benchmarking
Table 103 Johnson & Johnson: Strategic Outlook
Table 104 Merck & Co. Inc: Key Details, (CEO, HQ, Revenue, Founded, No. of Employees, Company Type, Website, Business Segment)
Table 105 Merck & Co., Inc: Product Benchmarking
Table 106 Novartis AG: Key Details, (CEO, HQ, Revenue, Founded, No. of Employees, Company Type, Website, Business Segment)
Table 107 Novartis AG: Product Benchmarking
Table 108 Teva Pharmaceutical: Key Details, (CEO, HQ, Revenue, Founded, No. of Employees, Company Type, Website, Business Segment)
Table 109 Teva Pharmaceutical Industries Ltd: Product Benchmarking
Table 110 Teva Pharmaceutical Industries Ltd: Strategic Outlook
Table 111 AptarGroup Inc: Key Details, (CEO, HQ, Revenue, Founded, No. of Employees, Company Type, Website, Business Segment)
Table 112 AptarGroup Inc.: Product Benchmarking
Table 113 AptarGroup Inc.: Strategic Outlook
Table 114 AstraZeneca Plc: Key Details, (CEO, HQ, Revenue, Founded, No. of Employees, Company Type, Website, Business Segment)
Table 115 AstraZeneca PLC: Product Benchmarking
Table 116 AstraZeneca PLC: Strategic Outlook
Table 117 Presspart Verwaltungs GmbH: Key Details, (CEO, HQ, Revenue, Founded, No. of Employees, Company Type, Website, Business Segment)
Table 118 Presspart Verwaltungs GmbH: Product Benchmarking
Table 119 Presspart Verwaltungs GmbH: Strategic Outlook
Table 120 Recipharm AB: Key Details, (CEO, HQ, Revenue, Founded, No. of Employees, Company Type, Website, Business Segment)
Table 121 Recipharm AB: Product Benchmarking
Table 122 Recipharm AB: Strategic Outlook
Table 123 Neurelis Inc: Key Details, (CEO, HQ, Revenue, Founded, No. of Employees, Company Type, Website, Business Segment)
Table 124 Neurelis Inc: Product Benchmarking
Table 125 Neurelis Inc: Strategic Outlook
Table 126 PendoPharm Inc: Key Details, (CEO, HQ, Revenue, Founded, No. of Employees, Company Type, Website, Business Segment)
Table 127 PendoPharm Inc.: Product Benchmarking
Table 128 Naveh Pharma Ltd: Key Details, (CEO, HQ, Revenue, Founded, No. of Employees, Company Type, Website, Business Segment)
Table 129 Naveh Pharma Ltd: Product Benchmarking
Table 130 Dr Reddy: Key Details, (CEO, HQ, Revenue, Founded, No. of Employees, Company Type, Website, Business Segment)
Table 131 Dr. Reddy's Laboratories: Product Benchmarking
Table 132 Pfizer Inc: Key Details, (CEO, HQ, Revenue, Founded, No. of Employees, Company Type, Website, Business Segment)
Table 133 Pfizer Inc: Product Benchmarking
Table 134 Pfizer Inc: Strategic Outlook
Table 135 Nemera: Key Details, (CEO, HQ, Revenue, Founded, No. of Employees, Company Type, Website, Business Segment)
Table 136 Nemera: Product Benchmarking
Table 137 Nemera: Strategic Outlook
Table 138 Teleflex Incorporated: Key Details, (CEO, HQ, Revenue, Founded, No. of Employees, Company Type, Website, Business Segment)
Table 139 Teleflex Incorporated: Product Benchmarking
Table 140 Optinose US Inc: Key Details, (CEO, HQ, Revenue, Founded, No. of Employees, Company Type, Website, Business Segment)
Table 141 Optinose US Inc: Product Benchmarking
Table 142 ENT Technologies: Key Details, (CEO, HQ, Revenue, Founded, No. of Employees, Company Type, Website, Business Segment)
Table 143 Flo Nasal Solution: Product Benchmarking
Table 144 Bayer AG: Key Details, (CEO, HQ, Revenue, Founded, No. of Employees, Company Type, Website, Business Segment)
Table 145 Bayer AG: Product Benchmarking
図の一覧
Figure 1 Nasal Drug Delivery Technology Market Segmentation
Figure 2 Nasal Drug Delivery Technology Market by Containers: Market Attractiveness Index
Figure 3 Nasal Drug Delivery Technology Market by System: Market Attractiveness Index
Figure 4 Nasal Drug Delivery Technology Market by Dosage Form: Market Attractiveness Index
Figure 5 Nasal Drug Delivery Technology Market by Application: Market Attractiveness Index
Figure 6 Nasal Drug Delivery Technology Market by Respiratory diseases: Market Attractiveness Index
Figure 7 Nasal Drug Delivery Technology Market by Non-Respiratory: Market Attractiveness Index
Figure 8 Nasal Drug Delivery Technology Market by End-users: Market Attractiveness Index
Figure 9 Nasal drug delivery technology market Attractiveness Index by Region
Figure 10 Nasal drug delivery technology Market: Market Dynamics
Figure 11 Nasal Drug Delivery Technology Market by Region, 2023-2033 (US$ Billion, AGR %): “V” Shaped Recovery
Figure 12 Nasal Drug Delivery Technology Market by Region, 2023-2033 (US$ Billion, AGR %): “U” Shaped Recovery
Figure 13 Nasal Drug Delivery Technology Market by Region, 2023-2033 (US$ Billion, AGR %): “W” Shaped Recovery
Figure 14 Nasal Drug Delivery Technology Market by Region, 2023-2033 (US$ Billion, AGR %): “L” Shaped Recovery
Figure 15 Nasal Drug Delivery Technology Market: Porter’s Five Forces Analysis
Figure 16 Nasal Drug Delivery Technology Market: PEST Analysis
Figure 17 Nasal Drug Delivery Technology Market by Container: Market Attractiveness Index
Figure 18 Nasal Drug Delivery Technology Market Forecast by Containers, 2023-2033 (US$ Billion, AGR %)
Figure 19 Nasal drug delivery technology market Share Forecast by Containers, 2023, 2028, 2033 (%)
Figure 20 Pressurized Segment Market Forecast by Region, 2023-2033 (US$ Billion, AGR %)
Figure 21 Pressurized Segment Market Share Forecast by Region, 2023 & 2033 (%)
Figure 22 Non-Pressurized Segment Market Forecast by Region, 2023-2033 (US$ Billion, AGR %)
Figure 23 Non-Pressurized Segment Market Share Forecast by Region, 2023 & 2033 (%)
Figure 24 Nasal Drug Delivery Technology Market by System: Market Attractiveness Index
Figure 25 Nasal Drug Delivery Technology Market Forecast by System, 2023-2033 (US$ Billion, AGR %)
Figure 26 Nasal drug delivery technology market Share Forecast by System, 2023, 2028, 2033 (%)
Figure 27 Nasal Bi Dose Segment Market Forecast by Region, 2023-2033 (US$ Billion, AGR %)
Figure 28 Nasal Bi Dose Segment Market Share Forecast by Region, 2023 & 2033 (%)
Figure 29 Nasal Multi Dose Segment Market Forecast by Region, 2023-2033 (US$ Billion, AGR %)
Figure 30 Nasal Multi Dose Segment Market Share Forecast by Region, 2023 & 2033 (%)
Figure 31 Nasal Uni Dose Segment Market Forecast by Region, 2023-2033 (US$ Billion, AGR %)
Figure 32 Nasal Uni Dose Segment Market Share Forecast by Region, 2023 & 2033 (%)
Figure 33 Nasal Drug Delivery Technology Market by Dosage Form: Market Attractiveness Index
Figure 34 Nasal Drug Delivery Technology Market Forecast by Dosage Form, 2023-2033 (US$ Billion, AGR %)
Figure 35 Nasal drug delivery technology market Share Forecast by Dosage Form, 2023, 2028, 2033 (%)
Figure 36 Nasal Spray Segment Market Forecast by Region, 2023-2033 (US$ Billion, AGR %)
Figure 37 Nasal Spray Segment Market Share Forecast by Region, 2023 & 2033 (%)
Figure 38 Nasal Drops and Liquid Segment Market Forecast by Region, 2023-2033 (US$ Billion, AGR %)
Figure 39 Nasal Drops and Liquid Segment Market Share Forecast by Region, 2023 & 2033 (%)
Figure 40 Nasal Gels Segment Market Forecast by Region, 2023-2033 (US$ Billion, AGR %)
Figure 41 Non-pressurized Containers Segment Market Share Forecast by Region, 2023 & 2033 (%)
Figure 42 Nasal Powder Segment Market Forecast by Region, 2023-2033 (US$ Billion, AGR %)
Figure 43 Nasal Powder Segment Market Share Forecast by Region, 2023 & 2033 (%)
Figure 44 Others Segment Market Forecast by Region, 2023-2033 (US$ Billion, AGR %)
Figure 45 Others Segment Market Share Forecast by Region, 2023 & 2033 (%)
Figure 46 Nasal Drug Delivery Technology Market by Application: Market Attractiveness Index
Figure 47 Nasal Drug Delivery Technology Market Forecast by Application, 2023-2033 (US$ Billion, AGR %)
Figure 48 Nasal drug delivery technology market Share Forecast by Application, 2023, 2028, 2033 (%)
Figure 49 Respiratory Disorders Segment Market Forecast by Region, 2023-2033 (US$ Billion, AGR %)
Figure 50 Respiratory Disorders Segment Market Share Forecast by Region, 2023 & 2033 (%)
Figure 51 Allergic Rhinitis Market Forecast by Region, 2023-2033 (US$ Billion, AGR %)
Figure 52 Allergic Rhinitis Segment Market Share Forecast by Region, 2023 & 2033 (%)
Figure 53 Nasal Congestion Segment Market Forecast by Region, 2023-2033 (US$ Billion, AGR %)
Figure 54 Nasal Congestion Segment Market Share Forecast by Region, 2023 & 2033 (%)
Figure 55 Asthma Segment Market Forecast by Region, 2023-2033 (US$ Billion, AGR %)
Figure 56 Asthma Segment Market Share Forecast by Region, 2023 & 2033 (%)
Figure 57 Other Respiratory Disorders Segment Market Forecast by Region, 2023-2033 (US$ Billion, AGR %)
Figure 58 Other Respiratory Disorders Segment Market Share Forecast by Region, 2023 & 2033 (%)
Figure 59 Non-Respiratory Disorders Segment Market Forecast by Region, 2023-2033 (US$ Billion, AGR %)
Figure 60 Non-Respiratory Disorders Segment Market Share Forecast by Region, 2023 & 2033 (%)
Figure 61 Alzheimer’s Market Forecast by Region, 2023-2033 (US$ Billion, AGR %)
Figure 62 Alzheimer’s Segment Market Share Forecast by Region, 2023 & 2033 (%)
Figure 63 Cardiovascular Disorders Segment Market Forecast by Region, 2023-2033 (US$ Billion, AGR %)
Figure 64 Cardiovascular Disorders Segment Market Share Forecast by Region, 2023 & 2033 (%)
Figure 65 Neuropsychiatry Segment Market Forecast by Region, 2023-2033 (US$ Billion, AGR %)
Figure 66 Neuropsychiatry Segment Market Share Forecast by Region, 2023 & 2033 (%)
Figure 67 Other Non-Respiratory Disorders Segment Market Forecast by Region, 2023-2033 (US$ Billion, AGR %)
Figure 68 Other Non-Respiratory Disorders Segment Market Share Forecast by Region, 2023 & 2033 (%)
Figure 69 Nasal Drug Delivery Technology Market by End-users: Market Attractiveness Index
Figure 70 Nasal Drug Delivery Technology Market Forecast by End-users, 2023-2033 (US$ Billion, AGR %)
Figure 71 Nasal drug delivery technology market Share Forecast by End-users, 2023, 2028, 2033 (%)
Figure 72 Home Health Care Segment Market Forecast by Region, 2023-2033 (US$ Billion, AGR %)
Figure 73 Home Health Care Segment Market Share Forecast by Region, 2023 & 2033 (%)
Figure 74 Hospitals Segment Market Forecast by Region, 2023-2033 (US$ Billion, AGR %)
Figure 75 Hospitals Segment Market Share Forecast by Region, 2023 & 2033 (%)
Figure 76 Specialty Clinics Segment Market Forecast by Region, 2023-2033 (US$ Billion, AGR %)
Figure 77 Specialty Clinics Segment Market Share Forecast by Region, 2023 & 2033 (%)
Figure 78 Vaccination Centers Segment Market Forecast by Region, 2023-2033 (US$ Billion, AGR %)
Figure 79 Vaccination Centers Segment Market Share Forecast by Region, 2023 & 2033 (%)
Figure 80 Ambulatory Surgical Centers Segment Market Forecast by Region, 2023-2033 (US$ Billion, AGR %)
Figure 81 Ambulatory Surgical Centers Segment Market Share Forecast by Region, 2023 & 2033 (%)
Figure 82 Others Segment Market Forecast by Region, 2023-2033 (US$ Billion, AGR %)
Figure 83 Others Segment Market Share Forecast by Region, 2023 & 2033 (%)
Figure 84 Nasal Drug Delivery Technology Market Forecast by Region 2023 and 2033 (Revenue, CAGR%)
Figure 85 Nasal drug delivery technology market Share Forecast by Region 2023, 2028, 2033 (%)
Figure 86 Nasal Drug Delivery Technology Market by Region, 2023-2033 (US$ Billion, AGR %)
Figure 87 North America Nasal Drug Delivery Technology Market Attractiveness Index
Figure 88 North America Nasal Drug Delivery Technology Market by Region, 2023, 2028 & 2033 (US$ Billion)
Figure 89 North America Nasal Drug Delivery Technology Market Forecast by Country, 2023-2033 (US$ Billion, AGR %)
Figure 90 North America Nasal Drug Delivery Technology Market Share Forecast by Country, 2023 & 2033 (%)
Figure 91 North America Nasal Drug Delivery Technology Market Forecast by Containers, 2023-2033 (US$ Billion, AGR %)
Figure 92 North America Nasal Drug Delivery Technology Market Share Forecast by Containers, 2023 & 2033 (%)
Figure 93 North America Nasal Drug Delivery Technology Market Forecast by System, 2023-2033 (US$ Billion, AGR %)
Figure 94 North America Nasal Drug Delivery Technology Market Share Forecast by System, 2023 & 2033 (%)
Figure 95 North America Nasal Drug Delivery Technology Market Forecast by Dosage Form, 2023-2033 (US$ Billion, AGR %)
Figure 96 North America Nasal Drug Delivery Technology Market Share Forecast by Dosage Form, 2023 & 2033 (%)
Figure 97 North America Nasal Drug Delivery Technology Market Forecast by Application, 2023-2033 (US$ Billion, AGR %)
Figure 98 North America Nasal Drug Delivery Technology Market Share Forecast by Application, 2023 & 2033 (%)
Figure 99 North America Nasal Drug Delivery Technology Market Forecast by Respiratory Diseases, 2023-2033 (US$ Billion, AGR %)
Figure 100 North America Nasal Drug Delivery Technology Market Share Forecast by Respiratory Diseases, 2023 & 2033 (%)
Figure 101 North America Nasal Drug Delivery Technology Market Forecast by Non-respiratory Diseases, 2023-2033 (US$ Billion, AGR %)
Figure 102 North America Nasal Drug Delivery Technology Market Share Forecast by Non-respiratory Diseases, 2023 & 2033 (%)
Figure 103 North America Nasal Drug Delivery Technology Market Forecast by End-users, 2023-2033 (US$ Billion, AGR %)
Figure 104 North America Nasal Drug Delivery Technology Market Share Forecast by End-users, 2023 & 2033 (%)
Figure 105 U.S. Nasal Drug Delivery Technology Market Forecast, 2023-2033 (US$ Billion, AGR %)
Figure 106 Canada Nasal Drug Delivery Technology Market Forecast, 2023-2033 (US$ Billion, AGR %)
Figure 107 European Nasal Drug Delivery Technology Market Attractiveness Index
Figure 108 European Nasal Drug Delivery Technology Market by Region, 2023, 2028 & 2033 (US$ Billion)
Figure 109 European Nasal Drug Delivery Technology Market Forecast by Country, 2023-2033 (US$ Billion, AGR %)
Figure 110 European Nasal Drug Delivery Technology Market Share Forecast by Country, 2023 & 2033 (%)
Figure 111 European Nasal Drug Delivery Technology Market Forecast by Containers, 2023-2033 (US$ Billion, AGR %)
Figure 112 European Nasal Drug Delivery Technology Market Share Forecast by Containers, 2023 & 2033 (%)
Figure 113 European Nasal Drug Delivery Technology Market Forecast by System, 2023-2033 (US$ Billion, AGR %)
Figure 114 European Nasal Drug Delivery Technology Market Share Forecast by System, 2023 & 2033 (%)
Figure 115 European Nasal Drug Delivery Technology Market Forecast by Dosage Form, 2023-2033 (US$ Billion, AGR %)
Figure 116 European Nasal Drug Delivery Technology Market Share Forecast by Dosage Form, 2023 & 2033 (%)
Figure 117 European Nasal Drug Delivery Technology Market Forecast by Application, 2023-2033 (US$ Billion, AGR %)
Figure 118 European Nasal Drug Delivery Technology Market Share Forecast by Application, 2023 & 2033 (%)
Figure 119 European Nasal Drug Delivery Technology Market Forecast by Respiratory Diseases, 2023-2033 (US$ Billion, AGR %)
Figure 120 European Nasal Drug Delivery Technology Market Share Forecast by Respiratory Diseases, 2023 & 2033 (%)
Figure 121 European Nasal Drug Delivery Technology Market Forecast by Non-respiratory Diseases, 2023-2033 (US$ Billion, AGR %)
Figure 122 European Nasal Drug Delivery Technology Market Share Forecast by Non-respiratory Diseases, 2023 & 2033 (%)
Figure 123 European Nasal Drug Delivery Technology Market Forecast by End-users, 2023-2033 (US$ Billion, AGR %)
Figure 124 European Nasal Drug Delivery Technology Market Share Forecast by End-users, 2023 & 2033 (%)
Figure 125 Germany Nasal Drug Delivery Technology Market Forecast, 2023-2033 (US$ Billion, AGR %)
Figure 126 UK Nasal Drug Delivery Technology Market Forecast, 2023-2033 (US$ Billion, AGR %)
Figure 127 France Nasal Drug Delivery Technology Market Forecast, 2023-2033 (US$ Billion, AGR %)
Figure 128 Italy Nasal Drug Delivery Technology Market Forecast, 2023-2033 (US$ Billion, AGR %)
Figure 129 Spain Nasal Drug Delivery Technology Market Forecast, 2023-2033 (US$ Billion, AGR %)
Figure 130 Russia Nasal Drug Delivery Technology Market Forecast, 2023-2033 (US$ Billion, AGR %)
Figure 131 Netherlands Nasal Drug Delivery Technology Market Forecast, 2023-2033 (US$ Billion, AGR %)
Figure 132 Switzerland Nasal Drug Delivery Technology Market Forecast, 2023-2033 (US$ Billion, AGR %)
Figure 133 Rest of Europe Nasal Drug Delivery Technology Market Forecast, 2023-2033 (US$ Billion, AGR %)
Figure 134 Asia Nasal Drug Delivery Technology Market Attractiveness Index
Figure 135 Asia Nasal Drug Delivery Technology Market by Region, 2023, 2028 & 2033 (US$ Billion)
Figure 136 Asia Nasal Drug Delivery Technology Market Forecast by Country, 2023-2033 (US$ Billion, AGR %)
Figure 137 Asia Nasal Drug Delivery Technology Market Share Forecast by Country, 2023 & 2033 (%)
Figure 138 Asia Nasal Drug Delivery Technology Market Forecast by Containers, 2023-2033 (US$ Billion, AGR %)
Figure 139 Asia Nasal Drug Delivery Technology Market Share Forecast by Containers, 2023 & 2033 (%)
Figure 140 Asia Nasal Drug Delivery Technology Market Forecast by System, 2023-2033 (US$ Billion, AGR %)
Figure 141 Asia Nasal Drug Delivery Technology Market Share Forecast by System, 2023 & 2033 (%)
Figure 142 Asia Nasal Drug Delivery Technology Market Forecast by Dosage Form, 2023-2033 (US$ Billion, AGR %)
Figure 143 Asia Nasal Drug Delivery Technology Market Share Forecast by Dosage Form, 2023 & 2033 (%)
Figure 144 Asia Nasal Drug Delivery Technology Market Forecast by Application, 2023-2033 (US$ Billion, AGR %)
Figure 145 Asia Nasal Drug Delivery Technology Market Share Forecast by Application, 2023 & 2033 (%)
Figure 146 Asia Nasal Drug Delivery Technology Market Forecast by Respiratory Diseases, 2023-2033 (US$ Billion, AGR %)
Figure 147 Asia Nasal Drug Delivery Technology Market Share Forecast by Respiratory Diseases, 2023 & 2033 (%)
Figure 148 Asia Nasal Drug Delivery Technology Market Forecast by Non-respiratory Diseases, 2023-2033 (US$ Billion, AGR %)
Figure 149 Asia Nasal Drug Delivery Technology Market Share Forecast by Non-respiratory Diseases, 2023 & 2033 (%)
Figure 150 Asia Nasal Drug Delivery Technology Market Forecast by End-users, 2023-2033 (US$ Billion, AGR %)
Figure 151 Asia Nasal Drug Delivery Technology Market Share Forecast by End-users, 2023 & 2033 (%)
Figure 152 Japan Nasal Drug Delivery Technology Market Forecast, 2023-2033 (US$ Billion, AGR %)
Figure 153 China Nasal Drug Delivery Technology Market Forecast, 2023-2033 (US$ Billion, AGR %)
Figure 154 India Nasal Drug Delivery Technology Market Forecast, 2023-2033 (US$ Billion, AGR %)
Figure 155 Australia Nasal Drug Delivery Technology Market Forecast, 2023-2033 (US$ Billion, AGR %)
Figure 156 South Korea Nasal Drug Delivery Technology Market Forecast, 2023-2033 (US$ Billion, AGR %)
Figure 157 Singapore Nasal Drug Delivery Technology Market Forecast, 2023-2033 (US$ Billion, AGR %)
Figure 158 Thailand Nasal Drug Delivery Technology Market Forecast, 2023-2033 (US$ Billion, AGR %)
Figure 159 Rest of Asia Nasal Drug Delivery Technology Market Forecast, 2023-2033 (US$ Billion, AGR %)
Figure 160 Latin America Nasal Drug Delivery Technology Market Attractiveness Index
Figure 161 Latin America Nasal Drug Delivery Technology Market by Region, 2023, 2028 & 2033 (US$ Billion)
Figure 162 Latin America Nasal Drug Delivery Technology Market Forecast by Country, 2023-2033 (US$ Billion, AGR %)
Figure 163 Latin America Nasal Drug Delivery Technology Market Share Forecast by Country, 2023 & 2033 (%)
Figure 164 Latin America Nasal Drug Delivery Technology Market Forecast by Containers, 2023-2033 (US$ Billion, AGR %)
Figure 165 Latin America Nasal Drug Delivery Technology Market Share Forecast by Containers, 2023 & 2033 (%)
Figure 166 Latin America Nasal Drug Delivery Technology Market Forecast by System, 2023-2033 (US$ Billion, AGR %)
Figure 167 Latin America Nasal Drug Delivery Technology Market Share Forecast by System, 2023 & 2033 (%)
Figure 168 Latin America Nasal Drug Delivery Technology Market Forecast by Dosage Form, 2023-2033 (US$ Billion, AGR %)
Figure 169 Latin America Nasal Drug Delivery Technology Market Share Forecast by Dosage Form, 2023 & 2033 (%)
Figure 170 Latin America Nasal Drug Delivery Technology Market Forecast by Application, 2023-2033 (US$ Billion, AGR %)
Figure 171 Latin America Nasal Drug Delivery Technology Market Share Forecast by Application, 2023 & 2033 (%)
Figure 172 Latin America Nasal Drug Delivery Technology Market Forecast by Respiratory Diseases, 2023-2033 (US$ Billion, AGR %)
Figure 173 Latin America Nasal Drug Delivery Technology Market Share Forecast by Respiratory Diseases, 2023 & 2033 (%)
Figure 174 Latin America Nasal Drug Delivery Technology Market Forecast by Non-respiratory Diseases, 2023-2033 (US$ Billion, AGR %)
Figure 175 Latin America Nasal Drug Delivery Technology Market Share Forecast by Non-respiratory Diseases, 2023 & 2033 (%)
Figure 176 Latin America Nasal Drug Delivery Technology Market Forecast by End-users, 2023-2033 (US$ Billion, AGR %)
Figure 177 Latin America Nasal Drug Delivery Technology Market Share Forecast by End-users, 2023 & 2033 (%)
Figure 178 Brazil Nasal Drug Delivery Technology Market Forecast, 2023-2033 (US$ Billion, AGR %)
Figure 179 Mexico Nasal Drug Delivery Technology Market Forecast, 2023-2033 (US$ Billion, AGR %)
Figure 180 Argentina Nasal Drug Delivery Technology Market Forecast, 2023-2033 (US$ Billion, AGR %)
Figure 181 Colombia Nasal Drug Delivery Technology Market Forecast, 2023-2033 (US$ Billion, AGR %)
Figure 182 Chile Nasal Drug Delivery Technology Market Forecast, 2023-2033 (US$ Billion, AGR %)
Figure 183 Rest of Latin America Nasal Drug Delivery Technology Market Forecast, 2023-2033 (US$ Billion, AGR %)
Figure 184 MEA Nasal Drug Delivery Technology Market Attractiveness Index
Figure 185 MEA Nasal Drug Delivery Technology Market by Region, 2023, 2028 & 2033 (US$ Billion)
Figure 186 MEA Nasal Drug Delivery Technology Market Forecast by Country, 2023-2033 (US$ Billion, AGR %)
Figure 187 MEA Nasal Drug Delivery Technology Market Share Forecast by Country, 2023 & 2033 (%)
Figure 188 MEA Nasal Drug Delivery Technology Market Forecast by System, 2023-2033 (US$ Billion, AGR %)
Figure 189 MEA Nasal Drug Delivery Technology Market Share Forecast by Containers, 2023 & 2033 (%)
Figure 190 MEA Nasal Drug Delivery Technology Market Forecast by System, 2023-2033 (US$ Billion, AGR %)
Figure 191 MEA Nasal Drug Delivery Technology Market Share Forecast by System, 2023 & 2033 (%)
Figure 192 MEA Nasal Drug Delivery Technology Market Forecast by Dosage Form, 2023-2033 (US$ Billion, AGR %)
Figure 193 MEA Nasal Drug Delivery Technology Market Share Forecast by Dosage Form, 2023 & 2033 (%)
Figure 194 MEA Nasal Drug Delivery Technology Market Forecast by Application, 2023-2033 (US$ Billion, AGR %)
Figure 195 MEA Nasal Drug Delivery Technology Market Share Forecast by Application, 2023 & 2033 (%)
Figure 196 MEA Nasal Drug Delivery Technology Market Forecast by Respiratory Diseases, 2023-2033 (US$ Billion, AGR %)
Figure 197 MEA Nasal Drug Delivery Technology Market Share Forecast by Respiratory Diseases, 2023 & 2033 (%)
Figure 198 MEA Nasal Drug Delivery Technology Market Forecast by Non-respiratory Diseases, 2023-2033 (US$ Billion, AGR %)
Figure 199 MEA Nasal Drug Delivery Technology Market Share Forecast by Non-respiratory Diseases, 2023 & 2033 (%)
Figure 200 MEA Nasal Drug Delivery Technology Market Forecast by End-users, 2023-2033 (US$ Billion, AGR %)
Figure 201 MEA Nasal Drug Delivery Technology Market Share Forecast by End-users, 2023 & 2033 (%)
Figure 202 GCC Nasal Drug Delivery Technology Market Forecast, 2023-2033 (US$ Billion, AGR %)
Figure 203 South Africa Nasal Drug Delivery Technology Market Forecast, 2023-2033 (US$ Billion, AGR %)
Figure 204 Turkey Nasal Drug Delivery Technology Market Forecast, 2023-2033 (US$ Billion, AGR %)
Figure 205 Egypt Nasal Drug Delivery Technology Market Forecast, 2023-2033 (US$ Billion, AGR %)
Figure 206 Rest of MEA Nasal Drug Delivery Technology Market Forecast, 2023-2033 (US$ Billion, AGR %)
Figure 207 Nasal Drug Delivery Technology Market: Company Share, 2022
Figure 208 Becton, Dickinson, and Company: Net Revenue, 2017-2022 (US$ Million, AGR%)
Figure 209 Becton, Dickinson, and Company: R&D, 2017-2022 (US$ Million, AGR%)
Figure 210 Becton, Dickinson, and Company: Regional Market Shares, 2022
Figure 211 Becton, Dickinson, and Company: Business Segment Market Shares, 2022
Figure 212 GSK plc: Net Revenue, 2017-2022 (US$ million, AGR%)
Figure 213 GSK plc: R&D, 2017-2022 (US$ million, AGR%)
Figure 214 GSK plc: Regional Market Shares, 2022
Figure 215 GSK plc: Business Segment Market Shares, 2022
Figure 216 Johnson & Johnson: Net Revenue, 2017-2022 (US$ million, AGR%)
Figure 217 Johnson & Johnson: R&D, 2017-2022 (US$ million, AGR%)
Figure 218 Johnson & Johnson: Regional Market Shares, 2022
Figure 219 Johnson & Johnson: Business Segment Market Shares, 2022
Figure 220 Merck & Co., Inc: Net Revenue, 2017-2022 (US$ million, AGR%)
Figure 221 Merck & Co., Inc: R&D, 2017-2022 (US$ million, AGR%)
Figure 222 Merck & Co., Inc: Regional Market Shares, 2022
Figure 223 Merck & Co., Inc: Business Segment Market Shares, 2022
Figure 224 Novartis AG: Net Revenue, 2017-2022 (US$ million, AGR%)
Figure 225 Novartis AG: R&D, 2017-2022 (US$ million, AGR%)
Figure 226 Novartis AG: Regional Market Shares, 2022
Figure 227 Novartis AG: Business Segment Market Shares, 2022
Figure 228 Teva Pharmaceutical Industries Ltd: Net Revenue, 2017-2022 (US$ million, AGR%)
Figure 229 Teva Pharmaceutical Industries Ltd: R&D, 2017-2022 (US$ million, AGR%)
Figure 230 Teva Pharmaceutical Industries Ltd: Regional Market Shares, 2022
Figure 231 Teva Pharmaceutical Industries Ltd: Business Segment Market Shares, 2022
Figure 232 AptarGroup Inc.: Net Revenue, 2017-2022 (US$ million, AGR%)
Figure 233 AptarGroup Inc.: R&D, 2017-2022 (US$ million, AGR%)
Figure 234 AptarGroup Inc.: Regional Market Shares, 2022
Figure 235 AptarGroup Inc.: Business Segment Market Shares, 2022
Figure 236 AstraZeneca PLC: Net Revenue, 2017-2022 (US$ million, AGR%)
Figure 237 AstraZeneca PLC: R&D, 2017-2022 (US$ million, AGR%)
Figure 238 AstraZeneca PLC: Regional Market Shares, 2022
Figure 239 AstraZeneca PLC: Business Segment Market Shares, 2022
Figure 240 Dr. Reddy's Laboratories: Net Revenue, 2017-2022 (US$ million, AGR%)
Figure 241 Dr. Reddy's Laboratories: R&D, 2017-2022 (US$ million, AGR%)
Figure 242 Dr. Reddy's Laboratories: Regional Market Shares, 2022
Figure 243 Dr. Reddy's Laboratories: Business Segment Market Shares, 2022
Figure 244 Pfizer Inc: Net Revenue, 2017-2022 (US$ million, AGR%)
Figure 245 Pfizer Inc: R&D, 2017-2022 (US$ million, AGR%)
Figure 246 Pfizer Inc: Regional Market Shares, 2022
Figure 247 Pfizer Inc: Business Segment Market Shares, 2022
Figure 248 Bayer AG: Net Revenue, 2017-2022 (US$ million, AGR%)
Figure 249 Bayer AG: R&D, 2017-2022 (US$ million, AGR%)
Figure 250 Bayer AG: Regional Market Shares, 2022
Figure 251 Bayer AG: Business Segment Market Shares, 2022
ページTOPに戻る
Summary
Report Details
The Nasal Drug Delivery Technology Market Report 2022-2033: This report will prove invaluable to leading firms striving for new revenue pockets if they wish to better understand the industry and its underlying dynamics. It will be useful for companies that would like to expand into different industries or to expand their existing operations in a new region.
Increasing Demand for Alternative Drug Delivery Methods Coupled with Advancements In Product Development Driving Market Growth
Some of the major forces propelling the nasal drug delivery technology market include surge in demand for better drug delivery methods, and advancements in product packing and development. Furthermore, rising prevalence of allergic rhinitis and increasing cases of asthma are expected to propel market growth. On the other hand, rise in adoption of generic nasal delivery drugs coupled with new launches are expected to further boost market growth. Developing a successful nasal drug product requires expertise in a variety of areas, including formulation development, device design, clinical trial design, regulatory compliance, and commercialization. Market players are entering into strategic partnerships such as agreement and mergers to meet the growing market demand for effective nasal drugs. Many pharmaceutical companies developing a nasal drug product are partnering with a device manufacturer to design and manufacture a nasal delivery device that is optimized for the specific drug formulation.
On the other hand, production of pharmaceutical products is subject to strict consumer safety regulations. Before a product is finally marketed, lengthy and laborious processes are typically required for medical device and medicine approvals. Companies who engage in significant R&D to introduce new items to the market typically find this to be a hurdle. These stringent regulations are anticipated to hinder the growth of this market over the forecast period.
Complications with Nasal Drug Overuse Likely to Challenge Market Growth
Overuse of nasal drugs can lead to a variety of side effects, some of which can be serious. Rebound congestion, nosebleed, and irritation of nasal membrane are some of the side effects of nasal spray overuse. Many people mistakenly believe that nasal sprays are safe to use since they are widely accessible as over-the-counter medications, and they are ignorant of the potential side effects and addiction linked to them. Regular nasal spray users are prone to developing a habit of abusing the medicine. When their symptoms get worse, people take the prescription more frequently, which frequently results in rhinitis medicamentosa, a disorder. This frequently leads to a condition known as septal perforation—a hole in the inner wall of the nose—in situations of misuse.
What Questions Should You Ask before Buying a Market Research Report?
• How is the Nasal Drug Delivery Technology Market evolving?
• What is driving and restraining the nasal drug delivery technology market?
• How will each nasal drug delivery technology submarket segment grow over the forecast period and how much revenue will these submarkets account for in 2033?
• How will the market shares for each nasal drug delivery technology submarket develop from 2023 to 2033?
• What will be the main driver for the overall market from 2023 to 2033?
• Will leading nasal drug delivery technology markets broadly follow the macroeconomic dynamics, or will individual national markets outperform others?
• How will the market shares of the national markets change by 2033 and which geographical region will lead the market in 2033?
• Who are the leading players and what are their prospects over the forecast period?
• What are the nasal drug delivery technology projects for these leading companies?
• How will the industry evolve during the period between 2022 and 2033? What are the implications of nasal drug delivery technology projects taking place now and over the next 10 years?
• Is there a greater need for product commercialisation to further scale the nasal drug delivery technology market?
• Where is the nasal drug delivery technology market heading and how can you ensure you are at the forefront of the market?
• What are the best investment options for new product and service lines?
• What are the key prospects for moving companies into a new growth path and C-suite?
You need to discover how this will impact the nasal drug delivery technology market today, and over the next 10 years:
• Our 397-page report provides 141 tables and 251 charts/graphs exclusively to you.
• The report highlights key lucrative areas in the industry so you can target them – NOW.
• It contains in-depth analysis of global, regional and national sales and growth.
• It highlights for you the key successful trends, changes and revenue projections made by your competitors.
This report tells you TODAY how the Nasal Drug Delivery Technology Market will develop in the next 10 years, and in line with the variations in COVID-19 economic recession and bounce. This market is more critical now than at any point over the last 10 years.
Forecasts to 2033 and other analyses reveal commercial prospects
• In addition to revenue forecasting to 2033, our new study provides you with recent results, growth rates, and market shares.
• You will find original analyses, with business outlooks and developments.
• Discover qualitative analyses (including market dynamics, drivers, opportunities, restraints and challenges), cost structure, impact of rising nasal drug delivery technology prices and recent developments.
This report includes data analysis and invaluable insight into how COVID-19 will affect the industry and your company. Four COVID-19 recovery patterns and their impact, namely, “V”, “L”, “W” and “U” are discussed in this report.
Segments Covered in the Report
Container
• Pressurized Containers
• Non-pressurized Containers
System
• Nasal Bi Dose
• Nasal Multi Dose
• Nasal Unidose
Dosage Form
• Nasal Spray
• Nasal Drops and Liquids
• Nasal Gels
• Nasal Powder
• Others
Application
• Respiratory Diseases
– Allergic Rhinitis
– Nasal Congestion
– Asthma
– Others
• Non-respiratory Diseases
– Alzheimer’s
– Cardiovascular Disorders
– Neuropsychiatry
– Others
End-users
• Home Health Care
• Hospitals
• Specialty Clinics
• Vaccination Centres
• Ambulatory Surgical Centres
• Others
In addition to the revenue predictions for the overall world market and segments, you will also find revenue forecasts for five regional and 29 leading national markets:
North America
• U.S.
• Canada
Europe
• Germany
• UK
• France
• Italy
• Spain
• Russia
• Netherlands
• Switzerland
• Rest of Europe
Asia Pacific
• Japan
• China
• India
• Australia
• South Korea
• Singapore
• Thailand
• Rest of Asia Pacific
Latin America
• Brazil
• Mexico
• Argentina
• Colombia
• Chile
• Rest of Latin America
MEA
• GCC
• South Africa
• Turkey
• Egypt
• Rest of MEA
The report also includes profiles and for some of the leading companies in the Nasal Drug Delivery Technology Market, 2023 to 2033, with a focus on this segment of these companies’ operations.
Leading companies and the potential for market growth
• AptarGroup, Inc
• AstraZeneca PLC
• Bayer AG
• Becton, Dickinson, and Company
• Dr. Reddy’s Laboratories Ltd.
• Flo Nasal Solution
• GlaxoSmithKline PLC
• H&T Presspart
• Johnson & Johnson
• Merck & Co., Inc.
• Naveh Pharma Ltd
• Nemera
• Novartis AG
• Neurelis Inc.
• OptiNose, Inc.
• Pfizer Inc.
• PendoPharm Inc.
• Recipharm AB
• Teleflex, Inc.
• Teva Pharmaceutical Industries Ltd.
Overall world revenue for Nasal Drug Delivery Technology Market, 2023 to 2033 in terms of value the market will surpass US$70 billion in 2022, our work calculates. We predict strong revenue growth through to 2033. Our work identifies which organizations hold the greatest potential. Discover their capabilities, progress, and commercial prospects, helping you stay ahead.
How will the Nasal Drug Delivery Technology Market, 2023 to 2033 report help you?
In summary, our 397-page report provides you with the following knowledge:
• Revenue forecasts to 2033 for Nasal Drug Delivery Technology Market, 2023 to 2033 Market, with forecasts for containers, system, dosage form, application, end user, each forecast at a global and regional level – discover the industry’s prospects, finding the most lucrative places for investments and revenues.
• Revenue forecasts to 2033 for five regional and 30 key national markets – See forecasts for the Nasal Drug Delivery Technology Market, 2023 to 2033 market in North America, Europe, Asia-Pacific, Latin America, and MEA. Also forecasted is the market in the US, Canada, Mexico, Brazil, Germany, France, UK, Italy, China, India, Japan, and Australia among other prominent economies.
• Prospects for established firms and those seeking to enter the market – including company profiles for 20 of the major companies involved in the Nasal Drug Delivery Technology Market, 2023 to 2033.
Find quantitative and qualitative analyses with independent predictions. Receive information that only our report contains, staying informed with invaluable business intelligence.
Information found nowhere else
With our new report, you are less likely to fall behind in knowledge or miss out on opportunities. See how our work could benefit your research, analyses, and decisions. Visiongain’s study is for everybody needing commercial analyses for the Nasal Drug Delivery Technology Market, 2023 to 2033, market-leading companies. You will find data, trends, and predictions.
ページTOPに戻る
Table of Contents
Table of Contents
1 Report Overview
1.1 Objectives of the Study
1.2 Introduction to Nasal drug delivery technology market
1.3 What This Report Delivers
1.4 Why You Should Read This Report
1.5 Key Questions Answered by This Analytical Report
1.6 Who is This Report for?
1.7 Methodology
1.7.1 Market Definitions
1.7.2 Market Evaluation & Forecasting Methodology
1.7.3 Data Validation
1.7.3.1 Primary Research
1.7.3.2 Secondary Research
1.8 Frequently Asked Questions (FAQs)
1.9 Associated Visiongain Reports
1.10 About Visiongain
2 Executive Summary
3 Market Overview
3.1 Key Findings
3.2 Market Dynamics
3.2.1 Market Driving Factors
3.2.1.1 High Prevalence of Allergic Rhinitis to Spur Demand
3.2.1.2 Multiple Benefits Associated with Multi-dose Nasal Spray Packaging to Boost Industry Growth
3.2.1.3 Chronic Respiratory Diseases Driving Market Growth
3.2.1.4 Need for Generic Inhalation and Nasal Spray Drugs to Boost Industry Growth
3.2.1.5 Support from Government and NGOs for Respiratory Diseases Healthcare Awareness to Spur Market Growth
3.2.1.6 Advanced Inhalation Methods to Augment Market Growth
3.2.2 Market Restraining Factors
3.2.2.1 Product Development Regulations Likely to Restrain Market Growth
3.2.2.2 Complications Associated with the Overuse of Nasal Sprays
3.2.3 Market Opportunities
3.2.3.1 Emerging Opportunities for Nasal Devices
3.2.3.2 Nasal Drug Delivery Has Evolved into a Highly Versatile Method of Administration for Locally Acting And Systemic Drugs
3.2.3.3 Rising Demand for Generic Drugs is Expected to Enhance Market Growth
3.2.3.4 DPI Technology Driving the Adoption of Nasal Drugs
3.3 COVID-19 Impact Analysis
3.4 Porter’s Five Forces Analysis
3.4.1 Bargaining Power of Suppliers
3.4.2 Bargaining Power of Buyers
3.4.3 Competitive Rivalry
3.4.4 Threat from Substitutes
3.4.5 Threat of New Entrants
3.5 PEST Analysis
4 Nasal Drug Delivery Technology Market Analysis by Containers
4.1 Key Findings
4.2 Container Segment: Market Attractiveness Index
4.3 Nasal Drug Delivery Technology Market Size Estimation and Forecast by Containers
4.4 Pressurized Containers
4.4.1 Market Size by Region, 2023-2033 (US$ Billion)
4.4.2 Market Share by Region, 2023 & 2033 (%)
4.5 Non-pressurized Containers
4.5.1 Market Size by Region, 2023-2033 (US$ Billion)
4.5.2 Market Share by Region, 2023 & 2033 (%)
5 Nasal Drug Delivery Technology Market Analysis by System
5.1 Key Findings
5.2 System Segment: Market Attractiveness Index
5.3 Nasal Drug Delivery Technology Market Size Estimation and Forecast by System
5.4 Nasal Bi Dose
5.4.1 Market Size by Region, 2023-2033 (US$ Billion)
5.4.2 Market Share by Region, 2023 & 2033 (%)
5.5 Nasal Multi Dose
5.5.1 Market Size by Region, 2023-2033 (US$ Billion)
5.5.2 Market Share by Region, 2023 & 2033 (%)
5.6 Nasal Unidose
5.6.1 Market Size by Region, 2023-2033 (US$ Billion)
5.6.2 Market Share by Region, 2023 & 2033 (%)
6 Nasal Drug Delivery Technology Market Analysis By Dosage Form
6.1 Key Findings
6.2 Dosage Form Segment: Market Attractiveness Index
6.3 Nasal Drug Delivery Technology Market Size Estimation and Forecast by Dosage Form
6.4 Nasal Spray
6.4.1 Market Size by Region, 2023-2033 (US$ Billion)
6.4.2 Market Share by Region, 2023 & 2033 (%)
6.5 Nasal Drops and Liquid
6.5.1 Market Size by Region, 2023-2033 (US$ Billion)
6.5.2 Market Share by Region, 2023 & 2033 (%)
6.6 Nasal Gels
6.6.1 Market Size by Region, 2023-2033 (US$ Billion)
6.6.2 Market Share by Region, 2023 & 2033 (%)
6.7 Nasal Powder
6.7.1 Market Size by Region, 2023-2033 (US$ Billion)
6.7.2 Market Share by Region, 2023 & 2033 (%)
6.8 Others
6.8.1 Market Size by Region, 2023-2033 (US$ Billion)
6.8.2 Market Share by Region, 2023 & 2033 (%)
7 Nasal Drug Delivery Technology Market Analysis by Application
7.1 Key Findings
7.2 Application Segment: Market Attractiveness Index
7.3 Nasal Drug Delivery Technology Market Size Estimation and Forecast by Application
7.4 Respiratory Diseases
7.4.1 Market Size by Region, 2023-2033 (US$ Billion)
7.4.2 Market Share by Region, 2023 & 2033 (%)
7.4.3 Allergic Rhinitis
7.4.3.1 Market Size by Region, 2023-2033 (US$ Billion)
7.4.3.2 Market Share by Region, 2023 & 2033 (%)
7.4.4 Nasal Congestion
7.4.4.1 Market Size by Region, 2023-2033 (US$ Billion)
7.4.4.2 Market Share by Region, 2023 & 2033 (%)
7.4.5 Asthma
7.4.5.1 FDA Approved First Generic of Symbicort to Treat Asthma and COPD
7.4.5.2 Market Size by Region, 2023-2033 (US$ Billion)
7.4.5.3 Market Share by Region, 2023 & 2033 (%)
7.4.6 Others
7.4.6.1 COPD
7.4.6.2 Lupin Launched Nasal Drug For Breathing Problems In United States
7.4.6.3 Covid 19
7.4.6.4 Market Size by Region, 2023-2033 (US$ Billion)
7.4.6.5 Market Share by Region, 2023 & 2033 (%)
7.5 Non-respiratory Diseases
7.5.1 Market Size by Region, 2023-2033 (US$ Billion)
7.5.2 Market Share by Region, 2023 & 2033 (%)
7.5.3 Alzheimer’s
7.5.3.1 Market Size by Region, 2023-2033 (US$ Billion)
7.5.3.2 Market Share by Region, 2023 & 2033 (%)
7.5.4 Cardiovascular Disorders
7.5.4.1 Market Size by Region, 2023-2033 (US$ Billion)
7.5.4.2 Market Share by Region, 2023 & 2033 (%)
7.5.5 Neuropsychiatry
7.5.5.1 Market Size by Region, 2023-2033 (US$ Billion)
7.5.5.2 Market Share by Region, 2023 & 2033 (%)
7.5.6 Others
7.5.6.1 Market Size by Region, 2023-2033 (US$ Billion)
7.5.6.2 Market Share by Region, 2023 & 2033 (%)
8 Nasal Drug Delivery Technology Market Analysis by End-users
8.1 Key Findings
8.2 End-users Segment: Market Attractiveness Index
8.3 Nasal Drug Delivery Technology Market Size Estimation and Forecast by End-users
8.4 Home Health Care
8.4.1 Market Size by Region, 2023-2033 (US$ Billion)
8.4.2 Market Share by Region, 2023 & 2033 (%)
8.5 Hospitals
8.5.1 Market Size by Region, 2023-2033 (US$ Billion)
8.5.2 Market Share by Region, 2023 & 2033 (%)
8.6 Speciality Clinics
8.6.1 Market Size by Region, 2023-2033 (US$ Billion)
8.6.2 Market Share by Region, 2023 & 2033 (%)
8.7 Vaccination Centres
8.7.1 Market Size by Region, 2023-2033 (US$ Billion)
8.7.2 Market Share by Region, 2023 & 2033 (%)
8.8 Ambulatory Surgical Centres
8.8.1 Market Size by Region, 2023-2033 (US$ Billion)
8.8.2 Market Share by Region, 2023 & 2033 (%)
8.9 Others
8.9.1 Market Size by Region, 2023-2033 (US$ Billion)
8.9.2 Market Share by Region, 2023 & 2033 (%)
9 Nasal Drug Delivery Technology Market Analysis by Region
9.1 Key Findings
9.2 Regional Market Size Estimation and Forecast
10 North America Nasal Drug Delivery Technology Market Analysis
10.1 Key Findings
10.2 North America Nasal Drug Delivery Technology Market Attractiveness Index
10.3 North America Nasal Drug Delivery Technology Market by Country, 2023, 2028 & 2033 (US$ Billion)
10.4 North America Nasal Drug Delivery Technology Market Size Estimation and Forecast by Country
10.5 North America Nasal Drug Delivery Technology Market Size Estimation and Forecast by Containers
10.6 North America Nasal Drug Delivery Technology Market Size Estimation and Forecast by System
10.7 North America Nasal Drug Delivery Technology Market Size Estimation and Forecast by Dosage Form
10.8 North America Nasal Drug Delivery Technology Market Size Estimation and Forecast by Application
10.9 North America Nasal Drug Delivery Technology Market Size Estimation and Forecast by Respiratory Diseases
10.10 North America Nasal Drug Delivery Technology Market Size Estimation and Forecast by Non-respiratory Diseases
10.11 North America Nasal Drug Delivery Technology Market Size Estimation and Forecast by End-users
10.12 U.S. Nasal Drug Delivery Technology Market Analysis
10.13 Canada Nasal Drug Delivery Technology Market Analysis
11 European Nasal Drug Delivery Technology Market Analysis
11.1 Key Findings
11.2 European Nasal Drug Delivery Technology Market Attractiveness Index
11.3 European Nasal Drug Delivery Technology Market by Country, 2023, 2028 & 2033 (US$ Billion)
11.4 European Nasal Drug Delivery Technology Market Size Estimation and Forecast by Country
11.5 European Nasal Drug Delivery Technology Market Size Estimation and Forecast by Containers
11.6 European Nasal Drug Delivery Technology Market Size Estimation and Forecast by System
11.7 European Nasal Drug Delivery Technology Market Size Estimation and Forecast by Dosage Form
11.8 European Nasal Drug Delivery Technology Market Size Estimation and Forecast by Application
11.9 European Nasal Drug Delivery Technology Market Size Estimation and Forecast by Respiratory Diseases
11.10 European Nasal Drug Delivery Technology Market Size Estimation and Forecast by Non-respiratory Diseases
11.11 European Nasal Drug Delivery Technology Market Size Estimation and Forecast by End-users
11.12 Germany Nasal Drug Delivery Technology Market Analysis
11.13 UK Nasal Drug Delivery Technology Market Analysis
11.14 France Nasal Drug Delivery Technology Market Analysis
11.15 Italy Nasal Drug Delivery Technology Market Analysis
11.16 Spain Nasal Drug Delivery Technology Market Analysis
11.17 Russia Nasal Drug Delivery Technology Market Analysis
11.18 Netherlands Nasal Drug Delivery Technology Market Analysis
11.19 Switzerland Nasal Drug Delivery Technology Market Analysis
11.20 Rest of Europe Nasal Drug Delivery Technology Market Analysis
12 Asia Nasal Drug Delivery Technology Market Analysis
12.1 Key Findings
12.2 Asia Nasal Drug Delivery Technology Market Attractiveness Index
12.3 Asia Nasal Drug Delivery Technology Market by Country, 2023, 2028 & 2033 (US$ Billion)
12.4 Asia Nasal Drug Delivery Technology Market Size Estimation and Forecast by Country
12.5 Asia Nasal Drug Delivery Technology Market Size Estimation and Forecast by Containers
12.6 Asia Nasal Drug Delivery Technology Market Size Estimation and Forecast by System
12.7 Asia Nasal Drug Delivery Technology Market Size Estimation and Forecast by Dosage Form
12.8 Asia Nasal Drug Delivery Technology Market Size Estimation and Forecast by Application
12.9 Asia Nasal Drug Delivery Technology Market Size Estimation and Forecast by Respiratory Diseases
12.10 Asia Nasal Drug Delivery Technology Market Size Estimation and Forecast by Non-respiratory Diseases
12.11 Asia Nasal Drug Delivery Technology Market Size Estimation and Forecast by End-users
12.12 Japan Nasal Drug Delivery Technology Market Analysis
12.13 China Nasal Drug Delivery Technology Market Analysis
12.14 India Nasal Drug Delivery Technology Market Analysis
12.15 Australia Nasal Drug Delivery Technology Market Analysis
12.16 South Korea Nasal Drug Delivery Technology Market Analysis
12.17 Singapore Nasal Drug Delivery Technology Market Analysis
12.18 Thailand Nasal Drug Delivery Technology Market Analysis
12.19 Rest of Asia Nasal Drug Delivery Technology Market Analysis
13 Latin America Nasal Drug Delivery Technology Market Analysis
13.1 Key Findings
13.2 Latin America Nasal Drug Delivery Technology Market Attractiveness Index
13.3 Latin America Nasal Drug Delivery Technology Market by Country, 2023, 2028 & 2033 (US$ Billion)
13.4 Latin America Nasal Drug Delivery Technology Market Size Estimation and Forecast by Country
13.5 Latin America Nasal Drug Delivery Technology Market Size Estimation and Forecast by Containers
13.6 Latin America Nasal Drug Delivery Technology Market Size Estimation and Forecast by System
13.7 Latin America Nasal Drug Delivery Technology Market Size Estimation and Forecast by Dosage Form
13.8 Latin America Nasal Drug Delivery Technology Market Size Estimation and Forecast by Application
13.9 Latin America Nasal Drug Delivery Technology Market Size Estimation and Forecast by Respiratory Diseases
13.10 Latin America Nasal Drug Delivery Technology Market Size Estimation and Forecast by Non-respiratory Diseases
13.11 Latin America Nasal Drug Delivery Technology Market Size Estimation and Forecast by End-users
13.12 Brazil Nasal Drug Delivery Technology Market Analysis
13.13 Mexico Nasal Drug Delivery Technology Market Analysis
13.14 Argentina Nasal Drug Delivery Technology Market Analysis
13.15 Colombia Nasal Drug Delivery Technology Market Analysis
13.16 Chile Nasal Drug Delivery Technology Market Analysis
13.17 Rest of Latin America Nasal Drug Delivery Technology Market Analysis
14 MEA Nasal Drug Delivery Technology Market Analysis
14.1 Key Findings
14.2 MEA Nasal Drug Delivery Technology Market Attractiveness Index
14.3 MEA Nasal Drug Delivery Technology Market by Country, 2023, 2028 & 2033 (US$ Billion)
14.4 MEA Nasal Drug Delivery Technology Market Size Estimation and Forecast by Country
14.5 MEA Nasal Drug Delivery Technology Market Size Estimation and Forecast by Containers
14.6 MEA Nasal Drug Delivery Technology Market Size Estimation and Forecast by System
14.7 MEA Nasal Drug Delivery Technology Market Size Estimation and Forecast by Dosage Form
14.8 MEA Nasal Drug Delivery Technology Market Size Estimation and Forecast by Application
14.9 MEA Nasal Drug Delivery Technology Market Size Estimation and Forecast by Respiratory Diseases
14.10 MEA Nasal Drug Delivery Technology Market Size Estimation and Forecast by Non-respiratory Diseases
14.11 MEA Nasal Drug Delivery Technology Market Size Estimation and Forecast by End-users
14.12 GCC Nasal Drug Delivery Technology Market Analysis
14.13 South Africa Nasal Drug Delivery Technology Market Analysis
14.14 Turkey Nasal Drug Delivery Technology Market Analysis
14.15 Egypt Nasal Drug Delivery Technology Market Analysis
14.16 Rest of MEA Nasal Drug Delivery Technology Market Analysis
15 Company Profiles
15.1 Competitive Landscape, 2022
15.2 Strategic Outlook
15.3 Becton, Dickinson, and Company
15.3.1 Company Snapshot
15.3.2 Company Overview
15.3.3 Financial Analysis
15.3.3.1 Net Revenue, 2017-2022
15.3.3.2 R&D, 2017-2022
15.3.3.3 Regional Market Shares, 2022
15.3.3.4 Segment Market Shares, 2022
15.3.4 Product Benchmarking
15.4 GSK plc
15.4.1 Company Snapshot
15.4.2 Company Overview
15.4.3 Financial Analysis
15.4.3.1 Net Revenue, 2017-2022
15.4.3.2 R&D, 2017-2022
15.4.3.3 Regional Market Shares, 2022
15.4.3.4 Business Segment Market Shares, 2022
15.4.4 Product Benchmarking
15.5 Johnson & Johnson
15.5.1 Company Snapshot
15.5.2 Company Overview
15.5.3 Financial Analysis
15.5.3.1 Net Revenue, 2017-2022
15.5.3.2 R&D, 2017-2022
15.5.3.3 Regional Market Shares, 2022
15.5.3.4 Business Segment Market Shares, 2022
15.5.4 Product Benchmarking
15.5.5 Strategic Outlook
15.6 Merck & Co., Inc
15.6.1 Company Snapshot
15.6.2 Company Overview
15.6.3 Financial Analysis
15.6.3.1 Net Revenue, 2017-2022
15.6.3.2 R&D, 2017-2022
15.6.3.3 Regional Market Shares, 2022
15.6.3.4 Business Segment Market Shares, 2022
15.6.4 Product Benchmarking
15.7 Novartis AG
15.7.1 Company Snapshot
15.7.2 Company Overview
15.7.3 Financial Analysis
15.7.3.1 Net Revenue, 2017-2022
15.7.3.2 R&D, 2017-2022
15.7.3.3 Regional Market Shares, 2022
15.7.3.4 Business Segment Market Shares, 2022
15.7.4 Product Benchmarking
15.8 Teva Pharmaceutical Industries Ltd.
15.8.1 Company Snapshot
15.8.2 Company Overview
15.8.3 Financial Analysis
15.8.3.1 Net Revenue, 2017-2022
15.8.3.2 R&D, 2017-2022
15.8.3.3 Regional Market Shares, 2022
15.8.3.4 Business Segment Market Shares, 2022
15.8.4 Product Benchmarking
15.8.5 Strategic Outlook
15.9 AptarGroup, Inc
15.9.1 Company Snapshot
15.9.2 Company Overview
15.9.3 Financial Analysis
15.9.3.1 Net Revenue, 2017-2022
15.9.3.2 R&D, 2017-2022
15.9.3.3 Regional Market Shares, 2022
15.9.3.4 Business Segment Market Shares, 2022
15.9.4 Product Benchmarking
15.9.5 Strategic Outlook
15.10 AstraZeneca PLC
15.10.1 Company Snapshot
15.10.2 Company Overview
15.10.3 Financial Analysis
15.10.3.1 Net Revenue, 2017-2022
15.10.3.2 R&D, 2017-2022
15.10.3.3 Regional Market Shares, 2022
15.10.3.4 Business Segment Market Shares, 2022
15.10.4 Product Benchmarking
15.10.5 Strategic Outlook
15.11 Presspart Verwaltungs GmbH
15.11.1 Company Snapshot
15.11.2 Company Overview
15.11.3 Product Benchmarking
15.11.4 Strategic Outlook
15.12 Recipharm AB
15.12.1 Company Snapshot
15.12.2 Company Overview
15.12.3 Product Benchmarking
15.12.4 Strategic Outlook
15.13 Neurelis Inc.
15.13.1 Company Snapshot
15.13.2 Overview
15.13.3 Product Benchmarking
15.13.4 Strategic Outlook
15.14 PendoPharm Inc.
15.14.1 Company Snapshot
15.14.2 Company Overview
15.14.3 Product Benchmarking
15.15 Naveh Pharma Ltd.
15.15.1 Company Snapshot
15.15.2 Company Overview
15.15.3 Product Benchmarking
15.16 Dr. Reddy's Laboratories
15.16.1 Company Snapshot
15.16.2 Company Overview
15.16.3 Financial Analysis
15.16.3.1 Net Revenue, 2017-2022
15.16.3.2 R&D, 2017-2022
15.16.3.3 Regional Market Shares, 2022
15.16.3.4 Business Segment Market Shares, 2022
15.16.4 Product Benchmarking
15.17 Pfizer Inc
15.17.1 Company Snapshot
15.17.2 Company Overview
15.17.3 Financial Analysis
15.17.3.1 Net Revenue, 2017-2022
15.17.3.2 R&D, 2017-2022
15.17.3.3 Regional Market Shares, 2022
15.17.3.4 Business Segment Market Shares, 2022
15.17.4 Product Benchmarking
15.17.5 Strategic Outlook
15.18 Nemera
15.18.1 Company Snapshot
15.18.2 Company Overview
15.18.3 Product Benchmarking
15.18.4 Strategic Outlook
15.19 Teleflex Incorporated
15.19.1 Company Snapshot
15.19.2 Company Overview
15.19.3 Product Benchmarking
15.20 Optinose US, Inc
15.20.1 Company Snapshot
15.20.2 Company Overview
15.20.3 Product Benchmarking
15.21 Flo Nasal Solution
15.21.1 Company Snapshot
15.21.2 Company Overview
15.21.3 Product Benchmarking
15.22 Bayer AG
15.22.1 Company Snapshot
15.22.2 Company Overview
15.22.3 Financial Analysis
15.22.3.1 Net Revenue, 2017-2022
15.22.3.2 R&D, 2017-2022
15.22.3.3 Regional Market Shares, 2022
15.22.3.4 Business Segment Market Shares, 2022
15.22.4 Product Benchmarking
16 Conclusion and Recommendations
16.1 Concluding Remarks from Visiongain
16.2 Recommendations for Market Players
ページTOPに戻る
List of Tables/Graphs
List of Tables
Table 1 Nasal drug delivery technology market Snapshot, 2023 & 2033 (US$ Billion, CAGR %)
Table 2 Nasal Drug Delivery Technology Market Forecast by Region, 2023-2033 (US$ Billion, AGR%, CAGR%): “V” Shaped Recovery
Table 3 Nasal Drug Delivery Technology Market Forecast by Region, 2023-2033 (US$ Billion, AGR%, CAGR%): “U” Shaped Recovery
Table 4 Nasal Drug Delivery Technology Market Forecast by Region, 2023-2033 (US$ Billion, AGR%, CAGR%): “W” Shaped Recovery
Table 5 Nasal Drug Delivery Technology Market Forecast by Region, 2023-2033 (US$ Billion, AGR%, CAGR%): “L” Shaped Recovery
Table 6 Nasal Drug Delivery Technology Market Forecast by Containers, 2023-2033 (US$ Billion, AGR%, CAGR%)
Table 1 Pressurized Containers and Commercial Drugs
Table 2 Pressurized Segment Market Forecast by Region, 2023-2033 (US$ Billion, AGR%, CAGR%)
Table 3 Non-pressurized Containers and Commercial OTC Nasal Sprays
Table 4 Non-Pressurized Segment Market Forecast by Region, 2023-2033 (US$ Billion, AGR%, CAGR%)
Table 5 Nasal Drug Delivery Technology Market Forecast by System, 2023-2033 (US$ Billion, AGR%, CAGR%)
Table 6 Nasal Bi Dose Segment Market Forecast by Region, 2023-2033 (US$ Billion, AGR%, CAGR%)
Table 7 Nasal Multi Dose Segment Market Forecast by Region, 2023-2033 (US$ Billion, AGR%, CAGR%)
Table 8 Nasal Uni Dose Segment Market Forecast by Region, 2023-2033 (US$ Billion, AGR%, CAGR%)
Table 9 Nasal Drug Delivery Technology Market Forecast by Dosage Form, 2023-2033 (US$ Billion, AGR%, CAGR%)
Table 2 Nasal Spray Segment Market Forecast by Region, 2023-2033 (US$ Billion, AGR%, CAGR%)
Table 3 Nasal Drops and Liquid Segment Market Forecast by Region, 2023-2033 (US$ Billion, AGR%, CAGR%)
Table 4 Nasal Gels Segment Market Forecast by Region, 2023-2033 (US$ Billion, AGR%, CAGR%)
Table 5 Nasal Powder Segment Market Forecast by Region, 2023-2033 (US$ Billion, AGR%, CAGR%)
Table 6 Others Segment Market Forecast by Region, 2023-2033 (US$ Billion, AGR%, CAGR%)
Table 7 Nasal Drug Delivery Technology Market Forecast by Application, 2023-2033 (US$ Billion, AGR%, CAGR%)
Table 8 Respiratory Disorders Segment Market Forecast by Region, 2023-2033 (US$ Billion, AGR%, CAGR%)
Table 9 Allergic Rhinitis Market Forecast by Region, 2023-2033 (US$ Billion, AGR%, CAGR%)
Table 10 Nasal Congestion Segment Market Forecast by Region, 2023-2033 (US$ Billion, AGR%, CAGR%)
Table 11 Asthma Segment Market Forecast by Region, 2023-2033 (US$ Billion, AGR%, CAGR%)
Table 12 Other Respiratory Disorders Segment Market Forecast by Region, 2023-2033 (US$ Billion, AGR%, CAGR%)
Table 13 Non-Respiratory Disorders Segment Market Forecast by Region, 2023-2033 (US$ Billion, AGR%, CAGR%)
Table 14 Alzheimer’s Market Forecast by Region, 2023-2033 (US$ Billion, AGR%, CAGR%)
Table 15 Cardiovascular Disorders Segment Market Forecast by Region, 2023-2033 (US$ Billion, AGR%, CAGR%)
Table 16 Neuropsychiatry Segment Market Forecast by Region, 2023-2033 (US$ Billion, AGR%, CAGR%)
Table 17 Other Non-Respiratory Disorders Segment Market Forecast by Region, 2023-2033 (US$ Billion, AGR%, CAGR%)
Table 18 Nasal Drug Delivery Technology Market Forecast by End-users, 2023-2033 (US$ Billion, AGR%, CAGR%)
Table 19 Home Health Care Segment Market Forecast by Region, 2023-2033 (US$ Billion, AGR%, CAGR%)
Table 20 Hospitals Segment Market Forecast by Region, 2023-2033 (US$ Billion, AGR%, CAGR%)
Table 21 Specialty Clinics Segment Market Forecast by Region, 2023-2033 (US$ Billion, AGR%, CAGR%)
Table 22 Vaccination Centers Segment Market Forecast by Region, 2023-2033 (US$ Billion, AGR%, CAGR%)
Table 23 Ambulatory Surgical Centers Segment Market Forecast by Region, 2023-2033 (US$ Billion, AGR%, CAGR%)
Table 24 Others Segment Market Forecast by Region, 2023-2033 (US$ Billion, AGR%, CAGR%)
Table 25 Nasal Drug Delivery Technology Market Forecast by Region, 2023-2033 (US$ Billion, AGR%, CAGR%)
Table 26 North America Nasal Drug Delivery Technology Market Forecast by Country, 2023-2033 (US$ Billion, AGR%, CAGR%)
Table 27 North America Nasal Drug Delivery Technology Market Forecast by Containers, 2023-2033 (US$ Billion, AGR%, CAGR%)
Table 28 North America Nasal Drug Delivery Technology Market Forecast by System, 2023-2033 (US$ Billion, AGR%, CAGR%)
Table 29 North America Nasal Drug Delivery Technology Market Forecast by Dosage Form, 2023-2033 (US$ Billion, AGR%, CAGR%)
Table 30 North America Nasal Drug Delivery Technology Market Forecast by Application, 2023-2033 (US$ Billion, AGR%, CAGR%)
Table 31 North America Nasal Drug Delivery Technology Market Forecast by Respiratory Diseases, 2023-2033 (US$ Billion, AGR%, CAGR%)
Table 32 North America Nasal Drug Delivery Technology Market Forecast by Non-Respiratory, 2023-2033 (US$ Billion, AGR%, CAGR%)
Table 33 North America Nasal Drug Delivery Technology Market Forecast by End-users, 2023-2033 (US$ Billion, AGR%, CAGR%)
Table 34 U.S. Nasal Drug Delivery Technology Market Forecast, 2023-2033 (US$ Billion, AGR%, CAGR%)
Table 35 Canada Nasal Drug Delivery Technology Market Forecast, 2023-2033 (US$ Billion, AGR%, CAGR%)
Table 36 European Nasal Drug Delivery Technology Market Forecast by Country, 2023-2033 (US$ Billion, AGR%, CAGR%)
Table 37 European Nasal Drug Delivery Technology Market Forecast by Containers, 2023-2033 (US$ Billion, AGR%, CAGR%)
Table 38 European Nasal Drug Delivery Technology Market Forecast by System, 2023-2033 (US$ Billion, AGR%, CAGR%)
Table 39 European Nasal Drug Delivery Technology Market Forecast by Dosage Form, 2023-2033 (US$ Billion, AGR%, CAGR%)
Table 40 European Nasal Drug Delivery Technology Market Forecast by Application, 2023-2033 (US$ Billion, AGR%, CAGR%)
Table 41 European Nasal Drug Delivery Technology Market Forecast by Respiratory Diseases, 2023-2033 (US$ Billion, AGR%, CAGR%)
Table 42 European Nasal Drug Delivery Technology Market Forecast by Non-Respiratory, 2023-2033 (US$ Billion, AGR%, CAGR%)
Table 43 European Nasal Drug Delivery Technology Market Forecast by End-users, 2023-2033 (US$ Billion, AGR%, CAGR%)
Table 44 Germany Nasal Drug Delivery Technology Market Forecast, 2023-2033 (US$ Billion, AGR%, CAGR%)
Table 45 UK Nasal Drug Delivery Technology Market Forecast, 2023-2033 (US$ Billion, AGR%, CAGR%)
Table 46 France Nasal Drug Delivery Technology Market Forecast, 2023-2033 (US$ Billion, AGR%, CAGR%)
Table 47 Italy Nasal Drug Delivery Technology Market Forecast, 2023-2033 (US$ Billion, AGR%, CAGR%)
Table 48 Spain Nasal Drug Delivery Technology Market Forecast, 2023-2033 (US$ Billion, AGR%, CAGR%)
Table 49 Russia Nasal Drug Delivery Technology Market Forecast, 2023-2033 (US$ Billion, AGR%, CAGR%)
Table 50 Netherlands Nasal Drug Delivery Technology Market Forecast, 2023-2033 (US$ Billion, AGR%, CAGR%)
Table 51 Switzerland Nasal Drug Delivery Technology Market Forecast, 2023-2033 (US$ Billion, AGR%, CAGR%)
Table 52 Rest of Europe Nasal Drug Delivery Technology Market Forecast, 2023-2033 (US$ Billion, AGR%, CAGR%)
Table 53 Asia Nasal Drug Delivery Technology Market Forecast by Country, 2023-2033 (US$ Billion, AGR%, CAGR%)
Table 54 Asia Nasal Drug Delivery Technology Market Forecast by Containers, 2023-2033 (US$ Billion, AGR%, CAGR%)
Table 55 Asia Nasal Drug Delivery Technology Market Forecast by System, 2023-2033 (US$ Billion, AGR%, CAGR%)
Table 56 Asia Nasal Drug Delivery Technology Market Forecast by Dosage Form, 2023-2033 (US$ Billion, AGR%, CAGR%)
Table 57 Asia Nasal Drug Delivery Technology Market Forecast by Application, 2023-2033 (US$ Billion, AGR%, CAGR%)
Table 58 Asia Nasal Drug Delivery Technology Market Forecast by Respiratory Diseases, 2023-2033 (US$ Billion, AGR%, CAGR%)
Table 59 Asia Nasal Drug Delivery Technology Market Forecast by Non-Respiratory, 2023-2033 (US$ Billion, AGR%, CAGR%)
Table 60 Asia Nasal Drug Delivery Technology Market Forecast by End-users, 2023-2033 (US$ Billion, AGR%, CAGR%)
Table 61 Japan Nasal Drug Delivery Technology Market Forecast, 2023-2033 (US$ Billion, AGR%, CAGR%)
Table 62 China Nasal Drug Delivery Technology Market Forecast, 2023-2033 (US$ Billion, AGR%, CAGR%)
Table 63 India Nasal Drug Delivery Technology Market Forecast, 2023-2033 (US$ Billion, AGR%, CAGR%)
Table 64 Australia Nasal Drug Delivery Technology Market Forecast, 2023-2033 (US$ Billion, AGR%, CAGR%)
Table 65 South Korea Nasal Drug Delivery Technology Market Forecast, 2023-2033 (US$ Billion, AGR%, CAGR%)
Table 66 Singapore Nasal Drug Delivery Technology Market Forecast, 2023-2033 (US$ Billion, AGR%, CAGR%)
Table 67 Thailand Nasal Drug Delivery Technology Market Forecast, 2023-2033 (US$ Billion, AGR%, CAGR%)
Table 68 Rest of Asia Nasal Drug Delivery Technology Market Forecast, 2023-2033 (US$ Billion, AGR%, CAGR%)
Table 69 Latin America Nasal Drug Delivery Technology Market Forecast by Country, 2023-2033 (US$ Billion, AGR%, CAGR%)
Table 70 Latin America Nasal Drug Delivery Technology Market Forecast by Containers, 2023-2033 (US$ Billion, AGR%, CAGR%)
Table 71 Latin America Nasal Drug Delivery Technology Market Forecast by System, 2023-2033 (US$ Billion, AGR%, CAGR%)
Table 72 Latin America Nasal Drug Delivery Technology Market Forecast by Dosage Form, 2023-2033 (US$ Billion, AGR%, CAGR%)
Table 73 Latin America Nasal Drug Delivery Technology Market Forecast by Application, 2023-2033 (US$ Billion, AGR%, CAGR%)
Table 74 Latin America Nasal Drug Delivery Technology Market Forecast by Respiratory Diseases, 2023-2033 (US$ Billion, AGR%, CAGR%)
Table 75 Latin America Nasal Drug Delivery Technology Market Forecast by Non-Respiratory, 2023-2033 (US$ Billion, AGR%, CAGR%)
Table 76 Latin America Nasal Drug Delivery Technology Market Forecast by End-users, 2023-2033 (US$ Billion, AGR%, CAGR%)
Table 77 Brazil Nasal Drug Delivery Technology Market Forecast, 2023-2033 (US$ Billion, AGR%, CAGR%)
Table 78 Mexico Nasal Drug Delivery Technology Market Forecast, 2023-2033 (US$ Billion, AGR%, CAGR%)
Table 79 Argentina Nasal Drug Delivery Technology Market Forecast, 2023-2033 (US$ Billion, AGR%, CAGR%)
Table 80 Colombia Nasal Drug Delivery Technology Market Forecast, 2023-2033 (US$ Billion, AGR%, CAGR%)
Table 81 Chile Nasal Drug Delivery Technology Market Forecast, 2023-2033 (US$ Billion, AGR%, CAGR%)
Table 82 Rest of Latin America Nasal Drug Delivery Technology Market Forecast, 2023-2033 (US$ Billion, AGR%, CAGR%)
Table 83 MEA Nasal Drug Delivery Technology Market Forecast by Country, 2023-2033 (US$ Billion, AGR%, CAGR%)
Table 84 MEA Nasal Drug Delivery Technology Market Forecast by Containers, 2023-2033 (US$ Billion, AGR%, CAGR%)
Table 85 MEA Nasal Drug Delivery Technology Market Forecast by System, 2023-2033 (US$ Billion, AGR%, CAGR%)
Table 86 MEA Nasal Drug Delivery Technology Market Forecast by Dosage Form, 2023-2033 (US$ Billion, AGR%, CAGR%)
Table 87 MEA Nasal Drug Delivery Technology Market Forecast by Application, 2023-2033 (US$ Billion, AGR%, CAGR%)
Table 88 MEA Nasal Drug Delivery Technology Market Forecast by Respiratory Diseases, 2023-2033 (US$ Billion, AGR%, CAGR%)
Table 89 MEA Nasal Drug Delivery Technology Market Forecast by Non-Respiratory, 2023-2033 (US$ Billion, AGR%, CAGR%)
Table 90 MEA Nasal Drug Delivery Technology Market Forecast by End-users, 2023-2033 (US$ Billion, AGR%, CAGR%)
Table 91 GCC Nasal Drug Delivery Technology Market Forecast, 2023-2033 (US$ Billion, AGR%, CAGR%)
Table 92 South Africa Nasal Drug Delivery Technology Market Forecast, 2023-2033 (US$ Billion, AGR%, CAGR%)
Table 93 Turkey Nasal Drug Delivery Technology Market Forecast, 2023-2033 (US$ Billion, AGR%, CAGR%)
Table 94 Egypt Nasal Drug Delivery Technology Market Forecast, 2023-2033 (US$ Billion, AGR%, CAGR%)
Table 95 Rest of MEA Nasal Drug Delivery Technology Market Forecast, 2023-2033 (US$ Billion, AGR%, CAGR%)
Table 96 Strategic Outlook
Table 97 Becton Dickinson and Company: Key Details, (CEO, HQ, Revenue, Founded, No. of Employees, Company Type, Website, Business Segment)
Table 98 AbbVie: Product Benchmarking
Table 99 GSK plc: Key Details, (CEO, HQ, Revenue, Founded, No. of Employees, Company Type, Website, Business Segment)
Table 100 GSK plc: Product Benchmarking
Table 101 Johnson & Johnson: Key Details, (CEO, HQ, Revenue, Founded, No. of Employees, Company Type, Website, Business Segment)
Table 102 Johnson & Johnson: Product Benchmarking
Table 103 Johnson & Johnson: Strategic Outlook
Table 104 Merck & Co. Inc: Key Details, (CEO, HQ, Revenue, Founded, No. of Employees, Company Type, Website, Business Segment)
Table 105 Merck & Co., Inc: Product Benchmarking
Table 106 Novartis AG: Key Details, (CEO, HQ, Revenue, Founded, No. of Employees, Company Type, Website, Business Segment)
Table 107 Novartis AG: Product Benchmarking
Table 108 Teva Pharmaceutical: Key Details, (CEO, HQ, Revenue, Founded, No. of Employees, Company Type, Website, Business Segment)
Table 109 Teva Pharmaceutical Industries Ltd: Product Benchmarking
Table 110 Teva Pharmaceutical Industries Ltd: Strategic Outlook
Table 111 AptarGroup Inc: Key Details, (CEO, HQ, Revenue, Founded, No. of Employees, Company Type, Website, Business Segment)
Table 112 AptarGroup Inc.: Product Benchmarking
Table 113 AptarGroup Inc.: Strategic Outlook
Table 114 AstraZeneca Plc: Key Details, (CEO, HQ, Revenue, Founded, No. of Employees, Company Type, Website, Business Segment)
Table 115 AstraZeneca PLC: Product Benchmarking
Table 116 AstraZeneca PLC: Strategic Outlook
Table 117 Presspart Verwaltungs GmbH: Key Details, (CEO, HQ, Revenue, Founded, No. of Employees, Company Type, Website, Business Segment)
Table 118 Presspart Verwaltungs GmbH: Product Benchmarking
Table 119 Presspart Verwaltungs GmbH: Strategic Outlook
Table 120 Recipharm AB: Key Details, (CEO, HQ, Revenue, Founded, No. of Employees, Company Type, Website, Business Segment)
Table 121 Recipharm AB: Product Benchmarking
Table 122 Recipharm AB: Strategic Outlook
Table 123 Neurelis Inc: Key Details, (CEO, HQ, Revenue, Founded, No. of Employees, Company Type, Website, Business Segment)
Table 124 Neurelis Inc: Product Benchmarking
Table 125 Neurelis Inc: Strategic Outlook
Table 126 PendoPharm Inc: Key Details, (CEO, HQ, Revenue, Founded, No. of Employees, Company Type, Website, Business Segment)
Table 127 PendoPharm Inc.: Product Benchmarking
Table 128 Naveh Pharma Ltd: Key Details, (CEO, HQ, Revenue, Founded, No. of Employees, Company Type, Website, Business Segment)
Table 129 Naveh Pharma Ltd: Product Benchmarking
Table 130 Dr Reddy: Key Details, (CEO, HQ, Revenue, Founded, No. of Employees, Company Type, Website, Business Segment)
Table 131 Dr. Reddy's Laboratories: Product Benchmarking
Table 132 Pfizer Inc: Key Details, (CEO, HQ, Revenue, Founded, No. of Employees, Company Type, Website, Business Segment)
Table 133 Pfizer Inc: Product Benchmarking
Table 134 Pfizer Inc: Strategic Outlook
Table 135 Nemera: Key Details, (CEO, HQ, Revenue, Founded, No. of Employees, Company Type, Website, Business Segment)
Table 136 Nemera: Product Benchmarking
Table 137 Nemera: Strategic Outlook
Table 138 Teleflex Incorporated: Key Details, (CEO, HQ, Revenue, Founded, No. of Employees, Company Type, Website, Business Segment)
Table 139 Teleflex Incorporated: Product Benchmarking
Table 140 Optinose US Inc: Key Details, (CEO, HQ, Revenue, Founded, No. of Employees, Company Type, Website, Business Segment)
Table 141 Optinose US Inc: Product Benchmarking
Table 142 ENT Technologies: Key Details, (CEO, HQ, Revenue, Founded, No. of Employees, Company Type, Website, Business Segment)
Table 143 Flo Nasal Solution: Product Benchmarking
Table 144 Bayer AG: Key Details, (CEO, HQ, Revenue, Founded, No. of Employees, Company Type, Website, Business Segment)
Table 145 Bayer AG: Product Benchmarking
List of Figures
Figure 1 Nasal Drug Delivery Technology Market Segmentation
Figure 2 Nasal Drug Delivery Technology Market by Containers: Market Attractiveness Index
Figure 3 Nasal Drug Delivery Technology Market by System: Market Attractiveness Index
Figure 4 Nasal Drug Delivery Technology Market by Dosage Form: Market Attractiveness Index
Figure 5 Nasal Drug Delivery Technology Market by Application: Market Attractiveness Index
Figure 6 Nasal Drug Delivery Technology Market by Respiratory diseases: Market Attractiveness Index
Figure 7 Nasal Drug Delivery Technology Market by Non-Respiratory: Market Attractiveness Index
Figure 8 Nasal Drug Delivery Technology Market by End-users: Market Attractiveness Index
Figure 9 Nasal drug delivery technology market Attractiveness Index by Region
Figure 10 Nasal drug delivery technology Market: Market Dynamics
Figure 11 Nasal Drug Delivery Technology Market by Region, 2023-2033 (US$ Billion, AGR %): “V” Shaped Recovery
Figure 12 Nasal Drug Delivery Technology Market by Region, 2023-2033 (US$ Billion, AGR %): “U” Shaped Recovery
Figure 13 Nasal Drug Delivery Technology Market by Region, 2023-2033 (US$ Billion, AGR %): “W” Shaped Recovery
Figure 14 Nasal Drug Delivery Technology Market by Region, 2023-2033 (US$ Billion, AGR %): “L” Shaped Recovery
Figure 15 Nasal Drug Delivery Technology Market: Porter’s Five Forces Analysis
Figure 16 Nasal Drug Delivery Technology Market: PEST Analysis
Figure 17 Nasal Drug Delivery Technology Market by Container: Market Attractiveness Index
Figure 18 Nasal Drug Delivery Technology Market Forecast by Containers, 2023-2033 (US$ Billion, AGR %)
Figure 19 Nasal drug delivery technology market Share Forecast by Containers, 2023, 2028, 2033 (%)
Figure 20 Pressurized Segment Market Forecast by Region, 2023-2033 (US$ Billion, AGR %)
Figure 21 Pressurized Segment Market Share Forecast by Region, 2023 & 2033 (%)
Figure 22 Non-Pressurized Segment Market Forecast by Region, 2023-2033 (US$ Billion, AGR %)
Figure 23 Non-Pressurized Segment Market Share Forecast by Region, 2023 & 2033 (%)
Figure 24 Nasal Drug Delivery Technology Market by System: Market Attractiveness Index
Figure 25 Nasal Drug Delivery Technology Market Forecast by System, 2023-2033 (US$ Billion, AGR %)
Figure 26 Nasal drug delivery technology market Share Forecast by System, 2023, 2028, 2033 (%)
Figure 27 Nasal Bi Dose Segment Market Forecast by Region, 2023-2033 (US$ Billion, AGR %)
Figure 28 Nasal Bi Dose Segment Market Share Forecast by Region, 2023 & 2033 (%)
Figure 29 Nasal Multi Dose Segment Market Forecast by Region, 2023-2033 (US$ Billion, AGR %)
Figure 30 Nasal Multi Dose Segment Market Share Forecast by Region, 2023 & 2033 (%)
Figure 31 Nasal Uni Dose Segment Market Forecast by Region, 2023-2033 (US$ Billion, AGR %)
Figure 32 Nasal Uni Dose Segment Market Share Forecast by Region, 2023 & 2033 (%)
Figure 33 Nasal Drug Delivery Technology Market by Dosage Form: Market Attractiveness Index
Figure 34 Nasal Drug Delivery Technology Market Forecast by Dosage Form, 2023-2033 (US$ Billion, AGR %)
Figure 35 Nasal drug delivery technology market Share Forecast by Dosage Form, 2023, 2028, 2033 (%)
Figure 36 Nasal Spray Segment Market Forecast by Region, 2023-2033 (US$ Billion, AGR %)
Figure 37 Nasal Spray Segment Market Share Forecast by Region, 2023 & 2033 (%)
Figure 38 Nasal Drops and Liquid Segment Market Forecast by Region, 2023-2033 (US$ Billion, AGR %)
Figure 39 Nasal Drops and Liquid Segment Market Share Forecast by Region, 2023 & 2033 (%)
Figure 40 Nasal Gels Segment Market Forecast by Region, 2023-2033 (US$ Billion, AGR %)
Figure 41 Non-pressurized Containers Segment Market Share Forecast by Region, 2023 & 2033 (%)
Figure 42 Nasal Powder Segment Market Forecast by Region, 2023-2033 (US$ Billion, AGR %)
Figure 43 Nasal Powder Segment Market Share Forecast by Region, 2023 & 2033 (%)
Figure 44 Others Segment Market Forecast by Region, 2023-2033 (US$ Billion, AGR %)
Figure 45 Others Segment Market Share Forecast by Region, 2023 & 2033 (%)
Figure 46 Nasal Drug Delivery Technology Market by Application: Market Attractiveness Index
Figure 47 Nasal Drug Delivery Technology Market Forecast by Application, 2023-2033 (US$ Billion, AGR %)
Figure 48 Nasal drug delivery technology market Share Forecast by Application, 2023, 2028, 2033 (%)
Figure 49 Respiratory Disorders Segment Market Forecast by Region, 2023-2033 (US$ Billion, AGR %)
Figure 50 Respiratory Disorders Segment Market Share Forecast by Region, 2023 & 2033 (%)
Figure 51 Allergic Rhinitis Market Forecast by Region, 2023-2033 (US$ Billion, AGR %)
Figure 52 Allergic Rhinitis Segment Market Share Forecast by Region, 2023 & 2033 (%)
Figure 53 Nasal Congestion Segment Market Forecast by Region, 2023-2033 (US$ Billion, AGR %)
Figure 54 Nasal Congestion Segment Market Share Forecast by Region, 2023 & 2033 (%)
Figure 55 Asthma Segment Market Forecast by Region, 2023-2033 (US$ Billion, AGR %)
Figure 56 Asthma Segment Market Share Forecast by Region, 2023 & 2033 (%)
Figure 57 Other Respiratory Disorders Segment Market Forecast by Region, 2023-2033 (US$ Billion, AGR %)
Figure 58 Other Respiratory Disorders Segment Market Share Forecast by Region, 2023 & 2033 (%)
Figure 59 Non-Respiratory Disorders Segment Market Forecast by Region, 2023-2033 (US$ Billion, AGR %)
Figure 60 Non-Respiratory Disorders Segment Market Share Forecast by Region, 2023 & 2033 (%)
Figure 61 Alzheimer’s Market Forecast by Region, 2023-2033 (US$ Billion, AGR %)
Figure 62 Alzheimer’s Segment Market Share Forecast by Region, 2023 & 2033 (%)
Figure 63 Cardiovascular Disorders Segment Market Forecast by Region, 2023-2033 (US$ Billion, AGR %)
Figure 64 Cardiovascular Disorders Segment Market Share Forecast by Region, 2023 & 2033 (%)
Figure 65 Neuropsychiatry Segment Market Forecast by Region, 2023-2033 (US$ Billion, AGR %)
Figure 66 Neuropsychiatry Segment Market Share Forecast by Region, 2023 & 2033 (%)
Figure 67 Other Non-Respiratory Disorders Segment Market Forecast by Region, 2023-2033 (US$ Billion, AGR %)
Figure 68 Other Non-Respiratory Disorders Segment Market Share Forecast by Region, 2023 & 2033 (%)
Figure 69 Nasal Drug Delivery Technology Market by End-users: Market Attractiveness Index
Figure 70 Nasal Drug Delivery Technology Market Forecast by End-users, 2023-2033 (US$ Billion, AGR %)
Figure 71 Nasal drug delivery technology market Share Forecast by End-users, 2023, 2028, 2033 (%)
Figure 72 Home Health Care Segment Market Forecast by Region, 2023-2033 (US$ Billion, AGR %)
Figure 73 Home Health Care Segment Market Share Forecast by Region, 2023 & 2033 (%)
Figure 74 Hospitals Segment Market Forecast by Region, 2023-2033 (US$ Billion, AGR %)
Figure 75 Hospitals Segment Market Share Forecast by Region, 2023 & 2033 (%)
Figure 76 Specialty Clinics Segment Market Forecast by Region, 2023-2033 (US$ Billion, AGR %)
Figure 77 Specialty Clinics Segment Market Share Forecast by Region, 2023 & 2033 (%)
Figure 78 Vaccination Centers Segment Market Forecast by Region, 2023-2033 (US$ Billion, AGR %)
Figure 79 Vaccination Centers Segment Market Share Forecast by Region, 2023 & 2033 (%)
Figure 80 Ambulatory Surgical Centers Segment Market Forecast by Region, 2023-2033 (US$ Billion, AGR %)
Figure 81 Ambulatory Surgical Centers Segment Market Share Forecast by Region, 2023 & 2033 (%)
Figure 82 Others Segment Market Forecast by Region, 2023-2033 (US$ Billion, AGR %)
Figure 83 Others Segment Market Share Forecast by Region, 2023 & 2033 (%)
Figure 84 Nasal Drug Delivery Technology Market Forecast by Region 2023 and 2033 (Revenue, CAGR%)
Figure 85 Nasal drug delivery technology market Share Forecast by Region 2023, 2028, 2033 (%)
Figure 86 Nasal Drug Delivery Technology Market by Region, 2023-2033 (US$ Billion, AGR %)
Figure 87 North America Nasal Drug Delivery Technology Market Attractiveness Index
Figure 88 North America Nasal Drug Delivery Technology Market by Region, 2023, 2028 & 2033 (US$ Billion)
Figure 89 North America Nasal Drug Delivery Technology Market Forecast by Country, 2023-2033 (US$ Billion, AGR %)
Figure 90 North America Nasal Drug Delivery Technology Market Share Forecast by Country, 2023 & 2033 (%)
Figure 91 North America Nasal Drug Delivery Technology Market Forecast by Containers, 2023-2033 (US$ Billion, AGR %)
Figure 92 North America Nasal Drug Delivery Technology Market Share Forecast by Containers, 2023 & 2033 (%)
Figure 93 North America Nasal Drug Delivery Technology Market Forecast by System, 2023-2033 (US$ Billion, AGR %)
Figure 94 North America Nasal Drug Delivery Technology Market Share Forecast by System, 2023 & 2033 (%)
Figure 95 North America Nasal Drug Delivery Technology Market Forecast by Dosage Form, 2023-2033 (US$ Billion, AGR %)
Figure 96 North America Nasal Drug Delivery Technology Market Share Forecast by Dosage Form, 2023 & 2033 (%)
Figure 97 North America Nasal Drug Delivery Technology Market Forecast by Application, 2023-2033 (US$ Billion, AGR %)
Figure 98 North America Nasal Drug Delivery Technology Market Share Forecast by Application, 2023 & 2033 (%)
Figure 99 North America Nasal Drug Delivery Technology Market Forecast by Respiratory Diseases, 2023-2033 (US$ Billion, AGR %)
Figure 100 North America Nasal Drug Delivery Technology Market Share Forecast by Respiratory Diseases, 2023 & 2033 (%)
Figure 101 North America Nasal Drug Delivery Technology Market Forecast by Non-respiratory Diseases, 2023-2033 (US$ Billion, AGR %)
Figure 102 North America Nasal Drug Delivery Technology Market Share Forecast by Non-respiratory Diseases, 2023 & 2033 (%)
Figure 103 North America Nasal Drug Delivery Technology Market Forecast by End-users, 2023-2033 (US$ Billion, AGR %)
Figure 104 North America Nasal Drug Delivery Technology Market Share Forecast by End-users, 2023 & 2033 (%)
Figure 105 U.S. Nasal Drug Delivery Technology Market Forecast, 2023-2033 (US$ Billion, AGR %)
Figure 106 Canada Nasal Drug Delivery Technology Market Forecast, 2023-2033 (US$ Billion, AGR %)
Figure 107 European Nasal Drug Delivery Technology Market Attractiveness Index
Figure 108 European Nasal Drug Delivery Technology Market by Region, 2023, 2028 & 2033 (US$ Billion)
Figure 109 European Nasal Drug Delivery Technology Market Forecast by Country, 2023-2033 (US$ Billion, AGR %)
Figure 110 European Nasal Drug Delivery Technology Market Share Forecast by Country, 2023 & 2033 (%)
Figure 111 European Nasal Drug Delivery Technology Market Forecast by Containers, 2023-2033 (US$ Billion, AGR %)
Figure 112 European Nasal Drug Delivery Technology Market Share Forecast by Containers, 2023 & 2033 (%)
Figure 113 European Nasal Drug Delivery Technology Market Forecast by System, 2023-2033 (US$ Billion, AGR %)
Figure 114 European Nasal Drug Delivery Technology Market Share Forecast by System, 2023 & 2033 (%)
Figure 115 European Nasal Drug Delivery Technology Market Forecast by Dosage Form, 2023-2033 (US$ Billion, AGR %)
Figure 116 European Nasal Drug Delivery Technology Market Share Forecast by Dosage Form, 2023 & 2033 (%)
Figure 117 European Nasal Drug Delivery Technology Market Forecast by Application, 2023-2033 (US$ Billion, AGR %)
Figure 118 European Nasal Drug Delivery Technology Market Share Forecast by Application, 2023 & 2033 (%)
Figure 119 European Nasal Drug Delivery Technology Market Forecast by Respiratory Diseases, 2023-2033 (US$ Billion, AGR %)
Figure 120 European Nasal Drug Delivery Technology Market Share Forecast by Respiratory Diseases, 2023 & 2033 (%)
Figure 121 European Nasal Drug Delivery Technology Market Forecast by Non-respiratory Diseases, 2023-2033 (US$ Billion, AGR %)
Figure 122 European Nasal Drug Delivery Technology Market Share Forecast by Non-respiratory Diseases, 2023 & 2033 (%)
Figure 123 European Nasal Drug Delivery Technology Market Forecast by End-users, 2023-2033 (US$ Billion, AGR %)
Figure 124 European Nasal Drug Delivery Technology Market Share Forecast by End-users, 2023 & 2033 (%)
Figure 125 Germany Nasal Drug Delivery Technology Market Forecast, 2023-2033 (US$ Billion, AGR %)
Figure 126 UK Nasal Drug Delivery Technology Market Forecast, 2023-2033 (US$ Billion, AGR %)
Figure 127 France Nasal Drug Delivery Technology Market Forecast, 2023-2033 (US$ Billion, AGR %)
Figure 128 Italy Nasal Drug Delivery Technology Market Forecast, 2023-2033 (US$ Billion, AGR %)
Figure 129 Spain Nasal Drug Delivery Technology Market Forecast, 2023-2033 (US$ Billion, AGR %)
Figure 130 Russia Nasal Drug Delivery Technology Market Forecast, 2023-2033 (US$ Billion, AGR %)
Figure 131 Netherlands Nasal Drug Delivery Technology Market Forecast, 2023-2033 (US$ Billion, AGR %)
Figure 132 Switzerland Nasal Drug Delivery Technology Market Forecast, 2023-2033 (US$ Billion, AGR %)
Figure 133 Rest of Europe Nasal Drug Delivery Technology Market Forecast, 2023-2033 (US$ Billion, AGR %)
Figure 134 Asia Nasal Drug Delivery Technology Market Attractiveness Index
Figure 135 Asia Nasal Drug Delivery Technology Market by Region, 2023, 2028 & 2033 (US$ Billion)
Figure 136 Asia Nasal Drug Delivery Technology Market Forecast by Country, 2023-2033 (US$ Billion, AGR %)
Figure 137 Asia Nasal Drug Delivery Technology Market Share Forecast by Country, 2023 & 2033 (%)
Figure 138 Asia Nasal Drug Delivery Technology Market Forecast by Containers, 2023-2033 (US$ Billion, AGR %)
Figure 139 Asia Nasal Drug Delivery Technology Market Share Forecast by Containers, 2023 & 2033 (%)
Figure 140 Asia Nasal Drug Delivery Technology Market Forecast by System, 2023-2033 (US$ Billion, AGR %)
Figure 141 Asia Nasal Drug Delivery Technology Market Share Forecast by System, 2023 & 2033 (%)
Figure 142 Asia Nasal Drug Delivery Technology Market Forecast by Dosage Form, 2023-2033 (US$ Billion, AGR %)
Figure 143 Asia Nasal Drug Delivery Technology Market Share Forecast by Dosage Form, 2023 & 2033 (%)
Figure 144 Asia Nasal Drug Delivery Technology Market Forecast by Application, 2023-2033 (US$ Billion, AGR %)
Figure 145 Asia Nasal Drug Delivery Technology Market Share Forecast by Application, 2023 & 2033 (%)
Figure 146 Asia Nasal Drug Delivery Technology Market Forecast by Respiratory Diseases, 2023-2033 (US$ Billion, AGR %)
Figure 147 Asia Nasal Drug Delivery Technology Market Share Forecast by Respiratory Diseases, 2023 & 2033 (%)
Figure 148 Asia Nasal Drug Delivery Technology Market Forecast by Non-respiratory Diseases, 2023-2033 (US$ Billion, AGR %)
Figure 149 Asia Nasal Drug Delivery Technology Market Share Forecast by Non-respiratory Diseases, 2023 & 2033 (%)
Figure 150 Asia Nasal Drug Delivery Technology Market Forecast by End-users, 2023-2033 (US$ Billion, AGR %)
Figure 151 Asia Nasal Drug Delivery Technology Market Share Forecast by End-users, 2023 & 2033 (%)
Figure 152 Japan Nasal Drug Delivery Technology Market Forecast, 2023-2033 (US$ Billion, AGR %)
Figure 153 China Nasal Drug Delivery Technology Market Forecast, 2023-2033 (US$ Billion, AGR %)
Figure 154 India Nasal Drug Delivery Technology Market Forecast, 2023-2033 (US$ Billion, AGR %)
Figure 155 Australia Nasal Drug Delivery Technology Market Forecast, 2023-2033 (US$ Billion, AGR %)
Figure 156 South Korea Nasal Drug Delivery Technology Market Forecast, 2023-2033 (US$ Billion, AGR %)
Figure 157 Singapore Nasal Drug Delivery Technology Market Forecast, 2023-2033 (US$ Billion, AGR %)
Figure 158 Thailand Nasal Drug Delivery Technology Market Forecast, 2023-2033 (US$ Billion, AGR %)
Figure 159 Rest of Asia Nasal Drug Delivery Technology Market Forecast, 2023-2033 (US$ Billion, AGR %)
Figure 160 Latin America Nasal Drug Delivery Technology Market Attractiveness Index
Figure 161 Latin America Nasal Drug Delivery Technology Market by Region, 2023, 2028 & 2033 (US$ Billion)
Figure 162 Latin America Nasal Drug Delivery Technology Market Forecast by Country, 2023-2033 (US$ Billion, AGR %)
Figure 163 Latin America Nasal Drug Delivery Technology Market Share Forecast by Country, 2023 & 2033 (%)
Figure 164 Latin America Nasal Drug Delivery Technology Market Forecast by Containers, 2023-2033 (US$ Billion, AGR %)
Figure 165 Latin America Nasal Drug Delivery Technology Market Share Forecast by Containers, 2023 & 2033 (%)
Figure 166 Latin America Nasal Drug Delivery Technology Market Forecast by System, 2023-2033 (US$ Billion, AGR %)
Figure 167 Latin America Nasal Drug Delivery Technology Market Share Forecast by System, 2023 & 2033 (%)
Figure 168 Latin America Nasal Drug Delivery Technology Market Forecast by Dosage Form, 2023-2033 (US$ Billion, AGR %)
Figure 169 Latin America Nasal Drug Delivery Technology Market Share Forecast by Dosage Form, 2023 & 2033 (%)
Figure 170 Latin America Nasal Drug Delivery Technology Market Forecast by Application, 2023-2033 (US$ Billion, AGR %)
Figure 171 Latin America Nasal Drug Delivery Technology Market Share Forecast by Application, 2023 & 2033 (%)
Figure 172 Latin America Nasal Drug Delivery Technology Market Forecast by Respiratory Diseases, 2023-2033 (US$ Billion, AGR %)
Figure 173 Latin America Nasal Drug Delivery Technology Market Share Forecast by Respiratory Diseases, 2023 & 2033 (%)
Figure 174 Latin America Nasal Drug Delivery Technology Market Forecast by Non-respiratory Diseases, 2023-2033 (US$ Billion, AGR %)
Figure 175 Latin America Nasal Drug Delivery Technology Market Share Forecast by Non-respiratory Diseases, 2023 & 2033 (%)
Figure 176 Latin America Nasal Drug Delivery Technology Market Forecast by End-users, 2023-2033 (US$ Billion, AGR %)
Figure 177 Latin America Nasal Drug Delivery Technology Market Share Forecast by End-users, 2023 & 2033 (%)
Figure 178 Brazil Nasal Drug Delivery Technology Market Forecast, 2023-2033 (US$ Billion, AGR %)
Figure 179 Mexico Nasal Drug Delivery Technology Market Forecast, 2023-2033 (US$ Billion, AGR %)
Figure 180 Argentina Nasal Drug Delivery Technology Market Forecast, 2023-2033 (US$ Billion, AGR %)
Figure 181 Colombia Nasal Drug Delivery Technology Market Forecast, 2023-2033 (US$ Billion, AGR %)
Figure 182 Chile Nasal Drug Delivery Technology Market Forecast, 2023-2033 (US$ Billion, AGR %)
Figure 183 Rest of Latin America Nasal Drug Delivery Technology Market Forecast, 2023-2033 (US$ Billion, AGR %)
Figure 184 MEA Nasal Drug Delivery Technology Market Attractiveness Index
Figure 185 MEA Nasal Drug Delivery Technology Market by Region, 2023, 2028 & 2033 (US$ Billion)
Figure 186 MEA Nasal Drug Delivery Technology Market Forecast by Country, 2023-2033 (US$ Billion, AGR %)
Figure 187 MEA Nasal Drug Delivery Technology Market Share Forecast by Country, 2023 & 2033 (%)
Figure 188 MEA Nasal Drug Delivery Technology Market Forecast by System, 2023-2033 (US$ Billion, AGR %)
Figure 189 MEA Nasal Drug Delivery Technology Market Share Forecast by Containers, 2023 & 2033 (%)
Figure 190 MEA Nasal Drug Delivery Technology Market Forecast by System, 2023-2033 (US$ Billion, AGR %)
Figure 191 MEA Nasal Drug Delivery Technology Market Share Forecast by System, 2023 & 2033 (%)
Figure 192 MEA Nasal Drug Delivery Technology Market Forecast by Dosage Form, 2023-2033 (US$ Billion, AGR %)
Figure 193 MEA Nasal Drug Delivery Technology Market Share Forecast by Dosage Form, 2023 & 2033 (%)
Figure 194 MEA Nasal Drug Delivery Technology Market Forecast by Application, 2023-2033 (US$ Billion, AGR %)
Figure 195 MEA Nasal Drug Delivery Technology Market Share Forecast by Application, 2023 & 2033 (%)
Figure 196 MEA Nasal Drug Delivery Technology Market Forecast by Respiratory Diseases, 2023-2033 (US$ Billion, AGR %)
Figure 197 MEA Nasal Drug Delivery Technology Market Share Forecast by Respiratory Diseases, 2023 & 2033 (%)
Figure 198 MEA Nasal Drug Delivery Technology Market Forecast by Non-respiratory Diseases, 2023-2033 (US$ Billion, AGR %)
Figure 199 MEA Nasal Drug Delivery Technology Market Share Forecast by Non-respiratory Diseases, 2023 & 2033 (%)
Figure 200 MEA Nasal Drug Delivery Technology Market Forecast by End-users, 2023-2033 (US$ Billion, AGR %)
Figure 201 MEA Nasal Drug Delivery Technology Market Share Forecast by End-users, 2023 & 2033 (%)
Figure 202 GCC Nasal Drug Delivery Technology Market Forecast, 2023-2033 (US$ Billion, AGR %)
Figure 203 South Africa Nasal Drug Delivery Technology Market Forecast, 2023-2033 (US$ Billion, AGR %)
Figure 204 Turkey Nasal Drug Delivery Technology Market Forecast, 2023-2033 (US$ Billion, AGR %)
Figure 205 Egypt Nasal Drug Delivery Technology Market Forecast, 2023-2033 (US$ Billion, AGR %)
Figure 206 Rest of MEA Nasal Drug Delivery Technology Market Forecast, 2023-2033 (US$ Billion, AGR %)
Figure 207 Nasal Drug Delivery Technology Market: Company Share, 2022
Figure 208 Becton, Dickinson, and Company: Net Revenue, 2017-2022 (US$ Million, AGR%)
Figure 209 Becton, Dickinson, and Company: R&D, 2017-2022 (US$ Million, AGR%)
Figure 210 Becton, Dickinson, and Company: Regional Market Shares, 2022
Figure 211 Becton, Dickinson, and Company: Business Segment Market Shares, 2022
Figure 212 GSK plc: Net Revenue, 2017-2022 (US$ million, AGR%)
Figure 213 GSK plc: R&D, 2017-2022 (US$ million, AGR%)
Figure 214 GSK plc: Regional Market Shares, 2022
Figure 215 GSK plc: Business Segment Market Shares, 2022
Figure 216 Johnson & Johnson: Net Revenue, 2017-2022 (US$ million, AGR%)
Figure 217 Johnson & Johnson: R&D, 2017-2022 (US$ million, AGR%)
Figure 218 Johnson & Johnson: Regional Market Shares, 2022
Figure 219 Johnson & Johnson: Business Segment Market Shares, 2022
Figure 220 Merck & Co., Inc: Net Revenue, 2017-2022 (US$ million, AGR%)
Figure 221 Merck & Co., Inc: R&D, 2017-2022 (US$ million, AGR%)
Figure 222 Merck & Co., Inc: Regional Market Shares, 2022
Figure 223 Merck & Co., Inc: Business Segment Market Shares, 2022
Figure 224 Novartis AG: Net Revenue, 2017-2022 (US$ million, AGR%)
Figure 225 Novartis AG: R&D, 2017-2022 (US$ million, AGR%)
Figure 226 Novartis AG: Regional Market Shares, 2022
Figure 227 Novartis AG: Business Segment Market Shares, 2022
Figure 228 Teva Pharmaceutical Industries Ltd: Net Revenue, 2017-2022 (US$ million, AGR%)
Figure 229 Teva Pharmaceutical Industries Ltd: R&D, 2017-2022 (US$ million, AGR%)
Figure 230 Teva Pharmaceutical Industries Ltd: Regional Market Shares, 2022
Figure 231 Teva Pharmaceutical Industries Ltd: Business Segment Market Shares, 2022
Figure 232 AptarGroup Inc.: Net Revenue, 2017-2022 (US$ million, AGR%)
Figure 233 AptarGroup Inc.: R&D, 2017-2022 (US$ million, AGR%)
Figure 234 AptarGroup Inc.: Regional Market Shares, 2022
Figure 235 AptarGroup Inc.: Business Segment Market Shares, 2022
Figure 236 AstraZeneca PLC: Net Revenue, 2017-2022 (US$ million, AGR%)
Figure 237 AstraZeneca PLC: R&D, 2017-2022 (US$ million, AGR%)
Figure 238 AstraZeneca PLC: Regional Market Shares, 2022
Figure 239 AstraZeneca PLC: Business Segment Market Shares, 2022
Figure 240 Dr. Reddy's Laboratories: Net Revenue, 2017-2022 (US$ million, AGR%)
Figure 241 Dr. Reddy's Laboratories: R&D, 2017-2022 (US$ million, AGR%)
Figure 242 Dr. Reddy's Laboratories: Regional Market Shares, 2022
Figure 243 Dr. Reddy's Laboratories: Business Segment Market Shares, 2022
Figure 244 Pfizer Inc: Net Revenue, 2017-2022 (US$ million, AGR%)
Figure 245 Pfizer Inc: R&D, 2017-2022 (US$ million, AGR%)
Figure 246 Pfizer Inc: Regional Market Shares, 2022
Figure 247 Pfizer Inc: Business Segment Market Shares, 2022
Figure 248 Bayer AG: Net Revenue, 2017-2022 (US$ million, AGR%)
Figure 249 Bayer AG: R&D, 2017-2022 (US$ million, AGR%)
Figure 250 Bayer AG: Regional Market Shares, 2022
Figure 251 Bayer AG: Business Segment Market Shares, 2022
ページTOPに戻る
本レポートと同じKEY WORD(drug)の最新刊レポート
-
Global Biosimulation Market (2022 Edition) – Analysis By Component (Software, Service), Application (Drug Discovery, Pre-Clinical, Clinical), End-User, By Region, By Country: Market Insights and Forecast (2018-2028)
-
組換えタンパク質市場:製品(成長因子、ケモカイン、構造タンパク質、膜タンパク質)、用途(創薬・開発、バイオ医薬品生産、研究、診断)、エンドユーザー(バイオテクノロジー、CRO)別 - 2027年までの世界予測
-
Saudi Arabia Telepathology Services Market, By System (Static Image Based Systems, Virtual Slide Systems, Real-Time Systems), By Application (Teleconsultation, Disease Diagnosis, Drug Discovery & Training, Others), By End User (Pharmaceutical & Biotechnology Companies, Hospitals & Diagnostic Laboratories, Academic & Government Research Institutes), By Region, Competition Forecast & Opportunities, 2027
-
バイオシミュレーション市場の規模、シェア、動向分析レポート:製品別(ソフトウェア、サービス)、用途別(医薬品開発、創薬)、エンドユーザー別、地域別、セグメント別予測、2022年〜2030年
-
皮下注射針市場セグメント化されています。製品別(安全皮下注射針、非安全皮下注射針)、用途別(ドラッグデリバリー、ワクチン接種、血液検体採取)、エンドユーザー別(病院、糖尿病患者、家庭医、精神科、その他)、地域別 - 2019-2021年の市場規模、シェア&トレンド、2031年までの予測などグローバルな分析が可能
-
分子モデリング市場。セグメント別:用途別(創薬、薬剤開発、その他)、製品タイプ別(ソフトウェア、サービス)、地域別 - 2019-2020年の市場規模、シェア、トレンドの世界分析、2031年までの予測
-
長寿・抗老化療法市場:療法別(老化防止薬物療法、遺伝子療法、免疫療法)、用途別(癌、その他)、エンドユーザー別(病院、医療サービス機関)。世界の市場機会分析および産業予測、2020-2030年
-
デジタル薬局市場:医薬品(Rx、OTC)、製品(医療、パーソナルケア、ビタミン&サプリメント、糖尿病、CVD、腫瘍)、プラットフォーム(アプリ、ウェブサイト)、ビジネスモデル(Captive、フランチャイズ、Aggregator)、地域(都市、地方)- 2027年までの世界市場予測
-
にきび治療薬市場ニキビタイプ別(炎症性、非炎症性、コメド性、手術後、その他)、用途別(病院、オンライン、E薬局、小売、その他)、薬剤タイプ別(抗生物質、抗菌剤、ホルモン剤、局所レチノイド、その他)、地域別に分類 ~2019~2020年の市場規模、シェア&トレンド、2030年の予測をグローバルで分析
-
注射用薬物送達デバイスの世界市場 2022-2026
よくあるご質問
Visiongain社はどのような調査会社ですか?
英国の調査会社ヴィジョンゲイン社(Visiongain)は、通信とエネルギーのほか、自動車や化学・医薬品、金属など、広範な市場を対象に調査を行っています。自動車市場については、市場全般に関する調査のほ... もっと見る
調査レポートの納品までの日数はどの程度ですか?
在庫のあるものは速納となりますが、平均的には 3-4日と見て下さい。
但し、一部の調査レポートでは、発注を受けた段階で内容更新をして納品をする場合もあります。
発注をする前のお問合せをお願いします。
注文の手続きはどのようになっていますか?
1)お客様からの御問い合わせをいただきます。
2)見積書やサンプルの提示をいたします。
3)お客様指定、もしくは弊社の発注書をメール添付にて発送してください。
4)データリソース社からレポート発行元の調査会社へ納品手配します。
5) 調査会社からお客様へ納品されます。最近は、pdfにてのメール納品が大半です。
お支払方法の方法はどのようになっていますか?
納品と同時にデータリソース社よりお客様へ請求書(必要に応じて納品書も)を発送いたします。
お客様よりデータリソース社へ(通常は円払い)の御振り込みをお願いします。
請求書は、納品日の日付で発行しますので、翌月最終営業日までの当社指定口座への振込みをお願いします。振込み手数料は御社負担にてお願いします。
お客様の御支払い条件が60日以上の場合は御相談ください。
尚、初めてのお取引先や個人の場合、前払いをお願いすることもあります。ご了承のほど、お願いします。
データリソース社はどのような会社ですか?
当社は、世界各国の主要調査会社・レポート出版社と提携し、世界各国の市場調査レポートや技術動向レポートなどを日本国内の企業・公官庁及び教育研究機関に提供しております。
世界各国の「市場・技術・法規制などの」実情を調査・収集される時には、データリソース社にご相談ください。
お客様の御要望にあったデータや情報を抽出する為のレポート紹介や調査のアドバイスも致します。
|
|


