液化天然ガス(LNG)市場レポート:2023-2033
Liquified Natural Gas (LNG) Market Report 2023-2033
レポート詳細
液化天然ガス(LNG)市場レポート 2023-2033 :本レポートは、新たな収益源の開拓を目指すリーディングカンパニーにとって、業界とその基礎となる力学をより深く理解する上で、非常に貴... もっと見る
※上記価格は部署ライセンス(Departmental licence)価格です。
その他の価格についてはデータリソースまでお問合せください。
日本語のページは自動翻訳を利用し作成しています。
実際のレポートは英文のみでご納品いたします。

|

|
サマリー
レポート詳細
液化天然ガス(LNG)市場レポート 2023-2033:本レポートは、新たな収益源の開拓を目指すリーディングカンパニーにとって、業界とその基礎となる力学をより深く理解する上で、非常に貴重なものとなるでしょう。また、異業種への進出や新地域での既存事業の拡大を目指す企業にとっても有益なレポートです。
LNG市場の重要なトレンドは、新規液化プロジェクトの増加である
液化天然ガス(LNG)市場は近年急成長しており、今後もその勢いは続くと予想されます。LNGの需要は、よりクリーンなエネルギー源へのニーズの高まり、天然ガス生産の拡大、世界のエネルギー市場の拡大など、いくつかの要因によってもたらされています。
LNG市場の大きなトレンドのひとつは、アジア、特に中国とインドからの需要の増加です。これらの国々は著しい経済成長を遂げており、エネルギー需要の増加につながっています。発電分野での天然ガス使用の増加や、よりクリーンな燃料への需要の高まりが、LNG輸入の急増につながっています。
LNG市場のもう一つの重要な傾向は、新規の液化プロジェクトが増加していることです。米国、ロシア、カタールなど数カ国が近年、新たなLNGプロジェクトに多額の投資を行っています。これらのプロジェクトは、LNG生産能力を増強し、増大するLNG需要に対応することを目的としています。
LNG市場の成長の可能性にもかかわらず、対処すべきいくつかの課題があります。大きな課題の一つは、液化プラント、再ガス化ターミナル、輸送船などの新しいLNGインフラを建設するためのコストが高いことです。また、LNG価格の変動は、買い手と売り手にとって将来の計画を立てることを困難にするため、懸念材料となっています。
マーケットリサーチレポートを購入する前に、どのような質問をするべきか?
- 液化天然ガス(LNG)市場はどのように進化しているのか?
- 液化天然ガス(LNG)市場を牽引し、抑制しているものは何か?
- 液化天然ガス(LNG)の各サブマーケットセグメントは予測期間中にどのように成長し、2033年にこれらのサブマーケットが占める収益はどの程度になるのか?
- 2023年から2033年にかけて、液化天然ガス(LNG)の各サブマーケットの市場シェアはどのように推移するのか?
- 2023年から2033年にかけて、市場全体の主な牽引役となるのは何か?
- 主要な液化天然ガス(LNG)市場はマクロ経済ダイナミクスに概ね追随するのか、それとも個々の国別市場が他を凌駕するのか?
- 2033年までに各国市場のシェアはどのように変化し、2033年に市場をリードするのはどの地域か?
- 主要プレイヤーは誰で、予測期間中の見通しは?
- これらの主要企業の液化天然ガス(LNG)プロジェクトは何か?
- 2023年から2033年の間に、業界はどのように進化するのか?現在および今後10年間に行われる液化天然ガス(LNG)プロジェクトはどのような意味を持つのか?
- 液化天然ガス(LNG)市場をさらに拡大するために、製品の商業化の必要性は高いのでしょうか?
- 液化天然ガス(LNG)市場はどこに向かっているのか、そして市場の最前線に立つためにはどうすればよいのか?
- 新製品やサービスラインに対する最適な投資オプションは何か?
- 企業を新たな成長軌道に乗せ、C-suiteに移行させるための重要な展望は何か?
このことが、現在、そして今後10年間の液化天然ガス(LNG)市場にどのような影響を与えるかを知る必要があります:
- 345ページにわたる本レポートでは、165の表と207のチャート/グラフを独占的に提供します。
- 本レポートでは、業界における主要な収益性の高い分野を取り上げており、今すぐその分野をターゲットにすることができます。
- 世界、地域、国の売上高と成長率を詳細に分析しています。
- 競合他社が成功した主要なトレンド、変化、収益予測をハイライトしています。
本レポートは、液化天然ガス(LNG)市場が今後10年間にどのように発展するか、またCOVID-19の景気後退と好転の変動に合わせて、今日あなたに伝えます。この市場は、過去10年間のどの時点よりも今が重要です。
2033年までの予測やその他の分析により、商業的な展望を明らかにする。
- 今回の調査では、2033年までの収益予測に加え、直近の実績、成長率、市場シェアも掲載しています。
- ビジネスの展望や展開など、独自の分析がご覧いただけます。
- 定性的分析(市場力学、促進要因、機会、阻害要因、課題など)、コスト構造、液化天然ガス(LNG)価格上昇の影響、最近の動向をご覧いただけます。
本レポートでは、COVID-19が業界や貴社にどのような影響を与えるかについて、データ分析および貴重な知見を提供しています。COVID-19の4つの回収パターン、すなわち「V」「L」「W」「U」の回収パターンとその影響について考察しています。
報告書の対象セグメント
市場別セグメント
- 金額(US$ Billion)
- 容量(BCM)
輸送用燃料別市場セグメント
- 大型車
- 乗用車
- 海上輸送
- その他輸送用燃料
エンドユーズ別市場セグメント
- 国内向け
- 産業用
- 商用利用
- 交通機関の利用
- ユーティリティと電力使用
- その他のエンドユーズ
世界市場全体およびセグメントの収益予測に加え、4地域および主要20カ国市場の収益予測も掲載しています:
北米
- 米国
- カナダ
欧州
- ドイツ
- ロシア
- イギリス
- フランス
- イタリア
- その他の欧州地域
アジア太平洋
- 中国
- 日本
- インド
- タイ
- 韓国
- その他のアジア太平洋地域
ラテンアメリカ
- アルゼンチン
- メキシコ
- その他のラテンアメリカ地域
中近東・アフリカ
- GCC
- 南アフリカ
- その他の中東・アフリカ地域
また、液化天然ガス(LNG)市場の2023年から2033年までの主要企業のプロファイルと、これらの企業の事業のこのセグメントに焦点を当てた、いくつかの企業についても記載しています。
主要企業と市場成長の可能性
・ BG Group plc
・ BP Plc
・ Chesapeake Energy Corporation
・ Chevron Corporation
・ ConocoPhillips Company
・ Eni S.p.A.
・ Equinor ASA
・ ExxonMobil Corporation
・ Gazprom PJSC
・ INPEX Corporation
・ Petronas Dagangan Berhad
・ Qatargas
・ Royal Dutch Shell Plc.
・ TotalEnergies SE
・ Woodside Energy Group Ltd
液化天然ガス(LNG)市場の世界全体の収益、金額ベースで2023年から2033年まで、市場は2023年に2865億8000万米ドルを突破すると、私たちの仕事は計算されます。2033年まで収益が大きく伸びることが予測されます。当社の調査では、最も大きな可能性を秘めた企業を特定しています。彼らの能力、進歩、商業的展望を発見することで、先手を打つことができます。
液化天然ガス(LNG)市場、2023年から2033年までのレポートはどのように役立つのでしょうか?
要約すると、340ページ以上のレポートでは、以下のような知識を得ることができます:
- 液化天然ガス(LNG)市場、2023年から2033年までの収益予測 市場価値、市場量、輸送燃料、最終用途の各予測を世界および地域レベルで掲載 - 業界の展望を発見し、投資や収益に最も有利な場所を見つけることができます。
- 4つの地域と20の主要国市場の2033年までの収益予測 - 液化天然ガス(LNG)市場、北米、欧州、アジア太平洋、ラテンアメリカ、中東&アフリカの2023年から2033年の市場予測をご覧いただけます。また、米国、カナダ、ロシア、ドイツ、フランス、英国、イタリア、中国、インド、日本、オーストラリアなどの著名な経済圏の市場も予測されています。
- 液化天然ガス(LNG)市場に関わる主要企業15社の企業プロファイルを含む、既存企業および市場参入を目指す企業の展望(2023年から2033年)。
独自の予測による定量・定性分析をご覧いただけます。私たちのレポートだけが持つ情報を入手し、貴重なビジネスインテリジェンスとして情報を得ることができます。
他にはない情報
私たちの新しいレポートがあれば、知識に遅れをとったり、チャンスを逃したりする可能性は低くなります。私たちの仕事があなたの研究、分析、意思決定にどのように役立つかをご覧ください。Visiongainの研究は、液化天然ガス(LNG)市場、2023年から2033年、市場をリードする企業のための商業分析を必要とするすべての人のためのものです。データ、トレンド、予測を見つけることができます。
ページTOPに戻る
目次
目次
1 レポートの概要
1.1 研究の目的
1.2 液化天然ガス市場の紹介
1.3 この報告書がもたらすもの
1.4 本レポートを読むべき理由
1.本分析レポートが回答する5つの重要な質問
1.6 本レポートは誰のためのものか?
1.7 調査方法
1.7.1 市場の定義
1.7.2 市場評価・予測手法
1.7.3 データバリデーション
1.7.3.1 一次調査
1.7.3.2 二次調査
1.8 よくある質問(FAQ)
1.9 関連するVisiongainのレポート
1.10 ビジョンゲインについて
2 エグゼクティブサマリー
2.1 セグメント別分析
2.1.1 輸送用燃料セグメント:市場魅力度指数
2.1.2 エンドユースセグメント:市場魅力度指数
2.2 地域別分析
3 市場の概要
3.1 キーファインディング
3.2 マーケットダイナミクス
3.2.1 市場促進要因
3.2.1.1 小型液化天然ガス(LNG)に対する高い需要性
3.2.1.2 クリーンエネルギー需要
3.2.2 市場の抑制要因
3.2.2.1 供給過多:懸念される主な原因
3.2.2.2 地政学的な不確実性による成長率の低下
3.2.2.3 LNG市場の成長抑制要因としての環境問題
3.2.3 マーケットオポチュニティ
3.2.3.1 技術と政府の政策の統合
3.2.3.2 経済性の向上がLNG市場の成長を支える
3.2.3.3 LNGインフラがもたらす燃料の柔軟性
3.3 COVID-19の影響度分析
3.3.1 V字型リカバリー
3.3.2 W型リカバリー
3.3.3 U字型リカバリー
3.3.4 L字型リカバリー
3.4 ポーターのファイブフォース分析
3.4.1 サプライヤーのバーゲニングパワー
3.4.2 バイヤーのバーゲニングパワー
3.4.3 競争力のあるライバル
3.4.4 代替品の脅威
3.4.5 新規参入の脅威
3.5 PEST分析
3.5.1 政治的要因
3.5.2 経済的要因
3.5.3 社会的要因
3.5.4 技術的要因
4 液化天然ガス市場分析:輸送燃料別
4.1 キーファインディング
4.2 輸送用燃料のセグメント:市場魅力度指数
4.3 輸送燃料別の液化天然ガス市場規模の推定と予測
4.4 大型車市場
4.4.1 地域別市場規模、2023-2033年(US$ bn)
4.4.2 2023年&2033年地域別市場シェア(%)
4.5 乗用車の市場
4.5.1 地域別市場規模、2023-2033年(US$ bn)
4.5.2 2023年&2033年地域別市場シェア(%)
4.6 海運市場
4.6.1 地域別市場規模、2023-2033年(US$ bn)
4.6.2 2023年&2033年地域別市場シェア(%)
4.7 その他の輸送用燃料の市場
4.7.1 地域別市場規模、2023-2033年(US$ bn)
4.7.2 2023年&2033年地域別市場シェア(%)
5 液化天然ガス市場分析:エンドユーズ別
5.1 キーファインディング
5.2 エンドユースセグメント:市場魅力度指数
5.3 液化天然ガスのエンドユーズ別市場規模の推定と予測
5.4 国内使用市場
5.4.1 地域別市場規模、2023-2033年(US$ bn)
5.4.2 2023年&2033年地域別市場シェア(%)
5.5 産業用市場
5.5.1 地域別市場規模、2023-2033年(US$ bn)
5.5.2 2023年&2033年地域別市場シェア(%)
5.6 業務用市場
5.6.1 地域別市場規模、2023-2033年(US$ bn)
5.6.2 2023年&2033年地域別市場シェア(%)
5.7 交通利用市場
5.7.1 地域別市場規模、2023-2033年(US$ bn)
5.7.2 2023年&2033年地域別市場シェア(%)
5.8 ユーティリティと電力使用市場
5.8.1 地域別市場規模、2023-2033年(US$ bn)
5.8.2 2023年&2033年地域別市場シェア(%)
5.9 その他のエンドユーズ市場
5.9.1 地域別市場規模、2023-2033年(US$ bn)
5.9.2 2023年&2033年地域別市場シェア(%)
6 液化天然ガス市場分析:地域別
6.1 キーファインディング
6.2 地域別市場規模の推計と予測
6.3 液化天然ガス(LNG)の世界市場:地域別
6.4 液化天然ガス(LNG)の世界市場:輸送燃料別
6.5 液化天然ガス(LNG)の世界市場:エンドユーズ別
7 北米の液化天然ガス市場の分析
7.1 キーファインディング
7.2 北米液化天然ガス市場魅力度指数
7.3 北米液化天然ガス市場規模推計と予測金額別
7.4 北米液化天然ガス(LNG)市場:国別
7.5 北米液化天然ガス(LNG)市場:輸送燃料別
7.6 北米液化天然ガス(LNG)市場:エンドユーズ別
7.7 米国の液化天然ガス市場分析
7.8 カナダ液化天然ガス市場の分析
8 欧州の液化天然ガス市場分析
8.1 キーファインディング
8.2 欧州液化天然ガス市場魅力度指数
8.3 欧州液化天然ガス市場規模推計と予測:金額別
8.4 欧州液化天然ガス(LNG)市場:国別
8.5 欧州液化天然ガス(LNG)市場:輸送燃料別
8.6 欧州液化天然ガス(LNG)市場:エンドユーザー別
8.7 ロシア液化天然ガス市場分析
8.8 ドイツ液化天然ガス市場分析
8.9 イタリア液化天然ガス市場の分析
8.10 英国液化天然ガス市場の分析
8.11 フランス液化天然ガス市場分析
8.12 その他の欧州の液化天然ガス市場の分析
9 アジア太平洋地域の液化天然ガス市場分析
9.1 キーファインディング
9.2 アジア太平洋地域の液化天然ガス市場魅力度指数
9.3 アジア太平洋地域の液化天然ガス市場規模推計と予測:金額別
9.4 アジア太平洋地域の液化天然ガス(LNG)市場:国別
9.5 アジア太平洋地域の液化天然ガス(LNG)市場:輸送燃料別
9.6 アジア太平洋地域の液化天然ガス(LNG)市場:エンドユーズ別
9.7 中国液化天然ガス市場分析
9.8 日本液化天然ガス市場分析
9.9 韓国液化天然ガス市場分析
9.10 インド液化天然ガス市場の分析
9.11 タイの液化天然ガス市場の分析
9.12 その他のアジア太平洋地域の液化天然ガス市場の分析
10 中東・アフリカ液化天然ガス市場分析
10.1 キーファインディング
10.2 中東・アフリカ液化天然ガス市場魅力度指数
10.3 中東・アフリカ液化天然ガス市場規模推計と予測:金額別
10.4 中東・アフリカ液化天然ガス(LNG)市場:国別
10.5 中東・アフリカ液化天然ガス(LNG)市場:輸送燃料別
10.6 中東・アフリカ液化天然ガス(LNG)市場:エンドユーズ別
10.7 GCC液化天然ガス市場分析
10.8 南アフリカの液化天然ガス市場の分析
10.9 その他の中東・アフリカの液化天然ガス市場分析
11 ラテンアメリカの液化天然ガス市場分析
11.1 主要な調査結果
11.2 ラテンアメリカの液化天然ガス市場魅力度指数
11.3 ラテンアメリカ 液化天然ガス市場規模推計と予測:金額別
11.4 ラテンアメリカ 液化天然ガス(LNG)市場:国別
11.5 ラテンアメリカ 液化天然ガス(LNG)市場:輸送燃料別
11.6 ラテンアメリカ 液化天然ガス(LNG)市場:エンドユーズ別
11.7 アルゼンチン液化天然ガス市場分析
11.8 メキシコ液化天然ガス市場分析
11.9 その他のラテンアメリカ液化天然ガス市場分析
12 企業プロフィール
12.1 競合状況、2022年
12.2 戦略的展望
12.2.1 主要な事業戦略としての企業買収
12.2.2 主要なビジネス戦略としてのパートナーシップ
12.2.3 主要なビジネス戦略としてのコラボレーション
12.2.4 主要なビジネス戦略としての新製品発売
12.2.5 主要なビジネス戦略としての拡張性
12.3 Royal Dutch Shell Plc.
12.3.1 会社概要
12.3.2 会社概要
12.3.3 財務分析
12.3.3.1 純収益、2018年~2022年
12.3.3.2 R&D、2018年~2022年
12.3.3.3 地域別市場シェア、2022年
12.3.3.4 事業セグメント別市場シェア、2022年
12.3.4 製品ベンチマーキング
12.3.5 戦略的な展望
12.4 Gazprom PJSC
12.4.1 企業スナップショット
12.4.2 会社概要
12.4.3 製品ベンチマーキング
12.4.4 戦略的な展望
12.5 Petronas Dagangan Berhad
12.5.1 企業スナップショット
12.5.2 会社概要
12.5.3 製品ベンチマーキング
12.5.4 戦略的な展望
12.6 Equinor ASA
12.6.1 企業スナップショット
12.6.2 会社概要
12.6.3 財務分析
12.6.3.1 純収益、2018年~2022年
12.6.3.2 R&D、2018年~2022年
12.6.3.3 地域別市場シェア、2022年
12.6.3.4 事業セグメント別市場シェア、2022年
12.6.4 戦略的な展望
12.7 ExxonMobil Corporation
12.7.1 企業スナップショット
12.7.2 会社概要
12.7.3 財務分析
12.7.3.1 純収益、2018年~2022年
12.7.3.2 R&D、2018年~2022年
12.7.3.3 地域別市場シェア、2022年
12.7.3.4 事業セグメント別市場シェア、2022年
12.7.4 製品ベンチマーキング
12.7.5 戦略的な展望
12.8 Chevron Corporation
12.8.1 企業スナップショット
12.8.2 会社概要
12.8.3 財務分析
12.8.3.1 純収益、2018年~2022年
12.8.3.2 R&D、2018年~2022年
12.8.3.3 地域別市場占有率、2022年
12.8.3.4 事業セグメント別市場シェア、2022年
12.8.4 製品ベンチマーキング
12.8.5 戦略的な展望
12.9 BP Plc
12.9.1 企業スナップショット
12.9.2 会社概要
12.9.3 財務分析
12.9.3.1 純収益、2018年~2022年
12.9.3.2 R&D、2018年~2022年
12.9.3.3 事業セグメント別市場シェア、2022年
12.9.4 製品ベンチマーキング
12.10 TotalEnergies SE
12.10.1 企業スナップショット
12.10.2 会社概要
12.10.3 財務分析
12.10.3.1 純収益、2018年~2022年
12.10.3.2 R&D、2018年~2022年
12.10.3.3 地域別市場占有率、2022年
12.10.3.4 事業セグメント別市場シェア、2022年
12.10.4 製品ベンチマーキング
12.10.5 戦略的な展望
12.11 ConocoPhillips Company
12.11.1 企業スナップショット
12.11.2 会社概要
12.11.3 財務分析
12.11.3.1 純収益、2018年~2022年
12.11.3.2 R&D、2018年~2022年
12.11.3.3 地域別市場占有率、2022年
12.11.3.4 事業セグメント別市場シェア、2022年
12.11.4 製品ベンチマーキング
12.11.5 戦略的な展望
12.12 Eni S.p.A.
12.12.1 企業スナップショット
12.12.2 会社概要
12.12.3 財務分析
12.12.3.1 純収益、2018-2022年
12.12.3.2 R&D、2018年~2022年
12.12.3.3 地域別市場占有率、2022年
12.12.3.4 事業セグメント別市場シェア、2022年
12.12.4 製品ベンチマーキング
12.12.5 戦略的な展望
12.13 Woodside Energy Group Ltd
12.13.1 企業スナップショット
12.13.2 会社概要
12.13.3 財務分析
12.13.3.1 純収益、2017-2021年
12.13.3.2 地域別市場占有率、2022年
12.13.3.3 事業セグメント別市場シェア、2022年
12.13.4 製品ベンチマーキング
12.13.5 戦略的な展望
12.14 BG Group plc
12.14.1 企業スナップショット
12.14.2 会社概要
12.14.3 財務分析
12.14.3.1 純収益、2018年~2022年
12.14.3.2 R&D、2018年~2022年
12.14.3.3 地域別市場占有率、2022年
12.14.3.4 事業セグメント別市場シェア、2022年
12.14.4 製品ベンチマーキング
12.15 INPEX Corporation
12.15.1 企業スナップショット
12.15.2 会社概要
12.15.3 財務分析
12.15.3.1 純収益、2017-2021年
12.15.3.2 R&D、2017年~2021年
12.15.3.3 地域別市場シェア、2021年
12.15.3.4 ビジネスセグメント市場シェア、2021年
12.15.4 製品ベンチマーキング
12.15.5 戦略的な展望
12.16 Chesapeake Energy Corporation
12.16.1 企業スナップショット
12.16.2 会社概要
12.16.3 財務分析
12.16.3.1 純収益、2018年~2022年
12.16.3.2 R&D、2018年~2022年
12.16.3.3 事業セグメント別市場シェア、2021年
12.16.4 製品ベンチマーキング
12.17 Qatargas
12.17.1 企業スナップショット
12.17.2 会社概要
12.17.3 製品ベンチマーキング
12.17.4 戦略的な展望
13 結論と提言
13.1 ビジョンゲインからの結びの言葉
13.2 市場関係者への提言
表の一覧
Table 1 Liquified Natural Gas Market Snapshot, 2023 & 2033 (US$ billion, CAGR %)
Table 2 Global Liquified Natural Gas (LNG) Market Forecast, 2023-2033 (US$ Bn, AGR (%), CAGR (%)) (V-Shaped Recovery Scenario)
Table 3 Global Liquified Natural Gas (LNG) Market by Region, 2023-2033 (US$ Bn, AGR (%), CAGR (%)) (V-Shaped Recovery Scenario)
Table 4 Global Liquified Natural Gas (LNG) Market Forecast, 2023-2033 (US$ Bn, AGR (%), CAGR (%)) (W-Shaped Recovery Scenario)
Table 5 Global Liquified Natural Gas (LNG) Market by Region, 2023-2033 (US$ Bn, AGR (%), CAGR (%)) (W-Shaped Recovery Scenario)
Table 6 Global Liquified Natural Gas (LNG) Market Forecast, 2023-2033 (US$ Bn, AGR (%), CAGR (%)) (U-Shaped Recovery Scenario)
Table 7 Global Liquified Natural Gas (LNG) Market by Region, 2023-2033 (US$ Bn, AGR (%), CAGR (%)) (U-Shaped Recovery Scenario)
Table 8 Global Liquified Natural Gas (LNG) Market Forecast, 2023-2033 (US$ Bn, AGR (%), CAGR (%)) (L-Shaped Recovery Scenario)
Table 9 Global Liquified Natural Gas (LNG) Market by Region, 2023-2033 (US$ Bn, AGR (%), CAGR (%)) (L-Shaped Recovery Scenario)
Table 10 Global Liquified Natural Gas (LNG) Market by Transport Fuel, 2023-2033 (US$ Bn, AGR (%), CAGR (%))
Table 11 Global Liquified Natural Gas (LNG) Market by Transport Fuel, 2023-2033 (BCM, AGR (%), CAGR (%))
Table 12 Heavy-Duty Vehicles Market by Region, 2023-2033 (US$ Bn, AGR (%), CAGR (%))
Table 13 Heavy-Duty Vehicles Market by Region, 2023-2033 (BCM, AGR (%), CAGR (%))
Table 14 Passenger Vehicles Market by Region, 2023-2033 (US$ Bn, AGR (%), CAGR (%))
Table 15 Passenger Vehicles Market by Region, 2023-2033 (BCM, AGR (%), CAGR (%))
Table 16 Marine Transport Market by Region, 2023-2033 (US$ Bn, AGR (%), CAGR (%))
Table 17 Marine Transport Market by Region, 2023-2033 (BCM, AGR (%), CAGR (%))
Table 18 Other Transport Fuel Market by Region, 2023-2033 (US$ Bn, AGR (%), CAGR (%))
Table 19 Marine Transport Market by Region, 2023-2033 (BCM, AGR (%), CAGR (%))
Table 20 Global Liquified Natural Gas (LNG) Market by End-Use, 2023-2033 (US$ Bn, AGR (%), CAGR (%))
Table 21 Global Liquified Natural Gas (LNG) Market by End-Use, 2023-2033 (BCM, AGR (%), CAGR (%))
Table 22 Domestic Use Market by Region, 2023-2033 (US$ Bn, AGR (%), CAGR (%))
Table 23 Domestic Use Market by Region, 2023-2033 (BCM, AGR (%), CAGR (%))
Table 24 Industrial Use Market by Region, 2023-2033 (US$ Bn, AGR (%), CAGR (%))
Table 25 Industrial Use Market by Region, 2023-2033 (BCM, AGR (%), CAGR (%))
Table 26 Commercial Use Market by Region, 2023-2033 (US$ Bn, AGR (%), CAGR (%))
Table 27 Commercial Use Market by Region, 2023-2033 (BCM, AGR (%), CAGR (%))
Table 28 Transportation Use Market by Region, 2023-2033 (US$ Bn, AGR (%), CAGR (%))
Table 29 Transportation Use Market by Region, 2023-2033 (BCM, AGR (%), CAGR (%))
Table 30 Utilities and Power Use Market by Region, 2023-2033 (US$ Bn, AGR (%), CAGR (%))
Table 31 Utilities and Power Use Market by Region, 2023-2033 (BCM, AGR (%), CAGR (%))
Table 32 Other End-Use Market by Region, 2023-2033 (US$ Bn, AGR (%), CAGR (%))
Table 33 Other End-Use Market by Region, 2023-2033 (BCM, AGR (%), CAGR (%))
Table 34 Global Liquified Natural Gas (LNG) Market Forecast, 2023-2033 (US$ Bn, AGR (%), CAGR (%))
Table 35 Global Liquified Natural Gas (LNG) Market Forecast, 2023-2033 (BCM, AGR (%), CAGR (%))
Table 36 Global Liquified Natural Gas (LNG) Market by Region, 2023-2033 (US$ Bn, AGR (%), CAGR (%))
Table 37 Global Liquified Natural Gas (LNG) Market by Region, 2023-2033 (BCM, AGR (%), CAGR (%))
Table 38 Global Liquified Natural Gas (LNG) Market by Transport Fuel, 2023-2033 (US$ Bn, AGR (%), CAGR (%))
Table 39 Global Liquified Natural Gas (LNG) Market by Transport Fuel, 2023-2033 (BCM, AGR (%), CAGR (%))
Table 40 Global Liquified Natural Gas (LNG) Market by End-Use, 2023-2033 (US$ Bn, AGR (%), CAGR (%))
Table 41 Global Liquified Natural Gas (LNG) Market by End-Use, 2023-2033 (BCM, AGR (%), CAGR (%))
Table 42 North America Liquified Natural Gas (LNG) Market by Value, 2023-2033 (US$ Bn, AGR (%), CAGR (%))
Table 43 North America Liquified Natural Gas (LNG) Market by Volume, 2023-2033 (BCM, AGR (%), CAGR (%))
Table 44 North America Liquified Natural Gas (LNG) Market by Country, 2023-2033 (US$ Bn, AGR (%), CAGR (%))
Table 45 North America Liquified Natural Gas (LNG) Market by Country, 2023-2033 (BCM, AGR (%), CAGR (%))
Table 46 North America Liquified Natural Gas (LNG) Market by Transport Fuel, 2023-2033 (US$ Bn, AGR (%), CAGR (%))
Table 47 North America Liquified Natural Gas (LNG) Market by Transport Fuel, 2023-2033 (BCM, AGR (%), CAGR (%))
Table 48 North America Liquified Natural Gas (LNG) Market by End-Use, 2023-2033 (US$ Bn, AGR (%), CAGR (%))
Table 49 North America Liquified Natural Gas (LNG) Market by End-Use, 2023-2033 (BCM, AGR (%), CAGR (%))
Table 50 US Liquified Natural Gas (LNG) Market by Value, 2023-2033 (US$ Bn, AGR (%), CAGR (%))
Table 51 US Liquified Natural Gas (LNG) Market by Volume, 2023-2033 (BCM, AGR (%), CAGR (%))
Table 52 Canada Liquified Natural Gas (LNG) Market by Value, 2023-2033 (US$ Bn, AGR (%), CAGR (%))
Table 53 Canada Liquified Natural Gas (LNG) Market by Volume, 2023-2033 (BCM, AGR (%), CAGR (%))
Table 54 Europe Liquified Natural Gas (LNG) Market by Value, 2023-2033 (US$ Bn, AGR (%), CAGR (%))
Table 55 Europe Liquified Natural Gas (LNG) Market by Volume, 2023-2033 (BCM, AGR (%), CAGR (%))
Table 56 Europe Liquified Natural Gas (LNG) Market by Country, 2023-2033 (US$ Bn, AGR (%), CAGR (%))
Table 57 Europe Liquified Natural Gas (LNG) Market by Country, 2023-2033 (BCM, AGR (%), CAGR (%))
Table 58 Europe Liquified Natural Gas (LNG) Market by Transport Fuel, 2023-2033 (US$ Bn, AGR (%), CAGR (%))
Table 59 Europe Liquified Natural Gas (LNG) Market by Transport Fuel, 2023-2033 (BCM, AGR (%), CAGR (%))
Table 60 Europe Liquified Natural Gas (LNG) Market by End-Use, 2023-2033 (US$ Bn, AGR (%), CAGR (%))
Table 61 Europe Liquified Natural Gas (LNG) Market by End-Use, 2023-2033 (BCM, AGR (%), CAGR (%))
Table 62 Russia Liquified Natural Gas (LNG) Market by Value, 2023-2033 (US$ Bn, AGR (%), CAGR (%))
Table 63 Russia Liquified Natural Gas (LNG) Market by Volume, 2023-2033 (BCM, AGR (%), CAGR (%))
Table 64 Germany Liquified Natural Gas (LNG) Market by Value, 2023-2033 (US$ Bn, AGR (%), CAGR (%))
Table 65 Germany Liquified Natural Gas (LNG) Market by Volume, 2023-2033 (BCM, AGR (%), CAGR (%))
Table 66 Italy Liquified Natural Gas (LNG) Market by Value, 2023-2033 (US$ Bn, AGR (%), CAGR (%))
Table 67 Italy Liquified Natural Gas (LNG) Market by Volume, 2023-2033 (BCM, AGR (%), CAGR (%))
Table 68 UK Liquified Natural Gas (LNG) Market by Value, 2023-2033 (US$ Bn, AGR (%), CAGR (%))
Table 69 UK Liquified Natural Gas (LNG) Market by Volume, 2023-2033 (BCM, AGR (%), CAGR (%))
Table 70 France Liquified Natural Gas (LNG) Market by Value, 2023-2033 (US$ Bn, AGR (%), CAGR (%))
Table 71 France Liquified Natural Gas (LNG) Market by Volume, 2023-2033 (BCM, AGR (%), CAGR (%))
Table 72 Rest of Europe Liquified Natural Gas (LNG) Market by Value, 2023-2033 (US$ Bn, AGR (%), CAGR (%))
Table 73 Rest of Europe Liquified Natural Gas (LNG) Market by Volume, 2023-2033 (BCM, AGR (%), CAGR (%))
Table 74 Asia-Pacific Liquified Natural Gas (LNG) Market by Value, 2023-2033 (US$ Bn, AGR (%), CAGR (%))
Table 75 Asia-Pacific Liquified Natural Gas (LNG) Market by Volume, 2023-2033 (BCM, AGR (%), CAGR (%))
Table 76 Asia-Pacific Liquified Natural Gas (LNG) Market by Country, 2023-2033 (US$ Bn, AGR (%), CAGR (%))
Table 77 Asia-Pacific Liquified Natural Gas (LNG) Market by Country, 2023-2033 (BCM, AGR (%), CAGR (%))
Table 78 Asia-Pacific Liquified Natural Gas (LNG) Market by Transport Fuel, 2023-2033 (US$ Bn, AGR (%), CAGR (%))
Table 79 Asia-Pacific Liquified Natural Gas (LNG) Market by Transport Fuel, 2023-2033 (BCM, AGR (%), CAGR (%))
Table 80 Asia-Pacific Liquified Natural Gas (LNG) Market by End-Use, 2023-2033 (US$ Bn, AGR (%), CAGR (%))
Table 81 Asia-Pacific Liquified Natural Gas (LNG) Market by End-Use, 2023-2033 (BCM, AGR (%), CAGR (%))
Table 82 China Liquified Natural Gas (LNG) Market by Value, 2023-2033 (US$ Bn, AGR (%), CAGR (%))
Table 83 China Liquified Natural Gas (LNG) Market by Volume, 2023-2033 (BCM, AGR (%), CAGR (%))
Table 84 Japan Liquified Natural Gas (LNG) Market by Value, 2023-2033 (US$ Bn, AGR (%), CAGR (%))
Table 85 Japan Liquified Natural Gas (LNG) Market by Volume, 2023-2033 (BCM, AGR (%), CAGR (%))
Table 86 South Korea Liquified Natural Gas (LNG) Market by Value, 2023-2033 (US$ Bn, AGR (%), CAGR (%))
Table 87 South Korea Liquified Natural Gas (LNG) Market by Volume, 2023-2033 (BCM, AGR (%), CAGR (%))
Table 88 India Liquified Natural Gas (LNG) Market by Value, 2023-2033 (US$ Bn, AGR (%), CAGR (%))
Table 89 India Liquified Natural Gas (LNG) Market by Volume, 2023-2033 (BCM, AGR (%), CAGR (%))
Table 90 Thailand Liquified Natural Gas (LNG) Market by Value, 2023-2033 (US$ Bn, AGR (%), CAGR (%))
Table 91 Thailand Liquified Natural Gas (LNG) Market by Volume, 2023-2033 (BCM, AGR (%), CAGR (%))
Table 92 Rest of Asia-Pacific Liquified Natural Gas (LNG) Market by Value, 2023-2033 (US$ Bn, AGR (%), CAGR (%))
Table 93 Rest of Asia-Pacific Liquified Natural Gas (LNG) Market by Volume, 2023-2033 (BCM, AGR (%), CAGR (%))
Table 94 Middle East & Africa Liquified Natural Gas (LNG) Market by Value, 2023-2033 (US$ Bn, AGR (%), CAGR (%))
Table 95 Middle East & Africa Liquified Natural Gas (LNG) Market by Volume, 2023-2033 (BCM, AGR (%), CAGR (%))
Table 96 Middle East & Africa Liquified Natural Gas (LNG) Market by Country, 2023-2033 (US$ Bn, AGR (%), CAGR (%))
Table 97 Middle East & Africa Liquified Natural Gas (LNG) Market by Country, 2023-2033 (BCM, AGR (%), CAGR (%))
Table 98 Middle East & Africa Liquified Natural Gas (LNG) Market by Transport Fuel, 2023-2033 (US$ Bn, AGR (%), CAGR (%))
Table 99 Middle East & Africa Liquified Natural Gas (LNG) Market by Transport Fuel, 2023-2033 (BCM, AGR (%), CAGR (%))
Table 100 Middle East & Africa Liquified Natural Gas (LNG) Market by End-Use, 2023-2033 (US$ Bn, AGR (%), CAGR (%))
Table 101 Middle East & Africa Liquified Natural Gas (LNG) Market by End-Use, 2023-2033 (BCM, AGR (%), CAGR (%))
Table 102 GCC Liquified Natural Gas (LNG) Market by Value, 2023-2033 (US$ Bn, AGR (%), CAGR (%))
Table 103 GCC Liquified Natural Gas (LNG) Market by Volume, 2023-2033 (BCM, AGR (%), CAGR (%))
Table 104 South Africa Liquified Natural Gas (LNG) Market by Value, 2023-2033 (US$ Bn, AGR (%), CAGR (%))
Table 105 South Africa Liquified Natural Gas (LNG) Market by Volume, 2023-2033 (BCM, AGR (%), CAGR (%))
Table 106 Rest of Middle East & Africa Liquified Natural Gas (LNG) Market by Value, 2023-2033 (US$ Bn, AGR (%), CAGR (%))
Table 107 Rest of Middle East & Africa Liquified Natural Gas (LNG) Market by Volume, 2023-2033 (BCM, AGR (%), CAGR (%))
Table 108 Latin America Liquified Natural Gas (LNG) Market by Value, 2023-2033 (US$ Bn, AGR (%), CAGR (%))
Table 109 Latin America Liquified Natural Gas (LNG) Market by Volume, 2023-2033 (BCM, AGR (%), CAGR (%))
Table 110 Latin America Liquified Natural Gas (LNG) Market by Country, 2023-2033 (US$ Bn, AGR (%), CAGR (%))
Table 111 Latin America Liquified Natural Gas (LNG) Market by Country, 2023-2033 (BCM, AGR (%), CAGR (%))
Table 112 Latin America Liquified Natural Gas (LNG) Market by Transport Fuel, 2023-2033 (US$ Bn, AGR (%), CAGR (%))
Table 113 Latin America Liquified Natural Gas (LNG) Market by Transport Fuel, 2023-2033 (BCM, AGR (%), CAGR (%))
Table 114 Latin America Liquified Natural Gas (LNG) Market by End-Use, 2023-2033 (US$ Bn, AGR (%), CAGR (%))
Table 115 Latin America Liquified Natural Gas (LNG) Market by End-Use, 2023-2033 (BCM, AGR (%), CAGR (%))
Table 116 Argentina Liquified Natural Gas (LNG) Market by Value, 2023-2033 (US$ Bn, AGR (%), CAGR (%))
Table 117 Argentina Liquified Natural Gas (LNG) Market by Volume, 2023-2033 (BCM, AGR (%), CAGR (%))
Table 118 Mexico Liquified Natural Gas (LNG) Market by Value, 2023-2033 (US$ Bn, AGR (%), CAGR (%))
Table 119 Mexico Liquified Natural Gas (LNG) Market by Volume, 2023-2033 (BCM, AGR (%), CAGR (%))
Table 120 Rest of Latin America Liquified Natural Gas (LNG) Market by Value, 2023-2033 (US$ Bn, AGR (%), CAGR (%))
Table 121 Rest of Latin America Liquified Natural Gas (LNG) Market by Volume, 2023-2033 (BCM, AGR (%), CAGR (%))
Table 122 Acquisitions as Key Business Strategy
Table 123 Partnership as Key Business Strategy
Table 124 Collaboration as Key Business Strategy
Table 125 New Product Launch as Key Business Strategy
Table 126 Expansion as Key Business Strategy
Table 127 Royal Dutch Shell Plc: Key Details, (CEO, HQ, Revenue, Founded, No. of Employees, Company Type, Website, Business Segment)
Table 128 Royal Dutch Shell Plc: Product Benchmarking
Table 129 Royal Dutch Shell Plc: Strategic Outlook
Table 130 Gazprom PJSC: Key Details, (CEO, HQ, Revenue, Founded, No. of Employees, Company Type, Website, Business Segment)
Table 131 Gazprom PJSC: Product Benchmarking
Table 132 Gazprom PJSC: Strategic Outlook
Table 133 Petronas Dagangan Berhad: Key Details, (CEO, HQ, Revenue, Founded, No. of Employees, Company Type, Website, Business Segment)
Table 134 Petronas Dagangan Berhad: Product Benchmarking
Table 135 Petronas Dagangan Berhad: Strategic Outlook
Table 136 Equinor ASA: Key Details, (CEO, HQ, Revenue, Founded, No. of Employees, Company Type, Website, Business Segment)
Table 137 Equinor ASA: Strategic Outlook
Table 138 ExxonMobil Corporation: Key Details, (CEO, HQ, Revenue, Founded, No. of Employees, Company Type, Website, Business Segment)
Table 139 ExxonMobil Corporation: Product Benchmarking
Table 140 ExxonMobil Corporation: Strategic Outlook
Table 141 Chevron Corporation: Key Details, (CEO, HQ, Revenue, Founded, No. of Employees, Company Type, Website, Business Segment)
Table 142 Chevron Corporation: Product Benchmarking
Table 143 Chevron Corporation: Strategic Outlook
Table 144 BP Plc: Key Details, (CEO, HQ, Revenue, Founded, No. of Employees, Company Type, Website, Business Segment)
Table 145 BP Plc: Product Benchmarking
Table 146 TotalEnergies SE: Key Details, (CEO, HQ, Revenue, Founded, No. of Employees, Company Type, Website, Business Segment)
Table 147 TotalEnergies SE: Product Benchmarking
Table 148 TotalEnergies SE: Strategic Outlook
Table 149 ConocoPhillips Company: Key Details, (CEO, HQ, Revenue, Founded, No. of Employees, Company Type, Website, Business Segment)
Table 150 ConocoPhillips Company: Product Benchmarking
Table 151 ConocoPhillips Company: Strategic Outlook
Table 152 Eni S.p.A.: Key Details, (CEO, HQ, Revenue, Founded, No. of Employees, Company Type, Website, Business Segment)
Table 153 Eni S.p.A.: Product Benchmarking
Table 154 . Eni S.p.A: Strategic Outlook
Table 155 Woodside Energy Group Ltd: Key Details, (CEO, HQ, Revenue, Founded, No. of Employees, Company Type, Website, Business Segment)
Table 156 Woodside Energy Group Ltd: Product Benchmarking
Table 157 Woodside Energy Group Ltd: Strategic Outlook
Table 158 BG Group plc: Key Details, (CEO, HQ, Revenue, Founded, No. of Employees, Company Type, Website, Business Segment)
Table 159 BG Group plc: Product Benchmarking
Table 160 INPEX Corporation: Key Details, (CEO, HQ, Revenue, Founded, No. of Employees, Company Type, Website, Business Segment)
Table 161 INPEX Corporation: Product Benchmarking
Table 162 INPEX Corporation: Strategic Outlook
Table 163 Chesapeake Energy Corporation: Key Details, (CEO, HQ, Revenue, Founded, No. of Employees, Company Type, Website, Business Segment)
Table 164 Qatargas: Key Details, (CEO, HQ, Revenue, Founded, No. of Employees, Company Type, Website, Business Segment)
Table 165 Qatargas: Strategic Outlook
図の一覧
Figure 1 Liquified Natural Gas Market Segmentation
Figure 2 Liquified Natural Gas Market by Transport Fuel: Market Attractiveness Index
Figure 3 Liquified Natural Gas Market by End-use: Market Attractiveness Index
Figure 4 Liquified Natural Gas Market Attractiveness Index by Region
Figure 5 Liquified Natural Gas Market: Market Dynamics
Figure 6 Transportation Industry Market Size Over Time
Figure 7 COVID Impact Analysis: Liquified Natural Gas Market Recovery Scenarios
Figure 8 Global Liquified Natural Gas (LNG) Market Forecast, 2023-2033 (US$ Bn, AGR (%)) (V-Shaped Recovery Scenario)
Figure 9 Global Liquified Natural Gas (LNG) Market by Region, 2023-2033 (US$ Bn, AGR (%)) (V-Shaped Recovery Scenario)
Figure 10 Global Liquified Natural Gas (LNG) Market Forecast, 2023-2033 (US$ Bn, AGR (%)) (W-Shaped Recovery Scenario)
Figure 11 Global Liquified Natural Gas (LNG) Market by Region, 2023-2033 (US$ Bn, AGR (%)) (W-Shaped Recovery Scenario)
Figure 12 Global Liquified Natural Gas (LNG) Market Forecast, 2023-2033 (US$ Bn, AGR (%)) (U-Shaped Recovery Scenario)
Figure 13 Global Liquified Natural Gas (LNG) Market by Region, 2023-2033 (US$ Bn, AGR (%)) (U-Shaped Recovery Scenario)
Figure 14 Global Liquified Natural Gas (LNG) Market Forecast, 2023-2033 (US$ Bn, AGR (%)) (L-Shaped Recovery Scenario)
Figure 15 Global Liquified Natural Gas (LNG) Market by Region, 2023-2033 (US$ Bn, AGR (%)) (L-Shaped Recovery Scenario)
Figure 16 Liquified Natural Gas Market: Porter’s Five Forces Analysis
Figure 17 Liquified Natural Gas Market: PEST Analysis
Figure 18 Liquified Natural Gas Market by Transport Fuel: Market Attractiveness Index
Figure 19 Global Liquified Natural Gas (LNG) Market by Transport Fuel, 2023-2033 (US$ Bn, AGR (%))
Figure 20 Global Liquified Natural Gas (LNG) Market by Transport Fuel, 2023-2033 (BCM, AGR (%))
Figure 21 Heavy-Duty Vehicles Market by Region, 2023-2033 (US$ Bn, AGR (%))
Figure 22 Heavy-Duty Vehicles Market by Region, 2023-2033 (BCM, AGR (%))
Figure 23 Heavy Duty Vehicles Market Share Forecast by Region, 2023 & 2033 (%)
Figure 24 Passenger Vehicles Market by Region, 2023-2033 (US$ Bn, AGR (%))
Figure 25 Passenger Vehicles Market by Region, 2023-2033 (BCM, AGR (%))
Figure 26 Passenger Vehicles Market Share Forecast by Region, 2023 & 2033 (%)
Figure 27 Marine Transport Market by Region, 2023-2033 (US$ Bn, AGR (%))
Figure 28 Marine Transport Market by Region, 2023-2033 (BCM, AGR (%))
Figure 29 Marine Transport Vehicles Market Share Forecast by Region, 2023 & 2033 (%)
Figure 30 Other Transport Fuel Market by Region, 2023-2033 (US$ Bn, AGR (%))
Figure 31 Marine Transport Market by Region, 2023-2033 (BCM, AGR (%))
Figure 32 Other Transport Fuel Market Share Forecast by Region, 2023 & 2033 (%)
Figure 33 Liquified Natural Gas Market by End-use: Market Attractiveness Index
Figure 34 Global Liquified Natural Gas (LNG) Market by End-Use, 2023-2033 (US$ Bn, AGR (%))
Figure 35 Global Liquified Natural Gas (LNG) Market by End-Use, 2023-2033 (BCM, AGR (%))
Figure 36 Domestic Use Market by Region, 2023-2033 (US$ Bn, AGR (%))
Figure 37 Domestic Use Market by Region, 2023-2033 (BCM, AGR (%))
Figure 38 Domestic Use Market Share Forecast by Region, 2023 & 2033 (%)
Figure 39 Industrial Use Market by Region, 2023-2033 (US$ Bn, AGR (%))
Figure 40 Industrial Use Market by Region, 2023-2033 (BCM, AGR (%))
Figure 41 Industrial Use Market Share Forecast by Region, 2023 & 2033 (%)
Figure 42 Commercial Use Market by Region, 2023-2033 (US$ Bn, AGR (%))
Figure 43 Commercial Use Market by Region, 2023-2033 (BCM, AGR (%))
Figure 44 Commercial Use Market Share Forecast by Region, 2023 & 2033 (%)
Figure 45 Transportation Use Market by Region, 2023-2033 (US$ Bn, AGR (%))
Figure 46 Transportation Use Market by Region, 2023-2033 (BCM, AGR (%))
Figure 47 Transportation Use Market Share Forecast by Region, 2023 & 2033 (%)
Figure 48 Utilities and Power Use Market by Region, 2023-2033 (US$ Bn, AGR (%))
Figure 49 Utilities and Power Use Market by Region, 2023-2033 (BCM, AGR (%))
Figure 50 Utilities and Power Use Market Share Forecast by Region, 2023 & 2033 (%)
Figure 51 Other End-Use Market by Region, 2023-2033 (US$ Bn, AGR (%))
Figure 52 Other End-Use Market by Region, 2023-2033 (BCM, AGR (%))
Figure 53 Other End-Use Market Share Forecast by Region, 2023 & 2033 (%)
Figure 54 Global Liquified Natural Gas (LNG) Market Forecast, 2023-2033 (US$ Bn, AGR (%))
Figure 55 Global Liquified Natural Gas (LNG) Market Forecast, 2023-2033 (BCM, AGR (%))
Figure 56 Global Liquified Natural Gas (LNG) Market by Region, 2023-2033 (US$ Bn, AGR (%))
Figure 57 Global Liquified Natural Gas (LNG) Market by Region, 2023-2033 (BCM, AGR (%))
Figure 58 Global Liquified Natural Gas (LNG) Market by Transport Fuel, 2023-2033 (US$ Bn, AGR (%))
Figure 59 Global Liquified Natural Gas (LNG) Market by Transport Fuel, 2023-2033 (BCM, AGR (%))
Figure 60 Global Liquified Natural Gas (LNG) Market by End-Use, 2023-2033 (US$ Bn, AGR (%))
Figure 61 Global Liquified Natural Gas (LNG) Market by End-Use, 2023-2033 (BCM, AGR (%))
Figure 62 North America Liquified Natural Gas Market Attractiveness Index
Figure 63 North America Liquified Natural Gas (LNG) Market by Value, 2023-2033 (US$ Bn, AGR (%))
Figure 64 North America Liquified Natural Gas (LNG) Market by Volume, 2023-2033 (BCM, AGR (%))
Figure 65 North America Liquified Natural Gas (LNG) Market by Country, 2023-2033 (US$ Bn, AGR (%))
Figure 66 North America Liquified Natural Gas (LNG) Market by Country, 2023-2033 (BCM, AGR (%))
Figure 67 North America Liquified Natural Gas (LNG) Market Share Forecast by Country, 2023-2033 (%)
Figure 68 North America Liquified Natural Gas (LNG) Market by Transport Fuel, 2023-2033 (US$ Bn, AGR (%))
Figure 69 North America Liquified Natural Gas (LNG) Market by Transport Fuel, 2023-2033 (BCM, AGR (%))
Figure 70 North America Liquified Natural Gas (LNG) Market Share Forecast by Transport Fuel, 2023-2033 (%)
Figure 71 North America Liquified Natural Gas (LNG) Market by End-Use, 2023-2033 (US$ Bn, AGR (%))
Figure 72 North America Liquified Natural Gas (LNG) Market by End-Use, 2023-2033 (BCM, AGR (%))
Figure 73 North America Liquified Natural Gas (LNG) Market Share Forecast by End-Use, 2023-2033 (%)
Figure 74 US Liquified Natural Gas (LNG) Market by Value, 2023-2033 (US$ Bn, AGR (%))
Figure 75 US Liquified Natural Gas (LNG) Market by Volume, 2023-2033 (BCM, AGR (%))
Figure 76 Canada Liquified Natural Gas (LNG) Market by Value, 2023-2033 (US$ Bn, AGR (%))
Figure 77 Canada Liquified Natural Gas (LNG) Market by Volume, 2023-2033 (BCM, AGR (%))
Figure 78 Europe Liquified Natural Gas Market Attractiveness Index
Figure 79 Europe Liquified Natural Gas (LNG) Market by Value, 2023-2033 (US$ Bn, AGR (%))
Figure 80 Europe Liquified Natural Gas (LNG) Market by Volume, 2023-2033 (BCM, AGR (%))
Figure 81 Europe Liquified Natural Gas (LNG) Market by Country, 2023-2033 (US$ Bn, AGR (%))
Figure 82 Europe Liquified Natural Gas (LNG) Market by Country, 2023-2033 (BCM, AGR (%))
Figure 83 Europe Liquified Natural Gas (LNG) Market Share Forecast by Country, 2023-2033 (%)
Figure 84 Europe Liquified Natural Gas (LNG) Market by Transport Fuel, 2023-2033 (US$ Bn, AGR (%))
Figure 85 Europe Liquified Natural Gas (LNG) Market by Transport Fuel, 2023-2033 (BCM, AGR (%))
Figure 86 Europe Liquified Natural Gas (LNG) Market Share Forecast by Transport Fuel, 2023-2033 (%)
Figure 87 Europe Liquified Natural Gas (LNG) Market by End-Use, 2023-2033 (US$ Bn, AGR (%))
Figure 88 Europe Liquified Natural Gas (LNG) Market by End-Use, 2023-2033 (BCM, AGR (%))
Figure 89 Europe Liquified Natural Gas (LNG) Market Share Forecast by End-Use, 2023-2033 (%)
Figure 90 Russia Liquified Natural Gas (LNG) Market by Value, 2023-2033 (US$ Bn, AGR (%))
Figure 91 Russia Liquified Natural Gas (LNG) Market by Volume, 2023-2033 (BCM, AGR (%))
Figure 92 Germany Liquified Natural Gas (LNG) Market by Value, 2023-2033 (US$ Bn, AGR (%))
Figure 93 Germany Liquified Natural Gas (LNG) Market by Volume, 2023-2033 (BCM, AGR (%))
Figure 94 Italy Liquified Natural Gas (LNG) Market by Value, 2023-2033 (US$ Bn, AGR (%))
Figure 95 Italy Liquified Natural Gas (LNG) Market by Volume, 2023-2033 (BCM, AGR (%))
Figure 96 UK Liquified Natural Gas (LNG) Market by Value, 2023-2033 (US$ Bn, AGR (%))
Figure 97 UK Liquified Natural Gas (LNG) Market by Volume, 2023-2033 (BCM, AGR (%))
Figure 98 France Liquified Natural Gas (LNG) Market by Value, 2023-2033 (US$ Bn, AGR (%))
Figure 99 France Liquified Natural Gas (LNG) Market by Volume, 2023-2033 (BCM, AGR (%))
Figure 100 Rest of Europe Liquified Natural Gas (LNG) Market by Value, 2023-2033 (US$ Bn, AGR (%))
Figure 101 Rest of Europe Liquified Natural Gas (LNG) Market by Volume, 2023-2033 (BCM, AGR (%))
Figure 102 Asia Pacific Liquified Natural Gas Market Attractiveness Index
Figure 103 Asia-Pacific Liquified Natural Gas (LNG) Market by Value, 2023-2033 (US$ Bn, AGR (%))
Figure 104 Asia-Pacific Liquified Natural Gas (LNG) Market by Volume, 2023-2033 (BCM, AGR (%))
Figure 105 Asia-Pacific Liquified Natural Gas (LNG) Market by Country, 2023-2033 (US$ Bn, AGR (%))
Figure 106 Asia-Pacific Liquified Natural Gas (LNG) Market by Country, 2023-2033 (BCM, AGR (%))
Figure 107 Asia-Pacific Liquified Natural Gas (LNG) Market Share Forecast by Country, 2023-2033 (%)
Figure 108 Asia-Pacific Liquified Natural Gas (LNG) Market by Transport Fuel, 2023-2033 (US$ Bn, AGR (%))
Figure 109 Asia-Pacific Liquified Natural Gas (LNG) Market by Transport Fuel, 2023-2033 (BCM, AGR (%))
Figure 110 Asia-Pacific Liquified Natural Gas (LNG) Market Share Forecast by Transport Fuel, 2023-2033 (%)
Figure 111 Asia-Pacific Liquified Natural Gas (LNG) Market by End-Use, 2023-2033 (US$ Bn, AGR (%))
Figure 112 Asia-Pacific Liquified Natural Gas (LNG) Market by End-Use, 2023-2033 (BCM, AGR (%))
Figure 113 Asia-Pacific Liquified Natural Gas (LNG) Market Share Forecast by End-Use, 2023-2033 (%)
Figure 114 China Liquified Natural Gas (LNG) Market by Value, 2023-2033 (US$ Bn, AGR (%))
Figure 115 China Liquified Natural Gas (LNG) Market by Volume, 2023-2033 (BCM, AGR (%))
Figure 116 Japan Liquified Natural Gas (LNG) Market by Value, 2023-2033 (US$ Bn, AGR (%))
Figure 117 Japan Liquified Natural Gas (LNG) Market by Volume, 2023-2033 (BCM, AGR (%))
Figure 118 South Korea Liquified Natural Gas (LNG) Market by Value, 2023-2033 (US$ Bn, AGR (%))
Figure 119 South Korea Liquified Natural Gas (LNG) Market by Volume, 2023-2033 (BCM, AGR (%))
Figure 120 India Liquified Natural Gas (LNG) Market by Value, 2023-2033 (US$ Bn, AGR (%))
Figure 121 India Liquified Natural Gas (LNG) Market by Volume, 2023-2033 (BCM, AGR (%))
Figure 122 Thailand Liquified Natural Gas (LNG) Market by Value, 2023-2033 (US$ Bn, AGR (%))
Figure 123 Thailand Liquified Natural Gas (LNG) Market by Volume, 2023-2033 (BCM, AGR (%))
Figure 124 Rest of Asia-Pacific Liquified Natural Gas (LNG) Market by Value, 2023-2033 (US$ Bn, AGR (%))
Figure 125 Rest of Asia-Pacific Liquified Natural Gas (LNG) Market by Volume, 2023-2033 (BCM, AGR (%))
Figure 126 Middle East & Africa Liquified Natural Gas Market Attractiveness Index
Figure 127 Middle East & Africa Liquified Natural Gas (LNG) Market by Value, 2023-2033 (US$ Bn, AGR (%))
Figure 128 Middle East & Africa Liquified Natural Gas (LNG) Market by Volume, 2023-2033 (BCM, AGR (%))
Figure 129 Middle East & Africa Liquified Natural Gas (LNG) Market by Country, 2023-2033 (US$ Bn, AGR (%))
Figure 130 Middle East & Africa Liquified Natural Gas (LNG) Market by Country, 2023-2033 (BCM, AGR (%))
Figure 131 Middle East & Africa Liquified Natural Gas (LNG) Market Share Forecast by Country, 2023-2033 (%)
Figure 132 Middle East & Africa Liquified Natural Gas (LNG) Market by Transport Fuel, 2023-2033 (US$ Bn, AGR (%))
Figure 133 Middle East & Africa Liquified Natural Gas (LNG) Market by Transport Fuel, 2023-2033 (BCM, AGR (%))
Figure 134 Middle East & Africa Liquified Natural Gas (LNG) Market Share Forecast by Transport Fuel, 2023-2033 (%)
Figure 135 Middle East & Africa Liquified Natural Gas (LNG) Market by End-Use, 2023-2033 (US$ Bn, AGR (%))
Figure 136 Middle East & Africa Liquified Natural Gas (LNG) Market by End-Use, 2023-2033 (BCM, AGR (%))
Figure 137 Middle East & Africa Liquified Natural Gas (LNG) Market Share Forecast by End-Use, 2023-2033 (%)
Figure 138 GCC Liquified Natural Gas (LNG) Market by Value, 2023-2033 (US$ Bn, AGR (%))
Figure 139 GCC Liquified Natural Gas (LNG) Market by Volume, 2023-2033 (BCM, AGR (%))
Figure 140 South Africa Liquified Natural Gas (LNG) Market by Value, 2023-2033 (US$ Bn, AGR (%))
Figure 141 South Africa Liquified Natural Gas (LNG) Market by Volume, 2023-2033 (BCM, AGR (%))
Figure 142 Rest of Middle East & Africa Liquified Natural Gas (LNG) Market by Value, 2023-2033 (US$ Bn, AGR (%))
Figure 143 Rest of Middle East & Africa Liquified Natural Gas (LNG) Market by Volume, 2023-2033 (BCM, AGR (%))
Figure 144 Latin America Liquified Natural Gas Market Attractiveness Index
Figure 145 Latin America Liquified Natural Gas (LNG) Market by Value, 2023-2033 (US$ Bn, AGR (%))
Figure 146 Latin America Liquified Natural Gas (LNG) Market by Volume, 2023-2033 (BCM, AGR (%))
Figure 147 Latin America Liquified Natural Gas (LNG) Market by Country, 2023-2033 (US$ Bn, AGR (%))
Figure 148 Latin America Liquified Natural Gas (LNG) Market by Country, 2023-2033 (BCM, AGR (%))
Figure 149 Latin America Liquified Natural Gas (LNG) Market Share Forecast by Country, 2023-2033 (%)
Figure 150 Latin America Liquified Natural Gas (LNG) Market by Transport Fuel, 2023-2033 (US$ Bn, AGR (%))
Figure 151 Latin America Liquified Natural Gas (LNG) Market by Transport Fuel, 2023-2033 (BCM, AGR (%))
Figure 152 Latin America Liquified Natural Gas (LNG) Market Share Forecast by Transport Fuel, 2023-2033 (%)
Figure 153 Latin America Liquified Natural Gas (LNG) Market by End-Use, 2023-2033 (US$ Bn, AGR (%))
Figure 154 Latin America Liquified Natural Gas (LNG) Market by End-Use, 2023-2033 (BCM, AGR (%))
Figure 155 Latin America Liquified Natural Gas (LNG) Market Share Forecast by End-Use, 2023-2033 (%)
Figure 156 Argentina Liquified Natural Gas (LNG) Market by Value, 2023-2033 (US$ Bn, AGR (%))
Figure 157 Argentina Liquified Natural Gas (LNG) Market by Volume, 2023-2033 (BCM, AGR (%))
Figure 158 Mexico Liquified Natural Gas (LNG) Market by Value, 2023-2033 (US$ Bn, AGR (%))
Figure 159 Argentina Liquified Natural Gas (LNG) Market by Volume, 2023-2033 (BCM, AGR (%))
Figure 160 Rest of Latin America Liquified Natural Gas (LNG) Market by Value, 2023-2033 (US$ Bn, AGR (%))
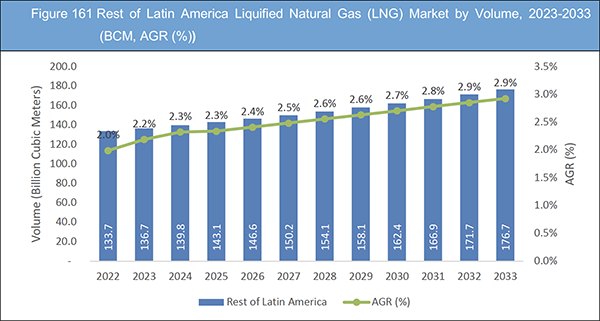
Figure 161 Rest of Latin America Liquified Natural Gas (LNG) Market by Volume, 2023-2033 (BCM, AGR (%))
Figure 162 Liquified Natural Gas Market: Company Share, 2022
Figure 163 Royal Dutch Shell Plc: Net Revenue, 2018-2022 (US$ million, AGR%)
Figure 164 Royal Dutch Shell Plc: R&D, 2018-2022 (US$ million, AGR%)
Figure 165 Royal Dutch Shell Plc: Regional Market Shares, 2022
Figure 166 Royal Dutch Shell Plc: Business Segment Market Shares, 2022
Figure 167 Equinor ASA: Net Revenue, 2018-2022 (US$ million, AGR%)
Figure 168 Equinor ASA: R&D, 2018-2022 (US$ million, AGR%)
Figure 169 Equinor ASA: Regional Market Shares, 2022
Figure 170 Equinor ASA: Business Segment Market Shares, 2022
Figure 171 ExxonMobil Corporation: Net Revenue, 2018-2022 (US$ million, AGR%)
Figure 172 ExxonMobil Corporation: R&D, 2018-2022 (US$ million, AGR%)
Figure 173 ExxonMobil Corporation: Regional Market Shares, 2022
Figure 174 ExxonMobil Corporation: Business Segment Market Shares, 2022
Figure 175 Chevron Corporation: Net Revenue, 2018-2022 (US$ million, AGR%)
Figure 176 Chevron Corporation: R&D, 2018-2022 (US$ million, AGR%)
Figure 177 Chevron Corporation: Regional Market Shares, 2022
Figure 178 Chevron Corporation: Business Market Shares, 2022
Figure 179 BP Plc: Net Revenue, 2018-2022 (US$ million, AGR%)
Figure 180 BP Plc: R&D, 2018-2022 (US$ million, AGR%)
Figure 181 BP Plc: Business Segment Market Shares, 2022
Figure 182 TotalEnergies SE: Net Revenue, 2018-2022 (US$ million, AGR%)
Figure 183 TotalEnergies SE: R&D, 2018-2022 (US$ million, AGR%)
Figure 184 TotalEnergies SE: Regional Market Shares, 2022
Figure 185 TotalEnergies SE: Business Segment Market Shares, 2022
Figure 186 ConocoPhillips Company: Net Revenue, 2018-2022 (US$ million, AGR%)
Figure 187 ConocoPhillips Company: R&D, 2018-2022 (US$ million, AGR%)
Figure 188 ConocoPhillips Company: Regional Market Shares, 2022
Figure 189 ConocoPhillips Company: Regional Market Shares, 2022
Figure 190 Eni S.p.A.: Net Revenue, 2018-2022 (US$ million, AGR%)
Figure 191 Eni S.p.A.: R&D, 2018-2022 (US$ million, AGR%)
Figure 192 Eni S.p.A.: Regional Market Shares, 2022
Figure 193 Eni S.p.A.: Business Segment Market Shares, 2022
Figure 194 Woodside Energy Group Ltd: Net Revenue, 2017-2021 (US$ million, AGR%)
Figure 195 Woodside Energy Group Ltd: Regional Market Shares, 2022
Figure 196 Woodside Energy Group Ltd: Business Segment Market Shares, 2022
Figure 197 BG Group plc: Net Revenue, 2018-2022 (US$ million, AGR%)
Figure 198 BG Group plc: R&D, 2018-2022 (US$ million, AGR%)
Figure 199 BG Group plc: Regional Market Shares, 2022
Figure 200 BG Group plc: Business Segment Market Shares, 2022
Figure 201 INPEX Corporation: Net Revenue, 2017-2021 (US$ million, AGR%)
Figure 202 INPEX Corporation: R&D, 2017-2021 (US$ million, AGR%)
Figure 203 INPEX Corporation: Regional Market Shares, 2021
Figure 204 INPEX Corporation: Regional Market Shares, 2021
Figure 205 Chesapeake Energy Corporation: Net Revenue, 2018-2022 (US$ million, AGR%)
Figure 206 Chesapeake Energy Corporation: R&D, 2018-2022 (US$ million, AGR%)
Figure 207 Chesapeake Energy Corporation: Regional Market Shares, 2021
ページTOPに戻る
Summary
Report Details
The Liquified Natural Gas (LNG) Market Report 2023-2033: This report will prove invaluable to leading firms striving for new revenue pockets if they wish to better understand the industry and its underlying dynamics. It will be useful for companies that would like to expand into different industries or to expand their existing operations in a new region.
Important Trend in the LNG Market Is the Growing Number of New Liquefaction Projects
The liquefied natural gas (LNG) market has grown rapidly in recent years and is expected to continue to do so in the coming years. The demand for LNG is driven by several factors, including the increasing need for cleaner energy sources, the growth of natural gas production, and the expansion of the global energy market.
One of the major trends in the LNG market is the increasing demand from Asia, particularly China and India. These countries are experiencing significant economic growth, leading to an increase in energy demand. The increasing use of natural gas in the power generation sector, coupled with the rise in demand for cleaner-burning fuels, has led to a surge in LNG imports.
Another important trend in the LNG market is the growing number of new liquefaction projects. Several countries, including the United States, Russia, and Qatar, have invested heavily in new LNG projects in recent years. These projects are aimed at increasing LNG production capacity and meeting the growing demand for LNG.
Despite the growth potential of the LNG market, there are several challenges that need to be addressed. One of the major challenges is the high cost of building new LNG infrastructure, such as liquefaction plants, regasification terminals, and shipping vessels. The volatility of LNG prices is also a concern, as it makes it difficult for buyers and sellers to plan for the future.
What Questions Should You Ask before Buying a Market Research Report?
• How is the liquified natural gas (LNG) market evolving?
• What is driving and restraining the liquified natural gas (LNG) market?
• How will each liquified natural gas (LNG) submarket segment grow over the forecast period and how much revenue will these submarkets account for in 2033?
• How will the market shares for each liquified natural gas (LNG) submarket develop from 2023 to 2033?
• What will be the main driver for the overall market from 2023 to 2033?
• Will leading liquified natural gas (LNG) markets broadly follow the macroeconomic dynamics, or will individual national markets outperform others?
• How will the market shares of the national markets change by 2033 and which geographical region will lead the market in 2033?
• Who are the leading players and what are their prospects over the forecast period?
• What are the liquified natural gas (LNG) projects for these leading companies?
• How will the industry evolve during the period between 2023 and 2033?What are the implications of liquified natural gas (LNG) projects taking place now and over the next 10 years?
• Is there a greater need for product commercialisation to further scale the liquified natural gas (LNG) market?
• Where is the liquified natural gas (LNG) market heading and how can you ensure you are at the forefront of the market?
• What are the best investment options for new product and service lines?
• What are the key prospects for moving companies into a new growth path and C-suite?
You need to discover how this will impact the liquified natural gas (LNG) market today, and over the next 10 years:
• Our 345-page report provides 165 tables and 207 charts/graphs exclusively to you.
• The report highlights key lucrative areas in the industry so you can target them – NOW.
• It contains in-depth analysis of global, regional and national sales and growth.
• It highlights for you the key successful trends, changes and revenue projections made by your competitors.
This report tells you TODAY how the liquified natural gas (LNG) market will develop in the next 10 years, and in line with the variations in COVID-19 economic recession and bounce. This market is more critical now than at any point over the last 10 years.
Forecasts to 2033 and other analyses reveal commercial prospects
• In addition to revenue forecasting to 2033, our new study provides you with recent results, growth rates, and market shares.
• You will find original analyses, with business outlooks and developments.
• Discover qualitative analyses (including market dynamics, drivers, opportunities, restraints and challenges), cost structure, impact of rising liquified natural gas (LNG) prices and recent developments.
This report includes data analysis and invaluable insight into how COVID-19 will affect the industry and your company. Four COVID-19 recovery patterns and their impact, namely, “V”, “L”, “W” and “U” are discussed in this report.
Segments Covered in the Report
Market Segment by
• Value (US$ Billion)
• Volume (BCM)
Market Segment by Transport Fuel
• Heavy-Duty Vehicles
• Passenger Vehicles
• Marine Transport
• Other Transport Fuel
Market Segment by End-Use
• Domestic Use
• Industrial Use
• Commercial Use
• Transportation Use
• Utilities and Power Use
• Other End-Use
In addition to the revenue predictions for the overall world market and segments, you will also find revenue forecasts for four regional and 20 leading national markets:
North America
• U.S.
• Canada
Europe
• Germany
• Russia
• United Kingdom
• France
• Italy
• Rest of Europe
Asia Pacific
• China
• Japan
• India
• Thailand
• South Korea
• Rest of Asia Pacific
Latin America
• Argentina
• Mexico
• Rest of Latin America
Middle East & Africa
• GCC
• South Africa
• Rest of Middle East & Africa
The report also includes profiles and for some of the leading companies in the Liquified Natural Gas (LNG) Market, 2023 to 2033, with a focus on this segment of these companies’ operations.
Leading companies and the potential for market growth
• BG Group plc
• BP Plc
• Chesapeake Energy Corporation
• Chevron Corporation
• ConocoPhillips Company
• Eni S.p.A.
• Equinor ASA
• ExxonMobil Corporation
• Gazprom PJSC
• INPEX Corporation
• Petronas Dagangan Berhad
• Qatargas
• Royal Dutch Shell Plc.
• TotalEnergies SE
• Woodside Energy Group Ltd
Overall world revenue for Liquified Natural Gas (LNG) Market, 2023 to 2033 in terms of value the market will surpass US$286.58 billion in 2023, our work calculates. We predict strong revenue growth through to 2033. Our work identifies which organizations hold the greatest potential. Discover their capabilities, progress, and commercial prospects, helping you stay ahead.
How will the Liquified Natural Gas (LNG) Market, 2023 to 2033 report help you?
In summary, our 340+ page report provides you with the following knowledge:
• Revenue forecasts to 2033 for Liquified Natural Gas (LNG) Market, 2023 to 2033 Market, with forecasts for market value, market volume, transport fuel, and end-use, each forecast at a global and regional level – discover the industry’s prospects, finding the most lucrative places for investments and revenues.
• Revenue forecasts to 2033 for four regional and 20 key national markets – See forecasts for the Liquified Natural Gas (LNG) Market, 2023 to 2033 market in North America, Europe, Asia-Pacific, Latin America and Middle East & Africa. Also forecasted is the market in the US, Canada, Russia, Germany, France, UK, Italy, China, India, Japan, and Australia among other prominent economies.
• Prospects for established firms and those seeking to enter the market – including company profiles for 15 of the major companies involved in the Liquified Natural Gas (LNG) Market, 2023 to 2033.
Find quantitative and qualitative analyses with independent predictions. Receive information that only our report contains, staying informed with invaluable business intelligence.
Information found nowhere else
With our new report, you are less likely to fall behind in knowledge or miss out on opportunities. See how our work could benefit your research, analyses, and decisions. Visiongain’s study is for everybody needing commercial analyses for the Liquified Natural Gas (LNG) Market, 2023 to 2033, market-leading companies. You will find data, trends and predictions.
ページTOPに戻る
Table of Contents
Table of Contents
1 Report Overview
1.1 Objectives of the Study
1.2 Introduction to Liquified Natural Gas Market
1.3 What This Report Delivers
1.4 Why You Should Read This Report
1.5 Key Questions Answered by This Analytical Report
1.6 Who is This Report for?
1.7 Research Methodology
1.7.1 Market Definitions
1.7.2 Market Evaluation & Forecasting Methodology
1.7.3 Data Validation
1.7.3.1 Primary Research
1.7.3.2 Secondary Research
1.8 Frequently Asked Questions (FAQs)
1.9 Associated Visiongain Reports
1.10 About Visiongain
2 Executive Summary
2.1 Segment analysis
2.1.1 Transport Fuel Segment: Market Attractiveness Index
2.1.2 End-Use Segment: Market Attractiveness Index
2.2 Regional Analysis
3 Market Overview
3.1 Key Findings
3.2 Market Dynamics
3.2.1 Market Driving Factors
3.2.1.1 High Demand for Small-Scale Liquefied Natural Gas (LNG)
3.2.1.2 Clean Energy Demand
3.2.2 Market Restraining Factors
3.2.2.1 Oversupply: A Major Cause of Concern
3.2.2.2 Geopolitical Uncertainty Leading to Low Rate of Growth
3.2.2.3 Environmental Concerns as a Restraint to the Growth of LNG Market
3.2.3 Market Opportunities
3.2.3.1 Technology and Government Policy Integration
3.2.3.2 Improved Economics Aiding the Growth of the LNG Market
3.2.3.3 Fuel Flexibility is Aided by LNG Infrastructure
3.3 COVID-19 Impact Analysis
3.3.1 V-Shaped Recovery
3.3.2 W-Shaped Recovery
3.3.3 U-Shaped Recovery
3.3.4 L-Shaped Recovery
3.4 Porter’s Five Forces Analysis
3.4.1 Bargaining Power of Suppliers
3.4.2 Bargaining Power of Buyers
3.4.3 Competitive Rivalry
3.4.4 Threat from Substitutes
3.4.5 Threat of New Entrants
3.5 PEST Analysis
3.5.1 Political Factors
3.5.2 Economic Factors
3.5.3 Social Factors
3.5.4 Technological Factors
4 Liquified Natural Gas Market Analysis by Transport Fuel
4.1 Key Findings
4.2 Transport Fuel Segment: Market Attractiveness Index
4.3 Liquified Natural Gas Market Size Estimation and Forecast by Transport Fuel
4.4 Heavy-Duty Vehicles Market
4.4.1 Market Size by Region, 2023-2033 (US$ bn)
4.4.2 Market Share by Region, 2023 & 2033 (%)
4.5 Passenger Vehicles Market
4.5.1 Market Size by Region, 2023-2033 (US$ bn)
4.5.2 Market Share by Region, 2023 & 2033 (%)
4.6 Marine Transport Market
4.6.1 Market Size by Region, 2023-2033 (US$ bn)
4.6.2 Market Share by Region, 2023 & 2033 (%)
4.7 Other Transport Fuel Market
4.7.1 Market Size by Region, 2023-2033 (US$ bn)
4.7.2 Market Share by Region, 2023 & 2033 (%)
5 Liquified Natural Gas Market Analysis by End-Use
5.1 Key Findings
5.2 End-Use Segment: Market Attractiveness Index
5.3 Liquified Natural Gas Market Size Estimation and Forecast by End-Use
5.4 Domestic Use Market
5.4.1 Market Size by Region, 2023-2033 (US$ bn)
5.4.2 Market Share by Region, 2023 & 2033 (%)
5.5 Industrial Use Market
5.5.1 Market Size by Region, 2023-2033 (US$ bn)
5.5.2 Market Share by Region, 2023 & 2033 (%)
5.6 Commercial Use Market
5.6.1 Market Size by Region, 2023-2033 (US$ bn)
5.6.2 Market Share by Region, 2023 & 2033 (%)
5.7 Transportation Use Market
5.7.1 Market Size by Region, 2023-2033 (US$ bn)
5.7.2 Market Share by Region, 2023 & 2033 (%)
5.8 Utilities and Power Use Market
5.8.1 Market Size by Region, 2023-2033 (US$ bn)
5.8.2 Market Share by Region, 2023 & 2033 (%)
5.9 Other End-Use Market
5.9.1 Market Size by Region, 2023-2033 (US$ bn)
5.9.2 Market Share by Region, 2023 & 2033 (%)
6 Liquified Natural Gas Market Analysis by Region
6.1 Key Findings
6.2 Regional Market Size Estimation and Forecast
6.3 Global Liquified Natural Gas (LNG) Market by Region
6.4 Global Liquified Natural Gas (LNG) Market by Transport Fuel
6.5 Global Liquified Natural Gas (LNG) Market by End-Use
7 North America Liquified Natural Gas Market Analysis
7.1 Key Findings
7.2 North America Liquified Natural Gas Market Attractiveness Index
7.3 North America Liquified Natural Gas Market Size Estimation and Forecast by Value
7.4 North America Liquified Natural Gas (LNG) Market by Country
7.5 North America Liquified Natural Gas (LNG) Market by Transport Fuel
7.6 North America Liquified Natural Gas (LNG) Market by End-Use
7.7 U.S. Liquified Natural Gas Market Analysis
7.8 Canada Liquified Natural Gas Market Analysis
8 Europe Liquified Natural Gas Market Analysis
8.1 Key Findings
8.2 Europe Liquified Natural Gas Market Attractiveness Index
8.3 Europe Liquified Natural Gas Market Size Estimation and Forecast by Value
8.4 Europe Liquified Natural Gas (LNG) Market by Country
8.5 Europe Liquified Natural Gas (LNG) Market by Transport Fuel
8.6 Europe Liquified Natural Gas (LNG) Market by End-Use
8.7 Russia Liquified Natural Gas Market Analysis
8.8 Germany Liquified Natural Gas Market Analysis
8.9 Italy Liquified Natural Gas Market Analysis
8.10 UK Liquified Natural Gas Market Analysis
8.11 France Liquified Natural Gas Market Analysis
8.12 Rest of Europe Liquified Natural Gas Market Analysis
9 Asia Pacific Liquified Natural Gas Market Analysis
9.1 Key Findings
9.2 Asia Pacific Liquified Natural Gas Market Attractiveness Index
9.3 Asia Pacific Liquified Natural Gas Market Size Estimation and Forecast by Value
9.4 Asia-Pacific Liquified Natural Gas (LNG) Market by Country
9.5 Asia-Pacific Liquified Natural Gas (LNG) Market by Transport Fuel
9.6 Asia-Pacific Liquified Natural Gas (LNG) Market by End-Use
9.7 China Liquified Natural Gas Market Analysis
9.8 Japan Liquified Natural Gas Market Analysis
9.9 South Korea Liquified Natural Gas Market Analysis
9.10 India Liquified Natural Gas Market Analysis
9.11 Thailand Liquified Natural Gas Market Analysis
9.12 Rest of Asia Pacific Liquified Natural Gas Market Analysis
10 Middle East & Africa Liquified Natural Gas Market Analysis
10.1 Key Findings
10.2 Middle East & Africa Liquified Natural Gas Market Attractiveness Index
10.3 Middle East & Africa Liquified Natural Gas Market Size Estimation and Forecast by Value
10.4 Middle East & Africa Liquified Natural Gas (LNG) Market by Country
10.5 Middle East & Africa Liquified Natural Gas (LNG) Market by Transport Fuel
10.6 Middle East & Africa Liquified Natural Gas (LNG) Market by End-Use
10.7 GCC Liquified Natural Gas Market Analysis
10.8 South Africa Liquified Natural Gas Market Analysis
10.9 Rest of Middle East & Africa Liquified Natural Gas Market Analysis
11 Latin America Liquified Natural Gas Market Analysis
11.1 Key Findings
11.2 Latin America Liquified Natural Gas Market Attractiveness Index
11.3 Latin America Liquified Natural Gas Market Size Estimation and Forecast by Value
11.4 Latin America Liquified Natural Gas (LNG) Market by Country
11.5 Latin America Liquified Natural Gas (LNG) Market by Transport Fuel
11.6 Latin America Liquified Natural Gas (LNG) Market by End-Use
11.7 Argentina Liquified Natural Gas Market Analysis
11.8 Mexico Liquified Natural Gas Market Analysis
11.9 Rest of Latin America Liquified Natural Gas Market Analysis
12 Company Profiles
12.1 Competitive Landscape, 2022
12.2 Strategic Outlook
12.2.1 Acquisitions as Key Business Strategy
12.2.2 Partnership as Key Business Strategy
12.2.3 Collaboration as Key Business Strategy
12.2.4 New Product Launch as Key Business Strategy
12.2.5 Expansion as Key Business Strategy
12.3 Royal Dutch Shell Plc.
12.3.1 Company Snapshot
12.3.2 Company Overview
12.3.3 Financial Analysis
12.3.3.1 Net Revenue, 2018-2022
12.3.3.2 R&D, 2018-2022
12.3.3.3 Regional Market Shares, 2022
12.3.3.4 Business Segment Market Shares, 2022
12.3.4 Product Benchmarking
12.3.5 Strategic Outlook
12.4 Gazprom PJSC
12.4.1 Company Snapshot
12.4.2 Company Overview
12.4.3 Product Benchmarking
12.4.4 Strategic Outlook
12.5 Petronas Dagangan Berhad
12.5.1 Company Snapshot
12.5.2 Company Overview
12.5.3 Product Benchmarking
12.5.4 Strategic Outlook
12.6 Equinor ASA
12.6.1 Company Snapshot
12.6.2 Company Overview
12.6.3 Financial Analysis
12.6.3.1 Net Revenue, 2018-2022
12.6.3.2 R&D, 2018-2022
12.6.3.3 Regional Market Shares, 2022
12.6.3.4 Business Segment Market Shares, 2022
12.6.4 Strategic Outlook
12.7 ExxonMobil Corporation
12.7.1 Company Snapshot
12.7.2 Company Overview
12.7.3 Financial Analysis
12.7.3.1 Net Revenue, 2018-2022
12.7.3.2 R&D, 2018-2022
12.7.3.3 Regional Market Shares, 2022
12.7.3.4 Business Segment Market Shares, 2022
12.7.4 Product Benchmarking
12.7.5 Strategic Outlook
12.8 Chevron Corporation
12.8.1 Company Snapshot
12.8.2 Company Overview
12.8.3 Financial Analysis
12.8.3.1 Net Revenue, 2018-2022
12.8.3.2 R&D, 2018-2022
12.8.3.3 Regional Market Shares, 2022
12.8.3.4 Business Segment Market Shares, 2022
12.8.4 Product Benchmarking
12.8.5 Strategic Outlook
12.9 BP Plc
12.9.1 Company Snapshot
12.9.2 Company Overview
12.9.3 Financial Analysis
12.9.3.1 Net Revenue, 2018-2022
12.9.3.2 R&D, 2018-2022
12.9.3.3 Business Segment Market Shares, 2022
12.9.4 Product Benchmarking
12.10 TotalEnergies SE
12.10.1 Company Snapshot
12.10.2 Company Overview
12.10.3 Financial Analysis
12.10.3.1 Net Revenue, 2018-2022
12.10.3.2 R&D, 2018-2022
12.10.3.3 Regional Market Shares, 2022
12.10.3.4 Business Segment Market Shares, 2022
12.10.4 Product Benchmarking
12.10.5 Strategic Outlook
12.11 ConocoPhillips Company
12.11.1 Company Snapshot
12.11.2 Company Overview
12.11.3 Financial Analysis
12.11.3.1 Net Revenue, 2018-2022
12.11.3.2 R&D, 2018-2022
12.11.3.3 Regional Market Shares, 2022
12.11.3.4 Business Segment Market Shares, 2022
12.11.4 Product Benchmarking
12.11.5 Strategic Outlook
12.12 Eni S.p.A.
12.12.1 Company Snapshot
12.12.2 Company Overview
12.12.3 Financial Analysis
12.12.3.1 Net Revenue, 2018-2022
12.12.3.2 R&D, 2018-2022
12.12.3.3 Regional Market Shares, 2022
12.12.3.4 Business Segment Market Shares, 2022
12.12.4 Product Benchmarking
12.12.5 Strategic Outlook
12.13 Woodside Energy Group Ltd
12.13.1 Company Snapshot
12.13.2 Company Overview
12.13.3 Financial Analysis
12.13.3.1 Net Revenue, 2017-2021
12.13.3.2 Regional Market Shares, 2022
12.13.3.3 Business Segment Market Shares, 2022
12.13.4 Product Benchmarking
12.13.5 Strategic Outlook
12.14 BG Group plc
12.14.1 Company Snapshot
12.14.2 Company Overview
12.14.3 Financial Analysis
12.14.3.1 Net Revenue, 2018-2022
12.14.3.2 R&D, 2018-2022
12.14.3.3 Regional Market Shares, 2022
12.14.3.4 Business Segment Market Shares, 2022
12.14.4 Product Benchmarking
12.15 INPEX Corporation
12.15.1 Company Snapshot
12.15.2 Company Overview
12.15.3 Financial Analysis
12.15.3.1 Net Revenue, 2017-2021
12.15.3.2 R&D, 2017-2021
12.15.3.3 Regional Market Shares, 2021
12.15.3.4 Business Segment Market Shares, 2021
12.15.4 Product Benchmarking
12.15.5 Strategic Outlook
12.16 Chesapeake Energy Corporation
12.16.1 Company Snapshot
12.16.2 Company Overview
12.16.3 Financial Analysis
12.16.3.1 Net Revenue, 2018-2022
12.16.3.2 R&D, 2018-2022
12.16.3.3 Business Segment Market Shares, 2021
12.16.4 Product Benchmarking
12.17 Qatargas
12.17.1 Company Snapshot
12.17.2 Company Overview
12.17.3 Product Benchmarking
12.17.4 Strategic Outlook
13 Conclusion and Recommendations
13.1 Concluding Remarks from Visiongain
13.2 Recommendations for Market Players
List of Tables
Table 1 Liquified Natural Gas Market Snapshot, 2023 & 2033 (US$ billion, CAGR %)
Table 2 Global Liquified Natural Gas (LNG) Market Forecast, 2023-2033 (US$ Bn, AGR (%), CAGR (%)) (V-Shaped Recovery Scenario)
Table 3 Global Liquified Natural Gas (LNG) Market by Region, 2023-2033 (US$ Bn, AGR (%), CAGR (%)) (V-Shaped Recovery Scenario)
Table 4 Global Liquified Natural Gas (LNG) Market Forecast, 2023-2033 (US$ Bn, AGR (%), CAGR (%)) (W-Shaped Recovery Scenario)
Table 5 Global Liquified Natural Gas (LNG) Market by Region, 2023-2033 (US$ Bn, AGR (%), CAGR (%)) (W-Shaped Recovery Scenario)
Table 6 Global Liquified Natural Gas (LNG) Market Forecast, 2023-2033 (US$ Bn, AGR (%), CAGR (%)) (U-Shaped Recovery Scenario)
Table 7 Global Liquified Natural Gas (LNG) Market by Region, 2023-2033 (US$ Bn, AGR (%), CAGR (%)) (U-Shaped Recovery Scenario)
Table 8 Global Liquified Natural Gas (LNG) Market Forecast, 2023-2033 (US$ Bn, AGR (%), CAGR (%)) (L-Shaped Recovery Scenario)
Table 9 Global Liquified Natural Gas (LNG) Market by Region, 2023-2033 (US$ Bn, AGR (%), CAGR (%)) (L-Shaped Recovery Scenario)
Table 10 Global Liquified Natural Gas (LNG) Market by Transport Fuel, 2023-2033 (US$ Bn, AGR (%), CAGR (%))
Table 11 Global Liquified Natural Gas (LNG) Market by Transport Fuel, 2023-2033 (BCM, AGR (%), CAGR (%))
Table 12 Heavy-Duty Vehicles Market by Region, 2023-2033 (US$ Bn, AGR (%), CAGR (%))
Table 13 Heavy-Duty Vehicles Market by Region, 2023-2033 (BCM, AGR (%), CAGR (%))
Table 14 Passenger Vehicles Market by Region, 2023-2033 (US$ Bn, AGR (%), CAGR (%))
Table 15 Passenger Vehicles Market by Region, 2023-2033 (BCM, AGR (%), CAGR (%))
Table 16 Marine Transport Market by Region, 2023-2033 (US$ Bn, AGR (%), CAGR (%))
Table 17 Marine Transport Market by Region, 2023-2033 (BCM, AGR (%), CAGR (%))
Table 18 Other Transport Fuel Market by Region, 2023-2033 (US$ Bn, AGR (%), CAGR (%))
Table 19 Marine Transport Market by Region, 2023-2033 (BCM, AGR (%), CAGR (%))
Table 20 Global Liquified Natural Gas (LNG) Market by End-Use, 2023-2033 (US$ Bn, AGR (%), CAGR (%))
Table 21 Global Liquified Natural Gas (LNG) Market by End-Use, 2023-2033 (BCM, AGR (%), CAGR (%))
Table 22 Domestic Use Market by Region, 2023-2033 (US$ Bn, AGR (%), CAGR (%))
Table 23 Domestic Use Market by Region, 2023-2033 (BCM, AGR (%), CAGR (%))
Table 24 Industrial Use Market by Region, 2023-2033 (US$ Bn, AGR (%), CAGR (%))
Table 25 Industrial Use Market by Region, 2023-2033 (BCM, AGR (%), CAGR (%))
Table 26 Commercial Use Market by Region, 2023-2033 (US$ Bn, AGR (%), CAGR (%))
Table 27 Commercial Use Market by Region, 2023-2033 (BCM, AGR (%), CAGR (%))
Table 28 Transportation Use Market by Region, 2023-2033 (US$ Bn, AGR (%), CAGR (%))
Table 29 Transportation Use Market by Region, 2023-2033 (BCM, AGR (%), CAGR (%))
Table 30 Utilities and Power Use Market by Region, 2023-2033 (US$ Bn, AGR (%), CAGR (%))
Table 31 Utilities and Power Use Market by Region, 2023-2033 (BCM, AGR (%), CAGR (%))
Table 32 Other End-Use Market by Region, 2023-2033 (US$ Bn, AGR (%), CAGR (%))
Table 33 Other End-Use Market by Region, 2023-2033 (BCM, AGR (%), CAGR (%))
Table 34 Global Liquified Natural Gas (LNG) Market Forecast, 2023-2033 (US$ Bn, AGR (%), CAGR (%))
Table 35 Global Liquified Natural Gas (LNG) Market Forecast, 2023-2033 (BCM, AGR (%), CAGR (%))
Table 36 Global Liquified Natural Gas (LNG) Market by Region, 2023-2033 (US$ Bn, AGR (%), CAGR (%))
Table 37 Global Liquified Natural Gas (LNG) Market by Region, 2023-2033 (BCM, AGR (%), CAGR (%))
Table 38 Global Liquified Natural Gas (LNG) Market by Transport Fuel, 2023-2033 (US$ Bn, AGR (%), CAGR (%))
Table 39 Global Liquified Natural Gas (LNG) Market by Transport Fuel, 2023-2033 (BCM, AGR (%), CAGR (%))
Table 40 Global Liquified Natural Gas (LNG) Market by End-Use, 2023-2033 (US$ Bn, AGR (%), CAGR (%))
Table 41 Global Liquified Natural Gas (LNG) Market by End-Use, 2023-2033 (BCM, AGR (%), CAGR (%))
Table 42 North America Liquified Natural Gas (LNG) Market by Value, 2023-2033 (US$ Bn, AGR (%), CAGR (%))
Table 43 North America Liquified Natural Gas (LNG) Market by Volume, 2023-2033 (BCM, AGR (%), CAGR (%))
Table 44 North America Liquified Natural Gas (LNG) Market by Country, 2023-2033 (US$ Bn, AGR (%), CAGR (%))
Table 45 North America Liquified Natural Gas (LNG) Market by Country, 2023-2033 (BCM, AGR (%), CAGR (%))
Table 46 North America Liquified Natural Gas (LNG) Market by Transport Fuel, 2023-2033 (US$ Bn, AGR (%), CAGR (%))
Table 47 North America Liquified Natural Gas (LNG) Market by Transport Fuel, 2023-2033 (BCM, AGR (%), CAGR (%))
Table 48 North America Liquified Natural Gas (LNG) Market by End-Use, 2023-2033 (US$ Bn, AGR (%), CAGR (%))
Table 49 North America Liquified Natural Gas (LNG) Market by End-Use, 2023-2033 (BCM, AGR (%), CAGR (%))
Table 50 US Liquified Natural Gas (LNG) Market by Value, 2023-2033 (US$ Bn, AGR (%), CAGR (%))
Table 51 US Liquified Natural Gas (LNG) Market by Volume, 2023-2033 (BCM, AGR (%), CAGR (%))
Table 52 Canada Liquified Natural Gas (LNG) Market by Value, 2023-2033 (US$ Bn, AGR (%), CAGR (%))
Table 53 Canada Liquified Natural Gas (LNG) Market by Volume, 2023-2033 (BCM, AGR (%), CAGR (%))
Table 54 Europe Liquified Natural Gas (LNG) Market by Value, 2023-2033 (US$ Bn, AGR (%), CAGR (%))
Table 55 Europe Liquified Natural Gas (LNG) Market by Volume, 2023-2033 (BCM, AGR (%), CAGR (%))
Table 56 Europe Liquified Natural Gas (LNG) Market by Country, 2023-2033 (US$ Bn, AGR (%), CAGR (%))
Table 57 Europe Liquified Natural Gas (LNG) Market by Country, 2023-2033 (BCM, AGR (%), CAGR (%))
Table 58 Europe Liquified Natural Gas (LNG) Market by Transport Fuel, 2023-2033 (US$ Bn, AGR (%), CAGR (%))
Table 59 Europe Liquified Natural Gas (LNG) Market by Transport Fuel, 2023-2033 (BCM, AGR (%), CAGR (%))
Table 60 Europe Liquified Natural Gas (LNG) Market by End-Use, 2023-2033 (US$ Bn, AGR (%), CAGR (%))
Table 61 Europe Liquified Natural Gas (LNG) Market by End-Use, 2023-2033 (BCM, AGR (%), CAGR (%))
Table 62 Russia Liquified Natural Gas (LNG) Market by Value, 2023-2033 (US$ Bn, AGR (%), CAGR (%))
Table 63 Russia Liquified Natural Gas (LNG) Market by Volume, 2023-2033 (BCM, AGR (%), CAGR (%))
Table 64 Germany Liquified Natural Gas (LNG) Market by Value, 2023-2033 (US$ Bn, AGR (%), CAGR (%))
Table 65 Germany Liquified Natural Gas (LNG) Market by Volume, 2023-2033 (BCM, AGR (%), CAGR (%))
Table 66 Italy Liquified Natural Gas (LNG) Market by Value, 2023-2033 (US$ Bn, AGR (%), CAGR (%))
Table 67 Italy Liquified Natural Gas (LNG) Market by Volume, 2023-2033 (BCM, AGR (%), CAGR (%))
Table 68 UK Liquified Natural Gas (LNG) Market by Value, 2023-2033 (US$ Bn, AGR (%), CAGR (%))
Table 69 UK Liquified Natural Gas (LNG) Market by Volume, 2023-2033 (BCM, AGR (%), CAGR (%))
Table 70 France Liquified Natural Gas (LNG) Market by Value, 2023-2033 (US$ Bn, AGR (%), CAGR (%))
Table 71 France Liquified Natural Gas (LNG) Market by Volume, 2023-2033 (BCM, AGR (%), CAGR (%))
Table 72 Rest of Europe Liquified Natural Gas (LNG) Market by Value, 2023-2033 (US$ Bn, AGR (%), CAGR (%))
Table 73 Rest of Europe Liquified Natural Gas (LNG) Market by Volume, 2023-2033 (BCM, AGR (%), CAGR (%))
Table 74 Asia-Pacific Liquified Natural Gas (LNG) Market by Value, 2023-2033 (US$ Bn, AGR (%), CAGR (%))
Table 75 Asia-Pacific Liquified Natural Gas (LNG) Market by Volume, 2023-2033 (BCM, AGR (%), CAGR (%))
Table 76 Asia-Pacific Liquified Natural Gas (LNG) Market by Country, 2023-2033 (US$ Bn, AGR (%), CAGR (%))
Table 77 Asia-Pacific Liquified Natural Gas (LNG) Market by Country, 2023-2033 (BCM, AGR (%), CAGR (%))
Table 78 Asia-Pacific Liquified Natural Gas (LNG) Market by Transport Fuel, 2023-2033 (US$ Bn, AGR (%), CAGR (%))
Table 79 Asia-Pacific Liquified Natural Gas (LNG) Market by Transport Fuel, 2023-2033 (BCM, AGR (%), CAGR (%))
Table 80 Asia-Pacific Liquified Natural Gas (LNG) Market by End-Use, 2023-2033 (US$ Bn, AGR (%), CAGR (%))
Table 81 Asia-Pacific Liquified Natural Gas (LNG) Market by End-Use, 2023-2033 (BCM, AGR (%), CAGR (%))
Table 82 China Liquified Natural Gas (LNG) Market by Value, 2023-2033 (US$ Bn, AGR (%), CAGR (%))
Table 83 China Liquified Natural Gas (LNG) Market by Volume, 2023-2033 (BCM, AGR (%), CAGR (%))
Table 84 Japan Liquified Natural Gas (LNG) Market by Value, 2023-2033 (US$ Bn, AGR (%), CAGR (%))
Table 85 Japan Liquified Natural Gas (LNG) Market by Volume, 2023-2033 (BCM, AGR (%), CAGR (%))
Table 86 South Korea Liquified Natural Gas (LNG) Market by Value, 2023-2033 (US$ Bn, AGR (%), CAGR (%))
Table 87 South Korea Liquified Natural Gas (LNG) Market by Volume, 2023-2033 (BCM, AGR (%), CAGR (%))
Table 88 India Liquified Natural Gas (LNG) Market by Value, 2023-2033 (US$ Bn, AGR (%), CAGR (%))
Table 89 India Liquified Natural Gas (LNG) Market by Volume, 2023-2033 (BCM, AGR (%), CAGR (%))
Table 90 Thailand Liquified Natural Gas (LNG) Market by Value, 2023-2033 (US$ Bn, AGR (%), CAGR (%))
Table 91 Thailand Liquified Natural Gas (LNG) Market by Volume, 2023-2033 (BCM, AGR (%), CAGR (%))
Table 92 Rest of Asia-Pacific Liquified Natural Gas (LNG) Market by Value, 2023-2033 (US$ Bn, AGR (%), CAGR (%))
Table 93 Rest of Asia-Pacific Liquified Natural Gas (LNG) Market by Volume, 2023-2033 (BCM, AGR (%), CAGR (%))
Table 94 Middle East & Africa Liquified Natural Gas (LNG) Market by Value, 2023-2033 (US$ Bn, AGR (%), CAGR (%))
Table 95 Middle East & Africa Liquified Natural Gas (LNG) Market by Volume, 2023-2033 (BCM, AGR (%), CAGR (%))
Table 96 Middle East & Africa Liquified Natural Gas (LNG) Market by Country, 2023-2033 (US$ Bn, AGR (%), CAGR (%))
Table 97 Middle East & Africa Liquified Natural Gas (LNG) Market by Country, 2023-2033 (BCM, AGR (%), CAGR (%))
Table 98 Middle East & Africa Liquified Natural Gas (LNG) Market by Transport Fuel, 2023-2033 (US$ Bn, AGR (%), CAGR (%))
Table 99 Middle East & Africa Liquified Natural Gas (LNG) Market by Transport Fuel, 2023-2033 (BCM, AGR (%), CAGR (%))
Table 100 Middle East & Africa Liquified Natural Gas (LNG) Market by End-Use, 2023-2033 (US$ Bn, AGR (%), CAGR (%))
Table 101 Middle East & Africa Liquified Natural Gas (LNG) Market by End-Use, 2023-2033 (BCM, AGR (%), CAGR (%))
Table 102 GCC Liquified Natural Gas (LNG) Market by Value, 2023-2033 (US$ Bn, AGR (%), CAGR (%))
Table 103 GCC Liquified Natural Gas (LNG) Market by Volume, 2023-2033 (BCM, AGR (%), CAGR (%))
Table 104 South Africa Liquified Natural Gas (LNG) Market by Value, 2023-2033 (US$ Bn, AGR (%), CAGR (%))
Table 105 South Africa Liquified Natural Gas (LNG) Market by Volume, 2023-2033 (BCM, AGR (%), CAGR (%))
Table 106 Rest of Middle East & Africa Liquified Natural Gas (LNG) Market by Value, 2023-2033 (US$ Bn, AGR (%), CAGR (%))
Table 107 Rest of Middle East & Africa Liquified Natural Gas (LNG) Market by Volume, 2023-2033 (BCM, AGR (%), CAGR (%))
Table 108 Latin America Liquified Natural Gas (LNG) Market by Value, 2023-2033 (US$ Bn, AGR (%), CAGR (%))
Table 109 Latin America Liquified Natural Gas (LNG) Market by Volume, 2023-2033 (BCM, AGR (%), CAGR (%))
Table 110 Latin America Liquified Natural Gas (LNG) Market by Country, 2023-2033 (US$ Bn, AGR (%), CAGR (%))
Table 111 Latin America Liquified Natural Gas (LNG) Market by Country, 2023-2033 (BCM, AGR (%), CAGR (%))
Table 112 Latin America Liquified Natural Gas (LNG) Market by Transport Fuel, 2023-2033 (US$ Bn, AGR (%), CAGR (%))
Table 113 Latin America Liquified Natural Gas (LNG) Market by Transport Fuel, 2023-2033 (BCM, AGR (%), CAGR (%))
Table 114 Latin America Liquified Natural Gas (LNG) Market by End-Use, 2023-2033 (US$ Bn, AGR (%), CAGR (%))
Table 115 Latin America Liquified Natural Gas (LNG) Market by End-Use, 2023-2033 (BCM, AGR (%), CAGR (%))
Table 116 Argentina Liquified Natural Gas (LNG) Market by Value, 2023-2033 (US$ Bn, AGR (%), CAGR (%))
Table 117 Argentina Liquified Natural Gas (LNG) Market by Volume, 2023-2033 (BCM, AGR (%), CAGR (%))
Table 118 Mexico Liquified Natural Gas (LNG) Market by Value, 2023-2033 (US$ Bn, AGR (%), CAGR (%))
Table 119 Mexico Liquified Natural Gas (LNG) Market by Volume, 2023-2033 (BCM, AGR (%), CAGR (%))
Table 120 Rest of Latin America Liquified Natural Gas (LNG) Market by Value, 2023-2033 (US$ Bn, AGR (%), CAGR (%))
Table 121 Rest of Latin America Liquified Natural Gas (LNG) Market by Volume, 2023-2033 (BCM, AGR (%), CAGR (%))
Table 122 Acquisitions as Key Business Strategy
Table 123 Partnership as Key Business Strategy
Table 124 Collaboration as Key Business Strategy
Table 125 New Product Launch as Key Business Strategy
Table 126 Expansion as Key Business Strategy
Table 127 Royal Dutch Shell Plc: Key Details, (CEO, HQ, Revenue, Founded, No. of Employees, Company Type, Website, Business Segment)
Table 128 Royal Dutch Shell Plc: Product Benchmarking
Table 129 Royal Dutch Shell Plc: Strategic Outlook
Table 130 Gazprom PJSC: Key Details, (CEO, HQ, Revenue, Founded, No. of Employees, Company Type, Website, Business Segment)
Table 131 Gazprom PJSC: Product Benchmarking
Table 132 Gazprom PJSC: Strategic Outlook
Table 133 Petronas Dagangan Berhad: Key Details, (CEO, HQ, Revenue, Founded, No. of Employees, Company Type, Website, Business Segment)
Table 134 Petronas Dagangan Berhad: Product Benchmarking
Table 135 Petronas Dagangan Berhad: Strategic Outlook
Table 136 Equinor ASA: Key Details, (CEO, HQ, Revenue, Founded, No. of Employees, Company Type, Website, Business Segment)
Table 137 Equinor ASA: Strategic Outlook
Table 138 ExxonMobil Corporation: Key Details, (CEO, HQ, Revenue, Founded, No. of Employees, Company Type, Website, Business Segment)
Table 139 ExxonMobil Corporation: Product Benchmarking
Table 140 ExxonMobil Corporation: Strategic Outlook
Table 141 Chevron Corporation: Key Details, (CEO, HQ, Revenue, Founded, No. of Employees, Company Type, Website, Business Segment)
Table 142 Chevron Corporation: Product Benchmarking
Table 143 Chevron Corporation: Strategic Outlook
Table 144 BP Plc: Key Details, (CEO, HQ, Revenue, Founded, No. of Employees, Company Type, Website, Business Segment)
Table 145 BP Plc: Product Benchmarking
Table 146 TotalEnergies SE: Key Details, (CEO, HQ, Revenue, Founded, No. of Employees, Company Type, Website, Business Segment)
Table 147 TotalEnergies SE: Product Benchmarking
Table 148 TotalEnergies SE: Strategic Outlook
Table 149 ConocoPhillips Company: Key Details, (CEO, HQ, Revenue, Founded, No. of Employees, Company Type, Website, Business Segment)
Table 150 ConocoPhillips Company: Product Benchmarking
Table 151 ConocoPhillips Company: Strategic Outlook
Table 152 Eni S.p.A.: Key Details, (CEO, HQ, Revenue, Founded, No. of Employees, Company Type, Website, Business Segment)
Table 153 Eni S.p.A.: Product Benchmarking
Table 154 . Eni S.p.A: Strategic Outlook
Table 155 Woodside Energy Group Ltd: Key Details, (CEO, HQ, Revenue, Founded, No. of Employees, Company Type, Website, Business Segment)
Table 156 Woodside Energy Group Ltd: Product Benchmarking
Table 157 Woodside Energy Group Ltd: Strategic Outlook
Table 158 BG Group plc: Key Details, (CEO, HQ, Revenue, Founded, No. of Employees, Company Type, Website, Business Segment)
Table 159 BG Group plc: Product Benchmarking
Table 160 INPEX Corporation: Key Details, (CEO, HQ, Revenue, Founded, No. of Employees, Company Type, Website, Business Segment)
Table 161 INPEX Corporation: Product Benchmarking
Table 162 INPEX Corporation: Strategic Outlook
Table 163 Chesapeake Energy Corporation: Key Details, (CEO, HQ, Revenue, Founded, No. of Employees, Company Type, Website, Business Segment)
Table 164 Qatargas: Key Details, (CEO, HQ, Revenue, Founded, No. of Employees, Company Type, Website, Business Segment)
Table 165 Qatargas: Strategic Outlook
List of Figures
Figure 1 Liquified Natural Gas Market Segmentation
Figure 2 Liquified Natural Gas Market by Transport Fuel: Market Attractiveness Index
Figure 3 Liquified Natural Gas Market by End-use: Market Attractiveness Index
Figure 4 Liquified Natural Gas Market Attractiveness Index by Region
Figure 5 Liquified Natural Gas Market: Market Dynamics
Figure 6 Transportation Industry Market Size Over Time
Figure 7 COVID Impact Analysis: Liquified Natural Gas Market Recovery Scenarios
Figure 8 Global Liquified Natural Gas (LNG) Market Forecast, 2023-2033 (US$ Bn, AGR (%)) (V-Shaped Recovery Scenario)
Figure 9 Global Liquified Natural Gas (LNG) Market by Region, 2023-2033 (US$ Bn, AGR (%)) (V-Shaped Recovery Scenario)
Figure 10 Global Liquified Natural Gas (LNG) Market Forecast, 2023-2033 (US$ Bn, AGR (%)) (W-Shaped Recovery Scenario)
Figure 11 Global Liquified Natural Gas (LNG) Market by Region, 2023-2033 (US$ Bn, AGR (%)) (W-Shaped Recovery Scenario)
Figure 12 Global Liquified Natural Gas (LNG) Market Forecast, 2023-2033 (US$ Bn, AGR (%)) (U-Shaped Recovery Scenario)
Figure 13 Global Liquified Natural Gas (LNG) Market by Region, 2023-2033 (US$ Bn, AGR (%)) (U-Shaped Recovery Scenario)
Figure 14 Global Liquified Natural Gas (LNG) Market Forecast, 2023-2033 (US$ Bn, AGR (%)) (L-Shaped Recovery Scenario)
Figure 15 Global Liquified Natural Gas (LNG) Market by Region, 2023-2033 (US$ Bn, AGR (%)) (L-Shaped Recovery Scenario)
Figure 16 Liquified Natural Gas Market: Porter’s Five Forces Analysis
Figure 17 Liquified Natural Gas Market: PEST Analysis
Figure 18 Liquified Natural Gas Market by Transport Fuel: Market Attractiveness Index
Figure 19 Global Liquified Natural Gas (LNG) Market by Transport Fuel, 2023-2033 (US$ Bn, AGR (%))
Figure 20 Global Liquified Natural Gas (LNG) Market by Transport Fuel, 2023-2033 (BCM, AGR (%))
Figure 21 Heavy-Duty Vehicles Market by Region, 2023-2033 (US$ Bn, AGR (%))
Figure 22 Heavy-Duty Vehicles Market by Region, 2023-2033 (BCM, AGR (%))
Figure 23 Heavy Duty Vehicles Market Share Forecast by Region, 2023 & 2033 (%)
Figure 24 Passenger Vehicles Market by Region, 2023-2033 (US$ Bn, AGR (%))
Figure 25 Passenger Vehicles Market by Region, 2023-2033 (BCM, AGR (%))
Figure 26 Passenger Vehicles Market Share Forecast by Region, 2023 & 2033 (%)
Figure 27 Marine Transport Market by Region, 2023-2033 (US$ Bn, AGR (%))
Figure 28 Marine Transport Market by Region, 2023-2033 (BCM, AGR (%))
Figure 29 Marine Transport Vehicles Market Share Forecast by Region, 2023 & 2033 (%)
Figure 30 Other Transport Fuel Market by Region, 2023-2033 (US$ Bn, AGR (%))
Figure 31 Marine Transport Market by Region, 2023-2033 (BCM, AGR (%))
Figure 32 Other Transport Fuel Market Share Forecast by Region, 2023 & 2033 (%)
Figure 33 Liquified Natural Gas Market by End-use: Market Attractiveness Index
Figure 34 Global Liquified Natural Gas (LNG) Market by End-Use, 2023-2033 (US$ Bn, AGR (%))
Figure 35 Global Liquified Natural Gas (LNG) Market by End-Use, 2023-2033 (BCM, AGR (%))
Figure 36 Domestic Use Market by Region, 2023-2033 (US$ Bn, AGR (%))
Figure 37 Domestic Use Market by Region, 2023-2033 (BCM, AGR (%))
Figure 38 Domestic Use Market Share Forecast by Region, 2023 & 2033 (%)
Figure 39 Industrial Use Market by Region, 2023-2033 (US$ Bn, AGR (%))
Figure 40 Industrial Use Market by Region, 2023-2033 (BCM, AGR (%))
Figure 41 Industrial Use Market Share Forecast by Region, 2023 & 2033 (%)
Figure 42 Commercial Use Market by Region, 2023-2033 (US$ Bn, AGR (%))
Figure 43 Commercial Use Market by Region, 2023-2033 (BCM, AGR (%))
Figure 44 Commercial Use Market Share Forecast by Region, 2023 & 2033 (%)
Figure 45 Transportation Use Market by Region, 2023-2033 (US$ Bn, AGR (%))
Figure 46 Transportation Use Market by Region, 2023-2033 (BCM, AGR (%))
Figure 47 Transportation Use Market Share Forecast by Region, 2023 & 2033 (%)
Figure 48 Utilities and Power Use Market by Region, 2023-2033 (US$ Bn, AGR (%))
Figure 49 Utilities and Power Use Market by Region, 2023-2033 (BCM, AGR (%))
Figure 50 Utilities and Power Use Market Share Forecast by Region, 2023 & 2033 (%)
Figure 51 Other End-Use Market by Region, 2023-2033 (US$ Bn, AGR (%))
Figure 52 Other End-Use Market by Region, 2023-2033 (BCM, AGR (%))
Figure 53 Other End-Use Market Share Forecast by Region, 2023 & 2033 (%)
Figure 54 Global Liquified Natural Gas (LNG) Market Forecast, 2023-2033 (US$ Bn, AGR (%))
Figure 55 Global Liquified Natural Gas (LNG) Market Forecast, 2023-2033 (BCM, AGR (%))
Figure 56 Global Liquified Natural Gas (LNG) Market by Region, 2023-2033 (US$ Bn, AGR (%))
Figure 57 Global Liquified Natural Gas (LNG) Market by Region, 2023-2033 (BCM, AGR (%))
Figure 58 Global Liquified Natural Gas (LNG) Market by Transport Fuel, 2023-2033 (US$ Bn, AGR (%))
Figure 59 Global Liquified Natural Gas (LNG) Market by Transport Fuel, 2023-2033 (BCM, AGR (%))
Figure 60 Global Liquified Natural Gas (LNG) Market by End-Use, 2023-2033 (US$ Bn, AGR (%))
Figure 61 Global Liquified Natural Gas (LNG) Market by End-Use, 2023-2033 (BCM, AGR (%))
Figure 62 North America Liquified Natural Gas Market Attractiveness Index
Figure 63 North America Liquified Natural Gas (LNG) Market by Value, 2023-2033 (US$ Bn, AGR (%))
Figure 64 North America Liquified Natural Gas (LNG) Market by Volume, 2023-2033 (BCM, AGR (%))
Figure 65 North America Liquified Natural Gas (LNG) Market by Country, 2023-2033 (US$ Bn, AGR (%))
Figure 66 North America Liquified Natural Gas (LNG) Market by Country, 2023-2033 (BCM, AGR (%))
Figure 67 North America Liquified Natural Gas (LNG) Market Share Forecast by Country, 2023-2033 (%)
Figure 68 North America Liquified Natural Gas (LNG) Market by Transport Fuel, 2023-2033 (US$ Bn, AGR (%))
Figure 69 North America Liquified Natural Gas (LNG) Market by Transport Fuel, 2023-2033 (BCM, AGR (%))
Figure 70 North America Liquified Natural Gas (LNG) Market Share Forecast by Transport Fuel, 2023-2033 (%)
Figure 71 North America Liquified Natural Gas (LNG) Market by End-Use, 2023-2033 (US$ Bn, AGR (%))
Figure 72 North America Liquified Natural Gas (LNG) Market by End-Use, 2023-2033 (BCM, AGR (%))
Figure 73 North America Liquified Natural Gas (LNG) Market Share Forecast by End-Use, 2023-2033 (%)
Figure 74 US Liquified Natural Gas (LNG) Market by Value, 2023-2033 (US$ Bn, AGR (%))
Figure 75 US Liquified Natural Gas (LNG) Market by Volume, 2023-2033 (BCM, AGR (%))
Figure 76 Canada Liquified Natural Gas (LNG) Market by Value, 2023-2033 (US$ Bn, AGR (%))
Figure 77 Canada Liquified Natural Gas (LNG) Market by Volume, 2023-2033 (BCM, AGR (%))
Figure 78 Europe Liquified Natural Gas Market Attractiveness Index
Figure 79 Europe Liquified Natural Gas (LNG) Market by Value, 2023-2033 (US$ Bn, AGR (%))
Figure 80 Europe Liquified Natural Gas (LNG) Market by Volume, 2023-2033 (BCM, AGR (%))
Figure 81 Europe Liquified Natural Gas (LNG) Market by Country, 2023-2033 (US$ Bn, AGR (%))
Figure 82 Europe Liquified Natural Gas (LNG) Market by Country, 2023-2033 (BCM, AGR (%))
Figure 83 Europe Liquified Natural Gas (LNG) Market Share Forecast by Country, 2023-2033 (%)
Figure 84 Europe Liquified Natural Gas (LNG) Market by Transport Fuel, 2023-2033 (US$ Bn, AGR (%))
Figure 85 Europe Liquified Natural Gas (LNG) Market by Transport Fuel, 2023-2033 (BCM, AGR (%))
Figure 86 Europe Liquified Natural Gas (LNG) Market Share Forecast by Transport Fuel, 2023-2033 (%)
Figure 87 Europe Liquified Natural Gas (LNG) Market by End-Use, 2023-2033 (US$ Bn, AGR (%))
Figure 88 Europe Liquified Natural Gas (LNG) Market by End-Use, 2023-2033 (BCM, AGR (%))
Figure 89 Europe Liquified Natural Gas (LNG) Market Share Forecast by End-Use, 2023-2033 (%)
Figure 90 Russia Liquified Natural Gas (LNG) Market by Value, 2023-2033 (US$ Bn, AGR (%))
Figure 91 Russia Liquified Natural Gas (LNG) Market by Volume, 2023-2033 (BCM, AGR (%))
Figure 92 Germany Liquified Natural Gas (LNG) Market by Value, 2023-2033 (US$ Bn, AGR (%))
Figure 93 Germany Liquified Natural Gas (LNG) Market by Volume, 2023-2033 (BCM, AGR (%))
Figure 94 Italy Liquified Natural Gas (LNG) Market by Value, 2023-2033 (US$ Bn, AGR (%))
Figure 95 Italy Liquified Natural Gas (LNG) Market by Volume, 2023-2033 (BCM, AGR (%))
Figure 96 UK Liquified Natural Gas (LNG) Market by Value, 2023-2033 (US$ Bn, AGR (%))
Figure 97 UK Liquified Natural Gas (LNG) Market by Volume, 2023-2033 (BCM, AGR (%))
Figure 98 France Liquified Natural Gas (LNG) Market by Value, 2023-2033 (US$ Bn, AGR (%))
Figure 99 France Liquified Natural Gas (LNG) Market by Volume, 2023-2033 (BCM, AGR (%))
Figure 100 Rest of Europe Liquified Natural Gas (LNG) Market by Value, 2023-2033 (US$ Bn, AGR (%))
Figure 101 Rest of Europe Liquified Natural Gas (LNG) Market by Volume, 2023-2033 (BCM, AGR (%))
Figure 102 Asia Pacific Liquified Natural Gas Market Attractiveness Index
Figure 103 Asia-Pacific Liquified Natural Gas (LNG) Market by Value, 2023-2033 (US$ Bn, AGR (%))
Figure 104 Asia-Pacific Liquified Natural Gas (LNG) Market by Volume, 2023-2033 (BCM, AGR (%))
Figure 105 Asia-Pacific Liquified Natural Gas (LNG) Market by Country, 2023-2033 (US$ Bn, AGR (%))
Figure 106 Asia-Pacific Liquified Natural Gas (LNG) Market by Country, 2023-2033 (BCM, AGR (%))
Figure 107 Asia-Pacific Liquified Natural Gas (LNG) Market Share Forecast by Country, 2023-2033 (%)
Figure 108 Asia-Pacific Liquified Natural Gas (LNG) Market by Transport Fuel, 2023-2033 (US$ Bn, AGR (%))
Figure 109 Asia-Pacific Liquified Natural Gas (LNG) Market by Transport Fuel, 2023-2033 (BCM, AGR (%))
Figure 110 Asia-Pacific Liquified Natural Gas (LNG) Market Share Forecast by Transport Fuel, 2023-2033 (%)
Figure 111 Asia-Pacific Liquified Natural Gas (LNG) Market by End-Use, 2023-2033 (US$ Bn, AGR (%))
Figure 112 Asia-Pacific Liquified Natural Gas (LNG) Market by End-Use, 2023-2033 (BCM, AGR (%))
Figure 113 Asia-Pacific Liquified Natural Gas (LNG) Market Share Forecast by End-Use, 2023-2033 (%)
Figure 114 China Liquified Natural Gas (LNG) Market by Value, 2023-2033 (US$ Bn, AGR (%))
Figure 115 China Liquified Natural Gas (LNG) Market by Volume, 2023-2033 (BCM, AGR (%))
Figure 116 Japan Liquified Natural Gas (LNG) Market by Value, 2023-2033 (US$ Bn, AGR (%))
Figure 117 Japan Liquified Natural Gas (LNG) Market by Volume, 2023-2033 (BCM, AGR (%))
Figure 118 South Korea Liquified Natural Gas (LNG) Market by Value, 2023-2033 (US$ Bn, AGR (%))
Figure 119 South Korea Liquified Natural Gas (LNG) Market by Volume, 2023-2033 (BCM, AGR (%))
Figure 120 India Liquified Natural Gas (LNG) Market by Value, 2023-2033 (US$ Bn, AGR (%))
Figure 121 India Liquified Natural Gas (LNG) Market by Volume, 2023-2033 (BCM, AGR (%))
Figure 122 Thailand Liquified Natural Gas (LNG) Market by Value, 2023-2033 (US$ Bn, AGR (%))
Figure 123 Thailand Liquified Natural Gas (LNG) Market by Volume, 2023-2033 (BCM, AGR (%))
Figure 124 Rest of Asia-Pacific Liquified Natural Gas (LNG) Market by Value, 2023-2033 (US$ Bn, AGR (%))
Figure 125 Rest of Asia-Pacific Liquified Natural Gas (LNG) Market by Volume, 2023-2033 (BCM, AGR (%))
Figure 126 Middle East & Africa Liquified Natural Gas Market Attractiveness Index
Figure 127 Middle East & Africa Liquified Natural Gas (LNG) Market by Value, 2023-2033 (US$ Bn, AGR (%))
Figure 128 Middle East & Africa Liquified Natural Gas (LNG) Market by Volume, 2023-2033 (BCM, AGR (%))
Figure 129 Middle East & Africa Liquified Natural Gas (LNG) Market by Country, 2023-2033 (US$ Bn, AGR (%))
Figure 130 Middle East & Africa Liquified Natural Gas (LNG) Market by Country, 2023-2033 (BCM, AGR (%))
Figure 131 Middle East & Africa Liquified Natural Gas (LNG) Market Share Forecast by Country, 2023-2033 (%)
Figure 132 Middle East & Africa Liquified Natural Gas (LNG) Market by Transport Fuel, 2023-2033 (US$ Bn, AGR (%))
Figure 133 Middle East & Africa Liquified Natural Gas (LNG) Market by Transport Fuel, 2023-2033 (BCM, AGR (%))
Figure 134 Middle East & Africa Liquified Natural Gas (LNG) Market Share Forecast by Transport Fuel, 2023-2033 (%)
Figure 135 Middle East & Africa Liquified Natural Gas (LNG) Market by End-Use, 2023-2033 (US$ Bn, AGR (%))
Figure 136 Middle East & Africa Liquified Natural Gas (LNG) Market by End-Use, 2023-2033 (BCM, AGR (%))
Figure 137 Middle East & Africa Liquified Natural Gas (LNG) Market Share Forecast by End-Use, 2023-2033 (%)
Figure 138 GCC Liquified Natural Gas (LNG) Market by Value, 2023-2033 (US$ Bn, AGR (%))
Figure 139 GCC Liquified Natural Gas (LNG) Market by Volume, 2023-2033 (BCM, AGR (%))
Figure 140 South Africa Liquified Natural Gas (LNG) Market by Value, 2023-2033 (US$ Bn, AGR (%))
Figure 141 South Africa Liquified Natural Gas (LNG) Market by Volume, 2023-2033 (BCM, AGR (%))
Figure 142 Rest of Middle East & Africa Liquified Natural Gas (LNG) Market by Value, 2023-2033 (US$ Bn, AGR (%))
Figure 143 Rest of Middle East & Africa Liquified Natural Gas (LNG) Market by Volume, 2023-2033 (BCM, AGR (%))
Figure 144 Latin America Liquified Natural Gas Market Attractiveness Index
Figure 145 Latin America Liquified Natural Gas (LNG) Market by Value, 2023-2033 (US$ Bn, AGR (%))
Figure 146 Latin America Liquified Natural Gas (LNG) Market by Volume, 2023-2033 (BCM, AGR (%))
Figure 147 Latin America Liquified Natural Gas (LNG) Market by Country, 2023-2033 (US$ Bn, AGR (%))
Figure 148 Latin America Liquified Natural Gas (LNG) Market by Country, 2023-2033 (BCM, AGR (%))
Figure 149 Latin America Liquified Natural Gas (LNG) Market Share Forecast by Country, 2023-2033 (%)
Figure 150 Latin America Liquified Natural Gas (LNG) Market by Transport Fuel, 2023-2033 (US$ Bn, AGR (%))
Figure 151 Latin America Liquified Natural Gas (LNG) Market by Transport Fuel, 2023-2033 (BCM, AGR (%))
Figure 152 Latin America Liquified Natural Gas (LNG) Market Share Forecast by Transport Fuel, 2023-2033 (%)
Figure 153 Latin America Liquified Natural Gas (LNG) Market by End-Use, 2023-2033 (US$ Bn, AGR (%))
Figure 154 Latin America Liquified Natural Gas (LNG) Market by End-Use, 2023-2033 (BCM, AGR (%))
Figure 155 Latin America Liquified Natural Gas (LNG) Market Share Forecast by End-Use, 2023-2033 (%)
Figure 156 Argentina Liquified Natural Gas (LNG) Market by Value, 2023-2033 (US$ Bn, AGR (%))
Figure 157 Argentina Liquified Natural Gas (LNG) Market by Volume, 2023-2033 (BCM, AGR (%))
Figure 158 Mexico Liquified Natural Gas (LNG) Market by Value, 2023-2033 (US$ Bn, AGR (%))
Figure 159 Argentina Liquified Natural Gas (LNG) Market by Volume, 2023-2033 (BCM, AGR (%))
Figure 160 Rest of Latin America Liquified Natural Gas (LNG) Market by Value, 2023-2033 (US$ Bn, AGR (%))
Figure 161 Rest of Latin America Liquified Natural Gas (LNG) Market by Volume, 2023-2033 (BCM, AGR (%))
Figure 162 Liquified Natural Gas Market: Company Share, 2022
Figure 163 Royal Dutch Shell Plc: Net Revenue, 2018-2022 (US$ million, AGR%)
Figure 164 Royal Dutch Shell Plc: R&D, 2018-2022 (US$ million, AGR%)
Figure 165 Royal Dutch Shell Plc: Regional Market Shares, 2022
Figure 166 Royal Dutch Shell Plc: Business Segment Market Shares, 2022
Figure 167 Equinor ASA: Net Revenue, 2018-2022 (US$ million, AGR%)
Figure 168 Equinor ASA: R&D, 2018-2022 (US$ million, AGR%)
Figure 169 Equinor ASA: Regional Market Shares, 2022
Figure 170 Equinor ASA: Business Segment Market Shares, 2022
Figure 171 ExxonMobil Corporation: Net Revenue, 2018-2022 (US$ million, AGR%)
Figure 172 ExxonMobil Corporation: R&D, 2018-2022 (US$ million, AGR%)
Figure 173 ExxonMobil Corporation: Regional Market Shares, 2022
Figure 174 ExxonMobil Corporation: Business Segment Market Shares, 2022
Figure 175 Chevron Corporation: Net Revenue, 2018-2022 (US$ million, AGR%)
Figure 176 Chevron Corporation: R&D, 2018-2022 (US$ million, AGR%)
Figure 177 Chevron Corporation: Regional Market Shares, 2022
Figure 178 Chevron Corporation: Business Market Shares, 2022
Figure 179 BP Plc: Net Revenue, 2018-2022 (US$ million, AGR%)
Figure 180 BP Plc: R&D, 2018-2022 (US$ million, AGR%)
Figure 181 BP Plc: Business Segment Market Shares, 2022
Figure 182 TotalEnergies SE: Net Revenue, 2018-2022 (US$ million, AGR%)
Figure 183 TotalEnergies SE: R&D, 2018-2022 (US$ million, AGR%)
Figure 184 TotalEnergies SE: Regional Market Shares, 2022
Figure 185 TotalEnergies SE: Business Segment Market Shares, 2022
Figure 186 ConocoPhillips Company: Net Revenue, 2018-2022 (US$ million, AGR%)
Figure 187 ConocoPhillips Company: R&D, 2018-2022 (US$ million, AGR%)
Figure 188 ConocoPhillips Company: Regional Market Shares, 2022
Figure 189 ConocoPhillips Company: Regional Market Shares, 2022
Figure 190 Eni S.p.A.: Net Revenue, 2018-2022 (US$ million, AGR%)
Figure 191 Eni S.p.A.: R&D, 2018-2022 (US$ million, AGR%)
Figure 192 Eni S.p.A.: Regional Market Shares, 2022
Figure 193 Eni S.p.A.: Business Segment Market Shares, 2022
Figure 194 Woodside Energy Group Ltd: Net Revenue, 2017-2021 (US$ million, AGR%)
Figure 195 Woodside Energy Group Ltd: Regional Market Shares, 2022
Figure 196 Woodside Energy Group Ltd: Business Segment Market Shares, 2022
Figure 197 BG Group plc: Net Revenue, 2018-2022 (US$ million, AGR%)
Figure 198 BG Group plc: R&D, 2018-2022 (US$ million, AGR%)
Figure 199 BG Group plc: Regional Market Shares, 2022
Figure 200 BG Group plc: Business Segment Market Shares, 2022
Figure 201 INPEX Corporation: Net Revenue, 2017-2021 (US$ million, AGR%)
Figure 202 INPEX Corporation: R&D, 2017-2021 (US$ million, AGR%)
Figure 203 INPEX Corporation: Regional Market Shares, 2021
Figure 204 INPEX Corporation: Regional Market Shares, 2021
Figure 205 Chesapeake Energy Corporation: Net Revenue, 2018-2022 (US$ million, AGR%)
Figure 206 Chesapeake Energy Corporation: R&D, 2018-2022 (US$ million, AGR%)
Figure 207 Chesapeake Energy Corporation: Regional Market Shares, 2021
ページTOPに戻る
よくあるご質問
Visiongain社はどのような調査会社ですか?
英国の調査会社ヴィジョンゲイン社(Visiongain)は、通信とエネルギーのほか、自動車や化学・医薬品、金属など、広範な市場を対象に調査を行っています。自動車市場については、市場全般に関する調査のほ... もっと見る
調査レポートの納品までの日数はどの程度ですか?
在庫のあるものは速納となりますが、平均的には 3-4日と見て下さい。
但し、一部の調査レポートでは、発注を受けた段階で内容更新をして納品をする場合もあります。
発注をする前のお問合せをお願いします。
注文の手続きはどのようになっていますか?
1)お客様からの御問い合わせをいただきます。
2)見積書やサンプルの提示をいたします。
3)お客様指定、もしくは弊社の発注書をメール添付にて発送してください。
4)データリソース社からレポート発行元の調査会社へ納品手配します。
5) 調査会社からお客様へ納品されます。最近は、pdfにてのメール納品が大半です。
お支払方法の方法はどのようになっていますか?
納品と同時にデータリソース社よりお客様へ請求書(必要に応じて納品書も)を発送いたします。
お客様よりデータリソース社へ(通常は円払い)の御振り込みをお願いします。
請求書は、納品日の日付で発行しますので、翌月最終営業日までの当社指定口座への振込みをお願いします。振込み手数料は御社負担にてお願いします。
お客様の御支払い条件が60日以上の場合は御相談ください。
尚、初めてのお取引先や個人の場合、前払いをお願いすることもあります。ご了承のほど、お願いします。
データリソース社はどのような会社ですか?
当社は、世界各国の主要調査会社・レポート出版社と提携し、世界各国の市場調査レポートや技術動向レポートなどを日本国内の企業・公官庁及び教育研究機関に提供しております。
世界各国の「市場・技術・法規制などの」実情を調査・収集される時には、データリソース社にご相談ください。
お客様の御要望にあったデータや情報を抽出する為のレポート紹介や調査のアドバイスも致します。
|
|


