医薬品受託製造市場レポート:2023-2033
Pharmaceutical Contract Manufacturing Market Report 2023-2033
レポート詳細
医薬品受託製造市場レポート 2023-2033 : 本レポートは、業界とその基礎となる力学をよりよく理解したい場合、新たな収益ポケットを目指す大手企業にとって貴重なものとなるでしょう。... もっと見る
※上記価格は部署ライセンス(Departmental licence)価格です。
その他の価格についてはデータリソースまでお問合せください。
日本語のページは自動翻訳を利用し作成しています。
実際のレポートは英文のみでご納品いたします。
サマリー
レポート詳細
医薬品受託製造市場レポート 2023-2033: 本レポートは、業界とその基礎となる力学をよりよく理解したい場合、新たな収益ポケットを目指す大手企業にとって貴重なものとなるでしょう。また、異業種への進出や新地域での既存事業の拡大を希望する企業にとっても有益なレポートです。
治療性能と安全性の特性に関して、ジェネリック医薬品はブランド品よりも安価である。ジェネリック医薬品の需要を後押ししている主な要因のひとつは、増加する医療費を削減するための後押しです。より安価なジェネリック医薬品の市場参入は、特許の失効によって可能になりました。最近特許が切れた重要な医薬品には、Roche社のLucentis、Galen社のAdasuve、Mylan社のPerforomist、Lundbeck社のNorthera、Emergent BioSolutions社のNarcanなどがあります。
核医学の受託製造には、放射性医薬品の開発・製造も含まれます。最近の企業買収や株式公開により、放射性医薬品業界への関心は高まっています。また、2021年5月、キュリウムはIASONの買収を最終決定し、救命診断ソリューションのサービスポートフォリオと欧州市場全体の成長を支援しました。
マーケットリサーチレポートを購入する前に、どのような質問をするべきか?
- 医薬品受託製造市場はどのように進化しているのか?
- 医薬品受託製造市場を牽引しているもの、抑制しているものは何か?
- ポイントオブケア診断の各サブマーケット分野は予測期間中にどのように成長し、2033年にこれらのサブマーケットが占める収益はどの程度になるのか?
- 2022年から2033年にかけて、医薬品受託製造の各サブマーケットの市場シェアはどのように推移するのか?
- 2023年から2033年にかけて、市場全体の主な牽引役となるのは何か?
- 医薬品受託製造の主要市場は、マクロ経済ダイナミクスに広く追随するのか、それとも個々の国内市場が他を凌駕するのか?
- 2033年までに各国市場のシェアはどのように変化し、2033年に市場をリードするのはどの地域か?
- 主要プレイヤーは誰で、予測期間中の見通しはどうなっているか?
- これらの大手企業の医薬品受託製造プロジェクトはどのようなものか?
- 2023年から2033年の間に、業界はどのように進化していくのでしょうか?現在および今後10年間に実施される医薬品受託製造プロジェクトには、どのような意味があるのか?
- 医薬品受託製造市場をさらに拡大するために、製品の商業化の必要性は高まっているのか?
- 医薬品受託製造市場はどこに向かっているのか、そして市場の最前線に立つためにはどうすればよいのか?
- 新製品やサービスラインに対する最適な投資オプションは何か?
- 企業を新たな成長軌道に乗せ、C-suiteに移行させるための重要な展望は何か?
このことが、現在、そして今後10年間の医薬品受託製造市場にどのような影響を与えるかを見極める必要があります:
- 318ページにわたる本レポートでは、143の表、184のチャート/グラフを独占的に提供します。
- 本レポートでは、業界における主要な収益性の高い分野を取り上げているため、今すぐターゲットを絞ることができます - NOW.
- 世界、地域、国の売上高と成長率を詳細に分析しています。
- 競合他社が成功した主要なトレンド、変化、収益予測をハイライトしています。
本レポートは、医薬品受託製造市場が今後10年間にどのように発展するか、またCOVID-19の景気後退やバウンスの変化に合わせて、今日あなたにお伝えします。この市場は、過去10年間のどの時点よりも今が重要です。
2033年までの予測やその他の分析により、商業的な展望を明らかにする。
- 今回の調査では、2033年までの収益予測に加え、直近の実績、成長率、市場シェアも掲載しています。
- ビジネスの展望や展開など、独自の分析がご覧いただけます。
- 定性的分析(市場力学、促進要因、機会、阻害要因、課題など)、コスト構造、医薬品受託製造価格上昇の影響、最近の動向などをご覧いただけます。
本レポートでは、COVID-19が業界や貴社にどのような影響を与えるかについて、データ分析および貴重な知見を提供しています。COVID-19の4つの回収パターン、すなわち「V」「L」「W」「U」の回収パターンとその影響について考察しています。
報告書の対象セグメント
サービス
・医薬品製造サービス
- 医薬品原薬製造サービス
- 医薬品のFDF製造サービス: 非経口剤・注射剤製造サービス、錠剤製造サービス、カプセル製造サービス、内服液剤製造サービス、半固形剤製造サービス、その他製剤製造サービス
・医薬品開発サービス
- リード化合物の同定と候補化合物の最適化
- ターゲット同定とスクリーニング
- ターゲットバリデーション&ファンクショナルインフォマティクス
- その他のサービス
・生物製剤製造サービス
- 生物学的製剤の原薬製造サービス
- 生物学的製剤FDF製造サービス
医薬品タイプ
- ブランド
- ジェネリック
エンドユーザー
- 大手製薬会社
- 中小規模製薬会社
- ジェネリック製薬会社
- その他のエンドユーザー
世界市場全体およびセグメントの収益予測に加え、5つの地域および18の主要国市場の収益予測も掲載しています:
北米
- アメリカ
- カナダ
欧州
- ドイツ
- 英国
- フランス
- イタリア
- スペイン
- スイス
- その他の欧州地域
アジア太平洋地域
- 中国
- 日本
- インド
- オーストラリア
- 韓国
- その他のアジア太平洋地域
ラテンアメリカ
- ブラジル
- メキシコ
- その他のラテンアメリカ地域
MEA
- GCC
- 南アフリカ
- その他のMEAの地域
医薬品受託製造市場の2023年から2033年にかけての主要企業のプロファイルと、これらの企業のこのセグメントに焦点を当てた、いくつかの企業についても記載しています。
主要企業と市場成長の可能性
・ AbbVie Inc.
・ Abnova Corporation
・ Aenova Group
・ Almac Group
・ Baxter
・ Boehringer Ingelheim International
・ Catalent Inc
・ Charles River Laboratories
・ Evonik Industries
・ Fujifilm Holdings Corporation
・ Grifols S.A.
・ Jubilant Pharmova Limited
・ ICON Plc
・ IQVIA
・ Lonza
・ Nipro Pharma Corporation
・ Pfizer Inc.
・ Piramal Pharma Solutions
・ Recipharm AB
・ Samsung Biologics
・ Siegfried Holding AG
・ Thermo Fisher Scientific
・ Vetter Pharma
・ WuXi AppTec
医薬品受託製造市場の世界全体の売上高、2023年から2033年までの金額ベースで、市場は2023年に1450億米ドルを突破すると、当研究所が算出しました。2033年まで収益が大きく伸びることが予測されます。当社の調査では、最も大きな可能性を秘めた組織を特定します。彼らの能力、進歩、商業的展望を知ることで、一歩先を行くことができます。
医薬品受託製造市場、2023年から2033年までのレポートはどのように役立つのでしょうか?
要約すると、310ページを超えるレポートでは、以下の知識を得ることができます:
- 医薬品受託製造市場、2023年から2033年までの収益予測 サービス、薬剤タイプ、エンドユーザー、それぞれ世界と地域レベルで予測 - 業界の展望を発見し、投資と収益のための最も有利な場所を見つけることができます。
- 5つの地域と21の主要国市場の2033年までの収益予測 - 医薬品受託製造市場の2023年から2033年の市場予測は、北米、欧州、アジア太平洋、ラテンアメリカ、MEAでご覧いただけます。また、米国、カナダ、メキシコ、ブラジル、ドイツ、フランス、英国、イタリア、スペイン、スイス、中国、インド、日本、オーストラリア、韓国、ブラジル、GCC、南アフリカなど著名な経済圏の市場も予測しています。
- 医薬品受託製造市場に関わる主要企業25社の会社概要を含む、2023年から2033年までの既存企業および市場参入を目指す企業にとっての展望。
独自の予測による定量・定性分析をご覧いただけます。私たちのレポートだけが持つ情報を入手し、貴重なビジネスインテリジェンスとして情報を得ることができます。
他にはない情報
私たちの新しいレポートがあれば、知識に遅れをとったり、チャンスを逃したりする可能性は低くなります。私たちの仕事があなたの研究、分析、意思決定にどのように役立つかをご覧ください。Visiongainの研究は、医薬品受託製造市場、2023年から2033年、市場をリードする企業のための商業分析を必要とするすべての人のためのものです。データ、トレンド、予測を見つけることができます。
ページTOPに戻る
目次
目次
1 レポートの概要
1.1 調査の目的
1.2 医薬品受託製造市場の紹介
1.3 本レポートが提供するもの
1.4 本レポートを読むべき理由
1.5 本分析レポートが回答する主な質問事項
1.6 本レポートは誰のためのものか?
1.7 方法論
1.7.1 市場の定義
1.7.2 市場評価・予測手法
1.7.3 データの検証
1.7.3.1 プライマリーリサーチ
1.7.3.2 セカンダリーリサーチ
1.8 よくある質問(FAQ)
1.9 関連するVisiongainのレポート
1.10 Visiongainについて
2 エグゼクティブサマリー
3 市場の概要
3.1 主要な調査結果
3.2 マーケットダイナミクス
3.2.1 市場促進要因
3.2.1.1 特許切れとジェネリック医薬品の需要増加
3.2.1.2 医薬品R&Dへの投資拡大
3.2.1.3 CDMOによる先端製造技術への投資
3.2.2 市場抑制要因
3.2.2.1 シリアライゼーションの導入
3.2.3 市場機会
3.2.3.1 生物学的治療薬に対する需要の増加
3.2.3.2 核医学分野の成長
3.2.3.3 細胞・遺伝子治療薬の需要拡大
3.3 COVID-19影響度分析
3.4 ポーターのファイブフォース分析
3.4.1 サプライヤーのバーゲニングパワー
3.4.2 バイヤーのバーゲニングパワー
3.4.3 新規参入の脅威
3.4.4 代替品の脅威
3.4.5 競争力のあるライバル
3.5 PEST分析
3.6 SWOT分析
4 医薬品受託製造市場、サービス別、2023-2033年
4.1 主要な調査結果
4.2 サービス・セグメント市場魅力度指数
4.3 医薬品受託製造のサービス別市場規模の推定と予測
4.4 医薬品製造サービス
4.4.1 地域別市場規模、2023年〜2033年(US$ bn)
4.4.2 2023年&2033年地域別市場シェア(%)
4.4.3 医薬品原薬製造サービス
4.4.3.1 2023-2033年の地域別市場規模(US$ bn)
4.4.3.2 地域別市場シェア、2023年&2033年(%)
4.4.4 医薬品FDF製造サービス
4.4.4.1 2023-2033年の地域別市場規模(US$ bn)
4.4.4.2 地域別市場シェア、2023年&2033年(%)
4.4.4.3 非経口剤/注射剤製造サービス
4.4.4.4 錠剤製造サービス
4.4.4.5 カプセル製造サービス
4.4.4.6 経口液剤製造サービス
4.4.4.7 半固形製剤製造サービス
4.4.4.8 その他の製剤製造サービス
4.5 医薬品開発サービス
4.5.1 地域別市場規模、2023年〜2033年(US$ bn)
4.5.2 地域別市場シェア、2023年&2033年(%)
4.5.3 リード探索と候補化合物の最適化
4.5.3.1 地域別市場規模、2023年~2033年 (US$bn)
4.5.3.2 地域別市場シェア、2023年&2033年(%)
4.5.4 ターゲット同定&スクリーニング
4.5.4.1 2023年~2033年の地域別市場規模(US$bn)
4.5.4.2 地域別市場シェア、2023年&2033年(%)
4.5.5 ターゲットバリデーション&ファンクショナルインフォマティクス
4.5.5.1 地域別市場規模、2023年 ? 2033年 (US$bn)
4.5.5.2 地域別市場シェア、2023年&2033年(%)
4.5.6 その他サービス
4.5.6.1 地域別市場規模、2023年 ? 2033年 (US$bn)
4.5.6.2 地域別市場シェア、2023年&2033年(%)
4.6 生物製剤製造サービス
4.6.1 2023年〜2033年の地域別市場規模(US$bn)
4.6.2 地域別市場シェア、2023年&2033年(%)
4.6.3 生物製剤の原薬製造サービス
4.6.3.1 2023年~2033年の地域別市場規模(US$ bn)
4.6.3.2 地域別市場シェア、2023年&2033年(%)
4.6.4 生物製剤FDF製造サービス
4.6.4.1 2023〜2033年の地域別市場規模(US$ bn)
4.6.4.2 地域別市場シェア、2023年&2033年(%)
5 医薬品受託製造市場:エンドユーザー別、2023-2033年
5.1 主要な調査結果
5.2 エンドユーザセグメント市場魅力度指数
5.3 医薬品受託製造市場:エンドユーザー別
5.4 大手製薬会社
5.4.1 地域別市場規模、2023年〜2033年(US$ bn)
5.4.2 地域別市場シェア、2023年&2033年(%)
5.5 中小規模の製薬会社
5.5.1 2023-2033年地域別市場規模(US$ bn)
5.5.2 地域別市場シェア、2023年&2033年(%)
5.6 ジェネリック医薬品企業
5.6.1 2023-2033年の地域別市場規模(US$ bn)
5.6.2 地域別市場シェア、2023年&2033年(%)
5.7 その他のエンドユーザー
5.7.1 2023年~2033年の地域別市場規模(US$ bn)
5.7.2 地域別市場シェア、2023年&2033年(%)
6 医薬品受託製造市場、薬剤タイプ別、2023-2033年
6.1 主要な調査結果
6.2 薬剤タイプ別セグメント市場魅力度指数
6.3 医薬品受託製造の薬物タイプ別市場規模の推定と予測
6.4 ブランデッド
6.4.1 地域別市場規模、2023〜2033年(US$ bn)
6.4.2 地域別市場シェア、2023年&2033年(%)
6.5 ジェネリック
6.5.1 地域別市場規模、2023年〜2033年(US$ bn)
6.5.2 地域別市場シェア、2023年&2033年(%)
7 医薬品受託製造市場分析:地域別、2023-2033年
7.1 主要な調査結果
7.2 地域別市場規模の推定と予測
8 北米の医薬品受託製造市場、2023-2033年
8.1 主要な調査結果
8.2 北米の医薬品受託製造市場魅力度指数
8.3 北米医薬品受託製造のサービス別市場予測
8.4 北米医薬品受託製造のエンドユーザー別市場規模推定と予測
8.5 北米医薬品受託製造の医薬品タイプ別市場規模推定と予測
8.6 北米医薬品受託製造の国別市場規模予測
8.7 米国の医薬品受託製造市場の分析
8.8 カナダ医薬品受託製造市場の分析
9 欧州の医薬品受託製造市場、2023-2033年
9.1 主要な調査結果
9.2 欧州医薬品受託製造市場魅力度指数
9.3 欧州医薬品受託製造の国別市場規模推移推定と予測
9.4 欧州医薬品受託製造のサービス別市場規模推定と予測
9.5 欧州医薬品受託製造のエンドユーザー別市場規模推定と予測
9.6 欧州医薬品受託製造の医薬品タイプ別市場規模推定と予測
9.7 ドイツの医薬品受託製造の市場分析
9.8 イギリスの医薬品受託製造市場の分析
9.9 フランス医薬品受託製造市場の分析
9.10 イタリア医薬品受託製造市場の分析
9.11 スペイン 医薬品受託製造市場の分析
9.12 スイス 医薬品受託製造市場の分析
9.13 その他の欧州の医薬品受託製造市場の分析
10 アジア太平洋地域の医薬品受託製造市場分析
10.1 主要な調査結果
10.2 アジア太平洋地域の医薬品受託製造市場魅力度指数
10.3 アジア太平洋地域の医薬品受託製造の国別市場規模推移推定と予測
10.4 アジア太平洋地域の医薬品受託製造のサービス別市場規模推定と予測
10.5 アジア太平洋地域の医薬品受託製造のエンドユーザー別市場規模推定と予測
10.6 アジア太平洋地域の医薬品受託製造の医薬品タイプ別市場規模推定と予測
10.7 日本 医薬品受託製造市場の分析
10.8 中国 医薬品受託製造市場の分析
10.9 インド 医薬品受託製造市場の分析
10.10 オーストラリア 医薬品受託製造市場の分析
10.11 韓国 医薬品受託製造市場の分析
10.12 その他のアジア太平洋地域の医薬品受託製造市場の分析
11 ラテンアメリカの医薬品受託製造市場分析
11.1 主要な調査結果
11.2 ラテンアメリカの医薬品受託製造市場魅力度指数
11.3 ラテンアメリカの医薬品受託製造の国別市場規模推移推定と予測
11.4 ラテンアメリカの医薬品受託製造のサービス別市場規模推定と予測
11.5 ラテンアメリカの医薬品受託製造のエンドユーザー別市場規模推定と予測
11.6 ラテンアメリカの医薬品受託製造の医薬品タイプ別市場規模推定と予測
11.7 ブラジル医薬品受託製造の市場分析
11.8 メキシコ医薬品受託製造市場の分析
11.9 その他のラテンアメリカ地域の医薬品受託製造市場の分析
12 MEAの医薬品受託製造市場の分析
12.1 主要な調査結果
12.2 MEA医薬品受託製造市場魅力度指数
12.3 MEA医薬品受託製造の国別市場規模、2023年、2028年、2033年(US$ bn)
12.4 MEA医薬品受託製造の国別市場規模推移の推定と予測
12.5 MEA医薬品受託製造のサービス別市場規模推移の推定と予測
12.6 MEA医薬品受託製造のエンドユーザー別市場規模推定と予測
12.7 MEA医薬品受託製造の薬剤タイプ別市場規模推定と予測
12.8 GCC医薬品受託製造の市場分析
12.9 南アフリカの医薬品受託製造市場の分析
12.10 その他のMEA地域の医薬品受託製造市場の分析
13 会社概要
13.1 競合他社の状況
13.2 Lonza
13.2.1 企業スナップショット
13.2.2 会社概要
13.2.3 財務分析
13.2.3.1 純収益、2018-2022年
13.2.4 サービスのベンチマーキング
13.2.5 戦略的な展望
13.3 Catalent, Inc
13.3.1 企業スナップショット
13.3.2 会社概要
13.3.3 財務分析
13.3.3.1 純収益、2018年〜2022年
13.3.3.2 地域別市場占有率、2022年
13.3.4 サービスのベンチマーキング
13.3.5 戦略的な展望
13.4 Recipharm AB
13.4.1 企業スナップショット
13.4.2 会社概要
13.4.3 財務分析
13.4.3.1 純収入、2017-2021年
13.4.4 サービスのベンチマーキング
13.4.5 戦略的な展望
13.5 AbbVie Inc.
13.5.1 企業スナップショット
13.5.2 会社概要
13.5.3 財務分析
13.5.3.1 純収益、2018年〜2022年
13.5.3.2 R&D、2018年〜2022年
13.5.3.3 地域別市場シェア、2022年
13.5.4 サービスのベンチマーキング
13.5.5 戦略的な展望
13.6 Thermo Fisher Scientific
13.6.1 企業スナップショット
13.6.2 会社概要
13.6.3 財務分析
13.6.3.1 純収益、2017-2021年
13.6.3.2 R&D、2017年〜2021年
13.6.4 サービスのベンチマーキング
13.6.5 戦略的な展望
13.7 Siegfried Holding AG
13.7.1 企業スナップショット
13.7.2 会社概要
13.7.3 財務分析
13.7.3.1 純収益、2018年〜2022年
13.7.3.2 R&D、2018年〜2022年
13.7.4 サービスのベンチマーキング
13.7.5 戦略的な展望
13.8 Evonik Industries
13.8.1 企業スナップショット
13.8.2 会社概要
13.8.3 財務分析
13.8.3.1 純収益、2018年〜2022年
13.8.3.2 R&D、2018年〜2022年
13.8.3.3 地域別市場シェア、2022年
13.8.4 サービスのベンチマーキング
13.8.5 戦略的な展望
13.9 Boehringer Ingelheim International GmbH
13.9.1 企業スナップショット
13.9.2 会社概要
13.9.3 財務分析
13.9.3.1 純収益、2017-2021年
13.9.3.2 r&d、2017年〜2021年
13.9.3.3 地域別市場シェア、2021年
13.9.4 サービスのベンチマーキング
13.9.5 戦略的な展望
13.10 Piramal Pharma Solutions
13.10.1 企業スナップショット
13.10.2 会社概要
13.10.3 サービス・ベンチマーキング
13.10.4 戦略的な展望
13.11 Samsung Biologics
13.11.1 企業スナップショット
13.11.2 会社概要
13.11.3 財務分析
13.11.3.1 純収益、2017年〜2021年
13.11.3.2 地域別市場占有率、2021年
13.11.4 サービスのベンチマーキング
13.11.5 戦略的な展望
13.12 WuXi AppTec
13.12.1 企業スナップショット
13.12.2 会社概要
13.12.3 財務分析
13.12.3.1 純収入、2017-2021年
13.12.4 サービスのベンチマーキング
13.12.5 戦略的な展望
13.13 富士フイルムホールディングス株式会社
13.13.1 企業スナップショット
13.13.2 会社概要
13.13.3 財務分析
13.13.3.1 純収益、2017-2021年
13.13.3.2 R&D、2017年〜2021年
13.13.3.3 地域別市場シェア、2021年
13.13.4 サービスのベンチマーキング
13.13.5 戦略的な展望
13.14 アイコン・ピーエルシー
13.14.1 企業スナップショット
13.14.2 会社概要
13.14.3 財務分析
13.14.3.1 純収益、2018年〜2022年
13.14.3.2 R&D、2017年〜2021年
13.14.3.3 地域別市場シェア、2022年
13.14.4 サービスのベンチマーキング
13.14.5 戦略的な展望
13.15 Abnova Corporation
13.15.1 企業スナップショット
13.15.2 会社概要
13.15.3 サービス・ベンチマーキング
13.16 Vetter Pharma
13.16.1 カンパニー・スナップショット
13.16.2 会社概要
13.16.3 サービス・ベンチマーキング
13.16.4 戦略的な展望
13.17 Aenova Group
13.17.1 企業スナップショット
13.17.2 会社概要
13.17.3 財務分析
13.17.3.1 純収益、2017年〜2021年
13.17.3.2 地域別市場占有率、2021年
13.17.4 サービスのベンチマーキング
13.17.5 戦略的な展望
13.18 Almac Group
13.18.1 企業スナップショット
13.18.2 会社概要
13.18.3 サービス・ベンチマーキング
13.18.4 戦略的な展望
13.19 Nipro Pharma Corporation
13.19.1 企業スナップショット
13.19.2 会社概要
13.19.3 財務分析
13.19.3.1 純収益、2018年〜2022年
13.19.3.2 R&D、2018年〜2022年
13.19.3.3 地域別市場シェア、2022年
13.19.4 サービスのベンチマーキング
13.19.5 戦略的な展望
13.20 Jubilant Pharmova Limited
13.20.1 企業スナップショット
13.20.2 会社概要
13.20.3 財務分析
13.20.3.1 純収益、2018年〜2022年
13.20.3.2 R&D、2018年〜2022年
13.20.3.3 地域別市場シェア、2022年
13.20.4 サービスのベンチマーキング
13.20.5 戦略的な展望
13.21 Grifols, S.A.
13.21.1 企業スナップショット
13.21.2 会社概要
13.21.3 財務分析
13.21.3.1 純収益、2018年〜2022年
13.21.3.2 R&D、2018年-2022年
13.21.3.3 地域別市場シェア、2022年
13.21.4 サービスのベンチマーキング
13.21.5 戦略的な展望
13.22 Pfizer Inc.
13.22.1 企業スナップショット
13.22.2 会社概要
13.22.3 財務分析
13.22.3.1 純収益、2018年〜2022年
13.22.3.2 R&D、2018年〜2022年
13.22.3.3 地域別市場シェア、2022年
13.22.4 サービスのベンチマーキング
13.22.5 戦略的な展望
13.23 Charles River Laboratories
13.23.1 企業スナップショット
13.23.2 会社概要
13.23.3 財務分析
13.23.3.1 純収益、2017年〜2021年
13.23.3.2 地域別市場シェア、2021年
13.23.4 サービスのベンチマーキング
13.23.5 戦略的な展望
13.24 IQVIA Inc.
13.24.1 企業スナップショット
13.24.2 会社概要
13.24.3 財務分析
13.24.3.1 純収益、2018年〜2022年
13.24.3.2 R&D、2018年-2022年
13.24.3.3 地域別市場シェア、2022年
13.24.4 サービスのベンチマーキング
13.24.5 戦略的な展望
13.25 Baxter
13.25.1 企業スナップショット
13.25.2 会社概要
13.25.3 財務分析
13.25.3.1 純収益、2018年〜2022年
13.25.3.2 R&D、2018年〜2022年
13.25.3.3 地域別市場シェア、2022年
13.25.4 サービスのベンチマーキング
14 結論と提言
14.1 Visiongainからの結びの言葉
14.2 市場関係者への提言
ページTOPに戻る
図表リスト
表の一覧
Table 1 Pharmaceutical Contract Manufacturing Market Snapshot, 2022 & 2033 (US$bn, CAGR %)
Table 2 Pharmaceutical Contract Manufacturing Market by Region, 2023-2033 (US$bn, AGR (%), CAGR(%)): “V” Shaped Recovery Scenario
Table 3 Pharmaceutical Contract Manufacturing Market by Region, 2023-2033 (US$bn, AGR (%), CAGR(%)): “U” Shaped Recovery Scenario
Table 4 Pharmaceutical Contract Manufacturing Market by Region, 2023-2033 (US$bn, AGR (%), CAGR(%)): “W” Shaped Recovery Scenario
Table 5 Pharmaceutical Contract Manufacturing Market by Region, 2023-2033 (US$bn, AGR (%), CAGR(%)): “L” Shaped Recovery Scenario
Table 6 Pharmaceutical Contract Manufacturing Market Forecast by Services, 2023-2033 (US$ bn, AGR%, CAGR%)
Table 7 Pharmaceutical Manufacturing Services Segment Market Forecast by Region, 2023-2033 (US$ bn, AGR%, CAGR%)
Table 8 Pharmaceutical API Manufacturing Services Segment Market Forecast by Region, 2023-2033 (US$ bn, AGR%, CAGR%)
Table 9 Pharmaceutical FDF Manufacturing Services Segment Market Forecast by Region, 2023-2033 (US$ bn, AGR%, CAGR%)
Table 10 Parenteral/Injectable Manufacturing Services Segment Market Forecast by Region, 2023-2033 (US$ bn, AGR%, CAGR%)
Table 11 Tablet Manufacturing Services Segment Market Forecast by Region, 2023-2033 (US$ bn, AGR%, CAGR%)
Table 12 Capsule Manufacturing Services Segment Market Forecast by Region, 2023-2033 (US$ bn, AGR%, CAGR%)
Table 13 Oral Liquid Manufacturing Services Segment Market Forecast by Region, 2023-2033 (US$ bn, AGR%, CAGR%)
Table 14 Semi-solid Manufacturing Services Segment Market Forecast by Region, 2023-2033 (US$ bn, AGR%, CAGR%)
Table 15 Other Formulation Manufacturing Services Segment Market Forecast by Region, 2023-2033 (US$ bn, AGR%, CAGR%)
Table 16 Drug Development Services Market Forecast by Region, 2023-2033 (US$ bn, AGR%, CAGR%)
Table 17 Lead Identification & Candidate Optimization Market Forecast by Region, 2023-2033 (US$ bn)
Table 18 Target Identification & Screening Market Forecast by Region, 2023-2033 (US$ bn)
Table 19 Target Validation & Functional Informatics Market Forecast by Region, 2023-2033 (US$ bn)
Table 20 Other Services Market Forecast by Region, 2023-2033 (US$ bn)
Table 21 Biologics Manufacturing Services Segment Market Forecast by Region, 2023-2033 (US$ bn, AGR%, CAGR%)
Table 22 Biologics API Manufacturing Services Segment Market Forecast by Region, 2023-2033 (US$ bn, AGR%, CAGR%)
Table 23 Biologics FDF Manufacturing Services Segment Market Forecast by Region, 2023-2033 (US$ bn, AGR%, CAGR%)
Table 24 Pharmaceutical Contract Manufacturing Market by End-users, 2023-2033 (US$ bn, AGR%, CAGR%)
Table 25 Big Pharmaceutical Companies Market Forecast by Region, 2023-2033 (US$ bn, AGR%, CAGR%)
Table 26 Small & Medium-Sized Pharmaceutical Companies Market Forecast by Region, 2023-2033 (US$ bn, AGR%, CAGR%)
Table 27 Generic Pharmaceutical Companies Market Forecast by Region, 2023-2033 (US$ bn, AGR%, CAGR%)
Table 28 Other End Users Pharmaceutical Companies Market Forecast by Region, 2023-2033 (US$ bn, AGR%, CAGR%)
Table 29 Pharmaceutical Contract Manufacturing Market Forecast by Drug Type, 2023-2033 (US$ bn, AGR%, CAGR%)
Table 30 Branded Market Forecast by Region, 2023-2033 (US$ bn, AGR%, CAGR%)
Table 31 Generic Market Forecast by Region, 2023-2033 (US$ bn, AGR%, CAGR%)
Table 32 Pharmaceutical Contract Manufacturing Market by Region, 2023-2033 (US$bn, AGR (%), CAGR (%))
Table 33 North America Pharmaceutical Contract Manufacturing Market Forecast by Services, 2023-2033 (US$ bn, AGR%, CAGR%)
Table 34 North America Pharmaceutical Contract Manufacturing Market Forecast by End-users 2023-2033 (US$ bn, AGR%, CAGR%)
Table 35 North America Pharmaceutical Contract Manufacturing Market Forecast by Drug Type, 2023-2033 (US$ bn, AGR%, CAGR%)
Table 36 North America Pharmaceutical Contract Manufacturing Market Forecast by Country, 2023-2033 (US$ bn, AGR%, CAGR%)
Table 37 U.S. Pharmaceutical Contract Manufacturing Market Forecast, 2023-2033 (US$ bn, AGR%, CAGR%)
Table 38 Canada Pharmaceutical Contract Manufacturing Market Forecast, 2023-2033 (US$ bn, AGR%, CAGR%)
Table 39 Europe Pharmaceutical Contract Manufacturing Market Forecast by Country, 2023-2033 (US$ bn, AGR%, CAGR%)
Table 40 Europe Pharmaceutical Contract Manufacturing Market Forecast by Services, 2023-2033 (US$ bn, AGR%, CAGR%)
Table 41 Europe Pharmaceutical Contract Manufacturing Market Forecast by End-users, 2023-2033 (US$ bn, AGR%, CAGR%)
Table 42 Europe Pharmaceutical Contract Manufacturing Market Forecast by Drug Type, 2023-2033 (US$ bn, AGR%, CAGR%)
Table 43 Germany Pharmaceutical Contract Manufacturing Market Forecast, 2023-2033 (US$ bn, AGR%, CAGR%)
Table 44 UK Pharmaceutical Contract Manufacturing Market Forecast, 2023-2033 (US$ bn, AGR%, CAGR%)
Table 45 France Pharmaceutical Contract Manufacturing Market Forecast, 2023-2033 (US$ bn, AGR%, CAGR%)
Table 46 Italy Pharmaceutical Contract Manufacturing Market Forecast, 2023-2033 (US$ bn, AGR%, CAGR%)
Table 47 Spain Pharmaceutical Contract Manufacturing Market Forecast, 2023-2033 (US$ bn, AGR%, CAGR%)
Table 48 Switzerland Pharmaceutical Contract Manufacturing Market Forecast, 2023-2033 (US$ bn, AGR%, CAGR%)
Table 49 Rest of Europe Pharmaceutical Contract Manufacturing Market Forecast, 2023-2033 (US$ bn, AGR%, CAGR%)
Table 50 Asia Pacific Pharmaceutical Contract Manufacturing Market Forecast by Country, 2023-2033 (US$ bn, AGR%, CAGR%)
Table 51 Asia Pacific Pharmaceutical Contract Manufacturing Market Forecast by Services, 2023-2033 (US$ bn, AGR%, CAGR%)
Table 52 Asia Pacific Pharmaceutical Contract Manufacturing Market Forecast by End-users, 2023-2033 (US$ bn, AGR%, CAGR%)
Table 53 Asia Pacific Pharmaceutical Contract Manufacturing Market Forecast by Drug Type, 2023-2033 (US$ bn, AGR%, CAGR%)
Table 54 Japan Pharmaceutical Contract Manufacturing Market Forecast, 2023-2033 (US$ bn, AGR%, CAGR%)
Table 55 China Pharmaceutical Contract Manufacturing Market Forecast, 2023-2033 (US$ bn, AGR%, CAGR%)
Table 56 India Pharmaceutical Contract Manufacturing Market Forecast, 2023-2033 (US$ bn, AGR%, CAGR%)
Table 57 Australia Pharmaceutical Contract Manufacturing Market Forecast, 2023-2033 (US$ bn, AGR%, CAGR%)
Table 58 South Korea Pharmaceutical Contract Manufacturing Market Forecast, 2023-2033 (US$ bn, AGR%, CAGR%)
Table 59 Rest of Asia Pacific Pharmaceutical Contract Manufacturing Market Forecast, 2023-2033 (US$ bn, AGR%, CAGR%)
Table 60 Latin America Pharmaceutical Contract Manufacturing Market Forecast by Country, 2023-2033 (US$ bn, AGR%, CAGR%)
Table 61 Latin America Pharmaceutical Contract Manufacturing Market Forecast by Services, 2023-2033 (US$ bn, AGR%, CAGR%)
Table 62 Latin America Pharmaceutical Contract Manufacturing Market Forecast by End-users, 2023-2033 (US$ bn, AGR%, CAGR%)
Table 63 Latin America Pharmaceutical Contract Manufacturing Market Forecast by Drug Type, 2023-2033 (US$ bn, AGR%, CAGR%)
Table 64 Brazil Pharmaceutical Contract Manufacturing Market Forecast, 2023-2033 (US$ bn, AGR%, CAGR%)
Table 65 Mexico Pharmaceutical Contract Manufacturing Market Forecast, 2023-2033 (US$ bn, AGR%, CAGR%)
Table 66 Rest of Latin America Pharmaceutical Contract Manufacturing Market Forecast, 2023-2033 (US$ bn, AGR%, CAGR%)
Table 67 MEA Pharmaceutical Contract Manufacturing Market Forecast by Country, 2023-2033 (US$ bn, AGR%, CAGR%)
Table 68 MEA Pharmaceutical Contract Manufacturing Market Forecast by Services, 2023-2033 (US$ bn, AGR%, CAGR%)
Table 69 MEA Pharmaceutical Contract Manufacturing Market Forecast by End-users, 2023-2033 (US$ bn, AGR%, CAGR%)
Table 70 MEA Pharmaceutical Contract Manufacturing Market Forecast by Drug Type, 2023-2033 (US$ bn, AGR%, CAGR%)
Table 71 GCC Pharmaceutical Contract Manufacturing Market Forecast, 2023-2033 (US$ bn, AGR%, CAGR%)
Table 72 South Africa Pharmaceutical Contract Manufacturing Market Forecast, 2023-2033 (US$ bn, AGR%, CAGR%)
Table 73 Rest of MEA Pharmaceutical Contract Manufacturing Market Forecast, 2023-2033 (US$ bn, AGR%, CAGR%)
Table 74 Lonza: Key Details, (CEO, HQ, Revenue, Founded, No. of Employees, Company Type, Website, Business Segment)
Table 75 Lonza: Service Benchmarking
Table 76 Lonza: Strategic Outlook
Table 77 Catalent, Inc: Key Details, (CEO, HQ, Revenue, Founded, No. of Employees, Company Type, Website, Business Segment)
Table 78 Catalent, Inc: Service Benchmarking
Table 79 Catalent, Inc: Strategic Outlook
Table 80 Recipharm AB: Key Details, (CEO, HQ, Revenue, Founded, No. of Employees, Company Type, Website, Business Segment)
Table 81 Recipharm AB: Service Benchmarking
Table 82 Recipharm AB: Strategic Outlook
Table 83 AbbVie Inc.: Key Details, (CEO, HQ, Revenue, Founded, No. of Employees, Company Type, Website, Business Segment)
Table 84 AbbVie Inc.: Service Benchmarking
Table 85 AbbVie Inc.: Strategic Outlook
Table 86 Thermo Fisher Scientific.: Key Details, (CEO, HQ, Revenue, Founded, No. of Employees, Company Type, Website, Business Segment)
Table 87 Thermo Fisher Scientific.: Service Benchmarking
Table 88 Thermo Fisher Scientific Inc.: Strategic Outlook
Table 89 Siegfried Holding AG: Key Details, (CEO, HQ, Revenue, Founded, No. of Employees, Company Type, Website, Business Segment)
Table 90 Siegfried Holding AG: Service Benchmarking
Table 91 Siegfried Holding AG: Strategic Outlook
Table 92 Evonik Industries: Key Details, (CEO, HQ, Revenue, Founded, No. of Employees, Company Type, Website, Business Segment)
Table 93 Evonik Industries: Service Benchmarking
Table 94 Evonik Industries: Strategic Outlook
Table 95 Boehringer Ingelheim International GmbH: Key Details, (CEO, HQ, Revenue, Founded, No. of Employees, Company Type, Website, Business Segment)
Table 96 Boehringer Ingelheim International GmbH: Service Benchmarking
Table 97 Boehringer Ingelheim International GmbH: Strategic Outlook
Table 98 Piramal Pharma Solutions: Key Details, (CEO, HQ, Revenue, Founded, No. of Employees, Company Type, Website, Business Segment)
Table 99 Piramal Pharma Solutions: Service Benchmarking
Table 100 Piramal Pharma Solutions: Strategic Outlook
Table 101 Samsung Biologics: Key Details, (CEO, HQ, Revenue, Founded, No. of Employees, Company Type, Website, Business Segment)
Table 102 Samsung Biologics: Service Benchmarking
Table 103 Samsung Biologics: Strategic Outlook
Table 104 WuXi AppTec: Key Details, (CEO, HQ, Founded, No. of Employees, Company Type, Website, Business Segment)
Table 105 WuXi AppTec: Service Benchmarking
Table 106 WuXi AppTec: Strategic Outlook
Table 107 FUJIFILM Holdings Corporation: Key Details, (CEO, HQ, Revenue, Founded, No. of Employees, Company Type, Website, Business Segment)
Table 108 FUJIFILM Holdings Corporation: Service Benchmarking
Table 109 FUJIFILM Holdings Corporation: Strategic Outlook
Table 110 ICON Plc: Key Details, (CEO, HQ, Revenue, Founded, No. of Employees, Company Type, Website, Business Segment)
Table 111 ICON Plc. Service Benchmarking
Table 112 ICON Plc.: Strategic Outlook
Table 113 Abnova Corporation: Key Details, (CEO, HQ, Revenue, Founded, No. of Employees, Company Type, Website, Business Segment)
Table 114 Abnova Corporation: Service Benchmarking
Table 115 Vetter Pharma: Key Details, (CEO, HQ, Revenue, Founded, No. of Employees, Company Type, Website, Business Segment)
Table 116 Vetter Pharma: Service Benchmarking
Table 117 Vetter Pharma: Strategic Outlook
Table 118 Aenova Group: Key Details, (CEO, HQ, Revenue, Founded, No. of Employees, Company Type, Website, Business Segment)
Table 119 Aenova Group: Service Benchmarking
Table 120 Aenova Group: Strategic Outlook
Table 121 Almac Group: Key Details, (CEO, HQ, Revenue, Founded, No. of Employees, Company Type, Website, Business Segment)
Table 122 Almac Group: Service Benchmarking
Table 123 Almac Group: Strategic Outlook
Table 124 Nipro Pharma Corporation: Key Details, (CEO, HQ, Revenue, Founded, No. of Employees, Company Type, Website, Business Segment)
Table 125 Nipro Pharma Corporation: Service Benchmarking
Table 126 Nipro Pharma Corporation: Strategic Outlook
Table 127 Jubilant Pharmova Limited: Key Details, (CEO, HQ, Revenue, Founded, No. of Employees, Company Type, Website, Business Segment)
Table 128 Jubilant Pharmova Limited: Service Benchmarking
Table 129 Jubilant Pharmova Limited: Strategic Outlook
Table 130 Grifols, S.A.: Key Details, (CEO, HQ, Revenue, Founded, No. of Employees, Company Type, Website, Business Segment)
Table 131 Grifols, S.A: Service Benchmarking
Table 132 Grifols, S.A: Strategic Outlook
Table 133 Pfizer Inc.: Key Details, (CEO, HQ, Revenue, Founded, No. of Employees, Company Type, Website, Business Segment)
Table 134 Pfizer Inc.: Service Benchmarking
Table 135 Pfizer Inc.: Strategic Outlook
Table 136 Charles River Laboratories: Key Details, (CEO, HQ, Revenue, Founded, No. of Employees, Company Type, Website, Business Segment)
Table 137 Charles River Laboratories: Service Benchmarking
Table 138 Charles River Laboratories: Strategic Outlook
Table 139 IQVIA Inc.: Key Details, (CEO, HQ, Revenue, Founded, No. of Employees, Company Type, Website, Business Segment)
Table 140 IQVIA Inc.: Service Benchmarking
Table 141 IQVIA Inc.: Strategic Outlook
Table 142 Baxter: Key Details, (CEO, HQ, Revenue, Founded, No. of Employees, Company Type, Website, Business Segment)
Table 143 Baxter: Service Benchmarking
図の一覧
Figure 1 Pharmaceutical Contract Manufacturing Market Segmentation
Figure 2 Pharmaceutical Contract Manufacturing Market: Market Dynamics
Figure 3 Pharmaceutical Contract Manufacturing Market by Region, 2023-2033 (US$ bn, AGR %): “V” Shaped Recovery
Figure 4 Pharmaceutical Contract Manufacturing Market by Region, 2023-2033 (US$ bn, AGR %): “U” Shaped Recovery
Figure 5 Pharmaceutical Contract Manufacturing Market by Region, 2023-2033 (US$ bn, AGR %): “W” Shaped Recovery
Figure 6 Pharmaceutical Contract Manufacturing Market by Region, 2023-2033 (US$ bn, AGR %): “L” Shaped Recovery
Figure 7 Pharmaceutical Contract Manufacturing Market: Porter’s Five Forces Analysis
Figure 8 Pharmaceutical Contract Manufacturing Market: PEST Analysis
Figure 9 Pharmaceutical Contract Manufacturing Market: SWOT Analysis
Figure 10 Pharmaceutical Contract Manufacturing Market Forecast by Services 2023 (Revenue, CAGR%)
Figure 11 Pharmaceutical Contract Manufacturing Market Forecast by Services, 2023-2033 (US$ bn)
Figure 12 Pharmaceutical Contract Manufacturing Market Share Forecast by Services, 2023, 2028, 2033 (%)
Figure 13 Pharmaceutical Manufacturing Services Segment Market Forecast by Region, 2023-2033 (US$ bn)
Figure 14 Pharmaceutical Manufacturing Services Segment Market Share Forecast by Region, 2023 & 2033 (%)
Figure 15 Pharmaceutical API Manufacturing Services Segment Market Forecast by Region, 2023-2033 (US$ bn)
Figure 16 Pharmaceutical API Manufacturing Services Segment Market Share Forecast by Region, 2023 & 2033 (%)
Figure 17 Pharmaceutical FDF Manufacturing Services Segment Market Forecast by Region, 2023-2033 (US$ bn)
Figure 18 Pharmaceutical FDF Manufacturing Services Segment Market Share Forecast by Region, 2023 & 2033 (%)
Figure 19 Parenteral/Injectable Manufacturing Services Segment Market Forecast by Region, 2023-2033 (US$ bn)
Figure 20 Parenteral/Injectable Manufacturing Services Segment Market Share Forecast by Region, 2023 & 2033 (%)
Figure 21 Tablet Manufacturing Services Segment Market Forecast by Region, 2023-2033 (US$ bn)
Figure 22 Tablet Manufacturing Services Segment Market Share Forecast by Region, 2023 & 2033 (%)
Figure 23 Capsule Manufacturing Services Segment Market Forecast by Region, 2023-2033 (US$ bn)
Figure 24 Capsule Manufacturing Services Segment Market Share Forecast by Region, 2023 & 2033 (%)
Figure 25 Oral Liquid Manufacturing Services Segment Market Forecast by Region, 2023-2033 (US$ bn)
Figure 26 Oral Liquid Manufacturing Services Segment Market Share Forecast by Region, 2023 & 2033 (%)
Figure 27 Semi-solid Manufacturing Services Segment Market Forecast by Region, 2023-2033 (US$ bn)
Figure 28 Semi-solid Manufacturing Services Segment Market Share Forecast by Region, 2023 & 2033 (%)
Figure 29 Other Formulation Manufacturing Services Segment Market Forecast by Region, 2023-2033 (US$ bn)
Figure 30 Other Formulation Manufacturing Services Segment Market Share Forecast by Region, 2023 & 2033 (%)
Figure 31 Drug Development Services Market Forecast by Region, 2023-2033 (US$ bn)
Figure 32 Drug Development Services Market Share Forecast by Region, 2023 & 2033 (%)
Figure 33 Lead Identification & Candidate Optimization Market Forecast by Region, 2023-2033 (US$ bn)
Figure 34 Lead Identification & Candidate Optimization Market Share Forecast by Region, 2023 & 2033 (%)
Figure 35 Target Identification & Screening Market Forecast by Region, 2023-2033 (US$ bn)
Figure 36 Target Identification & Screening Market Share Forecast by Region, 2023 & 2033 (%)
Figure 37 Target Validation & Functional Informatics Market Forecast by Region, 2023-2033 (US$ bn)
Figure 38 Target Validation & Functional Informatics Market Share Forecast by Region, 2023 & 2033 (%)
Figure 39 Other Services Market Forecast by Region, 2023-2033 (US$ bn)
Figure 40 Other Services Market Share Forecast by Region, 2023 & 2033 (%)
Figure 41 Biologics Manufacturing Services Segment Market Forecast by Region, 2023-2033 (US$ bn)
Figure 42 Biologics Manufacturing Services Segment Market Share Forecast by Region, 2023 & 2033 (%)
Figure 43 Biologics API Manufacturing Services Segment Market Forecast by Region, 2023-2033 (US$ bn)
Figure 44 Biologics API Manufacturing Services Segment Market Share Forecast by Region, 2023 & 2033 (%)
Figure 45 Biologics FDF Manufacturing Services Segment Market Forecast by Region, 2023-2033 (US$ bn)
Figure 46 Biologics FDF Manufacturing Services Segment Market Share Forecast by Region, 2023 & 2033 (%)
Figure 47 Pharmaceutical Contract Manufacturing Market by End-users 2023 (Revenue, CAGR%)
Figure 48 Pharmaceutical Contract Manufacturing Market by End-users, 2023-2033 (US$ bn)
Figure 49 Pharmaceutical Contract Manufacturing Market Share Forecast by End-users, 2023, 2028, 2033 (%)
Figure 50 Big Pharmaceutical Companies Market Forecast by Region, 2023-2033 (US$ bn)
Figure 51 Big Pharmaceutical Companies Market Share Forecast by Region, 2023 & 2033 (%)
Figure 52 Small & Medium-Sized Pharmaceutical Companies Market Forecast by Region, 2023-2033 (US$ bn)
Figure 53 Small & Medium-Sized Pharmaceutical Companies Market Share Forecast by Region, 2023 & 2033 (%)
Figure 54 Generic Pharmaceutical Companies Market Forecast by Region, 2023-2033 (US$ bn)
Figure 55 Generic Pharmaceutical Companies Market Share Forecast by Region, 2023 & 2033 (%)
Figure 56 Other End Users Pharmaceutical Companies Market Forecast by Region, 2023-2033 (US$ bn)
Figure 57 Other End Users Pharmaceutical Companies Market Share Forecast by Region, 2023 & 2033 (%)
Figure 58 Pharmaceutical Contract Manufacturing Market Forecast by Drug Type 2023 (Revenue, CAGR%)
Figure 59 Pharmaceutical Contract Manufacturing Market Forecast by Drug Type, 2023-2033 (US$ bn)
Figure 60 Pharmaceutical Contract Manufacturing Market Share Forecast by Drug Type, 2023, 2028, 2033 (%)
Figure 61 Branded Market Forecast by Region, 2023-2033 (US$ bn)
Figure 62 Branded Market Share Forecast by Region, 2023 & 2033 (%)
Figure 63 Generic Market Forecast by Region, 2023-2033 (US$ bn)
Figure 64 Generic Market Share Forecast by Region, 2023 & 2033 (%)
Figure 65 Pharmaceutical Contract Manufacturing Market Forecast by Region 2023, 2028, 2033 (Revenue, CAGR%)
Figure 66 Pharmaceutical Contract Manufacturing Market Share Forecast by Region 2023, 2028, 2033(%)
Figure 67 Pharmaceutical Contract Manufacturing Market by Region, 2023-2033 (US$ bn, AGR %)
Figure 68 North America Pharmaceutical Contract Manufacturing Market Attractiveness Index
Figure 69 North America Pharmaceutical Contract Manufacturing Market Forecast by Services, 2023-2033 (US$ bn)
Figure 70 North America Pharmaceutical Contract Manufacturing Market Share Forecast by Services, 2023 & 2033 (%)
Figure 71 North America Pharmaceutical Contract Manufacturing Market Forecast by End-users, 2023-2033 (US$ bn)
Figure 72 North America Pharmaceutical Contract Manufacturing Market Share Forecast by End-users, 2023 & 2033 (%)
Figure 73 North America Pharmaceutical Contract Manufacturing Market Forecast by Drug Type, 2023-2033 (US$ bn)
Figure 74 North America Pharmaceutical Contract Manufacturing Market Share Forecast by Drug Type, 2023 & 2033 (%)
Figure 75 North America Pharmaceutical Contract Manufacturing Market Forecast by Country, 2023-2033 (US$ bn)
Figure 76 North America Pharmaceutical Contract Manufacturing Market Share Forecast by Country, 2023 & 2033 (%)
Figure 77 U.S. Pharmaceutical Contract Manufacturing Market Forecast, 2023-2033 (US$ bn, AGR %)
Figure 78 Canada Pharmaceutical Contract Manufacturing Market Forecast, 2023-2033 (US$ bn, AGR %)
Figure 79 Europe Pharmaceutical Contract Manufacturing Market Attractiveness Index
Figure 80 Europe Pharmaceutical Contract Manufacturing Market Forecast by Country, 2023-2033 (US$ bn)
Figure 81 Europe Pharmaceutical Contract Manufacturing Market Share Forecast by Country, 2023 & 2033 (%)
Figure 82 Europe Pharmaceutical Contract Manufacturing Market Forecast by Service, 2023-2033 (US$ bn)
Figure 83 Europe Pharmaceutical Contract Manufacturing Market Share Forecast by Services, 2023 & 2033 (%)
Figure 84 Europe Pharmaceutical Contract Manufacturing Market Forecast by End-users, 2023-2033 (US$ bn)
Figure 85 Europe Pharmaceutical Contract Manufacturing Market Share Forecast by End-users, 2023 & 2033 (%)
Figure 86 Europe Pharmaceutical Contract Manufacturing Market Forecast by Drug Type, 2023-2033 (US$ bn)
Figure 87 Europe Pharmaceutical Contract Manufacturing Market Share Forecast by Drug Type, 2023 & 2033(%)
Figure 88 Germany Pharmaceutical Contract Manufacturing Market Forecast, 2023-2033 (US$ bn, AGR %)
Figure 89 UK Pharmaceutical Contract Manufacturing Market Forecast, 2023-2033 (US$ bn, AGR %)
Figure 90 France Pharmaceutical Contract Manufacturing Market Forecast, 2023-2033 (US$ bn, AGR %)
Figure 91 Italy Pharmaceutical Contract Manufacturing Market Forecast, 2023-2033 (US$ bn, AGR %)
Figure 92 Spain Pharmaceutical Contract Manufacturing Market Forecast, 2023-2033 (US$ bn, AGR %)
Figure 93 Switzerland Pharmaceutical Contract Manufacturing Market Forecast, 2023-2033 (US$ bn, AGR %)
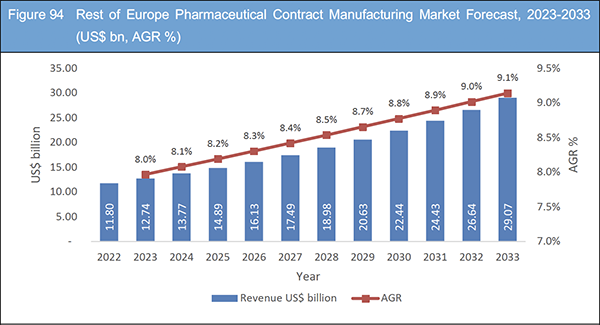
Figure 94 Rest of Europe Pharmaceutical Contract Manufacturing Market Forecast, 2023-2033 (US$ bn, AGR %)
Figure 95 Asia Pacific Pharmaceutical Contract Manufacturing Market Attractiveness Index
Figure 96 Asia Pacific Pharmaceutical Contract Manufacturing Market Forecast by Country, 2023-2033 (US$ bn)
Figure 97 Asia Pacific Pharmaceutical Contract Manufacturing Market Share Forecast by Country, 2023 & 2033 (%)
Figure 98 Asia Pacific Pharmaceutical Contract Manufacturing Market Forecast by Services, 2023-2033 (US$ bn)
Figure 99 Asia Pacific Pharmaceutical Contract Manufacturing Market Share Forecast by Services, 2023 & 2033 (%)
Figure 100 Asia Pacific Pharmaceutical Contract Manufacturing Market Forecast by End-users, 2023-2033 (US$ bn)
Figure 101 Asia Pacific Pharmaceutical Contract Manufacturing Market Share Forecast by End-users, 2023 & 2033 (%)
Figure 102 Asia Pacific Pharmaceutical Contract Manufacturing Market Forecast by Drug Type, 2023-2033 (US$ bn)
Figure 103 Asia Pacific Pharmaceutical Contract Manufacturing Market Share Forecast by Drug Type, 2023 & 2033 (%)
Figure 104 Japan Pharmaceutical Contract Manufacturing Market Forecast, 2023-2033 (US$ bn, AGR %)
Figure 105 China Pharmaceutical Contract Manufacturing Market Forecast, 2023-2033 (US$ bn, AGR %)
Figure 106 India Pharmaceutical Contract Manufacturing Market Forecast, 2023-2033 (US$ bn, AGR %)
Figure 107 Australia Pharmaceutical Contract Manufacturing Market Forecast, 2023-2033 (US$ bn, AGR %)
Figure 108 South Korea Pharmaceutical Contract Manufacturing Market Forecast, 2023-2033 (US$ bn, AGR %)
Figure 109 Rest of Asia Pacific Pharmaceutical Contract Manufacturing Market Forecast, 2023-2033 (US$ bn, AGR %)
Figure 110 Latin America Pharmaceutical Contract Manufacturing Market Attractiveness Index
Figure 111 Latin America Pharmaceutical Contract Manufacturing Market Forecast by Country, 2023-2033 (US$ bn)
Figure 112 Latin America Pharmaceutical Contract Manufacturing Market Share Forecast by Country, 2023 & 2033 (%)
Figure 113 Latin America Pharmaceutical Contract Manufacturing Market Forecast by Services, 2023-2033 (US$ bn)
Figure 114 Latin America Pharmaceutical Contract Manufacturing Market Share Forecast by Services, 2023 & 2033 (%)
Figure 115 Latin America Pharmaceutical Contract Manufacturing Market Forecast by End-users, 2023-2033 (US$ bn)
Figure 116 Latin America Pharmaceutical Contract Manufacturing Market Share Forecast by End-users, 2023 & 2033 (%)
Figure 117 Latin America Pharmaceutical Contract Manufacturing Market Forecast by Drug Type, 2023-2033 (US$ bn)
Figure 118 Latin America Pharmaceutical Contract Manufacturing Market Share Forecast by Drug Type, 2023 & 2033 (%)
Figure 119 Brazil Pharmaceutical Contract Manufacturing Market Forecast, 2023-2033 (US$ bn, AGR %)
Figure 120 Mexico Pharmaceutical Contract Manufacturing Market Forecast, 2023-2033 (US$ bn, AGR %)
Figure 121 Rest of Latin America Pharmaceutical Contract Manufacturing Market Forecast, 2023-2033 (US$ bn, AGR %)
Figure 122 MEA Pharmaceutical Contract Manufacturing Market Attractiveness Index
Figure 123 MEA Pharmaceutical Contract Manufacturing Market by Region, 2023, 2028 & 2033 (US$ bn)
Figure 124 MEA Pharmaceutical Contract Manufacturing Market Forecast by Country, 2023-2033 (US$ bn)
Figure 125 MEA Pharmaceutical Contract Manufacturing Market Share Forecast by Country, 2023 & 2033 (%)
Figure 126 MEA Pharmaceutical Contract Manufacturing Market Forecast by Services, 2023-2033 (US$ bn)
Figure 127 MEA Pharmaceutical Contract Manufacturing Market Share Forecast by Services, 2023 & 2033 (%)
Figure 128 MEA Pharmaceutical Contract Manufacturing Market Forecast by End-users, 2023-2033 (US$ bn)
Figure 129 MEA Pharmaceutical Contract Manufacturing Market Share Forecast by End-users, 2023 & 2033 (%)
Figure 130 MEA Pharmaceutical Contract Manufacturing Market Forecast by Drug Type, 2023-2033 (US$ bn)
Figure 131 MEA Pharmaceutical Contract Manufacturing Market Share Forecast by Drug Type, 2023 & 2033 (%)
Figure 132 GCC Pharmaceutical Contract Manufacturing Market Forecast, 2023-2033 (US$ bn, AGR %)
Figure 133 South Africa Pharmaceutical Contract Manufacturing Market Forecast, 2023-2033 (US$ bn, AGR %)
Figure 134 Rest of MEA Pharmaceutical Contract Manufacturing Market Forecast, 2023-2033 (US$ bn, AGR %)
Figure 135 Pharmaceutical Contract Manufacturing Market: Company Share, 2022
Figure 136 Lonza: Net Revenue, 2018-2022 (US$ million, AGR%)
Figure 137 Catalent, Inc: Net Revenue, 2018-2022 (US$ million, AGR%)
Figure 138 Catalent, Inc: Regional Market Shares, 2022
Figure 139 Recipharm AB: Net Revenue, 2017-2021 (US$ million, AGR%)
Figure 140 AbbVie Inc.: Net Revenue, 2018-2022 (US$ million, AGR%)
Figure 141 AbbVie Inc.: R&D, 2018-2022 (US$ million, AGR%)
Figure 142 AbbVie Inc.: Regional Market Shares, 2022
Figure 143 Thermo Fisher Scientific.: Net Revenue, 2017-2021 (US$ million, AGR%)
Figure 144 Thermo Fisher Scientific.: R&D, 2017-2021 (US$ million, AGR%)
Figure 145 Thermo Fisher Scientific.: Regional Market Shares, 2021
Figure 146 Siegfried Holding AG: Net Revenue, 2018-2022 (US$ million, AGR%)
Figure 147 Siegfried Holding AG: R&D, 2018-2022 (US$ million, AGR%)
Figure 148 Evonik Industries: Net Revenue, 2018-2022(US$ million, AGR%)
Figure 149 Evonik Industries: R&D, 2018-2022 (US$ million, AGR%)
Figure 150 Evonik Industries: Regional Market Shares, 2022
Figure 151 Boehringer Ingelheim International GmbH: Net Revenue, 2017-2021(US$ million, AGR%)
Figure 152 Boehringer Ingelheim International GmbH: R&D, 2017-2021 (US$ million, AGR%)
Figure 153 Boehringer Ingelheim International GmbH: Regional Market Shares, 2021
Figure 154 Samsung Biologics: Net Revenue, 2017-2021(US$ million, AGR%)
Figure 155 Samsung Biologics: Regional Market Shares, 2021
Figure 156 WuXi AppTec: Net Revenue, 2017-2021 (US$ million, AGR%)
Figure 157 FUJIFILM Holdings Corporation: Net Revenue, 2017-2021 (US$ million, AGR%)
Figure 158 FUJIFILM Holdings Corporation: R&D, 2017-2021 (US$ million, AGR%)
Figure 159 FUJIFILM Holdings Corporation: Regional Market Shares, 2021
Figure 160 ICON Plc: Net Revenue, 2018-2022 (US$ million, AGR%)
Figure 161 ICON Plc: R&D, 2017-2021 (US$ million, AGR%)
Figure 162 ICON Plc: Regional Market Shares, 2022
Figure 163 Aenova Group: Net Revenue, 2017-2021 (US$ million, AGR%)
Figure 164 Aenova Group: Regional Market Shares, 2021
Figure 165 Nipro Pharma Corporation: Net Revenue, 2018-2022 (US$ million, AGR%)
Figure 166 Nipro Pharma Corporation: R&D, 2018-2022 (US$ million, AGR%)
Figure 167 Nipro Pharma Corporation: Regional Market Shares, 2022
Figure 168 Jubilant Pharmova Limited: Net Revenue, 2018-2022 (US$ million, AGR%)
Figure 169 Jubilant Pharmova Limited: R&D, 2018-2022 (US$ million, AGR%)
Figure 170 Jubilant Pharmova Limited: Regional Market Shares, 2022
Figure 171 Grifols, S.A: Net Revenue, 2018-2022 (US$ million, AGR%)
Figure 172 Grifols, S.A: R&D, 2018-2022 (US$ million, AGR%)
Figure 173 Grifols, S.A: Regional Market Shares, 2022
Figure 174 Pfizer Inc: Net Revenue, 2018-2022 (US$ million, AGR%)
Figure 175 Pfizer Inc.: R&D, 2018-2022 (US$ million, AGR%)
Figure 176 Pfizer Inc: Regional Market Shares, 2022
Figure 177 Charles River Laboratories: Net Revenue, 2017-2021 (US$ million, AGR%)
Figure 178 Charles River Laboratories: Regional Market Shares, 2021
Figure 179 IQVIA Inc.: Net Revenue, 2018-2022 (US$ million, AGR%)
Figure 180 IQVIA Inc.: R&D, 2018-2022 (US$ million, AGR%)
Figure 181 IQVIA Inc.: Regional Market Shares, 2022
Figure 182 Baxter: Net Revenue, 2018-2022 (US$ million, AGR%)
Figure 183 Baxter: R&D, 2018-2022 (US$ million, AGR%)
Figure 184 Baxter: Regional Market Shares, 2022
ページTOPに戻る
Summary
Report Details
The Pharmaceutical Contract Manufacturing Market Report 2023-2033: This report will prove invaluable to leading firms striving for new revenue pockets if they wish to better understand the industry and its underlying dynamics. It will be useful for companies that would like to expand into different industries or to expand their existing operations in a new region.
In regard to therapeutic performance and safety characteristics, generic medications are less expensive than their branded counterparts. One of the main factors fueling the demand for generics is the push to lower the rising healthcare expenses. The market entry of various less expensive generic substitutes was made possible by patent expiration. Some of the significant medications whose patents recently expired included Lucentis by Roche, Adasuve by Galen, Perforomist by Mylan, Northera by Lundbeck, and Narcan by Emergent BioSolutions.
Nuclear medicine contract manufacturing also encompasses the development and production of radiopharmaceuticals. Due to recent corporate acquisitions and share offers, interest in the radiopharmaceutical industry has increased. Also, in May 2021, Curium finalized the acquisition of IASON, which aided the firm in growing its service portfolio of life-saving diagnostic solutions and throughout the European market.
What Questions Should You Ask before Buying a Market Research Report?
• How is the pharmaceutical contract manufacturing market evolving?
• What is driving and restraining the pharmaceutical contract manufacturing market?
• How will each point of care diagnostic submarket segment grow over the forecast period and how much revenue will these submarkets account for in 2033?
• How will the market shares for each pharmaceutical contract manufacturing submarket develop from 2022 to 2033?
• What will be the main driver for the overall market from 2023 to 2033?
• Will leading pharmaceutical contract manufacturing markets broadly follow the macroeconomic dynamics, or will individual national markets outperform others?
• How will the market shares of the national markets change by 2033 and which geographical region will lead the market in 2033?
• Who are the leading players and what are their prospects over the forecast period?
• What are the pharmaceutical contract manufacturing projects for these leading companies?
• How will the industry evolve during the period between 2023 and 2033? What are the implications of pharmaceutical contract manufacturing projects taking place now and over the next 10 years?
• Is there a greater need for product commercialisation to further scale the pharmaceutical contract manufacturing market?
• Where is the pharmaceutical contract manufacturing market heading and how can you ensure you are at the forefront of the market?
• What are the best investment options for new product and service lines?
• What are the key prospects for moving companies into a new growth path and C-suite?
You need to discover how this will impact the pharmaceutical contract manufacturing market today, and over the next 10 years:
• Our 318-page report provides 143 tables, 184 charts/graphs exclusively to you.
• The report highlights key lucrative areas in the industry so you can target them – NOW.
• It contains in-depth analysis of global, regional and national sales and growth.
• It highlights for you the key successful trends, changes and revenue projections made by your competitors.
This report tells you TODAY how the pharmaceutical contract manufacturing market will develop in the next 10 years, and in line with the variations in COVID-19 economic recession and bounce. This market is more critical now than at any point over the last 10 years.
Forecasts to 2033 and other analyses reveal commercial prospects
• In addition to revenue forecasting to 2033, our new study provides you with recent results, growth rates, and market shares.
• You will find original analyses, with business outlooks and developments.
• Discover qualitative analyses (including market dynamics, drivers, opportunities, restraints and challenges), cost structure, impact of rising pharmaceutical contract manufacturing prices and recent developments.
This report includes data analysis and invaluable insight into how COVID-19 will affect the industry and your company. Four COVID-19 recovery patterns and their impact, namely, “V”, “L”, “W” and “U” are discussed in this report.
Segments Covered in the Report
Services
• Pharmaceutical Manufacturing Services
– Pharmaceutical API Manufacturing Services
– Pharmaceutical FDF Manufacturing Services: Parenteral/Injectable Manufacturing Services, Tablet Manufacturing Services, Capsule Manufacturing Services, Oral Liquid Manufacturing Services, Semi-solid Manufacturing Services, Other Formulation Manufacturing Services
• Drug Development Services
– Lead Identification & Candidate Optimization
– Target Identification & Screening
– Target Validation & Functional Informatics
– Other Services
• Biologics Manufacturing Services
– Biologics API Manufacturing Services
– Biologics FDF Manufacturing Services
Drug Type
• Branded
• Generic
End User
• Big Pharmaceutical Companies
• Small & Medium-sized Pharmaceutical Companies
• Generic Pharmaceutical Companies
• Other End-users
In addition to the revenue predictions for the overall world market and segments, you will also find revenue forecasts for five regional and 18 leading national markets:
North America
• U.S.
• Canada
Europe
• Germany
• UK
• France
• Italy
• Spain
• Switzerland
• Rest of Europe
Asia Pacific
• China
• Japan
• India
• Australia
• South Korea
• Rest of Asia Pacific
Latin America
• Brazil
• Mexico
• Rest of Latin America
MEA
• GCC
• South Africa
• Rest of MEA
The report also includes profiles and for some of the leading companies in the Pharmaceutical Contract Manufacturing Market, 2023 to 2033, with a focus on this segment of these companies’ operations.
Leading companies and the potential for market growth
• AbbVie Inc.
• Abnova Corporation
• Aenova Group
• Almac Group
• Baxter
• Boehringer Ingelheim International
• Catalent Inc
• Charles River Laboratories
• Evonik Industries
• Fujifilm Holdings Corporation
• Grifols S.A.
• Jubilant Pharmova Limited
• ICON Plc
• IQVIA
• Lonza
• Nipro Pharma Corporation
• Pfizer Inc.
• Piramal Pharma Solutions
• Recipharm AB
• Samsung Biologics
• Siegfried Holding AG
• Thermo Fisher Scientific
• Vetter Pharma
• WuXi AppTec
Overall world revenue for pharmaceutical contract manufacturing market, 2023 to 2033 in terms of value the market will surpass US$145 billion in 2023, our work calculates. We predict strong revenue growth through to 2033. Our work identifies which organizations hold the greatest potential. Discover their capabilities, progress, and commercial prospects, helping you stay ahead.
How will the Pharmaceutical contract manufacturing Market, 2023 to 2033 report help you?
In summary, our 310+ page report provides you with the following knowledge:
• Revenue forecasts to 2033 for pharmaceutical contract manufacturing Market, 2023 to 2033 Market, with forecasts for service, drug type, end-users, each forecast at a global and regional level – discover the industry’s prospects, finding the most lucrative places for investments and revenues.
• Revenue forecasts to 2033 for five regional and 21 key national markets – See forecasts for the pharmaceutical contract manufacturing Market, 2023 to 2033 market in North America, Europe, Asia-Pacific, Latin America, and MEA. Also forecasted is the market in the US, Canada, Mexico, Brazil, Germany, France, UK, Italy, Spain, Switzerland, China, India, Japan, Australia, South Korea, Brazil, GCC, and South Africa among other prominent economies.
• Prospects for established firms and those seeking to enter the market – including company profiles for 25 of the major companies involved in the pharmaceutical contract manufacturing Market, 2023 to 2033.
Find quantitative and qualitative analyses with independent predictions. Receive information that only our report contains, staying informed with invaluable business intelligence.
Information found nowhere else
With our new report, you are less likely to fall behind in knowledge or miss out on opportunities. See how our work could benefit your research, analyses, and decisions. Visiongain’s study is for everybody needing commercial analyses for the pharmaceutical contract manufacturing Market, 2023 to 2033, market-leading companies. You will find data, trends and predictions.
ページTOPに戻る
Table of Contents
Table of Contents
1 Report Overview
1.1 Objectives of the Study
1.2 Introduction to Pharmaceutical Contract Manufacturing Market
1.3 What This Report Delivers
1.4 Why You Should Read This Report
1.5 Key Questions Answered by This Analytical Report
1.6 Who is This Report for?
1.7 Methodology
1.7.1 Market Definitions
1.7.2 Market Evaluation & Forecasting Methodology
1.7.3 Data Validation
1.7.3.1 Primary Research
1.7.3.2 Secondary Research
1.8 Frequently Asked Questions (FAQs)
1.9 Associated Visiongain Reports
1.10 About Visiongain
2 Executive Summary
3 Market Overview
3.1 Key Findings
3.2 Market Dynamics
3.2.1 Market Driving Factors
3.2.1.1 Patent Expiry and Increasing Demand for Generic Drugs
3.2.1.2 Increasing Investments in Pharmaceutical R&D
3.2.1.3 Investments in Advanced Manufacturing Technologies by CDMOs
3.2.2 Market Restraining Factors
3.2.2.1 Introduction of Serialization
3.2.3 Market Opportunities
3.2.3.1 Increasing Demand for Biological Therapies
3.2.3.2 Growth in the Nuclear Medicine Sector
3.2.3.3 Growing Demand for Cell and Gene Therapies
3.3 COVID-19 Impact Analysis
3.4 Porter’s Five Forces Analysis
3.4.1 Bargaining Power of Supplier
3.4.2 Bargaining Power of Buyer
3.4.3 Threat of New Entrants
3.4.4 Threat of Substitutes
3.4.5 Competitive Rivalry
3.5 PEST Analysis
3.6 SWOT Analysis
4 Pharmaceutical Contract Manufacturing Market, by Services, 2023-2033
4.1 Key Findings
4.2 Services Segment: Market Attractiveness Index
4.3 Pharmaceutical Contract Manufacturing Market Size Estimation and Forecast by Services
4.4 Pharmaceutical Manufacturing Services
4.4.1 Market Size by Region, 2023-2033 (US$ bn)
4.4.2 Market Share by Region, 2023 & 2033 (%)
4.4.3 Pharmaceutical API Manufacturing Services
4.4.3.1 Market Size by Region, 2023-2033 (US$ bn)
4.4.3.2 Market Share by Region, 2023 & 2033 (%)
4.4.4 Pharmaceutical FDF Manufacturing Services
4.4.4.1 Market Size by Region, 2023-2033 (US$ bn)
4.4.4.2 Market Share by Region, 2023 & 2033 (%)
4.4.4.3 Parenteral/Injectable Manufacturing Services
4.4.4.4 Tablet Manufacturing Services
4.4.4.5 Capsule Manufacturing Services
4.4.4.6 Oral Liquid Manufacturing Services
4.4.4.7 Semi-solid Manufacturing Services
4.4.4.8 Other Formulation Manufacturing Services
4.5 Drug Development Services
4.5.1 Market Size by Region, 2023-2033 (US$ bn)
4.5.2 Market Share by Region, 2023 & 2033 (%)
4.5.3 Lead Identification & Candidate Optimization
4.5.3.1 Market Size by Region, 2023-2033 (US$ bn)
4.5.3.2 Market Share by Region, 2023 & 2033 (%)
4.5.4 Target Identification & Screening
4.5.4.1 Market Size by Region, 2023 – 2033 (US$bn)
4.5.4.2 Market Share by Region, 2023 & 2033 (%)
4.5.5 Target Validation & Functional Informatics
4.5.5.1 Market Size by Region, 2023 – 2033 (US$bn)
4.5.5.2 Market Share by Region, 2023 & 2033 (%)
4.5.6 Other Services
4.5.6.1 Market Size by Region, 2023 – 2033 (US$bn)
4.5.6.2 Market Share by Region, 2023 & 2033 (%)
4.6 Biologics Manufacturing Services
4.6.1 Market Size by Region, 2023-2033 (US$ bn)
4.6.2 Market Share by Region, 2023 & 2033 (%)
4.6.3 Biologics API Manufacturing Services
4.6.3.1 Market Size by Region, 2023-2033 (US$ bn)
4.6.3.2 Market Share by Region, 2023 & 2033 (%)
4.6.4 Biologics FDF Manufacturing Services
4.6.4.1 Market Size by Region, 2023-2033 (US$ bn)
4.6.4.2 Market Share by Region, 2023 & 2033 (%)
5 Pharmaceutical Contract Manufacturing Market, by End-users, 2023-2033
5.1 Key Findings
5.2 End-users Segment: Market Attractiveness Index
5.3 Pharmaceutical Contract Manufacturing Market, by End-users
5.4 Big Pharmaceutical Companies
5.4.1 Market Size by Region, 2023-2033 (US$ bn)
5.4.2 Market Share by Region, 2023 & 2033 (%)
5.5 Small & Medium-Sized Pharmaceutical Companies
5.5.1 Market Size by Region, 2023-2033 (US$ bn)
5.5.2 Market Share by Region, 2023 & 2033 (%)
5.6 Generic Pharmaceutical Company
5.6.1 Market Size by Region, 2023-2033 (US$ bn)
5.6.2 Market Share by Region, 2023 & 2033 (%)
5.7 Other End-users
5.7.1 Market Size by Region, 2023-2033 (US$ bn)
5.7.2 Market Share by Region, 2023 & 2033 (%)
6 Pharmaceutical Contract Manufacturing Market, by Drug Type, 2023-2033
6.1 Key Findings
6.2 Drug Type Segment: Market Attractiveness Index
6.3 Pharmaceutical Contract Manufacturing Market Size Estimation and Forecast by Drug Type
6.4 Branded
6.4.1 Market Size by Region, 2023-2033 (US$ bn)
6.4.2 Market Share by Region, 2023 & 2033 (%)
6.5 Generic
6.5.1 Market Size by Region, 2023-2033 (US$ bn)
6.5.2 Market Share by Region, 2023 & 2033 (%)
7 Pharmaceutical Contract Manufacturing Market Analysis by Region, 2023-2033
7.1 Key Findings
7.2 Regional Market Size Estimation and Forecast
8 North America Pharmaceutical Contract Manufacturing Market, 2023-2033
8.1 Key Findings
8.2 North America Pharmaceutical Contract Manufacturing Market Attractiveness Index
8.3 North America Pharmaceutical Contract Manufacturing Market Forecast by Services
8.4 North America Pharmaceutical Contract Manufacturing Market Size Estimation and Forecast by End-users
8.5 North America Pharmaceutical Contract Manufacturing Market Size Estimation and Forecast by Drug Type
8.6 North America Pharmaceutical Contract Manufacturing Market Forecast by Country
8.7 U.S. Pharmaceutical Contract Manufacturing Market Analysis
8.8 Canada Pharmaceutical Contract Manufacturing Market Analysis
9 Europe Pharmaceutical Contract Manufacturing Market, 2023-2033
9.1 Key Findings
9.2 Europe Pharmaceutical Contract Manufacturing Market Attractiveness Index
9.3 Europe Pharmaceutical Contract Manufacturing Market Size Estimation and Forecast by Country
9.4 Europe Pharmaceutical Contract Manufacturing Market Size Estimation and Forecast by Services
9.5 Europe Pharmaceutical Contract Manufacturing Market Size Estimation and Forecast by End-users
9.6 Europe Pharmaceutical Contract Manufacturing Market Size Estimation and Forecast by Drug Type
9.7 Germany Pharmaceutical Contract Manufacturing Market Analysis
9.8 UK Pharmaceutical Contract Manufacturing Market Analysis
9.9 France Pharmaceutical Contract Manufacturing Market Analysis
9.10 Italy Pharmaceutical Contract Manufacturing Market Analysis
9.11 Spain Pharmaceutical Contract Manufacturing Market Analysis
9.12 Switzerland Pharmaceutical Contract Manufacturing Market Analysis
9.13 Rest of Europe Pharmaceutical Contract Manufacturing Market Analysis
10 Asia Pacific Pharmaceutical Contract Manufacturing Market Analysis
10.1 Key Findings
10.2 Asia Pacific Pharmaceutical Contract Manufacturing Market Attractiveness Index
10.3 Asia Pacific Pharmaceutical Contract Manufacturing Market Size Estimation and Forecast by Country
10.4 Asia Pacific Pharmaceutical Contract Manufacturing Market Size Estimation and Forecast by Services
10.5 Asia Pacific Pharmaceutical Contract Manufacturing Market Size Estimation and Forecast by End-users
10.6 Asia Pacific Pharmaceutical Contract Manufacturing Market Size Estimation and Forecast by Drug Type
10.7 Japan Pharmaceutical Contract Manufacturing Market Analysis
10.8 China Pharmaceutical Contract Manufacturing Market Analysis
10.9 India Pharmaceutical Contract Manufacturing Market Analysis
10.10 Australia Pharmaceutical Contract Manufacturing Market Analysis
10.11 South Korea Pharmaceutical Contract Manufacturing Market Analysis
10.12 Rest of Asia Pacific Pharmaceutical Contract Manufacturing Market Analysis
11 Latin America Pharmaceutical Contract Manufacturing Market Analysis
11.1 Key Findings
11.2 Latin America Pharmaceutical Contract Manufacturing Market Attractiveness Index
11.3 Latin America Pharmaceutical Contract Manufacturing Market Size Estimation and Forecast by Country
11.4 Latin America Pharmaceutical Contract Manufacturing Market Size Estimation and Forecast by Services
11.5 Latin America Pharmaceutical Contract Manufacturing Market Size Estimation and Forecast by End-users
11.6 Latin America Pharmaceutical Contract Manufacturing Market Size Estimation and Forecast by Drug Type
11.7 Brazil Pharmaceutical Contract Manufacturing Market Analysis
11.8 Mexico Pharmaceutical Contract Manufacturing Market Analysis
11.9 Rest of Latin America Pharmaceutical Contract Manufacturing Market Analysis
12 MEA Pharmaceutical Contract Manufacturing Market Analysis
12.1 Key Findings
12.2 MEA Pharmaceutical Contract Manufacturing Market Attractiveness Index
12.3 MEA Pharmaceutical Contract Manufacturing Market by Country, 2023, 2028 & 2033 (US$ bn)
12.4 MEA Pharmaceutical Contract Manufacturing Market Size Estimation and Forecast by Country
12.5 MEA Pharmaceutical Contract Manufacturing Market Size Estimation and Forecast by Services
12.6 MEA Pharmaceutical Contract Manufacturing Market Size Estimation and Forecast by End-users
12.7 MEA Pharmaceutical Contract Manufacturing Market Size Estimation and Forecast by Drug Type
12.8 GCC Pharmaceutical Contract Manufacturing Market Analysis
12.9 South Africa Pharmaceutical Contract Manufacturing Market Analysis
12.10 Rest of MEA Pharmaceutical Contract Manufacturing Market Analysis
13 Company Profiles
13.1 Competitive Landscape
13.2 Lonza
13.2.1 Company Snapshot
13.2.2 Company Overview
13.2.3 Financial Analysis
13.2.3.1 Net Revenue, 2018-2022
13.2.4 Service Benchmarking
13.2.5 Strategic Outlook
13.3 Catalent, Inc
13.3.1 Company Snapshot
13.3.2 Company Overview
13.3.3 Financial Analysis
13.3.3.1 Net Revenue, 2018-2022
13.3.3.2 Regional Market Shares, 2022
13.3.4 Service Benchmarking
13.3.5 Strategic Outlook
13.4 Recipharm AB
13.4.1 Company Snapshot
13.4.2 Company Overview
13.4.3 Financial Analysis
13.4.3.1 Net Revenue, 2017-2021
13.4.4 Service Benchmarking
13.4.5 Strategic Outlook
13.5 AbbVie Inc.
13.5.1 Company Snapshot
13.5.2 Company Overview
13.5.3 Financial Analysis
13.5.3.1 Net Revenue, 2018-2022
13.5.3.2 R&D, 2018-2022
13.5.3.3 Regional Market Shares, 2022
13.5.4 Service Benchmarking
13.5.5 Strategic Outlook
13.6 Thermo Fisher Scientific
13.6.1 Company Snapshot
13.6.2 Company Overview
13.6.3 Financial Analysis
13.6.3.1 Net Revenue, 2017-2021
13.6.3.2 R&D, 2017-2021
13.6.4 Service Benchmarking
13.6.5 Strategic Outlook
13.7 Siegfried Holding AG
13.7.1 Company Snapshot
13.7.2 Company Overview
13.7.3 Financial Analysis
13.7.3.1 Net Revenue, 2018-2022
13.7.3.2 R&D, 2018-2022
13.7.4 Service Benchmarking
13.7.5 Strategic Outlook
13.8 Evonik Industries
13.8.1 Company Snapshot
13.8.2 Company Overview
13.8.3 Financial Analysis
13.8.3.1 Net Revenue, 2018-2022
13.8.3.2 R&D, 2018-2022
13.8.3.3 Regional Market Shares, 2022
13.8.4 Service Benchmarking
13.8.5 Strategic Outlook
13.9 Boehringer Ingelheim International GmbH
13.9.1 Company Snapshot
13.9.2 Company Overview
13.9.3 Financial Analysis
13.9.3.1 Net Revenue, 2017-2021
13.9.3.2 R&D, 2017-2021
13.9.3.3 Regional Market Shares, 2021
13.9.4 Service Benchmarking
13.9.5 Strategic Outlook
13.10 Piramal Pharma Solutions
13.10.1 Company Snapshot
13.10.2 Company Overview
13.10.3 Service Benchmarking
13.10.4 Strategic Outlook
13.11 Samsung Biologics
13.11.1 Company Snapshot
13.11.2 Company Overview
13.11.3 Financial Analysis
13.11.3.1 Net Revenue, 2017-2021
13.11.3.2 Regional Market Shares, 2021
13.11.4 Service Benchmarking
13.11.5 Strategic Outlook
13.12 WuXi AppTec
13.12.1 Company Snapshot
13.12.2 Company Overview
13.12.3 Financial Analysis
13.12.3.1 Net Revenue, 2017-2021
13.12.4 Service Benchmarking
13.12.5 Strategic Outlook
13.13 FUJIFILM Holdings Corporation
13.13.1 Company Snapshot
13.13.2 Company Overview
13.13.3 Financial Analysis
13.13.3.1 Net Revenue, 2017-2021
13.13.3.2 R&D, 2017-2021
13.13.3.3 Regional Market Shares, 2021
13.13.4 Service Benchmarking
13.13.5 Strategic Outlook
13.14 ICON Plc
13.14.1 Company Snapshot
13.14.2 Company Overview
13.14.3 Financial Analysis
13.14.3.1 Net Revenue, 2018-2022
13.14.3.2 R&D, 2017-2021
13.14.3.3 Regional Market Shares, 2022
13.14.4 Service Benchmarking
13.14.5 Strategic Outlook
13.15 Abnova Corporation
13.15.1 Company Snapshot
13.15.2 Company Overview
13.15.3 Service Benchmarking
13.16 Vetter Pharma
13.16.1 Company Snapshot
13.16.2 Company Overview
13.16.3 Service Benchmarking
13.16.4 Strategic Outlook
13.17 Aenova Group
13.17.1 Company Snapshot
13.17.2 Company Overview
13.17.3 Financial Analysis
13.17.3.1 Net Revenue, 2017-2021
13.17.3.2 Regional Market Shares, 2021
13.17.4 Service Benchmarking
13.17.5 Strategic Outlook
13.18 Almac Group
13.18.1 Company Snapshot
13.18.2 Company Overview
13.18.3 Service Benchmarking
13.18.4 Strategic Outlook
13.19 Nipro Pharma Corporation
13.19.1 Company Snapshot
13.19.2 Company Overview
13.19.3 Financial Analysis
13.19.3.1 Net Revenue, 2018-2022
13.19.3.2 R&D, 2018-2022
13.19.3.3 Regional Market Shares, 2022
13.19.4 Service Benchmarking
13.19.5 Strategic Outlook
13.20 Jubilant Pharmova Limited
13.20.1 Company Snapshot
13.20.2 Company Overview
13.20.3 Financial Analysis
13.20.3.1 Net Revenue, 2018-2022
13.20.3.2 R&D, 2018-2022
13.20.3.3 Regional Market Shares, 2022
13.20.4 Service Benchmarking
13.20.5 Strategic Outlook
13.21 Grifols, S.A.
13.21.1 Company Snapshot
13.21.2 Company Overview
13.21.3 Financial Analysis
13.21.3.1 Net Revenue, 2018-2022
13.21.3.2 R&D, 2018-2022
13.21.3.3 Regional Market Shares, 2022
13.21.4 Service Benchmarking
13.21.5 Strategic Outlook
13.22 Pfizer Inc.
13.22.1 Company Snapshot
13.22.2 Company Overview
13.22.3 Financial Analysis
13.22.3.1 Net Revenue, 2018-2022
13.22.3.2 R&D, 2018-2022
13.22.3.3 Regional Market Shares, 2022
13.22.4 Service Benchmarking
13.22.5 Strategic Outlook
13.23 Charles River Laboratories
13.23.1 Company Snapshot
13.23.2 Company Overview
13.23.3 Financial Analysis
13.23.3.1 Net Revenue, 2017-2021
13.23.3.2 Regional Market Shares, 2021
13.23.4 Service Benchmarking
13.23.5 Strategic Outlook
13.24 IQVIA Inc.
13.24.1 Company Snapshot
13.24.2 Company Overview
13.24.3 Financial Analysis
13.24.3.1 Net Revenue, 2018-2022
13.24.3.2 R&D, 2018-2022
13.24.3.3 Regional Market Shares, 2022
13.24.4 Service Benchmarking
13.24.5 Strategic Outlook
13.25 Baxter
13.25.1 Company Snapshot
13.25.2 Company Overview
13.25.3 Financial Analysis
13.25.3.1 Net Revenue, 2018-2022
13.25.3.2 R&D, 2018-2022
13.25.3.3 Regional Market Shares, 2022
13.25.4 Service Benchmarking
14 Conclusion and Recommendations
14.1 Concluding Remarks from Visiongain
14.2 Recommendations for Market Players
ページTOPに戻る
List of Tables/Graphs
List of Tables
Table 1 Pharmaceutical Contract Manufacturing Market Snapshot, 2022 & 2033 (US$bn, CAGR %)
Table 2 Pharmaceutical Contract Manufacturing Market by Region, 2023-2033 (US$bn, AGR (%), CAGR(%)): “V” Shaped Recovery Scenario
Table 3 Pharmaceutical Contract Manufacturing Market by Region, 2023-2033 (US$bn, AGR (%), CAGR(%)): “U” Shaped Recovery Scenario
Table 4 Pharmaceutical Contract Manufacturing Market by Region, 2023-2033 (US$bn, AGR (%), CAGR(%)): “W” Shaped Recovery Scenario
Table 5 Pharmaceutical Contract Manufacturing Market by Region, 2023-2033 (US$bn, AGR (%), CAGR(%)): “L” Shaped Recovery Scenario
Table 6 Pharmaceutical Contract Manufacturing Market Forecast by Services, 2023-2033 (US$ bn, AGR%, CAGR%)
Table 7 Pharmaceutical Manufacturing Services Segment Market Forecast by Region, 2023-2033 (US$ bn, AGR%, CAGR%)
Table 8 Pharmaceutical API Manufacturing Services Segment Market Forecast by Region, 2023-2033 (US$ bn, AGR%, CAGR%)
Table 9 Pharmaceutical FDF Manufacturing Services Segment Market Forecast by Region, 2023-2033 (US$ bn, AGR%, CAGR%)
Table 10 Parenteral/Injectable Manufacturing Services Segment Market Forecast by Region, 2023-2033 (US$ bn, AGR%, CAGR%)
Table 11 Tablet Manufacturing Services Segment Market Forecast by Region, 2023-2033 (US$ bn, AGR%, CAGR%)
Table 12 Capsule Manufacturing Services Segment Market Forecast by Region, 2023-2033 (US$ bn, AGR%, CAGR%)
Table 13 Oral Liquid Manufacturing Services Segment Market Forecast by Region, 2023-2033 (US$ bn, AGR%, CAGR%)
Table 14 Semi-solid Manufacturing Services Segment Market Forecast by Region, 2023-2033 (US$ bn, AGR%, CAGR%)
Table 15 Other Formulation Manufacturing Services Segment Market Forecast by Region, 2023-2033 (US$ bn, AGR%, CAGR%)
Table 16 Drug Development Services Market Forecast by Region, 2023-2033 (US$ bn, AGR%, CAGR%)
Table 17 Lead Identification & Candidate Optimization Market Forecast by Region, 2023-2033 (US$ bn)
Table 18 Target Identification & Screening Market Forecast by Region, 2023-2033 (US$ bn)
Table 19 Target Validation & Functional Informatics Market Forecast by Region, 2023-2033 (US$ bn)
Table 20 Other Services Market Forecast by Region, 2023-2033 (US$ bn)
Table 21 Biologics Manufacturing Services Segment Market Forecast by Region, 2023-2033 (US$ bn, AGR%, CAGR%)
Table 22 Biologics API Manufacturing Services Segment Market Forecast by Region, 2023-2033 (US$ bn, AGR%, CAGR%)
Table 23 Biologics FDF Manufacturing Services Segment Market Forecast by Region, 2023-2033 (US$ bn, AGR%, CAGR%)
Table 24 Pharmaceutical Contract Manufacturing Market by End-users, 2023-2033 (US$ bn, AGR%, CAGR%)
Table 25 Big Pharmaceutical Companies Market Forecast by Region, 2023-2033 (US$ bn, AGR%, CAGR%)
Table 26 Small & Medium-Sized Pharmaceutical Companies Market Forecast by Region, 2023-2033 (US$ bn, AGR%, CAGR%)
Table 27 Generic Pharmaceutical Companies Market Forecast by Region, 2023-2033 (US$ bn, AGR%, CAGR%)
Table 28 Other End Users Pharmaceutical Companies Market Forecast by Region, 2023-2033 (US$ bn, AGR%, CAGR%)
Table 29 Pharmaceutical Contract Manufacturing Market Forecast by Drug Type, 2023-2033 (US$ bn, AGR%, CAGR%)
Table 30 Branded Market Forecast by Region, 2023-2033 (US$ bn, AGR%, CAGR%)
Table 31 Generic Market Forecast by Region, 2023-2033 (US$ bn, AGR%, CAGR%)
Table 32 Pharmaceutical Contract Manufacturing Market by Region, 2023-2033 (US$bn, AGR (%), CAGR (%))
Table 33 North America Pharmaceutical Contract Manufacturing Market Forecast by Services, 2023-2033 (US$ bn, AGR%, CAGR%)
Table 34 North America Pharmaceutical Contract Manufacturing Market Forecast by End-users 2023-2033 (US$ bn, AGR%, CAGR%)
Table 35 North America Pharmaceutical Contract Manufacturing Market Forecast by Drug Type, 2023-2033 (US$ bn, AGR%, CAGR%)
Table 36 North America Pharmaceutical Contract Manufacturing Market Forecast by Country, 2023-2033 (US$ bn, AGR%, CAGR%)
Table 37 U.S. Pharmaceutical Contract Manufacturing Market Forecast, 2023-2033 (US$ bn, AGR%, CAGR%)
Table 38 Canada Pharmaceutical Contract Manufacturing Market Forecast, 2023-2033 (US$ bn, AGR%, CAGR%)
Table 39 Europe Pharmaceutical Contract Manufacturing Market Forecast by Country, 2023-2033 (US$ bn, AGR%, CAGR%)
Table 40 Europe Pharmaceutical Contract Manufacturing Market Forecast by Services, 2023-2033 (US$ bn, AGR%, CAGR%)
Table 41 Europe Pharmaceutical Contract Manufacturing Market Forecast by End-users, 2023-2033 (US$ bn, AGR%, CAGR%)
Table 42 Europe Pharmaceutical Contract Manufacturing Market Forecast by Drug Type, 2023-2033 (US$ bn, AGR%, CAGR%)
Table 43 Germany Pharmaceutical Contract Manufacturing Market Forecast, 2023-2033 (US$ bn, AGR%, CAGR%)
Table 44 UK Pharmaceutical Contract Manufacturing Market Forecast, 2023-2033 (US$ bn, AGR%, CAGR%)
Table 45 France Pharmaceutical Contract Manufacturing Market Forecast, 2023-2033 (US$ bn, AGR%, CAGR%)
Table 46 Italy Pharmaceutical Contract Manufacturing Market Forecast, 2023-2033 (US$ bn, AGR%, CAGR%)
Table 47 Spain Pharmaceutical Contract Manufacturing Market Forecast, 2023-2033 (US$ bn, AGR%, CAGR%)
Table 48 Switzerland Pharmaceutical Contract Manufacturing Market Forecast, 2023-2033 (US$ bn, AGR%, CAGR%)
Table 49 Rest of Europe Pharmaceutical Contract Manufacturing Market Forecast, 2023-2033 (US$ bn, AGR%, CAGR%)
Table 50 Asia Pacific Pharmaceutical Contract Manufacturing Market Forecast by Country, 2023-2033 (US$ bn, AGR%, CAGR%)
Table 51 Asia Pacific Pharmaceutical Contract Manufacturing Market Forecast by Services, 2023-2033 (US$ bn, AGR%, CAGR%)
Table 52 Asia Pacific Pharmaceutical Contract Manufacturing Market Forecast by End-users, 2023-2033 (US$ bn, AGR%, CAGR%)
Table 53 Asia Pacific Pharmaceutical Contract Manufacturing Market Forecast by Drug Type, 2023-2033 (US$ bn, AGR%, CAGR%)
Table 54 Japan Pharmaceutical Contract Manufacturing Market Forecast, 2023-2033 (US$ bn, AGR%, CAGR%)
Table 55 China Pharmaceutical Contract Manufacturing Market Forecast, 2023-2033 (US$ bn, AGR%, CAGR%)
Table 56 India Pharmaceutical Contract Manufacturing Market Forecast, 2023-2033 (US$ bn, AGR%, CAGR%)
Table 57 Australia Pharmaceutical Contract Manufacturing Market Forecast, 2023-2033 (US$ bn, AGR%, CAGR%)
Table 58 South Korea Pharmaceutical Contract Manufacturing Market Forecast, 2023-2033 (US$ bn, AGR%, CAGR%)
Table 59 Rest of Asia Pacific Pharmaceutical Contract Manufacturing Market Forecast, 2023-2033 (US$ bn, AGR%, CAGR%)
Table 60 Latin America Pharmaceutical Contract Manufacturing Market Forecast by Country, 2023-2033 (US$ bn, AGR%, CAGR%)
Table 61 Latin America Pharmaceutical Contract Manufacturing Market Forecast by Services, 2023-2033 (US$ bn, AGR%, CAGR%)
Table 62 Latin America Pharmaceutical Contract Manufacturing Market Forecast by End-users, 2023-2033 (US$ bn, AGR%, CAGR%)
Table 63 Latin America Pharmaceutical Contract Manufacturing Market Forecast by Drug Type, 2023-2033 (US$ bn, AGR%, CAGR%)
Table 64 Brazil Pharmaceutical Contract Manufacturing Market Forecast, 2023-2033 (US$ bn, AGR%, CAGR%)
Table 65 Mexico Pharmaceutical Contract Manufacturing Market Forecast, 2023-2033 (US$ bn, AGR%, CAGR%)
Table 66 Rest of Latin America Pharmaceutical Contract Manufacturing Market Forecast, 2023-2033 (US$ bn, AGR%, CAGR%)
Table 67 MEA Pharmaceutical Contract Manufacturing Market Forecast by Country, 2023-2033 (US$ bn, AGR%, CAGR%)
Table 68 MEA Pharmaceutical Contract Manufacturing Market Forecast by Services, 2023-2033 (US$ bn, AGR%, CAGR%)
Table 69 MEA Pharmaceutical Contract Manufacturing Market Forecast by End-users, 2023-2033 (US$ bn, AGR%, CAGR%)
Table 70 MEA Pharmaceutical Contract Manufacturing Market Forecast by Drug Type, 2023-2033 (US$ bn, AGR%, CAGR%)
Table 71 GCC Pharmaceutical Contract Manufacturing Market Forecast, 2023-2033 (US$ bn, AGR%, CAGR%)
Table 72 South Africa Pharmaceutical Contract Manufacturing Market Forecast, 2023-2033 (US$ bn, AGR%, CAGR%)
Table 73 Rest of MEA Pharmaceutical Contract Manufacturing Market Forecast, 2023-2033 (US$ bn, AGR%, CAGR%)
Table 74 Lonza: Key Details, (CEO, HQ, Revenue, Founded, No. of Employees, Company Type, Website, Business Segment)
Table 75 Lonza: Service Benchmarking
Table 76 Lonza: Strategic Outlook
Table 77 Catalent, Inc: Key Details, (CEO, HQ, Revenue, Founded, No. of Employees, Company Type, Website, Business Segment)
Table 78 Catalent, Inc: Service Benchmarking
Table 79 Catalent, Inc: Strategic Outlook
Table 80 Recipharm AB: Key Details, (CEO, HQ, Revenue, Founded, No. of Employees, Company Type, Website, Business Segment)
Table 81 Recipharm AB: Service Benchmarking
Table 82 Recipharm AB: Strategic Outlook
Table 83 AbbVie Inc.: Key Details, (CEO, HQ, Revenue, Founded, No. of Employees, Company Type, Website, Business Segment)
Table 84 AbbVie Inc.: Service Benchmarking
Table 85 AbbVie Inc.: Strategic Outlook
Table 86 Thermo Fisher Scientific.: Key Details, (CEO, HQ, Revenue, Founded, No. of Employees, Company Type, Website, Business Segment)
Table 87 Thermo Fisher Scientific.: Service Benchmarking
Table 88 Thermo Fisher Scientific Inc.: Strategic Outlook
Table 89 Siegfried Holding AG: Key Details, (CEO, HQ, Revenue, Founded, No. of Employees, Company Type, Website, Business Segment)
Table 90 Siegfried Holding AG: Service Benchmarking
Table 91 Siegfried Holding AG: Strategic Outlook
Table 92 Evonik Industries: Key Details, (CEO, HQ, Revenue, Founded, No. of Employees, Company Type, Website, Business Segment)
Table 93 Evonik Industries: Service Benchmarking
Table 94 Evonik Industries: Strategic Outlook
Table 95 Boehringer Ingelheim International GmbH: Key Details, (CEO, HQ, Revenue, Founded, No. of Employees, Company Type, Website, Business Segment)
Table 96 Boehringer Ingelheim International GmbH: Service Benchmarking
Table 97 Boehringer Ingelheim International GmbH: Strategic Outlook
Table 98 Piramal Pharma Solutions: Key Details, (CEO, HQ, Revenue, Founded, No. of Employees, Company Type, Website, Business Segment)
Table 99 Piramal Pharma Solutions: Service Benchmarking
Table 100 Piramal Pharma Solutions: Strategic Outlook
Table 101 Samsung Biologics: Key Details, (CEO, HQ, Revenue, Founded, No. of Employees, Company Type, Website, Business Segment)
Table 102 Samsung Biologics: Service Benchmarking
Table 103 Samsung Biologics: Strategic Outlook
Table 104 WuXi AppTec: Key Details, (CEO, HQ, Founded, No. of Employees, Company Type, Website, Business Segment)
Table 105 WuXi AppTec: Service Benchmarking
Table 106 WuXi AppTec: Strategic Outlook
Table 107 FUJIFILM Holdings Corporation: Key Details, (CEO, HQ, Revenue, Founded, No. of Employees, Company Type, Website, Business Segment)
Table 108 FUJIFILM Holdings Corporation: Service Benchmarking
Table 109 FUJIFILM Holdings Corporation: Strategic Outlook
Table 110 ICON Plc: Key Details, (CEO, HQ, Revenue, Founded, No. of Employees, Company Type, Website, Business Segment)
Table 111 ICON Plc. Service Benchmarking
Table 112 ICON Plc.: Strategic Outlook
Table 113 Abnova Corporation: Key Details, (CEO, HQ, Revenue, Founded, No. of Employees, Company Type, Website, Business Segment)
Table 114 Abnova Corporation: Service Benchmarking
Table 115 Vetter Pharma: Key Details, (CEO, HQ, Revenue, Founded, No. of Employees, Company Type, Website, Business Segment)
Table 116 Vetter Pharma: Service Benchmarking
Table 117 Vetter Pharma: Strategic Outlook
Table 118 Aenova Group: Key Details, (CEO, HQ, Revenue, Founded, No. of Employees, Company Type, Website, Business Segment)
Table 119 Aenova Group: Service Benchmarking
Table 120 Aenova Group: Strategic Outlook
Table 121 Almac Group: Key Details, (CEO, HQ, Revenue, Founded, No. of Employees, Company Type, Website, Business Segment)
Table 122 Almac Group: Service Benchmarking
Table 123 Almac Group: Strategic Outlook
Table 124 Nipro Pharma Corporation: Key Details, (CEO, HQ, Revenue, Founded, No. of Employees, Company Type, Website, Business Segment)
Table 125 Nipro Pharma Corporation: Service Benchmarking
Table 126 Nipro Pharma Corporation: Strategic Outlook
Table 127 Jubilant Pharmova Limited: Key Details, (CEO, HQ, Revenue, Founded, No. of Employees, Company Type, Website, Business Segment)
Table 128 Jubilant Pharmova Limited: Service Benchmarking
Table 129 Jubilant Pharmova Limited: Strategic Outlook
Table 130 Grifols, S.A.: Key Details, (CEO, HQ, Revenue, Founded, No. of Employees, Company Type, Website, Business Segment)
Table 131 Grifols, S.A: Service Benchmarking
Table 132 Grifols, S.A: Strategic Outlook
Table 133 Pfizer Inc.: Key Details, (CEO, HQ, Revenue, Founded, No. of Employees, Company Type, Website, Business Segment)
Table 134 Pfizer Inc.: Service Benchmarking
Table 135 Pfizer Inc.: Strategic Outlook
Table 136 Charles River Laboratories: Key Details, (CEO, HQ, Revenue, Founded, No. of Employees, Company Type, Website, Business Segment)
Table 137 Charles River Laboratories: Service Benchmarking
Table 138 Charles River Laboratories: Strategic Outlook
Table 139 IQVIA Inc.: Key Details, (CEO, HQ, Revenue, Founded, No. of Employees, Company Type, Website, Business Segment)
Table 140 IQVIA Inc.: Service Benchmarking
Table 141 IQVIA Inc.: Strategic Outlook
Table 142 Baxter: Key Details, (CEO, HQ, Revenue, Founded, No. of Employees, Company Type, Website, Business Segment)
Table 143 Baxter: Service Benchmarking
List of Figures
Figure 1 Pharmaceutical Contract Manufacturing Market Segmentation
Figure 2 Pharmaceutical Contract Manufacturing Market: Market Dynamics
Figure 3 Pharmaceutical Contract Manufacturing Market by Region, 2023-2033 (US$ bn, AGR %): “V” Shaped Recovery
Figure 4 Pharmaceutical Contract Manufacturing Market by Region, 2023-2033 (US$ bn, AGR %): “U” Shaped Recovery
Figure 5 Pharmaceutical Contract Manufacturing Market by Region, 2023-2033 (US$ bn, AGR %): “W” Shaped Recovery
Figure 6 Pharmaceutical Contract Manufacturing Market by Region, 2023-2033 (US$ bn, AGR %): “L” Shaped Recovery
Figure 7 Pharmaceutical Contract Manufacturing Market: Porter’s Five Forces Analysis
Figure 8 Pharmaceutical Contract Manufacturing Market: PEST Analysis
Figure 9 Pharmaceutical Contract Manufacturing Market: SWOT Analysis
Figure 10 Pharmaceutical Contract Manufacturing Market Forecast by Services 2023 (Revenue, CAGR%)
Figure 11 Pharmaceutical Contract Manufacturing Market Forecast by Services, 2023-2033 (US$ bn)
Figure 12 Pharmaceutical Contract Manufacturing Market Share Forecast by Services, 2023, 2028, 2033 (%)
Figure 13 Pharmaceutical Manufacturing Services Segment Market Forecast by Region, 2023-2033 (US$ bn)
Figure 14 Pharmaceutical Manufacturing Services Segment Market Share Forecast by Region, 2023 & 2033 (%)
Figure 15 Pharmaceutical API Manufacturing Services Segment Market Forecast by Region, 2023-2033 (US$ bn)
Figure 16 Pharmaceutical API Manufacturing Services Segment Market Share Forecast by Region, 2023 & 2033 (%)
Figure 17 Pharmaceutical FDF Manufacturing Services Segment Market Forecast by Region, 2023-2033 (US$ bn)
Figure 18 Pharmaceutical FDF Manufacturing Services Segment Market Share Forecast by Region, 2023 & 2033 (%)
Figure 19 Parenteral/Injectable Manufacturing Services Segment Market Forecast by Region, 2023-2033 (US$ bn)
Figure 20 Parenteral/Injectable Manufacturing Services Segment Market Share Forecast by Region, 2023 & 2033 (%)
Figure 21 Tablet Manufacturing Services Segment Market Forecast by Region, 2023-2033 (US$ bn)
Figure 22 Tablet Manufacturing Services Segment Market Share Forecast by Region, 2023 & 2033 (%)
Figure 23 Capsule Manufacturing Services Segment Market Forecast by Region, 2023-2033 (US$ bn)
Figure 24 Capsule Manufacturing Services Segment Market Share Forecast by Region, 2023 & 2033 (%)
Figure 25 Oral Liquid Manufacturing Services Segment Market Forecast by Region, 2023-2033 (US$ bn)
Figure 26 Oral Liquid Manufacturing Services Segment Market Share Forecast by Region, 2023 & 2033 (%)
Figure 27 Semi-solid Manufacturing Services Segment Market Forecast by Region, 2023-2033 (US$ bn)
Figure 28 Semi-solid Manufacturing Services Segment Market Share Forecast by Region, 2023 & 2033 (%)
Figure 29 Other Formulation Manufacturing Services Segment Market Forecast by Region, 2023-2033 (US$ bn)
Figure 30 Other Formulation Manufacturing Services Segment Market Share Forecast by Region, 2023 & 2033 (%)
Figure 31 Drug Development Services Market Forecast by Region, 2023-2033 (US$ bn)
Figure 32 Drug Development Services Market Share Forecast by Region, 2023 & 2033 (%)
Figure 33 Lead Identification & Candidate Optimization Market Forecast by Region, 2023-2033 (US$ bn)
Figure 34 Lead Identification & Candidate Optimization Market Share Forecast by Region, 2023 & 2033 (%)
Figure 35 Target Identification & Screening Market Forecast by Region, 2023-2033 (US$ bn)
Figure 36 Target Identification & Screening Market Share Forecast by Region, 2023 & 2033 (%)
Figure 37 Target Validation & Functional Informatics Market Forecast by Region, 2023-2033 (US$ bn)
Figure 38 Target Validation & Functional Informatics Market Share Forecast by Region, 2023 & 2033 (%)
Figure 39 Other Services Market Forecast by Region, 2023-2033 (US$ bn)
Figure 40 Other Services Market Share Forecast by Region, 2023 & 2033 (%)
Figure 41 Biologics Manufacturing Services Segment Market Forecast by Region, 2023-2033 (US$ bn)
Figure 42 Biologics Manufacturing Services Segment Market Share Forecast by Region, 2023 & 2033 (%)
Figure 43 Biologics API Manufacturing Services Segment Market Forecast by Region, 2023-2033 (US$ bn)
Figure 44 Biologics API Manufacturing Services Segment Market Share Forecast by Region, 2023 & 2033 (%)
Figure 45 Biologics FDF Manufacturing Services Segment Market Forecast by Region, 2023-2033 (US$ bn)
Figure 46 Biologics FDF Manufacturing Services Segment Market Share Forecast by Region, 2023 & 2033 (%)
Figure 47 Pharmaceutical Contract Manufacturing Market by End-users 2023 (Revenue, CAGR%)
Figure 48 Pharmaceutical Contract Manufacturing Market by End-users, 2023-2033 (US$ bn)
Figure 49 Pharmaceutical Contract Manufacturing Market Share Forecast by End-users, 2023, 2028, 2033 (%)
Figure 50 Big Pharmaceutical Companies Market Forecast by Region, 2023-2033 (US$ bn)
Figure 51 Big Pharmaceutical Companies Market Share Forecast by Region, 2023 & 2033 (%)
Figure 52 Small & Medium-Sized Pharmaceutical Companies Market Forecast by Region, 2023-2033 (US$ bn)
Figure 53 Small & Medium-Sized Pharmaceutical Companies Market Share Forecast by Region, 2023 & 2033 (%)
Figure 54 Generic Pharmaceutical Companies Market Forecast by Region, 2023-2033 (US$ bn)
Figure 55 Generic Pharmaceutical Companies Market Share Forecast by Region, 2023 & 2033 (%)
Figure 56 Other End Users Pharmaceutical Companies Market Forecast by Region, 2023-2033 (US$ bn)
Figure 57 Other End Users Pharmaceutical Companies Market Share Forecast by Region, 2023 & 2033 (%)
Figure 58 Pharmaceutical Contract Manufacturing Market Forecast by Drug Type 2023 (Revenue, CAGR%)
Figure 59 Pharmaceutical Contract Manufacturing Market Forecast by Drug Type, 2023-2033 (US$ bn)
Figure 60 Pharmaceutical Contract Manufacturing Market Share Forecast by Drug Type, 2023, 2028, 2033 (%)
Figure 61 Branded Market Forecast by Region, 2023-2033 (US$ bn)
Figure 62 Branded Market Share Forecast by Region, 2023 & 2033 (%)
Figure 63 Generic Market Forecast by Region, 2023-2033 (US$ bn)
Figure 64 Generic Market Share Forecast by Region, 2023 & 2033 (%)
Figure 65 Pharmaceutical Contract Manufacturing Market Forecast by Region 2023, 2028, 2033 (Revenue, CAGR%)
Figure 66 Pharmaceutical Contract Manufacturing Market Share Forecast by Region 2023, 2028, 2033(%)
Figure 67 Pharmaceutical Contract Manufacturing Market by Region, 2023-2033 (US$ bn, AGR %)
Figure 68 North America Pharmaceutical Contract Manufacturing Market Attractiveness Index
Figure 69 North America Pharmaceutical Contract Manufacturing Market Forecast by Services, 2023-2033 (US$ bn)
Figure 70 North America Pharmaceutical Contract Manufacturing Market Share Forecast by Services, 2023 & 2033 (%)
Figure 71 North America Pharmaceutical Contract Manufacturing Market Forecast by End-users, 2023-2033 (US$ bn)
Figure 72 North America Pharmaceutical Contract Manufacturing Market Share Forecast by End-users, 2023 & 2033 (%)
Figure 73 North America Pharmaceutical Contract Manufacturing Market Forecast by Drug Type, 2023-2033 (US$ bn)
Figure 74 North America Pharmaceutical Contract Manufacturing Market Share Forecast by Drug Type, 2023 & 2033 (%)
Figure 75 North America Pharmaceutical Contract Manufacturing Market Forecast by Country, 2023-2033 (US$ bn)
Figure 76 North America Pharmaceutical Contract Manufacturing Market Share Forecast by Country, 2023 & 2033 (%)
Figure 77 U.S. Pharmaceutical Contract Manufacturing Market Forecast, 2023-2033 (US$ bn, AGR %)
Figure 78 Canada Pharmaceutical Contract Manufacturing Market Forecast, 2023-2033 (US$ bn, AGR %)
Figure 79 Europe Pharmaceutical Contract Manufacturing Market Attractiveness Index
Figure 80 Europe Pharmaceutical Contract Manufacturing Market Forecast by Country, 2023-2033 (US$ bn)
Figure 81 Europe Pharmaceutical Contract Manufacturing Market Share Forecast by Country, 2023 & 2033 (%)
Figure 82 Europe Pharmaceutical Contract Manufacturing Market Forecast by Service, 2023-2033 (US$ bn)
Figure 83 Europe Pharmaceutical Contract Manufacturing Market Share Forecast by Services, 2023 & 2033 (%)
Figure 84 Europe Pharmaceutical Contract Manufacturing Market Forecast by End-users, 2023-2033 (US$ bn)
Figure 85 Europe Pharmaceutical Contract Manufacturing Market Share Forecast by End-users, 2023 & 2033 (%)
Figure 86 Europe Pharmaceutical Contract Manufacturing Market Forecast by Drug Type, 2023-2033 (US$ bn)
Figure 87 Europe Pharmaceutical Contract Manufacturing Market Share Forecast by Drug Type, 2023 & 2033(%)
Figure 88 Germany Pharmaceutical Contract Manufacturing Market Forecast, 2023-2033 (US$ bn, AGR %)
Figure 89 UK Pharmaceutical Contract Manufacturing Market Forecast, 2023-2033 (US$ bn, AGR %)
Figure 90 France Pharmaceutical Contract Manufacturing Market Forecast, 2023-2033 (US$ bn, AGR %)
Figure 91 Italy Pharmaceutical Contract Manufacturing Market Forecast, 2023-2033 (US$ bn, AGR %)
Figure 92 Spain Pharmaceutical Contract Manufacturing Market Forecast, 2023-2033 (US$ bn, AGR %)
Figure 93 Switzerland Pharmaceutical Contract Manufacturing Market Forecast, 2023-2033 (US$ bn, AGR %)
Figure 94 Rest of Europe Pharmaceutical Contract Manufacturing Market Forecast, 2023-2033 (US$ bn, AGR %)
Figure 95 Asia Pacific Pharmaceutical Contract Manufacturing Market Attractiveness Index
Figure 96 Asia Pacific Pharmaceutical Contract Manufacturing Market Forecast by Country, 2023-2033 (US$ bn)
Figure 97 Asia Pacific Pharmaceutical Contract Manufacturing Market Share Forecast by Country, 2023 & 2033 (%)
Figure 98 Asia Pacific Pharmaceutical Contract Manufacturing Market Forecast by Services, 2023-2033 (US$ bn)
Figure 99 Asia Pacific Pharmaceutical Contract Manufacturing Market Share Forecast by Services, 2023 & 2033 (%)
Figure 100 Asia Pacific Pharmaceutical Contract Manufacturing Market Forecast by End-users, 2023-2033 (US$ bn)
Figure 101 Asia Pacific Pharmaceutical Contract Manufacturing Market Share Forecast by End-users, 2023 & 2033 (%)
Figure 102 Asia Pacific Pharmaceutical Contract Manufacturing Market Forecast by Drug Type, 2023-2033 (US$ bn)
Figure 103 Asia Pacific Pharmaceutical Contract Manufacturing Market Share Forecast by Drug Type, 2023 & 2033 (%)
Figure 104 Japan Pharmaceutical Contract Manufacturing Market Forecast, 2023-2033 (US$ bn, AGR %)
Figure 105 China Pharmaceutical Contract Manufacturing Market Forecast, 2023-2033 (US$ bn, AGR %)
Figure 106 India Pharmaceutical Contract Manufacturing Market Forecast, 2023-2033 (US$ bn, AGR %)
Figure 107 Australia Pharmaceutical Contract Manufacturing Market Forecast, 2023-2033 (US$ bn, AGR %)
Figure 108 South Korea Pharmaceutical Contract Manufacturing Market Forecast, 2023-2033 (US$ bn, AGR %)
Figure 109 Rest of Asia Pacific Pharmaceutical Contract Manufacturing Market Forecast, 2023-2033 (US$ bn, AGR %)
Figure 110 Latin America Pharmaceutical Contract Manufacturing Market Attractiveness Index
Figure 111 Latin America Pharmaceutical Contract Manufacturing Market Forecast by Country, 2023-2033 (US$ bn)
Figure 112 Latin America Pharmaceutical Contract Manufacturing Market Share Forecast by Country, 2023 & 2033 (%)
Figure 113 Latin America Pharmaceutical Contract Manufacturing Market Forecast by Services, 2023-2033 (US$ bn)
Figure 114 Latin America Pharmaceutical Contract Manufacturing Market Share Forecast by Services, 2023 & 2033 (%)
Figure 115 Latin America Pharmaceutical Contract Manufacturing Market Forecast by End-users, 2023-2033 (US$ bn)
Figure 116 Latin America Pharmaceutical Contract Manufacturing Market Share Forecast by End-users, 2023 & 2033 (%)
Figure 117 Latin America Pharmaceutical Contract Manufacturing Market Forecast by Drug Type, 2023-2033 (US$ bn)
Figure 118 Latin America Pharmaceutical Contract Manufacturing Market Share Forecast by Drug Type, 2023 & 2033 (%)
Figure 119 Brazil Pharmaceutical Contract Manufacturing Market Forecast, 2023-2033 (US$ bn, AGR %)
Figure 120 Mexico Pharmaceutical Contract Manufacturing Market Forecast, 2023-2033 (US$ bn, AGR %)
Figure 121 Rest of Latin America Pharmaceutical Contract Manufacturing Market Forecast, 2023-2033 (US$ bn, AGR %)
Figure 122 MEA Pharmaceutical Contract Manufacturing Market Attractiveness Index
Figure 123 MEA Pharmaceutical Contract Manufacturing Market by Region, 2023, 2028 & 2033 (US$ bn)
Figure 124 MEA Pharmaceutical Contract Manufacturing Market Forecast by Country, 2023-2033 (US$ bn)
Figure 125 MEA Pharmaceutical Contract Manufacturing Market Share Forecast by Country, 2023 & 2033 (%)
Figure 126 MEA Pharmaceutical Contract Manufacturing Market Forecast by Services, 2023-2033 (US$ bn)
Figure 127 MEA Pharmaceutical Contract Manufacturing Market Share Forecast by Services, 2023 & 2033 (%)
Figure 128 MEA Pharmaceutical Contract Manufacturing Market Forecast by End-users, 2023-2033 (US$ bn)
Figure 129 MEA Pharmaceutical Contract Manufacturing Market Share Forecast by End-users, 2023 & 2033 (%)
Figure 130 MEA Pharmaceutical Contract Manufacturing Market Forecast by Drug Type, 2023-2033 (US$ bn)
Figure 131 MEA Pharmaceutical Contract Manufacturing Market Share Forecast by Drug Type, 2023 & 2033 (%)
Figure 132 GCC Pharmaceutical Contract Manufacturing Market Forecast, 2023-2033 (US$ bn, AGR %)
Figure 133 South Africa Pharmaceutical Contract Manufacturing Market Forecast, 2023-2033 (US$ bn, AGR %)
Figure 134 Rest of MEA Pharmaceutical Contract Manufacturing Market Forecast, 2023-2033 (US$ bn, AGR %)
Figure 135 Pharmaceutical Contract Manufacturing Market: Company Share, 2022
Figure 136 Lonza: Net Revenue, 2018-2022 (US$ million, AGR%)
Figure 137 Catalent, Inc: Net Revenue, 2018-2022 (US$ million, AGR%)
Figure 138 Catalent, Inc: Regional Market Shares, 2022
Figure 139 Recipharm AB: Net Revenue, 2017-2021 (US$ million, AGR%)
Figure 140 AbbVie Inc.: Net Revenue, 2018-2022 (US$ million, AGR%)
Figure 141 AbbVie Inc.: R&D, 2018-2022 (US$ million, AGR%)
Figure 142 AbbVie Inc.: Regional Market Shares, 2022
Figure 143 Thermo Fisher Scientific.: Net Revenue, 2017-2021 (US$ million, AGR%)
Figure 144 Thermo Fisher Scientific.: R&D, 2017-2021 (US$ million, AGR%)
Figure 145 Thermo Fisher Scientific.: Regional Market Shares, 2021
Figure 146 Siegfried Holding AG: Net Revenue, 2018-2022 (US$ million, AGR%)
Figure 147 Siegfried Holding AG: R&D, 2018-2022 (US$ million, AGR%)
Figure 148 Evonik Industries: Net Revenue, 2018-2022(US$ million, AGR%)
Figure 149 Evonik Industries: R&D, 2018-2022 (US$ million, AGR%)
Figure 150 Evonik Industries: Regional Market Shares, 2022
Figure 151 Boehringer Ingelheim International GmbH: Net Revenue, 2017-2021(US$ million, AGR%)
Figure 152 Boehringer Ingelheim International GmbH: R&D, 2017-2021 (US$ million, AGR%)
Figure 153 Boehringer Ingelheim International GmbH: Regional Market Shares, 2021
Figure 154 Samsung Biologics: Net Revenue, 2017-2021(US$ million, AGR%)
Figure 155 Samsung Biologics: Regional Market Shares, 2021
Figure 156 WuXi AppTec: Net Revenue, 2017-2021 (US$ million, AGR%)
Figure 157 FUJIFILM Holdings Corporation: Net Revenue, 2017-2021 (US$ million, AGR%)
Figure 158 FUJIFILM Holdings Corporation: R&D, 2017-2021 (US$ million, AGR%)
Figure 159 FUJIFILM Holdings Corporation: Regional Market Shares, 2021
Figure 160 ICON Plc: Net Revenue, 2018-2022 (US$ million, AGR%)
Figure 161 ICON Plc: R&D, 2017-2021 (US$ million, AGR%)
Figure 162 ICON Plc: Regional Market Shares, 2022
Figure 163 Aenova Group: Net Revenue, 2017-2021 (US$ million, AGR%)
Figure 164 Aenova Group: Regional Market Shares, 2021
Figure 165 Nipro Pharma Corporation: Net Revenue, 2018-2022 (US$ million, AGR%)
Figure 166 Nipro Pharma Corporation: R&D, 2018-2022 (US$ million, AGR%)
Figure 167 Nipro Pharma Corporation: Regional Market Shares, 2022
Figure 168 Jubilant Pharmova Limited: Net Revenue, 2018-2022 (US$ million, AGR%)
Figure 169 Jubilant Pharmova Limited: R&D, 2018-2022 (US$ million, AGR%)
Figure 170 Jubilant Pharmova Limited: Regional Market Shares, 2022
Figure 171 Grifols, S.A: Net Revenue, 2018-2022 (US$ million, AGR%)
Figure 172 Grifols, S.A: R&D, 2018-2022 (US$ million, AGR%)
Figure 173 Grifols, S.A: Regional Market Shares, 2022
Figure 174 Pfizer Inc: Net Revenue, 2018-2022 (US$ million, AGR%)
Figure 175 Pfizer Inc.: R&D, 2018-2022 (US$ million, AGR%)
Figure 176 Pfizer Inc: Regional Market Shares, 2022
Figure 177 Charles River Laboratories: Net Revenue, 2017-2021 (US$ million, AGR%)
Figure 178 Charles River Laboratories: Regional Market Shares, 2021
Figure 179 IQVIA Inc.: Net Revenue, 2018-2022 (US$ million, AGR%)
Figure 180 IQVIA Inc.: R&D, 2018-2022 (US$ million, AGR%)
Figure 181 IQVIA Inc.: Regional Market Shares, 2022
Figure 182 Baxter: Net Revenue, 2018-2022 (US$ million, AGR%)
Figure 183 Baxter: R&D, 2018-2022 (US$ million, AGR%)
Figure 184 Baxter: Regional Market Shares, 2022
ページTOPに戻る
本レポートと同分野(医療/ヘルスケア)の最新刊レポート
Visiongain社のヘルスケアと医薬・化学品分野での最新刊レポート
本レポートと同じKEY WORD(pharmaceutical)の最新刊レポート
- 本レポートと同じKEY WORDの最新刊レポートはありません。
よくあるご質問
Visiongain社はどのような調査会社ですか?
英国の調査会社ヴィジョンゲイン社(Visiongain)は、通信とエネルギーのほか、自動車や化学・医薬品、金属など、広範な市場を対象に調査を行っています。自動車市場については、市場全般に関する調査のほ... もっと見る
調査レポートの納品までの日数はどの程度ですか?
在庫のあるものは速納となりますが、平均的には 3-4日と見て下さい。
但し、一部の調査レポートでは、発注を受けた段階で内容更新をして納品をする場合もあります。
発注をする前のお問合せをお願いします。
注文の手続きはどのようになっていますか?
1)お客様からの御問い合わせをいただきます。
2)見積書やサンプルの提示をいたします。
3)お客様指定、もしくは弊社の発注書をメール添付にて発送してください。
4)データリソース社からレポート発行元の調査会社へ納品手配します。
5) 調査会社からお客様へ納品されます。最近は、pdfにてのメール納品が大半です。
お支払方法の方法はどのようになっていますか?
納品と同時にデータリソース社よりお客様へ請求書(必要に応じて納品書も)を発送いたします。
お客様よりデータリソース社へ(通常は円払い)の御振り込みをお願いします。
請求書は、納品日の日付で発行しますので、翌月最終営業日までの当社指定口座への振込みをお願いします。振込み手数料は御社負担にてお願いします。
お客様の御支払い条件が60日以上の場合は御相談ください。
尚、初めてのお取引先や個人の場合、前払いをお願いすることもあります。ご了承のほど、お願いします。
データリソース社はどのような会社ですか?
当社は、世界各国の主要調査会社・レポート出版社と提携し、世界各国の市場調査レポートや技術動向レポートなどを日本国内の企業・公官庁及び教育研究機関に提供しております。
世界各国の「市場・技術・法規制などの」実情を調査・収集される時には、データリソース社にご相談ください。
お客様の御要望にあったデータや情報を抽出する為のレポート紹介や調査のアドバイスも致します。
|
|

