バイオ医薬品の受託製造市場レポート:2023-2033
Biopharmaceuticals Contract Manufacturing Market Report 2023-2033
レポート詳細
バイオ医薬品の受託製造市場レポート 2023-2033 : 本レポートは、業界とその基礎となる力学をよりよく理解したい場合、新たな収益ポケットを目指す大手企業にとって貴重なものとなりま... もっと見る
※上記価格は部署ライセンス(Departmental licence)価格です。
その他の価格についてはデータリソースまでお問合せください。
日本語のページは自動翻訳を利用し作成しています。
実際のレポートは英文のみでご納品いたします。

|

|
サマリー
レポート詳細
バイオ医薬品の受託製造市場レポート 2023-2033: 本レポートは、業界とその基礎となる力学をよりよく理解したい場合、新たな収益ポケットを目指す大手企業にとって貴重なものとなります。また、異業種への進出や既存事業の新地域への展開を希望する企業にとっても有益なレポートです。
毎年、新しくユニークな医薬品や技術が登場します。これによって、バイオファーマの働き方が変わり、どのような治療が可能になるのかが変わってきます。これは、アウトソーシングがその能力と自由を与えてくれるからでもある。将来のパイプラインを牽引する新興企業やバーチャル企業は、外部の開発パートナーに大きく依存しており、それは作りにくい製品に限ったことではありません。さらに有名な企業も、CDMOと契約を結び、そのリソースや特定のスキルにアクセスできるようにしている。細胞・遺伝子治療(CGT)では、プロセス開発、分析開発、試験、製造、充填・仕上げなどの化学・製造・管理(CMC)の仕事の多くが外部企業によって行われている。アウトソーシングは、治療薬が市場に出るまでのライフサイクルのほぼすべての時点で行われる可能性があります。
CGTには、高価で入手困難な消耗品や工具、スペース、人材が必要な問題があります。そのため、企業は臨床から商業生産工程までをアウトソーシングすることを考えるようになるかもしれません。大企業は製品を開発し、製造する手段を持っていますが、特殊な分析アッセイやプロセスの仕組みを改善するための研究など、特定の作業で助けを必要とするかもしれません。現在、先進的なバイオ治療薬の開発企業のほとんどを占める中小企業は、社内に開発・製造の能力や経験があまりないため、プロセス開発、プロセスのスケールアップ、製造をアウトソースする傾向があります。
マーケットリサーチレポートを購入する前に、どのような質問をするべきか?
- バイオ医薬品の受託製造市場はどのように進化しているのか?
- バイオ医薬品の受託製造市場を牽引しているもの、抑制しているものは何か?
- バイオ医薬品の受託製造の各サブマーケットセグメントは予測期間中にどのように成長し、2033年にこれらのサブマーケットが占める収益はどの程度になるのでしょうか?
- 2023年から2033年にかけて、バイオ医薬品の受託製造の各サブマーケットの市場シェアはどのように推移するのか?
- 2023年から2033年にかけて、市場全体の主な牽引役となるのは何か?
- バイオ医薬品の受託製造の主要市場は、マクロ経済のダイナミクスに幅広く追随するのか、それとも個々の国内市場が他を凌駕するのか?
- 2033年までに各国市場のシェアはどのように変化し、2033年に市場をリードするのはどの地域か?
- 主要プレイヤーは誰で、予測期間中の見通しはどうなっているのか?
- これらの大手企業のバイオ医薬品の受託製造プロジェクトはどのようなものですか?
- 2023年から2033年の間に、業界はどのように発展していくのか?バイオ医薬品の受託製造プロジェクトは、どのような意味を持つのでしょうか?
現在および今後10年間に実施されるバイオ医薬品の受託製造プロジェクトにはどのような意味があるのか?
- バイオ医薬品の受託製造市場をさらに拡大するために、製品の商業化の必要性は高まっているのでしょうか?
- バイオ医薬品の受託製造市場はどこに向かっているのか、そして市場の最前線に立つためにはどうすればよいのか?
- 新製品やサービスラインに対する最適な投資オプションは何か?
- 企業を新たな成長軌道に乗せ、C-suiteに移行させるための重要な展望は何か?
このことが、現在、そして今後10年間のバイオ医薬品の受託製造市場にどのような影響を与えるかを知る必要があります:
- 358ページにわたる本レポートでは、140の表と167のチャート/グラフを独占的に提供します。
- 本レポートでは、業界における主要な収益性の高い分野を取り上げており、今すぐその分野をターゲットにすることができます。
- 世界、地域、国の売上高と成長率を詳細に分析しています。
- 競合他社が成功した主要なトレンド、変化、収益予測をハイライトしています。
本レポートは、バイオ医薬品の受託製造市場が今後10年間にどのように発展するか、またCOVID-19の景気後退と好転の変動に合わせて、今日あなたにお伝えします。この市場は、過去10年間のどの時点よりも今が重要です。
2033年までの予測やその他の分析により、商業的な展望を明らかにする。
- 今回の調査では、2033年までの収益予測に加え、直近の実績、成長率、市場シェアも掲載しています。
- ビジネスの展望や展開など、独自の分析がご覧いただけます。
- 定性的分析(市場力学、促進要因、機会、阻害要因など)、ポーターのファイブフォース分析、PEST分析、最近の動向をご覧いただけます。
本レポートでは、COVID-19が業界や貴社にどのような影響を与えるかについて、データ分析および貴重な知見を提供しています。COVID-19の4つの回収パターン、すなわち「V」、「L」、「W」、「U」の回収パターンとその影響について考察しています。
報告書の対象セグメント
ソース
- 哺乳類
- 哺乳類以外
サービス
- プロセス開発
- フィル&フィニッシュオペレーション
- 分析・QC試験
- パッケージング
製品
- バイオロジクス
- バイオシミラー
企業規模
- 小規模
- 中規模
- 大規模
事業規模
- 前臨床
- 臨床
- 商業
世界市場全体およびセグメントの収益予測に加え、5つの地域および23の主要国市場の収益予測も掲載しています:
北米
- アメリカ
- カナダ
欧州
- ドイツ
- 英国
- フランス
- イタリア
- スペイン
- ロシア
- その他の欧州地域
アジア太平洋地域
- 日本
- 中国
- インド
- オーストラリア
- 東南アジア
- その他のアジア太平洋地域
ラテンアメリカ
- ブラジル
- メキシコ
- アルゼンチン
- コロンビア
- その他のラテンアメリカ地域
MEA
- GCC
- 南アフリカ
- その他のMEA地域
バイオ医薬品の受託製造市場の2023年から2033年にかけての主要企業のプロファイルと、これらの企業のこのセグメントに焦点を当てたいくつかの企業についても記載しています。
主要企業と市場成長の可能性
・ AbbVie, Inc.
・ AGC Biologics
・ Avantor, Inc.
・ Binex Co., Ltd.
・ Boehringer Ingelheim GmbH
・ Cambrex Corporation
・ Catalent Inc
・ Curia Global, Inc.
・ Cytiva
・ FUJIFILM Diosynth Biotechnologies
・ JRS PHARMA
・ Jubilant Pharma Limited
・ KBI Biopharma
・ Lonza
・ Pfizer CentreOne
・ ProBioGen
・ Rentschler Biopharma SE
・ Samsung Biologics
・ Sandoz
・ TOYOBO CO., LTD.
・ Thermo Fisher Scientific
・ WuXi Biologics
バイオ医薬品の受託製造市場の世界全体の収益、金額ベースで2023年から2033年まで、市場は2023年に15,280.0百万米ドルを突破すると、我々の仕事は計算されます。2033年まで収益が大きく伸びることが予測されます。当社の調査では、最も大きな可能性を秘めた企業を特定しています。彼らの能力、進歩、商業的な展望を発見し、あなたが一歩先を行くのを支援します。
バイオ医薬品の受託製造市場、2023年から2033年までのレポートはどのように役立つのでしょうか?
要約すると、350ページ以上のレポートでは、以下のような知識を得ることができます:
- バイオ医薬品の受託製造市場の2023年から2033年までの収益予測 世界と地域レベルでのソース、サービス、製品、企業規模、事業規模の各予測を掲載 - 業界の展望を発見し、投資と収益に最も有利な場所を見つけることができます。
- 5つの地域と23の主要国市場の2033年までの収益予測 - 北米、欧州、アジア太平洋、ラテンアメリカ、MEAのバイオ医薬品の受託製造市場、2023年から2033年の市場予測をご覧いただけます。また、米国、カナダ、メキシコ、ブラジル、ドイツ、フランス、英国、イタリア、中国、インド、日本、オーストラリアなどの著名な経済圏の市場も予測されています。
- バイオ医薬品の受託製造市場に関わる主要企業22社の企業プロファイルを含む、2023年から2033年までの既存企業および市場参入を目指す企業の展望。
独自の予測による定量・定性分析をご覧いただけます。私たちのレポートだけが持つ情報を入手し、貴重なビジネスインテリジェンスとして情報を得ることができます。
他にはない情報
私たちの新しいレポートがあれば、知識に遅れをとったり、チャンスを逃したりする可能性は低くなります。私たちの仕事があなたの研究、分析、意思決定にどのように役立つかをご覧ください。Visiongainの研究は、バイオ医薬品の受託製造市場、2023年から2033年、市場をリードする企業のための商業分析を必要とするすべての人のためのものです。データ、トレンド、予測を見つけることができます。
ページTOPに戻る
目次
目次
1 レポートの概要
1.1 調査の目的
1.2 バイオ医薬品の受託製造市場の紹介
1.3 本レポートが提供するもの
1.4 本レポートを読むべき理由
1.5 本分析レポートが回答する主要な質問は以下の通り:
1.6 本レポートは誰のためのものなのか?
1.7 調査方法
1.7.1 市場の定義
1.7.2 市場評価・予測手法
1.7.3 データの妥当性確認
1.7.3.1 一次調査
1.7.3.2 セカンダリーリサーチ
1.8 よくある質問(FAQ)
1.9 Visiongainの関連レポート
1.10 Visiongainについて
2 エグゼクティブサマリー
2.1 バイオ医薬品における新たなアウトソーシングのトレンド
2.2 RNAベースのCOVID-19ワクチンへの需要がコンタクトメーカーに収益機会をもたらす
2.3 研究開発への投資増加
2.4 アナリストの視点
3 市場の概要
3.1 主要な調査結果
3.2 マーケットダイナミクス
3.2.1 市場促進要因
3.2.1.1 CMOによる生産能力増強のための投資の増加
3.2.1.2 コントラクトサービスが提供するコストと時間の節約効果
3.2.1.3 市場成長の原動力となるアウトソーシング
3.2.1.4 希少疾病用医薬品への投資拡大
3.2.2 市場抑制要因
3.2.2.1 市場成長の妨げとなる価格設定圧力
3.2.2.2 規制のシナリオ
3.2.2.3 過剰生産能力による市場成長への挑戦の可能性
3.2.3 市場機会
3.2.3.1 Fill and Finish CMOsの拡大
3.2.3.2 シングルユースバイオプロセシング機器・ソリューションの登場
3.2.3.3 新興国が有利な成長機会を提供する
3.3 COVID-19の影響度分析
3.4 SWOT分析
3.4.1 強み
3.4.2 弱点
3.4.3 機会
3.4.4 脅威
3.5 ポーターのファイブフォース分析
3.5.1 バイヤーパワー
3.5.2 サプライヤーパワー
3.5.3 競争力のあるライバル
3.5.4 代替品の脅威
3.5.5 新規参入の脅威
3.6 PEST分析
3.6.1 バイオ医薬品の受託製造市場に影響を与える政治的要因
3.6.2 バイオ医薬品の受託製造市場に影響を与える経済的要因
3.6.3 バイオ医薬品の受託製造市場に影響を与える社会的要因
3.6.4 バイオ医薬品の受託製造市場に影響を与える技術的要因
4 バイオ医薬品の受託製造の市場分析:ソース別
4.1 主要な調査結果
4.2 ソース別セグメント 市場魅力度指数
4.3 バイオ医薬品の受託製造のソース別市場規模の推定と予測
4.4 哺乳類
4.4.1 地域別市場予測、2023年~2033年(US$ Mn)
4.4.2 地域別市場シェア、2023年&2033年(%)
4.5 非哺乳類
4.5.1 地域別市場予測、2023年~2033年(US$ Mn)
4.5.2 地域別市場シェア、2023年&2033年(%)
5 バイオ医薬品の受託製造の市場分析:サービス別
5.1 主要な調査結果
5.2 サービスセグメント市場魅力度指数
5.3 バイオ医薬品受託製造のサービス別市場規模の推定と予測
5.4 プロセス開発
5.4.1 上流工程開発
5.4.2 ダウンストリームプロセス開発
5.4.3 地域別市場予測、2023年~2033年(US$ Mn)
5.4.4 地域別市場シェア、2023年&2033年(%)
5.4.4.1 タイプ別市場予測、2023-2033年 (US$ Mn)
5.5 フィル&フィニッシュオペレーション
5.5.1 地域別市場予測、2023年~2033年 (US$ Mn)
5.5.2 地域別市場シェア、2023年~2033年(%)
5.6 アナリティカル&QCスタディ
5.6.1 地域別市場予測、2023年~2033年(US$ Mn)
5.6.2 地域別市場シェア、2023年&2033年(%)
5.7 パッケージング
5.7.1 地域別市場予測、2023-2033年(US$ Mn)
5.7.2 地域別市場シェア、2023年&2033年(%)
6 バイオ医薬品の受託製造市場分析:製品別
6.1 主要な調査結果
6.2 製品セグメント別市場魅力度指数
6.3 バイオ医薬品受託製造の製品別市場規模の推定と予測
6.4 バイオロジクス
6.4.1 地域別市場予測、2023年〜2033年(US$ Mn)
6.4.2 地域別市場シェア、2023年&2033年(%)
6.4.2.1 タイプ別市場予測、2023年〜2033年(US$ Mn)
6.5 バイオシミラー
6.5.1 地域別市場予測、2023年〜2033年(US$ Mn)
6.5.2 地域別市場シェア、2023年&2033年(%)
7 バイオ医薬品の受託製造の市場分析:事業規模別
7.1 主要な調査結果
7.2 事業規模別セグメント市場魅力度指数
7.3 バイオ医薬品受託製造の事業規模別市場規模の推定と予測
7.4 前臨床
7.4.1 地域別市場予測、2023-2033年(US$ Mn)
7.4.2 地域別市場シェア、2023年&2033年(%)
7.5 臨床
7.5.1 地域別市場予測、2023年~2033年(US$ Mn)
7.5.2 地域別市場シェア、2023年&2033年(%)
7.6 商業
7.6.1 地域別市場予測、2023年~2033年(US$ Mn)
7.6.2 地域別市場シェア、2023年&2033年(%)
8 バイオ医薬品の受託製造市場分析:企業規模別
8.1 主要な調査結果
8.2 企業規模別セグメント:市場魅力度指数
8.3 バイオ医薬品受託製造の企業規模別市場規模の推定と予測
8.4 小規模
8.4.1 地域別市場予測、2023年〜2033年(US$ Mn)
8.4.2 地域別市場シェア、2023年&2033年(%)
8.5 中規模
8.5.1 地域別市場予測、2023年~2033年 (US$ Mn)
8.5.2 地域別市場シェア、2023年&2033年(%)
8.6 大規模
8.6.1 地域別市場予測、2023年~2033年(US$ Mn)
8.6.2 地域別市場シェア、2023年&2033年(%)
9 バイオ医薬品の受託製造の地域別市場分析
9.1 主要な調査結果
9.2 地域別市場規模の推計と予測
10 北米のバイオ医薬品の受託製造市場分析
10.1 主要な調査結果
10.2 北米バイオ医薬品の受託製造市場魅力度指数
10.3 国別市場規模、2023年、2028年、2033年(US$ Mn)
10.4 国別市場規模推定と予測、2023年〜2033年(US$ Mn)
10.5 ソース別市場規模推定と予測、2023年〜2033年(US$ Mn)
10.6 サービス別市場規模推定と予測、2023年〜2033年(US$ Mn)
10.7 製品別市場規模の推定と予測、2023年~2033年(US$ Mn)
10.8 事業規模別市場規模の推定と予測、2023年~2033年(US$ Mn)
10.9 企業規模別市場規模の推定と予測、2023年~2033年(US$ Mn)
10.10 米国のバイオ医薬品の受託製造市場分析
10.11 カナダのバイオ医薬品の受託製造市場の分析
11 欧州のバイオ医薬品受託製造市場分析
11.1 主要な調査結果
11.2 欧州バイオ医薬品受託製造市場魅力度指数
11.3 国別市場規模、2023年、2028年&2033年(US$ Mn)
11.4 国別市場規模の推定と予測、2023年〜2033年(US$ Mn)
11.5 ソース別市場規模の推定と予測、2023年~2033年(US$ Mn)
11.6 サービス別市場規模の推定と予測、2023年〜2033年(US$ Mn)
11.7 製品別市場規模の推定と予測、2023~2033年(US$ Mn)
11.8 事業規模別市場規模の推定と予測、2023年~2033年(US$ Mn)
11.9 企業規模別市場規模の推定と予測、2023~2033年(US$ Mn)
11.10 ドイツ バイオ医薬品受託製造市場分析
11.11 イギリス バイオ医薬品受託製造市場分析
11.12 フランス バイオ医薬品受託製造市場分析
11.13 イタリア バイオ医薬品受託製造市場の分析
11.13.1 イタリア全土におけるCDMO事業の役割
11.13.2 市場拡大の原動力となる主要プレイヤーの投資
11.14 スペインのバイオ医薬品受託製造市場分析
11.15 ロシア バイオ医薬品受託製造市場の分析
11.16 その他の欧州のバイオ医薬品受託製造市場の分析
12 アジア太平洋地域のバイオ医薬品の受託製造市場分析
12.1 主要な調査結果
12.2 アジア太平洋地域のバイオ医薬品受託製造市場魅力度指数
12.3 国別市場規模、2023年、2028年&2033年(US$ Mn)
12.4 国別市場規模推計・予測、2023年〜2033年(US$ Mn)
12.5 ソース別市場規模の推定と予測、2023年~2033年(US$ Mn)
12.6 サービス別市場規模の推定と予測、2023年〜2033年(US$ Mn)
12.7 製品別市場規模の推定と予測、2023~2033年(US$ Mn)
12.8 事業規模別市場規模の推定と予測、2023年~2033年(US$ Mn)
12.9 企業規模別市場規模の推定と予測、2023~2033年(US$ Mn)
12.10 日本 バイオ医薬品受託製造市場分析
12.11 中国 バイオ医薬品の受託製造市場分析
12.12 インド バイオ医薬品受託製造市場の分析
12.12.1 COVID-19の大流行により、インドのバイオテクノロジー産業、特にバイオ医薬品が注目されるようになった
12.12.2 ピラマル・ファーマLtd.CDMOヤパンバイオに少数株主として出資
12.12.3 ステリス・バイオファーマが製造施設2カ所で、EU-GMPを取得
12.13 オーストラリア バイオ医薬品受託製造市場分析
12.14 東南アジアのバイオ医薬品受託製造市場の分析
12.15 その他のアジア太平洋地域のバイオ医薬品受託製造市場の分析
13 ラテンアメリカのバイオ医薬品受託製造市場分析
13.1 主要な調査結果
13.2 ラテンアメリカのバイオ医薬品受託製造市場魅力度指数
13.3 国別市場規模、2023年、2028年&2033年(US$ Mn)
13.4 国別市場規模の推定と予測、2023年〜2033年(US$ Mn)
13.5 ソース別市場規模の推定と予測、2023年~2033年(US$ Mn)
13.6 サービス別市場規模の推定と予測、2023年〜2033年(US$ Mn)
13.7 製品別市場規模の推定と予測、2023~2033年(US$ Mn)
13.8 事業規模別市場規模の推定と予測、2023年~2033年(US$ Mn)
13.9 企業規模別市場規模の推定と予測、2023~2033年(US$ Mn)
13.10 ブラジル バイオ医薬品受託製造市場分析
13.11 メキシコ バイオ医薬品受託製造市場分析
13.12 アルゼンチン バイオ医薬品受託製造市場の分析
13.13 コロンビアのバイオ医薬品受託製造市場の分析
13.14 その他のラテンアメリカ地域 バイオ医薬品受託製造市場の分析
14 MEAのバイオ医薬品の受託製造市場分析
14.1 主要な調査結果
14.2 MEAのバイオ医薬品受託製造市場魅力度指数
14.3 国別市場規模、2023年、2028年&2033年(US$ Mn)
14.4 国別市場規模推計・予測、2023年〜2033年(US$ Mn)
14.5 ソース別市場規模の推定と予測、2023年~2033年(US$ Mn)
14.6 サービス別市場規模の推定と予測、2023年〜2033年(US$ Mn)
14.7 製品別市場規模の推定と予測、2023~2033年(US$ Mn)
14.8 事業規模別市場規模の推定と予測、2023年~2033年(US$ Mn)
14.9 企業規模別市場規模の推定と予測、2023~2033年(US$ Mn)
14.10 GCC バイオ医薬品受託製造市場分析
14.11 南アフリカのバイオ医薬品受託製造市場分析
14.12 その他のMEA地域 バイオ医薬品受託製造市場の分析
15 会社概要
15.1 AbbVie, Inc.
15.1.1 企業スナップショット
15.1.2 会社概要
15.1.3 財務分析
15.1.3.1 純収益、2015-2022年
15.1.3.2 R&D費用、2015年~2022年
15.1.3.3 地域別市場占有率、2022年
15.1.4 サービスのベンチマーキング
15.1.5 戦略的な展望
15.2 AGC Biologics
15.2.1 企業スナップショット
15.2.2 会社概要
15.2.3 サービス・ベンチマーキング
15.2.4 戦略的な展望
15.3 Avantor, Inc.
15.3.1 企業スナップショット
15.3.2 会社概要
15.3.3 財務分析
15.3.3.1 純収益、2017年~2022年
15.3.3.2 地域別市場占有率、2021年
15.3.4 サービスのベンチマーキング
15.3.5 戦略的な展望
15.4 Binex Co., Ltd.
15.4.1 企業スナップショット
15.4.2 会社概要
15.4.3 サービス・ベンチマーキング
15.5 Boehringer Ingelheim GmbH
15.5.1 企業スナップショット
15.5.2 会社概要
15.5.3 財務分析
15.5.3.1 純収入、2015-2021年
15.5.4 サービスのベンチマーキング
15.5.5 戦略的な展望
15.6 FUJIFILM Diosynth Biotechnologies
15.6.1 企業スナップショット
15.6.2 会社概要
15.6.3 サービス・ベンチマーキング
15.6.4 戦略的展望
15.7 Lonza
15.7.1 企業スナップショット
15.7.2 会社概要
15.7.3 財務分析
15.7.3.1 純収益、2015-2022年
15.7.3.2 R&D費用、2017年~2021年
15.7.4 サービスのベンチマーキング
15.7.5 戦略的な展望
15.8 ProBioGen
15.8.1 企業スナップショット
15.8.2 会社概要
15.8.3 サービス・ベンチマーク
15.8.4 戦略的な展望
15.9 Rentschler Biopharma SE
15.9.1 企業スナップショット
15.9.2 会社概要
15.9.3 サービスベンチマーキング
15.9.4 戦略的な展望
15.10 Samsung Biologics
15.10.1 企業スナップショット
15.10.2 会社概要
15.10.3 サービス・ベンチマーキング
15.10.4 戦略的な展望
15.11 Sandoz
15.11.1 企業スナップショット
15.11.2 会社概要
15.11.3 財務分析
15.11.3.1 純収益、2015年〜2022年
15.11.3.2 地域別市場占有率、2021年
15.11.4 サービスのベンチマーキング
15.11.5 戦略的な展望
15.12 TOYOBO CO., LTD.
15.12.1 企業スナップショット
15.12.2 会社概要
15.12.3 サービス・ベンチマーキング
15.13 WuXi Biologics
15.13.1 企業スナップショット
15.13.2 会社概要
15.13.3 財務分析
15.13.3.1 純収益、2015年〜2022年
15.13.3.2 地域別市場占有率、2022年
15.13.4 サービスのベンチマーキング
15.13.5 戦略的な展望
15.14 JRS PHARMA
15.14.1 企業スナップショット
15.14.2 会社概要
15.14.3 サービス・ベンチマーキング
15.14.4 戦略的な展望
15.15 Thermo Fisher Scientific
15.15.1 企業スナップショット
15.15.2 会社概要
15.15.3 財務分析
15.15.3.1 純収入、2015-2022年
15.15.3.2 R&D、2015年-2022年
15.15.3.3 地域別市場占有率、2022年
15.15.4 サービスのベンチマーキング
15.16 Cambrex Corporation
15.16.1 企業スナップショット
15.16.2 会社概要
15.16.3 サービス・ベンチマーキング
15.16.4 戦略的な展望
15.17 Curia Global, Inc.
15.17.1 企業スナップショット
15.17.2 会社概要
15.17.3 サービス・ベンチマーキング
15.17.4 戦略的な展望
15.18 Pfizer CentreOne
15.18.1 企業スナップショット
15.18.2 会社概要
15.18.3 財務分析
15.18.3.1 純収益、2015-2022年
15.18.3.2 R&D、2015年〜2022年
15.18.3.3 地域別市場シェア、2022年
15.18.4 サービスのベンチマーキング
15.19 Jubilant Pharma Limited
15.19.1 企業スナップショット
15.19.2 会社概要
15.19.3 サービス・ベンチマーク
15.20 Catalent, Inc
15.20.1 企業スナップショット
15.20.2 会社概要
15.20.3 財務分析
15.20.3.1 純収入、2015年〜2022年
15.20.4 サービスのベンチマーキング
15.20.5 戦略的な展望
15.21 KBI Biopharma
15.21.1 企業スナップショット
15.21.2 会社概要
15.21.3 サービス・ベンチマーキング
15.21.4 戦略的な展望
15.22 Cytiva
15.22.1 企業スナップショット
15.22.2 会社概要
15.22.3 サービス・ベンチマーキング
15.22.4 戦略的な展望
16 結論と提言
16.1 Visiongainからの結びの言葉
16.2 市場関係者への提言
ページTOPに戻る
図表リスト
List of Tables
Table 1 Biopharmaceuticals Contract Manufacturing Market Snapshot, 2023 & 2033 (US$ million, CAGR %)
Table 2 Biopharmaceuticals Contract Manufacturing Market Forecast by Region, 2023-2033 (US$ Million, AGR%, CAGR%): "V" Shaped Recovery
Table 3 Biopharmaceuticals Contract Manufacturing Market Forecast by Region, 2023-2033 (US$ Million, AGR%, CAGR%): "U" Shaped Recovery
Table 4 Biopharmaceuticals Contract Manufacturing Market Forecast by Region, 2023-2033 (US$ Million, AGR%, CAGR%): "W" Shaped Recovery
Table 5 Biopharmaceuticals Contract Manufacturing Market Forecast by Region, 2023-2033 (US$ Million, AGR%, CAGR%): "L" Shaped Recovery
Table 6 Biopharmaceuticals Contract Manufacturing Market Forecast by Source, 2023-2033 (US$ Million, AGR%, CAGR%)
Table 7 Mammalian Segment Market Forecast by Region, 2023-2033 (US$ Mn, AGR%, CAGR%)
Table 8 Non-mammalian Segment Market Forecast by Region, 2023-2033 (US$ Mn, AGR%, CAGR%)
Table 9 Biopharmaceuticals Contract Manufacturing Market Forecast by Service, 2023-2033 (US$ Million, AGR%, CAGR%)
Table 10 Process Development Segment Market Forecast by Region, 2023-2033 (US$ Mn, AGR%, CAGR%)
Table 11 Biopharmaceuticals Contract Manufacturing Market Forecast by Process Development, 2023-2033 (US$ mn, AGR%, CAGR%)
Table 12 Fill & Finish Operations Segment Market Forecast by Region, 2023-2033 (US$ Mn, AGR%, CAGR%)
Table 13 Analytical & QC Studies Segment Market Forecast by Region, 2023-2033 (US$ Mn, AGR%, CAGR%)
Table 14 Packaging Segment Market Forecast by Region, 2023-2033 (US$ Mn, AGR%, CAGR%)
Table 15 Biopharmaceuticals Contract Manufacturing Market Forecast by Product, 2023-2033 (US$ Million, AGR%, CAGR%)
Table 16 Biologics Segment Market Forecast by Region, 2023-2033 (US$ Mn, AGR%, CAGR%)
Table 17 Biopharmaceuticals Contract Manufacturing Market Forecast by Application, 2023-2033 (US$ mn, AGR%, CAGR%)
Table 18 Biosimilars Segment Market Forecast by Region, 2023-2033 (US$ Mn, AGR%, CAGR%)
Table 19 Preclinical Segment Market Forecast by Region, 2023-2033 (US$ Mn, AGR%, CAGR%)
Table 20 Clinical Segment Market Forecast by Region, 2023-2033 (US$ Mn, AGR%, CAGR%)
Table 21 Commercial Segment Market Forecast by Region, 2023-2033 (US$ Mn, AGR%, CAGR%)
Table 22 Biopharmaceuticals Contract Manufacturing Market Forecast by Company Size, 2023-2033 (US$ Million, AGR%, CAGR%)
Table 23 Small Segment Market Forecast by Region, 2023-2033 (US$ Mn, AGR%, CAGR%)
Table 24 Mid-sized Segment Market Forecast by Region, 2023-2033 (US$ Mn, AGR%, CAGR%)
Table 25 Large Segment Market Forecast by Region, 2023-2033 (US$ Mn, AGR%, CAGR%)
Table 26 Biopharmaceuticals Contract Manufacturing Market Forecast by Region, 2023-2033 (US$ Million, AGR%, CAGR%)
Table 27 North America Biopharmaceuticals Contract Manufacturing Market Forecast by Country, 2023-2033 (US$ Million, AGR%, CAGR%)
Table 28 North America Biopharmaceuticals Contract Manufacturing Market Forecast by Source, 2023-2033 (US$ Million, AGR%, CAGR%)
Table 29 North America Biopharmaceuticals Contract Manufacturing Market Forecast by Service, 2023-2033 (US$ Million, AGR%, CAGR%)
Table 30 North America Biopharmaceuticals Contract Manufacturing Market Forecast by Product, 2023-2033 (US$ Million, AGR%, CAGR%)
Table 31 North America Biopharmaceuticals Contract Manufacturing Market Forecast by Scale of Operation, 2023-2033 (US$ Million, AGR%, CAGR%)
Table 32 North America Biopharmaceuticals Contract Manufacturing Market Forecast by Company Size, 2023-2033 (US$ Million, AGR%, CAGR%)
Table 33 U.S. Biopharmaceuticals Contract Manufacturing Market Forecast, 2023-2033 (US$ Million, AGR%, CAGR%)
Table 34 Canada Biopharmaceuticals Contract Manufacturing Market Forecast, 2023-2033 (US$ Million, AGR%, CAGR%)
Table 35 Europe Biopharmaceuticals Contract Manufacturing Market Forecast by Country, 2023-2033 (US$ Million, AGR%, CAGR%)
Table 36 Europe Biopharmaceuticals Contract Manufacturing Market Forecast by Source, 2023-2033 (US$ Million, AGR%, CAGR%)
Table 37 Europe Biopharmaceuticals Contract Manufacturing Market Forecast by Service, 2023-2033 (US$ Million, AGR%, CAGR%)
Table 38 Europe Biopharmaceuticals Contract Manufacturing Market Forecast by Product, 2023-2033 (US$ Million, AGR%, CAGR%)
Table 39 Europe Biopharmaceuticals Contract Manufacturing Market Forecast by Scale of Operation, 2023-2033 (US$ Million, AGR%, CAGR%)
Table 40 Europe Biopharmaceuticals Contract Manufacturing Market Forecast by Company Size, 2023-2033 (US$ Million, AGR%, CAGR%)
Table 41 Germany Biopharmaceuticals Contract Manufacturing Market Forecast, 2023-2033 (US$ Million, AGR%, CAGR%)
Table 42 UK Biopharmaceuticals Contract Manufacturing Market Forecast, 2023-2033 (US$ Million, AGR%, CAGR%)
Table 43 France Biopharmaceuticals Contract Manufacturing Market Forecast, 2023-2033 (US$ Million, AGR%, CAGR%)
Table 44 Italy Biopharmaceuticals Contract Manufacturing Market Forecast, 2023-2033 (US$ Million, AGR%, CAGR%)
Table 45 Spain Biopharmaceuticals Contract Manufacturing Market Forecast, 2023-2033 (US$ Million, AGR%, CAGR%)
Table 46 Russia Biopharmaceuticals Contract Manufacturing Market Forecast, 2023-2033 (US$ Million, AGR%, CAGR%)
Table 47 Rest of Europe Biopharmaceuticals Contract Manufacturing Market Forecast, 2023-2033 (US$ Million, AGR%, CAGR%)
Table 48 Asia Pacific Biopharmaceuticals Contract Manufacturing Market Forecast by Country, 2023-2033 (US$ Million, AGR%, CAGR%)
Table 49 Asia Pacific Biopharmaceuticals Contract Manufacturing Market Forecast by Source, 2023-2033 (US$ Million, AGR%, CAGR%)
Table 50 Asia Pacific Biopharmaceuticals Contract Manufacturing Market Forecast by Service, 2023-2033 (US$ Million, AGR%, CAGR%)
Table 51 Asia Pacific Biopharmaceuticals Contract Manufacturing Market Forecast by Product, 2023-2033 (US$ Million, AGR%, CAGR%)
Table 52 Asia Pacific Biopharmaceuticals Contract Manufacturing Market Forecast by Scale of Operation, 2023-2033 (US$ Million, AGR%, CAGR%)
Table 53 Asia Pacific Biopharmaceuticals Contract Manufacturing Market Forecast by Company Size, 2023-2033 (US$ Million, AGR%, CAGR%)
Table 54 Japan Biopharmaceuticals Contract Manufacturing Market Forecast, 2023-2033 (US$ Million, AGR%, CAGR%)
Table 55 China Biopharmaceuticals Contract Manufacturing Market Forecast, 2023-2033 (US$ Million, AGR%, CAGR%)
Table 56 India Biopharmaceuticals Contract Manufacturing Market Forecast, 2023-2033 (US$ Million, AGR%, CAGR%)
Table 57 Australia Biopharmaceuticals Contract Manufacturing Market Forecast, 2023-2033 (US$ Million, AGR%, CAGR%)
Table 58 South-East Asia Biopharmaceuticals Contract Manufacturing Market Forecast, 2023-2033 (US$ Million, AGR%, CAGR%)
Table 59 Rest of Asia Pacific Biopharmaceuticals Contract Manufacturing Market Forecast, 2023-2033 (US$ Million, AGR%, CAGR%)
Table 60 Latin America Biopharmaceuticals Contract Manufacturing Market Forecast by Country, 2023-2033 (US$ Million, AGR%, CAGR%)
Table 61 Latin America Biopharmaceuticals Contract Manufacturing Market Forecast by Source, 2023-2033 (US$ Million, AGR%, CAGR%)
Table 62 Latin America Biopharmaceuticals Contract Manufacturing Market Forecast by Service, 2023-2033 (US$ Million, AGR%, CAGR%)
Table 63 Latin America Biopharmaceuticals Contract Manufacturing Market Forecast by Product, 2023-2033 (US$ Million, AGR%, CAGR%)
Table 64 Latin America Biopharmaceuticals Contract Manufacturing Market Forecast by Scale of Operation, 2023-2033 (US$ Million, AGR%, CAGR%)
Table 65 Latin America Biopharmaceuticals Contract Manufacturing Market Forecast by Company Size, 2023-2033 (US$ Million, AGR%, CAGR%)
Table 66 Brazil Biopharmaceuticals Contract Manufacturing Market Forecast, 2023-2033 (US$ Million, AGR%, CAGR%)
Table 67 Mexico Biopharmaceuticals Contract Manufacturing Market Forecast, 2023-2033 (US$ Million, AGR%, CAGR%)
Table 68 Argentina Biopharmaceuticals Contract Manufacturing Market Forecast, 2023-2033 (US$ Million, AGR%, CAGR%)
Table 69 Colombia Biopharmaceuticals Contract Manufacturing Market Forecast, 2023-2033 (US$ Million, AGR%, CAGR%)
Table 70 Rest of Latin America Biopharmaceuticals Contract Manufacturing Market Forecast, 2023-2033 (US$ Million, AGR%, CAGR%)
Table 71 MEA Biopharmaceuticals Contract Manufacturing Market Forecast by Country, 2023-2033 (US$ Million, AGR%, CAGR%)
Table 72 MEA Biopharmaceuticals Contract Manufacturing Market Forecast by Source, 2023-2033 (US$ Million, AGR%, CAGR%)
Table 73 MEA Biopharmaceuticals Contract Manufacturing Market Forecast by Service, 2023-2033 (US$ Million, AGR%, CAGR%)
Table 74 MEA Biopharmaceuticals Contract Manufacturing Market Forecast by Product, 2023-2033 (US$ Million, AGR%, CAGR%)
Table 75 MEA Biopharmaceuticals Contract Manufacturing Market Forecast by Scale of Operation, 2023-2033 (US$ Million, AGR%, CAGR%)
Table 76 MEA Biopharmaceuticals Contract Manufacturing Market Forecast by Company Size, 2023-2033 (US$ Million, AGR%, CAGR%)
Table 77 GCC Biopharmaceuticals Contract Manufacturing Market Forecast, 2023-2033 (US$ Million, AGR%, CAGR%)
Table 78 South Africa Biopharmaceuticals Contract Manufacturing Market Forecast, 2023-2033 (US$ Million, AGR%, CAGR%)
Table 79 Rest of MEA Biopharmaceuticals Contract Manufacturing Market Forecast, 2023-2033 (US$ Million, AGR%, CAGR%)
Table 80 AbbVie, Inc.: Key Details, (CEO, HQ, Revenue, Founded, No. of Employees, Company Type, Website, Business Segment)
Table 81 AbbVie, Inc.: Service Benchmarking
Table 82 AbbVie, Inc.: Strategic Outlook
Table 83 AGC Biologics: Key Details, (CEO, HQ, Revenue, Founded, No. of Employees, Company Type, Website, Business Segment)
Table 84 AGC Biologics: Service Benchmarking
Table 85 AGC Biologics: Strategic Outlook
Table 86 Avantor, Inc.: Key Details, (CEO, HQ, Revenue, Founded, No. of Employees, Company Type, Website, Business Segment)
Table 87 Avantor, Inc.: Service Benchmarking
Table 88 Avantor, Inc.: Strategic Outlook
Table 89 Binex Co., Ltd.: Key Details, (CEO, HQ, Revenue, Founded, No. of Employees, Company Type, Website, Business Segment)
Table 90 Binex Co., Ltd.: Service Benchmarking
Table 91 Boehringer Ingelheim GmbH: Key Details, (CEO, HQ, Revenue, Founded, No. of Employees, Company Type, Website, Business Segment)
Table 92 Boehringer Ingelheim GmbH: Service Benchmarking
Table 93 Boehringer Ingelheim GmbH: Strategic Outlook
Table 94 FUJIFILM Diosynth Biotechnologies: Key Details, (CEO, HQ, Revenue, Founded, No. of Employees, Company Type, Website, Business Segment)
Table 95 FUJIFILM Diosynth Biotechnologies: Service Benchmarking
Table 96 FUJIFILM Diosynth Biotechnologies: Strategic Outlook
Table 97 Lonza: Key Details, (CEO, HQ, Revenue, Founded, No. of Employees, Company Type, Website, Business Segment)
Table 98 Lonza: Service Benchmarking
Table 99 Lonza: Strategic Outlook
Table 100 ProBioGen: Key Details, (CEO, HQ, Revenue, Founded, No. of Employees, Company Type, Website, Business Segment)
Table 101 ProBioGen: Service Benchmarking
Table 102 ProBioGen: Strategic Outlook
Table 103 Rentschler Biopharma SE: Key Details, (CEO, HQ, Revenue, Founded, No. of Employees, Company Type, Website, Business Segment)
Table 104 Rentschler Biopharma SE: Service Benchmarking
Table 105 Rentschler Biopharma SE: Strategic Outlook
Table 106 Samsung Biologics: Key Details, (CEO, HQ, Revenue, Founded, No. of Employees, Company Type, Website, Business Segment)
Table 107 Samsung Biologics: Service Benchmarking
Table 108 Samsung Biologics: Strategic Outlook
Table 109 Sandoz: Key Details, (CEO, HQ, Revenue, Founded, No. of Employees, Company Type, Website, Business Segment)
Table 110 Sandoz: Service Benchmarking
Table 111 Sandoz: Strategic Outlook
Table 112 TOYOBO CO., LTD.: Key Details, (CEO, HQ, Revenue, Founded, No. of Employees, Company Type, Website, Business Segment)
Table 113 TOYOBO CO., LTD.: Service Benchmarking
Table 114 WuXi Biologics: Key Details, (CEO, HQ, Revenue, Founded, No. of Employees, Company Type, Website, Business Segment)
Table 115 WuXi Biologics: Service Benchmarking
Table 116 WuXi Biologics: Strategic Outlook
Table 117 JRS PHARMA: Key Details, (CEO, HQ, Revenue, Founded, No. of Employees, Company Type, Website, Business Segment)
Table 118 JRS PHARMA: Service Benchmarking
Table 119 JRS PHARMA: Strategic Outlook
Table 120 Thermo Fisher Scientific: Key Details, (CEO, HQ, Revenue, Founded, No. of Employees, Company Type, Website, Business Segment)
Table 121 Thermo Fisher Scientific: Service Benchmarking
Table 122 Cambrex Corporation: Key Details, (CEO, HQ, Revenue, Founded, No. of Employees, Company Type, Website, Business Segment)
Table 123 Cambrex Corporation: Service Benchmarking
Table 124 Cambrex Corporation: Strategic Outlook
Table 125 Curia Global, Inc.: Key Details, (CEO, HQ, Revenue, Founded, No. of Employees, Company Type, Website, Business Segment)
Table 126 Curia Global, Inc.: Service Benchmarking
Table 127 Curia Global, Inc.: Strategic Outlook
Table 128 Pfizer CentreOne: Key Details, (CEO, HQ, Revenue, Founded, No. of Employees, Company Type, Website, Business Segment)
Table 129 Pfizer CentreOne: Service Benchmarking
Table 130 Jubilant Pharma Limited: Key Details, (CEO, HQ, Revenue, Founded, No. of Employees, Company Type, Website, Business Segment)
Table 131 Jubilant Pharma Limited: Service Benchmarking
Table 132 Catalent, Inc: Key Details, (CEO, HQ, Revenue, Founded, No. of Employees, Company Type, Website, Business Segment)
Table 133 Catalent, Inc: Service Benchmarking
Table 134 Catalent, Inc: Strategic Outlook
Table 135 KBI Biopharma: Key Details, (CEO, HQ, Revenue, Founded, No. of Employees, Company Type, Website, Business Segment)
Table 136 KBI Biopharma: Service Benchmarking
Table 137 KBI Biopharma: Strategic Outlook
Table 138 Cytiva: Key Details, (CEO, HQ, Revenue, Founded, No. of Employees, Company Type, Website, Business Segment)
Table 139 Cytiva: Service Benchmarking
Table 140 Cytiva: Strategic Outlook
List of Figures
Figure 1 Biopharmaceuticals Contract Manufacturing Market Segmentation
Figure 2 Biopharmaceuticals Contract Manufacturing Market: Market Dynamics
Figure 3 Biopharmaceuticals Contract Manufacturing Market by Region, 2023-2033 (US$ Mn, AGR %): “V” Shaped Recovery
Figure 4 Biopharmaceuticals Contract Manufacturing Market by Region, 2023-2033 (US$ Mn, AGR %): “U” Shaped Recovery
Figure 5 Biopharmaceuticals Contract Manufacturing Market by Region, 2023-2033 (US$ Mn, AGR %): “W” Shaped Recovery
Figure 6 Biopharmaceuticals Contract Manufacturing Market by Region, 2023-2033 (US$ Mn, AGR %): “L” Shaped Recovery
Figure 7 SWOT Analysis
Figure 8 Porter’s Five Forces Analysis
Figure 9 PEST Analysis
Figure 10 Biopharmaceuticals Contract Manufacturing Market Attractiveness Index by Source
Figure 11 Biopharmaceuticals Contract Manufacturing Market Forecast by Source, 2023-2033 (US$ Million, AGR %)
Figure 12 Biopharmaceuticals Contract Manufacturing Market Share Forecast by Source, 2023, 2028, 2033 (%)
Figure 13 Mammalian Segment Market Forecast by Region, 2023-2033 (US$ Million, AGR %)
Figure 14 Mammalian Segment Market Share Forecast by Region, 2023 & 2033 (%)
Figure 15 Non-mammalian Segment Market Forecast by Region, 2023-2033 (US$ Million, AGR %)
Figure 16 Non-mammalian Segment Market Share Forecast by Region, 2023 & 2033 (%)
Figure 17 Biopharmaceuticals Contract Manufacturing Market Attractiveness Index by Source
Figure 18 Biopharmaceuticals Contract Manufacturing Market Forecast by Service, 2023-2033 (US$ Million, AGR %)
Figure 19 Biopharmaceuticals Contract Manufacturing Market Share Forecast by Service, 2023, 2028, 2033 (%)
Figure 20 Process Development Segment Market Forecast by Region, 2023-2033 (US$ Million, AGR %)
Figure 21 Process Development Segment Market Share Forecast by Region, 2023 & 2033 (%)
Figure 22 Process Development Segment Market Forecast by Type, 2023-2033 (US$ Million, AGR %)
Figure 23 Fill & Finish Operations Segment Market Forecast by Region, 2023-2033 (US$ Million, AGR %)
Figure 24 Fill & Finish Operations Segment Market Share Forecast by Region, 2023 & 2033 (%)
Figure 25 Analytical & QC Studies Segment Market Forecast by Region, 2023-2033 (US$ Million, AGR %)
Figure 26 Analytical & QC Studies Segment Market Share Forecast by Region, 2023 & 2033 (%)
Figure 27 Packaging Segment Market Forecast by Region, 2023-2033 (US$ Million, AGR %)
Figure 28 Packaging Segment Market Share Forecast by Region, 2023 & 2033 (%)
Figure 29 Biopharmaceuticals Contract Manufacturing Market Attractiveness Index by Product
Figure 30 Biopharmaceuticals Contract Manufacturing Market Forecast by Product, 2023-2033 (US$ Million, AGR %)
Figure 31 Biopharmaceuticals Contract Manufacturing Market Share Forecast by Product, 2023, 2028, 2033 (%)
Figure 32 Biologics Segment Market Forecast by Region, 2023-2033 (US$ Million, AGR %)
Figure 33 Biologics Segment Market Share Forecast by Region, 2023 & 2033 (%)
Figure 34 Biologics Segment Market Forecast by Type, 2023-2033 (US$ Million, AGR %)
Figure 35 Biosimilars Segment Market Forecast by Region, 2023-2033 (US$ Million, AGR %)
Figure 36 Biosimilars Segment Market Share Forecast by Region, 2023 & 2033 (%)
Figure 37 Biopharmaceuticals Contract Manufacturing Market Attractiveness Index by Scale of Operation
Figure 38 Biopharmaceuticals Contract Manufacturing Market Forecast by Scale of Operation, 2023-2033 (US$ Million, AGR %)
Figure 39 Biopharmaceuticals Contract Manufacturing Market Share Forecast by Scale of Operation, 2023, 2028, 2033 (%)
Figure 40 Preclinical Segment Market Forecast by Region, 2023-2033 (US$ Million, AGR %)
Figure 41 Preclinical Segment Market Share Forecast by Region, 2023 & 2033 (%)
Figure 42 Clinical Segment Market Forecast by Region, 2023-2033 (US$ Million, AGR %)
Figure 43 Clinical Segment Market Share Forecast by Region, 2023 & 2033 (%)
Figure 44 Commercial Segment Market Forecast by Region, 2023-2033 (US$ Million, AGR %)
Figure 45 Commercial Segment Market Share Forecast by Region, 2023 & 2033 (%)
Figure 46 Biopharmaceuticals Contract Manufacturing Market Attractiveness Index by Company Size
Figure 47 Biopharmaceuticals Contract Manufacturing Market Forecast by Company Size, 2023-2033 (US$ Million, AGR %)
Figure 48 Biopharmaceuticals Contract Manufacturing Market Share Forecast by Company Size, 2023, 2028, 2033 (%)
Figure 49 Small Segment Market Forecast by Region, 2023-2033 (US$ Million, AGR %)
Figure 50 Small Segment Market Share Forecast by Region, 2023 & 2033 (%)
Figure 51 Mid-sized Segment Market Forecast by Region, 2023-2033 (US$ Million, AGR %)
Figure 52 Mid-sized Segment Market Share Forecast by Region, 2023 & 2033 (%)
Figure 53 Large Segment Market Forecast by Region, 2023-2033 (US$ Million, AGR %)
Figure 54 Large Segment Market Share Forecast by Region, 2023 & 2033 (%)
Figure 55 Biopharmaceuticals Contract Manufacturing Market Forecast by Region 2023, 2028, 2033 (Revenue, CAGR%)
Figure 56 Biopharmaceuticals Contract Manufacturing Market Share Forecast by Region 2023, 2028, 2033 (%)
Figure 57 Biopharmaceuticals Contract Manufacturing Market by Region, 2023-2033 (US$ Mn)
Figure 58 North America Biopharmaceuticals Contract Manufacturing Market Attractiveness Index
Figure 59 North America Biopharmaceuticals Contract Manufacturing Market by Region, 2023, 2028 & 2033 (US$ million)
Figure 60 North America Biopharmaceuticals Contract Manufacturing Market Forecast by Country, 2023-2033 (US$ Million, AGR %)
Figure 61 North America Biopharmaceuticals Contract Manufacturing Market Share Forecast by Country, 2023 & 2033 (%)
Figure 62 North America Biopharmaceuticals Contract Manufacturing Market Forecast by Source, 2023-2033 (US$ Million, AGR %)
Figure 63 North America Biopharmaceuticals Contract Manufacturing Market Share Forecast by Source, 2023 & 2033 (%)
Figure 64 North America Biopharmaceuticals Contract Manufacturing Market Forecast by Service, 2023-2033 (US$ Million, AGR %)
Figure 65 North America Biopharmaceuticals Contract Manufacturing Market Share Forecast by Service, 2023 & 2033 (%)
Figure 66 North America Biopharmaceuticals Contract Manufacturing Market Forecast by Product, 2023-2033 (US$ Million, AGR %)
Figure 67 North America Biopharmaceuticals Contract Manufacturing Market Share Forecast by Product, 2023 & 2033 (%)
Figure 68 North America Biopharmaceuticals Contract Manufacturing Market Forecast by Scale of Operation, 2023-2033 (US$ Million, AGR %)
Figure 69 North America Biopharmaceuticals Contract Manufacturing Market Share Forecast by Scale of Operation, 2023 & 2033 (%)
Figure 70 North America Biopharmaceuticals Contract Manufacturing Market Forecast by Company Size, 2023-2033 (US$ Million, AGR %)
Figure 71 North America Biopharmaceuticals Contract Manufacturing Market Share Forecast by Company Size, 2023 & 2033 (%)
Figure 72 U.S. Biopharmaceuticals Contract Manufacturing Market Forecast, 2023-2033 (US$ Million, AGR %)
Figure 73 Canada Biopharmaceuticals Contract Manufacturing Market Forecast, 2023-2033 (US$ Million, AGR %)
Figure 74 Europe Biopharmaceuticals Contract Manufacturing Market Attractiveness Index
Figure 75 Europe Biopharmaceuticals Contract Manufacturing Market by Region, 2023, 2028 & 2033 (US$ million)
Figure 76 Europe Biopharmaceuticals Contract Manufacturing Market Share Forecast by Country, 2023 & 2033 (%)
Figure 77 Europe Biopharmaceuticals Contract Manufacturing Market Forecast by Source, 2023-2033 (US$ Million, AGR %)
Figure 78 Europe Biopharmaceuticals Contract Manufacturing Market Share Forecast by Source, 2023 & 2033 (%)
Figure 79 Europe Biopharmaceuticals Contract Manufacturing Market Forecast by Service, 2023-2033 (US$ Million, AGR %)
Figure 80 Europe Biopharmaceuticals Contract Manufacturing Market Share Forecast by Service, 2023 & 2033 (%)
Figure 81 Europe Biopharmaceuticals Contract Manufacturing Market Forecast by Product, 2023-2033 (US$ Million, AGR %)
Figure 82 Europe Biopharmaceuticals Contract Manufacturing Market Share Forecast by Product, 2023 & 2033 (%)
Figure 83 Europe Biopharmaceuticals Contract Manufacturing Market Forecast by Scale of Operation, 2023-2033 (US$ Million, AGR %)
Figure 84 Europe Biopharmaceuticals Contract Manufacturing Market Share Forecast by Scale of Operation, 2023 & 2033 (%)
Figure 85 Europe Biopharmaceuticals Contract Manufacturing Market Forecast by Company Size, 2023-2033 (US$ Million, AGR %)
Figure 86 Europe Biopharmaceuticals Contract Manufacturing Market Share Forecast by Company Size, 2023 & 2033 (%)
Figure 87 Germany Biopharmaceuticals Contract Manufacturing Market Forecast, 2023-2033 (US$ million, AGR %)
Figure 88 UK Biopharmaceuticals Contract Manufacturing Market Forecast, 2023-2033 (US$ million, AGR %)
Figure 89 France Biopharmaceuticals Contract Manufacturing Market Forecast, 2023-2033 (US$ million, AGR %)
Figure 90 Italy Biopharmaceuticals Contract Manufacturing Market Forecast, 2023-2033 (US$ million, AGR %)
Figure 91 Spain Biopharmaceuticals Contract Manufacturing Market Forecast, 2023-2033 (US$ million, AGR %)
Figure 92 Russia Biopharmaceuticals Contract Manufacturing Market Forecast, 2023-2033 (US$ million, AGR %)
Figure 93 Rest of Europe Biopharmaceuticals Contract Manufacturing Market Forecast, 2023-2033 (US$ million, AGR %)
Figure 94 Asia Pacific Biopharmaceuticals Contract Manufacturing Market Attractiveness Index
Figure 95 Asia Pacific Biopharmaceuticals Contract Manufacturing Market by Region, 2023, 2028 & 2033 (US$ million)
Figure 96 Asia Pacific Biopharmaceuticals Contract Manufacturing Market Forecast by Country, 2023-2033 (US$ Million, AGR %)
Figure 97 Asia Pacific Biopharmaceuticals Contract Manufacturing Market Share Forecast by Country, 2023 & 2033 (%)
Figure 98 Asia Pacific Biopharmaceuticals Contract Manufacturing Market Forecast by Source, 2023-2033 (US$ Million, AGR %)
Figure 99 Asia Pacific Biopharmaceuticals Contract Manufacturing Market Share Forecast by Source, 2023 & 2033 (%)
Figure 100 Asia Pacific Biopharmaceuticals Contract Manufacturing Market Forecast by Service, 2023-2033 (US$ Million, AGR %)
Figure 101 Asia Pacific Biopharmaceuticals Contract Manufacturing Market Share Forecast by Service, 2023 & 2033 (%)
Figure 102 Asia Pacific Biopharmaceuticals Contract Manufacturing Market Forecast by Product, 2023-2033 (US$ Million, AGR %)
Figure 103 Asia Pacific Biopharmaceuticals Contract Manufacturing Market Share Forecast by Product, 2023 & 2033 (%)
Figure 104 Asia Pacific Biopharmaceuticals Contract Manufacturing Market Forecast by Scale of Operation, 2023-2033 (US$ Million, AGR %)
Figure 105 Asia Pacific Biopharmaceuticals Contract Manufacturing Market Share Forecast by Scale of Operation, 2023 & 2033 (%)
Figure 106 Asia Pacific Biopharmaceuticals Contract Manufacturing Market Forecast by Company Size, 2023-2033 (US$ Million, AGR %)
Figure 107 Asia Pacific Biopharmaceuticals Contract Manufacturing Market Share Forecast by Company Size, 2023 & 2033 (%)
Figure 108 Japan Biopharmaceuticals Contract Manufacturing Market Forecast, 2023-2033 (US$ million, AGR %)
Figure 109 China Biopharmaceuticals Contract Manufacturing Market Forecast, 2023-2033 (US$ million, AGR %)
Figure 110 India Biopharmaceuticals Contract Manufacturing Market Forecast, 2023-2033 (US$ million, AGR %)
Figure 111 Australia Biopharmaceuticals Contract Manufacturing Market Forecast, 2023-2033 (US$ million, AGR %)
Figure 112 South-East Asia Biopharmaceuticals Contract Manufacturing Market Forecast, 2023-2033 (US$ million, AGR %)
Figure 113 Rest of Asia Pacific Biopharmaceuticals Contract Manufacturing Market Forecast, 2023-2033 (US$ million, AGR %)
Figure 114 Latin America Biopharmaceuticals Contract Manufacturing Market Attractiveness Index
Figure 115 Latin America Biopharmaceuticals Contract Manufacturing Market by Region, 2023, 2028 & 2033 (US$ million)
Figure 116 Latin America Biopharmaceuticals Contract Manufacturing Market Share Forecast by Country, 2023 & 2033 (%)
Figure 117 Latin America Biopharmaceuticals Contract Manufacturing Market Forecast by Source, 2023-2033 (US$ Million, AGR %)
Figure 118 Latin America Biopharmaceuticals Contract Manufacturing Market Share Forecast by Source, 2023 & 2033 (%)
Figure 119 Latin America Biopharmaceuticals Contract Manufacturing Market Forecast by Service, 2023-2033 (US$ Million, AGR %)
Figure 120 Latin America Biopharmaceuticals Contract Manufacturing Market Share Forecast by Service, 2023 & 2033 (%)
Figure 121 Latin America Biopharmaceuticals Contract Manufacturing Market Forecast by Product, 2023-2033 (US$ Million, AGR %)
Figure 122 Latin America Biopharmaceuticals Contract Manufacturing Market Share Forecast by Product, 2023 & 2033 (%)
Figure 123 Latin America Biopharmaceuticals Contract Manufacturing Market Forecast by Scale of Operation, 2023-2033 (US$ Million, AGR %)
Figure 124 Latin America Biopharmaceuticals Contract Manufacturing Market Share Forecast by Scale of Operation, 2023 & 2033 (%)
Figure 125 Latin America Biopharmaceuticals Contract Manufacturing Market Forecast by Company Size, 2023-2033 (US$ Million, AGR %)
Figure 126 Latin America Biopharmaceuticals Contract Manufacturing Market Share Forecast by Company Size, 2023 & 2033 (%)
Figure 127 Brazil Biopharmaceuticals Contract Manufacturing Market Forecast, 2023-2033 (US$ million, AGR %)
Figure 128 Mexico Biopharmaceuticals Contract Manufacturing Market Forecast, 2023-2033 (US$ million, AGR %)
Figure 129 Argentina Biopharmaceuticals Contract Manufacturing Market Forecast, 2023-2033 (US$ million, AGR %)
Figure 130 Colombia Biopharmaceuticals Contract Manufacturing Market Forecast, 2023-2033 (US$ million, AGR %)
Figure 131 Rest of Latin America Biopharmaceuticals Contract Manufacturing Market Forecast, 2023-2033 (US$ million, AGR %)
Figure 132 MEA Biopharmaceuticals Contract Manufacturing Market Attractiveness Index
Figure 133 MEA Biopharmaceuticals Contract Manufacturing Market by Region, 2023, 2028 & 2033 (US$ million)
Figure 134 MEA Biopharmaceuticals Contract Manufacturing Market Forecast by Country, 2023-2033 (US$ Million, AGR %)
Figure 135 MEA Biopharmaceuticals Contract Manufacturing Market Share Forecast by Country, 2023 & 2033 (%)
Figure 136 MEA Biopharmaceuticals Contract Manufacturing Market Forecast by Source, 2023-2033 (US$ Million, AGR %)
Figure 137 MEA Biopharmaceuticals Contract Manufacturing Market Share Forecast by Source, 2023 & 2033 (%)
Figure 138 MEA Biopharmaceuticals Contract Manufacturing Market Forecast by Service, 2023-2033 (US$ Million, AGR %)
Figure 139 MEA Biopharmaceuticals Contract Manufacturing Market Share Forecast by Service, 2023 & 2033 (%)
Figure 140 MEA Biopharmaceuticals Contract Manufacturing Market Forecast by Product, 2023-2033 (US$ Million, AGR %)
Figure 141 MEA Biopharmaceuticals Contract Manufacturing Market Share Forecast by Product, 2023 & 2033 (%)
Figure 142 MEA Biopharmaceuticals Contract Manufacturing Market Forecast by Scale of Operation, 2023-2033 (US$ Million, AGR %)
Figure 143 MEA Biopharmaceuticals Contract Manufacturing Market Share Forecast by Scale of Operation, 2023 & 2033 (%)
Figure 144 MEA Biopharmaceuticals Contract Manufacturing Market Forecast by Company Size, 2023-2033 (US$ Million, AGR %)
Figure 145 MEA Biopharmaceuticals Contract Manufacturing Market Share Forecast by Company Size, 2023 & 2033 (%)
Figure 146 GCC Biopharmaceuticals Contract Manufacturing Market Forecast, 2023-2033 (US$ million, AGR %)
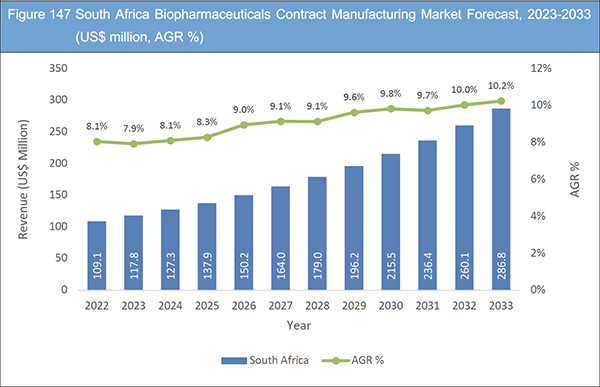
Figure 147 South Africa Biopharmaceuticals Contract Manufacturing Market Forecast, 2023-2033 (US$ million, AGR %)
Figure 148 Rest of MEA Biopharmaceuticals Contract Manufacturing Market Forecast, 2023-2033 (US$ million, AGR %)
Figure 149 AbbVie, Inc.: Net Revenue, 2015-2022 (US$ million, AGR%)
Figure 150 AbbVie, Inc.: R&D Expenses, 2015-2022 (US$ million, AGR%)
Figure 151 AbbVie, Inc.: Regional Market Shares, 2022 (%)
Figure 152 Avantor, Inc.: Net Revenue, 2017-2022 (US$ million, AGR%)
Figure 153 Avantor, Inc.: Regional Market Share (AGR%)
Figure 154 Boehringer Ingelheim GmbH: Net Revenue, 2015-2021 (US$ million, AGR%)
Figure 155 Lonza: Net Revenue, 2015-2022 (US$ million, AGR%)
Figure 156 Lonza: R&D Expenses, 2017-2021 (US$ million, AGR%)
Figure 157 Sandoz: Net Revenue, 2015-2022 (US$ million, AGR%)
Figure 158 Sandoz: Regional Market Share (AGR%)
Figure 159 WuXi Biologics: Net Revenue, 2015-2022 (US$ million, AGR%)
Figure 160 WuXi Biologics: Regional Market Shares, 2022 (%)
Figure 161 Thermo Fisher Scientific: Net Revenue, 2015-2022 (US$ million, AGR%)
Figure 162 Thermo Fisher Scientific: R&D, 2015-2022 (US$ million, AGR%)
Figure 163 Thermo Fisher Scientific: Regional Market Shares, 2022 (%)
Figure 164 Pfizer CentreOne: Net Revenue, 2015-2022 (US$ million, AGR%)
Figure 165 Pfizer CentreOne: R&D, 2015-2022 (US$ million, AGR%)
Figure 166 Pfizer CentreOne: Regional Market Shares, 2022 (%)
Figure 167 Catalent, Inc: Net Revenue, 2015-2022 (US$ million, AGR%)
ページTOPに戻る
Summary
Report Details
The Biopharmaceuticals Contract Manufacturing Market Report 2023-2033: This report will prove invaluable to leading firms striving for new revenue pockets if they wish to better understand the industry and its underlying dynamics. It will be useful for companies that would like to expand into different industries or to expand their existing operations in a new region.
Every year, new and unique drug products and technologies come out. This changes the way biopharma works and what kinds of treatments are possible. This is partly because outsourcing gives them the ability and freedom to do so. Emerging and virtual companies that are driving the future pipeline depend heavily on external development partners, and not just for hard-to-make products. Even more well-known companies are signing contracts with CDMOs to get access to their resources and certain skills. In cell and gene therapy (CGT), many of the chemistry, manufacturing, and control (CMC) jobs, such as process development, analytical development, testing, manufacturing, and filling and finishing, are done by outside companies. Outsourcing can happen at almost any point in the life cycle of a treatment, all the way up until it goes on the market.
CGTs have problems that require expensive and hard-to-find consumables, tools, space, and talent. This could lead a company to think about outsourcing clinical through commercial manufacturing processes. Big companies have the means to develop and make products, but they may need help with certain tasks, such as specialised analytical assays or studies to improve the way a process works. Small companies, which make up most of the advanced biotherapeutic developers right now, don’t have a lot of internal development and manufacturing capacity or experience, so they tend to outsource process development, process scaling up, and manufacturing.
What Questions Should You Ask before Buying a Market Research Report?
• How is the biopharmaceuticals contract manufacturing market evolving?
• What is driving and restraining the biopharmaceuticals contract manufacturing market?
• How will each biopharmaceuticals contract manufacturing submarket segment grow over the forecast period and how much revenue will these submarkets account for in 2033?
• How will the market shares for each biopharmaceuticals contract manufacturing submarket develop from 2023 to 2033?
• What will be the main driver for the overall market from 2023 to 2033?
• Will leading biopharmaceuticals contract manufacturing markets broadly follow the macroeconomic dynamics, or will individual national markets outperform others?
• How will the market shares of the national markets change by 2033 and which geographical region will lead the market in 2033?
• Who are the leading players and what are their prospects over the forecast period?
• What are the biopharmaceuticals contract manufacturing projects for these leading companies?
• How will the industry evolve during the period between 2023 and 2033? What are the implications of
biopharmaceuticals contract manufacturing projects taking place now and over the next 10 years?
• Is there a greater need for product commercialisation to further scale the biopharmaceuticals contract manufacturing market?
• Where is the biopharmaceuticals contract manufacturing market heading and how can you ensure you are at the forefront of the market?
• What are the best investment options for new product and service lines?
• What are the key prospects for moving companies into a new growth path and C-suite?
You need to discover how this will impact the biopharmaceuticals contract manufacturing market today, and over the next 10 years:
• Our 358-page report provides 140 tables and 167 charts/graphs exclusively to you.
• The report highlights key lucrative areas in the industry so you can target them – NOW.
• It contains in-depth analysis of global, regional and national sales and growth.
• It highlights for you the key successful trends, changes and revenue projections made by your competitors.
This report tells you TODAY how the biopharmaceuticals contract manufacturing market will develop in the next 10 years, and in line with the variations in COVID-19 economic recession and bounce. This market is more critical now than at any point over the last 10 years.
Forecasts to 2033 and other analyses reveal commercial prospects
• In addition to revenue forecasting to 2033, our new study provides you with recent results, growth rates, and market shares.
• You will find original analyses, with business outlooks and developments.
• Discover qualitative analyses (including market dynamics, drivers, opportunities, and restraints), Porter’s Five Forces Analysis, PEST Analysis and recent developments.
This report includes data analysis and invaluable insight into how COVID-19 will affect the industry and your company. Four COVID-19 recovery patterns and their impact, namely, “V”, “L”, “W” and “U” are discussed in this report.
Segments Covered in the Report
Source
• Mammalian
• Non-mammalian
Service
• Process Development
• Fill & Finish Operations
• Analytical & QC Studies
• Packaging
Product
• Biologics
• Biosimilars
Company Size
• Small
• Mid-sized
• Large
Scale of Operations
• Preclinical
• Clinical
• Commercial
In addition to the revenue predictions for the overall world market and segments, you will also find revenue forecasts for five regional and 23 leading national markets:
North America
• U.S.
• Canada
Europe
• Germany
• UK
• France
• Italy
• Spain
• Russia
• Rest of Europe
Asia Pacific
• Japan
• China
• India
• Australia
• South-East Asia
• Rest of Asia Pacific
Latin America
• Brazil
• Mexico
• Argentina
• Colombia
• Rest of Latin America
MEA
• GCC
• South Africa
• Rest of MEA
The report also includes profiles and for some of the leading companies in the Biopharmaceuticals Contract Manufacturing Market, 2023 to 2033, with a focus on this segment of these companies’ operations.
Leading companies and the potential for market growth
• AbbVie, Inc.
• AGC Biologics
• Avantor, Inc.
• Binex Co., Ltd.
• Boehringer Ingelheim GmbH
• Cambrex Corporation
• Catalent Inc
• Curia Global, Inc.
• Cytiva
• FUJIFILM Diosynth Biotechnologies
• JRS PHARMA
• Jubilant Pharma Limited
• KBI Biopharma
• Lonza
• Pfizer CentreOne
• ProBioGen
• Rentschler Biopharma SE
• Samsung Biologics
• Sandoz
• TOYOBO CO., LTD.
• Thermo Fisher Scientific
• WuXi Biologics
Overall world revenue for Biopharmaceuticals Contract Manufacturing Market, 2023 to 2033 in terms of value the market will surpass US$15,280.0 million in 2023, our work calculates. We predict strong revenue growth through to 2033. Our work identifies which organizations hold the greatest potential. Discover their capabilities, progress, and commercial prospects, helping you stay ahead.
How will the Biopharmaceuticals Contract Manufacturing Market, 2023 to 2033 report help you?
In summary, our 350+ page report provides you with the following knowledge:
• Revenue forecasts to 2033 for Biopharmaceuticals Contract Manufacturing Market, 2023 to 2033 Market, with forecasts for Source, service, product, company size, and scale of operations, each forecast at a global and regional level – discover the industry’s prospects, finding the most lucrative places for investments and revenues.
• Revenue forecasts to 2033 for five regional and 23 key national markets – See forecasts for the Biopharmaceuticals Contract Manufacturing Market, 2023 to 2033 market in North America, Europe, Asia-Pacific, Latin America, and MEA. Also forecasted is the market in the US, Canada, Mexico, Brazil, Germany, France, UK, Italy, China, India, Japan, and Australia among other prominent economies.
• Prospects for established firms and those seeking to enter the market – including company profiles for 22 of the major companies involved in the Biopharmaceuticals Contract Manufacturing Market, 2023 to 2033.
Find quantitative and qualitative analyses with independent predictions. Receive information that only our report contains, staying informed with invaluable business intelligence.
Information found nowhere else
With our new report, you are less likely to fall behind in knowledge or miss out on opportunities. See how our work could benefit your research, analyses, and decisions. Visiongain’s study is for everybody needing commercial analyses for the Biopharmaceuticals Contract Manufacturing Market, 2023 to 2033, market-leading companies. You will find data, trends and predictions.
ページTOPに戻る
Table of Contents
Table of Contents
1 Report Overview
1.1 Objectives of the Study
1.2 Introduction to Biopharmaceuticals Contract Manufacturing Market
1.3 What This Report Delivers
1.4 Why You Should Read This Report
1.5 Key Questions Answered by This Analytical Report Include:
1.6 Who is This Report For?
1.7 Methodology
1.7.1 Market Definitions
1.7.2 Market Evaluation & Forecasting Methodology
1.7.3 Data Validation
1.7.3.1 Primary Research
1.7.3.2 Secondary Research
1.8 Frequently Asked Questions (FAQs)
1.9 Associated Visiongain Reports
1.10 About Visiongain
2 Executive Summary
2.1 Emerging Outsourcing Trends in Biopharmaceuticals
2.2 Demand for RNA-based COVID-19 Vaccines Creates Revenue Opportunities for Contact Manufacturers
2.3 Increase in Investment in Research & Development
2.4 Analyst Viewpoint
3 Market Overview
3.1 Key Findings
3.2 Market Dynamics
3.2.1 Market Driving Factors
3.2.1.1 Rise in Investment by CMOs for Capacity Expansion
3.2.1.2 Cost and Time Saving Benefits Offered by Contract Services
3.2.1.3 Outsourcing as a Driver for Market Growth
3.2.1.4 Growing Investments in Orphan Drugs
3.2.2 Market Restraining Factors
3.2.2.1 Pricing Pressure to Impede Market Growth
3.2.2.2 Regulatory Scenarios
3.2.2.3 Overcapacity Likely to Challenge Market Growth
3.2.3 Market Opportunities
3.2.3.1 Expansion of Fill and Finish CMOs
3.2.3.2 Emergence of Single-Use Bioprocessing Equipment & Solutions
3.2.3.3 Emerging Economies to Offer Lucrative Growth Opportunities
3.3 COVID-19 Impact Analysis
3.4 SWOT Analysis
3.4.1 Strengths
3.4.2 Weaknesses
3.4.3 Opportunities
3.4.4 Threats
3.5 Porter’s Five Forces Analysis
3.5.1 Buyer Power
3.5.2 Supplier Power
3.5.3 Competitive Rivalry
3.5.4 Threat of Substitute
3.5.5 Threat of New Entrants
3.6 PEST Analysis
3.6.1 Political Factors Impacting Biopharmaceuticals Contract Manufacturing Market
3.6.2 Economic Factors Impacting Biopharmaceuticals Contract Manufacturing Market
3.6.3 Social Factors Impacting Biopharmaceuticals Contract Manufacturing Market
3.6.4 Technological Factors Impacting Biopharmaceuticals Contract Manufacturing Market
4 Biopharmaceuticals Contract Manufacturing Market Analysis by Source
4.1 Key Findings
4.2 Source Segment: Market Attractiveness Index
4.3 Biopharmaceuticals Contract Manufacturing Market Size Estimation and Forecast by Source
4.4 Mammalian
4.4.1 Market Forecast by Region, 2023-2033 (US$ Mn)
4.4.2 Market Share by Region, 2023 & 2033 (%)
4.5 Non-mammalian
4.5.1 Market Forecast by Region, 2023-2033 (US$ Mn)
4.5.2 Market Share by Region, 2023 & 2033 (%)
5 Biopharmaceuticals Contract Manufacturing Market Analysis by Service
5.1 Key Findings
5.2 Service Segment: Market Attractiveness Index
5.3 Biopharmaceuticals Contract Manufacturing Market Size Estimation and Forecast by Service
5.4 Process Development
5.4.1 Upstream Process Development
5.4.2 Downstream Process Development
5.4.3 Market Forecast by Region, 2023-2033 (US$ Mn)
5.4.4 Market Share by Region, 2023 & 2033 (%)
5.4.4.1 Market Forecast by Type, 2023-2033 (US$ Mn)
5.5 Fill & Finish Operations
5.5.1 Market Forecast by Region, 2023-2033 (US$ Mn)
5.5.2 Market Share by Region, 2023 & 2033 (%)
5.6 Analytical & QC Studies
5.6.1 Market Forecast by Region, 2023-2033 (US$ Mn)
5.6.2 Market Share by Region, 2023 & 2033 (%)
5.7 Packaging
5.7.1 Market Forecast by Region, 2023-2033 (US$ Mn)
5.7.2 Market Share by Region, 2023 & 2033 (%)
6 Biopharmaceuticals Contract Manufacturing Market Analysis by Product
6.1 Key Findings
6.2 Product Segment: Market Attractiveness Index
6.3 Biopharmaceuticals Contract Manufacturing Market Size Estimation and Forecast by Product
6.4 Biologics
6.4.1 Market Forecast by Region, 2023-2033 (US$ Mn)
6.4.2 Market Share by Region, 2023 & 2033 (%)
6.4.2.1 Market Forecast by Type, 2023-2033 (US$ Mn)
6.5 Biosimilars
6.5.1 Market Forecast by Region, 2023-2033 (US$ Mn)
6.5.2 Market Share by Region, 2023 & 2033 (%)
7 Biopharmaceuticals Contract Manufacturing Market Analysis by Scale of Operation
7.1 Key Findings
7.2 Scale of Operation Segment: Market Attractiveness Index
7.3 Biopharmaceuticals Contract Manufacturing Market Size Estimation and Forecast by Scale of Operation
7.4 Preclinical
7.4.1 Market Forecast by Region, 2023-2033 (US$ Mn)
7.4.2 Market Share by Region, 2023 & 2033 (%)
7.5 Clinical
7.5.1 Market Forecast by Region, 2023-2033 (US$ Mn)
7.5.2 Market Share by Region, 2023 & 2033 (%)
7.6 Commercial
7.6.1 Market Forecast by Region, 2023-2033 (US$ Mn)
7.6.2 Market Share by Region, 2023 & 2033 (%)
8 Biopharmaceuticals Contract Manufacturing Market Analysis by Company Size
8.1 Key Findings
8.2 Company Size Segment: Market Attractiveness Index
8.3 Biopharmaceuticals Contract Manufacturing Market Size Estimation and Forecast by Company Size
8.4 Small
8.4.1 Market Forecast by Region, 2023-2033 (US$ Mn)
8.4.2 Market Share by Region, 2023 & 2033 (%)
8.5 Mid-sized
8.5.1 Market Forecast by Region, 2023-2033 (US$ Mn)
8.5.2 Market Share by Region, 2023 & 2033 (%)
8.6 Large
8.6.1 Market Forecast by Region, 2023-2033 (US$ Mn)
8.6.2 Market Share by Region, 2023 & 2033 (%)
9 Biopharmaceuticals Contract Manufacturing Market Analysis by Region
9.1 Key Findings
9.2 Regional Market Size Estimation and Forecast
10 North America Biopharmaceuticals Contract Manufacturing Market Analysis
10.1 Key Findings
10.2 North America Biopharmaceuticals Contract Manufacturing Market Attractiveness Index
10.3 Market Size by Country, 2023, 2028 & 2033 (US$ Mn)
10.4 Market Size Estimation and Forecast by Country, 2023-2033 (US$ Mn)
10.5 Market Size Estimation and Forecast by Source, 2023-2033 (US$ Mn)
10.6 Market Size Estimation and Forecast by Service, 2023-2033 (US$ Mn)
10.7 Market Size Estimation and Forecast by Product, 2023-2033 (US$ Mn)
10.8 Market Size Estimation and Forecast by Scale of Operation, 2023-2033 (US$ Mn)
10.9 Market Size Estimation and Forecast by Company Size, 2023-2033 (US$ Mn)
10.10 U.S. Biopharmaceuticals Contract Manufacturing Market Analysis
10.11 Canada Biopharmaceuticals Contract Manufacturing Market Analysis
11 Europe Biopharmaceuticals Contract Manufacturing Market Analysis
11.1 Key Findings
11.2 Europe Biopharmaceuticals Contract Manufacturing Market Attractiveness Index
11.3 Market Size by Country, 2023, 2028 & 2033 (US$ Mn)
11.4 Market Size Estimation and Forecast by Country, 2023-2033 (US$ Mn)
11.5 Market Size Estimation and Forecast by Source, 2023-2033 (US$ Mn)
11.6 Market Size Estimation and Forecast by Service, 2023-2033 (US$ Mn)
11.7 Market Size Estimation and Forecast by Product, 2023-2033 (US$ Mn)
11.8 Market Size Estimation and Forecast by Scale of Operation, 2023-2033 (US$ Mn)
11.9 Market Size Estimation and Forecast by Company Size, 2023-2033 (US$ Mn)
11.10 Germany Biopharmaceuticals Contract Manufacturing Market Analysis
11.11 UK Biopharmaceuticals Contract Manufacturing Market Analysis
11.12 France Biopharmaceuticals Contract Manufacturing Market Analysis
11.13 Italy Biopharmaceuticals Contract Manufacturing Market Analysis
11.13.1 Role of CDMO Business Across Italy
11.13.2 Investment by Major Players to Fuel Market Expansion
11.14 Spain Biopharmaceuticals Contract Manufacturing Market Analysis
11.15 Russia Biopharmaceuticals Contract Manufacturing Market Analysis
11.16 Rest of Europe Biopharmaceuticals Contract Manufacturing Market Analysis
12 Asia Pacific Biopharmaceuticals Contract Manufacturing Market Analysis
12.1 Key Findings
12.2 Asia Pacific Biopharmaceuticals Contract Manufacturing Market Attractiveness Index
12.3 Market Size by Country, 2023, 2028 & 2033 (US$ Mn)
12.4 Market Size Estimation and Forecast by Country, 2023-2033 (US$ Mn)
12.5 Market Size Estimation and Forecast by Source, 2023-2033 (US$ Mn)
12.6 Market Size Estimation and Forecast by Service, 2023-2033 (US$ Mn)
12.7 Market Size Estimation and Forecast by Product, 2023-2033 (US$ Mn)
12.8 Market Size Estimation and Forecast by Scale of Operation, 2023-2033 (US$ Mn)
12.9 Market Size Estimation and Forecast by Company Size, 2023-2033 (US$ Mn)
12.10 Japan Biopharmaceuticals Contract Manufacturing Market Analysis
12.11 China Biopharmaceuticals Contract Manufacturing Market Analysis
12.12 India Biopharmaceuticals Contract Manufacturing Market Analysis
12.12.1 The COVID-19 pandemic has brought India’s biotechnology industry, especially biopharmaceuticals into the limelight
12.12.2 Piramal Pharma Ltd. Invests Minority Stake in CDMO Yapan Bio
12.12.3 Stelis Biopharma Limited Receives EU-GMP for Two of its Manufacturing Facilities
12.13 Australia Biopharmaceuticals Contract Manufacturing Market Analysis
12.14 South-East Asia Biopharmaceuticals Contract Manufacturing Market Analysis
12.15 Rest of Asia Pacific Biopharmaceuticals Contract Manufacturing Market Analysis
13 Latin America Biopharmaceuticals Contract Manufacturing Market Analysis
13.1 Key Findings
13.2 Latin America Biopharmaceuticals Contract Manufacturing Market Attractiveness Index
13.3 Market Size by Country, 2023, 2028 & 2033 (US$ Mn)
13.4 Market Size Estimation and Forecast by Country, 2023-2033 (US$ Mn)
13.5 Market Size Estimation and Forecast by Source, 2023-2033 (US$ Mn)
13.6 Market Size Estimation and Forecast by Service, 2023-2033 (US$ Mn)
13.7 Market Size Estimation and Forecast by Product, 2023-2033 (US$ Mn)
13.8 Market Size Estimation and Forecast by Scale of Operation, 2023-2033 (US$ Mn)
13.9 Market Size Estimation and Forecast by Company Size, 2023-2033 (US$ Mn)
13.10 Brazil Biopharmaceuticals Contract Manufacturing Market Analysis
13.11 Mexico Biopharmaceuticals Contract Manufacturing Market Analysis
13.12 Argentina Biopharmaceuticals Contract Manufacturing Market Analysis
13.13 Colombia Biopharmaceuticals Contract Manufacturing Market Analysis
13.14 Rest of Latin America Biopharmaceuticals Contract Manufacturing Market Analysis
14 MEA Biopharmaceuticals Contract Manufacturing Market Analysis
14.1 Key Findings
14.2 MEA Biopharmaceuticals Contract Manufacturing Market Attractiveness Index
14.3 Market Size by Country, 2023, 2028 & 2033 (US$ Mn)
14.4 Market Size Estimation and Forecast by Country, 2023-2033 (US$ Mn)
14.5 Market Size Estimation and Forecast by Source, 2023-2033 (US$ Mn)
14.6 Market Size Estimation and Forecast by Service, 2023-2033 (US$ Mn)
14.7 Market Size Estimation and Forecast by Product, 2023-2033 (US$ Mn)
14.8 Market Size Estimation and Forecast by Scale of Operation, 2023-2033 (US$ Mn)
14.9 Market Size Estimation and Forecast by Company Size, 2023-2033 (US$ Mn)
14.10 GCC Biopharmaceuticals Contract Manufacturing Market Analysis
14.11 South Africa Biopharmaceuticals Contract Manufacturing Market Analysis
14.12 Rest of MEA Biopharmaceuticals Contract Manufacturing Market Analysis
15 Company Profiles
15.1 AbbVie, Inc.
15.1.1 Company Snapshot
15.1.2 Company Overview
15.1.3 Financial Analysis
15.1.3.1 Net Revenue, 2015-2022
15.1.3.2 R&D Expenses, 2015-2022
15.1.3.3 Regional Market Shares, 2022
15.1.4 Service Benchmarking
15.1.5 Strategic Outlook
15.2 AGC Biologics
15.2.1 Company Snapshot
15.2.2 Company Overview
15.2.3 Service Benchmarking
15.2.4 Strategic Outlook
15.3 Avantor, Inc.
15.3.1 Company Snapshot
15.3.2 Company Overview
15.3.3 Financial Analysis
15.3.3.1 Net Revenue, 2017-2022
15.3.3.2 Regional Market Shares, 2021
15.3.4 Service Benchmarking
15.3.5 Strategic Outlook
15.4 Binex Co., Ltd.
15.4.1 Company Snapshot
15.4.2 Company Overview
15.4.3 Service Benchmarking
15.5 Boehringer Ingelheim GmbH
15.5.1 Company Snapshot
15.5.2 Company Overview
15.5.3 Financial Analysis
15.5.3.1 Net Revenue, 2015-2021
15.5.4 Service Benchmarking
15.5.5 Strategic Outlook
15.6 FUJIFILM Diosynth Biotechnologies
15.6.1 Company Snapshot
15.6.2 Company Overview
15.6.3 Service Benchmarking
15.6.4 Strategic Outlook
15.7 Lonza
15.7.1 Company Snapshot
15.7.2 Company Overview
15.7.3 Financial Analysis
15.7.3.1 Net Revenue, 2015-2022
15.7.3.2 R&D Expenses, 2017-2021
15.7.4 Service Benchmarking
15.7.5 Strategic Outlook
15.8 ProBioGen
15.8.1 Company Snapshot
15.8.2 Company Overview
15.8.3 Service Benchmarking
15.8.4 Strategic Outlook
15.9 Rentschler Biopharma SE
15.9.1 Company Snapshot
15.9.2 Company Overview
15.9.3 Service Benchmarking
15.9.4 Strategic Outlook
15.10 Samsung Biologics
15.10.1 Company Snapshot
15.10.2 Company Overview
15.10.3 Service Benchmarking
15.10.4 Strategic Outlook
15.11 Sandoz
15.11.1 Company Snapshot
15.11.2 Company Overview
15.11.3 Financial Analysis
15.11.3.1 Net Revenue, 2015-2022
15.11.3.2 Regional Market Shares, 2021
15.11.4 Service Benchmarking
15.11.5 Strategic Outlook
15.12 TOYOBO CO., LTD.
15.12.1 Company Snapshot
15.12.2 Company Overview
15.12.3 Service Benchmarking
15.13 WuXi Biologics
15.13.1 Company Snapshot
15.13.2 Company Overview
15.13.3 Financial Analysis
15.13.3.1 Net Revenue, 2015-2022
15.13.3.2 Regional Market Shares, 2022
15.13.4 Service Benchmarking
15.13.5 Strategic Outlook
15.14 JRS PHARMA
15.14.1 Company Snapshot
15.14.2 Company Overview
15.14.3 Service Benchmarking
15.14.4 Strategic Outlook
15.15 Thermo Fisher Scientific
15.15.1 Company Snapshot
15.15.2 Company Overview
15.15.3 Financial Analysis
15.15.3.1 Net Revenue, 2015-2022
15.15.3.2 R&D, 2015-2022
15.15.3.3 Regional Market Shares, 2022
15.15.4 Service Benchmarking
15.16 Cambrex Corporation
15.16.1 Company Snapshot
15.16.2 Company Overview
15.16.3 Service Benchmarking
15.16.4 Strategic Outlook
15.17 Curia Global, Inc.
15.17.1 Company Snapshot
15.17.2 Company Overview
15.17.3 Service Benchmarking
15.17.4 Strategic Outlook
15.18 Pfizer CentreOne
15.18.1 Company Snapshot
15.18.2 Company Overview
15.18.3 Financial Analysis
15.18.3.1 Net Revenue, 2015-2022
15.18.3.2 R&D, 2015-2022
15.18.3.3 Regional Market Shares, 2022
15.18.4 Service Benchmarking
15.19 Jubilant Pharma Limited
15.19.1 Company Snapshot
15.19.2 Company Overview
15.19.3 Service Benchmarking
15.20 Catalent, Inc
15.20.1 Company Snapshot
15.20.2 Company Overview
15.20.3 Financial Analysis
15.20.3.1 Net Revenue, 2015-2022
15.20.4 Service Benchmarking
15.20.5 Strategic Outlook
15.21 KBI Biopharma
15.21.1 Company Snapshot
15.21.2 Company Overview
15.21.3 Service Benchmarking
15.21.4 Strategic Outlook
15.22 Cytiva
15.22.1 Company Snapshot
15.22.2 Company Overview
15.22.3 Service Benchmarking
15.22.4 Strategic Outlook
16 Conclusion and Recommendations
16.1 Concluding Remarks from Visiongain
16.2 Recommendations for Market Players
ページTOPに戻る
List of Tables/Graphs
表の一覧
Table 1 Biopharmaceuticals Contract Manufacturing Market Snapshot, 2023 & 2033 (US$ million, CAGR %)
Table 2 Biopharmaceuticals Contract Manufacturing Market Forecast by Region, 2023-2033 (US$ Million, AGR%, CAGR%): "V" Shaped Recovery
Table 3 Biopharmaceuticals Contract Manufacturing Market Forecast by Region, 2023-2033 (US$ Million, AGR%, CAGR%): "U" Shaped Recovery
Table 4 Biopharmaceuticals Contract Manufacturing Market Forecast by Region, 2023-2033 (US$ Million, AGR%, CAGR%): "W" Shaped Recovery
Table 5 Biopharmaceuticals Contract Manufacturing Market Forecast by Region, 2023-2033 (US$ Million, AGR%, CAGR%): "L" Shaped Recovery
Table 6 Biopharmaceuticals Contract Manufacturing Market Forecast by Source, 2023-2033 (US$ Million, AGR%, CAGR%)
Table 7 Mammalian Segment Market Forecast by Region, 2023-2033 (US$ Mn, AGR%, CAGR%)
Table 8 Non-mammalian Segment Market Forecast by Region, 2023-2033 (US$ Mn, AGR%, CAGR%)
Table 9 Biopharmaceuticals Contract Manufacturing Market Forecast by Service, 2023-2033 (US$ Million, AGR%, CAGR%)
Table 10 Process Development Segment Market Forecast by Region, 2023-2033 (US$ Mn, AGR%, CAGR%)
Table 11 Biopharmaceuticals Contract Manufacturing Market Forecast by Process Development, 2023-2033 (US$ mn, AGR%, CAGR%)
Table 12 Fill & Finish Operations Segment Market Forecast by Region, 2023-2033 (US$ Mn, AGR%, CAGR%)
Table 13 Analytical & QC Studies Segment Market Forecast by Region, 2023-2033 (US$ Mn, AGR%, CAGR%)
Table 14 Packaging Segment Market Forecast by Region, 2023-2033 (US$ Mn, AGR%, CAGR%)
Table 15 Biopharmaceuticals Contract Manufacturing Market Forecast by Product, 2023-2033 (US$ Million, AGR%, CAGR%)
Table 16 Biologics Segment Market Forecast by Region, 2023-2033 (US$ Mn, AGR%, CAGR%)
Table 17 Biopharmaceuticals Contract Manufacturing Market Forecast by Application, 2023-2033 (US$ mn, AGR%, CAGR%)
Table 18 Biosimilars Segment Market Forecast by Region, 2023-2033 (US$ Mn, AGR%, CAGR%)
Table 19 Preclinical Segment Market Forecast by Region, 2023-2033 (US$ Mn, AGR%, CAGR%)
Table 20 Clinical Segment Market Forecast by Region, 2023-2033 (US$ Mn, AGR%, CAGR%)
Table 21 Commercial Segment Market Forecast by Region, 2023-2033 (US$ Mn, AGR%, CAGR%)
Table 22 Biopharmaceuticals Contract Manufacturing Market Forecast by Company Size, 2023-2033 (US$ Million, AGR%, CAGR%)
Table 23 Small Segment Market Forecast by Region, 2023-2033 (US$ Mn, AGR%, CAGR%)
Table 24 Mid-sized Segment Market Forecast by Region, 2023-2033 (US$ Mn, AGR%, CAGR%)
Table 25 Large Segment Market Forecast by Region, 2023-2033 (US$ Mn, AGR%, CAGR%)
Table 26 Biopharmaceuticals Contract Manufacturing Market Forecast by Region, 2023-2033 (US$ Million, AGR%, CAGR%)
Table 27 North America Biopharmaceuticals Contract Manufacturing Market Forecast by Country, 2023-2033 (US$ Million, AGR%, CAGR%)
Table 28 North America Biopharmaceuticals Contract Manufacturing Market Forecast by Source, 2023-2033 (US$ Million, AGR%, CAGR%)
Table 29 North America Biopharmaceuticals Contract Manufacturing Market Forecast by Service, 2023-2033 (US$ Million, AGR%, CAGR%)
Table 30 North America Biopharmaceuticals Contract Manufacturing Market Forecast by Product, 2023-2033 (US$ Million, AGR%, CAGR%)
Table 31 North America Biopharmaceuticals Contract Manufacturing Market Forecast by Scale of Operation, 2023-2033 (US$ Million, AGR%, CAGR%)
Table 32 North America Biopharmaceuticals Contract Manufacturing Market Forecast by Company Size, 2023-2033 (US$ Million, AGR%, CAGR%)
Table 33 U.S. Biopharmaceuticals Contract Manufacturing Market Forecast, 2023-2033 (US$ Million, AGR%, CAGR%)
Table 34 Canada Biopharmaceuticals Contract Manufacturing Market Forecast, 2023-2033 (US$ Million, AGR%, CAGR%)
Table 35 Europe Biopharmaceuticals Contract Manufacturing Market Forecast by Country, 2023-2033 (US$ Million, AGR%, CAGR%)
Table 36 Europe Biopharmaceuticals Contract Manufacturing Market Forecast by Source, 2023-2033 (US$ Million, AGR%, CAGR%)
Table 37 Europe Biopharmaceuticals Contract Manufacturing Market Forecast by Service, 2023-2033 (US$ Million, AGR%, CAGR%)
Table 38 Europe Biopharmaceuticals Contract Manufacturing Market Forecast by Product, 2023-2033 (US$ Million, AGR%, CAGR%)
Table 39 Europe Biopharmaceuticals Contract Manufacturing Market Forecast by Scale of Operation, 2023-2033 (US$ Million, AGR%, CAGR%)
Table 40 Europe Biopharmaceuticals Contract Manufacturing Market Forecast by Company Size, 2023-2033 (US$ Million, AGR%, CAGR%)
Table 41 Germany Biopharmaceuticals Contract Manufacturing Market Forecast, 2023-2033 (US$ Million, AGR%, CAGR%)
Table 42 UK Biopharmaceuticals Contract Manufacturing Market Forecast, 2023-2033 (US$ Million, AGR%, CAGR%)
Table 43 France Biopharmaceuticals Contract Manufacturing Market Forecast, 2023-2033 (US$ Million, AGR%, CAGR%)
Table 44 Italy Biopharmaceuticals Contract Manufacturing Market Forecast, 2023-2033 (US$ Million, AGR%, CAGR%)
Table 45 Spain Biopharmaceuticals Contract Manufacturing Market Forecast, 2023-2033 (US$ Million, AGR%, CAGR%)
Table 46 Russia Biopharmaceuticals Contract Manufacturing Market Forecast, 2023-2033 (US$ Million, AGR%, CAGR%)
Table 47 Rest of Europe Biopharmaceuticals Contract Manufacturing Market Forecast, 2023-2033 (US$ Million, AGR%, CAGR%)
Table 48 Asia Pacific Biopharmaceuticals Contract Manufacturing Market Forecast by Country, 2023-2033 (US$ Million, AGR%, CAGR%)
Table 49 Asia Pacific Biopharmaceuticals Contract Manufacturing Market Forecast by Source, 2023-2033 (US$ Million, AGR%, CAGR%)
Table 50 Asia Pacific Biopharmaceuticals Contract Manufacturing Market Forecast by Service, 2023-2033 (US$ Million, AGR%, CAGR%)
Table 51 Asia Pacific Biopharmaceuticals Contract Manufacturing Market Forecast by Product, 2023-2033 (US$ Million, AGR%, CAGR%)
Table 52 Asia Pacific Biopharmaceuticals Contract Manufacturing Market Forecast by Scale of Operation, 2023-2033 (US$ Million, AGR%, CAGR%)
Table 53 Asia Pacific Biopharmaceuticals Contract Manufacturing Market Forecast by Company Size, 2023-2033 (US$ Million, AGR%, CAGR%)
Table 54 Japan Biopharmaceuticals Contract Manufacturing Market Forecast, 2023-2033 (US$ Million, AGR%, CAGR%)
Table 55 China Biopharmaceuticals Contract Manufacturing Market Forecast, 2023-2033 (US$ Million, AGR%, CAGR%)
Table 56 India Biopharmaceuticals Contract Manufacturing Market Forecast, 2023-2033 (US$ Million, AGR%, CAGR%)
Table 57 Australia Biopharmaceuticals Contract Manufacturing Market Forecast, 2023-2033 (US$ Million, AGR%, CAGR%)
Table 58 South-East Asia Biopharmaceuticals Contract Manufacturing Market Forecast, 2023-2033 (US$ Million, AGR%, CAGR%)
Table 59 Rest of Asia Pacific Biopharmaceuticals Contract Manufacturing Market Forecast, 2023-2033 (US$ Million, AGR%, CAGR%)
Table 60 Latin America Biopharmaceuticals Contract Manufacturing Market Forecast by Country, 2023-2033 (US$ Million, AGR%, CAGR%)
Table 61 Latin America Biopharmaceuticals Contract Manufacturing Market Forecast by Source, 2023-2033 (US$ Million, AGR%, CAGR%)
Table 62 Latin America Biopharmaceuticals Contract Manufacturing Market Forecast by Service, 2023-2033 (US$ Million, AGR%, CAGR%)
Table 63 Latin America Biopharmaceuticals Contract Manufacturing Market Forecast by Product, 2023-2033 (US$ Million, AGR%, CAGR%)
Table 64 Latin America Biopharmaceuticals Contract Manufacturing Market Forecast by Scale of Operation, 2023-2033 (US$ Million, AGR%, CAGR%)
Table 65 Latin America Biopharmaceuticals Contract Manufacturing Market Forecast by Company Size, 2023-2033 (US$ Million, AGR%, CAGR%)
Table 66 Brazil Biopharmaceuticals Contract Manufacturing Market Forecast, 2023-2033 (US$ Million, AGR%, CAGR%)
Table 67 Mexico Biopharmaceuticals Contract Manufacturing Market Forecast, 2023-2033 (US$ Million, AGR%, CAGR%)
Table 68 Argentina Biopharmaceuticals Contract Manufacturing Market Forecast, 2023-2033 (US$ Million, AGR%, CAGR%)
Table 69 Colombia Biopharmaceuticals Contract Manufacturing Market Forecast, 2023-2033 (US$ Million, AGR%, CAGR%)
Table 70 Rest of Latin America Biopharmaceuticals Contract Manufacturing Market Forecast, 2023-2033 (US$ Million, AGR%, CAGR%)
Table 71 MEA Biopharmaceuticals Contract Manufacturing Market Forecast by Country, 2023-2033 (US$ Million, AGR%, CAGR%)
Table 72 MEA Biopharmaceuticals Contract Manufacturing Market Forecast by Source, 2023-2033 (US$ Million, AGR%, CAGR%)
Table 73 MEA Biopharmaceuticals Contract Manufacturing Market Forecast by Service, 2023-2033 (US$ Million, AGR%, CAGR%)
Table 74 MEA Biopharmaceuticals Contract Manufacturing Market Forecast by Product, 2023-2033 (US$ Million, AGR%, CAGR%)
Table 75 MEA Biopharmaceuticals Contract Manufacturing Market Forecast by Scale of Operation, 2023-2033 (US$ Million, AGR%, CAGR%)
Table 76 MEA Biopharmaceuticals Contract Manufacturing Market Forecast by Company Size, 2023-2033 (US$ Million, AGR%, CAGR%)
Table 77 GCC Biopharmaceuticals Contract Manufacturing Market Forecast, 2023-2033 (US$ Million, AGR%, CAGR%)
Table 78 South Africa Biopharmaceuticals Contract Manufacturing Market Forecast, 2023-2033 (US$ Million, AGR%, CAGR%)
Table 79 Rest of MEA Biopharmaceuticals Contract Manufacturing Market Forecast, 2023-2033 (US$ Million, AGR%, CAGR%)
Table 80 AbbVie, Inc.: Key Details, (CEO, HQ, Revenue, Founded, No. of Employees, Company Type, Website, Business Segment)
Table 81 AbbVie, Inc.: Service Benchmarking
Table 82 AbbVie, Inc.: Strategic Outlook
Table 83 AGC Biologics: Key Details, (CEO, HQ, Revenue, Founded, No. of Employees, Company Type, Website, Business Segment)
Table 84 AGC Biologics: Service Benchmarking
Table 85 AGC Biologics: Strategic Outlook
Table 86 Avantor, Inc.: Key Details, (CEO, HQ, Revenue, Founded, No. of Employees, Company Type, Website, Business Segment)
Table 87 Avantor, Inc.: Service Benchmarking
Table 88 Avantor, Inc.: Strategic Outlook
Table 89 Binex Co., Ltd.: Key Details, (CEO, HQ, Revenue, Founded, No. of Employees, Company Type, Website, Business Segment)
Table 90 Binex Co., Ltd.: Service Benchmarking
Table 91 Boehringer Ingelheim GmbH: Key Details, (CEO, HQ, Revenue, Founded, No. of Employees, Company Type, Website, Business Segment)
Table 92 Boehringer Ingelheim GmbH: Service Benchmarking
Table 93 Boehringer Ingelheim GmbH: Strategic Outlook
Table 94 FUJIFILM Diosynth Biotechnologies: Key Details, (CEO, HQ, Revenue, Founded, No. of Employees, Company Type, Website, Business Segment)
Table 95 FUJIFILM Diosynth Biotechnologies: Service Benchmarking
Table 96 FUJIFILM Diosynth Biotechnologies: Strategic Outlook
Table 97 Lonza: Key Details, (CEO, HQ, Revenue, Founded, No. of Employees, Company Type, Website, Business Segment)
Table 98 Lonza: Service Benchmarking
Table 99 Lonza: Strategic Outlook
Table 100 ProBioGen: Key Details, (CEO, HQ, Revenue, Founded, No. of Employees, Company Type, Website, Business Segment)
Table 101 ProBioGen: Service Benchmarking
Table 102 ProBioGen: Strategic Outlook
Table 103 Rentschler Biopharma SE: Key Details, (CEO, HQ, Revenue, Founded, No. of Employees, Company Type, Website, Business Segment)
Table 104 Rentschler Biopharma SE: Service Benchmarking
Table 105 Rentschler Biopharma SE: Strategic Outlook
Table 106 Samsung Biologics: Key Details, (CEO, HQ, Revenue, Founded, No. of Employees, Company Type, Website, Business Segment)
Table 107 Samsung Biologics: Service Benchmarking
Table 108 Samsung Biologics: Strategic Outlook
Table 109 Sandoz: Key Details, (CEO, HQ, Revenue, Founded, No. of Employees, Company Type, Website, Business Segment)
Table 110 Sandoz: Service Benchmarking
Table 111 Sandoz: Strategic Outlook
Table 112 TOYOBO CO., LTD.: Key Details, (CEO, HQ, Revenue, Founded, No. of Employees, Company Type, Website, Business Segment)
Table 113 TOYOBO CO., LTD.: Service Benchmarking
Table 114 WuXi Biologics: Key Details, (CEO, HQ, Revenue, Founded, No. of Employees, Company Type, Website, Business Segment)
Table 115 WuXi Biologics: Service Benchmarking
Table 116 WuXi Biologics: Strategic Outlook
Table 117 JRS PHARMA: Key Details, (CEO, HQ, Revenue, Founded, No. of Employees, Company Type, Website, Business Segment)
Table 118 JRS PHARMA: Service Benchmarking
Table 119 JRS PHARMA: Strategic Outlook
Table 120 Thermo Fisher Scientific: Key Details, (CEO, HQ, Revenue, Founded, No. of Employees, Company Type, Website, Business Segment)
Table 121 Thermo Fisher Scientific: Service Benchmarking
Table 122 Cambrex Corporation: Key Details, (CEO, HQ, Revenue, Founded, No. of Employees, Company Type, Website, Business Segment)
Table 123 Cambrex Corporation: Service Benchmarking
Table 124 Cambrex Corporation: Strategic Outlook
Table 125 Curia Global, Inc.: Key Details, (CEO, HQ, Revenue, Founded, No. of Employees, Company Type, Website, Business Segment)
Table 126 Curia Global, Inc.: Service Benchmarking
Table 127 Curia Global, Inc.: Strategic Outlook
Table 128 Pfizer CentreOne: Key Details, (CEO, HQ, Revenue, Founded, No. of Employees, Company Type, Website, Business Segment)
Table 129 Pfizer CentreOne: Service Benchmarking
Table 130 Jubilant Pharma Limited: Key Details, (CEO, HQ, Revenue, Founded, No. of Employees, Company Type, Website, Business Segment)
Table 131 Jubilant Pharma Limited: Service Benchmarking
Table 132 Catalent, Inc: Key Details, (CEO, HQ, Revenue, Founded, No. of Employees, Company Type, Website, Business Segment)
Table 133 Catalent, Inc: Service Benchmarking
Table 134 Catalent, Inc: Strategic Outlook
Table 135 KBI Biopharma: Key Details, (CEO, HQ, Revenue, Founded, No. of Employees, Company Type, Website, Business Segment)
Table 136 KBI Biopharma: Service Benchmarking
Table 137 KBI Biopharma: Strategic Outlook
Table 138 Cytiva: Key Details, (CEO, HQ, Revenue, Founded, No. of Employees, Company Type, Website, Business Segment)
Table 139 Cytiva: Service Benchmarking
Table 140 Cytiva: Strategic Outlook
図の一覧
Figure 1 Biopharmaceuticals Contract Manufacturing Market Segmentation
Figure 2 Biopharmaceuticals Contract Manufacturing Market: Market Dynamics
Figure 3 Biopharmaceuticals Contract Manufacturing Market by Region, 2023-2033 (US$ Mn, AGR %): “V” Shaped Recovery
Figure 4 Biopharmaceuticals Contract Manufacturing Market by Region, 2023-2033 (US$ Mn, AGR %): “U” Shaped Recovery
Figure 5 Biopharmaceuticals Contract Manufacturing Market by Region, 2023-2033 (US$ Mn, AGR %): “W” Shaped Recovery
Figure 6 Biopharmaceuticals Contract Manufacturing Market by Region, 2023-2033 (US$ Mn, AGR %): “L” Shaped Recovery
Figure 7 SWOT Analysis
Figure 8 Porter’s Five Forces Analysis
Figure 9 PEST Analysis
Figure 10 Biopharmaceuticals Contract Manufacturing Market Attractiveness Index by Source
Figure 11 Biopharmaceuticals Contract Manufacturing Market Forecast by Source, 2023-2033 (US$ Million, AGR %)
Figure 12 Biopharmaceuticals Contract Manufacturing Market Share Forecast by Source, 2023, 2028, 2033 (%)
Figure 13 Mammalian Segment Market Forecast by Region, 2023-2033 (US$ Million, AGR %)
Figure 14 Mammalian Segment Market Share Forecast by Region, 2023 & 2033 (%)
Figure 15 Non-mammalian Segment Market Forecast by Region, 2023-2033 (US$ Million, AGR %)
Figure 16 Non-mammalian Segment Market Share Forecast by Region, 2023 & 2033 (%)
Figure 17 Biopharmaceuticals Contract Manufacturing Market Attractiveness Index by Source
Figure 18 Biopharmaceuticals Contract Manufacturing Market Forecast by Service, 2023-2033 (US$ Million, AGR %)
Figure 19 Biopharmaceuticals Contract Manufacturing Market Share Forecast by Service, 2023, 2028, 2033 (%)
Figure 20 Process Development Segment Market Forecast by Region, 2023-2033 (US$ Million, AGR %)
Figure 21 Process Development Segment Market Share Forecast by Region, 2023 & 2033 (%)
Figure 22 Process Development Segment Market Forecast by Type, 2023-2033 (US$ Million, AGR %)
Figure 23 Fill & Finish Operations Segment Market Forecast by Region, 2023-2033 (US$ Million, AGR %)
Figure 24 Fill & Finish Operations Segment Market Share Forecast by Region, 2023 & 2033 (%)
Figure 25 Analytical & QC Studies Segment Market Forecast by Region, 2023-2033 (US$ Million, AGR %)
Figure 26 Analytical & QC Studies Segment Market Share Forecast by Region, 2023 & 2033 (%)
Figure 27 Packaging Segment Market Forecast by Region, 2023-2033 (US$ Million, AGR %)
Figure 28 Packaging Segment Market Share Forecast by Region, 2023 & 2033 (%)
Figure 29 Biopharmaceuticals Contract Manufacturing Market Attractiveness Index by Product
Figure 30 Biopharmaceuticals Contract Manufacturing Market Forecast by Product, 2023-2033 (US$ Million, AGR %)
Figure 31 Biopharmaceuticals Contract Manufacturing Market Share Forecast by Product, 2023, 2028, 2033 (%)
Figure 32 Biologics Segment Market Forecast by Region, 2023-2033 (US$ Million, AGR %)
Figure 33 Biologics Segment Market Share Forecast by Region, 2023 & 2033 (%)
Figure 34 Biologics Segment Market Forecast by Type, 2023-2033 (US$ Million, AGR %)
Figure 35 Biosimilars Segment Market Forecast by Region, 2023-2033 (US$ Million, AGR %)
Figure 36 Biosimilars Segment Market Share Forecast by Region, 2023 & 2033 (%)
Figure 37 Biopharmaceuticals Contract Manufacturing Market Attractiveness Index by Scale of Operation
Figure 38 Biopharmaceuticals Contract Manufacturing Market Forecast by Scale of Operation, 2023-2033 (US$ Million, AGR %)
Figure 39 Biopharmaceuticals Contract Manufacturing Market Share Forecast by Scale of Operation, 2023, 2028, 2033 (%)
Figure 40 Preclinical Segment Market Forecast by Region, 2023-2033 (US$ Million, AGR %)
Figure 41 Preclinical Segment Market Share Forecast by Region, 2023 & 2033 (%)
Figure 42 Clinical Segment Market Forecast by Region, 2023-2033 (US$ Million, AGR %)
Figure 43 Clinical Segment Market Share Forecast by Region, 2023 & 2033 (%)
Figure 44 Commercial Segment Market Forecast by Region, 2023-2033 (US$ Million, AGR %)
Figure 45 Commercial Segment Market Share Forecast by Region, 2023 & 2033 (%)
Figure 46 Biopharmaceuticals Contract Manufacturing Market Attractiveness Index by Company Size
Figure 47 Biopharmaceuticals Contract Manufacturing Market Forecast by Company Size, 2023-2033 (US$ Million, AGR %)
Figure 48 Biopharmaceuticals Contract Manufacturing Market Share Forecast by Company Size, 2023, 2028, 2033 (%)
Figure 49 Small Segment Market Forecast by Region, 2023-2033 (US$ Million, AGR %)
Figure 50 Small Segment Market Share Forecast by Region, 2023 & 2033 (%)
Figure 51 Mid-sized Segment Market Forecast by Region, 2023-2033 (US$ Million, AGR %)
Figure 52 Mid-sized Segment Market Share Forecast by Region, 2023 & 2033 (%)
Figure 53 Large Segment Market Forecast by Region, 2023-2033 (US$ Million, AGR %)
Figure 54 Large Segment Market Share Forecast by Region, 2023 & 2033 (%)
Figure 55 Biopharmaceuticals Contract Manufacturing Market Forecast by Region 2023, 2028, 2033 (Revenue, CAGR%)
Figure 56 Biopharmaceuticals Contract Manufacturing Market Share Forecast by Region 2023, 2028, 2033 (%)
Figure 57 Biopharmaceuticals Contract Manufacturing Market by Region, 2023-2033 (US$ Mn)
Figure 58 North America Biopharmaceuticals Contract Manufacturing Market Attractiveness Index
Figure 59 North America Biopharmaceuticals Contract Manufacturing Market by Region, 2023, 2028 & 2033 (US$ million)
Figure 60 North America Biopharmaceuticals Contract Manufacturing Market Forecast by Country, 2023-2033 (US$ Million, AGR %)
Figure 61 North America Biopharmaceuticals Contract Manufacturing Market Share Forecast by Country, 2023 & 2033 (%)
Figure 62 North America Biopharmaceuticals Contract Manufacturing Market Forecast by Source, 2023-2033 (US$ Million, AGR %)
Figure 63 North America Biopharmaceuticals Contract Manufacturing Market Share Forecast by Source, 2023 & 2033 (%)
Figure 64 North America Biopharmaceuticals Contract Manufacturing Market Forecast by Service, 2023-2033 (US$ Million, AGR %)
Figure 65 North America Biopharmaceuticals Contract Manufacturing Market Share Forecast by Service, 2023 & 2033 (%)
Figure 66 North America Biopharmaceuticals Contract Manufacturing Market Forecast by Product, 2023-2033 (US$ Million, AGR %)
Figure 67 North America Biopharmaceuticals Contract Manufacturing Market Share Forecast by Product, 2023 & 2033 (%)
Figure 68 North America Biopharmaceuticals Contract Manufacturing Market Forecast by Scale of Operation, 2023-2033 (US$ Million, AGR %)
Figure 69 North America Biopharmaceuticals Contract Manufacturing Market Share Forecast by Scale of Operation, 2023 & 2033 (%)
Figure 70 North America Biopharmaceuticals Contract Manufacturing Market Forecast by Company Size, 2023-2033 (US$ Million, AGR %)
Figure 71 North America Biopharmaceuticals Contract Manufacturing Market Share Forecast by Company Size, 2023 & 2033 (%)
Figure 72 U.S. Biopharmaceuticals Contract Manufacturing Market Forecast, 2023-2033 (US$ Million, AGR %)
Figure 73 Canada Biopharmaceuticals Contract Manufacturing Market Forecast, 2023-2033 (US$ Million, AGR %)
Figure 74 Europe Biopharmaceuticals Contract Manufacturing Market Attractiveness Index
Figure 75 Europe Biopharmaceuticals Contract Manufacturing Market by Region, 2023, 2028 & 2033 (US$ million)
Figure 76 Europe Biopharmaceuticals Contract Manufacturing Market Share Forecast by Country, 2023 & 2033 (%)
Figure 77 Europe Biopharmaceuticals Contract Manufacturing Market Forecast by Source, 2023-2033 (US$ Million, AGR %)
Figure 78 Europe Biopharmaceuticals Contract Manufacturing Market Share Forecast by Source, 2023 & 2033 (%)
Figure 79 Europe Biopharmaceuticals Contract Manufacturing Market Forecast by Service, 2023-2033 (US$ Million, AGR %)
Figure 80 Europe Biopharmaceuticals Contract Manufacturing Market Share Forecast by Service, 2023 & 2033 (%)
Figure 81 Europe Biopharmaceuticals Contract Manufacturing Market Forecast by Product, 2023-2033 (US$ Million, AGR %)
Figure 82 Europe Biopharmaceuticals Contract Manufacturing Market Share Forecast by Product, 2023 & 2033 (%)
Figure 83 Europe Biopharmaceuticals Contract Manufacturing Market Forecast by Scale of Operation, 2023-2033 (US$ Million, AGR %)
Figure 84 Europe Biopharmaceuticals Contract Manufacturing Market Share Forecast by Scale of Operation, 2023 & 2033 (%)
Figure 85 Europe Biopharmaceuticals Contract Manufacturing Market Forecast by Company Size, 2023-2033 (US$ Million, AGR %)
Figure 86 Europe Biopharmaceuticals Contract Manufacturing Market Share Forecast by Company Size, 2023 & 2033 (%)
Figure 87 Germany Biopharmaceuticals Contract Manufacturing Market Forecast, 2023-2033 (US$ million, AGR %)
Figure 88 UK Biopharmaceuticals Contract Manufacturing Market Forecast, 2023-2033 (US$ million, AGR %)
Figure 89 France Biopharmaceuticals Contract Manufacturing Market Forecast, 2023-2033 (US$ million, AGR %)
Figure 90 Italy Biopharmaceuticals Contract Manufacturing Market Forecast, 2023-2033 (US$ million, AGR %)
Figure 91 Spain Biopharmaceuticals Contract Manufacturing Market Forecast, 2023-2033 (US$ million, AGR %)
Figure 92 Russia Biopharmaceuticals Contract Manufacturing Market Forecast, 2023-2033 (US$ million, AGR %)
Figure 93 Rest of Europe Biopharmaceuticals Contract Manufacturing Market Forecast, 2023-2033 (US$ million, AGR %)
Figure 94 Asia Pacific Biopharmaceuticals Contract Manufacturing Market Attractiveness Index
Figure 95 Asia Pacific Biopharmaceuticals Contract Manufacturing Market by Region, 2023, 2028 & 2033 (US$ million)
Figure 96 Asia Pacific Biopharmaceuticals Contract Manufacturing Market Forecast by Country, 2023-2033 (US$ Million, AGR %)
Figure 97 Asia Pacific Biopharmaceuticals Contract Manufacturing Market Share Forecast by Country, 2023 & 2033 (%)
Figure 98 Asia Pacific Biopharmaceuticals Contract Manufacturing Market Forecast by Source, 2023-2033 (US$ Million, AGR %)
Figure 99 Asia Pacific Biopharmaceuticals Contract Manufacturing Market Share Forecast by Source, 2023 & 2033 (%)
Figure 100 Asia Pacific Biopharmaceuticals Contract Manufacturing Market Forecast by Service, 2023-2033 (US$ Million, AGR %)
Figure 101 Asia Pacific Biopharmaceuticals Contract Manufacturing Market Share Forecast by Service, 2023 & 2033 (%)
Figure 102 Asia Pacific Biopharmaceuticals Contract Manufacturing Market Forecast by Product, 2023-2033 (US$ Million, AGR %)
Figure 103 Asia Pacific Biopharmaceuticals Contract Manufacturing Market Share Forecast by Product, 2023 & 2033 (%)
Figure 104 Asia Pacific Biopharmaceuticals Contract Manufacturing Market Forecast by Scale of Operation, 2023-2033 (US$ Million, AGR %)
Figure 105 Asia Pacific Biopharmaceuticals Contract Manufacturing Market Share Forecast by Scale of Operation, 2023 & 2033 (%)
Figure 106 Asia Pacific Biopharmaceuticals Contract Manufacturing Market Forecast by Company Size, 2023-2033 (US$ Million, AGR %)
Figure 107 Asia Pacific Biopharmaceuticals Contract Manufacturing Market Share Forecast by Company Size, 2023 & 2033 (%)
Figure 108 Japan Biopharmaceuticals Contract Manufacturing Market Forecast, 2023-2033 (US$ million, AGR %)
Figure 109 China Biopharmaceuticals Contract Manufacturing Market Forecast, 2023-2033 (US$ million, AGR %)
Figure 110 India Biopharmaceuticals Contract Manufacturing Market Forecast, 2023-2033 (US$ million, AGR %)
Figure 111 Australia Biopharmaceuticals Contract Manufacturing Market Forecast, 2023-2033 (US$ million, AGR %)
Figure 112 South-East Asia Biopharmaceuticals Contract Manufacturing Market Forecast, 2023-2033 (US$ million, AGR %)
Figure 113 Rest of Asia Pacific Biopharmaceuticals Contract Manufacturing Market Forecast, 2023-2033 (US$ million, AGR %)
Figure 114 Latin America Biopharmaceuticals Contract Manufacturing Market Attractiveness Index
Figure 115 Latin America Biopharmaceuticals Contract Manufacturing Market by Region, 2023, 2028 & 2033 (US$ million)
Figure 116 Latin America Biopharmaceuticals Contract Manufacturing Market Share Forecast by Country, 2023 & 2033 (%)
Figure 117 Latin America Biopharmaceuticals Contract Manufacturing Market Forecast by Source, 2023-2033 (US$ Million, AGR %)
Figure 118 Latin America Biopharmaceuticals Contract Manufacturing Market Share Forecast by Source, 2023 & 2033 (%)
Figure 119 Latin America Biopharmaceuticals Contract Manufacturing Market Forecast by Service, 2023-2033 (US$ Million, AGR %)
Figure 120 Latin America Biopharmaceuticals Contract Manufacturing Market Share Forecast by Service, 2023 & 2033 (%)
Figure 121 Latin America Biopharmaceuticals Contract Manufacturing Market Forecast by Product, 2023-2033 (US$ Million, AGR %)
Figure 122 Latin America Biopharmaceuticals Contract Manufacturing Market Share Forecast by Product, 2023 & 2033 (%)
Figure 123 Latin America Biopharmaceuticals Contract Manufacturing Market Forecast by Scale of Operation, 2023-2033 (US$ Million, AGR %)
Figure 124 Latin America Biopharmaceuticals Contract Manufacturing Market Share Forecast by Scale of Operation, 2023 & 2033 (%)
Figure 125 Latin America Biopharmaceuticals Contract Manufacturing Market Forecast by Company Size, 2023-2033 (US$ Million, AGR %)
Figure 126 Latin America Biopharmaceuticals Contract Manufacturing Market Share Forecast by Company Size, 2023 & 2033 (%)
Figure 127 Brazil Biopharmaceuticals Contract Manufacturing Market Forecast, 2023-2033 (US$ million, AGR %)
Figure 128 Mexico Biopharmaceuticals Contract Manufacturing Market Forecast, 2023-2033 (US$ million, AGR %)
Figure 129 Argentina Biopharmaceuticals Contract Manufacturing Market Forecast, 2023-2033 (US$ million, AGR %)
Figure 130 Colombia Biopharmaceuticals Contract Manufacturing Market Forecast, 2023-2033 (US$ million, AGR %)
Figure 131 Rest of Latin America Biopharmaceuticals Contract Manufacturing Market Forecast, 2023-2033 (US$ million, AGR %)
Figure 132 MEA Biopharmaceuticals Contract Manufacturing Market Attractiveness Index
Figure 133 MEA Biopharmaceuticals Contract Manufacturing Market by Region, 2023, 2028 & 2033 (US$ million)
Figure 134 MEA Biopharmaceuticals Contract Manufacturing Market Forecast by Country, 2023-2033 (US$ Million, AGR %)
Figure 135 MEA Biopharmaceuticals Contract Manufacturing Market Share Forecast by Country, 2023 & 2033 (%)
Figure 136 MEA Biopharmaceuticals Contract Manufacturing Market Forecast by Source, 2023-2033 (US$ Million, AGR %)
Figure 137 MEA Biopharmaceuticals Contract Manufacturing Market Share Forecast by Source, 2023 & 2033 (%)
Figure 138 MEA Biopharmaceuticals Contract Manufacturing Market Forecast by Service, 2023-2033 (US$ Million, AGR %)
Figure 139 MEA Biopharmaceuticals Contract Manufacturing Market Share Forecast by Service, 2023 & 2033 (%)
Figure 140 MEA Biopharmaceuticals Contract Manufacturing Market Forecast by Product, 2023-2033 (US$ Million, AGR %)
Figure 141 MEA Biopharmaceuticals Contract Manufacturing Market Share Forecast by Product, 2023 & 2033 (%)
Figure 142 MEA Biopharmaceuticals Contract Manufacturing Market Forecast by Scale of Operation, 2023-2033 (US$ Million, AGR %)
Figure 143 MEA Biopharmaceuticals Contract Manufacturing Market Share Forecast by Scale of Operation, 2023 & 2033 (%)
Figure 144 MEA Biopharmaceuticals Contract Manufacturing Market Forecast by Company Size, 2023-2033 (US$ Million, AGR %)
Figure 145 MEA Biopharmaceuticals Contract Manufacturing Market Share Forecast by Company Size, 2023 & 2033 (%)
Figure 146 GCC Biopharmaceuticals Contract Manufacturing Market Forecast, 2023-2033 (US$ million, AGR %)
Figure 147 South Africa Biopharmaceuticals Contract Manufacturing Market Forecast, 2023-2033 (US$ million, AGR %)
Figure 148 Rest of MEA Biopharmaceuticals Contract Manufacturing Market Forecast, 2023-2033 (US$ million, AGR %)
Figure 149 AbbVie, Inc.: Net Revenue, 2015-2022 (US$ million, AGR%)
Figure 150 AbbVie, Inc.: R&D Expenses, 2015-2022 (US$ million, AGR%)
Figure 151 AbbVie, Inc.: Regional Market Shares, 2022 (%)
Figure 152 Avantor, Inc.: Net Revenue, 2017-2022 (US$ million, AGR%)
Figure 153 Avantor, Inc.: Regional Market Share (AGR%)
Figure 154 Boehringer Ingelheim GmbH: Net Revenue, 2015-2021 (US$ million, AGR%)
Figure 155 Lonza: Net Revenue, 2015-2022 (US$ million, AGR%)
Figure 156 Lonza: R&D Expenses, 2017-2021 (US$ million, AGR%)
Figure 157 Sandoz: Net Revenue, 2015-2022 (US$ million, AGR%)
Figure 158 Sandoz: Regional Market Share (AGR%)
Figure 159 WuXi Biologics: Net Revenue, 2015-2022 (US$ million, AGR%)
Figure 160 WuXi Biologics: Regional Market Shares, 2022 (%)
Figure 161 Thermo Fisher Scientific: Net Revenue, 2015-2022 (US$ million, AGR%)
Figure 162 Thermo Fisher Scientific: R&D, 2015-2022 (US$ million, AGR%)
Figure 163 Thermo Fisher Scientific: Regional Market Shares, 2022 (%)
Figure 164 Pfizer CentreOne: Net Revenue, 2015-2022 (US$ million, AGR%)
Figure 165 Pfizer CentreOne: R&D, 2015-2022 (US$ million, AGR%)
Figure 166 Pfizer CentreOne: Regional Market Shares, 2022 (%)
Figure 167 Catalent, Inc: Net Revenue, 2015-2022 (US$ million, AGR%)
ページTOPに戻る
- 細胞分析市場の規模、シェアおよび動向分析レポート:製品・サービス別(試薬・消耗品、機器)、手法別(フローサイトメトリー、細胞マイクロアレイ)、プロセス別、用途別、地域別、およびセグメント別予測(2026年~2033年)
- 密閉型バイオプロセス市場規模、シェアおよび動向分析レポート:製品別(バイオリアクター、発酵槽、撹拌システム)、用途別(ワクチン製造、細胞・遺伝子治療)、最終用途別(製薬・バイオテクノロジー企業)、地域別、およびセグメント別予測(2026年~2033年)
- 免疫ゲノミクス市場規模、シェアおよび動向分析レポート:タイプ別(機器、消耗品、ソフトウェア)、技術別(ポリメラーゼ連鎖反応、マイクロアレイ)、用途別(臨床用途、研究用途)、エンドユーザー別、地域別、およびセグメント別予測(2026年~2033年)
- 凍結乾燥装置およびサービス市場規模、シェア、動向分析レポート:提供形態別(装置、サービス)、事業規模別(実験室規模、パイロット規模)、用途別(診断・研究、食品産業)、地域別、およびセグメント別予測(2026年~2033年)
- 合成遺伝子回路市場規模、シェアおよび動向分析レポート:製品別(トグルスイッチ回路、発振器)、用途別(研究、治療)、最終用途別(学術・研究機関、バイオテクノロジー・製薬企業)、地域別、およびセグメント別予測(2026年~2033年)
- ウイルスベクターおよびプラスミドDNA製造市場の規模、シェア、動向分析レポート:ベクタータイプ別(レンチウイルス、アデノウイルス、レトロウイルス)、ワークフロー別、用途別(遺伝子治療、細胞治療、ワクチン学)、最終用途別、疾患別(がん、遺伝性疾患)、地域別、およびセグメント別予測(2026年~2033年)
- 血小板濃縮血漿(PRP)市場規模、シェアおよび動向分析レポート:タイプ別(純粋PRP、白血球濃縮PRP)、用途別(整形外科、スポーツ医学、美容外科、皮膚科、眼科手術)、エンドユーザー別、地域別、およびセグメント別予測(2026年~2033年)
- 細胞培養培地および細胞株市場の規模、シェア、動向分析レポート:製品別(従来型細胞株、従来型培地)、用途別(バイオ医薬品製造、診断、研究・学術機関)、最終用途別、地域別、およびセグメント別予測(2026年~2033年)
- 製品別(消耗品(キット・試薬)、機器、ソフトウェア)、技術別(PCR、キャピラリー電気泳動、NGS、マイクロアレイ、迅速DNA分析)、用途別(法医学、親子鑑定)、エンドユーザー別の人類識別市場 ― 2031年までの世界予測
- Next-Generation Sequencing Market by Product Type (Consumables, Platforms, Bioinformatics), Technology (SBS, Nanopore), Workflow (Sequencing, Data Analysis), Services, Application (Drug Discovery, Diagnostic, Agriculture) - Global Forecast to 2030
関連レポート(キーワード「バイオ医薬品」)
よくあるご質問
Visiongain社はどのような調査会社ですか?
英国の調査会社ヴィジョンゲイン社(Visiongain)は、通信とエネルギーのほか、自動車や化学・医薬品、金属など、広範な市場を対象に調査を行っています。自動車市場については、市場全般に関する調査のほ... もっと見る
調査レポートの納品までの日数はどの程度ですか?
在庫のあるものは速納となりますが、平均的には 3-4日と見て下さい。
但し、一部の調査レポートでは、発注を受けた段階で内容更新をして納品をする場合もあります。
発注をする前のお問合せをお願いします。
注文の手続きはどのようになっていますか?
1)お客様からの御問い合わせをいただきます。
2)見積書やサンプルの提示をいたします。
3)お客様指定、もしくは弊社の発注書をメール添付にて発送してください。
4)データリソース社からレポート発行元の調査会社へ納品手配します。
5) 調査会社からお客様へ納品されます。最近は、pdfにてのメール納品が大半です。
お支払方法の方法はどのようになっていますか?
納品と同時にデータリソース社よりお客様へ請求書(必要に応じて納品書も)を発送いたします。
お客様よりデータリソース社へ(通常は円払い)の御振り込みをお願いします。
請求書は、納品日の日付で発行しますので、翌月最終営業日までの当社指定口座への振込みをお願いします。振込み手数料は御社負担にてお願いします。
お客様の御支払い条件が60日以上の場合は御相談ください。
尚、初めてのお取引先や個人の場合、前払いをお願いすることもあります。ご了承のほど、お願いします。
データリソース社はどのような会社ですか?
当社は、世界各国の主要調査会社・レポート出版社と提携し、世界各国の市場調査レポートや技術動向レポートなどを日本国内の企業・公官庁及び教育研究機関に提供しております。
世界各国の「市場・技術・法規制などの」実情を調査・収集される時には、データリソース社にご相談ください。
お客様の御要望にあったデータや情報を抽出する為のレポート紹介や調査のアドバイスも致します。
|
|


