プリンテッドエレクトロニクス市場レポート 2023-2033
Printed Electronics Market Report 2023-2033
レポート詳細
プリンテッドエレクトロニクス市場レポート 2023-2033 :本レポートは、新たな収益源の開拓を目指すリーディングカンパニーにとって、業界とその基礎となる力学をより深く理解する上で、... もっと見る
※上記価格は部署ライセンス(Departmental licence)価格です。
その他の価格についてはデータリソースまでお問合せください。
日本語のページは自動翻訳を利用し作成しています。
実際のレポートは英文のみでご納品いたします。

|

|
サマリー
レポート詳細
プリンテッドエレクトロニクス市場レポート 2023-2033:本レポートは、新たな収益源の開拓を目指すリーディングカンパニーにとって、業界とその基礎となる力学をより深く理解する上で、非常に貴重なものとなるでしょう。また、異業種への進出や新地域での既存事業の拡大を目指す企業にとっても有益なレポートです。
プリンテッドエレクトロニクス市場は今後大きく成長・発展する見込み
プリンテッドエレクトロニクス市場は、急速に発展している有望な産業であり、幅広い用途が期待されています。フレキシブルで軽量、かつコスト効率の高いエレクトロニクスソリューションを生み出すことができるため、市場は今後数年間で大きく成長すると予想されています。この市場はまだ比較的新しく、大きな技術革新が行われていますが、近年は注目すべき発展や進歩が見られます。新素材や印刷技術の開発、さまざまな産業におけるプリンテッドエレクトロニクスの統合が進んでおり、今後も成長と採用が促進されると予想されます。
市場では、国内外を問わず投資や提携が増加しており、これが業界の拡大に寄与しています。また、世界各国の政府も資金援助や研究イニシアティブを通じてプリンテッドエレクトロニクスの開発を支援しています。しかし、プリンテッドエレクトロニクスの標準化や信頼性向上の必要性、拡張性や法規制への対応など、克服すべき課題も残っています。
全体として、プリンテッドエレクトロニクス市場は、幅広い潜在的なアプリケーションとイノベーションの機会を備え、今後数年間で大きく成長・発展する態勢を整えています。各社が研究開発への投資を続け、フレキシブルで軽量、かつコスト効率の高い電子ソリューションへの需要が高まる中、プリンテッドエレクトロニクス産業の未来は明るいと思われます。
マーケットリサーチレポートを購入する前に、どのような質問をするべきか?
- プリンテッドエレクトロニクス市場はどのように進化しているのか?
- プリンテッドエレクトロニクス市場を牽引し、抑制しているものは何か?
- 各プリンテッドエレクトロニクスサブマーケットセグメントは予測期間中にどのように成長し、2033年にこれらのサブマーケットが占める売上はどの程度になるのか?
- 2023年から2033年にかけて、各プリンテッドエレクトロニクスサブマーケットの市場シェアはどのように推移するのか?
- 2023年から2033年にかけて、市場全体の主な牽引役となるのは何か?
- 主要なプリンテッドエレクトロニクス市場はマクロ経済ダイナミクスに広く追随するのか、それとも個々の国別市場が他を凌駕するのか?
- 2033年までに各国市場のシェアはどのように変化し、2033年に市場をリードするのはどの地域か?
- 主要プレイヤーは誰で、予測期間中の見通しは?
- これらの主要企業のプリンテッドエレクトロニクスプロジェクトはどのようなものか?
- 2023年から2033年の間に、業界はどのように進化していくのか?現在および今後10年間に実施されるプリンテッドエレクトロニクス・プロジェクトにはどのような意味があるのか?
- プリンテッドエレクトロニクス市場をさらに拡大するために、製品の商業化の必要性は高まっているのか?
- プリンテッドエレクトロニクス市場はどこへ向かっているのか、そして市場の最前線に立つためにはどうすればよいのか?
- 新製品やサービスラインに対する最適な投資オプションは何か?
- 企業を新たな成長軌道に乗せ、C-suiteに移行させるための重要な展望は何か?
このことが、現在、そして今後10年間のプリンテッドエレクトロニクス市場にどのような影響を与えるかを見極める必要があります:
- 284ページにわたる本レポートでは、103の表と147のチャート/グラフを独占的に提供します。
- 本レポートでは、業界における主要な収益性の高い分野を取り上げているため、今すぐその分野をターゲットにすることができます。
- 世界、地域、国の売上高と成長率を詳細に分析しています。
- 競合他社が成功した主要なトレンド、変化、収益予測をハイライトしています。
本レポートは、プリンテッドエレクトロニクス市場が今後10年間でどのように発展していくか、またCOVID-19の景気後退や景気回復の変動に合わせて、その動向をお伝えします。この市場は、過去10年間のどの時点よりも、今がより重要なのです。
2033年までの予測やその他の分析により、商業的な展望を明らかにする。
- 2033年までの収益予測に加え、直近の実績や成長率、市場シェアなど、本調査では
- ビジネスの展望や展開など、独自の分析がご覧いただけます。
- 定性的分析(市場力学、促進要因、機会、阻害要因、課題など)、コスト構造、プリンテッドエレクトロニクス価格上昇の影響、最近の動向などをご覧いただけます。
本レポートでは、COVID-19が業界や貴社にどのような影響を与えるかについて、データ分析および貴重な知見を提供しています。COVID-19の4つの回収パターン、すなわち「V」「L」「W」「U」の回収パターンとその影響について考察しています。
報告書の対象セグメント
印刷技術別市場セグメント
- スクリーン印刷
- インクジェットプリンティング
- フレキソ印刷
- その他の印刷技術
エンドユーザー産業別市場セグメント
- 自動車・輸送機器
- コンシューマーエレクトロニクス
- 航空宇宙・防衛
- リテール&パッケージ
- その他の最終用途産業
デバ イス別市場セグメント
- フレキシブルディスプレイ
- RFIDタグ
- スマートパッケージング
- ウェアラブルデバイス
- 有機発光ダイオード(OLEDs)
- その他のデバイス
世界市場全体およびセグメントの収益予測に加え、4地域および主要20カ国市場の収益予測も掲載しています:
北米
- 米国
- カナダ
欧州
- ドイツ
- スペイン
- イギリス
- フランス
- イタリア
- その他の欧州地域
アジア太平洋
- 中国
- 日本
- インド
- 台湾
- 韓国
- その他のアジア太平洋地域
ラテンアメリカ
- ブラジル
- メキシコ
- ラテンアメリカの残りの地域
中近東・アフリカ
- GCC
- 南アフリカ
- その他の中東・アフリカ地域
プリンテッドエレクトロニクス市場の2023年から2033年にかけての主要企業のプロファイルと、これらの企業のこのセグメントに焦点を当てたいくつかの企業についても記載しています。
主要企業と市場成長の可能性
・ Agfa-Gevaert N.V
・ Applied Ink Solutions
・ BASF SE
・ Cambridge Display Technology
・ DuPont de Nemours, Inc.
・ E Ink Holdings Inc.
・ Jabil Inc.
・ LG Display Co., Ltd.
・ Molex LLC
・ Nissha Co., Ltd.
・ NovaCentrix
・ Optomec Inc.
・ Palo Alto Research Center Incorporated (PARC)
・ Samsung Electronics Co., Ltd.
・ Ynvisible Interactive Inc.
プリンテッドエレクトロニクス市場の世界全体の収益、金額ベースで2023年から2033年まで、市場は2023年に108億8000万米ドルを突破すると、当研究所は計算しています。2033年まで収益が大きく伸びることが予測されます。当研究所では、最も大きな可能性を秘めた企業を特定しています。彼らの能力、進歩、商業的展望を発見することで、先手を打つことができます。
プリンテッドエレクトロニクス市場、2023年から2033年までのレポートはどのように役立つのでしょうか?
要約すると、280ページ以上のレポートでは、以下のような知識を得ることができます:
- プリンテッドエレクトロニクス市場、2023年から2033年までの収益予測 世界および地域レベルでのプリント技術、エンドユーザー産業、デバイス、企業規模の各予測を掲載 - 業界の展望を発見し、投資や収益に最も有利な場所を見つけることができます。
- 4つの地域と20の主要国市場の2033年までの収益予測 - 北米、欧州、アジア太平洋、ラテンアメリカ、中東・アフリカのプリンテッドエレクトロニクス市場、2023年から2033年の市場予測をご覧いただけます。また、米国、カナダ、ブラジル、ドイツ、フランス、英国、イタリア、中国、インド、日本、オーストラリアなど、著名な経済圏の市場も予測しています。
- 2023年から2033年までのプリンテッドエレクトロニクス市場に関わる主要企業15社の企業プロファイルを含む、既存企業および市場参入を目指す企業の展望。
独自の予測による定量・定性分析をご覧いただけます。私たちのレポートだけが持つ情報を入手し、貴重なビジネスインテリジェンスとして情報を得ることができます。
他にはない情報
私たちの新しいレポートがあれば、知識に遅れをとったり、チャンスを逃したりする可能性は低くなります。私たちの仕事があなたの調査、分析、意思決定にどのように役立つかをご覧ください。Visiongainの研究は、プリンテッドエレクトロニクス市場、2023年から2033年、市場の主要企業のための商業分析を必要とするすべての人のためのものです。データ、トレンド、予測を見つけることができます。
ページTOPに戻る
目次
目次
1 レポートの概要
1.1 研究の目的
1.2 プリンテッドエレクトロニクス市場の紹介
1.3 この報告書がもたらすもの
1.4 本レポートを読むべき理由
1.本分析レポートが回答する5つの重要な質問
1.6 本レポートは誰のためのものか?
1.7 調査方法
1.7.1 市場の定義
1.7.2 市場評価・予測手法
1.7.3 データバリデーション
1.7.3.1 一次調査
1.7.3.2 二次調査
1.8 よくある質問(FAQ)
1.9 関連するVisiongainのレポート
1.10 ビジョンゲインについて
2 エグゼクティブサマリー
2.1 セグメント別分析
2.1.1 プリンティング技術セグメント:市場魅力度指数
2.1.2 エンドユース産業セグメント:市場魅力度指数
2.1.3 デバイス分野市場魅力度指数
2.2 地域別分析
3 市場の概要
3.1 キーファインディング
3.2 マーケットダイナミクス
3.2.1 市場促進要因
3.2.1.1 プリンテッドエレクトロニクス設計者の必須ツールであるラピッドプロトタイピング
3.2.1.2 プリンテッドエレクトロニクスの量産化
3.2.1.3 プリンテッドエレクトロニクス製造のコスト
3.2.2 市場の抑制要因
3.2.2.1 プリンテッドエレクトロニクスの機能の限定性
3.2.2.2 プリンテッドエレクトロニクスの環境負荷について
3.2.3 マーケットオポチュニティ
3.2.3.1 ヘルスケア産業はプリンテッドエレクトロニクスに数多くの機会を提供する
3.2.3.2 エネルギーハーベスティングデバイスの開発にプリンテッドエレクトロニクスを活用する動きが活発化
3.2.3.3 プリンテッドエレクトロニクスは自動車産業において様々な機会を提供する
3.3 COVID-19の影響度分析
3.4 ポーターのファイブフォース分析
3.4.1 サプライヤーのバーゲニングパワー
3.4.2 バイヤーのバーゲニングパワー
3.4.3 競争力のあるライバル
3.4.4 代替品による脅威
3.4.5 新規参入の脅威
3.5 PEST分析
3.5.1 政治的要因
3.5.2 経済的要因
3.5.3 社会的要因
3.5.4 技術的要因
4 プリンテッドエレクトロニクスの市場分析:印刷技術別
4.1 キーファインディング
4.2 プリンティング技術セグメント:市場魅力度指数
4.3 プリンテッドエレクトロニクスの印刷技術別市場規模の推定と予測
4.4 スクリーン印刷
4.4.1 地域別市場規模、2023-2033年(US$ bn)
4.4.2 2023年&2033年地域別市場シェア(%)
4.5 インクジェットプリンター
4.5.1 地域別市場規模、2023-2033年(US$ bn)
4.5.2 2023年&2033年地域別市場シェア(%)
4.6 フレキソ印刷
4.6.1 地域別市場規模、2023-2033年(US$ bn)
4.6.2 2023年&2033年地域別市場シェア(%)
4.7 その他の印刷技術
4.7.1 地域別市場規模、2023-2033年(US$ bn)
4.7.2 2023年&2033年地域別市場シェア(%)
5 プリンテッドエレクトロニクス市場分析:エンドユーザー産業別
5.1 キーファインディング
5.2 エンドユーザー産業セグメント:市場魅力度指数
5.3 プリンテッドエレクトロニクスのエンドユーザー産業別市場規模の推定と予測
5.4 自動車・輸送
5.4.1 地域別市場規模、2023-2033年(US$ bn)
5.4.2 2023年&2033年地域別市場シェア(%)
5.5 コンシューマーエレクトロニクス
5.5.1 地域別市場規模、2023-2033年(US$ bn)
5.5.2 2023年&2033年地域別市場シェア(%)
5.6 航空宇宙・防衛
5.6.1 地域別市場規模、2023-2033年(US$ bn)
5.6.2 2023年&2033年地域別市場シェア(%)
5.7 小売・パッケージ
5.7.1 地域別市場規模、2023-2033年(US$ bn)
5.7.2 2023年&2033年地域別市場シェア(%)
5.8 その他のエンドユーザー産業
5.8.1 地域別市場規模、2023-2033年(US$ bn)
5.8.2 2023年&2033年地域別市場シェア(%)
6 プリンテッドエレクトロニクス市場分析:デバイス別
6.1 キーファインディング
6.2 デバイスのセグメント:市場魅力度指数
6.3 プリンテッドエレクトロニクスのデバイス別市場規模の推定と予測
6.4 フレキシブルディスプレイ
6.4.1 地域別市場規模、2023-2033年(US$ bn)
6.4.2 2023年&2033年地域別市場シェア(%)
6.5 RFIDタグ
6.5.1 地域別市場規模、2023-2033年(US$ bn)
6.5.2 2023年&2033年地域別市場シェア(%)
6.6 スマートパッケージング
6.6.1 地域別市場規模、2023-2033年(US$ bn)
6.6.2 2023年&2033年地域別市場シェア(%)
6.7 ウェアラブルデバイス
6.7.1 地域別市場規模、2023-2033年(US$ bn)
6.7.2 2023年&2033年地域別市場シェア(%)
6.8 有機発光ダイオード(OLEDs)
6.8.1 地域別市場規模、2023-2033年(US$ bn)
6.8.2 2023年&2033年地域別市場シェア(%)
6.9 その他のデバイス
6.9.1 地域別市場規模、2023-2033年(US$ bn)
6.9.2 2023年&2033年地域別市場シェア(%)
7 プリンテッドエレクトロニクス市場分析:地域別
7.1 キーファインディング
7.2 地域別市場規模の推計と予測
8 北米のプリンテッドエレクトロニクス市場分析
8.1 キーファインディング
8.2 北米プリンテッドエレクトロニクス市場魅力度指数
8.3 北米プリンテッドエレクトロニクス国別市場規模推計と予測
8.4 北米プリンテッドエレクトロニクスの印刷技術別市場規模の推定と予測
8.5 北米プリンテッドエレクトロニクスのエンドユーザー産業別市場規模の推定と予測
8.6 北米プリンテッドエレクトロニクスのデバイス別市場規模の推定と予測
8.7 米国のプリンテッドエレクトロニクス市場分析
8.8 カナダのプリンテッドエレクトロニクス市場分析
9 欧州のプリンテッドエレクトロニクス市場分析
9.1 キーファインディング
9.2 欧州プリンテッドエレクトロニクス市場魅力度指数
9.3 欧州プリンテッドエレクトロニクス国別市場規模推計と予測
9.4 欧州プリンテッドエレクトロニクスの印刷技術別市場規模の推定と予測
9.5 欧州プリンテッドエレクトロニクスのエンドユーザー産業別市場規模推計と予測
9.6 欧州プリンテッドエレクトロニクスのデバイス別市場規模予測・予測
9.7 ドイツ プリンテッドエレクトロニクス市場分析
9.8 英国プリンテッドエレクトロニクス市場分析
9.9 フランス プリンテッドエレクトロニクス市場分析
9.10 イタリア プリンテッドエレクトロニクス市場分析
9.11 スペイン プリンテッドエレクトロニクス市場分析
9.12 その他の欧州のプリンテッドエレクトロニクス市場分析
10 アジア太平洋地域のプリンテッドエレクトロニクス市場分析
10.1 キーファインディング
10.2 アジア太平洋地域のプリンテッドエレクトロニクス市場魅力度指数
10.3 アジア太平洋地域のプリンテッドエレクトロニクス国別市場規模推定と予測
10.4 アジア太平洋地域のプリンテッドエレクトロニクスの印刷技術別市場規模推定と予測
10.5 アジア太平洋地域のプリンテッドエレクトロニクスのエンドユーザー産業別市場規模の推定と予測
10.6 アジア太平洋地域のプリンテッドエレクトロニクスのデバイス別市場規模予測と予測
10.7 中国プリンテッドエレクトロニクス市場分析
10.8 インド プリンテッドエレクトロニクス市場分析
10.9 日本プリンテッドエレクトロニクス市場分析
10.10 韓国プリンテッドエレクトロニクス市場分析
10.11 台湾プリンテッドエレクトロニクス市場分析
10.12 その他のアジア太平洋地域のプリンテッドエレクトロニクス市場分析
11 中東・アフリカのプリンテッドエレクトロニクス市場分析
11.1 キーファインディング
11.2 中東・アフリカ プリンテッドエレクトロニクス市場魅力度指数
11.3 中東・アフリカ プリンテッドエレクトロニクス国別市場規模の推定と予測
11.4 中東・アフリカ プリンテッドエレクトロニクスの印刷技術別市場規模の推定と予測
11.5 中東・アフリカ プリンテッドエレクトロニクスのエンドユーザー産業別市場規模の推定と予測
11.6 中東・アフリカ プリンテッドエレクトロニクスのデバイス別市場規模の推定と予測
11.7 GCCプリンテッドエレクトロニクス市場分析
11.8 南アフリカのプリンテッドエレクトロニクス市場分析
11.9 その他の中東・アフリカ地域 プリンテッドエレクトロニクス市場分析
12 ラテンアメリカのプリンテッドエレクトロニクス市場分析
12.1 キーファインディング
12.2 ラテンアメリカ プリンテッドエレクトロニクス市場魅力度指数
12.3 ラテンアメリカ プリンテッドエレクトロニクス国別市場規模の推定と予測
12.4 ラテンアメリカ プリンテッドエレクトロニクスの印刷技術別市場規模予測・予測
12.5 ラテンアメリカ プリンテッドエレクトロニクスのエンドユーザー産業別市場規模推定と予測
12.6 ラテンアメリカ プリンテッドエレクトロニクスのデバイス別市場規模予測と予測
12.7 ブラジルのプリンテッドエレクトロニクス市場分析
12.8 メキシコのプリンテッドエレクトロニクス市場分析
12.9 ラテンアメリカのその他の地域のプリンテッドエレクトロニクス市場分析
13 会社概要
13.1 競合他社の状況、2021年
13.2 戦略的展望
13.2.1 主要なビジネス戦略としての契約
13.2.2 主要なビジネス戦略としてのパートナーシップ
13.2.3 主要なビジネス戦略としての新製品発売
13.3 Samsung Electronics Co., Ltd.
13.3.1 会社概要
13.3.2 会社概要
13.3.3 財務分析
13.3.3.1 純収益、2018年~2022年
13.3.3.2 R&D、2018年~2022年
13.3.3.3 地域別市場シェア、2022年
13.3.3.4 事業セグメント別市場シェア、2022年
13.3.4 製品ベンチマーキング
13.4 LG Display Co., Ltd.
13.4.1 企業スナップショット
13.4.2 会社概要
13.4.3 財務分析
13.4.3.1 純収益、2017-2021年
13.4.3.2 R&D、2017年~2021年
13.4.3.3 地域別市場シェア、2022年
13.4.3.4 事業セグメント別市場シェア、2022年
13.4.4 製品ベンチマーキング
13.4.5 戦略的な展望
13.5 Molex LLC
13.5.1 企業スナップショット
13.5.2 会社概要
13.5.3 製品ベンチマーキング
13.5.4 戦略的な展望
13.6 Agfa-Gevaert N.V
13.6.1 会社概要
13.6.2 会社概要
13.6.3 財務分析
13.6.3.1 純収益、2018年~2022年
13.6.3.2 R&D、2018年~2022年
13.6.3.3 地域別市場シェア、2022年
13.6.3.4 事業セグメント別市場シェア、2022年
13.6.4 製品ベンチマーキング
13.6.5 戦略的な展望
13.7 Palo Alto Research Center Incorporated (PARC)
13.7.1 企業スナップショット
13.7.2 会社概要
13.7.3 製品ベンチマーキング
13.8 DuPont de Nemours, Inc.
13.8.1 企業スナップショット
13.8.2 会社概要
13.8.3 財務分析
13.8.3.1 純収益、2018年~2022年
13.8.3.2 R&D、2018年~2022年
13.8.3.3 地域別市場占有率、2022年
13.8.3.4 事業セグメント別市場シェア、2022年
13.8.4 製品ベンチマーキング
13.8.5 戦略的な展望
13.9 Nissha Co., Ltd.
13.9.1 会社概要
13.9.2 会社概要
13.9.3 製品ベンチマーキング
13.10 BASF SE
13.10.1 企業スナップショット
13.10.2 会社概要
13.10.3 財務分析
13.10.3.1 純収益、2018年~2022年
13.10.3.2 R&D、2018年~2022年
13.10.3.3 地域別市場占有率、2022年
13.10.3.4 事業セグメント別市場シェア、2022年
13.10.4 製品ベンチマーキング
13.11 NovaCentrix
13.11.1 企業スナップショット
13.11.2 会社概要
13.11.3 製品ベンチマーキング
13.11.4 戦略的な展望
13.12 E Ink Holdings Inc.
13.12.1 企業スナップショット
13.12.2 会社概要
13.12.3 財務分析
13.12.3.1 純収益、2017-2021年
13.12.3.2 R&D、2018年~2022年
13.12.3.3 地域別市場シェア、2021年
13.12.3.4 ビジネスセグメント市場シェア、2021年
13.12.4 製品ベンチマーキング
13.12.5 戦略的な展望
13.13 Ynvisible Interactive Inc.
13.13.1 企業スナップショット
13.13.2 会社概要
13.13.3 製品ベンチマーキング
13.13.4 戦略的な展望
13.14 Jabil Inc.
13.14.1 企業スナップショット
13.14.2 会社概要
13.14.3 財務分析
13.14.3.1 純収益、2018年~2022年
13.14.3.2 R&D、2018年~2022年
13.14.3.3 地域別市場シェア(2021年
13.14.3.4 ビジネスセグメント市場シェア、2021年
13.14.4 製品ベンチマーキング
13.14.5 戦略的な展望
13.15 Optomec Inc
13.15.1 企業スナップショット
13.15.2 会社概要
13.15.3 製品ベンチマーキング
13.16 Cambridge Display Technology
13.16.1 企業スナップショット
13.16.2 会社概要
13.16.3 製品ベンチマーキング
13.17 Applied Ink Solutions
13.17.1 企業スナップショット
13.17.2 会社概要
13.17.3 製品ベンチマーキング
14 結論と提言
14.1 ビジョンゲインからの結びの言葉
14.2 市場関係者への提言
表の一覧
Table 1 Printed Electronics Market Snapshot, 2023 & 2033 (US$ billion, CAGR %)
Table 2 Global Printed Electronics Market by Region, 2023-2033 (US$ Bn, AGR (%), CAGR (%)) (V-Shaped Recovery Scenario)
Table 3 Global Printed Electronics Market by Region, 2023-2033 (US$ Bn, AGR (%), CAGR (%)) (W-Shaped Recovery Scenario)
Table 4 Global Printed Electronics Market by Region, 2023-2033 (US$ Bn, AGR (%), CAGR (%)) (L-Shaped Recovery Scenario)
Table 5 Global Printed Electronics Market by Region, 2023-2033 (US$ Bn, AGR (%), CAGR (%)) (U-Shaped Recovery Scenario)
Table 6 Global Printed Electronics Market by Printing Technology, 2023-2033 (US$ Bn, AGR (%), CAGR (%))
Table 7 Screen Printing Market by Region, 2023-2033 (US$ Bn, AGR (%), CAGR (%))
Table 8 Inkjet Printing Market by Region, 2023-2033 (US$ Bn, AGR (%), CAGR (%))
Table 9 Flexographic Printing Market by Region, 2023-2033 (US$ Bn, AGR (%), CAGR (%))
Table 10 Other Printing Technologies Market by Region, 2023-2033 (US$ Bn, AGR (%), CAGR (%))
Table 11 Global Printed Electronics Market by End-Use Industry, 2023-2033 (US$ Bn, AGR (%), CAGR (%))
Table 12 Automotive & Transportation Market by Region, 2023-2033 (US$ Bn, AGR (%), CAGR (%))
Table 13 Consumer Electronics Market by Region, 2023-2033 (US$ Bn, AGR (%), CAGR (%))
Table 14 Aerospace & Defense Market by Region, 2023-2033 (US$ Bn, AGR (%), CAGR (%))
Table 15 Retail & Packaging Market by Region, 2023-2033 (US$ Bn, AGR (%), CAGR (%))
Table 16 Other End-use Industries Market by Region, 2023-2033 (US$ Bn, AGR (%), CAGR (%))
Table 17 Global Printed Electronics Market by Devices, 2023-2033 (US$ Bn, AGR (%), CAGR (%))
Table 18 Flexible Displays Market by Region, 2023-2033 (US$ Bn, AGR (%), CAGR (%))
Table 19 RFID Tags Market by Region, 2023-2033 (US$ Bn, AGR (%), CAGR (%))
Table 20 Smart Packaging Market by Region, 2023-2033 (US$ Bn, AGR (%), CAGR (%))
Table 21 Wearable Devices Market by Region, 2023-2033 (US$ Bn, AGR (%), CAGR (%))
Table 22 Organic Light-Emitting Diodes (OLEDs) Market by Region, 2023-2033 (US$ Bn, AGR (%), CAGR (%))
Table 23 Other Devices Market by Region, 2023-2033 (US$ Bn, AGR (%), CAGR (%))
Table 24 Global Printed Electronics Market by Region, 2023-2033 (US$ Bn, AGR (%), CAGR (%))
Table 25 North America Printed Electronics Market by Country, 2023-2033 (US$ Bn, AGR (%), CAGR (%))
Table 26 North America Printed Electronics Market by Printing Technology, 2023-2033 (US$ Bn, AGR (%), CAGR (%))
Table 27 North America Printed Electronics Market by End-Use Industry, 2023-2033 (US$ Bn, AGR (%), CAGR (%))
Table 28 North America Printed Electronics Market by Devices, 2023-2033 (US$ Bn, AGR (%), CAGR (%))
Table 29 US Printed Electronics Market by Value, 2023-2033 (US$ Bn, AGR (%), CAGR (%))
Table 30 Canada Printed Electronics Market by Value, 2023-2033 (US$ Bn, AGR (%), CAGR (%))
Table 31 Europe Printed Electronics Market by Country, 2023-2033 (US$ Bn, AGR (%), CAGR (%))
Table 32 Europe Printed Electronics Market by Printing Technology, 2023-2033 (US$ Bn, AGR (%), CAGR (%))
Table 33 Europe Printed Electronics Market by End-Use Industry, 2023-2033 (US$ Bn, AGR (%), CAGR (%))
Table 34 Europe Printed Electronics Market by Devices, 2023-2033 (US$ Bn, AGR (%), CAGR (%))
Table 35 Germany Printed Electronics Market by Value, 2023-2033 (US$ Bn, AGR (%), CAGR (%))
Table 36 UK Printed Electronics Market by Value, 2023-2033 (US$ Bn, AGR (%), CAGR (%))
Table 37 France Printed Electronics Market by Value, 2023-2033 (US$ Bn, AGR (%), CAGR (%))
Table 38 Italy Printed Electronics Market by Value, 2023-2033 (US$ Bn, AGR (%), CAGR (%))
Table 39 Spain Printed Electronics Market by Value, 2023-2033 (US$ Bn, AGR (%), CAGR (%))
Table 40 Rest of Europe Printed Electronics Market by Value, 2023-2033 (US$ Bn, AGR (%), CAGR (%))
Table 41 Asia-Pacific Printed Electronics Market by Country, 2023-2033 (US$ Bn, AGR (%), CAGR (%))
Table 42 Asia-Pacific Printed Electronics Market by Printing Technology, 2023-2033 (US$ Bn, AGR (%), CAGR (%))
Table 43 Asia-Pacific Printed Electronics Market by End-Use Industry, 2023-2033 (US$ Bn, AGR (%), CAGR (%))
Table 44 Asia-Pacific Printed Electronics Market by Devices, 2023-2033 (US$ Bn, AGR (%), CAGR (%))
Table 45 China Printed Electronics Market by Value, 2023-2033 (US$ Bn, AGR (%), CAGR (%))
Table 46 India Printed Electronics Market by Value, 2023-2033 (US$ Bn, AGR (%), CAGR (%))
Table 47 Japan Printed Electronics Market by Value, 2023-2033 (US$ Bn, AGR (%), CAGR (%))
Table 48 South Korea Printed Electronics Market by Value, 2023-2033 (US$ Bn, AGR (%), CAGR (%))
Table 49 Taiwan Printed Electronics Market by Value, 2023-2033 (US$ Bn, AGR (%), CAGR (%))
Table 50 Rest of Asia-Pacific Printed Electronics Market by Value, 2023-2033 (US$ Bn, AGR (%), CAGR (%))
Table 51 Middle East & Africa Printed Electronics Market by Country, 2023-2033 (US$ Bn, AGR (%), CAGR (%))
Table 52 Middle East & Africa Printed Electronics Market by Printing Technology, 2023-2033 (US$ Bn, AGR (%), CAGR (%))
Table 53 Middle East & Africa Printed Electronics Market by End-Use Industry, 2023-2033 (US$ Bn, AGR (%), CAGR (%))
Table 54 Middle East & Africa Printed Electronics Market by Devices, 2023-2033 (US$ Bn, AGR (%), CAGR (%))
Table 55 GCC Printed Electronics Market by Value, 2023-2033 (US$ Bn, AGR (%), CAGR (%))
Table 56 South Africa Printed Electronics Market by Value, 2023-2033 (US$ Bn, AGR (%), CAGR (%))
Table 57 Rest of Middle East & Africa Printed Electronics Market by Value, 2023-2033 (US$ Bn, AGR (%), CAGR (%))
Table 58 Latin America Printed Electronics Market by Country, 2023-2033 (US$ Bn, AGR (%), CAGR (%))
Table 59 Latin America Printed Electronics Market by Printing Technology, 2023-2033 (US$ Bn, AGR (%), CAGR (%))
Table 60 Latin America Printed Electronics Market by End-Use Industry, 2023-2033 (US$ Bn, AGR (%), CAGR (%))
Table 61 Latin America Printed Electronics Market Share Forecast by End-Use Industry,2023 & 2033 (%)
Table 62 Latin America Printed Electronics Market by Devices, 2023-2033 (US$ Bn, AGR (%), CAGR (%))
Table 63 Brazil Printed Electronics Market by Value, 2023-2033 (US$ Bn, AGR (%), CAGR (%))
Table 64 Mexico Printed Electronics Market by Value, 2023-2033 (US$ Bn, AGR (%), CAGR (%))
Table 65 Rest of Latin America Printed Electronics Market by Value, 2023-2033 (US$ Bn, AGR (%), CAGR (%))
Table 66 Samsung Electronics Co., Ltd.: Key Details, (CEO, HQ, Revenue, Founded, No. of Employees, Company Type, Website, Business Segment)
Table 67 Samsung Electronics Co., Ltd: Product Benchmarking
Table 68 LG Display Co., Ltd.: Key Details, (CEO, HQ, Revenue, Founded, No. of Employees, Company Type, Website, Business Segment)
Table 69 LG Display Co., Ltd.: Product Benchmarking
Table 70 LG Display Co., Ltd.: Strategic Outlook
Table 71 Molex LLC: Key Details, (CEO, HQ, Revenue, Founded, No. of Employees, Company Type, Website, Business Segment)
Table 72 Molex LLC: Product Benchmarking
Table 73 Molex LLC: Strategic Outlook
Table 74 Agfa-Gevaert N.V: Key Details, (CEO, HQ, Revenue, Founded, No. of Employees, Company Type, Website, Business Segment)
Table 75 Agfa-Gevaert N.V: Product Benchmarking
Table 76 Agfa-Gevaert N.V: Strategic Outlook
Table 77 Palo Alto Research Center Incorporated (PARC): Key Details, (CEO, HQ, Revenue, Founded, No. of Employees, Company Type, Website, Business Segment)
Table 78 Palo Alto Research Center Incorporated (PARC): Product Benchmarking
Table 79 DuPont de Nemours, Inc.: Key Details, (CEO, HQ, Revenue, Founded, No. of Employees, Company Type, Website, Business Segment)
Table 80 DuPont de Nemours, Inc.: Product Benchmarking
Table 81 DuPont de Nemours, Inc.: Strategic Outlook
Table 82 Nissha Co., Ltd.: Key Details, (CEO, HQ, Revenue, Founded, No. of Employees, Company Type, Website, Business Segment)
Table 83 Nissha Co., Ltd.: Product Benchmarking
Table 84 BASF SE: Key Details, (CEO, HQ, Revenue, Founded, No. of Employees, Company Type, Website, Business Segment)
Table 85 BASF SE: Product Benchmarking
Table 86 NovaCentrix: Key Details, (CEO, HQ, Revenue, Founded, No. of Employees, Company Type, Website, Business Segment)
Table 87 NovaCentrix: Product Benchmarking
Table 88 NovaCentrix: Strategic Outlook
Table 89 E Ink Holdings Inc.: Key Details, (CEO, HQ, Revenue, Founded, No. of Employees, Company Type, Website, Business Segment)
Table 90 E Ink Holdings Inc.: Product Benchmarking
Table 91 E Ink Holdings Inc.: Strategic Outlook
Table 92 Ynvisible Interactive Inc: Key Details, (CEO, HQ, Revenue, Founded, No. of Employees, Company Type, Website, Business Segment)
Table 93 Ynvisible Interactive Inc: Product Benchmarking
Table 94 Ynvisible Interactive Inc: Strategic Outlook
Table 95 Jabil Inc.: Key Details, (CEO, HQ, Revenue, Founded, No. of Employees, Company Type, Website, Business Segment)
Table 96 Jabil Inc: Product Benchmarking
Table 97 Jabil Inc.: Strategic Outlook
Table 98 Optomec Inc: Key Details, (CEO, HQ, Revenue, Founded, No. of Employees, Company Type, Website, Business Segment)
Table 99 Optomec Inc: Product Benchmarking
Table 100 Cambridge Display Technology: Key Details, (CEO, HQ, Revenue, Founded, No. of Employees, Company Type, Website, Business Segment)
Table 101 Cambridge Display Technology: Product Benchmarking
Table 102 Applied Ink Solutions: Key Details, (CEO, HQ, Revenue, Founded, No. of Employees, Company Type, Website, Business Segment)
Table 103 Applied Ink Solutions: Product Benchmarking
図の一覧
Figure 1 Printed Electronics Market Segmentation
Figure 2 Printed Electronics Market by Printing Technology: Market Attractiveness Index
Figure 3 Printed Electronics Market by End-Use Industry: Market Attractiveness Index
Figure 4 Printed Electronics Market by Devices: Market Attractiveness Index
Figure 5 Printed Electronics Market Attractiveness Index by Region
Figure 6 Printed Electronics Market: Market Dynamics
Figure 7 COVID Impact Analysis: Printed Electronics Market Recovery Scenarios
Figure 8 Global Printed Electronics Market by Region, 2023-2033 (US$ Bn, AGR (%)) (V-Shaped Recovery Scenario)
Figure 9 Global Printed Electronics Market by Region, 2023-2033 (US$ Bn, AGR (%)) (W-Shaped Recovery Scenario)
Figure 10 Global Printed Electronics Market by Region, 2023-2033 (US$ Bn, AGR (%)) (L-Shaped Recovery Scenario)
Figure 11 Global Printed Electronics Market by Region, 2023-2033 (US$ Bn, AGR (%)) (U-Shaped Recovery Scenario)
Figure 12 Printed Electronics Market: Porter’s Five Forces Analysis
Figure 13 Printed Electronics Market: PEST Analysis
Figure 14 Printed Electronics Market by Printing Technology: Market Attractiveness Index
Figure 15 Global Printed Electronics Market by Printing Technology, 2023-2033 (US$ Bn, AGR (%))
Figure 16 Global Printed Electronics Market Share Forecast by Printing Technology, 2023-2033 (%)
Figure 17 Screen Printing Market by Region, 2023-2033 (US$ Bn, AGR (%))
Figure 18 Screen Printing Market Share Forecast by Region, 2023 & 2033 (%)
Figure 19 Inkjet Printing Market by Region, 2023-2033 (US$ Bn, AGR (%))
Figure 20 Inkjet Printing Market Share Forecast by Region, 2023 & 2033 (%)
Figure 21 Flexographic Printing Market by Region, 2023-2033 (US$ Bn, AGR (%))
Figure 22 Flexographic Printing Market Share Forecast by Region, 2023 & 2033 (%)
Figure 23 Other Printing Technologies Market by Region, 2023-2033 (US$ Bn, AGR (%))
Figure 24 Other Printing Technologies Market Share Forecast by Region, 2023 & 2033 (%)
Figure 25 Printed Electronics Market by End-Use Industry: Market Attractiveness Index
Figure 26 Global Printed Electronics Market by End-Use Industry, 2023-2033 (US$ Bn, AGR (%))
Figure 27 Global Printed Electronics Market Share Forecast by End-Use Industry, 2023-2033 (%)
Figure 28 Automotive & Transportation Market by Region, 2023-2033 (US$ Bn, AGR (%))
Figure 29 Automotive & Transportation Market Share Forecast by Region, 2023 & 2033 (%)
Figure 30 Consumer Electronics Market by Region, 2023-2033 (US$ Bn, AGR (%))
Figure 31 Consumer Electronics Market Share Forecast by Region, 2023 & 2033 (%)
Figure 32 Aerospace & Defense Market by Region, 2023-2033 (US$ Bn, AGR (%))
Figure 33 Aerospace & Defense Market Share Forecast by Region, 2023 & 2033 (%)
Figure 34 Retail & Packaging Market by Region, 2023-2033 (US$ Bn, AGR (%))
Figure 35 Retail & Packaging Market Share Forecast by Region, 2023 & 2033 (%)
Figure 36 Other End-use Industries Market by Region, 2023-2033 (US$ Bn, AGR (%))
Figure 37 Other End-use Industries Market Share Forecast by Region, 2023 & 2033 (%)
Figure 38 Printed Electronics Market by Devices: Market Attractiveness Index
Figure 39 Global Printed Electronics Market by Devices, 2023-2033 (US$ Bn, AGR (%))
Figure 40 Global Printed Electronics Market Share Forecast by Devices, 2023-2033 (%)
Figure 41 Flexible Displays Market by Region, 2023-2033 (US$ Bn, AGR (%))
Figure 42 Flexible Displays Market Share Forecast by Region, 2023 & 2033 (%)
Figure 43 RFID Tags Market by Region, 2023-2033 (US$ Bn, AGR (%))
Figure 44 RFID Tags Market Share Forecast by Region, 2023 & 2033 (%)
Figure 45 Smart Packaging Market by Region, 2023-2033 (US$ Bn, AGR (%))
Figure 46 Smart Packaging Market Share Forecast by Region, 2023 & 2033 (%)
Figure 47 Wearable Devices Market by Region, 2023-2033 (US$ Bn, AGR (%))
Figure 48 Wearable Devices Market Share Forecast by Region, 2023 & 2033 (%)
Figure 49 Organic Light-Emitting Diodes (OLEDs) Market by Region, 2023-2033 (US$ Bn, AGR (%))
Figure 50 Organic Light-Emitting Diodes (OLEDs) Market Share Forecast by Region, 2023 & 2033 (%)
Figure 51 Other Devices Market by Region, 2023-2033 (US$ Bn, AGR (%))
Figure 52 Other Devices Market Share Forecast by Region, 2023 & 2033 (%)
Figure 53 printed electronics Market Forecast by Region 2023, 2033 (Revenue, CAGR%)
Figure 54 Global Printed Electronics Market by Region, 2023-2033 (US$ Bn, AGR (%))
Figure 55 Global Printed Electronics Market by North America: Market Attractiveness Index
Figure 56 North America Printed Electronics Market by Country, 2023-2033 (US$ Bn, AGR (%))
Figure 57 North America Printed Electronics Market Share Forecast by Country, 2023 & 2033 (%)
Figure 58 North America Printed Electronics Market by Printing Technology, 2023-2033 (US$ Bn, AGR (%))
Figure 59 North America Printed Electronics Market Share Forecast by Printing Technology ,2023 & 2033 (%)
Figure 60 North America Printed Electronics Market by End-Use Industry, 2023-2033 (US$ Bn, AGR (%))
Figure 61 North America Printed Electronics Market Share Forecast by End-Use Industry,2023 & 2033 (%)
Figure 62 North America Printed Electronics Market by Devices, 2023-2033 (US$ Bn, AGR (%))
Figure 63 North America Printed Electronics Market Share Forecast by Devices,2023 & 2033 (%)
Figure 64 US Printed Electronics Market by Value, 2023-2033 (US$ Bn, AGR (%))
Figure 65 Canada Printed Electronics Market by Value, 2023-2033 (US$ Bn, AGR (%))
Figure 66 Global Printed Electronics Market by Europe: Market Attractiveness Index
Figure 67 Europe Printed Electronics Market by Country, 2023-2033 (US$ Bn, AGR (%))
Figure 68 Europe Printed Electronics Market Share Forecast by Country, 2023 & 2033 (%)
Figure 69 Europe Printed Electronics Market by Printing Technology, 2023-2033 (US$ Bn, AGR (%))
Figure 70 Europe Printed Electronics Market Share Forecast by Printing Technology ,2023 & 2033 (%)
Figure 71 Europe Printed Electronics Market by End-Use Industry, 2023-2033 (US$ Bn, AGR (%))
Figure 72 Europe Printed Electronics Market Share Forecast by End-Use Industry,2023 & 2033 (%)
Figure 73 Europe Printed Electronics Market by End-Use Industry, 2023-2033 (US$ Bn, AGR (%))
Figure 74 Europe Printed Electronics Market Share Forecast by Devices,2023 & 2033 (%)
Figure 75 Germany Printed Electronics Market by Value, 2023-2033 (US$ Bn, AGR (%))
Figure 76 UK Printed Electronics Market by Value, 2023-2033 (US$ Bn, AGR (%))
Figure 77 France Printed Electronics Market by Value, 2023-2033 (US$ Bn, AGR (%))
Figure 78 Italy Printed Electronics Market by Value, 2023-2033 (US$ Bn, AGR (%))
Figure 79 Spain Printed Electronics Market by Value, 2023-2033 (US$ Bn, AGR (%))
Figure 80 Rest of Europe Printed Electronics Market by Value, 2023-2033 (US$ Bn, AGR (%))
Figure 81 Global Printed Electronics Market by Asia-Pacific: Market Attractiveness Index
Figure 82 Asia-Pacific Printed Electronics Market by Country, 2023-2033 (US$ Bn, AGR (%))
Figure 83 Asia-Pacific Printed Electronics Market Share Forecast by Country, 2023 & 2033 (%)
Figure 84 Asia-Pacific Printed Electronics Market by Printing Technology, 2023-2033 (US$ Bn, AGR (%))
Figure 85 Asia-Pacific Printed Electronics Market Share Forecast by Printing Technology ,2023 & 2033 (%)
Figure 86 Asia-Pacific Printed Electronics Market by End-Use Industry, 2023-2033 (US$ Bn, AGR (%))
Figure 87 Asia-Pacific Printed Electronics Market Share Forecast by End-Use Industry,2023 & 2033 (%)
Figure 88 Asia-Pacific Printed Electronics Market by Devices, 2023-2033 (US$ Bn, AGR (%))
Figure 89 Asia-Pacific Printed Electronics Market Share Forecast by Devices,2023 & 2033 (%)
Figure 90 China Printed Electronics Market by Value, 2023-2033 (US$ Bn, AGR (%))
Figure 91 India Printed Electronics Market by Value, 2023-2033 (US$ Bn, AGR (%))
Figure 92 Japan Printed Electronics Market by Value, 2023-2033 (US$ Bn, AGR (%))
Figure 93 South Korea Printed Electronics Market by Value, 2023-2033 (US$ Bn, AGR (%))
Figure 94 Taiwan Printed Electronics Market by Value, 2023-2033 (US$ Bn, AGR (%))
Figure 95 Rest of Asia-Pacific Printed Electronics Market by Value, 2023-2033 (US$ Bn, AGR (%))
Figure 96 Global Printed Electronics Market by Middle East & Africa: Market Attractiveness Index
Figure 97 Middle East & Africa Printed Electronics Market by Country, 2023-2033 (US$ Bn, AGR (%))
Figure 98 Middle East & Africa Printed Electronics Market Share Forecast by Country, 2023 & 2033 (%)
Figure 99 Middle East & Africa Printed Electronics Market by Printing Technology, 2023-2033 (US$ Bn, AGR (%))
Figure 100 Middle East & Africa Printed Electronics Market Share Forecast by Printing Technology ,2023 & 2033 (%)
Figure 101 Middle East & Africa Printed Electronics Market by End-Use Industry, 2023-2033 (US$ Bn, AGR (%))
Figure 102 Middle East & Africa Printed Electronics Market Share Forecast by End-Use Industry,2023 & 2033 (%)
Figure 103 Middle East & Africa Printed Electronics Market by Devices, 2023-2033 (US$ Bn, AGR (%))
Figure 104 Middle East & Africa Printed Electronics Market Share Forecast by Devices,2023 & 2033 (%)
Figure 105 GCC Printed Electronics Market by Value, 2023-2033 (US$ Bn, AGR (%))
Figure 106 South Africa Printed Electronics Market by Value, 2023-2033 (US$ Bn, AGR (%))
Figure 107 Rest of Middle East & Africa Printed Electronics Market by Value, 2023-2033 (US$ Bn, AGR (%))
Figure 108 Global Printed Electronics Market by Latin America: Market Attractiveness Index
Figure 109 Latin America Printed Electronics Market by Country, 2023-2033 (US$ Bn, AGR (%))
Figure 110 Latin America Printed Electronics Market Share Forecast by Country, 2023 & 2033 (%)
Figure 111 Latin America Printed Electronics Market by Printing Technology, 2023-2033 (US$ Bn, AGR (%))
Figure 112 Latin America Printed Electronics Market Share Forecast by Printing Technology ,2023 & 2033 (%)
Figure 113 Latin America Printed Electronics Market by End-Use Industry, 2023-2033 (US$ Bn, AGR (%))
Figure 114 Latin America Printed Electronics Market by Devices, 2023-2033 (US$ Bn, AGR (%))
Figure 115 Latin America Printed Electronics Market Share Forecast by Devices,2023 & 2033 (%)
Figure 116 Brazil Printed Electronics Market by Value, 2023-2033 (US$ Bn, AGR (%))
Figure 117 Mexico Printed Electronics Market by Value, 2023-2033 (US$ Bn, AGR (%))
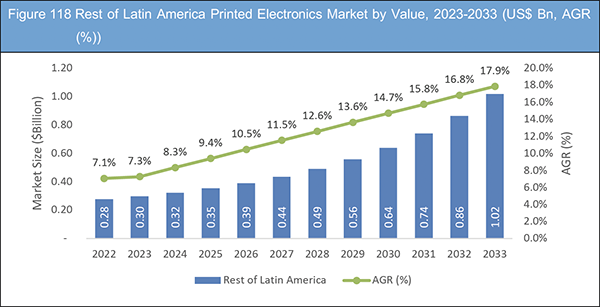
Figure 118 Rest of Latin America Printed Electronics Market by Value, 2023-2033 (US$ Bn, AGR (%))
Figure 119 Printed Electronics Market: Company Share/Ranking, 2021
Figure 120 Samsung Electronics Co., Ltd.: Net Revenue, 2018-2022 (US$ million, AGR%)
Figure 121 Samsung Electronics Co., Ltd.: R&D, 2018-2022 (US$ million, AGR%)
Figure 122 Samsung Electronics Co., Ltd.: Regional Market Shares, 2022
Figure 123 Samsung Electronics Co., Ltd.: Regional Market Shares, 2022
Figure 124 LG Display Co., Ltd.: Net Revenue, 2017-2021 (US$ million, AGR%)
Figure 125 LG Display Co., Ltd.: R&D, 2017-2021 (US$ million, AGR%)
Figure 126 LG Display Co., Ltd.: Regional Market Shares, 2022
Figure 127 LG Display Co., Ltd.: Regional Market Shares, 2022
Figure 128 Agfa-Gevaert N.V: Net Revenue, 2018-2022 (US$ million, AGR%)
Figure 129 Agfa-Gevaert N.V: R&D, 2018-2022 (US$ million, AGR%)
Figure 130 Agfa-Gevaert N.V: Regional Market Shares, 2022
Figure 131 Agfa-Gevaert N.V: Regional Market Shares, 2022
Figure 132 DuPont de Nemours, Inc.: Net Revenue, 2018-2022 (US$ million, AGR%)
Figure 133 DuPont de Nemours, Inc.: R&D, 2018-2022 (US$ million, AGR%)
Figure 134 DuPont de Nemours, Inc.: Regional Market Shares, 2022
Figure 135 DuPont de Nemours, Inc.: Regional Market Shares, 2022
Figure 136 BASF SE: Net Revenue, 2018-2022 (US$ million, AGR%)
Figure 137 BASF SE: R&D, 2018-2022 (US$ million, AGR%)
Figure 138 BASF SE: Regional Market Shares, 2022
Figure 139 BASF SE: Regional Market Shares, 2022
Figure 140 E Ink Holdings Inc.: Net Revenue, 2017-2021 (US$ million, AGR%)
Figure 141 E Ink Holdings Inc.: R&D, 2017-2021 (US$ million, AGR%)
Figure 142 E Ink Holdings Inc.: Regional Market Shares, 2021
Figure 143 E Ink Holdings Inc.: Regional Market Shares, 2021
Figure 144 Jabil Inc.: Net Revenue, 2018-2022 (US$ million, AGR%)
Figure 145 Jabil Inc.: R&D, 2018-2022 (US$ million, AGR%)
Figure 146 Jabil Inc.: Regional Market Shares, 2021
Figure 147 Jabil Inc.: Regional Market Shares, 2021
ページTOPに戻る
Summary
Report Details
The Printed Electronics Market Report 2023-2033: This report will prove invaluable to leading firms striving for new revenue pockets if they wish to better understand the industry and its underlying dynamics. It will be useful for companies that would like to expand into different industries or to expand their existing operations in a new region.
The Printed Electronics Market Is Poised for Significant Growth and Development in the Coming Years
The printed electronics market is a rapidly evolving and promising industry with a wide range of potential applications. As a result of its ability to produce flexible, lightweight, and cost-effective electronic solutions, the market is expected to grow significantly in the coming years. While the market is still relatively new and undergoing significant innovation, there have been notable developments and advancements in recent years. The development of new materials and printing techniques, as well as the increasing integration of printed electronics in various industries, are expected to continue to drive growth and adoption.
The market is seeing increasing investment and partnerships, both domestically and internationally, which is contributing to the expansion of the industry. Governments around the world are also supporting the development of printed electronics through funding and research initiatives. There are still challenges to be overcome, including the need for standardization and greater reliability in printed electronics, as well as the need to address issues such as scalability and regulatory compliance.
Overall, the printed electronics market is poised for significant growth and development in the coming years, with a wide range of potential applications and opportunities for innovation. As companies continue to invest in research and development, and as demand for flexible, lightweight, and cost-effective electronic solutions grows, the future looks bright for the printed electronics industry.
What Questions Should You Ask before Buying a Market Research Report?
• How is the printed electronics market evolving?
• What is driving and restraining the printed electronics market?
• How will each printed electronics submarket segment grow over the forecast period and how much revenue will these submarkets account for in 2033?
• How will the market shares for each printed electronics submarket develop from 2023 to 2033?
• What will be the main driver for the overall market from 2023 to 2033?
• Will leading printed electronics markets broadly follow the macroeconomic dynamics, or will individual national markets outperform others?
• How will the market shares of the national markets change by 2033 and which geographical region will lead the market in 2033?
• Who are the leading players and what are their prospects over the forecast period?
• What are the printed electronics projects for these leading companies?
• How will the industry evolve during the period between 2023 and 2033? What are the implications of printed electronics projects taking place now and over the next 10 years?
• Is there a greater need for product commercialisation to further scale the printed electronics market?
• Where is the printed electronics market heading and how can you ensure you are at the forefront of the market?
• What are the best investment options for new product and service lines?
• What are the key prospects for moving companies into a new growth path and C-suite?
You need to discover how this will impact the printed electronics market today, and over the next 10 years:
• Our 284-page report provides 103 tables and 147 charts/graphs exclusively to you.
• The report highlights key lucrative areas in the industry so you can target them – NOW.
• It contains in-depth analysis of global, regional and national sales and growth.
• It highlights for you the key successful trends, changes and revenue projections made by your competitors.
This report tells you TODAY how the printed electronics market will develop in the next 10 years, and in line with the variations in COVID-19 economic recession and bounce. This market is more critical now than at any point over the last 10 years.
Forecasts to 2033 and other analyses reveal commercial prospects
• In addition to revenue forecasting to 2033, our new study provides you with recent results, growth rates, and market shares.
• You will find original analyses, with business outlooks and developments.
• Discover qualitative analyses (including market dynamics, drivers, opportunities, restraints and challenges), cost structure, impact of rising printed electronics prices and recent developments.
This report includes data analysis and invaluable insight into how COVID-19 will affect the industry and your company. Four COVID-19 recovery patterns and their impact, namely, “V”, “L”, “W” and “U” are discussed in this report.
Segments Covered in the Report
Market Segment by Printing Technology
• Screen Printing
• Inkjet Printing
• Flexographic Printing
• Other Printing Technologies
Market Segment by End-Use Industry
• Automotive & Transportation
• Consumer Electronics
• Aerospace & Defense
• Retail & Packaging
• Other End-use Industries
Market Segment by Devices
• Flexible Displays
• RFID Tags
• Smart Packaging
• Wearable Devices
• Organic Light-Emitting Diodes (OLEDs)
• Other Devices
In addition to the revenue predictions for the overall world market and segments, you will also find revenue forecasts for four regional and 20 leading national markets:
North America
• U.S.
• Canada
Europe
• Germany
• Spain
• United Kingdom
• France
• Italy
• Rest of Europe
Asia Pacific
• China
• Japan
• India
• Taiwan
• South Korea
• Rest of Asia Pacific
Latin America
• Brazil
• Mexico
• Rest of Latin America
Middle East & Africa
• GCC
• South Africa
• Rest of Middle East & Africa
The report also includes profiles and for some of the leading companies in the Printed Electronics Market, 2023 to 2033, with a focus on this segment of these companies’ operations.
Leading companies and the potential for market growth
• Agfa-Gevaert N.V
• Applied Ink Solutions
• BASF SE
• Cambridge Display Technology
• DuPont de Nemours, Inc.
• E Ink Holdings Inc.
• Jabil Inc.
• LG Display Co., Ltd.
• Molex LLC
• Nissha Co., Ltd.
• NovaCentrix
• Optomec Inc.
• Palo Alto Research Center Incorporated (PARC)
• Samsung Electronics Co., Ltd.
• Ynvisible Interactive Inc.
Overall world revenue for Printed Electronics Market, 2023 to 2033 in terms of value the market will surpass US$10.88 billion in 2023, our work calculates. We predict strong revenue growth through to 2033. Our work identifies which organizations hold the greatest potential. Discover their capabilities, progress, and commercial prospects, helping you stay ahead.
How will the Printed Electronics Market, 2023 to 2033 report help you?
In summary, our 280+ page report provides you with the following knowledge:
• Revenue forecasts to 2033 for Printed Electronics Market, 2023 to 2033 Market, with forecasts for printed technology, end-user industry, devices and company size, each forecast at a global and regional level – discover the industry’s prospects, finding the most lucrative places for investments and revenues.
• Revenue forecasts to 2033 for four regional and 20 key national markets – See forecasts for the Printed Electronics Market, 2023 to 2033 market in North America, Europe, Asia-Pacific, Latin America and Middle East & Africa. Also forecasted is the market in the US, Canada, Brazil, Germany, France, UK, Italy, China, India, Japan, and Australia among other prominent economies.
• Prospects for established firms and those seeking to enter the market – including company profiles for 15 of the major companies involved in the Printed Electronics Market, 2023 to 2033.
Find quantitative and qualitative analyses with independent predictions. Receive information that only our report contains, staying informed with invaluable business intelligence.
Information found nowhere else
With our new report, you are less likely to fall behind in knowledge or miss out on opportunities. See how our work could benefit your research, analyses, and decisions. Visiongain’s study is for everybody needing commercial analyses for the Printed Electronics Market, 2023 to 2033, market-leading companies. You will find data, trends and predictions.
ページTOPに戻る
Table of Contents
Table of Contents
1 Report Overview
1.1 Objectives of the Study
1.2 Introduction to Printed Electronics Market
1.3 What This Report Delivers
1.4 Why You Should Read This Report
1.5 Key Questions Answered by This Analytical Report
1.6 Who is This Report for?
1.7 Research Methodology
1.7.1 Market Definitions
1.7.2 Market Evaluation & Forecasting Methodology
1.7.3 Data Validation
1.7.3.1 Primary Research
1.7.3.2 Secondary Research
1.8 Frequently Asked Questions (FAQs)
1.9 Associated Visiongain Reports
1.10 About Visiongain
2 Executive Summary
2.1 Segment Analysis
2.1.1 Printing Technology Segment: Market Attractiveness Index
2.1.2 End-Use Industry Segment: Market Attractiveness Index
2.1.3 Devices Segment: Market Attractiveness Index
2.2 Regional analysis
3 Market Overview
3.1 Key Findings
3.2 Market Dynamics
3.2.1 Market Driving Factors
3.2.1.1 Rapid Prototyping Is an Essential Tool for Printed Electronics Designers
3.2.1.2 Mass Production of Printed Electronics
3.2.1.3 The Cost of Producing Printed Electronics
3.2.2 Market Restraining Factors
3.2.2.1 The Limited Functionality of Printed Electronics
3.2.2.2 The Environmental Impact of Printed Electronics
3.2.3 Market Opportunities
3.2.3.1 The Healthcare Industry Presents Numerous Opportunities for Printed Electronics
3.2.3.2 Printed Electronics Is Increasingly Being Used to Develop Energy Harvesting Devices
3.2.3.3 Printed Electronics Presents a Range Of Opportunities in The Automotive Industry
3.3 COVID-19 Impact Analysis
3.4 Porter’s Five Forces Analysis
3.4.1 Bargaining Power of Suppliers
3.4.2 Bargaining Power of Buyers
3.4.3 Competitive Rivalry
3.4.4 Threat from Substitutes
3.4.5 Threat of New Entrants
3.5 PEST Analysis
3.5.1 Political Factors:
3.5.2 Economic Factors:
3.5.3 Social Factors:
3.5.4 Technological Factors:
4 Printed Electronics Market Analysis by Printing Technology
4.1 Key Findings
4.2 Printing Technology Segment: Market Attractiveness Index
4.3 Printed Electronics Market Size Estimation and Forecast by Printing Technology
4.4 Screen Printing
4.4.1 Market Size by Region, 2023-2033 (US$ bn)
4.4.2 Market Share by Region, 2023 & 2033 (%)
4.5 Inkjet Printing
4.5.1 Market Size by Region, 2023-2033 (US$ bn)
4.5.2 Market Share by Region, 2023 & 2033 (%)
4.6 Flexographic Printing
4.6.1 Market Size by Region, 2023-2033 (US$ bn)
4.6.2 Market Share by Region, 2023 & 2033 (%)
4.7 Other Printing Technologies
4.7.1 Market Size by Region, 2023-2033 (US$ bn)
4.7.2 Market Share by Region, 2023 & 2033 (%)
5 Printed Electronics Market Analysis by End-Use Industry
5.1 Key Findings
5.2 End-Use Industry Segment: Market Attractiveness Index
5.3 Printed Electronics Market Size Estimation and Forecast by End-Use Industry
5.4 Automotive & Transportation
5.4.1 Market Size by Region, 2023-2033 (US$ bn)
5.4.2 Market Share by Region, 2023 & 2033 (%)
5.5 Consumer Electronics
5.5.1 Market Size by Region, 2023-2033 (US$ bn)
5.5.2 Market Share by Region, 2023 & 2033 (%)
5.6 Aerospace & Defense
5.6.1 Market Size by Region, 2023-2033 (US$ bn)
5.6.2 Market Share by Region, 2023 & 2033 (%)
5.7 Retail & Packaging
5.7.1 Market Size by Region, 2023-2033 (US$ bn)
5.7.2 Market Share by Region, 2023 & 2033 (%)
5.8 Other End-use Industries
5.8.1 Market Size by Region, 2023-2033 (US$ bn)
5.8.2 Market Share by Region, 2023 & 2033 (%)
6 Printed Electronics Market Analysis by Devices
6.1 Key Findings
6.2 Devices Segment: Market Attractiveness Index
6.3 Printed Electronics Market Size Estimation and Forecast by Devices
6.4 Flexible Displays
6.4.1 Market Size by Region, 2023-2033 (US$ bn)
6.4.2 Market Share by Region, 2023 & 2033 (%)
6.5 RFID Tags
6.5.1 Market Size by Region, 2023-2033 (US$ bn)
6.5.2 Market Share by Region, 2023 & 2033 (%)
6.6 Smart Packaging
6.6.1 Market Size by Region, 2023-2033 (US$ bn)
6.6.2 Market Share by Region, 2023 & 2033 (%)
6.7 Wearable Devices
6.7.1 Market Size by Region, 2023-2033 (US$ bn)
6.7.2 Market Share by Region, 2023 & 2033 (%)
6.8 Organic Light-Emitting Diodes (OLEDs)
6.8.1 Market Size by Region, 2023-2033 (US$ bn)
6.8.2 Market Share by Region, 2023 & 2033 (%)
6.9 Other Devices
6.9.1 Market Size by Region, 2023-2033 (US$ bn)
6.9.2 Market Share by Region, 2023 & 2033 (%)
7 Printed Electronics Market Analysis by Region
7.1 Key Findings
7.2 Regional Market Size Estimation and Forecast
8 North America Printed Electronics Market Analysis
8.1 Key Findings
8.2 North America Printed Electronics Market Attractiveness Index
8.3 North America Printed Electronics Market Size Estimation and Forecast by Country
8.4 North America Printed Electronics Market Size Estimation and Forecast by Printing Technology
8.5 North America Printed Electronics Market Size Estimation and Forecast by End-Use Industry
8.6 North America Printed Electronics Market Size Estimation and Forecast by Devices
8.7 U.S. Printed Electronics Market Analysis
8.8 Canada Printed Electronics Market Analysis
9 Europe Printed Electronics Market Analysis
9.1 Key Findings
9.2 Europe Printed Electronics Market Attractiveness Index
9.3 Europe Printed Electronics Market Size Estimation and Forecast by Country
9.4 Europe Printed Electronics Market Size Estimation and Forecast by Printing Technology
9.5 Europe Printed Electronics Market Size Estimation and Forecast by End-Use Industry
9.6 Europe Printed Electronics Market Size Estimation and Forecast by Devices
9.7 Germany Printed Electronics Market Analysis
9.8 UK Printed Electronics Market Analysis
9.9 France Printed Electronics Market Analysis
9.10 Italy Printed Electronics Market Analysis
9.11 Spain Printed Electronics Market Analysis
9.12 Rest of Europe Printed Electronics Market Analysis
10 Asia-Pacific Printed Electronics Market Analysis
10.1 Key Findings
10.2 Asia-Pacific Printed Electronics Market Attractiveness Index
10.3 Asia-Pacific Printed Electronics Market Size Estimation and Forecast by Country
10.4 Asia-Pacific Printed Electronics Market Size Estimation and Forecast by Printing Technology
10.5 Asia-Pacific Printed Electronics Market Size Estimation and Forecast by End-Use Industry
10.6 Asia-Pacific Printed Electronics Market Size Estimation and Forecast by Devices
10.7 China Printed Electronics Market Analysis
10.8 India Printed Electronics Market Analysis
10.9 Japan Printed Electronics Market Analysis
10.10 South Korea Printed Electronics Market Analysis
10.11 Taiwan Printed Electronics Market Analysis
10.12 Rest of Asia-Pacific Printed Electronics Market Analysis
11 Middle East & Africa Printed Electronics Market Analysis
11.1 Key Findings
11.2 Middle East & Africa Printed Electronics Market Attractiveness Index
11.3 Middle East & Africa Printed Electronics Market Size Estimation and Forecast by Country
11.4 Middle East & Africa Printed Electronics Market Size Estimation and Forecast by Printing Technology
11.5 Middle East & Africa Printed Electronics Market Size Estimation and Forecast by End-Use Industry
11.6 Middle East & Africa Printed Electronics Market Size Estimation and Forecast by Devices
11.7 GCC Printed Electronics Market Analysis
11.8 South Africa Printed Electronics Market Analysis
11.9 Rest of Middle East & Africa Printed Electronics Market Analysis
12 Latin America Printed Electronics Market Analysis
12.1 Key Findings
12.2 Latin America Printed Electronics Market Attractiveness Index
12.3 Latin America Printed Electronics Market Size Estimation and Forecast by Country
12.4 Latin America Printed Electronics Market Size Estimation and Forecast by Printing Technology
12.5 Latin America Printed Electronics Market Size Estimation and Forecast by End-Use Industry
12.6 Latin America Printed Electronics Market Size Estimation and Forecast by Devices
12.7 Brazil Printed Electronics Market Analysis
12.8 Mexico Printed Electronics Market Analysis
12.9 Rest of Latin America Printed Electronics Market Analysis
13 Company Profiles
13.1 Competitive Landscape, 2021
13.2 Strategic Outlook
13.2.1 Agreement as Key Business Strategy
13.2.2 Partnership as Key Business Strategy
13.2.3 New Product Launch as Key Business Strategy
13.3 Samsung Electronics Co., Ltd.
13.3.1 Company Snapshot
13.3.2 Company Overview
13.3.3 Financial Analysis
13.3.3.1 Net Revenue, 2018-2022
13.3.3.2 R&D, 2018-2022
13.3.3.3 Regional Market Shares, 2022
13.3.3.4 Business Segment Market Shares, 2022
13.3.4 Product Benchmarking
13.4 LG Display Co., Ltd.
13.4.1 Company Snapshot
13.4.2 Company Overview
13.4.3 Financial Analysis
13.4.3.1 Net Revenue, 2017-2021
13.4.3.2 R&D, 2017-2021
13.4.3.3 Regional Market Shares, 2022
13.4.3.4 Business Segment Market Shares, 2022
13.4.4 Product Benchmarking
13.4.5 Strategic Outlook
13.5 Molex LLC
13.5.1 Company Snapshot
13.5.2 Company Overview
13.5.3 Product Benchmarking
13.5.4 Strategic Outlook
13.6 Agfa-Gevaert N.V
13.6.1 Company Snapshot
13.6.2 Company Overview
13.6.3 Financial Analysis
13.6.3.1 Net Revenue, 2018-2022
13.6.3.2 R&D, 2018-2022
13.6.3.3 Regional Market Shares, 2022
13.6.3.4 Business Segment Market Shares, 2022
13.6.4 Product Benchmarking
13.6.5 Strategic Outlook
13.7 Palo Alto Research Center Incorporated (PARC)
13.7.1 Company Snapshot
13.7.2 Company Overview
13.7.3 Product Benchmarking
13.8 DuPont de Nemours, Inc.
13.8.1 Company Snapshot
13.8.2 Company Overview
13.8.3 Financial Analysis
13.8.3.1 Net Revenue, 2018-2022
13.8.3.2 R&D, 2018-2022
13.8.3.3 Regional Market Shares, 2022
13.8.3.4 Business Segment Market Shares, 2022
13.8.4 Product Benchmarking
13.8.5 Strategic Outlook
13.9 Nissha Co., Ltd.
13.9.1 Company Snapshot
13.9.2 Company Overview
13.9.3 Product Benchmarking
13.10 BASF SE
13.10.1 Company Snapshot
13.10.2 Company Overview
13.10.3 Financial Analysis
13.10.3.1 Net Revenue, 2018-2022
13.10.3.2 R&D, 2018-2022
13.10.3.3 Regional Market Shares, 2022
13.10.3.4 Business Segment Market Shares, 2022
13.10.4 Product Benchmarking
13.11 NovaCentrix
13.11.1 Company Snapshot
13.11.2 Company Overview
13.11.3 Product Benchmarking
13.11.4 Strategic Outlook
13.12 E Ink Holdings Inc.
13.12.1 Company Snapshot
13.12.2 Company Overview
13.12.3 Financial Analysis
13.12.3.1 Net Revenue, 2017-2021
13.12.3.2 R&D, 2018-2022
13.12.3.3 Regional Market Shares, 2021
13.12.3.4 Business Segment Market Shares, 2021
13.12.4 Product Benchmarking
13.12.5 Strategic Outlook
13.13 Ynvisible Interactive Inc
13.13.1 Company Snapshot
13.13.2 Company Overview
13.13.3 Product Benchmarking
13.13.4 Strategic Outlook
13.14 Jabil Inc.
13.14.1 Company Snapshot
13.14.2 Company Overview
13.14.3 Financial Analysis
13.14.3.1 Net Revenue, 2018-2022
13.14.3.2 R&D, 2018-2022
13.14.3.3 Regional Market Shares, 2021
13.14.3.4 Business Segment Market Shares, 2021
13.14.4 Product Benchmarking
13.14.5 Strategic Outlook
13.15 Optomec Inc
13.15.1 Company Snapshot
13.15.2 Company Overview
13.15.3 Product Benchmarking
13.16 Cambridge Display Technology
13.16.1 Company Snapshot
13.16.2 Company Overview
13.16.3 Product Benchmarking
13.17 Applied Ink Solutions
13.17.1 Company Snapshot
13.17.2 Company Overview
13.17.3 Product Benchmarking
14 Conclusion and Recommendations
14.1 Concluding Remarks from Visiongain
14.2 Recommendations for Market Players
List of Tables
Table 1 Printed Electronics Market Snapshot, 2023 & 2033 (US$ billion, CAGR %)
Table 2 Global Printed Electronics Market by Region, 2023-2033 (US$ Bn, AGR (%), CAGR (%)) (V-Shaped Recovery Scenario)
Table 3 Global Printed Electronics Market by Region, 2023-2033 (US$ Bn, AGR (%), CAGR (%)) (W-Shaped Recovery Scenario)
Table 4 Global Printed Electronics Market by Region, 2023-2033 (US$ Bn, AGR (%), CAGR (%)) (L-Shaped Recovery Scenario)
Table 5 Global Printed Electronics Market by Region, 2023-2033 (US$ Bn, AGR (%), CAGR (%)) (U-Shaped Recovery Scenario)
Table 6 Global Printed Electronics Market by Printing Technology, 2023-2033 (US$ Bn, AGR (%), CAGR (%))
Table 7 Screen Printing Market by Region, 2023-2033 (US$ Bn, AGR (%), CAGR (%))
Table 8 Inkjet Printing Market by Region, 2023-2033 (US$ Bn, AGR (%), CAGR (%))
Table 9 Flexographic Printing Market by Region, 2023-2033 (US$ Bn, AGR (%), CAGR (%))
Table 10 Other Printing Technologies Market by Region, 2023-2033 (US$ Bn, AGR (%), CAGR (%))
Table 11 Global Printed Electronics Market by End-Use Industry, 2023-2033 (US$ Bn, AGR (%), CAGR (%))
Table 12 Automotive & Transportation Market by Region, 2023-2033 (US$ Bn, AGR (%), CAGR (%))
Table 13 Consumer Electronics Market by Region, 2023-2033 (US$ Bn, AGR (%), CAGR (%))
Table 14 Aerospace & Defense Market by Region, 2023-2033 (US$ Bn, AGR (%), CAGR (%))
Table 15 Retail & Packaging Market by Region, 2023-2033 (US$ Bn, AGR (%), CAGR (%))
Table 16 Other End-use Industries Market by Region, 2023-2033 (US$ Bn, AGR (%), CAGR (%))
Table 17 Global Printed Electronics Market by Devices, 2023-2033 (US$ Bn, AGR (%), CAGR (%))
Table 18 Flexible Displays Market by Region, 2023-2033 (US$ Bn, AGR (%), CAGR (%))
Table 19 RFID Tags Market by Region, 2023-2033 (US$ Bn, AGR (%), CAGR (%))
Table 20 Smart Packaging Market by Region, 2023-2033 (US$ Bn, AGR (%), CAGR (%))
Table 21 Wearable Devices Market by Region, 2023-2033 (US$ Bn, AGR (%), CAGR (%))
Table 22 Organic Light-Emitting Diodes (OLEDs) Market by Region, 2023-2033 (US$ Bn, AGR (%), CAGR (%))
Table 23 Other Devices Market by Region, 2023-2033 (US$ Bn, AGR (%), CAGR (%))
Table 24 Global Printed Electronics Market by Region, 2023-2033 (US$ Bn, AGR (%), CAGR (%))
Table 25 North America Printed Electronics Market by Country, 2023-2033 (US$ Bn, AGR (%), CAGR (%))
Table 26 North America Printed Electronics Market by Printing Technology, 2023-2033 (US$ Bn, AGR (%), CAGR (%))
Table 27 North America Printed Electronics Market by End-Use Industry, 2023-2033 (US$ Bn, AGR (%), CAGR (%))
Table 28 North America Printed Electronics Market by Devices, 2023-2033 (US$ Bn, AGR (%), CAGR (%))
Table 29 US Printed Electronics Market by Value, 2023-2033 (US$ Bn, AGR (%), CAGR (%))
Table 30 Canada Printed Electronics Market by Value, 2023-2033 (US$ Bn, AGR (%), CAGR (%))
Table 31 Europe Printed Electronics Market by Country, 2023-2033 (US$ Bn, AGR (%), CAGR (%))
Table 32 Europe Printed Electronics Market by Printing Technology, 2023-2033 (US$ Bn, AGR (%), CAGR (%))
Table 33 Europe Printed Electronics Market by End-Use Industry, 2023-2033 (US$ Bn, AGR (%), CAGR (%))
Table 34 Europe Printed Electronics Market by Devices, 2023-2033 (US$ Bn, AGR (%), CAGR (%))
Table 35 Germany Printed Electronics Market by Value, 2023-2033 (US$ Bn, AGR (%), CAGR (%))
Table 36 UK Printed Electronics Market by Value, 2023-2033 (US$ Bn, AGR (%), CAGR (%))
Table 37 France Printed Electronics Market by Value, 2023-2033 (US$ Bn, AGR (%), CAGR (%))
Table 38 Italy Printed Electronics Market by Value, 2023-2033 (US$ Bn, AGR (%), CAGR (%))
Table 39 Spain Printed Electronics Market by Value, 2023-2033 (US$ Bn, AGR (%), CAGR (%))
Table 40 Rest of Europe Printed Electronics Market by Value, 2023-2033 (US$ Bn, AGR (%), CAGR (%))
Table 41 Asia-Pacific Printed Electronics Market by Country, 2023-2033 (US$ Bn, AGR (%), CAGR (%))
Table 42 Asia-Pacific Printed Electronics Market by Printing Technology, 2023-2033 (US$ Bn, AGR (%), CAGR (%))
Table 43 Asia-Pacific Printed Electronics Market by End-Use Industry, 2023-2033 (US$ Bn, AGR (%), CAGR (%))
Table 44 Asia-Pacific Printed Electronics Market by Devices, 2023-2033 (US$ Bn, AGR (%), CAGR (%))
Table 45 China Printed Electronics Market by Value, 2023-2033 (US$ Bn, AGR (%), CAGR (%))
Table 46 India Printed Electronics Market by Value, 2023-2033 (US$ Bn, AGR (%), CAGR (%))
Table 47 Japan Printed Electronics Market by Value, 2023-2033 (US$ Bn, AGR (%), CAGR (%))
Table 48 South Korea Printed Electronics Market by Value, 2023-2033 (US$ Bn, AGR (%), CAGR (%))
Table 49 Taiwan Printed Electronics Market by Value, 2023-2033 (US$ Bn, AGR (%), CAGR (%))
Table 50 Rest of Asia-Pacific Printed Electronics Market by Value, 2023-2033 (US$ Bn, AGR (%), CAGR (%))
Table 51 Middle East & Africa Printed Electronics Market by Country, 2023-2033 (US$ Bn, AGR (%), CAGR (%))
Table 52 Middle East & Africa Printed Electronics Market by Printing Technology, 2023-2033 (US$ Bn, AGR (%), CAGR (%))
Table 53 Middle East & Africa Printed Electronics Market by End-Use Industry, 2023-2033 (US$ Bn, AGR (%), CAGR (%))
Table 54 Middle East & Africa Printed Electronics Market by Devices, 2023-2033 (US$ Bn, AGR (%), CAGR (%))
Table 55 GCC Printed Electronics Market by Value, 2023-2033 (US$ Bn, AGR (%), CAGR (%))
Table 56 South Africa Printed Electronics Market by Value, 2023-2033 (US$ Bn, AGR (%), CAGR (%))
Table 57 Rest of Middle East & Africa Printed Electronics Market by Value, 2023-2033 (US$ Bn, AGR (%), CAGR (%))
Table 58 Latin America Printed Electronics Market by Country, 2023-2033 (US$ Bn, AGR (%), CAGR (%))
Table 59 Latin America Printed Electronics Market by Printing Technology, 2023-2033 (US$ Bn, AGR (%), CAGR (%))
Table 60 Latin America Printed Electronics Market by End-Use Industry, 2023-2033 (US$ Bn, AGR (%), CAGR (%))
Table 61 Latin America Printed Electronics Market Share Forecast by End-Use Industry,2023 & 2033 (%)
Table 62 Latin America Printed Electronics Market by Devices, 2023-2033 (US$ Bn, AGR (%), CAGR (%))
Table 63 Brazil Printed Electronics Market by Value, 2023-2033 (US$ Bn, AGR (%), CAGR (%))
Table 64 Mexico Printed Electronics Market by Value, 2023-2033 (US$ Bn, AGR (%), CAGR (%))
Table 65 Rest of Latin America Printed Electronics Market by Value, 2023-2033 (US$ Bn, AGR (%), CAGR (%))
Table 66 Samsung Electronics Co., Ltd.: Key Details, (CEO, HQ, Revenue, Founded, No. of Employees, Company Type, Website, Business Segment)
Table 67 Samsung Electronics Co., Ltd: Product Benchmarking
Table 68 LG Display Co., Ltd.: Key Details, (CEO, HQ, Revenue, Founded, No. of Employees, Company Type, Website, Business Segment)
Table 69 LG Display Co., Ltd.: Product Benchmarking
Table 70 LG Display Co., Ltd.: Strategic Outlook
Table 71 Molex LLC: Key Details, (CEO, HQ, Revenue, Founded, No. of Employees, Company Type, Website, Business Segment)
Table 72 Molex LLC: Product Benchmarking
Table 73 Molex LLC: Strategic Outlook
Table 74 Agfa-Gevaert N.V: Key Details, (CEO, HQ, Revenue, Founded, No. of Employees, Company Type, Website, Business Segment)
Table 75 Agfa-Gevaert N.V: Product Benchmarking
Table 76 Agfa-Gevaert N.V: Strategic Outlook
Table 77 Palo Alto Research Center Incorporated (PARC): Key Details, (CEO, HQ, Revenue, Founded, No. of Employees, Company Type, Website, Business Segment)
Table 78 Palo Alto Research Center Incorporated (PARC): Product Benchmarking
Table 79 DuPont de Nemours, Inc.: Key Details, (CEO, HQ, Revenue, Founded, No. of Employees, Company Type, Website, Business Segment)
Table 80 DuPont de Nemours, Inc.: Product Benchmarking
Table 81 DuPont de Nemours, Inc.: Strategic Outlook
Table 82 Nissha Co., Ltd.: Key Details, (CEO, HQ, Revenue, Founded, No. of Employees, Company Type, Website, Business Segment)
Table 83 Nissha Co., Ltd.: Product Benchmarking
Table 84 BASF SE: Key Details, (CEO, HQ, Revenue, Founded, No. of Employees, Company Type, Website, Business Segment)
Table 85 BASF SE: Product Benchmarking
Table 86 NovaCentrix: Key Details, (CEO, HQ, Revenue, Founded, No. of Employees, Company Type, Website, Business Segment)
Table 87 NovaCentrix: Product Benchmarking
Table 88 NovaCentrix: Strategic Outlook
Table 89 E Ink Holdings Inc.: Key Details, (CEO, HQ, Revenue, Founded, No. of Employees, Company Type, Website, Business Segment)
Table 90 E Ink Holdings Inc.: Product Benchmarking
Table 91 E Ink Holdings Inc.: Strategic Outlook
Table 92 Ynvisible Interactive Inc: Key Details, (CEO, HQ, Revenue, Founded, No. of Employees, Company Type, Website, Business Segment)
Table 93 Ynvisible Interactive Inc: Product Benchmarking
Table 94 Ynvisible Interactive Inc: Strategic Outlook
Table 95 Jabil Inc.: Key Details, (CEO, HQ, Revenue, Founded, No. of Employees, Company Type, Website, Business Segment)
Table 96 Jabil Inc: Product Benchmarking
Table 97 Jabil Inc.: Strategic Outlook
Table 98 Optomec Inc: Key Details, (CEO, HQ, Revenue, Founded, No. of Employees, Company Type, Website, Business Segment)
Table 99 Optomec Inc: Product Benchmarking
Table 100 Cambridge Display Technology: Key Details, (CEO, HQ, Revenue, Founded, No. of Employees, Company Type, Website, Business Segment)
Table 101 Cambridge Display Technology: Product Benchmarking
Table 102 Applied Ink Solutions: Key Details, (CEO, HQ, Revenue, Founded, No. of Employees, Company Type, Website, Business Segment)
Table 103 Applied Ink Solutions: Product Benchmarking
List of Figures
Figure 1 Printed Electronics Market Segmentation
Figure 2 Printed Electronics Market by Printing Technology: Market Attractiveness Index
Figure 3 Printed Electronics Market by End-Use Industry: Market Attractiveness Index
Figure 4 Printed Electronics Market by Devices: Market Attractiveness Index
Figure 5 Printed Electronics Market Attractiveness Index by Region
Figure 6 Printed Electronics Market: Market Dynamics
Figure 7 COVID Impact Analysis: Printed Electronics Market Recovery Scenarios
Figure 8 Global Printed Electronics Market by Region, 2023-2033 (US$ Bn, AGR (%)) (V-Shaped Recovery Scenario)
Figure 9 Global Printed Electronics Market by Region, 2023-2033 (US$ Bn, AGR (%)) (W-Shaped Recovery Scenario)
Figure 10 Global Printed Electronics Market by Region, 2023-2033 (US$ Bn, AGR (%)) (L-Shaped Recovery Scenario)
Figure 11 Global Printed Electronics Market by Region, 2023-2033 (US$ Bn, AGR (%)) (U-Shaped Recovery Scenario)
Figure 12 Printed Electronics Market: Porter’s Five Forces Analysis
Figure 13 Printed Electronics Market: PEST Analysis
Figure 14 Printed Electronics Market by Printing Technology: Market Attractiveness Index
Figure 15 Global Printed Electronics Market by Printing Technology, 2023-2033 (US$ Bn, AGR (%))
Figure 16 Global Printed Electronics Market Share Forecast by Printing Technology, 2023-2033 (%)
Figure 17 Screen Printing Market by Region, 2023-2033 (US$ Bn, AGR (%))
Figure 18 Screen Printing Market Share Forecast by Region, 2023 & 2033 (%)
Figure 19 Inkjet Printing Market by Region, 2023-2033 (US$ Bn, AGR (%))
Figure 20 Inkjet Printing Market Share Forecast by Region, 2023 & 2033 (%)
Figure 21 Flexographic Printing Market by Region, 2023-2033 (US$ Bn, AGR (%))
Figure 22 Flexographic Printing Market Share Forecast by Region, 2023 & 2033 (%)
Figure 23 Other Printing Technologies Market by Region, 2023-2033 (US$ Bn, AGR (%))
Figure 24 Other Printing Technologies Market Share Forecast by Region, 2023 & 2033 (%)
Figure 25 Printed Electronics Market by End-Use Industry: Market Attractiveness Index
Figure 26 Global Printed Electronics Market by End-Use Industry, 2023-2033 (US$ Bn, AGR (%))
Figure 27 Global Printed Electronics Market Share Forecast by End-Use Industry, 2023-2033 (%)
Figure 28 Automotive & Transportation Market by Region, 2023-2033 (US$ Bn, AGR (%))
Figure 29 Automotive & Transportation Market Share Forecast by Region, 2023 & 2033 (%)
Figure 30 Consumer Electronics Market by Region, 2023-2033 (US$ Bn, AGR (%))
Figure 31 Consumer Electronics Market Share Forecast by Region, 2023 & 2033 (%)
Figure 32 Aerospace & Defense Market by Region, 2023-2033 (US$ Bn, AGR (%))
Figure 33 Aerospace & Defense Market Share Forecast by Region, 2023 & 2033 (%)
Figure 34 Retail & Packaging Market by Region, 2023-2033 (US$ Bn, AGR (%))
Figure 35 Retail & Packaging Market Share Forecast by Region, 2023 & 2033 (%)
Figure 36 Other End-use Industries Market by Region, 2023-2033 (US$ Bn, AGR (%))
Figure 37 Other End-use Industries Market Share Forecast by Region, 2023 & 2033 (%)
Figure 38 Printed Electronics Market by Devices: Market Attractiveness Index
Figure 39 Global Printed Electronics Market by Devices, 2023-2033 (US$ Bn, AGR (%))
Figure 40 Global Printed Electronics Market Share Forecast by Devices, 2023-2033 (%)
Figure 41 Flexible Displays Market by Region, 2023-2033 (US$ Bn, AGR (%))
Figure 42 Flexible Displays Market Share Forecast by Region, 2023 & 2033 (%)
Figure 43 RFID Tags Market by Region, 2023-2033 (US$ Bn, AGR (%))
Figure 44 RFID Tags Market Share Forecast by Region, 2023 & 2033 (%)
Figure 45 Smart Packaging Market by Region, 2023-2033 (US$ Bn, AGR (%))
Figure 46 Smart Packaging Market Share Forecast by Region, 2023 & 2033 (%)
Figure 47 Wearable Devices Market by Region, 2023-2033 (US$ Bn, AGR (%))
Figure 48 Wearable Devices Market Share Forecast by Region, 2023 & 2033 (%)
Figure 49 Organic Light-Emitting Diodes (OLEDs) Market by Region, 2023-2033 (US$ Bn, AGR (%))
Figure 50 Organic Light-Emitting Diodes (OLEDs) Market Share Forecast by Region, 2023 & 2033 (%)
Figure 51 Other Devices Market by Region, 2023-2033 (US$ Bn, AGR (%))
Figure 52 Other Devices Market Share Forecast by Region, 2023 & 2033 (%)
Figure 53 printed electronics Market Forecast by Region 2023, 2033 (Revenue, CAGR%)
Figure 54 Global Printed Electronics Market by Region, 2023-2033 (US$ Bn, AGR (%))
Figure 55 Global Printed Electronics Market by North America: Market Attractiveness Index
Figure 56 North America Printed Electronics Market by Country, 2023-2033 (US$ Bn, AGR (%))
Figure 57 North America Printed Electronics Market Share Forecast by Country, 2023 & 2033 (%)
Figure 58 North America Printed Electronics Market by Printing Technology, 2023-2033 (US$ Bn, AGR (%))
Figure 59 North America Printed Electronics Market Share Forecast by Printing Technology ,2023 & 2033 (%)
Figure 60 North America Printed Electronics Market by End-Use Industry, 2023-2033 (US$ Bn, AGR (%))
Figure 61 North America Printed Electronics Market Share Forecast by End-Use Industry,2023 & 2033 (%)
Figure 62 North America Printed Electronics Market by Devices, 2023-2033 (US$ Bn, AGR (%))
Figure 63 North America Printed Electronics Market Share Forecast by Devices,2023 & 2033 (%)
Figure 64 US Printed Electronics Market by Value, 2023-2033 (US$ Bn, AGR (%))
Figure 65 Canada Printed Electronics Market by Value, 2023-2033 (US$ Bn, AGR (%))
Figure 66 Global Printed Electronics Market by Europe: Market Attractiveness Index
Figure 67 Europe Printed Electronics Market by Country, 2023-2033 (US$ Bn, AGR (%))
Figure 68 Europe Printed Electronics Market Share Forecast by Country, 2023 & 2033 (%)
Figure 69 Europe Printed Electronics Market by Printing Technology, 2023-2033 (US$ Bn, AGR (%))
Figure 70 Europe Printed Electronics Market Share Forecast by Printing Technology ,2023 & 2033 (%)
Figure 71 Europe Printed Electronics Market by End-Use Industry, 2023-2033 (US$ Bn, AGR (%))
Figure 72 Europe Printed Electronics Market Share Forecast by End-Use Industry,2023 & 2033 (%)
Figure 73 Europe Printed Electronics Market by End-Use Industry, 2023-2033 (US$ Bn, AGR (%))
Figure 74 Europe Printed Electronics Market Share Forecast by Devices,2023 & 2033 (%)
Figure 75 Germany Printed Electronics Market by Value, 2023-2033 (US$ Bn, AGR (%))
Figure 76 UK Printed Electronics Market by Value, 2023-2033 (US$ Bn, AGR (%))
Figure 77 France Printed Electronics Market by Value, 2023-2033 (US$ Bn, AGR (%))
Figure 78 Italy Printed Electronics Market by Value, 2023-2033 (US$ Bn, AGR (%))
Figure 79 Spain Printed Electronics Market by Value, 2023-2033 (US$ Bn, AGR (%))
Figure 80 Rest of Europe Printed Electronics Market by Value, 2023-2033 (US$ Bn, AGR (%))
Figure 81 Global Printed Electronics Market by Asia-Pacific: Market Attractiveness Index
Figure 82 Asia-Pacific Printed Electronics Market by Country, 2023-2033 (US$ Bn, AGR (%))
Figure 83 Asia-Pacific Printed Electronics Market Share Forecast by Country, 2023 & 2033 (%)
Figure 84 Asia-Pacific Printed Electronics Market by Printing Technology, 2023-2033 (US$ Bn, AGR (%))
Figure 85 Asia-Pacific Printed Electronics Market Share Forecast by Printing Technology ,2023 & 2033 (%)
Figure 86 Asia-Pacific Printed Electronics Market by End-Use Industry, 2023-2033 (US$ Bn, AGR (%))
Figure 87 Asia-Pacific Printed Electronics Market Share Forecast by End-Use Industry,2023 & 2033 (%)
Figure 88 Asia-Pacific Printed Electronics Market by Devices, 2023-2033 (US$ Bn, AGR (%))
Figure 89 Asia-Pacific Printed Electronics Market Share Forecast by Devices,2023 & 2033 (%)
Figure 90 China Printed Electronics Market by Value, 2023-2033 (US$ Bn, AGR (%))
Figure 91 India Printed Electronics Market by Value, 2023-2033 (US$ Bn, AGR (%))
Figure 92 Japan Printed Electronics Market by Value, 2023-2033 (US$ Bn, AGR (%))
Figure 93 South Korea Printed Electronics Market by Value, 2023-2033 (US$ Bn, AGR (%))
Figure 94 Taiwan Printed Electronics Market by Value, 2023-2033 (US$ Bn, AGR (%))
Figure 95 Rest of Asia-Pacific Printed Electronics Market by Value, 2023-2033 (US$ Bn, AGR (%))
Figure 96 Global Printed Electronics Market by Middle East & Africa: Market Attractiveness Index
Figure 97 Middle East & Africa Printed Electronics Market by Country, 2023-2033 (US$ Bn, AGR (%))
Figure 98 Middle East & Africa Printed Electronics Market Share Forecast by Country, 2023 & 2033 (%)
Figure 99 Middle East & Africa Printed Electronics Market by Printing Technology, 2023-2033 (US$ Bn, AGR (%))
Figure 100 Middle East & Africa Printed Electronics Market Share Forecast by Printing Technology ,2023 & 2033 (%)
Figure 101 Middle East & Africa Printed Electronics Market by End-Use Industry, 2023-2033 (US$ Bn, AGR (%))
Figure 102 Middle East & Africa Printed Electronics Market Share Forecast by End-Use Industry,2023 & 2033 (%)
Figure 103 Middle East & Africa Printed Electronics Market by Devices, 2023-2033 (US$ Bn, AGR (%))
Figure 104 Middle East & Africa Printed Electronics Market Share Forecast by Devices,2023 & 2033 (%)
Figure 105 GCC Printed Electronics Market by Value, 2023-2033 (US$ Bn, AGR (%))
Figure 106 South Africa Printed Electronics Market by Value, 2023-2033 (US$ Bn, AGR (%))
Figure 107 Rest of Middle East & Africa Printed Electronics Market by Value, 2023-2033 (US$ Bn, AGR (%))
Figure 108 Global Printed Electronics Market by Latin America: Market Attractiveness Index
Figure 109 Latin America Printed Electronics Market by Country, 2023-2033 (US$ Bn, AGR (%))
Figure 110 Latin America Printed Electronics Market Share Forecast by Country, 2023 & 2033 (%)
Figure 111 Latin America Printed Electronics Market by Printing Technology, 2023-2033 (US$ Bn, AGR (%))
Figure 112 Latin America Printed Electronics Market Share Forecast by Printing Technology ,2023 & 2033 (%)
Figure 113 Latin America Printed Electronics Market by End-Use Industry, 2023-2033 (US$ Bn, AGR (%))
Figure 114 Latin America Printed Electronics Market by Devices, 2023-2033 (US$ Bn, AGR (%))
Figure 115 Latin America Printed Electronics Market Share Forecast by Devices,2023 & 2033 (%)
Figure 116 Brazil Printed Electronics Market by Value, 2023-2033 (US$ Bn, AGR (%))
Figure 117 Mexico Printed Electronics Market by Value, 2023-2033 (US$ Bn, AGR (%))
Figure 118 Rest of Latin America Printed Electronics Market by Value, 2023-2033 (US$ Bn, AGR (%))
Figure 119 Printed Electronics Market: Company Share/Ranking, 2021
Figure 120 Samsung Electronics Co., Ltd.: Net Revenue, 2018-2022 (US$ million, AGR%)
Figure 121 Samsung Electronics Co., Ltd.: R&D, 2018-2022 (US$ million, AGR%)
Figure 122 Samsung Electronics Co., Ltd.: Regional Market Shares, 2022
Figure 123 Samsung Electronics Co., Ltd.: Regional Market Shares, 2022
Figure 124 LG Display Co., Ltd.: Net Revenue, 2017-2021 (US$ million, AGR%)
Figure 125 LG Display Co., Ltd.: R&D, 2017-2021 (US$ million, AGR%)
Figure 126 LG Display Co., Ltd.: Regional Market Shares, 2022
Figure 127 LG Display Co., Ltd.: Regional Market Shares, 2022
Figure 128 Agfa-Gevaert N.V: Net Revenue, 2018-2022 (US$ million, AGR%)
Figure 129 Agfa-Gevaert N.V: R&D, 2018-2022 (US$ million, AGR%)
Figure 130 Agfa-Gevaert N.V: Regional Market Shares, 2022
Figure 131 Agfa-Gevaert N.V: Regional Market Shares, 2022
Figure 132 DuPont de Nemours, Inc.: Net Revenue, 2018-2022 (US$ million, AGR%)
Figure 133 DuPont de Nemours, Inc.: R&D, 2018-2022 (US$ million, AGR%)
Figure 134 DuPont de Nemours, Inc.: Regional Market Shares, 2022
Figure 135 DuPont de Nemours, Inc.: Regional Market Shares, 2022
Figure 136 BASF SE: Net Revenue, 2018-2022 (US$ million, AGR%)
Figure 137 BASF SE: R&D, 2018-2022 (US$ million, AGR%)
Figure 138 BASF SE: Regional Market Shares, 2022
Figure 139 BASF SE: Regional Market Shares, 2022
Figure 140 E Ink Holdings Inc.: Net Revenue, 2017-2021 (US$ million, AGR%)
Figure 141 E Ink Holdings Inc.: R&D, 2017-2021 (US$ million, AGR%)
Figure 142 E Ink Holdings Inc.: Regional Market Shares, 2021
Figure 143 E Ink Holdings Inc.: Regional Market Shares, 2021
Figure 144 Jabil Inc.: Net Revenue, 2018-2022 (US$ million, AGR%)
Figure 145 Jabil Inc.: R&D, 2018-2022 (US$ million, AGR%)
Figure 146 Jabil Inc.: Regional Market Shares, 2021
Figure 147 Jabil Inc.: Regional Market Shares, 2021
ページTOPに戻る
本レポートと同じKEY WORD()の最新刊レポート
- 本レポートと同じKEY WORDの最新刊レポートはありません。
よくあるご質問
Visiongain社はどのような調査会社ですか?
英国の調査会社ヴィジョンゲイン社(Visiongain)は、通信とエネルギーのほか、自動車や化学・医薬品、金属など、広範な市場を対象に調査を行っています。自動車市場については、市場全般に関する調査のほ... もっと見る
調査レポートの納品までの日数はどの程度ですか?
在庫のあるものは速納となりますが、平均的には 3-4日と見て下さい。
但し、一部の調査レポートでは、発注を受けた段階で内容更新をして納品をする場合もあります。
発注をする前のお問合せをお願いします。
注文の手続きはどのようになっていますか?
1)お客様からの御問い合わせをいただきます。
2)見積書やサンプルの提示をいたします。
3)お客様指定、もしくは弊社の発注書をメール添付にて発送してください。
4)データリソース社からレポート発行元の調査会社へ納品手配します。
5) 調査会社からお客様へ納品されます。最近は、pdfにてのメール納品が大半です。
お支払方法の方法はどのようになっていますか?
納品と同時にデータリソース社よりお客様へ請求書(必要に応じて納品書も)を発送いたします。
お客様よりデータリソース社へ(通常は円払い)の御振り込みをお願いします。
請求書は、納品日の日付で発行しますので、翌月最終営業日までの当社指定口座への振込みをお願いします。振込み手数料は御社負担にてお願いします。
お客様の御支払い条件が60日以上の場合は御相談ください。
尚、初めてのお取引先や個人の場合、前払いをお願いすることもあります。ご了承のほど、お願いします。
データリソース社はどのような会社ですか?
当社は、世界各国の主要調査会社・レポート出版社と提携し、世界各国の市場調査レポートや技術動向レポートなどを日本国内の企業・公官庁及び教育研究機関に提供しております。
世界各国の「市場・技術・法規制などの」実情を調査・収集される時には、データリソース社にご相談ください。
お客様の御要望にあったデータや情報を抽出する為のレポート紹介や調査のアドバイスも致します。
|
|

