チルトセンサー市場レポート:2023-2033
Tilt Sensors Market Report 2023-2033
レポート詳細
チルトセンサー市場レポート 2023-2033 :本レポートは、新たな収益の柱を目指すリーディングカンパニーが、業界とその背景にあるダイナミクスをより深く理解する上で、非常に有益なもの... もっと見る
※上記価格は部署ライセンス(Departmental licence)価格です。
その他の価格についてはデータリソースまでお問合せください。
日本語のページは自動翻訳を利用し作成しています。
実際のレポートは英文のみでご納品いたします。
サマリー
レポート詳細
チルトセンサー市場レポート 2023-2033:本レポートは、新たな収益の柱を目指すリーディングカンパニーが、業界とその背景にあるダイナミクスをより深く理解する上で、非常に有益なものとなるでしょう。また、異業種への進出や新地域での既存事業の拡大を目指す企業にとっても有用なレポートです。
建設・採掘活動の活発化、チルトセンサーの用途拡大、MEMSベースのチルトセンサーの需要拡大などが市場成長を牽引しています
チルトセンサー市場を推進する主な要因としては、建設・採掘活動の増加、チルトセンサーの用途拡大、MEMSベースのチルトセンサーの需要拡大などが挙げられます。MEMS技術は、その小型化と低コスト化により、さまざまな分野で広く利用されており、市場の成長にも影響を与えています。時間の経過とともに、産業界は高度な自動化プロセスへの依存度を高めてきました。このような特性から、転倒防止、プラットフォームレベリング、傾斜アラームのためのセンサーは、多くの分野でより重要なものとなってきています。市場の成長は、効率的で安全、かつ快適に操作できる車両に対する需要の拡大によって促進されると予想されます。センサー分野におけるMEMS技術の発展と小型化により、チルトセンサーの採用率は時間の経過とともに増加しています。近年人気のゲーム用途をはじめ、航空宇宙、自動車、通信など、さまざまな分野で利用され、チルトセンサーの必要性が拡大しています。
フォースバランス技術に基づく傾斜センサーの高コストがもたらす課題
機械や乗り物の安全装置として、最も重要な部品のひとつがチルトセンサーです。家電製品の操作など、多くのプロセスにおいて、角度測定は重要な段階です。しかし、チルトセンサーはコストが高いため、市場成長の妨げになると予想されます。フォースバランス技術に基づくチルトセンサーのコスト高が、市場拡大の制約になっているのです。また、原材料の高騰や傾斜計の性能の信頼性の低さも市場拡大の制約になっています。さらに、MEMSの製造方法が標準化されていないことや、デバイスにセンサーを追加することで追加コストが発生することも、市場拡大の妨げになっています。市場拡大の主な障害は、厳しい環境条件下での精度と信頼性です。
マーケットリサーチレポートを購入する前に、どのような質問をすべきでしょうか?
- チルトセンサー市場はどのように進化しているのか?
- チルトセンサー市場の推進要因と抑制要因は何か?
- 各チルトセンサーのサブマーケットセグメントは予測期間中にどのように成長し、2033年にこれらのサブマーケットが占める収益はどの程度になるのか?
- 2023年から2033年にかけて、各チルトセンサーサブマーケットの市場シェアはどのように推移するのか?
- 2023年から2033年にかけて、市場全体の主なドライバーは何になるのか?
- チルトセンサーの主要市場はマクロ経済のダイナミクスに広く追随するのか、それとも個々の国内市場が他を凌駕するのか?
- 2033年までに各国市場のシェアはどのように変化し、どの地域が2033年の市場をリードするのか?
- 主要プレイヤーは誰か、また予測期間中の展望は?
- これらの主要企業のチルトセンサープロジェクトはどのようなものですか?
- 2023年から2033年の間に、業界はどのように進化するのか?現在および今後10年間に行われるチルトセンサーのプロジェクトはどのような意味を持つのか?
- チルトセンサーの市場規模をさらに拡大するために、製品の商業化の必要性は高いか?
- チルトセンサー市場の方向性と、市場の最前線にいることを保証する方法とは?
- 新製品やサービスラインに対する最適な投資オプションは何か?
- 企業を新たな成長軌道に乗せ、C-suiteに移行させるための重要な展望とは?
このことが、現在、そして今後10年間のチルトセンサーの市場にどのような影響を与えるかを見極める必要があります。- 268ページにわたる本レポートでは、119の表と173のグラフを独占的に提供します。
- このレポートでは、業界における主要な収益性の高い分野をハイライトしているため、今すぐターゲットを絞ることができます。
- 世界、地域、国別の売上高と成長率を詳細に分析しています。
- 競合他社が成功した主なトレンド、変化、収益予測をハイライトしています。
本レポートは、チルトセンサー市場が今後10年間にどのように発展するか、またCOVID-19の景気後退と回復の変動に合わせて、今日あなたにお伝えします。この市場は、過去10年間のどの時点よりも今が重要なのです。
2033年までの予測やその他の分析により、商業的な展望が見えてきた
- 2033年までの収益予測に加え、直近の実績、成長率、市場シェアもご覧いただけます。
- ビジネスの展望や展開など、独自の分析もご覧いただけます。
- 定性的分析(市場力学、促進要因、機会、阻害要因、課題など)、コスト構造、チルトセンサー価格上昇の影響、最近の動向などをご覧いただけます。
本レポートでは、COVID-19が業界と貴社にどのような影響を与えるかについて、データ分析と貴重な洞察を掲載しています。本レポートでは、COVID-19の4つの回収パターンとその影響、すなわち「V」、「L」、「W」、「U」について論じています。
報告書の対象セグメント
使用アルゴリズム
- スタティック
- ダイナミック
測定軸
- 単軸
- 二軸
ハウジング材質別
- 金属
- 非金属
技術
- フォースバランス
- MEMS
- 流体充填
エンドユース産業
- 建設・土木
- 鉱業・農業
- 航空宇宙・防衛
- 自動車・輸送
- 一般産業
- 情報通信
- その他
世界市場全体とセグメントの収益予測に加え、5つの地域と17の主要国市場の収益予測も掲載しています。
北米
- 米国
- カナダ
欧州
- ドイツ
- 英国
- フランス
- イタリア
- スペイン
- ロシア
- その他の欧州
アジア太平洋
- 中国
- 日本
- インド
- 韓国
- オーストラリア
- その他のアジア太平洋地域
ラテンアメリカ
- ブラジル
- メキシコ
- その他のラテンアメリカ地域
MEA
- GCC
- 南米
- その他のMEA
チルトセンサー市場の主要企業のプロファイルと2023年から2033年まで、これらの企業の事業のこのセグメントに焦点を当てます。
主要企業と市場成長の可能性
・ Automation Sensorik Messtechnik GmbH
・ Balluff GmbH
・ Baumer Holding AG
・ DIS Sensors Bv
・ elobau GmbH & Co. KG
・ Gefran S.P.A.
・ IFM Electronic GmbH
・ Jewell Instruments
・ Level Developments Ltd
・ Murata Manufacturing Co., Ltd
・ Pepperl+Fuchs SE
・ Rieker Inc.
・ Sick AG
・ TE Connectivity
・ The Fredericks Company
チルトセンサー市場の世界全体の収益、2023年から2033年までの金額ベースで、2023年に2億2261万米ドルを突破すると、我々の仕事は計算しています。2033年まで力強い収益成長が予測される。このレポートでは、最も大きな可能性を秘めた企業を特定しています。彼らの能力、進歩、商業的展望を発見することで、一歩先を行くことができます。
チルトセンサーの市場、2023年から2033年までのレポートはどのように役立つのでしょうか?
268ページにわたる本レポートは、要約すると以下のような知識を提供するものです。
- チルトセンサー市場、2023年から2033年までの収益予測 使用アルゴリズム、測定軸、ハウジング材料タイプ、技術、最終使用産業、それぞれの予測を世界と地域レベルで掲載 - 業界の展望を発見し、投資と収益の最も有利な場所を見つけます。
- 5つの地域と17の主要国市場の2033年までの収益予測 - 北米、欧州、アジア太平洋、中南米、MEAのチルトセンサー市場、2023年から2033年の市場予測をご覧いただけます。また、米国、カナダ、メキシコ、ブラジル、ドイツ、フランス、英国、イタリア、スペイン、ロシア、中国、インド、日本、韓国、オーストラリア、ブラジル、メキシコなどの主要経済圏の市場も予測されています。
- 既存企業や市場参入を目指す企業の展望 - チルトセンサー市場に関わる主要企業15社の企業プロファイルを含む、2023年から2033年までの展望を掲載しています。
定量的・定性的な分析と独自の予測をご覧いただけます。私たちのレポートだけが持つ情報を入手し、貴重なビジネスインテリジェンスを得ることができます。
他にはない情報
私たちの新しいレポートがあれば、知識の遅れを取り戻し、チャンスを逃す可能性が低くなります。私たちの研究が貴社の調査、分析、意思決定にどのように役立つかをご覧ください。Visiongainの調査は、チルトセンサー市場、2023年から2033年、市場をリードする企業のための商業分析を必要とするすべての人のためのものです。データ、トレンド、予測を見つけることができます。
ページTOPに戻る
目次
目次
1.レポートの概要
1.1 調査の目的
1.2 チルトセンサー市場の紹介
1.3 本レポートが提供するもの
1.4 なぜ本レポートを読むべきなのか
1.5 本分析レポートが回答する重要な質問
1.6 本レポートは誰のためのものなのか?
1.7 方法論
1.7.1 市場の定義
1.7.2 市場評価・予測手法
1.7.3 データの検証
1.7.3.1 一次調査
1.7.3.2 セカンダリーリサーチ
1.8 よくある質問(FAQ)
1.9 関連するVisiongainのレポート
1.10 Visiongainについて
2 エグゼクティブサマリー
3 市場の概要
3.1 主要な調査結果
3.2 マーケットダイナミクス
3.2.1 市場の推進要因
3.2.1.1 建設・鉱業活動の活発化
3.2.1.2 MEMSベースのチルトセンサーの需要拡大
3.2.1.3 チルトセンサーのアプリケーションの増加
3.2.2 市場阻害要因
3.2.2.1 フォースバランス技術に基づくチルトセンサーのコスト高
3.2.2.2 市場の持続的な競争
3.2.3 市場機会
3.2.3.1 ロボットやその他のアプリケーションにおけるチルトセンサーの採用の増加
3.3 COVID-19影響度分析
3.4 ポーターのファイブフォース分析
3.4.1 供給者のバーゲニングパワー
3.4.2 バイヤーのバーゲニングパワー
3.4.3 競合他社の競争力
3.4.4 代替品による脅威
3.4.5 新規参入者の脅威
3.5 PEST分析
4 チルトセンサー市場分析:使用アルゴリズム別
4.1 主な調査結果
4.2 使用アルゴリズムセグメント市場魅力度指数
4.3 チルトセンサーのアルゴリズム別市場規模の推定と予測
4.4 スタティックセグメント
4.4.1 地域別市場規模、2023年~2033年(百万米ドル)
4.4.2 地域別市場シェア、2023年&2033年(%)
4.5 ダイナミックセグメント
4.5.1 地域別市場規模、2023年~2033年(百万米ドル)
4.5.2 地域別市場シェア、2023年&2033年(%)
5 チルトセンサー市場分析:測定軸別
5.1 主な調査結果
5.2 計測軸セグメント市場魅力度指数
5.3 チルトセンサーの測定軸別市場規模予測・予測
5.4 単軸セグメント
5.4.1 地域別市場規模、2023年~2033年(百万米ドル)
5.4.2 地域別市場シェア、2023年&2033年(%)
5.5 デュアルアクシス・セグメント
5.5.1 地域別市場規模、2023年~2033年 (百万米ドル)
5.5.2 地域別市場シェア、2023年&2033年(%)
6 チルトセンサー市場分析:ハウジング材質別
6.1 主な調査結果
6.2 ハウジング材質別セグメント市場魅力度指数
6.3 チルトセンサーのハウジング材質別市場規模の推定と予測
6.4 金属セグメント
6.4.1 地域別市場規模、2023年~2033年 (百万米ドル)
6.4.2 地域別市場シェア、2023年&2033年(%)
6.5 非金属セグメント
6.5.1 地域別市場規模、2023年~2033年(百万米ドル)
6.5.2 地域別市場シェア、2023年&2033年(%)
7 チルトセンサー市場分析:技術別
7.1 主な調査結果
7.2 技術セグメント市場魅力度指数
7.3 チルトセンサーの技術別市場規模推定と予測
7.4 フォースバランスセグメント
7.4.1 地域別市場規模、2023年~2033年 (百万米ドル)
7.4.2 地域別市場シェア、2023年&2033年(%)
7.5 MEMSセグメント
7.5.1 地域別市場規模、2023年~2033年 (百万米ドル)
7.5.2 地域別市場シェア、2023年&2033年(%)
7.6 流体充填セグメント
7.6.1 地域別市場規模、2023年~2033年 (百万米ドル)
7.6.2 地域別市場シェア、2023年&2033年(%)
8 チルトセンサー市場分析:エンドユーズ産業別
8.1 主な調査結果
8.2 エンドユーズ産業セグメント市場魅力度指数
8.3 チルトセンサーの最終用途別市場規模の推定と予測
8.4 建設業セグメント
8.4.1 地域別市場規模、2023年~2033年(百万米ドル)
8.4.2 地域別市場シェア、2023年&2033年(%)
8.5 鉱業・農業セグメント
8.5.1 地域別市場規模、2023年〜2033年 (百万米ドル)
8.5.2 地域別市場シェア、2023年&2033年(%)
8.6 航空宇宙・防衛セグメント
8.6.1 地域別市場規模、2023年~2033年 (百万米ドル)
8.6.2 地域別市場シェア、2023年&2033年(%)
8.7 自動車・輸送機器セグメント
8.7.1 地域別市場規模、2023年〜2033年 (百万米ドル)
8.7.2 地域別市場シェア、2023年&2033年(%)
8.8 一般産業セグメント
8.8.1 地域別市場規模、2023年~2033年 (百万米ドル)
8.8.2 地域別市場シェア、2023年&2033年 (%)
8.9 通信事業セグメント
8.9.1 地域別市場規模、2023年~2033年 (百万米ドル)
8.9.2 地域別市場シェア、2023年&2033年 (%)
8.10 その他セグメント
8.10.1 地域別市場規模、2023年~2033年 (百万米ドル)
8.10.2 地域別市場シェア、2023年&2033年(%)
9 チルトセンサー市場分析:地域別
9.1 主な調査結果
9.2 地域別市場規模の推定と予測
10 北米のチルトセンサー市場分析
10.1 主な調査結果
10.2 北米チルトセンサー市場魅力度指数
10.3 北米チルトセンサーの国別市場規模予測:2023年、2028年&2033年(百万米ドル)
10.4 北米チルトセンサーの国別市場規模予測・予想
10.5 北米チルトセンサーの市場規模予測・予想:使用アルゴリズム別
10.6 北米チルトセンサーの市場規模予測・予想:計測軸別
10.7 北米チルトセンサーの市場規模予測・予想:ハウジング材質別
10.8 北米チルトセンサーの市場規模予測・予想:技術別
10.9 北米チルトセンサーの市場規模予測・予想:エンドユーズ産業別
10.10 アメリカのチルトセンサーの市場分析
10.11 カナダのチルトセンサーの市場分析
11 欧州のチルトセンサー市場分析
11.1 主な調査結果
11.2 欧州チルトセンサー市場魅力度指数
11.3 欧州チルトセンサーの国別市場規模予測:2023年、2028年&2033年(百万米ドル)
11.4 欧州チルトセンサーの国別市場規模予測・予想
11.5 欧州チルトセンサーの市場規模予測・予想:使用アルゴリズム別
11.6 欧州チルトセンサーの市場規模予測・予想:計測軸別
11.7 欧州チルトセンサーの市場規模予測・予想:ハウジング材質別
11.8 欧州チルトセンサーの市場規模予測・予想:技術別
11.9 欧州チルトセンサーの市場規模予測・予想:エンドユーズ産業別
11.10 ドイツのチルトセンサーの市場分析
11.11 イギリスのチルトセンサーの市場分析
11.12 フランスのチルトセンサーの市場分析
11.13 イタリアのチルトセンサーの市場分析
11.14 スペインのチルトセンサーの市場分析
11.5 ロシアのチルトセンサーの市場分析
11.16 その他の欧州チルトセンサーの市場分析
12 アジア太平洋地域のチルトセンサーの市場分析
12.1 主な調査結果
12.2 アジア太平洋地域のチルトセンサー市場の魅力度指数
12.3 アジア太平洋地域のチルトセンサーの国別市場規模予測:2023年、2028年&2033年(百万米ドル)
12.4 アジア太平洋地域のチルトセンサーの国別市場規模予測・予想
12.5 アジア太平洋地域のチルトセンサーの市場規模予予測・予想:使用アルゴリズム別
12.6 アジア太平洋地域のチルトセンサーの市場規模予測・予想:計測軸別
12.7 アジア太平洋地域のチルトセンサーの市場規模予測・予想:ハウジング材質別
12.8 アジア太平洋地域のチルトセンサーの市場規模予測・予想:技術別
12.9 アジア太平洋地域のチルトセンサーの市場規模予測・予想:エンドユーザー産業別
12.10 中国のチルトセンサーの市場分析
12.11 日本のチルトセンサーの市場分析
12.12 インドのチルトセンサーの市場分析
12.13 韓国のチルトセンサーの市場分析
12.14 オーストラリアのチルトセンサーの市場分析
12.15 その他のアジア太平洋地域チルトセンサーの市場分析
13 ラテンアメリカのチルトセンサー市場分析
13.1 主な調査結果
13.2 ラテンアメリカのチルトセンサー市場魅力度指数
13.3 ラテンアメリカのチルトセンサー国別市場:2023年、2028年&2033年 (百万米ドル)
13.4 ラテンアメリカのチルトセンサーの国別市場規模予測・予想
13.5 ラテンアメリカのチルトセンサー市場規模予測・予想:使用アルゴリズム別
13.6 ラテンアメリカのチルトセンサーの市場規模予測・予想:測定軸別
13.7 ラテンアメリカのチルトセンサーの市場規模予測・予想:ハウジング材質別
13.8 ラテンアメリカのチルトセンサーの市場規模予測・予想:技術別
13.9 ラテンアメリカのチルトセンサーの市場規模予測・予想:エンドユーザー産業別
13.10 ブラジルチルトセンサーの市場分析
13.11 メキシコのチルトセンサーの市場分析
13.12 その他のラテンアメリカのチルトセンサーの市場分析
14 MEAのチルトセンサー市場分析
14.1 主な調査結果
14.2 MEAチルトセンサー市場の魅力度指数
14.3 MEAチルトセンサーの国別市場規模予測、2023年、2028年&2033年(百万米ドル)
14.4 MEAチルトセンサーの国別市場規模予測・予想
14.5 MEAチルトセンサーの市場規模予測・予想:使用アルゴリズム別
14.6 MEAチルトセンサーの市場規模予測・予想:測定軸別
14.7 MEAチルトセンサーの市場規模予測・予想:ハウジング素材タイプ別
14.8 MEAチルトセンサーの市場規模予測・予想:技術別
14.9 MEAチルトセンサーの市場規模予測・予想:ハウジング材質別
14.10 GCCのチルトセンサーの市場分析
14.11 南米のチルトセンサーの市場分析
14.12 MEAの他の地域チルトセンサーの市場分析
15 主要企業プロフィール
15.1 競合状況、2022年
15.2 戦略的な展望
15.3 シックAG
15.3.1 企業スナップショット
15.3.2 会社概要
15.3.3 財務分析
15.3.3.1 純収益、2016-2021年
15.3.3.2 R&D、2016-2021年
15.3.3.3 地域別市場シェア、2021年
15.3.3.4 セグメント別市場シェア、2021年
15.3.4 製品ベンチマーク
15.3.5 戦略的な展望
15.4 TE コネクティビティ
15.4.1 企業スナップショット
15.4.2 会社概要
15.4.3 財務分析
15.4.3.1 純収益、2017-2021年
15.4.3.2 R&D、2016年~2021年
15.4.3.3 地域別市場シェア、2021年
15.4.3.4 セグメント別市場シェア、2021年
15.4.4 製品ベンチマーク
15.4.5 戦略的な展望
15.5 Baumer Holding AG
15.5.1 企業スナップショット
15.5.2 会社概要
15.5.3 製品ベンチマーク
15.5.4 戦略的展望
15.6 IFMエレクトロニックGmbH
15.6.1 企業スナップショット
15.6.2 会社概要
15.6.3 ベンチマーキング
15.6.4 戦略的展望
15.7 ゲフランS.P.A.
15.7.1 企業スナップショット
15.7.2 会社概要
15.7.3 財務分析
15.7.3.1 純収益、2016-2021年
15.7.3.2 投資額、2016年〜2021年
15.7.3.3 地域別市場シェア、2021年
15.7.3.4 セグメント別市場シェア、2021年
15.7.4 製品ベンチマーク
15.8 ペッパールプラスフックスSE
15.8.1 企業スナップショット
15.8.2 会社概要
15.8.3 製品ベンチマーク
15.8.4 戦略的な展望
15.9 elobau GmbH & Co.KG
15.9.1 会社概要
15.9.2 会社概要
15.9.3 製品ベンチマーク
15.10 バルーフ社
15.10.1 企業スナップショット
15.10.2 会社概要
15.10.3 ベンチマーキング
15.11 オートメーションセンサークメステクニック社
15.11.1 企業スナップショット
15.11.2 会社概要
15.11.3 ベンチマーキング
15.11.4 戦略的な展望
15.12 ジュエルインスツルメンツ
15.12.1 企業スナップショット
15.12.2 会社概要
15.12.3 ベンチマーキング
15.12.4 戦略的展望
15.13 DISセンサーBv
15.13.1 企業スナップショット
15.13.2 会社概要
15.13.3 ベンチマーキング
15.13.4 戦略的展望
15.14 レベル・デベロプメント社
15.14.1 企業スナップショット
15.14.2 会社概要
15.14.3 製品ベンチマーク
15.14.4 戦略的展望
15.15 リーカー
15.15.1 企業スナップショット
15.15.2 会社概要
15.15.3 ベンチマーキング
15.16 村田製作所
15.16.1 企業スナップショット
15.16.2 会社概要
15.16.3 財務分析
15.16.3.1 純収益、2017-2021年
15.16.3.2 R&D、2017年-2021年
15.16.3.3 地域別市場シェア、2021年
15.16.3.4 セグメント別市場シェア、2021年
15.16.4 製品ベンチマーク
15.16.5 戦略的な展望
15.17 フレデリックス社
15.17.1 企業スナップショット
15.17.2 会社概要
15.17.3 製品ベンチマーク
16 結論と提言
16.1 ヴィジョンゲインからの結論
16.2 市場関係者への提言
L表の一覧
Table 1 Tilt Sensors Market Snapshot, 2023 & 2033 (US$ Million, CAGR %)
Table 2 Tilt Sensors Market Forecast by Region, 2023-2033 (US$ Million, AGR%, CAGR%): “V” Shaped Recovery Scenario
Table 3 Tilt Sensors Market Forecast by Region, 2023-2033 (US$ Million, AGR%, CAGR%): “U” Shaped Recovery Scenario
Table 4 Tilt Sensors Market Forecast by Region, 2023-2033 (US$ Million, AGR%, CAGR%): “W” Shaped Recovery Scenario
Table 5 Tilt Sensors Market Forecast by Region, 2023-2033 (US$ Million, AGR%, CAGR%): “L” Shaped Recovery Scenario
Table 6 Tilt Sensors Market Forecast by Algorithms Used, 2023-2033 (US$ Million, AGR%, CAGR%)
Table 7 Static Tilt Sensors Market Forecast by Region, 2023-2033 (US$ Million, AGR%, CAGR%)
Table 8 Dynamic Tilt Sensors Market Forecast by Region, 2023-2033 (US$ Million, AGR%, CAGR%)
Table 9 Tilt Sensors Market Forecast by Measurement Axis, 2023-2033 (US$ Million, AGR%, CAGR%)
Table 10 Single Axis Tilt Sensors Market Forecast by Region, 2023-2033 (US$ Million, AGR%, CAGR%)
Table 11 Dual Axis Tilt Sensors Market Forecast by Region, 2023-2033 (US$ Million, AGR%, CAGR%)
Table 12 Tilt Sensors Market Forecast by Housing Material Type, 2023-2033 (US$ Million, AGR%, CAGR%)
Table 13 Metal Tilt Sensors Market Forecast by Region, 2023-2033 (US$ Million, AGR%, CAGR%)
Table 14 Nonmetal Tilt Sensors Market Forecast by Region, 2023-2033 (US$ Million, AGR%, CAGR%)
Table 15 Tilt Sensors Market Forecast by Technology, 2023-2033 (US$ Million, AGR%, CAGR%)
Table 16 Force Balance Tilt Sensors Market Forecast by Region, 2023-2033 (US$ Million, AGR%, CAGR%)
Table 17 MEMS Tilt Sensors Market Forecast by Region, 2023-2033 (US$ Million, AGR%, CAGR%)
Table 18 Fluid Filled Tilt Sensors Market Forecast by Region, 2023-2033 (US$ Million, AGR%, CAGR%)
Table 19 Tilt Sensors Market Forecast by End-Use Industry, 2023-2033 (US$ Million, AGR%, CAGR%)
Table 20 Construction Tilt Sensors Market Forecast by Region, 2023-2033 (US$ Million, AGR%, CAGR%)
Table 21 Mining and Agriculture Tilt Sensors Market Forecast by Region, 2023-2033 (US$ Million, AGR%, CAGR%)
Table 22 Aerospace and Defense Tilt Sensors Market Forecast by Region, 2023-2033 (US$ Million, AGR%, CAGR%)
Table 23 Automotive and Transportation Tilt Sensors Market Forecast by Region, 2023-2033 (US$ Million, AGR%, CAGR%)
Table 24 General Industrial Tilt Sensors Market Forecast by Region, 2023-2033 (US$ Million, AGR%, CAGR%)
Table 25 Telecommunications Tilt Sensors Market Forecast by Region, 2023-2033 (US$ Million, AGR%, CAGR%)
Table 26 Other End-use Industries Tilt Sensors Market Forecast by Region, 2023-2033 (US$ Million, AGR%, CAGR%)
Table 27 Tilt Sensors Market Forecast by Region, 2023-2033 (US$ Million, AGR%, CAGR%)
Table 28 North America Tilt Sensors Market Forecast by Country, 2023-2033 (US$ Million, AGR%, CAGR%)
Table 29 North America Tilt Sensors Market Forecast by Algorithms Used, 2023-2033 (US$ Million, AGR%, CAGR%)
Table 30 North America Tilt Sensors Market Forecast by Measurement Axis, 2023-2033 (US$ Million, AGR%, CAGR%)
Table 31 North America Tilt Sensors Market Forecast by Housing Material Type, 2023-2033 (US$ Million, AGR%, CAGR%)
Table 32 North America Tilt Sensors Market Forecast by Technology, 2023-2033 (US$ Million, AGR%, CAGR%)
Table 33 North America Tilt Sensors Market Forecast by End-Use Industry, 2023-2033 (US$ Million, AGR%, CAGR%)
Table 34 U.S. Tilt Sensors Market Forecast, 2023-2033 (US$ Million, AGR%, CAGR%)
Table 35 Canada Tilt Sensors Market Forecast, 2023-2033 (US$ Million, AGR%, CAGR%)
Table 36 Europe Tilt Sensors Market Forecast by Country, 2023-2033 (US$ Million, AGR%, CAGR%)
Table 37 Europe Tilt Sensors Market Forecast by Algorithms Used, 2023-2033 (US$ Million, AGR%, CAGR%)
Table 38 Europe Tilt Sensors Market Forecast by Measurement Axis, 2023-2033 (US$ Million, AGR%, CAGR%)
Table 39 Europe Tilt Sensors Market Forecast by Housing Material Type, 2023-2033 (US$ Million, AGR%, CAGR%)
Table 40 Europe Tilt Sensors Market Forecast by Technology, 2023-2033 (US$ Million, AGR%, CAGR%)
Table 41 Europe Tilt Sensors Market Forecast by End-Use Industry, 2023-2033 (US$ Million, AGR%, CAGR%)
Table 42 Germany Tilt Sensors Market Forecast, 2023-2033 (US$ Million, AGR%, CAGR%)
Table 43 UK Tilt Sensors Market Forecast, 2023-2033 (US$ Million, AGR%, CAGR%)
Table 44 France Tilt Sensors Market Forecast, 2023-2033 (US$ Million, AGR%, CAGR%)
Table 45 Italy Tilt Sensors Market Forecast, 2023-2033 (US$ Million, AGR%, CAGR%)
Table 46 Spain Tilt Sensors Market Forecast, 2023-2033 (US$ Million, AGR%, CAGR%)
Table 47 Russia Tilt Sensors Market Forecast, 2023-2033 (US$ Million, AGR%, CAGR%)
Table 48 Rest of Europe Tilt Sensors Market Forecast, 2023-2033 (US$ Million, AGR%, CAGR%)
Table 49 Asia Pacific Tilt Sensors Market Forecast by Country, 2023-2033 (US$ Million, AGR%, CAGR%)
Table 50 Asia Pacific Tilt Sensors Market Forecast by Algorithms Used, 2023-2033 (US$ Million, AGR%, CAGR%)
Table 51 Asia Pacific Tilt Sensors Market Forecast by Measurement Axis, 2023-2033 (US$ Million, AGR%, CAGR%)
Table 52 Asia Pacific Tilt Sensors Market Forecast by Housing Material Type, 2023-2033 (US$ Million, AGR%, CAGR%)
Table 53 Asia-Pacific Tilt Sensors Market Forecast by Technology, 2023-2033 (US$ Million, AGR%, CAGR%)
Table 54 Asia-Pacific Tilt Sensors Market Forecast by End-Use Industry, 2023-2033 (US$ Million, AGR%, CAGR%)
Table 55 China Tilt Sensors Market Forecast, 2023-2033 (US$ Million, AGR%, CAGR%)
Table 56 Japan Tilt Sensors Market Forecast, 2023-2033 (US$ Million, AGR%, CAGR%)
Table 57 India Tilt Sensors Market Forecast, 2023-2033 (US$ Million, AGR%, CAGR%)
Table 58 South Korea Tilt Sensors Market Forecast, 2023-2033 (US$ Million, AGR%, CAGR%)
Table 59 Australia Tilt Sensors Market Forecast, 2023-2033 (US$ Million, AGR%, CAGR%)
Table 60 Rest of Asia Pacific Tilt Sensors Market Forecast, 2023-2033 (US$ Million, AGR%, CAGR%)
Table 61 Latin America Tilt Sensors Market Forecast by Country, 2023-2033 (US$ Million, AGR%, CAGR%)
Table 62 Latin America Tilt Sensors Market Forecast by Algorithms Used, 2023-2033 (US$ Million, AGR%, CAGR%)
Table 63 Latin America Tilt Sensors Market Forecast by Measurement Axis, 2023-2033 (US$ Million, AGR%, CAGR%)
Table 64 Latin America Tilt Sensors Market Forecast by Housing Material Type, 2023-2033 (US$ Million, AGR%, CAGR%)
Table 65 Latin America Tilt Sensors Market Forecast by Technology, 2023-2033 (US$ Million, AGR%, CAGR%)
Table 66 Latin America Tilt Sensors Market Forecast by End-Use Industry, 2023-2033 (US$ Million, AGR%, CAGR%)
Table 67 Brazil Tilt Sensors Market Forecast, 2023-2033 (US$ Million, AGR%, CAGR%)
Table 68 Mexico Tilt Sensors Market Forecast, 2023-2033 (US$ Million, AGR%, CAGR%)
Table 69 Rest of Latin America Tilt Sensors Market Forecast, 2023-2033 (US$ Million, AGR%, CAGR%)
Table 70 MEA Tilt Sensors Market Forecast by Country, 2023-2033 (US$ Million, AGR%, CAGR%)
Table 71 MEA Tilt Sensors Market Forecast by Algorithms Used, 2023-2033 (US$ Million, AGR%, CAGR%)
Table 72 MEA Tilt Sensors Market Forecast by Measurement Axis, 2023-2033 (US$ Million, AGR%, CAGR%)
Table 73 MEA Tilt Sensors Market Forecast by Housing Material Type, 2023-2033 (US$ Million, AGR%, CAGR%)
Table 74 MEA Tilt Sensors Market Forecast by Technology, 2023-2033 (US$ Million, AGR%, CAGR%)
Table 75 Middle East & Africa Tilt Sensors Market Forecast by End-Use Industry, 2023-2033 (US$ Million, AGR%, CAGR%)
Table 76 GCC Tilt Sensors Market Forecast, 2023-2033 (US$ Million, AGR%, CAGR%)
Table 77 South Africa Tilt Sensors Market Forecast, 2023-2033 (US$ Million, AGR%, CAGR%)
Table 78 Rest of MEA Tilt Sensors Market Forecast, 2023-2033 (US$ Million, AGR%, CAGR%)
Table 79 Strategic Outlook
Table 80 Sick AG: Key Details, (CEO, HQ, Revenue, Founded, No. of Employees, Company Type, Website, Business Segment)
Table 81 Sick AG: Product Benchmarking
Table 82 Sick AG: Strategic Outlook
Table 83 TE Connectivity: Key Details, (CEO, HQ, Revenue, Founded, No. of Employees, Company Type, Website, Business Segment)
Table 84 TE Connectivity: Product Benchmarking
Table 85 TE Connectivity: Strategic Outlook
Table 86 Baumer Holding AG: Key Details, (CEO, HQ, Revenue, Founded, No. of Employees, Company Type, Website, Business Segment)
Table 87 Baumer Holding AG: Product Benchmarking
Table 88 Baumer Holding AG: Strategic Outlook
Table 89 IFM Electronic GmbH: Key Details, (CEO, HQ, Revenue, Founded, No. of Employees, Company Type, Website, Business Segment)
Table 90 IFM Electronic GmbH: Product Benchmarking
Table 91 IFM Electronic GmbH: Strategic Outlook
Table 92 Gefran S.P.A.: Key Details, (CEO, HQ, Revenue, Founded, No. of Employees, Company Type, Website, Business Segment)
Table 93 Gefran S.P.A.: Product Benchmarking
Table 94 Pepperl+Fuchs SE: Key Details, (CEO, HQ, Revenue, Founded, No. of Employees, Company Type, Website, Business Segment)
Table 95 Pepperl+Fuchs SE: Product Benchmarking
Table 96 Pepperl+Fuchs SE: Strategic Outlook
Table 97 elobau GmbH & Co. KG: Key Details, (CEO, HQ, Revenue, Founded, No. of Employees, Company Type, Website, Business Segment)
Table 98 elobau GmbH & Co. KG: Product Benchmarking
Table 99 Balluff GmbH: Key Details, (CEO, HQ, Revenue, Founded, No. of Employees, Company Type, Website, Business Segment)
Table 100 Balluff GmbH: Product Benchmarking
Table 101 Automation Sensorik Messtechnik GmbH: Key Details, (CEO, HQ, Revenue, Founded, No. of Employees, Company Type, Website, Business Segment)
Table 102 Automation Sensorik Messtechnik GmbH: Product Benchmarking
Table 103 Automation Sensorik Messtechnik GmbH: Strategic Outlook
Table 104 Jewell Instruments: Key Details, (CEO, HQ, Revenue, Founded, No. of Employees, Company Type, Website, Business Segment)
Table 105 Jewell Instruments: Product Benchmarking
Table 106 Jewell Instruments: Strategic Outlook
Table 107 DIS Sensors Bv: Key Details, (CEO, HQ, Revenue, Founded, No. of Employees, Company Type, Website, Business Segment)
Table 108 DIS Sensors Bv: Product Benchmarking
Table 109 DIS Sensors Bv: Strategic Outlook
Table 110 Level Developments Ltd: Key Details, (CEO, HQ, Revenue, Founded, No. of Employees, Company Type, Website, Business Segment)
Table 111 Level Developments Ltd: Product Benchmarking
Table 112 Level Developments Ltd: Strategic Outlook
Table 113 Rieker Inc.: Key Details, (CEO, HQ, Revenue, Founded, No. of Employees, Company Type, Website, Business Segment)
Table 114 Rieker Inc.: Product Benchmarking
Table 115 Murata Manufacturing Co., Ltd: Key Details, (CEO, HQ, Revenue, Founded, No. of Employees, Company Type, Website, Business Segment)
Table 116 Murata Manufacturing Co., Ltd: Product Benchmarking
Table 117 Murata Manufacturing Co., Ltd: Strategic Outlook
Table 118 The Fredericks Company: Key Details, (CEO, HQ, Revenue, Founded, No. of Employees, Company Type, Website, Business Segment)
Table 119 The Fredericks Company: Product Benchmarking
図の一覧
Figure 1 Tilt Sensors Market Segmentation
Figure 2 Tilt Sensors Market by Algorithms Used: Market Attractiveness Index
Figure 3 Tilt Sensors Market by Measurement Axis: Market Attractiveness Index
Figure 4 Tilt Sensors Market by Housing Material Type: Market Attractiveness Index
Figure 5 Tilt Sensors Market by Technology: Market Attractiveness Index
Figure 6 Tilt Sensors Market by End-Use Industry: Market Attractiveness Index
Figure 7 Tilt Sensors Market Attractiveness Index by Region
Figure 8 Tilt Sensors Market: Market Dynamics
Figure 9 COVID Impact Analysis: Tilt Sensors Market Recovery Scenarios
Figure 10 Tilt Sensors Market by Region, 2023-2033 (US$ Million and AGR (%)): “V” Shaped Recovery
Figure 11 Tilt Sensors Market by Region, 2023-2033 (US$ Million and AGR (%)): “U” Shaped Recovery
Figure 12 Tilt Sensors Market by Region, 2023-2033 (US$ Million and AGR (%)): “W” Shaped Recovery
Figure 13 Tilt Sensors Market by Region, 2023-2033 (US$ Million and AGR (%)): “L” Shaped Recovery
Figure 14 Tilt Sensors Market: Porter’s Five Forces Analysis
Figure 15 Tilt Sensors Market: PEST Analysis
Figure 16 Tilt Sensors Market by Algorithms Used: Market Attractiveness Index
Figure 17 Tilt Sensors Market Forecast by Algorithms Used, 2023-2033 (US$ Million and AGR (%))
Figure 18 Tilt Sensors Market Share Forecast by Algorithms Used, 2023, 2028, 2033 (%)
Figure 19 Static Tilt Sensors Market Forecast by Region, 2023-2033 (US$ Million and AGR (%))
Figure 20 Static Tilt Sensors Market Share Forecast by Region, 2023 & 2033 (%)
Figure 21 Dynamic Tilt Sensors Market Forecast by Region, 2023-2033 (US$ Million and AGR (%))
Figure 22 Dynamic Tilt Sensors Market Share Forecast by Region, 2023 & 2033 (%)
Figure 23 Tilt Sensors Market by Measurement Axis: Market Attractiveness Index
Figure 24 Tilt Sensors Market Forecast by Measurement Axis, 2023-2033 (US$ Million and AGR (%))
Figure 25 Tilt Sensors Market Share Forecast by Measurement Axis, 2023, 2028, 2033 (%)
Figure 26 Single Axis Tilt Sensors Market Forecast by Region, 2023-2033 (US$ Million and AGR (%))
Figure 27 Single Axis Tilt Sensors Market Share Forecast by Region, 2023 & 2033 (%)
Figure 28 Dual Axis Tilt Sensors Market Forecast by Region, 2023-2033 (US$ Million and AGR (%))
Figure 29 Dual Axis Tilt Sensors Market Share Forecast by Region, 2023 & 2033 (%)
Figure 30 Tilt Sensors Market by Housing Material Type: Market Attractiveness Index
Figure 31 Tilt Sensors Market Forecast by Housing Material Type, 2023-2033 (US$ Million and AGR (%))
Figure 32 Tilt Sensors Market Share Forecast by Housing Material Type, 2023, 2028, 2033 (%)
Figure 33 Metal Tilt Sensors Market Forecast by Region, 2023-2033 (US$ Million and AGR (%))
Figure 34 Metal Tilt Sensors Market Share Forecast by Region, 2023 & 2033 (%)
Figure 35 Nonmetal Tilt Sensors Market Forecast by Region, 2023-2033 (US$ Million and AGR (%))
Figure 36 Nonmetal Tilt Sensors Market Share Forecast by Region, 2023 & 2033 (%)
Figure 37 Tilt Sensors Market by Technology: Market Attractiveness Index
Figure 38 Tilt Sensors Market Forecast by Technology, 2023-2033 (US$ Million and AGR (%))
Figure 39 Tilt Sensors Market Share Forecast by Technology, 2023, 2028, 2033 (%)
Figure 40 Force Balance Tilt Sensors Market Forecast by Region, 2023-2033 (US$ Million and AGR (%))
Figure 41 Force Balance Tilt Sensors Market Share Forecast by Region, 2023 & 2033 (%)
Figure 42 MEMS Tilt Sensors Market Forecast by Region, 2023-2033 (US$ Million and AGR (%))
Figure 43 MEMS Tilt Sensors Market Share Forecast by Region, 2023 & 2033 (%)
Figure 44 Fluid Filled Tilt Sensors Market Forecast by Region, 2023-2033 (US$ Million and AGR (%))
Figure 45 Fluid Filled Tilt Sensors Market Share Forecast by Region, 2023 & 2033 (%)
Figure 46 Tilt Sensors Market by End-Use Industry: Market Attractiveness Index
Figure 47 Tilt Sensors Market Forecast by End-Use Industry, 2023-2033 (US$ Million and AGR (%))
Figure 48 Tilt Sensors Market Share Forecast by End-Use Industry, 2023, 2028, 2033 (%)
Figure 49 Construction Tilt Sensors Market Forecast by Region, 2023-2033 (US$ Million and AGR (%))
Figure 50 Construction Tilt Sensors Market Share Forecast by Region, 2023 & 2033 (%)
Figure 51 Mining and Agriculture Tilt Sensors Market Forecast by Region, 2023-2033 (US$ Million and AGR (%))
Figure 52 Mining and Agriculture Tilt Sensors Market Share Forecast by Region, 2023 & 2033 (%)
Figure 53 Aerospace and Defense Tilt Sensors Market Forecast by Region, 2023-2033 (US$ Million and AGR (%))
Figure 54 Aerospace and Defense Tilt Sensors Market Share Forecast by Region, 2023 & 2033 (%)
Figure 55 Automotive and Transportation Tilt Sensors Market Forecast by Region, 2023-2033 (US$ Million and AGR (%))
Figure 56 Automotive and Transportation Tilt Sensors Market Share Forecast by Region, 2023 & 2033 (%)
Figure 57 General Industrial Tilt Sensors Market Forecast by Region, 2023-2033 (US$ Million and AGR (%))
Figure 58 General Industrial Tilt Sensors Market Share Forecast by Region, 2023 & 2033 (%)
Figure 59 Telecommunications Tilt Sensors Market Forecast by Region, 2023-2033 (US$ Million and AGR (%))
Figure 60 Telecommunications Tilt Sensors Market Share Forecast by Region, 2023 & 2033 (%)
Figure 61 Other End-Use Industries Tilt Sensors Market Forecast by Region, 2023-2033 (US$ Million and AGR (%))
Figure 62 Other End-Use Industries Tilt Sensors Market Share Forecast by Region, 2023 & 2033 (%)
Figure 63 Tilt Sensors Market Forecast by Region 2023, 2028, 2033 (Revenue, CAGR%)
Figure 64 Tilt Sensors Market Share Forecast by Region 2023, 2028, 2033 (%)
Figure 65 Tilt Sensors Market Forecast by Region, 2023-2033 (US$ Million and AGR (%))
Figure 66 North America Tilt Sensors Market Attractiveness Index
Figure 67 North America Tilt Sensors Market by Region, 2023, 2028 & 2033 (US$ Million)
Figure 68 North America Tilt Sensors Market Forecast by Country, 2023-2033 (US$ Million and AGR (%))
Figure 69 North America Tilt Sensors Market Share Forecast by Country, 2023 & 2033 (%)
Figure 70 North America Tilt Sensors Market Forecast by Algorithms Used, 2023-2033 (US$ Million and AGR (%))
Figure 71 North America Tilt Sensors Market Share Forecast by Algorithms Used, 2023 & 2033 (%)
Figure 72 North America Tilt Sensors Market Forecast by Measurement Axis, 2023-2033 (US$ Million and AGR (%))
Figure 73 North America Tilt Sensors Market Share Forecast by Measurement Axis, 2023 & 2033 (%)
Figure 74 North America Tilt Sensors Market Forecast by Housing Material Type, 2023-2033 (US$ Million and AGR (%))
Figure 75 North America Tilt Sensors Market Share Forecast by Housing Material Type, 2023 & 2033 (%)
Figure 76 North America Tilt Sensors Market Forecast by Technology, 2023-2033 (US$ Million and AGR (%))
Figure 77 North America Tilt Sensors Market Share Forecast by Technology, 2023 & 2033 (%)
Figure 78 North America Tilt Sensors Market Forecast by End-Use Industry, 2023-2033 (US$ Million and AGR (%))
Figure 79 North America Tilt Sensors Market Share Forecast by End-Use Industry, 2023 & 2033 (%)
Figure 80 U.S. Tilt Sensors Market Forecast, 2023-2033 (US$ Million and AGR %)
Figure 81 Canada Tilt Sensors Market Forecast, 2023-2033 (US$ Million and AGR %)
Figure 82 Europe Tilt Sensors Market Attractiveness Index
Figure 83 Europe Tilt Sensors Market by Country, 2023, 2028 & 2033 (US$ Million)
Figure 84 Europe Tilt Sensors Market Forecast by Country, 2023-2033 (US$ Million and AGR (%))
Figure 85 Europe Tilt Sensors Market Share Forecast by Country, 2023 & 2033 (%)
Figure 86 Europe Tilt Sensors Market Forecast by Algorithms Used, 2023-2033 (US$ Million and AGR (%))
Figure 87 Europe Tilt Sensors Market Share Forecast by Algorithms Used, 2023 & 2033 (%)
Figure 88 Europe Tilt Sensors Market Forecast by Measurement Axis, 2023-2033 (US$ Million and AGR (%))
Figure 89 Europe Tilt Sensors Market Share Forecast by Measurement Axis, 2023 & 2033 (%)
Figure 90 Europe Tilt Sensors Market Forecast by Housing Material Type, 2023-2033 (US$ Million and AGR (%))
Figure 91 Europe Tilt Sensors Market Share Forecast by Housing Material Type, 2023 & 2033 (%)
Figure 92 Europe Tilt Sensors Market Forecast by Technology, 2023-2033 (US$ Million and AGR (%))
Figure 93 Europe Tilt Sensors Market Share Forecast by Technology, 2023 & 2033 (%)
Figure 94 Europe Tilt Sensors Market Forecast by End-Use Industry, 2023-2033 (US$ Million and AGR (%))
Figure 95 Europe Tilt Sensors Market Share Forecast by End-Use Industry, 2023 & 2033 (%)
Figure 96 Germany Tilt Sensors Market Forecast, 2023-2033 (US$ Million and AGR %)
Figure 97 UK Tilt Sensors Market Forecast, 2023-2033 (US$ Million and AGR %)
Figure 98 France Tilt Sensors Market Forecast, 2023-2033 (US$ Million and AGR %)
Figure 99 Italy Tilt Sensors Market Forecast, 2023-2033 (US$ Million and AGR %)
Figure 100 Spain Tilt Sensors Market Forecast, 2023-2033 (US$ Million and AGR %)
Figure 101 Russia Tilt Sensors Market Forecast, 2023-2033 (US$ Million and AGR %)
Figure 102 Rest of Europe Tilt Sensors Market Forecast, 2023-2033 (US$ Million and AGR %)
Figure 103 Asia Pacific Tilt Sensors Market Attractiveness Index
Figure 104 Asia Pacific Tilt Sensors Market by Country, 2023, 2028 & 2033 (US$ Million)
Figure 105 Asia Pacific Tilt Sensors Market Forecast by Country, 2023-2033 (US$ Million and AGR (%))
Figure 106 Asia Pacific Tilt Sensors Market Share Forecast by Country, 2023 & 2033 (%)
Figure 107 Asia Pacific Tilt Sensors Market Forecast by Algorithms Used, 2023-2033 (US$ Million and AGR (%))
Figure 108 Asia Pacific Tilt Sensors Market Share Forecast by Algorithms Used, 2023 & 2033 (%)
Figure 109 Asia Pacific Tilt Sensors Market Forecast by Measurement Axis, 2023-2033 (US$ Million and AGR (%))
Figure 110 Asia Pacific Tilt Sensors Market Share Forecast by Measurement Axis, 2023 & 2033 (%)
Figure 111 Asia Pacific Tilt Sensors Market Forecast by Housing Metal Type, 2023-2033 (US$ Million and AGR (%))
Figure 112 Asia Pacific Tilt Sensors Market Share Forecast by Housing Material Type, 2023 & 2033 (%)
Figure 113 Asia Pacific Tilt Sensors Market Forecast by Technology, 2023-2033 (US$ Million and AGR (%))
Figure 114 Asia Pacific Tilt Sensors Market Share Forecast by Technology, 2023 & 2033 (%)
Figure 115 Asia Pacific Tilt Sensors Market Forecast by End-Use Industry, 2023-2033 (US$ Million and AGR (%))
Figure 116 Asia Pacific Tilt Sensors Market Share Forecast by End-Use Industry, 2023 & 2033 (%)
Figure 117 China Tilt Sensors Market Forecast, 2023-2033 (US$ Million and AGR %)
Figure 118 Japan Tilt Sensors Market Forecast, 2023-2033 (US$ Million and AGR %)
Figure 119 India Tilt Sensors Market Forecast, 2023-2033 (US$ Million and AGR %)
Figure 120 South Korea Tilt Sensors Market Forecast, 2023-2033 (US$ Million and AGR %)
Figure 121 Australia Tilt Sensors Market Forecast, 2023-2033 (US$ Million and AGR %)
Figure 122 Rest of Asia Pacific Tilt Sensors Market Forecast, 2023-2033 (US$ Million and AGR %)
Figure 123 Latin America Tilt Sensors Market Attractiveness Index
Figure 124 Latin America Tilt Sensors Market by Country, 2023, 2028 & 2033 (US$ Million)
Figure 125 Latin America Tilt Sensors Market Forecast by Country, 2023-2033 (US$ Million and AGR (%))
Figure 126 Latin America Tilt Sensors Market Share Forecast by Country, 2023 & 2033 (%)
Figure 127 Latin America Tilt Sensors Market Forecast by Algorithms Used, 2023-2033 (US$ Million and AGR (%))
Figure 128 Latin America Tilt Sensors Market Share Forecast by Algorithms Used, 2023 & 2033 (%)
Figure 129 Latin America Tilt Sensors Market Forecast by Measurement Axis, 2023-2033 (US$ Million and AGR (%))
Figure 130 Latin America Tilt Sensors Market Share Forecast by Measurement Axis, 2023 & 2033 (%)
Figure 131 Latin America Tilt Sensors Market Forecast by Housing Material Type, 2023-2033 (US$ Million and AGR (%))
Figure 132 Latin America Tilt Sensors Market Share Forecast by Housing Material Type, 2023 & 2033 (%)
Figure 133 Latin America Tilt Sensors Market Forecast by Technology, 2023-2033 (US$ Million and AGR (%))
Figure 134 Latin America Tilt Sensors Market Share Forecast by Technology, 2023 & 2033 (%)
Figure 135 Latin America Tilt Sensors Market Forecast by End-Use Industry, 2023-2033 (US$ Million and AGR (%))
Figure 136 Latin America Tilt Sensors Market Share Forecast by End-Use Industry, 2023 & 2033 (%)
Figure 137 Brazil Tilt Sensors Market Forecast, 2023-2033 (US$ Million and AGR %)
Figure 138 Mexico Tilt Sensors Market Forecast, 2023-2033 (US$ Million and AGR %)
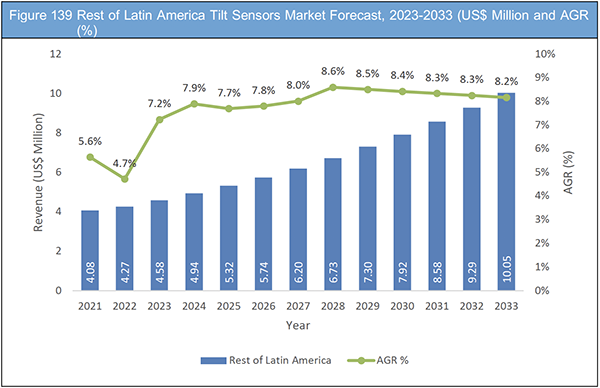
Figure 139 Rest of Latin America Tilt Sensors Market Forecast, 2023-2033 (US$ Million and AGR %)
Figure 140 MEA Tilt Sensors Market Attractiveness Index
Figure 141 MEA Tilt Sensors Market by Country, 2023, 2028 & 2033 (US$ Million)
Figure 142 MEA Tilt Sensors Market Forecast by Country, 2023-2033 (US$ Million and AGR (%))
Figure 143 MEA Tilt Sensors Market Share Forecast by Country, 2023 & 2033 (%)
Figure 144 MEA Tilt Sensors Market Forecast by Algorithms Used, 2023-2033 (US$ Million and AGR (%))
Figure 145 MEA Tilt Sensors Market Share Forecast by Algorithms Used, 2023 & 2033 (%)
Figure 146 MEA Tilt Sensors Market Forecast by Measurement Axis, 2023-2033 (US$ Million and AGR (%))
Figure 147 MEA Tilt Sensors Market Share Forecast by Measurement Axis, 2023 & 2033 (%)
Figure 148 MEA Tilt Sensors Market Forecast by Housing Material Type, 2023-2033 (US$ Million and AGR (%))
Figure 149 MEA Tilt Sensors Market Share Forecast by Housing Material Type, 2023 & 2033 (%)
Figure 150 MEA Tilt Sensors Market Forecast by Technology, 2023-2033 (US$ Million and AGR (%))
Figure 151 MEA Tilt Sensors Market Share Forecast by Technology, 2023 & 2033 (%)
Figure 152 MEA Tilt Sensors Market Forecast by End-Use Industry, 2023-2033 (US$ Million and AGR (%))
Figure 153 MEA Tilt Sensors Market Share Forecast by End-Use Industry, 2023 & 2033 (%)
Figure 154 GCC Tilt Sensors Market Forecast, 2023-2033 (US$ Million and AGR %)
Figure 155 South Africa Tilt Sensors Market Forecast, 2023-2033 (US$ Million and AGR %)
Figure 156 Rest of MEA Tilt Sensors Market Forecast, 2023-2033 (US$ Million and AGR %)
Figure 157 Tilt Sensors Market: Company Share, 2022
Figure 158 Sick AG: Net Revenue, 2016-2021 (US$ Million, AGR%)
Figure 159 Sick AG: R&D, 2016-2021 (US$ Million, AGR%)
Figure 160 Sick AG: Regional Market Shares, 2021
Figure 161 Sick AG: Segmental Market Shares, 2021
Figure 162 TE Connectivity: Net Revenue, 2017-2021 (US$ Million, AGR%)
Figure 163 TE Connectivity: R&D, 2016-2021 (US$ Million, AGR%)
Figure 164 TE Connectivity: Regional Market Shares, 2021
Figure 165 TE Connectivity: Segmental Market Shares, 2021
Figure 166 Gefran S.P.A.: Net Revenue, 2016-2021 (US$ Million, AGR%)
Figure 167 Gefran S.P.A.: Investments, 2016-2021 (US$ Million, AGR%)
Figure 168 Gefran S.P.A.: Regional Market Shares, 2021
Figure 169 Gefran S.P.A.: Segmental Market Shares, 2021
Figure 170 Murata Manufacturing Co., Ltd: Net Revenue, 2016-2021 (US$ Million, AGR%)
Figure 171 Murata Manufacturing Co., Ltd: R&D, 2016-2021 (US$ Million, AGR%)
Figure 172 Murata Manufacturing Co., Ltd: Regional Market Shares, 2021
Figure 173 Murata Manufacturing Co., Ltd: Segmental Market Shares, 2021
ページTOPに戻る
Summary
この調査レポートは世界のチルトセンサー市場を調査し、使用アルゴリズム、測定軸別、ハウジング材質別、技術別、エンドユース産業別、地域別に2023年から2033年までの予測結果を掲載しています。また関連企業情報を提供しています。
主な掲載内容(目次より抜粋)
-
レポート概要
-
エグゼクティブサマリー
-
市場概要
-
チルトセンサー市場分析:使用アルゴリズム別
-
チルトセンサー市場分析:測定軸別
-
チルトセンサー市場分析:ハウジング材質別
-
チルトセンサー市場分析:技術別
-
チルトセンサー市場分析:エンドユース産業別
-
チルトセンサー市場分析:地域別
-
北米のチルトセンサー市場分析
-
欧州のチルトセンサー市場分析
-
アジア太平洋のチルトセンサー市場分析
-
ラテンアメリカのチルトセンサー市場分析
-
MEAのチルトセンサー市場分析
-
主要企業のプロフィール
Report Details
The Tilt Sensors Market Report 2023-2033: This report will prove invaluable to leading firms striving for new revenue pockets if they wish to better understand the industry and its underlying dynamics. It will be useful for companies that would like to expand into different industries or to expand their existing operations in a new region.
Factors Such as Rising Construction and Mining Activities, Increasing Application of Tilt Sensors, and Growing Demand of MEMS-based Tilt Sensors are Driving the Market Growth
Some of the major forces propelling the tilt sensors market include rising construction and mining activities, increasing application of tilt sensors, and growing demand of MEMS-based tilt sensors. Due to its tiny size and low cost, Micro Electro Mechanical Systems (MEMS) technology is widely used in a range of sectors and has an impact on market growth. Over time, industries became more and more reliant on sophisticated automated processes. In terms of these attributes, sensors for tip-over prevention, platform levelling, and tilt alarms have become more crucial in many sectors. The market growth is anticipated to be fuelled by the expanding demand for vehicles that are efficient, secure, and comfortable to operate. Due to the development of MEMS technology in the sensors sector and downsizing, the rate of adoption for tilt sensors has increased over time. For usage in a range of sectors, including gaming applications that have recently gained popularity, aerospace, automotive, and communications, the necessity for tilt sensors has expanded.
Challenge Posed by High Cost of Force Balance Technology Based Tilt Sensors
One of the most crucial components employed as a safety feature for several machinery and vehicles is the tilt sensor. In many processes, including the operation of consumer electronics, angle measuring is a crucial phase. However, the higher cost of tilt sensors is expected to hinder market growth. The market’s expansion is being constrained by the tilt sensors’ higher cost, which is based on force balance technology. The market expansion is also constrained by the rising cost of raw materials and the unreliable performance of inclinometers. Additionally, the absence of a standardised production method for MEMS and the addition of sensors to devices that add additional cost are impeding the market’s expansion. The main obstacle to market expansion is accuracy & dependability in tough environmental conditions.
What Questions Should You Ask before Buying a Market Research Report?
• How is the tilt sensors market evolving?
• What is driving and restraining the tilt sensors market?
• How will each tilt sensors submarket segment grow over the forecast period and how much revenue will these submarkets account for in 2033?
• How will the market shares for each tilt sensors submarket develop from 2023 to 2033?
• What will be the main driver for the overall market from 2023 to 2033?
• Will leading tilt sensors market broadly follow the macroeconomic dynamics, or will individual national markets outperform others?
• How will the market shares of the national markets change by 2033 and which geographical region will lead the market in 2033?
• Who are the leading players and what are their prospects over the forecast period?
• What are the tilt sensor projects for these leading companies?
• How will the industry evolve during the period between 2023 and 2033? What are the implications of tilt sensor projects taking place now and over the next 10 years?
• Is there a greater need for product commercialisation to further scale the tilt sensors market?
• Where is the tilt sensors market heading and how can you ensure you are at the forefront of the market?
• What are the best investment options for new product and service lines?
• What are the key prospects for moving companies into a new growth path and C-suite?
You need to discover how this will impact the tilt sensors market today, and over the next 10 years:
• Our 268-page report provides 119 tables and 173 charts/graphs exclusively to you.
• The report highlights key lucrative areas in the industry so you can target them – NOW.
• It contains in-depth analysis of global, regional and national sales and growth.
• It highlights for you the key successful trends, changes and revenue projections made by your competitors.
This report tells you TODAY how the tilt sensors market will develop in the next 10 years, and in line with the variations in COVID-19 economic recession and bounce. This market is more critical now than at any point over the last 10 years.
Forecasts to 2033 and other analyses reveal commercial prospects
• In addition to revenue forecasting to 2033, our new study provides you with recent results, growth rates, and market shares.
• You will find original analyses, with business outlooks and developments.
• Discover qualitative analyses (including market dynamics, drivers, opportunities, restraints and challenges), cost structure, impact of rising tilt sensor prices and recent developments.
This report includes data analysis and invaluable insight into how COVID-19 will affect the industry and your company. Four COVID-19 recovery patterns and their impact, namely, “V”, “L”, “W” and “U” are discussed in this report.
Segments Covered in the Report
Algorithms Used
• Static
• Dynamic
Measurement Axis
• Single Axis
• Dual Axis
Housing Material Type
• Metal
• Nonmetal
Technology
• Force Balance
• MEMS
• Fluid Filled
End-Use Industry
• Construction
• Mining and Agriculture
• Aerospace and Defense
• Automotive and Transportation
• General Industrial
• Telecommunications
• Others
In addition to the revenue predictions for the overall world market and segments, you will also find revenue forecasts for five regional and 17 leading national markets:
North America
• U.S.
• Canada
Europe
• Germany
• UK
• France
• Italy
• Spain
• Russia
• Rest of Europe
Asia Pacific
• China
• Japan
• India
• South Korea
• Australia
• Rest of APAC
Latin America
• Brazil
• Mexico
• Rest of Latin America Latin America
MEA
• GCC
• South Africa
• Rest of MEA
The report also includes profiles and for some of the leading companies in the Tilt Sensors Market, 2023 to 2033, with a focus on this segment of these companies’ operations.
Leading companies and the potential for market growth
• Automation Sensorik Messtechnik GmbH
• Balluff GmbH
• Baumer Holding AG
• DIS Sensors Bv
• elobau GmbH & Co. KG
• Gefran S.P.A.
• IFM Electronic GmbH
• Jewell Instruments
• Level Developments Ltd
• Murata Manufacturing Co., Ltd
• Pepperl+Fuchs SE
• Rieker Inc.
• Sick AG
• TE Connectivity
• The Fredericks Company
Overall world revenue for Tilt Sensors Market, 2023 to 2033 in terms of value the market will surpass US$222.61 million in 2023, our work calculates. We predict strong revenue growth through to 2033. Our work identifies which organizations hold the greatest potential. Discover their capabilities, progress, and commercial prospects, helping you stay ahead.
How will the Tilt Sensors Market, 2023 to 2033 report help you?
In summary, our 268-page report provides you with the following knowledge:
• Revenue forecasts to 2033 for Tilt Sensors Market, 2023 to 2033 Market, with forecasts for algorithms used, measurement axis, housing material type, technology, end-use industry, each forecast at a global and regional level – discover the industry’s prospects, finding the most lucrative places for investments and revenues.
• Revenue forecasts to 2033 for five regional and 17 key national markets – See forecasts for the Tilt Sensors Market, 2023 to 2033 market in North America, Europe, Asia-Pacific, Latin America, and MEA. Also forecasted is the market in the U.S., Canada, Mexico, Brazil, Germany, France, UK, Italy, Spain, Russia, China, India, Japan, South Korea, Australia, Brazil, and Mexico among other prominent economies.
• Prospects for established firms and those seeking to enter the market – including company profiles for 15 of the major companies involved in the Tilt Sensors Market, 2023 to 2033.
Find quantitative and qualitative analyses with independent predictions. Receive information that only our report contains, staying informed with invaluable business intelligence.
Information found nowhere else
With our new report, you are less likely to fall behind in knowledge or miss out on opportunities. See how our work could benefit your research, analyses, and decisions. Visiongain’s study is for everybody needing commercial analyses for the Tilt Sensors Market, 2023 to 2033, market-leading companies. You will find data, trends and predictions.
ページTOPに戻る
Table of Contents
Table of Contents
1. Report Overview
1.1 Objectives of the Study
1.2 Introduction to Tilt Sensors Market
1.3 What This Report Delivers
1.4 Why You Should Read This Report
1.5 Key Questions Answered by This Analytical Report
1.6 Who is This Report for?
1.7 Methodology
1.7.1 Market Definitions
1.7.2 Market Evaluation & Forecasting Methodology
1.7.3 Data Validation
1.7.3.1 Primary Research
1.7.3.2 Secondary Research
1.8 Frequently Asked Questions (FAQs)
1.9 Associated Visiongain Reports
1.10 About Visiongain
2 Executive Summary
3 Market Overview
3.1 Key Findings
3.2 Market Dynamics
3.2.1 Market Driving Factors
3.2.1.1 Rising Construction and Mining Activities
3.2.1.2 Growing Demand of MEMS-based Tilt Sensors
3.2.1.3 Increasing Application of Tilt Sensors
3.2.2 Market Restraining Factors
3.2.2.1 High Cost of Force Balance Technology Based Tilt Sensors
3.2.2.2 Sustaining Competition in the Market
3.2.3 Market Opportunities
3.2.3.1 Growing Adoption of Tilt Sensors in Robotics and Other Applications
3.3 COVID-19 Impact Analysis
3.4 Porter’s Five Forces Analysis
3.4.1 Bargaining Power of Suppliers
3.4.2 Bargaining Power of Buyers
3.4.3 Competitive Rivalry
3.4.4 Threat from Substitutes
3.4.5 Threat of New Entrants
3.5 PEST Analysis
4 Tilt Sensors Market Analysis by Algorithms Used
4.1 Key Findings
4.2 Algorithms Used Segment: Market Attractiveness Index
4.3 Tilt Sensors Market Size Estimation and Forecast by Algorithms Used
4.4 Static Segment
4.4.1 Market Size by Region, 2023-2033 (US$ Million)
4.4.2 Market Share by Region, 2023 & 2033 (%)
4.5 Dynamic Segment
4.5.1 Market Size by Region, 2023-2033 (US$ Million)
4.5.2 Market Share by Region, 2023 & 2033 (%)
5 Tilt Sensors Market Analysis by Measurement Axis
5.1 Key Findings
5.2 Measurement Axis Segment: Market Attractiveness Index
5.3 Tilt Sensors Market Size Estimation and Forecast by Measurement Axis
5.4 Single Axis Segment
5.4.1 Market Size by Region, 2023-2033 (US$ Million)
5.4.2 Market Share by Region, 2023 & 2033 (%)
5.5 Dual Axis Segment
5.5.1 Market Size by Region, 2023-2033 (US$ Million)
5.5.2 Market Share by Region, 2023 & 2033 (%)
6 Tilt Sensors Market Analysis by Housing Material Type
6.1 Key Findings
6.2 Housing Material Type Segment: Market Attractiveness Index
6.3 Tilt Sensors Market Size Estimation and Forecast by Housing Material Type
6.4 Metal Segment
6.4.1 Market Size by Region, 2023-2033 (US$ Million)
6.4.2 Market Share by Region, 2023 & 2033 (%)
6.5 Nonmetal Segment
6.5.1 Market Size by Region, 2023-2033 (US$ Million)
6.5.2 Market Share by Region, 2023 & 2033 (%)
7 Tilt Sensors Market Analysis by Technology
7.1 Key Findings
7.2 Technology Segment: Market Attractiveness Index
7.3 Tilt Sensors Market Size Estimation and Forecast by Technology
7.4 Force Balance Segment
7.4.1 Market Size by Region, 2023-2033 (US$ Million)
7.4.2 Market Share by Region, 2023 & 2033 (%)
7.5 MEMS Segment
7.5.1 Market Size by Region, 2023-2033 (US$ Million)
7.5.2 Market Share by Region, 2023 & 2033 (%)
7.6 Fluid Filled Segment
7.6.1 Market Size by Region, 2023-2033 (US$ Million)
7.6.2 Market Share by Region, 2023 & 2033 (%)
8 Tilt Sensors Market Analysis by End-Use Industry
8.1 Key Findings
8.2 End-Use Industry Segment: Market Attractiveness Index
8.3 Tilt Sensors Market Size Estimation and Forecast by End-Use Industry
8.4 Construction Segment
8.4.1 Market Size by Region, 2023-2033 (US$ Million)
8.4.2 Market Share by Region, 2023 & 2033 (%)
8.5 Mining and Agriculture Segment
8.5.1 Market Size by Region, 2023-2033 (US$ Million)
8.5.2 Market Share by Region, 2023 & 2033 (%)
8.6 Aerospace and Defense Segment
8.6.1 Market Size by Region, 2023-2033 (US$ Million)
8.6.2 Market Share by Region, 2023 & 2033 (%)
8.7 Automotive and Transportation Segment
8.7.1 Market Size by Region, 2023-2033 (US$ Million)
8.7.2 Market Share by Region, 2023 & 2033 (%)
8.8 General Industrial Segment
8.8.1 Market Size by Region, 2023-2033 (US$ Million)
8.8.2 Market Share by Region, 2023 & 2033 (%)
8.9 Telecommunications Segment
8.9.1 Market Size by Region, 2023-2033 (US$ Million)
8.9.2 Market Share by Region, 2023 & 2033 (%)
8.10 Other Segments
8.10.1 Market Size by Region, 2023-2033 (US$ Million)
8.10.2 Market Share by Region, 2023 & 2033 (%)
9 Tilt Sensors Market Analysis by Region
9.1 Key Findings
9.2 Regional Market Size Estimation and Forecast
10 North America Tilt Sensors Market Analysis
10.1 Key Findings
10.2 North America Tilt Sensors Market Attractiveness Index
10.3 North America Tilt Sensors Market by Country, 2023, 2028 & 2033 (US$ Million)
10.4 North America Tilt Sensors Market Size Estimation and Forecast by Country
10.5 North America Tilt Sensors Market Size Estimation and Forecast by Algorithms Used
10.6 North America Tilt Sensors Market Size Estimation and Forecast by Measurement Axis
10.7 North America Tilt Sensors Market Size Estimation and Forecast by Housing Material Type
10.8 North America Tilt Sensors Market Size Estimation and Forecast by Technology
10.9 North America Tilt Sensors Market Size Estimation and Forecast by End-Use Industry
10.10 U.S. Tilt Sensors Market Analysis
10.11 Canada Tilt Sensors Market Analysis
11 Europe Tilt Sensors Market Analysis
11.1 Key Findings
11.2 Europe Tilt Sensors Market Attractiveness Index
11.3 Europe Tilt Sensors Market by Country, 2023, 2028 & 2033 (US$ Million)
11.4 Europe Tilt Sensors Market Size Estimation and Forecast by Country
11.5 Europe Tilt Sensors Market Size Estimation and Forecast by Algorithms Used
11.6 Europe Tilt Sensors Market Size Estimation and Forecast by Measurement Axis
11.7 Europe Tilt Sensors Market Size Estimation and Forecast by Housing Material Used
11.8 Europe Tilt Sensors Market Size Estimation and Forecast by Technology
11.9 Europe Tilt Sensors Market Size Estimation and Forecast by End-Use Industry
11.10 Germany Tilt Sensors Market Analysis
11.11 UK Tilt Sensors Market Analysis
11.12 France Tilt Sensors Market Analysis
11.13 Italy Tilt Sensors Market Analysis
11.14 Spain Tilt Sensors Market Analysis
11.5 Russia Tilt Sensors Market Analysis
11.16 Rest of Europe Tilt Sensors Market Analysis
12 Asia Pacific Tilt Sensors Market Analysis
12.1 Key Findings
12.2 Asia Pacific Tilt Sensors Market Attractiveness Index
12.3 Asia Pacific Tilt Sensors Market by Country, 2023, 2028 & 2033 (US$ Million)
12.4 Asia Pacific Tilt Sensors Market Size Estimation and Forecast by Country
12.5 Asia Pacific Tilt Sensors Market Size Estimation and Forecast by Algorithms Used
12.6 Asia Pacific Tilt Sensors Market Size Estimation and Forecast by Measurement Axis
12.7 Asia Pacific Tilt Sensors Market Size Estimation and Forecast by Housing Material Type
12.8 Asia Pacific Tilt Sensors Market Size Estimation and Forecast by Technology
12.9 Asia Pacific Tilt Sensors Market Size Estimation and Forecast by End-Use Industry
12.10 China Tilt Sensors Market Analysis
12.11 Japan Tilt Sensors Market Analysis
12.12 India Tilt Sensors Market Analysis
12.13 South Korea Tilt Sensors Market Analysis
12.14 Australia Tilt Sensors Market Analysis
12.15 Rest of Asia Pacific Tilt Sensors Market Analysis
13 Latin America Tilt Sensors Market Analysis
13.1 Key Findings
13.2 Latin America Tilt Sensors Market Attractiveness Index
13.3 Latin America Tilt Sensors Market by Country, 2023, 2028 & 2033 (US$ Million)
13.4 Latin America Tilt Sensors Market Size Estimation and Forecast by Country
13.5 Latin America Tilt Sensors Market Size Estimation and Forecast by Algorithms Used
13.6 Latin America Tilt Sensors Market Size Estimation and Forecast by Measurement Axis
13.7 Latin America Tilt Sensors Market Size Estimation and Forecast by Housing Material Type
13.8 Latin America Tilt Sensors Market Size Estimation and Forecast by Technology
13.9 Latin America Tilt Sensors Market Size Estimation and Forecast by End-Use Industry
13.10 Brazil Tilt Sensors Market Analysis
13.11 Mexico Tilt Sensors Market Analysis
13.12 Rest of Latin America Tilt Sensors Market Analysis
14 MEA Tilt Sensors Market Analysis
14.1 Key Findings
14.2 MEA Tilt Sensors Market Attractiveness Index
14.3 MEA Tilt Sensors Market by Country, 2023, 2028 & 2033 (US$ Million)
14.4 MEA Tilt Sensors Market Size Estimation and Forecast by Country
14.5 MEA Tilt Sensors Market Size Estimation and Forecast by Algorithms Used
14.6 MEA Tilt Sensors Market Size Estimation and Forecast by Measurement Axis
14.7 MEA Tilt Sensors Market Size Estimation and Forecast by Housing Material Type
14.8 MEA Tilt Sensors Market Size Estimation and Forecast by Technology
14.9 MEA Tilt Sensors Market Size Estimation and Forecast by End-Use Industry
14.10 GCC Tilt Sensors Market Analysis
14.11 South Africa Tilt Sensors Market Analysis
14.12 Rest of MEA Tilt Sensors Market Analysis
15 Company Profiles
15.1 Competitive Landscape, 2022
15.2 Strategic Outlook
15.3 Sick AG
15.3.1 Company Snapshot
15.3.2 Company Overview
15.3.3 Financial Analysis
15.3.3.1 Net Revenue, 2016-2021
15.3.3.2 R&D, 2016-2021
15.3.3.3 Regional Market Shares, 2021
15.3.3.4 Segmental Market Shares, 2021
15.3.4 Product Benchmarking
15.3.5 Strategic Outlook
15.4 TE Connectivity
15.4.1 Company Snapshot
15.4.2 Company Overview
15.4.3 Financial Analysis
15.4.3.1 Net Revenue, 2017-2021
15.4.3.2 R&D, 2016-2021
15.4.3.3 Regional Market Shares, 2021
15.4.3.4 Segmental Market Shares, 2021
15.4.4 Product Benchmarking
15.4.5 Strategic Outlook
15.5 Baumer Holding AG
15.5.1 Company Snapshot
15.5.2 Company Overview
15.5.3 Product Benchmarking
15.5.4 Strategic Outlook
15.6 IFM Electronic GmbH
15.6.1 Company Snapshot
15.6.2 Company Overview
15.6.3 Product Benchmarking
15.6.4 Strategic Outlook
15.7 Gefran S.P.A.
15.7.1 Company Snapshot
15.7.2 Company Overview
15.7.3 Financial Analysis
15.7.3.1 Net Revenue, 2016-2021
15.7.3.2 Investments, 2016-2021
15.7.3.3 Regional Market Shares, 2021
15.7.3.4 Segmental Market Shares, 2021
15.7.4 Product Benchmarking
15.8 Pepperl+Fuchs SE
15.8.1 Company Snapshot
15.8.2 Company Overview
15.8.3 Product Benchmarking
15.8.4 Strategic Outlook
15.9 elobau GmbH & Co. KG
15.9.1 Company Snapshot
15.9.2 Company Overview
15.9.3 Product Benchmarking
15.10 Balluff GmbH
15.10.1 Company Snapshot
15.10.2 Company Overview
15.10.3 Product Benchmarking
15.11 Automation Sensorik Messtechnik GmbH
15.11.1 Company Snapshot
15.11.2 Company Overview
15.11.3 Product Benchmarking
15.11.4 Strategic Outlook
15.12 Jewell Instruments
15.12.1 Company Snapshot
15.12.2 Company Overview
15.12.3 Product Benchmarking
15.12.4 Strategic Outlook
15.13 DIS Sensors Bv
15.13.1 Company Snapshot
15.13.2 Company Overview
15.13.3 Product Benchmarking
15.13.4 Strategic Outlook
15.14 Level Developments Ltd
15.14.1 Company Snapshot
15.14.2 Company Overview
15.14.3 Product Benchmarking
15.14.4 Strategic Outlook
15.15 Rieker Inc.
15.15.1 Company Snapshot
15.15.2 Company Overview
15.15.3 Product Benchmarking
15.16 Murata Manufacturing Co., Ltd
15.16.1 Company Snapshot
15.16.2 Company Overview
15.16.3 Financial Analysis
15.16.3.1 Net Revenue, 2017-2021
15.16.3.2 R&D, 2017-2021
15.16.3.3 Regional Market Shares, 2021
15.16.3.4 Segmental Market Shares, 2021
15.16.4 Product Benchmarking
15.16.5 Strategic Outlook
15.17 The Fredericks Company
15.17.1 Company Snapshot
15.17.2 Company Overview
15.17.3 Product Benchmarking
16 Conclusion and Recommendations
16.1 Concluding Remarks from Visiongain
16.2 Recommendations for Market Players
List of Tables
Table 1 Tilt Sensors Market Snapshot, 2023 & 2033 (US$ Million, CAGR %)
Table 2 Tilt Sensors Market Forecast by Region, 2023-2033 (US$ Million, AGR%, CAGR%): “V” Shaped Recovery Scenario
Table 3 Tilt Sensors Market Forecast by Region, 2023-2033 (US$ Million, AGR%, CAGR%): “U” Shaped Recovery Scenario
Table 4 Tilt Sensors Market Forecast by Region, 2023-2033 (US$ Million, AGR%, CAGR%): “W” Shaped Recovery Scenario
Table 5 Tilt Sensors Market Forecast by Region, 2023-2033 (US$ Million, AGR%, CAGR%): “L” Shaped Recovery Scenario
Table 6 Tilt Sensors Market Forecast by Algorithms Used, 2023-2033 (US$ Million, AGR%, CAGR%)
Table 7 Static Tilt Sensors Market Forecast by Region, 2023-2033 (US$ Million, AGR%, CAGR%)
Table 8 Dynamic Tilt Sensors Market Forecast by Region, 2023-2033 (US$ Million, AGR%, CAGR%)
Table 9 Tilt Sensors Market Forecast by Measurement Axis, 2023-2033 (US$ Million, AGR%, CAGR%)
Table 10 Single Axis Tilt Sensors Market Forecast by Region, 2023-2033 (US$ Million, AGR%, CAGR%)
Table 11 Dual Axis Tilt Sensors Market Forecast by Region, 2023-2033 (US$ Million, AGR%, CAGR%)
Table 12 Tilt Sensors Market Forecast by Housing Material Type, 2023-2033 (US$ Million, AGR%, CAGR%)
Table 13 Metal Tilt Sensors Market Forecast by Region, 2023-2033 (US$ Million, AGR%, CAGR%)
Table 14 Nonmetal Tilt Sensors Market Forecast by Region, 2023-2033 (US$ Million, AGR%, CAGR%)
Table 15 Tilt Sensors Market Forecast by Technology, 2023-2033 (US$ Million, AGR%, CAGR%)
Table 16 Force Balance Tilt Sensors Market Forecast by Region, 2023-2033 (US$ Million, AGR%, CAGR%)
Table 17 MEMS Tilt Sensors Market Forecast by Region, 2023-2033 (US$ Million, AGR%, CAGR%)
Table 18 Fluid Filled Tilt Sensors Market Forecast by Region, 2023-2033 (US$ Million, AGR%, CAGR%)
Table 19 Tilt Sensors Market Forecast by End-Use Industry, 2023-2033 (US$ Million, AGR%, CAGR%)
Table 20 Construction Tilt Sensors Market Forecast by Region, 2023-2033 (US$ Million, AGR%, CAGR%)
Table 21 Mining and Agriculture Tilt Sensors Market Forecast by Region, 2023-2033 (US$ Million, AGR%, CAGR%)
Table 22 Aerospace and Defense Tilt Sensors Market Forecast by Region, 2023-2033 (US$ Million, AGR%, CAGR%)
Table 23 Automotive and Transportation Tilt Sensors Market Forecast by Region, 2023-2033 (US$ Million, AGR%, CAGR%)
Table 24 General Industrial Tilt Sensors Market Forecast by Region, 2023-2033 (US$ Million, AGR%, CAGR%)
Table 25 Telecommunications Tilt Sensors Market Forecast by Region, 2023-2033 (US$ Million, AGR%, CAGR%)
Table 26 Other End-use Industries Tilt Sensors Market Forecast by Region, 2023-2033 (US$ Million, AGR%, CAGR%)
Table 27 Tilt Sensors Market Forecast by Region, 2023-2033 (US$ Million, AGR%, CAGR%)
Table 28 North America Tilt Sensors Market Forecast by Country, 2023-2033 (US$ Million, AGR%, CAGR%)
Table 29 North America Tilt Sensors Market Forecast by Algorithms Used, 2023-2033 (US$ Million, AGR%, CAGR%)
Table 30 North America Tilt Sensors Market Forecast by Measurement Axis, 2023-2033 (US$ Million, AGR%, CAGR%)
Table 31 North America Tilt Sensors Market Forecast by Housing Material Type, 2023-2033 (US$ Million, AGR%, CAGR%)
Table 32 North America Tilt Sensors Market Forecast by Technology, 2023-2033 (US$ Million, AGR%, CAGR%)
Table 33 North America Tilt Sensors Market Forecast by End-Use Industry, 2023-2033 (US$ Million, AGR%, CAGR%)
Table 34 U.S. Tilt Sensors Market Forecast, 2023-2033 (US$ Million, AGR%, CAGR%)
Table 35 Canada Tilt Sensors Market Forecast, 2023-2033 (US$ Million, AGR%, CAGR%)
Table 36 Europe Tilt Sensors Market Forecast by Country, 2023-2033 (US$ Million, AGR%, CAGR%)
Table 37 Europe Tilt Sensors Market Forecast by Algorithms Used, 2023-2033 (US$ Million, AGR%, CAGR%)
Table 38 Europe Tilt Sensors Market Forecast by Measurement Axis, 2023-2033 (US$ Million, AGR%, CAGR%)
Table 39 Europe Tilt Sensors Market Forecast by Housing Material Type, 2023-2033 (US$ Million, AGR%, CAGR%)
Table 40 Europe Tilt Sensors Market Forecast by Technology, 2023-2033 (US$ Million, AGR%, CAGR%)
Table 41 Europe Tilt Sensors Market Forecast by End-Use Industry, 2023-2033 (US$ Million, AGR%, CAGR%)
Table 42 Germany Tilt Sensors Market Forecast, 2023-2033 (US$ Million, AGR%, CAGR%)
Table 43 UK Tilt Sensors Market Forecast, 2023-2033 (US$ Million, AGR%, CAGR%)
Table 44 France Tilt Sensors Market Forecast, 2023-2033 (US$ Million, AGR%, CAGR%)
Table 45 Italy Tilt Sensors Market Forecast, 2023-2033 (US$ Million, AGR%, CAGR%)
Table 46 Spain Tilt Sensors Market Forecast, 2023-2033 (US$ Million, AGR%, CAGR%)
Table 47 Russia Tilt Sensors Market Forecast, 2023-2033 (US$ Million, AGR%, CAGR%)
Table 48 Rest of Europe Tilt Sensors Market Forecast, 2023-2033 (US$ Million, AGR%, CAGR%)
Table 49 Asia Pacific Tilt Sensors Market Forecast by Country, 2023-2033 (US$ Million, AGR%, CAGR%)
Table 50 Asia Pacific Tilt Sensors Market Forecast by Algorithms Used, 2023-2033 (US$ Million, AGR%, CAGR%)
Table 51 Asia Pacific Tilt Sensors Market Forecast by Measurement Axis, 2023-2033 (US$ Million, AGR%, CAGR%)
Table 52 Asia Pacific Tilt Sensors Market Forecast by Housing Material Type, 2023-2033 (US$ Million, AGR%, CAGR%)
Table 53 Asia-Pacific Tilt Sensors Market Forecast by Technology, 2023-2033 (US$ Million, AGR%, CAGR%)
Table 54 Asia-Pacific Tilt Sensors Market Forecast by End-Use Industry, 2023-2033 (US$ Million, AGR%, CAGR%)
Table 55 China Tilt Sensors Market Forecast, 2023-2033 (US$ Million, AGR%, CAGR%)
Table 56 Japan Tilt Sensors Market Forecast, 2023-2033 (US$ Million, AGR%, CAGR%)
Table 57 India Tilt Sensors Market Forecast, 2023-2033 (US$ Million, AGR%, CAGR%)
Table 58 South Korea Tilt Sensors Market Forecast, 2023-2033 (US$ Million, AGR%, CAGR%)
Table 59 Australia Tilt Sensors Market Forecast, 2023-2033 (US$ Million, AGR%, CAGR%)
Table 60 Rest of Asia Pacific Tilt Sensors Market Forecast, 2023-2033 (US$ Million, AGR%, CAGR%)
Table 61 Latin America Tilt Sensors Market Forecast by Country, 2023-2033 (US$ Million, AGR%, CAGR%)
Table 62 Latin America Tilt Sensors Market Forecast by Algorithms Used, 2023-2033 (US$ Million, AGR%, CAGR%)
Table 63 Latin America Tilt Sensors Market Forecast by Measurement Axis, 2023-2033 (US$ Million, AGR%, CAGR%)
Table 64 Latin America Tilt Sensors Market Forecast by Housing Material Type, 2023-2033 (US$ Million, AGR%, CAGR%)
Table 65 Latin America Tilt Sensors Market Forecast by Technology, 2023-2033 (US$ Million, AGR%, CAGR%)
Table 66 Latin America Tilt Sensors Market Forecast by End-Use Industry, 2023-2033 (US$ Million, AGR%, CAGR%)
Table 67 Brazil Tilt Sensors Market Forecast, 2023-2033 (US$ Million, AGR%, CAGR%)
Table 68 Mexico Tilt Sensors Market Forecast, 2023-2033 (US$ Million, AGR%, CAGR%)
Table 69 Rest of Latin America Tilt Sensors Market Forecast, 2023-2033 (US$ Million, AGR%, CAGR%)
Table 70 MEA Tilt Sensors Market Forecast by Country, 2023-2033 (US$ Million, AGR%, CAGR%)
Table 71 MEA Tilt Sensors Market Forecast by Algorithms Used, 2023-2033 (US$ Million, AGR%, CAGR%)
Table 72 MEA Tilt Sensors Market Forecast by Measurement Axis, 2023-2033 (US$ Million, AGR%, CAGR%)
Table 73 MEA Tilt Sensors Market Forecast by Housing Material Type, 2023-2033 (US$ Million, AGR%, CAGR%)
Table 74 MEA Tilt Sensors Market Forecast by Technology, 2023-2033 (US$ Million, AGR%, CAGR%)
Table 75 Middle East & Africa Tilt Sensors Market Forecast by End-Use Industry, 2023-2033 (US$ Million, AGR%, CAGR%)
Table 76 GCC Tilt Sensors Market Forecast, 2023-2033 (US$ Million, AGR%, CAGR%)
Table 77 South Africa Tilt Sensors Market Forecast, 2023-2033 (US$ Million, AGR%, CAGR%)
Table 78 Rest of MEA Tilt Sensors Market Forecast, 2023-2033 (US$ Million, AGR%, CAGR%)
Table 79 Strategic Outlook
Table 80 Sick AG: Key Details, (CEO, HQ, Revenue, Founded, No. of Employees, Company Type, Website, Business Segment)
Table 81 Sick AG: Product Benchmarking
Table 82 Sick AG: Strategic Outlook
Table 83 TE Connectivity: Key Details, (CEO, HQ, Revenue, Founded, No. of Employees, Company Type, Website, Business Segment)
Table 84 TE Connectivity: Product Benchmarking
Table 85 TE Connectivity: Strategic Outlook
Table 86 Baumer Holding AG: Key Details, (CEO, HQ, Revenue, Founded, No. of Employees, Company Type, Website, Business Segment)
Table 87 Baumer Holding AG: Product Benchmarking
Table 88 Baumer Holding AG: Strategic Outlook
Table 89 IFM Electronic GmbH: Key Details, (CEO, HQ, Revenue, Founded, No. of Employees, Company Type, Website, Business Segment)
Table 90 IFM Electronic GmbH: Product Benchmarking
Table 91 IFM Electronic GmbH: Strategic Outlook
Table 92 Gefran S.P.A.: Key Details, (CEO, HQ, Revenue, Founded, No. of Employees, Company Type, Website, Business Segment)
Table 93 Gefran S.P.A.: Product Benchmarking
Table 94 Pepperl+Fuchs SE: Key Details, (CEO, HQ, Revenue, Founded, No. of Employees, Company Type, Website, Business Segment)
Table 95 Pepperl+Fuchs SE: Product Benchmarking
Table 96 Pepperl+Fuchs SE: Strategic Outlook
Table 97 elobau GmbH & Co. KG: Key Details, (CEO, HQ, Revenue, Founded, No. of Employees, Company Type, Website, Business Segment)
Table 98 elobau GmbH & Co. KG: Product Benchmarking
Table 99 Balluff GmbH: Key Details, (CEO, HQ, Revenue, Founded, No. of Employees, Company Type, Website, Business Segment)
Table 100 Balluff GmbH: Product Benchmarking
Table 101 Automation Sensorik Messtechnik GmbH: Key Details, (CEO, HQ, Revenue, Founded, No. of Employees, Company Type, Website, Business Segment)
Table 102 Automation Sensorik Messtechnik GmbH: Product Benchmarking
Table 103 Automation Sensorik Messtechnik GmbH: Strategic Outlook
Table 104 Jewell Instruments: Key Details, (CEO, HQ, Revenue, Founded, No. of Employees, Company Type, Website, Business Segment)
Table 105 Jewell Instruments: Product Benchmarking
Table 106 Jewell Instruments: Strategic Outlook
Table 107 DIS Sensors Bv: Key Details, (CEO, HQ, Revenue, Founded, No. of Employees, Company Type, Website, Business Segment)
Table 108 DIS Sensors Bv: Product Benchmarking
Table 109 DIS Sensors Bv: Strategic Outlook
Table 110 Level Developments Ltd: Key Details, (CEO, HQ, Revenue, Founded, No. of Employees, Company Type, Website, Business Segment)
Table 111 Level Developments Ltd: Product Benchmarking
Table 112 Level Developments Ltd: Strategic Outlook
Table 113 Rieker Inc.: Key Details, (CEO, HQ, Revenue, Founded, No. of Employees, Company Type, Website, Business Segment)
Table 114 Rieker Inc.: Product Benchmarking
Table 115 Murata Manufacturing Co., Ltd: Key Details, (CEO, HQ, Revenue, Founded, No. of Employees, Company Type, Website, Business Segment)
Table 116 Murata Manufacturing Co., Ltd: Product Benchmarking
Table 117 Murata Manufacturing Co., Ltd: Strategic Outlook
Table 118 The Fredericks Company: Key Details, (CEO, HQ, Revenue, Founded, No. of Employees, Company Type, Website, Business Segment)
Table 119 The Fredericks Company: Product Benchmarking
List of Figures
Figure 1 Tilt Sensors Market Segmentation
Figure 2 Tilt Sensors Market by Algorithms Used: Market Attractiveness Index
Figure 3 Tilt Sensors Market by Measurement Axis: Market Attractiveness Index
Figure 4 Tilt Sensors Market by Housing Material Type: Market Attractiveness Index
Figure 5 Tilt Sensors Market by Technology: Market Attractiveness Index
Figure 6 Tilt Sensors Market by End-Use Industry: Market Attractiveness Index
Figure 7 Tilt Sensors Market Attractiveness Index by Region
Figure 8 Tilt Sensors Market: Market Dynamics
Figure 9 COVID Impact Analysis: Tilt Sensors Market Recovery Scenarios
Figure 10 Tilt Sensors Market by Region, 2023-2033 (US$ Million and AGR (%)): “V” Shaped Recovery
Figure 11 Tilt Sensors Market by Region, 2023-2033 (US$ Million and AGR (%)): “U” Shaped Recovery
Figure 12 Tilt Sensors Market by Region, 2023-2033 (US$ Million and AGR (%)): “W” Shaped Recovery
Figure 13 Tilt Sensors Market by Region, 2023-2033 (US$ Million and AGR (%)): “L” Shaped Recovery
Figure 14 Tilt Sensors Market: Porter’s Five Forces Analysis
Figure 15 Tilt Sensors Market: PEST Analysis
Figure 16 Tilt Sensors Market by Algorithms Used: Market Attractiveness Index
Figure 17 Tilt Sensors Market Forecast by Algorithms Used, 2023-2033 (US$ Million and AGR (%))
Figure 18 Tilt Sensors Market Share Forecast by Algorithms Used, 2023, 2028, 2033 (%)
Figure 19 Static Tilt Sensors Market Forecast by Region, 2023-2033 (US$ Million and AGR (%))
Figure 20 Static Tilt Sensors Market Share Forecast by Region, 2023 & 2033 (%)
Figure 21 Dynamic Tilt Sensors Market Forecast by Region, 2023-2033 (US$ Million and AGR (%))
Figure 22 Dynamic Tilt Sensors Market Share Forecast by Region, 2023 & 2033 (%)
Figure 23 Tilt Sensors Market by Measurement Axis: Market Attractiveness Index
Figure 24 Tilt Sensors Market Forecast by Measurement Axis, 2023-2033 (US$ Million and AGR (%))
Figure 25 Tilt Sensors Market Share Forecast by Measurement Axis, 2023, 2028, 2033 (%)
Figure 26 Single Axis Tilt Sensors Market Forecast by Region, 2023-2033 (US$ Million and AGR (%))
Figure 27 Single Axis Tilt Sensors Market Share Forecast by Region, 2023 & 2033 (%)
Figure 28 Dual Axis Tilt Sensors Market Forecast by Region, 2023-2033 (US$ Million and AGR (%))
Figure 29 Dual Axis Tilt Sensors Market Share Forecast by Region, 2023 & 2033 (%)
Figure 30 Tilt Sensors Market by Housing Material Type: Market Attractiveness Index
Figure 31 Tilt Sensors Market Forecast by Housing Material Type, 2023-2033 (US$ Million and AGR (%))
Figure 32 Tilt Sensors Market Share Forecast by Housing Material Type, 2023, 2028, 2033 (%)
Figure 33 Metal Tilt Sensors Market Forecast by Region, 2023-2033 (US$ Million and AGR (%))
Figure 34 Metal Tilt Sensors Market Share Forecast by Region, 2023 & 2033 (%)
Figure 35 Nonmetal Tilt Sensors Market Forecast by Region, 2023-2033 (US$ Million and AGR (%))
Figure 36 Nonmetal Tilt Sensors Market Share Forecast by Region, 2023 & 2033 (%)
Figure 37 Tilt Sensors Market by Technology: Market Attractiveness Index
Figure 38 Tilt Sensors Market Forecast by Technology, 2023-2033 (US$ Million and AGR (%))
Figure 39 Tilt Sensors Market Share Forecast by Technology, 2023, 2028, 2033 (%)
Figure 40 Force Balance Tilt Sensors Market Forecast by Region, 2023-2033 (US$ Million and AGR (%))
Figure 41 Force Balance Tilt Sensors Market Share Forecast by Region, 2023 & 2033 (%)
Figure 42 MEMS Tilt Sensors Market Forecast by Region, 2023-2033 (US$ Million and AGR (%))
Figure 43 MEMS Tilt Sensors Market Share Forecast by Region, 2023 & 2033 (%)
Figure 44 Fluid Filled Tilt Sensors Market Forecast by Region, 2023-2033 (US$ Million and AGR (%))
Figure 45 Fluid Filled Tilt Sensors Market Share Forecast by Region, 2023 & 2033 (%)
Figure 46 Tilt Sensors Market by End-Use Industry: Market Attractiveness Index
Figure 47 Tilt Sensors Market Forecast by End-Use Industry, 2023-2033 (US$ Million and AGR (%))
Figure 48 Tilt Sensors Market Share Forecast by End-Use Industry, 2023, 2028, 2033 (%)
Figure 49 Construction Tilt Sensors Market Forecast by Region, 2023-2033 (US$ Million and AGR (%))
Figure 50 Construction Tilt Sensors Market Share Forecast by Region, 2023 & 2033 (%)
Figure 51 Mining and Agriculture Tilt Sensors Market Forecast by Region, 2023-2033 (US$ Million and AGR (%))
Figure 52 Mining and Agriculture Tilt Sensors Market Share Forecast by Region, 2023 & 2033 (%)
Figure 53 Aerospace and Defense Tilt Sensors Market Forecast by Region, 2023-2033 (US$ Million and AGR (%))
Figure 54 Aerospace and Defense Tilt Sensors Market Share Forecast by Region, 2023 & 2033 (%)
Figure 55 Automotive and Transportation Tilt Sensors Market Forecast by Region, 2023-2033 (US$ Million and AGR (%))
Figure 56 Automotive and Transportation Tilt Sensors Market Share Forecast by Region, 2023 & 2033 (%)
Figure 57 General Industrial Tilt Sensors Market Forecast by Region, 2023-2033 (US$ Million and AGR (%))
Figure 58 General Industrial Tilt Sensors Market Share Forecast by Region, 2023 & 2033 (%)
Figure 59 Telecommunications Tilt Sensors Market Forecast by Region, 2023-2033 (US$ Million and AGR (%))
Figure 60 Telecommunications Tilt Sensors Market Share Forecast by Region, 2023 & 2033 (%)
Figure 61 Other End-Use Industries Tilt Sensors Market Forecast by Region, 2023-2033 (US$ Million and AGR (%))
Figure 62 Other End-Use Industries Tilt Sensors Market Share Forecast by Region, 2023 & 2033 (%)
Figure 63 Tilt Sensors Market Forecast by Region 2023, 2028, 2033 (Revenue, CAGR%)
Figure 64 Tilt Sensors Market Share Forecast by Region 2023, 2028, 2033 (%)
Figure 65 Tilt Sensors Market Forecast by Region, 2023-2033 (US$ Million and AGR (%))
Figure 66 North America Tilt Sensors Market Attractiveness Index
Figure 67 North America Tilt Sensors Market by Region, 2023, 2028 & 2033 (US$ Million)
Figure 68 North America Tilt Sensors Market Forecast by Country, 2023-2033 (US$ Million and AGR (%))
Figure 69 North America Tilt Sensors Market Share Forecast by Country, 2023 & 2033 (%)
Figure 70 North America Tilt Sensors Market Forecast by Algorithms Used, 2023-2033 (US$ Million and AGR (%))
Figure 71 North America Tilt Sensors Market Share Forecast by Algorithms Used, 2023 & 2033 (%)
Figure 72 North America Tilt Sensors Market Forecast by Measurement Axis, 2023-2033 (US$ Million and AGR (%))
Figure 73 North America Tilt Sensors Market Share Forecast by Measurement Axis, 2023 & 2033 (%)
Figure 74 North America Tilt Sensors Market Forecast by Housing Material Type, 2023-2033 (US$ Million and AGR (%))
Figure 75 North America Tilt Sensors Market Share Forecast by Housing Material Type, 2023 & 2033 (%)
Figure 76 North America Tilt Sensors Market Forecast by Technology, 2023-2033 (US$ Million and AGR (%))
Figure 77 North America Tilt Sensors Market Share Forecast by Technology, 2023 & 2033 (%)
Figure 78 North America Tilt Sensors Market Forecast by End-Use Industry, 2023-2033 (US$ Million and AGR (%))
Figure 79 North America Tilt Sensors Market Share Forecast by End-Use Industry, 2023 & 2033 (%)
Figure 80 U.S. Tilt Sensors Market Forecast, 2023-2033 (US$ Million and AGR %)
Figure 81 Canada Tilt Sensors Market Forecast, 2023-2033 (US$ Million and AGR %)
Figure 82 Europe Tilt Sensors Market Attractiveness Index
Figure 83 Europe Tilt Sensors Market by Country, 2023, 2028 & 2033 (US$ Million)
Figure 84 Europe Tilt Sensors Market Forecast by Country, 2023-2033 (US$ Million and AGR (%))
Figure 85 Europe Tilt Sensors Market Share Forecast by Country, 2023 & 2033 (%)
Figure 86 Europe Tilt Sensors Market Forecast by Algorithms Used, 2023-2033 (US$ Million and AGR (%))
Figure 87 Europe Tilt Sensors Market Share Forecast by Algorithms Used, 2023 & 2033 (%)
Figure 88 Europe Tilt Sensors Market Forecast by Measurement Axis, 2023-2033 (US$ Million and AGR (%))
Figure 89 Europe Tilt Sensors Market Share Forecast by Measurement Axis, 2023 & 2033 (%)
Figure 90 Europe Tilt Sensors Market Forecast by Housing Material Type, 2023-2033 (US$ Million and AGR (%))
Figure 91 Europe Tilt Sensors Market Share Forecast by Housing Material Type, 2023 & 2033 (%)
Figure 92 Europe Tilt Sensors Market Forecast by Technology, 2023-2033 (US$ Million and AGR (%))
Figure 93 Europe Tilt Sensors Market Share Forecast by Technology, 2023 & 2033 (%)
Figure 94 Europe Tilt Sensors Market Forecast by End-Use Industry, 2023-2033 (US$ Million and AGR (%))
Figure 95 Europe Tilt Sensors Market Share Forecast by End-Use Industry, 2023 & 2033 (%)
Figure 96 Germany Tilt Sensors Market Forecast, 2023-2033 (US$ Million and AGR %)
Figure 97 UK Tilt Sensors Market Forecast, 2023-2033 (US$ Million and AGR %)
Figure 98 France Tilt Sensors Market Forecast, 2023-2033 (US$ Million and AGR %)
Figure 99 Italy Tilt Sensors Market Forecast, 2023-2033 (US$ Million and AGR %)
Figure 100 Spain Tilt Sensors Market Forecast, 2023-2033 (US$ Million and AGR %)
Figure 101 Russia Tilt Sensors Market Forecast, 2023-2033 (US$ Million and AGR %)
Figure 102 Rest of Europe Tilt Sensors Market Forecast, 2023-2033 (US$ Million and AGR %)
Figure 103 Asia Pacific Tilt Sensors Market Attractiveness Index
Figure 104 Asia Pacific Tilt Sensors Market by Country, 2023, 2028 & 2033 (US$ Million)
Figure 105 Asia Pacific Tilt Sensors Market Forecast by Country, 2023-2033 (US$ Million and AGR (%))
Figure 106 Asia Pacific Tilt Sensors Market Share Forecast by Country, 2023 & 2033 (%)
Figure 107 Asia Pacific Tilt Sensors Market Forecast by Algorithms Used, 2023-2033 (US$ Million and AGR (%))
Figure 108 Asia Pacific Tilt Sensors Market Share Forecast by Algorithms Used, 2023 & 2033 (%)
Figure 109 Asia Pacific Tilt Sensors Market Forecast by Measurement Axis, 2023-2033 (US$ Million and AGR (%))
Figure 110 Asia Pacific Tilt Sensors Market Share Forecast by Measurement Axis, 2023 & 2033 (%)
Figure 111 Asia Pacific Tilt Sensors Market Forecast by Housing Metal Type, 2023-2033 (US$ Million and AGR (%))
Figure 112 Asia Pacific Tilt Sensors Market Share Forecast by Housing Material Type, 2023 & 2033 (%)
Figure 113 Asia Pacific Tilt Sensors Market Forecast by Technology, 2023-2033 (US$ Million and AGR (%))
Figure 114 Asia Pacific Tilt Sensors Market Share Forecast by Technology, 2023 & 2033 (%)
Figure 115 Asia Pacific Tilt Sensors Market Forecast by End-Use Industry, 2023-2033 (US$ Million and AGR (%))
Figure 116 Asia Pacific Tilt Sensors Market Share Forecast by End-Use Industry, 2023 & 2033 (%)
Figure 117 China Tilt Sensors Market Forecast, 2023-2033 (US$ Million and AGR %)
Figure 118 Japan Tilt Sensors Market Forecast, 2023-2033 (US$ Million and AGR %)
Figure 119 India Tilt Sensors Market Forecast, 2023-2033 (US$ Million and AGR %)
Figure 120 South Korea Tilt Sensors Market Forecast, 2023-2033 (US$ Million and AGR %)
Figure 121 Australia Tilt Sensors Market Forecast, 2023-2033 (US$ Million and AGR %)
Figure 122 Rest of Asia Pacific Tilt Sensors Market Forecast, 2023-2033 (US$ Million and AGR %)
Figure 123 Latin America Tilt Sensors Market Attractiveness Index
Figure 124 Latin America Tilt Sensors Market by Country, 2023, 2028 & 2033 (US$ Million)
Figure 125 Latin America Tilt Sensors Market Forecast by Country, 2023-2033 (US$ Million and AGR (%))
Figure 126 Latin America Tilt Sensors Market Share Forecast by Country, 2023 & 2033 (%)
Figure 127 Latin America Tilt Sensors Market Forecast by Algorithms Used, 2023-2033 (US$ Million and AGR (%))
Figure 128 Latin America Tilt Sensors Market Share Forecast by Algorithms Used, 2023 & 2033 (%)
Figure 129 Latin America Tilt Sensors Market Forecast by Measurement Axis, 2023-2033 (US$ Million and AGR (%))
Figure 130 Latin America Tilt Sensors Market Share Forecast by Measurement Axis, 2023 & 2033 (%)
Figure 131 Latin America Tilt Sensors Market Forecast by Housing Material Type, 2023-2033 (US$ Million and AGR (%))
Figure 132 Latin America Tilt Sensors Market Share Forecast by Housing Material Type, 2023 & 2033 (%)
Figure 133 Latin America Tilt Sensors Market Forecast by Technology, 2023-2033 (US$ Million and AGR (%))
Figure 134 Latin America Tilt Sensors Market Share Forecast by Technology, 2023 & 2033 (%)
Figure 135 Latin America Tilt Sensors Market Forecast by End-Use Industry, 2023-2033 (US$ Million and AGR (%))
Figure 136 Latin America Tilt Sensors Market Share Forecast by End-Use Industry, 2023 & 2033 (%)
Figure 137 Brazil Tilt Sensors Market Forecast, 2023-2033 (US$ Million and AGR %)
Figure 138 Mexico Tilt Sensors Market Forecast, 2023-2033 (US$ Million and AGR %)
Figure 139 Rest of Latin America Tilt Sensors Market Forecast, 2023-2033 (US$ Million and AGR %)
Figure 140 MEA Tilt Sensors Market Attractiveness Index
Figure 141 MEA Tilt Sensors Market by Country, 2023, 2028 & 2033 (US$ Million)
Figure 142 MEA Tilt Sensors Market Forecast by Country, 2023-2033 (US$ Million and AGR (%))
Figure 143 MEA Tilt Sensors Market Share Forecast by Country, 2023 & 2033 (%)
Figure 144 MEA Tilt Sensors Market Forecast by Algorithms Used, 2023-2033 (US$ Million and AGR (%))
Figure 145 MEA Tilt Sensors Market Share Forecast by Algorithms Used, 2023 & 2033 (%)
Figure 146 MEA Tilt Sensors Market Forecast by Measurement Axis, 2023-2033 (US$ Million and AGR (%))
Figure 147 MEA Tilt Sensors Market Share Forecast by Measurement Axis, 2023 & 2033 (%)
Figure 148 MEA Tilt Sensors Market Forecast by Housing Material Type, 2023-2033 (US$ Million and AGR (%))
Figure 149 MEA Tilt Sensors Market Share Forecast by Housing Material Type, 2023 & 2033 (%)
Figure 150 MEA Tilt Sensors Market Forecast by Technology, 2023-2033 (US$ Million and AGR (%))
Figure 151 MEA Tilt Sensors Market Share Forecast by Technology, 2023 & 2033 (%)
Figure 152 MEA Tilt Sensors Market Forecast by End-Use Industry, 2023-2033 (US$ Million and AGR (%))
Figure 153 MEA Tilt Sensors Market Share Forecast by End-Use Industry, 2023 & 2033 (%)
Figure 154 GCC Tilt Sensors Market Forecast, 2023-2033 (US$ Million and AGR %)
Figure 155 South Africa Tilt Sensors Market Forecast, 2023-2033 (US$ Million and AGR %)
Figure 156 Rest of MEA Tilt Sensors Market Forecast, 2023-2033 (US$ Million and AGR %)
Figure 157 Tilt Sensors Market: Company Share, 2022
Figure 158 Sick AG: Net Revenue, 2016-2021 (US$ Million, AGR%)
Figure 159 Sick AG: R&D, 2016-2021 (US$ Million, AGR%)
Figure 160 Sick AG: Regional Market Shares, 2021
Figure 161 Sick AG: Segmental Market Shares, 2021
Figure 162 TE Connectivity: Net Revenue, 2017-2021 (US$ Million, AGR%)
Figure 163 TE Connectivity: R&D, 2016-2021 (US$ Million, AGR%)
Figure 164 TE Connectivity: Regional Market Shares, 2021
Figure 165 TE Connectivity: Segmental Market Shares, 2021
Figure 166 Gefran S.P.A.: Net Revenue, 2016-2021 (US$ Million, AGR%)
Figure 167 Gefran S.P.A.: Investments, 2016-2021 (US$ Million, AGR%)
Figure 168 Gefran S.P.A.: Regional Market Shares, 2021
Figure 169 Gefran S.P.A.: Segmental Market Shares, 2021
Figure 170 Murata Manufacturing Co., Ltd: Net Revenue, 2016-2021 (US$ Million, AGR%)
Figure 171 Murata Manufacturing Co., Ltd: R&D, 2016-2021 (US$ Million, AGR%)
Figure 172 Murata Manufacturing Co., Ltd: Regional Market Shares, 2021
Figure 173 Murata Manufacturing Co., Ltd: Segmental Market Shares, 2021
ページTOPに戻る
本レポートと同分野(電子部品/半導体)の最新刊レポート
Visiongain社の電子機器分野での最新刊レポート
本レポートと同じKEY WORD()の最新刊レポート
- 本レポートと同じKEY WORDの最新刊レポートはありません。
よくあるご質問
Visiongain社はどのような調査会社ですか?
英国の調査会社ヴィジョンゲイン社(Visiongain)は、通信とエネルギーのほか、自動車や化学・医薬品、金属など、広範な市場を対象に調査を行っています。自動車市場については、市場全般に関する調査のほ... もっと見る
調査レポートの納品までの日数はどの程度ですか?
在庫のあるものは速納となりますが、平均的には 3-4日と見て下さい。
但し、一部の調査レポートでは、発注を受けた段階で内容更新をして納品をする場合もあります。
発注をする前のお問合せをお願いします。
注文の手続きはどのようになっていますか?
1)お客様からの御問い合わせをいただきます。
2)見積書やサンプルの提示をいたします。
3)お客様指定、もしくは弊社の発注書をメール添付にて発送してください。
4)データリソース社からレポート発行元の調査会社へ納品手配します。
5) 調査会社からお客様へ納品されます。最近は、pdfにてのメール納品が大半です。
お支払方法の方法はどのようになっていますか?
納品と同時にデータリソース社よりお客様へ請求書(必要に応じて納品書も)を発送いたします。
お客様よりデータリソース社へ(通常は円払い)の御振り込みをお願いします。
請求書は、納品日の日付で発行しますので、翌月最終営業日までの当社指定口座への振込みをお願いします。振込み手数料は御社負担にてお願いします。
お客様の御支払い条件が60日以上の場合は御相談ください。
尚、初めてのお取引先や個人の場合、前払いをお願いすることもあります。ご了承のほど、お願いします。
データリソース社はどのような会社ですか?
当社は、世界各国の主要調査会社・レポート出版社と提携し、世界各国の市場調査レポートや技術動向レポートなどを日本国内の企業・公官庁及び教育研究機関に提供しております。
世界各国の「市場・技術・法規制などの」実情を調査・収集される時には、データリソース社にご相談ください。
お客様の御要望にあったデータや情報を抽出する為のレポート紹介や調査のアドバイスも致します。
|
|

