バイオ医薬品産業の自動化市場レポート:2023-2033
Automation in Biopharma Industry Market Report 2023-2033
レポート詳細
バイオ医薬品産業の自動化市場レポート 2023-2033 : 本レポートは、業界とその基礎となる力学をよりよく理解したい場合、新たな収益ポケットを目指す大手企業にとって貴重なものとなり... もっと見る
※上記価格は部署ライセンス(Departmental licence)価格です。
その他の価格についてはデータリソースまでお問合せください。
日本語のページは自動翻訳を利用し作成しています。
実際のレポートは英文のみでご納品いたします。

|

|
サマリー
レポート詳細
バイオ医薬品産業の自動化市場レポート 2023-2033: 本レポートは、業界とその基礎となる力学をよりよく理解したい場合、新たな収益ポケットを目指す大手企業にとって貴重なものとなります。また、異業種への進出や新地域での既存事業の拡大を目指す企業にも有用です。
バイオ医薬品産業の自動化とは、バイオ医薬品産業において、製造プロセスの効率性、正確性、信頼性を高めるために、先端技術や自動化システムを利用することを指す言葉である。様々な手段で医薬品製造の一貫性と品質を向上させることができます。
バイオ医薬品の自動化の主な利点は、正確さと精度を向上させることです。自動化されたシステムは、より正確で精度の高いタスクを実行するようにプログラムすることができ、医薬品の品質に影響を与える可能性のあるエラーや矛盾の可能性を減らすことができます。また、バイオファーマの自動化により、人の手を介する必要がなくなるため、汚染のリスクを低減し、製品の純度を向上させることができます。
バイオファーマの自動化のもう一つの大きなメリットは、効率の向上です。自動化されたシステムは、連続的に動作し、人間よりもはるかに速く反復作業を行うことができるため、製造時間を短縮し、生産性を向上させることができます。その結果、大幅なコスト削減と医薬品製造の迅速化を実現することができます。
バイオファーマの自動化は、プロセス制御の強化ももたらします。自動化されたシステムは、製造プロセスをより詳細に監視・制御し、重要なプロセスパラメーターが狭い範囲に維持されることを保証します。その結果、製品の品質が安定し、バッチ不良のリスクも低減されます。
全体として、バイオ医薬品産業の自動化は、効率性の向上、エラーや汚染のリスクの低減、製品の品質と一貫性の向上など、多くのメリットをもたらし、バイオ医薬品産業の必須ツールとなっています。
マーケットリサーチレポートを購入する前に、どのような質問をするべきか?
- バイオ医薬品産業の自動化市場はどのように進化しているのか?
- バイオ医薬品産業の自動化市場を牽引し、抑制しているものは何か?
- バイオ医薬品産業の各サブマーケット区分は予測期間中にどのように成長し、2033年にこれらのサブマーケットが占める収益はどの程度になるのでしょうか?
- 2023年から2033年にかけて、バイオ医薬品産業の各サブマーケットの市場シェアはどのように推移していくのでしょうか?
- 2023年から2033年にかけて、市場全体の主な牽引役となるのは何か?
- バイオ医薬品産業の主要な自動化市場は、マクロ経済ダイナミクスに広く追随するのか、それとも個々の国内市場が他を凌駕するのか?
- 2033年までに各国市場のシェアはどのように変化し、2033年に市場をリードするのはどの地域か?
- 主要プレイヤーは誰で、予測期間中の見通しはどうなっているのか?
- これらの主要企業のバイオ医薬品産業の自動化プロジェクトはどのようなものでしょうか?
- 2023年から2033年の間に、業界はどのように進化していくのか?現在および今後10年間に実施されるバイオ医薬品産業の自動化プロジェクトには、どのような意味があるのか?
- バイオ医薬品産業の自動化市場をさらに拡大するために、製品の商業化の必要性は高まっているのか?
- バイオ医薬品産業の自動化市場はどこに向かっているのか、そしてどのようにすれば市場の最前線に立つことができるのか?
- 新製品やサービスラインのための最適な投資オプションは何か?
- 企業を新たな成長軌道に乗せ、C-suiteに移行させるための重要な展望とは?
このことが、現在、そして今後10年間のバイオファーマ業界の自動化市場にどのような影響を与えるかを見極める必要があります:
- 本レポートは、134の表と205のチャート/グラフを提供します。
- 本レポートでは、業界における主要な収益性の高い分野を取り上げているため、今すぐその分野をターゲットにすることができます。
- 世界、地域、国の売上と成長を詳細に分析しています。
- 競合他社が成功した主要なトレンド、変化、収益予測をハイライトしています。
本レポートは、バイオ医薬品産業の自動化市場が今後10年間にどのように発展するか、またCOVID-19の景気後退と回復の変動に合わせて、今日あなたに伝えます。この市場は、過去10年間のどの時点よりも今がより重要です。
2033年までの予測やその他の分析により、商業的な展望を明らかにする。
- 2033年までの収益予測に加え、直近の実績、成長率、市場シェアもご覧いただけます。
- ビジネスの展望や展開など、独自の分析がご覧いただけます。
- 定性的分析(市場力学、促進要因、機会、阻害要因、課題など)、コスト構造、バイオ医薬品産業の価格上昇に伴う自動化の影響、最近の動向などをご覧いただけます。
本レポートは、バイオ医薬品産業の自動化市場が今後10年間にどのように発展するか、またCOVID-19の景気後退と回復の変動に合わせて、今日あなたに伝えます。この市場は、過去10年間のどの時点よりも今がより重要です。
報告書の対象セグメント
技術
- 自動化技術
- デジタル化技術
用途
- 臨床段階
- 創薬フェーズ
- 生産段階
コンポーネント
- 自動化ハードウェア
- 自動化ソフトウェア
- サービスプロジェクトフェーズ
- サービス運用フェーズ
自動化技術
- 監視制御およびデータ収集 (SCADA)
- 分散型制御システム(DCS)
- プログラマブルロジックコントローラー(PLC)
- 製造実行システム(MES)
- ヒューマンマシンインターフェース(HMI)
- 高度なプロセス制御(APC)
- 企業資源計画(ERP)
- 臨床検査情報管理システム(LIMS)
- 顧客関係管理(CRM)
- 是正処置・予防処置(CAPA)
- その他の自動化技術
デジタル化技術
- モノのインターネット(IoT)
- 人工知能(AI)
- デジタルツインテクノロジー
- AR(拡張現実)とVR(仮想現実)
- 予測分析
- クラウドコンピューティング
世界市場全体およびセグメントの収益予測に加え、4地域および主要20カ国市場の収益予測も掲載しています:
北米
- 米国
- カナダ
欧州
- ドイツ
- イギリス
- フランス
- イタリア
- スペイン
- その他の欧州地域
アジア太平洋
- 中国
- インド
- 日本
- 韓国
- オーストラリア
- その他のアジア太平洋地域
ラテンアメリカ
- ブラジル
- メキシコ
- その他のラテンアメリカ地域
中近東・アフリカ
- GCC
- 南アフリカ
- その他の中東・アフリカ地域
また、バイオ医薬品産業の自動化市場の2023年から2033年にかけての主要企業のプロファイルと、これらの企業のこのセグメントに焦点を当てたいくつかの企業についても記載しています。
主要企業と市場成長の可能性
・ ABB Robotics
・ Acieta LLC
・ ADLINK Technology Inc.
・ AMETEK, Inc.
・ Autodesk, Inc.
・ Baumueller-Nuermont Corp
・ Emerson Electric Co.
・ Kawasaki Robotics
・ PerkinElmer, Inc.
・ RheoSense Inc.
・ Rockwell Automation, Inc.
・ Sartorius Stedim Biotech SA
・ Siemens Healthineers
・ TetraScience, Inc.
・ Thermo Fisher Scientific Inc.
バイオ医薬品産業の自動化市場の世界全体の収益、2023年から2033年までの金額ベースで、2023年に1,855.0百万米ドルを突破すると、当研究所が算出しました。2033年まで収益が大きく伸びることが予測されます。当社の調査では、最も大きな可能性を秘めた企業を特定しています。彼らの能力、進歩、商業的な展望を知ることで、常に先を行くことができます。
バイオ医薬品産業の自動化市場、2023年から2033年までのレポートはどのようにお役に立つのでしょうか?
要約すると、当社の390ページ以上のレポートでは、以下の知識を得ることができます:
- バイオ医薬品産業の自動化市場の2023年から2033年までの収益予測 技術、アプリケーション、コンポーネント、自動化技術、デジタル化技術、企業規模の各予測を世界および地域レベルで掲載 - 業界の展望を発見し、投資と収益に最も有利な場所を見つけることができます。
- 5つの地域と20の主要国市場の2033年までの収益予測 - 北米、欧州、アジア太平洋、ラテンアメリカ、中東・アフリカのバイオ医薬品産業の自動化市場、2023年から2033年の予測をご覧ください。また、アメリカ、カナダ、ブラジル、ドイツ、フランス、イギリス、イタリア、中国、インド、日本、オーストラリアなど、著名な経済圏の市場も予測されています。
- バイオ医薬品産業の自動化市場(2023年〜2033年)に関わる主要企業15社の企業プロファイルを含む、既存企業および市場参入を目指す企業の展望。
独自の予測による定量・定性分析をご覧いただけます。私たちのレポートだけが持つ情報を入手し、貴重なビジネスインテリジェンスとして情報を得ることができます。
他では得られない情報
私たちの新しいレポートがあれば、知識に遅れをとったり、チャンスを逃したりする可能性は低くなります。私たちの仕事があなたの研究、分析、意思決定にどのように役立つかをご覧ください。Visiongainの調査は、バイオ医薬品産業の自動化市場、2023年から2033年、市場をリードする企業の商業分析を必要とするすべての人のためのものです。データ、トレンド、予測を見つけることができます。
ページTOPに戻る
目次
目次
1 レポートの概要
1.1 研究の目的
1.2 バイオ医薬品産業の自動化市場についての紹介
1.3 本レポートが提供するもの
1.4 本レポートを読むべき理由
1.5 本分析レポートが回答する主な疑問点
1.6 本レポートは誰のためのものなのか?
1.7 方法論
1.7.1 市場の定義
1.7.2 市場評価・予測手法
1.7.3 データの妥当性確認
1.7.3.1 一次調査
1.7.3.2 セカンダリーリサーチ
1.8 よくある質問(FAQ)
1.9 Visiongainの関連レポート
1.10 Visiongainについて
2 エグゼクティブサマリー
3 産業構造
3.1.1 最前線に立つのはテクノロジー
3.1.2 製造業の自動化
3.1.3 医薬品製造におけるデジタルツイン
3.1.3.1 PATの手法
3.1.4 プロセスモデリング
3.1.5 アドバンスト・プロセス・コントロール
3.1.6 バイオファーマにおける規制の進展と動向
3.2 バイオ医薬品産業4.0における自動化の概要
3.2.1 バイオファーマにおける自動化の種類とレベル
3.2.2 バイオファーマ、デジタルアプリケーション、インダストリー4.0
3.2.2.1 サプライチェーン
3.2.2.2 マーケティング活動の合理化
3.2.2.3 より効率的な人材獲得
3.2.3 製造業とサプライチェーン
3.2.4 最近の動向と展開
4 市場の概要
4.1 主要な調査結果
4.2 マーケットダイナミクス
4.2.1 市場促進要因
4.2.1.1 パンデミック以前は、高技能者と低技能者の両方からなる労働力不足がメーカーにとって問題であった。
4.2.1.2 機械の柔軟性向上へのニーズ
4.2.1.3 製品の安全性を向上させるための技術的進歩
4.2.1.4 自動化により効率化が進む
4.2.2 市場の抑制要因
4.2.2.1 高額な設備投資の必要性が市場拡大を制限する
4.2.2.2 厳しい規制が市場成長の妨げになる
4.2.2.3 データセットの小ささ
4.2.3 市場の可能性
4.2.3.1 デジタルレイバーによるスマートな働き方
4.2.3.2 ロボティクスが業務に役立つと評価されつつある
4.2.3.3 仮説から検証までのサイクルの高速化
4.3 SWOT分析
4.3.1 市場の強み
4.3.2 市場の弱点
4.3.3 市場の機会
4.3.4 市場の脅威
4.4 ポーターのファイブフォース分析
4.4.1 新規参入の脅威
4.4.2 代替品からの脅威
4.4.3 サプライヤーのバーゲニングパワー
4.4.4 バイヤーのバーゲニングパワー
4.4.5 競合他社のライバル関係
4.5 PESTLE分析
4.5.1 政治的要因
4.5.2 経済的要因
4.5.3 社会的要因
4.5.4 技術的要因
4.5.5 法的要因
4.5.6 環境要因
4.6 製薬業界における自動化の意義
4.6.1 充填、検査、包装の自動化
4.6.2 個人向け医薬品の実現に向けて
4.6.3 研究所におけるロボットの活用
4.6.4 継続的で中断のない製造工程
4.6.5 自動制御
4.7 COVID-19の影響度分析
4.7.1 "V字型リカバリー"
4.7.2 "U字型リカバリー"
4.7.3 "W型リカバリー"
4.7.4 "L字型リカバリー"
5 バイオ医薬品産業の自動化市場分析
5.1 主要な調査結果
5.2 バイオ医薬品産業の自動化市場の予測
5.3 地域別市場規模、2023年〜2033年(US$ Mn)
5.4 技術別市場規模、2023年〜2033年(US$ Mn)
5.5 用途別市場規模、2023年〜2033年(US$ Mn)
5.6 コンポーネント別市場規模、2023年〜2033年(US$ Mn)
5.7 オートメーション技術別市場規模、2023年〜2033年(US$ Mn)
5.8 デジタル化技術別の市場規模、2023年〜2033年(US$ Mn)
6 バイオ医薬品産業の自動化市場分析:技術別
6.1 主要な調査結果
6.1.1 技術セグメント 市場魅力度指数
6.1.2 技術別市場シェア、2023年・2033年(%)
6.1.3 バイオ医薬品産業の技術別自動化市場
6.2 自動化技術
6.2.1 2023年〜2033年の地域別市場規模(US$ Mn)
6.2.2 地域別市場シェア、2023年&2033年(%)
6.3 デジタル化技術
6.3.1 2023年~2033年地域別市場規模(US$ Mn)
6.3.2 地域別市場シェア、2023年&2033年(%)
7 バイオ医薬品産業の自動化市場分析:用途別
7.1 主要な調査結果
7.1.1 用途別セグメント 市場魅力度指数
7.1.2 2023年および2033年の用途別市場シェア(%)
7.1.3 バイオ医薬品産業の自動化市場:用途別
7.2 臨床フェーズ
7.2.1 2023年〜2033年の地域別市場規模(US$ Mn)
7.2.2 地域別市場シェア、2023年&2033年(%)
7.3 創薬フェーズ
7.3.1 2023年〜2033年の地域別市場規模(US$ Mn)
7.3.2 地域別市場シェア、2023年&2033年(%)
7.4 生産フェーズ
7.4.1 2023年〜2033年の地域別市場規模(US$ Mn)
7.4.2 地域別市場シェア、2023年&2033年(%)
8 バイオ医薬品産業の自動化市場分析:コンポーネント別
8.1 主要な調査結果
8.1.1 コンポーネントセグメント: 市場魅力度指数
8.1.2 コンポーネント別市場シェア、2023年&2033年(%)
8.1.3 バイオ医薬品産業のコンポーネント別自動化市場
8.2 自動化ハードウェア
8.2.1 処理装置
8.2.2 包装機器
8.2.3 2023年〜2033年の地域別市場規模(US$ Mn)
8.2.4 地域別市場シェア、2023年&2033年(%)
8.3 自動化ソフトウェア
8.3.1 2023年〜2033年の地域別市場規模(US$ Mn)
8.3.2 地域別市場シェア、2023年&2033年(%)
8.4 サービスプロジェクトフェーズ
8.4.1 2023年〜2033年の地域別市場規模(US$ Mn)
8.4.2 地域別市場シェア、2023年&2033年(%)
8.5 サービス運用フェーズ
8.5.1 2023年〜2033年の地域別市場規模(US$ Mn)
8.5.2 地域別市場シェア、2023年&2033年(%)
9 バイオ医薬品産業の自動化分析:自動化技術別
9.1 主要な調査結果
9.1.1 自動化技術セグメント: 市場魅力度指数
9.1.2 バイオ医薬品産業の自動化市場:自動化技術別
9.2 監視制御とデータ収集(SCADA)
9.2.1 2023年〜2033年の地域別市場規模(US$ Mn)
9.2.2 地域別市場シェア、2023年&2033年(%)
9.3 分散型制御システム(DCS)
9.3.1 2023年〜2033年の地域別市場規模(US$ Mn)
9.3.2 地域別市場シェア、2023年&2033年(%)
9.4 プログラマブルロジックコントローラー(PLC)
9.4.1 2023年〜2033年の地域別市場規模(US$ Mn)
9.4.2 地域別市場シェア、2023年&2033年(%)
9.5 製造実行システム(MES)
9.5.1 2023年〜2033年の地域別市場規模(US$ Mn)
9.5.2 地域別市場シェア、2023年&2033年(%)
9.6 ヒューマンマシンインターフェース(HMI)
9.6.1 2023年〜2033年の地域別市場規模(US$ Mn)
9.6.2 地域別市場シェア、2023年&2033年(%)
9.7 高度プロセス制御(APC)
9.7.1 2023年〜2033年の地域別市場規模(US$ Mn)
9.7.2 地域別市場シェア、2023年&2033年(%)
9.8 企業資源計画(ERP)
9.8.1 2023年〜2033年の地域別市場規模(US$ Mn)
9.8.2 地域別市場シェア、2023年&2033年(%)
9.9 臨床検査情報管理システム(LIMS)
9.9.1 2023年〜2033年の地域別市場規模(US$ Mn)
9.9.2 地域別市場シェア、2023年&2033年(%)
9.10 顧客関係管理(CRM)
9.10.1 2023年〜2033年の地域別市場規模(US$ Mn)
9.10.2 地域別市場シェア、2023年&2033年(%)
9.11 是正処置および予防処置(CAPA)
9.11.1 2023年〜2033年の地域別市場規模(US$ Mn)
9.11.2 地域別市場シェア、2023年&2033年(%)
9.12 その他の自動化技術
9.12.1 2023年〜2033年の地域別市場規模(US$ Mn)
9.12.2 地域別市場シェア、2023年&2033年(%)
10 バイオ医薬品産業の自動化 による市場分析:デジタル化技術
10.1 主要な調査結果
10.1.1 デジタル化技術セグメント: 市場魅力度指数
10.1.2 デジタル化技術別市場シェア、2023年・2033年 (%)
10.1.3 バイオ医薬品産業の自動化市場:デジタル化技術別
10.2 モノのインターネット(IoT)
10.2.1 2023年〜2033年の地域別市場規模(US$ Mn)
10.2.2 地域別市場シェア、2023年&2033年(%)
10.3 人工知能(AI)
10.3.1 2023年〜2033年の地域別市場規模(US$ Mn)
10.3.2 地域別市場シェア、2023年&2033年(%)
10.4 デジタルツイン技術
10.4.1 2023年〜2033年の地域別市場規模(US$ Mn)
10.4.2 地域別市場シェア、2023年&2033年(%)
10.5 拡張現実(AR)および仮想現実(VR)
10.5.1 拡張現実(AR)技術
10.5.2 仮想現実(VR)技術
10.5.3 2023年〜2033年の地域別市場規模(US$ Mn)
10.5.4 地域別市場シェア、2023年&2033年(%)
10.6 予測分析
10.6.1 2023年〜2033年の地域別市場規模(US$ Mn)
10.6.2 地域別市場シェア、2023年&2033年(%)
10.7 クラウドコンピューティング
10.7.1 2023年〜2033年の地域別市場規模(US$ Mn)
10.7.2 地域別市場シェア、2023年&2033年(%)
11 北米のバイオ医薬品産業の自動化市場分析
11.1 主要な調査結果
11.2 北米バイオ医薬品産業の自動化市場魅力度指数
11.3 北米バイオ医薬品産業の国別市場規模推定・予測
11.4 北米バイオ医薬品産業の自動化の技術別市場規模推定・予測
11.5 北米バイオ医薬品産業の自動化の用途別市場規模推定・予測
11.6 北米バイオ医薬品産業の自動化のコンポーネント別市場規模推定・予測
11.7 北米バイオ医薬品産業の自動化の自動化技術別市場規模推定・予測
11.8 北米バイオ医薬品産業の自動化のデジタル化技術別市場規模推定・予測
11.9 米国 バイオ医薬品産業の自動化市場
11.10 カナダ バイオ医薬品産業の自動化市場
12 欧州のバイオ医薬品産業市場分析
12.1 主要な調査結果
12.2 欧州バイオ医薬品産業の自動化市場魅力度指数
12.3 欧州バイオ医薬品産業の自動化の国別市場規模推定・予測
12.4 欧州バイオ医薬品産業の自動化の技術別市場規模推定・予測
12.5 欧州バイオ医薬品産業の自動化の用途別市場規模推定・予測
12.6 欧州バイオ医薬品産業の自動化のコンポーネント別市場規模推定・予測
12.7 欧州バイオ医薬品産業の自動化の自動化技術別市場規模推定・予測
12.8 欧州バイオ医薬品産業の自動化のデジタル化技術別市場規模推定・予測
12.9 ドイツ バイオ医薬品産業の自動化市場分析
12.10 イギリス バイオ医薬品産業の自動化市場分析
12.11 フランス バイオ医薬品産業の自動化市場分析
12.12 イタリア バイオ医薬品産業の自動化市場の分析
12.13 スペイン バイオ医薬品産業の自動化市場の分析
12.14 その他の欧州のバイオ医薬品産業の自動化市場の分析
13 アジア太平洋地域のバイオ医薬品産業市場分析
13.1 主要な調査結果
13.2 アジア太平洋地域のバイオ医薬品産業の自動化市場魅力度指数
13.3 アジア太平洋地域のバイオ医薬品産業の国別市場規模の推定・予測
13.4 アジア太平洋地域のバイオ医薬品産業の技術別市場規模の推定・予測
13.5 アジア太平洋地域のバイオ医薬品産業の自動化の用途別市場規模推定・予測
13.6 アジア太平洋地域のバイオ医薬品産業の自動化のコンポーネント別市場規模推定・予測
13.7 アジア太平洋地域のバイオ医薬品産業の自動化の自動化技術別市場規模推定・予測
13.8 アジア太平洋地域のバイオ医薬品産業の自動化のデジタル化技術別市場規模推定・予測
13.9 中国 バイオ医薬品産業の自動化市場分析
13.10 インド バイオ医薬品産業の自動化市場分析
13.11 日本 バイオ医薬品産業の自動化市場の分析
13.12 韓国 バイオ医薬品産業の自動化市場の分析
13.13 オーストラリア バイオ医薬品産業の自動化市場の分析
13.14 その他のアジア太平洋地域のバイオ医薬品産業の自動化市場の分析
14 ラテンアメリカのバイオ医薬品産業の自動化市場分析
14.1 主要な調査結果
14.2 ラテンアメリカのバイオ医薬品産業の自動化市場魅力度指数
14.3 ラテンアメリカのバイオ医薬品産業の国別市場規模の推推定・予測
14.4 ラテンアメリカのバイオ医薬品産業の自動化の技術別市場規模推定・予測
14.5 ラテンアメリカのバイオ医薬品産業の自動化の用途別市場規模推定・予測
14.6 ラテンアメリカのバイオ医薬品産業の自動化のコンポーネント別市場規模推定・予測
14.7 ラテンアメリカのバイオ医薬品産業の自動化の自動化ン技術別市場規模推定・予測
14.8 ラテンアメリカのバイオ医薬品産業の自動化のデジタル化技術別市場規模推定・予測
14.9 ブラジルのバイオ医薬品産業の自動化市場分析
14.10 メキシコ バイオ医薬品産業の自動化市場分析
14.11 その他のラテンアメリカのバイオ医薬品産業の自動化市場の分析
15 MEAのバイオ医薬品の産業市場分析
15.1 主要な調査結果
15.2 MEAのバイオ医薬品産業の自動化市場魅力度指数
15.3 MEAのバイオ医薬品産業の国別市場規模推定・予測
15.4 MEAのバイオ医薬品産業の自動化の技術別市場規模推定・予測
15.5 MEAのバイオ医薬品産業の自動化の用途別市場規模推定・予測
15.6 MEAのバイオ医薬品産業の自動化のコンポーネント別市場規模推定・予測
15.7 MEAのバイオ医薬品産業の自動化の自動化技術別MEA市場規模推定・予測
15.8 MEAのバイオ医薬品産業の自動化のデジタル化技術別MEA市場規模推定・予測
15.9 GCC バイオ医薬品産業の自動化市場分析
15.10 南アフリカのバイオ医薬品産業の自動化市場の分析
15.11 その他のMEAのバイオ医薬品産業の自動化市場の分析
16 会社概要
16.1 PerkinElmer, Inc.
16.1.1 企業スナップショット
16.1.2 会社概要
16.1.3 財務分析
16.1.3.1 収益、2018-2022年
16.1.3.2 R&D、2018-2022年
16.1.3.3 地域別売上シェア、2022年(%)
16.1.3.4 2022年の事業別売上シェア(%)
16.1.4 製品ベンチマーキング
16.1.5 戦略的な展望
16.2 Siemens Healthineers
16.2.1 企業スナップショット
16.2.2 会社概要
16.2.3 財務分析
16.2.3.1 収益、2018-2022年
16.2.3.2 地域別売上シェア、2022年(%)
16.2.3.3 事業セグメント別売上シェア、2022年(%)
16.2.4 製品ベンチマーキング
16.2.5 戦略的な展望
16.3 ABB Robotics
16.3.1 企業スナップショット
16.3.2 会社概要
16.3.3 財務分析
16.3.3.1 売上高、2018年~2022年
16.3.3.2 R&D、2018年~2022年
16.3.3.3 地域別売上シェア、2022年(%)
16.3.3.4 2022年事業セグメント別売上高シェア(%)
16.3.4 製品ベンチマーキング
16.3.5 戦略的な展望
16.4 Rockwell Automation, Inc.
16.4.1 企業スナップショット
16.4.2 会社概要
16.4.3 財務分析
16.4.3.1 収益、2018-2022年
16.4.3.2 2022年地域別売上シェア(%)
16.4.3.3 事業別売上高シェア、2022年(%)
16.4.4 製品ベンチマーキング
16.4.5 戦略的な展望
16.5 Thermo Fisher Scientific Inc.
16.5.1 企業スナップショット
16.5.2 会社概要
16.5.3 財務分析
16.5.3.1 売上高、2018年~2022年
16.5.3.2 R&D、2018年~2022年
16.5.3.3 地域別売上シェア、2022年(%)
16.5.3.4 2022年事業別売上高シェア(%)
16.5.4 製品ベンチマーキング
16.5.5 戦略的な展望
16.6 Sartorius Stedim Biotech SA
16.6.1 企業スナップショット
16.6.2 会社概要
16.6.3 財務分析
16.6.3.1 収益、2017-2021年
16.6.3.2 R&D、2017年~2021年
16.6.3.3 地域別売上シェア、2022年(%)
16.6.3.4 事業別売上高シェア、2022年(%)
16.6.4 製品ベンチマーキング
16.6.5 戦略的な展望
16.7 RheoSense Inc.
16.7.1 企業スナップショット
16.7.2 会社概要
16.7.3 製品ベンチマーキング
16.7.4 戦略的な展望
16.8 Emerson Electric Co.
16.8.1 企業スナップショット
16.8.2 会社概要
16.8.3 財務分析
16.8.3.1 収益、2018-2022年
16.8.3.2 R&D、2018年~2022年
16.8.3.3 地域別売上シェア、2022年(%)
16.8.3.4 2022年事業セグメント別売上高シェア(%)
16.8.4 製品ベンチマーキング
16.8.5 戦略的な展望
16.9 TetraScience, Inc.
16.9.1 企業スナップショット
16.9.2 会社概要
16.9.3 製品ベンチマーキング
16.9.4 戦略的な展望
16.10 ADLINK Technology Inc.
16.10.1 企業スナップショット
16.10.2 会社概要
16.10.3 製品ベンチマーキング
16.11 Acieta LLC
16.11.1 企業スナップショット
16.11.2 会社概要
16.11.3 製品ベンチマーキング
16.12 AMETEK
16.12.1 企業スナップショット
16.12.2 会社概要
16.12.3 財務分析
16.12.3.1 収益、2017-2021年
16.12.3.2 地域別売上シェア、2022年(%)
16.12.3.3 事業セグメント別売上シェア、2022年(%)
16.12.4 製品ベンチマーキング
16.12.5 戦略的な展望
16.13 Autodesk, Inc.
16.13.1 企業スナップショット
16.13.2 会社概要
16.13.3 財務分析
16.13.3.1 収益、2018-2022年
16.13.3.2 R&D、2018年~2022年
16.13.3.3 地域別売上シェア、2022年(%)
16.13.3.4 2022年事業別売上高シェア(%)
16.13.4 製品ベンチマーキング
16.14 Baumueller-Nuermont Corp.
16.14.1 企業スナップショット
16.14.2 会社概要
16.14.3 製品ベンチマーキング
16.14.4 戦略的な展望
16.15 Kawasaki Robotics
16.15.1 企業スナップショット
16.15.2 会社概要
16.15.3 製品ベンチマーキング
17 結論と提言
17.1 Visiongainからの結びの言葉
17.2 市場関係者への提言
表の一覧
Table 1 Automation in Biopharma Industry Market Snapshot, 2023 & 2033 (US$ million, CAGR %)
Table 2 Automation in Biopharma Industry Market by Region, 2023-2033 (US$ Mn, AGR (%), CAGR (%)) (V-Shaped Recovery Scenario)
Table 3 Automation in Biopharma Industry Market by Region, 2023-2033 (US$ Mn, AGR (%), CAGR (%)) (U-Shaped Recovery Scenario)
Table 4 Automation in Biopharma Industry Market by Region, 2023-2033 (US$ Mn, AGR (%), CAGR (%)) (W-Shaped Recovery Scenario)
Table 5 Automation in Biopharma Industry Market by Region, 2023-2033 (US$ Mn, AGR (%), CAGR (%)) (L-Shaped Recovery Scenario)
Table 6 Automation in Biopharma Industry Market Forecast, 2023-2033 (US$ Mn, AGR (%), CAGR (%))
Table 7 Automation in Biopharma Industry Market by Region, 2023-2033 (US$ Mn, AGR (%), CAGR (%))
Table 8 Automation in Biopharma Industry Market by Technology, 2023-2033 (US$ Mn, AGR (%), CAGR (%))
Table 9 Automation in Biopharma Industry Market by Application, 2023-2033 (US$ Mn, AGR (%), CAGR (%))
Table 10 Automation in Biopharma Industry Market by Component, 2023-2033 (US$ Mn, AGR (%), CAGR (%))
Table 11 Automation in Biopharma Industry Market by Automation Technology, 2023-2033 (US$ Mn, AGR (%), CAGR (%))
Table 12 Automation in Biopharma Industry Market by Digitization Technology, 2023-2033 (US$ Mn, AGR (%), CAGR (%))
Table 13 Automation in Biopharma Industry Market by Technology, 2023-2033 (US$ Mn, AGR (%), CAGR (%))
Table 14 Automation Technology Market by Region, 2023-2033 (US$ Mn, AGR (%), CAGR (%))
Table 15 Digitization Technology Market by Region, 2023-2033 (US$ Mn, AGR (%), CAGR (%))
Table 16 Automation in Biopharma Industry Market by Application, 2023-2033 (US$ Mn, AGR (%), CAGR (%))
Table 17 Clinical Phase Market by Region, 2023-2033 (US$ Mn, AGR (%), CAGR (%))
Table 18 Drug Discovery Phase Market by Region, 2023-2033 (US$ Mn, AGR (%), CAGR (%))
Table 19 Production Phase Market by Region, 2023-2033 (US$ Mn, AGR (%), CAGR (%))
Table 20 Automation in Biopharma Industry Market by Component, 2023-2033 (US$ Mn, AGR (%), CAGR (%))
Table 21 Automation Hardware Market by Region, 2023-2033 (US$ Mn, AGR (%), CAGR (%))
Table 22 Automation Software Market by Region, 2023-2033 (US$ Mn, AGR (%), CAGR (%))
Table 23 Services Project Phase Market by Region, 2023-2033 (US$ Mn, AGR (%), CAGR (%))
Table 24 Global Services Operation Phase Market by Region, 2023-2033 (US$ Mn, AGR (%), CAGR (%))
Table 25 Automation in Biopharma Industry Market by Automation Technology, 2023-2033 (US$ Mn, AGR (%), CAGR (%))
Table 26 Supervisory Control and Data Acquisition (SCADA) Market by Region, 2023-2033 (US$ Mn, AGR (%), CAGR (%))
Table 27 Distributed Control Systems (DCS) Market by Region, 2023-2033 (US$ Mn, AGR (%), CAGR (%))
Table 28 Programmable Logic Controllers (PLC) Market by Region, 2023-2033 (US$ Mn, AGR (%), CAGR (%))
Table 29 Manufacturing Execution System (MES) Market by Region, 2023-2033 (US$ Mn, AGR (%), CAGR (%))
Table 30 Human-machine Interface (HMI) Market by Region, 2023-2033 (US$ Mn, AGR (%), CAGR (%))
Table 31 Advanced Process Control (APC) Market by Region, 2023-2033 (US$ Mn, AGR (%), CAGR (%))
Table 32 Enterprise Resource Planning (ERP) Market by Region, 2023-2033 (US$ Mn, AGR (%), CAGR (%))
Table 33 Laboratory Information Management System (LIMS) Market by Region, 2023-2033 (US$ Mn, AGR (%), CAGR (%))
Table 34 Customer Relationship Management (CRM) Market by Region, 2023-2033 (US$ Mn, AGR (%), CAGR (%))
Table 35 Corrective and Preventive Actions (CAPA) Market by Region, 2023-2033 (US$ Mn, AGR (%), CAGR (%))
Table 36 Other Automation Technologies Market by Region, 2023-2033 (US$ Mn, AGR (%), CAGR (%))
Table 37 Automation in Biopharma Industry Market by Digitization Technology, 2023-2033 (US$ Mn, AGR (%), CAGR (%))
Table 38 Internet of things (IoT) Market by Region, 2023-2033 (US$ Mn, AGR (%), CAGR (%))
Table 39 Artificial intelligence (AI) Market by Region, 2023-2033 (US$ Mn, AGR (%), CAGR (%))
Table 40 Digital Twin Technology Market by Region, 2023-2033 (US$ Mn, AGR (%), CAGR (%))
Table 41 Augmented Reality (AR) and Virtual Reality (VR) Market by Region, 2023-2033 (US$ Mn, AGR (%), CAGR (%))
Table 42 Predictive Analytics Market by Region, 2023-2033 (US$ Mn, AGR (%), CAGR (%))
Table 43 Cloud Computing Market by Region, 2023-2033 (US$ Mn, AGR (%), CAGR (%))
Table 44 North America Automation in Biopharma Industry Market by Country, 2023-2033 (US$ Mn, AGR (%), CAGR (%))
Table 45 North America Automation in Biopharma Industry Market by Technology, 2023-2033 (US$ Mn, AGR (%), CAGR (%))
Table 46 North America Automation in Biopharma Industry Market by Application, 2023-2033 (US$ Mn, AGR (%), CAGR (%))
Table 47 North America Automation in Biopharma Industry Market by Component, 2023-2033 (US$ Mn, AGR (%), CAGR (%))
Table 48 North America Automation in Biopharma Industry Market by Automation Technology, 2023-2033 (US$ Mn, AGR (%), CAGR (%))
Table 49 North America Automation in Biopharma Industry Market by Digitization Technology, 2023-2033 (US$ Mn, AGR (%), CAGR (%))
Table 50 US Automation in Biopharma Industry Market by Value, 2023-2033 (US$ Mn, AGR (%), CAGR (%))
Table 51 Canada Automation in Biopharma Industry Market by Value, 2023-2033 (US$ Mn, AGR (%), CAGR (%))
Table 52 Europe Automation in Biopharma Industry Market by Country, 2023-2033 (US$ Mn, AGR (%), CAGR (%))
Table 53 Europe Automation in Biopharma Industry Market by Technology, 2023-2033 (US$ Mn, AGR (%), CAGR (%))
Table 54 Europe Automation in Biopharma Industry Market by Application, 2023-2033 (US$ Mn, AGR (%), CAGR (%))
Table 55 Europe Automation in Biopharma Industry Market by Component, 2023-2033 (US$ Mn, AGR (%), CAGR (%))
Table 56 Europe Automation in Biopharma Industry Market by Automation Technology, 2023-2033 (US$ Mn, AGR (%), CAGR (%))
Table 57 Europe Automation in Biopharma Industry Market by Digitization Technology, 2023-2033 (US$ Mn, AGR (%), CAGR (%))
Table 58 Germany Automation in Biopharma Industry Market by Value, 2023-2033 (US$ Mn, AGR (%), CAGR (%))
Table 59 UK Automation in Biopharma Industry Market by Value, 2023-2033 (US$ Mn, AGR (%), CAGR (%))
Table 60 France Automation in Biopharma Industry Market by Value, 2023-2033 (US$ Mn, AGR (%), CAGR (%))
Table 61 Italy Automation in Biopharma Industry Market by Value, 2023-2033 (US$ Mn, AGR (%), CAGR (%))
Table 62 Spain Automation in Biopharma Industry Market by Value, 2023-2033 (US$ Mn, AGR (%), CAGR (%))
Table 63 Rest of Europe Automation in Biopharma Industry Market by Value, 2023-2033 (US$ Mn, AGR (%), CAGR (%))
Table 64 Asia-Pacific Automation in Biopharma Industry Market by Country, 2023-2033 (US$ Mn, AGR (%), CAGR (%))
Table 65 Asia-Pacific Automation in Biopharma Industry Market by Technology, 2023-2033 (US$ Mn, AGR (%), CAGR (%))
Table 66 Asia-Pacific Automation in Biopharma Industry Market by Application, 2023-2033 (US$ Mn, AGR (%), CAGR (%))
Table 67 Asia-Pacific Automation in Biopharma Industry Market by Component, 2023-2033 (US$ Mn, AGR (%), CAGR (%))
Table 68 Asia-Pacific Automation in Biopharma Industry Market by Automation Technology, 2023-2033 (US$ Mn, AGR (%), CAGR (%))
Table 69 Asia-Pacific Automation in Biopharma Industry Market by Digitization Technology, 2023-2033 (US$ Mn, AGR (%), CAGR (%))
Table 70 China Automation in Biopharma Industry Market by Value, 2023-2033 (US$ Mn, AGR (%), CAGR (%))
Table 71 India Automation in Biopharma Industry Market by Value, 2023-2033 (US$ Mn, AGR (%), CAGR (%))
Table 72 Japan Automation in Biopharma Industry Market by Value, 2023-2033 (US$ Mn, AGR (%), CAGR (%))
Table 73 South Korea Automation in Biopharma Industry Market by Value, 2023-2033 (US$ Mn, AGR (%), CAGR (%))
Table 74 Australia Automation in Biopharma Industry Market by Value, 2023-2033 (US$ Mn, AGR (%), CAGR (%))
Table 75 Rest of Asia-Pacific Automation in Biopharma Industry Market by Value, 2023-2033 (US$ Mn, AGR (%), CAGR (%))
Table 76 Latin America Automation in Biopharma Industry Market by Country, 2023-2033 (US$ Mn, AGR (%), CAGR (%))
Table 77 Latin America Automation in Biopharma Industry Market by Technology, 2023-2033 (US$ Mn, AGR (%), CAGR (%))
Table 78 Latin America Automation in Biopharma Industry Market by Application, 2023-2033 (US$ Mn, AGR (%), CAGR (%))
Table 79 Latin America Automation in Biopharma Industry Market by Component, 2023-2033 (US$ Mn, AGR (%), CAGR (%))
Table 80 Latin America Automation in Biopharma Industry Market by Automation Technology, 2023-2033 (US$ Mn, AGR (%), CAGR (%))
Table 81 Latin America Automation in Biopharma Industry Market by Digitization Technology, 2023-2033 (US$ Mn, AGR (%), CAGR (%))
Table 82 Brazil Automation in Biopharma Industry Market by Value, 2023-2033 (US$ Mn, AGR (%), CAGR (%))
Table 83 Mexico Automation in Biopharma Industry Market by Value, 2023-2033 (US$ Mn, AGR (%), CAGR (%))
Table 84 Rest of Latin America Automation in Biopharma Industry Market by Value, 2023-2033 (US$ Mn, AGR (%), CAGR (%))
Table 85 MEA Automation in Biopharma Industry Market by Country, 2023-2033 (US$ Mn, AGR (%), CAGR (%))
Table 86 MEA Automation in Biopharma Industry Market by Technology, 2023-2033 (US$ Mn, AGR (%), CAGR (%))
Table 87 MEA Automation in Biopharma Industry Market by Application, 2023-2033 (US$ Mn, AGR (%), CAGR (%))
Table 88 MEA Automation in Biopharma Industry Market by Component, 2023-2033 (US$ Mn, AGR (%), CAGR (%))
Table 89 MEA Automation in Biopharma Industry Market by Automation Technology, 2023-2033 (US$ Mn, AGR (%), CAGR (%))
Table 90 MEA Automation in Biopharma Industry Market by Digitization Technology, 2023-2033 (US$ Mn, AGR (%), CAGR (%))
Table 91 GCC Automation in Biopharma Industry Market by Value, 2023-2033 (US$ Mn, AGR (%), CAGR (%))
Table 92 South Africa Automation in Biopharma Industry Market by Value, 2023-2033 (US$ Mn, AGR (%), CAGR (%))
Table 93 Rest of MEA Automation in Biopharma Industry Market by Value, 2023-2033 (US$ Mn, AGR (%), CAGR (%))
Table 94 PerkinElmer Inc : Key Details, (CEO, HQ, Revenue, Founded, No. of Employees, Company Type, Website, Business Segment)
Table 95 PerkinElmer Inc: Product Benchmarking
Table 96 PerkinElmer Inc: Strategic Outlook
Table 97 Siemens Healthineers: Key Details, (CEO, HQ, Revenue, Founded, No. of Employees, Company Type, Website, Business Segment)
Table 98 Siemens Healthineers: Product Benchmarking
Table 99 Siemens Healthineers: Strategic Outlook
Table 100 ABB Robotics: Key Details, (CEO, HQ, Revenue, Founded, No. of Employees, Company Type, Website, Business Segment)
Table 101 ABB Robotics: Product Benchmarking
Table 102 ABB Robotics: Strategic Outlook
Table 103 Rockwell Automation, Inc.: Key Details, (CEO, HQ, Revenue, Founded, No. of Employees, Company Type, Website, Business Segment)
Table 104 Rockwell Automation, Inc.: Product Benchmarking
Table 105 Rockwell Automation, Inc.: Strategic Outlook
Table 106 Thermo Fisher Scientific Inc.: Key Details, (CEO, HQ, Revenue, Founded, No. of Employees, Company Type, Website, Business Segment)
Table 107 Thermo Fisher Scientific Inc.: Product Benchmarking
Table 108 Thermo Fisher Scientific Inc.: Strategic Outlook
Table 109 Sartorius Stedim Biotech SA: Key Details, (CEO, HQ, Revenue, Founded, No. of Employees, Company Type, Website, Business Segment)
Table 110 Sartorius Stedim Biotech SA: Product Benchmarking
Table 111 Sartorius Stedim Biotech SA: Strategic Outlook
Table 112 RheoSense Inc.: Key Details, (CEO, HQ, Revenue, Founded, No. of Employees, Company Type, Website, Business Segment)
Table 113 RheoSense Inc.: Product Benchmarking
Table 114 RheoSense Inc.: Strategic Outlook
Table 115 Emerson Electric Co.: Key Details, (CEO, HQ, Revenue, Founded, No. of Employees, Company Type, Website, Business Segment)
Table 116 Emerson Electric Co.: Product Benchmarking
Table 117 Emerson Electric Co.: Strategic Outlook
Table 118 TetraScience, Inc.: Key Details, (CEO, HQ, Revenue, Founded, No. of Employees, Company Type, Website, Business Segment)
Table 119 TetraScience, Inc.: Product Benchmarking
Table 120 TetraScience, Inc.: Strategic Outlook
Table 121 ADLINK Technology Inc.: Key Details, (CEO, HQ, Revenue, Founded, No. of Employees, Company Type, Website, Business Segment)
Table 122 ADLINK Technology Inc.: Product Benchmarking
Table 123 Acieta LLC: Key Details, (CEO, HQ, Revenue, Founded, No. of Employees, Company Type, Website, Business Segment)
Table 124 Acieta LLC: Product Benchmarking
Table 125 AMETEK: Key Details, (CEO, HQ, Revenue, Founded, No. of Employees, Company Type, Website, Business Segment)
Table 126 AMETEK: Product Benchmarking
Table 127 AMETEK: Strategic Outlook
Table 128 Autodesk, Inc.: Key Details, (CEO, HQ, Revenue, Founded, No. of Employees, Company Type, Website, Business Segment)
Table 129 Autodesk, Inc.: Product Benchmarking
Table 130 Baumueller-Nuermont Corp.: Key Details, (CEO, HQ, Revenue, Founded, No. of Employees, Company Type, Website, Business Segment)
Table 131 Baumueller-Nuermont Corp.: Product Benchmarking
Table 132 Baumueller-Nuermont Corp.: Strategic Outlook
Table 133 Kawasaki Robotics: Key Details, (CEO, HQ, Revenue, Founded, No. of Employees, Company Type, Website, Business Segment)
Table 134 Kawasaki Robotics: Product Benchmarking
図の一覧
Figure 1 Automation in Biopharma Industry Market Segmentation
Figure 2 Automation in Biopharma Industry Market Forecast by Region: Market Attractiveness Index
Figure 3 Automation in Biopharma Industry Market by Technology: Market Attractiveness Index
Figure 4 Automation in Biopharma Industry Market by Application: Market Attractiveness Index
Figure 5 Automation in Biopharma Industry Market by Components: Market Attractiveness Index
Figure 6 Automation in Biopharma Industry Market by Automation Technology: Market Attractiveness Index
Figure 7 Automation in Biopharma Industry Market by Digitalization Technology: Market Attractiveness Index
Figure 8 Automation in Biopharma Industry Market: Market Dynamics
Figure 9 Automation in Biopharma Industry Market: Porter’s Five Forces Analysis
Figure 10 Automation in Biopharma Industry Market: PEST Analysis
Figure 11 Automation in Biopharma Industry Market by Region, 2023-2033 (US$ Mn, AGR (%)) (V-Shaped Recovery Scenario)
Figure 12 Automation in Biopharma Industry Market by Region, 2023-2033 (US$ Mn, AGR (%)) (U-Shaped Recovery Scenario)
Figure 13 Automation in Biopharma Industry Market by Region, 2023-2033 (US$ Mn, AGR (%)) (W-Shaped Recovery Scenario)
Figure 14 Automation in Biopharma Industry Market by Region, 2023-2033 (US$ Mn, AGR (%)) (L-Shaped Recovery Scenario)
Figure 15 Automation in Biopharma Industry Market Forecast, 2023-2033 (US$ Mn, AGR (%))
Figure 16 Automation in Biopharma Industry Market by Region, 2023-2033 (US$ Mn, AGR (%))
Figure 17 Automation in Biopharma Industry Market by Technology, 2023-2033 (US$ Mn, AGR (%))
Figure 18 Automation in Biopharma Industry Market by Application, 2023-2033 (US$ Mn, AGR (%))
Figure 19 Automation in Biopharma Industry Market by Component, 2023-2033 (US$ Mn, AGR (%))
Figure 20 Automation in Biopharma Industry Market by Automation Technology, 2023-2033 (US$ Mn, AGR (%))
Figure 21 Automation in Biopharma Industry Market by Digitization Technology, 2023-2033 (US$ Mn, AGR (%))
Figure 22 Automation in Biopharma Industry Market by Technology: Market Attractiveness Index
Figure 23 Automation in Biopharma Industry Market Share Forecast by Technology, 2023 & 2033 (%)
Figure 24 Automation in Biopharma Industry Market by Technology, 2023-2033 (US$ Mn, AGR (%))
Figure 25 Automation Technology Market by Region, 2023-2033 (US$ Mn, AGR (%))
Figure 26 Automation Technology Market Share Forecast by Region, 2023 & 2033 (%)
Figure 27 Digitization Technology Market by Region, 2023-2033 (US$ Mn, AGR (%))
Figure 28 Digitization Technology Market Share Forecast by Region, 2023 & 2033 (%)
Figure 29 Automation in Biopharma Industry Market by Application: Market Attractiveness Index
Figure 30 Automation in Biopharma Industry Market Share Forecast by Application, 2023 & 2033 (%)
Figure 31 Automation in Biopharma Industry Market by Application, 2023-2033 (US$ Mn, AGR (%))
Figure 32 Global Clinical Phase Market by Region, 2023-2033 (US$ Mn, AGR (%))
Figure 33 Clinical Phase Market Share Forecast by Region, 2023 & 2033 (%)
Figure 34 Drug Discovery Phase Market by Region, 2023-2033 (US$ Mn, AGR (%))
Figure 35 Drug Discovery Phase Market Share Forecast by Region, 2023 & 2033 (%)
Figure 36 Production Phase Market by Region, 2023-2033 (US$ Mn, AGR (%))
Figure 37 Production Phase Market Share Forecast by Region, 2023 & 2033 (%)
Figure 38 Automation in Biopharma Industry Market by Components: Market Attractiveness Index
Figure 39 Automation in Biopharma Industry Market Share Forecast by Component, 2023 & 2033 (%)
Figure 40 Automation in Biopharma Industry Market by Component, 2023-2033 (US$ Mn, AGR (%))
Figure 41 Automation Hardware Market by Region, 2023-2033 (US$ Mn, AGR (%))
Figure 42 Automation Hardware Market Share Forecast by Region, 2023 & 2033 (%)
Figure 43 Automation Software Market by Region, 2023-2033 (US$ Mn, AGR (%))
Figure 44 Automation Software Market Share Forecast by Region, 2023 & 2033 (%)
Figure 45 Services Project Phase Market by Region, 2023-2033 (US$ Mn, AGR (%))
Figure 46 Services Project Phase Market Share Forecast by Region, 2023 & 2033 (%)
Figure 47 Global Services Operation Phase Market by Region, 2023-2033 (US$ Mn, AGR (%))
Figure 48 Services Operation Phase Market Share Forecast by Region, 2023 & 2033 (%)
Figure 49 Automation in Biopharma Industry Market by Automation Technology: Market Attractiveness Index
Figure 50 Automation in Biopharma Industry Market by Automation Technology, 2023-2033 (US$ Mn, AGR (%))
Figure 51 Supervisory Control and Data Acquisition (SCADA) Market by Region, 2023-2033 (US$ Mn, AGR (%))
Figure 52 Supervisory Control and Data Acquisition (SCADA) Market Share Forecast by Region, 2023 & 2033 (%)
Figure 53 Distributed Control Systems (DCS) Market by Region, 2023-2033 (US$ Mn, AGR (%))
Figure 54 Distributed Control Systems (DCS) Market Share Forecast by Region, 2023 & 2033 (%)
Figure 55 Programmable Logic Controllers (PLC) Market by Region, 2023-2033 (US$ Mn, AGR (%))
Figure 56 Programmable Logic Controllers (PLC) Market Share Forecast by Region, 2023 & 2033 (%)
Figure 57 Manufacturing Execution System (MES) Market by Region, 2023-2033 (US$ Mn, AGR (%))
Figure 58 Manufacturing Execution System (MES) Market Share Forecast by Region, 2023 & 2033 (%)
Figure 59 Human-machine Interface (HMI) Market by Region, 2023-2033 (US$ Mn, AGR (%))
Figure 60 Human-machine Interface (HMI) Market Share Forecast by Region, 2023 & 2033 (%)
Figure 61 Advanced Process Control (APC) Market by Region, 2023-2033 (US$ Mn, AGR (%))
Figure 62 Advanced Process Control (APC) Market Share Forecast by Region, 2023 & 2033 (%)
Figure 63 Enterprise Resource Planning (ERP) Market by Region, 2023-2033 (US$ Mn, AGR (%))
Figure 64 Enterprise Resource Planning (ERP) Market Share Forecast by Region, 2023 & 2033 (%)
Figure 65 Laboratory Information Management System (LIMS) Market by Region, 2023-2033 (US$ Mn, AGR (%))
Figure 66 Laboratory Information Management System (LIMS) Market Share Forecast by Region, 2023 & 2033 (%)
Figure 67 Customer Relationship Management (CRM) Market by Region, 2023-2033 (US$ Mn, AGR (%))
Figure 68 Customer Relationship Management (CRM) Market Share Forecast by Region, 2023 & 2033 (%)
Figure 69 Corrective and Preventive Actions (CAPA) Market by Region, 2023-2033 (US$ Mn, AGR (%))
Figure 70 Corrective and Preventive Actions (CAPA) Market Share Forecast by Region, 2023 & 2033 (%)
Figure 71 Other Automation Technologies Market by Region, 2023-2033 (US$ Mn, AGR (%))
Figure 72 Other Automation Technologies Market Share Forecast by Region, 2023 & 2033 (%)
Figure 73 Automation in Biopharma Industry Market by Digitalization Technology: Market Attractiveness Index
Figure 74 Advanced Process Control (APC) Market Share Forecast by Region, 2023 & 2033 (%)
Figure 75 Automation in Biopharma Industry Market by Digitization Technology, 2023-2033 (US$ Mn, AGR (%))
Figure 76 Internet of things (IoT) Market by Region, 2023-2033 (US$ Mn, AGR (%))
Figure 77 Internet of Things (IoT) Market Share Forecast by Region, 2023 & 2033 (%)
Figure 78 Artificial intelligence (AI) Market by Region, 2023-2033 (US$ Mn, AGR (%))
Figure 79 Artificial intelligence (AI) Market Share Forecast by Region, 2023 & 2033 (%)
Figure 80 Digital Twin Technology Market by Region, 2023-2033 (US$ Mn, AGR (%))
Figure 81 Digital Twin Technology Market Share Forecast by Region, 2023 & 2033 (%)
Figure 82 Augmented Reality (AR) and Virtual Reality (VR) Market by Region, 2023-2033 (US$ Mn, AGR (%))
Figure 83 Augmented Reality (AR) and Virtual Reality (VR) Market Share Forecast by Region, 2023 & 2033 (%)
Figure 84 Predictive Analytics Market by Region, 2023-2033 (US$ Mn, AGR (%))
Figure 85 Predictive Analytics Market Share Forecast by Region, 2023 & 2033 (%)
Figure 86 Cloud Computing Market by Region, 2023-2033 (US$ Mn, AGR (%))
Figure 87 Cloud Computing Market Share Forecast by Region, 2023 & 2033 (%)
Figure 88 North America Automation in Biopharma Industry Market Attractiveness Index
Figure 89 North America Automation in Biopharma Industry Market by Country, 2023-2033 (US$ Mn, AGR (%))
Figure 90 North America Automation in Biopharma Industry Market Share Forecast by Country, 2023 & 2033 (%)
Figure 91 North America Automation in Biopharma Industry Market by Technology, 2023-2033 (US$ Mn, AGR (%))
Figure 92 North America Automation in Biopharma Market Share Forecast by Technology, 2023 & 2033 (%)
Figure 93 North America Automation in Biopharma Industry Market by Application, 2023-2033 (US$ Mn, AGR (%))
Figure 94 North America Automation in Biopharma Market Share Forecast by Application, 2023 & 2033 (%)
Figure 95 North America Automation in Biopharma Industry Market by Component, 2023-2033 (US$ Mn, AGR (%))
Figure 96 North America Automation in Biopharma Market Share Forecast by Component, 2023 & 2033 (%)
Figure 97 North America Automation in Biopharma Industry Market by Automation Technology, 2023-2033 (US$ Mn, AGR (%))
Figure 98 North America Automation in Biopharma Market Share Forecast by Automation Technology, 2023 & 2033 (%)
Figure 99 North America Automation in Biopharma Industry Market by Digitization Technology, 2023-2033 (US$ Mn, AGR (%))
Figure 100 North America Automation in Biopharma Market Share Forecast by Digitization Technology, 2023 & 2033 (%)
Figure 101 US Automation in Biopharma Industry Market by Value, 2023-2033 (US$ Mn, AGR (%))
Figure 102 Canada Automation in Biopharma Industry Market by Value, 2023-2033 (US$ Mn, AGR (%))
Figure 103 Europe Automation in Biopharma Industry Market Attractiveness Index
Figure 104 Europe Automation in Biopharma Industry Market by Country, 2023-2033 (US$ Mn, AGR (%))
Figure 105 Europe Automation in Biopharma Industry Market Share Forecast by Country, 2023 & 2033 (%)
Figure 106 Europe Automation in Biopharma Industry Market by Technology, 2023-2033 (US$ Mn, AGR (%))
Figure 107 Europe Automation in Biopharma Market Share Forecast by Technology, 2023 & 2033 (%)
Figure 108 Europe Automation in Biopharma Industry Market by Application, 2023-2033 (US$ Mn, AGR (%))
Figure 109 Europe Automation in Biopharma Market Share Forecast by Application, 2023 & 2033 (%)
Figure 110 Europe Automation in Biopharma Industry Market by Component, 2023-2033 (US$ Mn, AGR (%))
Figure 111 Europe Automation in Biopharma Market Share Forecast by Component, 2023 & 2033 (%)
Figure 112 Europe Automation in Biopharma Industry Market by Automation Technology, 2023-2033 (US$ Mn, AGR (%))
Figure 113 Europe Automation in Biopharma Market Share Forecast by Automation Technology, 2023 & 2033 (%)
Figure 114 Europe Automation in Biopharma Industry Market by Digitization Technology, 2023-2033 (US$ Mn, AGR (%))
Figure 115 Europe Automation in Biopharma Market Share Forecast by Digitization Technology, 2023 & 2033 (%)
Figure 116 Germany Automation in Biopharma Industry Market by Value, 2023-2033 (US$ Mn, AGR (%))
Figure 117 UK Automation in Biopharma Industry Market by Value, 2023-2033 (US$ Mn, AGR (%))
Figure 118 France Automation in Biopharma Industry Market by Value, 2023-2033 (US$ Mn, AGR (%))
Figure 119 Italy Automation in Biopharma Industry Market by Value, 2023-2033 (US$ Mn, AGR (%))
Figure 120 Spain Automation in Biopharma Industry Market by Value, 2023-2033 (US$ Mn, AGR (%))
Figure 121 Rest of Europe Automation in Biopharma Industry Market by Value, 2023-2033 (US$ Mn, AGR (%))
Figure 122 Asia-Pacific Automation in Biopharma Industry Market Attractiveness Index
Figure 123 Asia-Pacific Automation in Biopharma Industry Market by Country, 2023-2033 (US$ Mn, AGR (%))
Figure 124 Asia-Pacific Automation in Biopharma Industry Market Share Forecast by Country, 2023 & 2033 (%)
Figure 125 Asia-Pacific Automation in Biopharma Industry Market by Technology, 2023-2033 (US$ Mn, AGR (%))
Figure 126 Asia-Pacific Automation in Biopharma Market Share Forecast by Technology, 2023 & 2033 (%)
Figure 127 Asia-Pacific Automation in Biopharma Industry Market by Application, 2023-2033 (US$ Mn, AGR (%))
Figure 128 Asia-Pacific Automation in Biopharma Market Share Forecast by Application, 2023 & 2033 (%)
Figure 129 Asia-Pacific Automation in Biopharma Industry Market by Component, 2023-2033 (US$ Mn, AGR (%))
Figure 130 Asia-Pacific Automation in Biopharma Market Share Forecast by Component, 2023 & 2033 (%)
Figure 131 Asia-Pacific Automation in Biopharma Industry Market by Automation Technology, 2023-2033 (US$ Mn, AGR (%))
Figure 132 Asia-Pacific Automation in Biopharma Market Share Forecast by Automation Technology, 2023 & 2033 (%)
Figure 133 Asia-Pacific Automation in Biopharma Industry Market by Digitization Technology, 2023-2033 (US$ Mn, AGR (%))
Figure 134 Asia-Pacific Automation in Biopharma Market Share Forecast by Digitization Technology, 2023 & 2033 (%)
Figure 135 China Automation in Biopharma Industry Market by Value, 2023-2033 (US$ Mn, AGR (%))
Figure 136 India Automation in Biopharma Industry Market by Value, 2023-2033 (US$ Mn, AGR (%))
Figure 137 Japan Automation in Biopharma Industry Market by Value, 2023-2033 (US$ Mn, AGR (%))
Figure 138 South Korea Automation in Biopharma Industry Market by Value, 2023-2033 (US$ Mn, AGR (%))
Figure 139 Australia Automation in Biopharma Industry Market by Value, 2023-2033 (US$ Mn, AGR (%))
Figure 140 Rest of Asia-Pacific Automation in Biopharma Industry Market by Value, 2023-2033 (US$ Mn, AGR (%))
Figure 141 Latin America Automation in Biopharma Industry Market Forecast by Country: Market Attractiveness Index
Figure 142 Latin America Automation in Biopharma Industry Market by Country, 2023-2033 (US$ Mn, AGR (%))
Figure 143 Latin America Automation in Biopharma Industry Market Share Forecast by Country, 2023 & 2033 (%)
Figure 144 Latin America Automation in Biopharma Industry Market by Technology, 2023-2033 (US$ Mn, AGR (%))
Figure 145 Latin America Automation in Biopharma Market Share Forecast by Technology, 2023 & 2033 (%)
Figure 146 Latin America Automation in Biopharma Industry Market by Application, 2023-2033 (US$ Mn, AGR (%))
Figure 147 Latin America Automation in Biopharma Market Share Forecast by Application, 2023 & 2033 (%)
Figure 148 Latin America Automation in Biopharma Industry Market by Component, 2023-2033 (US$ Mn, AGR (%))
Figure 149 Latin America Automation in Biopharma Market Share Forecast by Component, 2023 & 2033 (%)
Figure 150 Latin America Automation in Biopharma Industry Market by Automation Technology, 2023-2033 (US$ Mn, AGR (%))
Figure 151 Latin America Automation in Biopharma Market Share Forecast by Automation Technology, 2023 & 2033 (%)
Figure 152 Latin America Automation in Biopharma Industry Market by Digitization Technology, 2023-2033 (US$ Mn, AGR (%))
Figure 153 Latin America Automation in Biopharma Market Share Forecast by Digitization Technology, 2023 & 2033 (%)
Figure 154 Brazil Automation in Biopharma Industry Market by Value, 2023-2033 (US$ Mn, AGR (%))
Figure 155 Mexico Automation in Biopharma Industry Market by Value, 2023-2033 (US$ Mn, AGR (%))
Figure 156 Rest of Latin America Automation in Biopharma Industry Market by Value, 2023-2033 (US$ Mn, AGR (%))
Figure 157 MEA Automation in Biopharma Industry Market Attractiveness Index
Figure 158 MEA Automation in Biopharma Industry Market by Country, 2023-2033 (US$ Mn, AGR (%))
Figure 159 MEA Automation in Biopharma Industry Market Share Forecast by Country, 2023 & 2033 (%)
Figure 160 MEA Automation in Biopharma Industry Market by Technology, 2023-2033 (US$ Mn, AGR (%))
Figure 161 MEA Automation in Biopharma Market Share Forecast by Technology, 2023 & 2033 (%)
Figure 162 MEA Automation in Biopharma Industry Market by Application, 2023-2033 (US$ Mn, AGR (%))
Figure 163 MEA Automation in Biopharma Market Share Forecast by Application, 2023 & 2033 (%)
Figure 164 MEA Automation in Biopharma Industry Market by Component, 2023-2033 (US$ Mn, AGR (%))
Figure 165 MEA Automation in Biopharma Market Share Forecast by Component, 2023 & 2033 (%)
Figure 166 MEA Automation in Biopharma Industry Market by Automation Technology, 2023-2033 (US$ Mn, AGR (%))
Figure 167 MEA Automation in Biopharma Market Share Forecast by Automation Technology, 2023 & 2033 (%)
Figure 168 MEA Automation in Biopharma Industry Market by Digitization Technology, 2023-2033 (US$ Mn, AGR (%))
Figure 169 MEA Automation in Biopharma Market Share Forecast by Digitization Technology, 2023 & 2033 (%)
Figure 170 GCC Automation in Biopharma Industry Market by Value, 2023-2033 (US$ Mn, AGR (%))
Figure 171 South Africa Automation in Biopharma Industry Market by Value, 2023-2033 (US$ Mn, AGR (%))
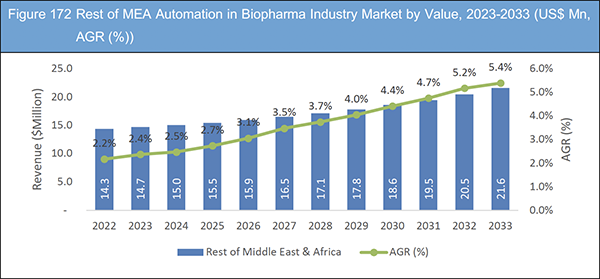
Figure 172 Rest of MEA Automation in Biopharma Industry Market by Value, 2023-2033 (US$ Mn, AGR (%))
Figure 173 PerkinElmer Inc: Revenue 2018-2022 (US$ million, AGR%)
Figure 174 PerkinElmer Inc: R&D, 2018-2022 (US$ million, AGR%)
Figure 175 PerkinElmer Inc: Regional Revenue Share, 2022 (%)
Figure 176 PerkinElmer Inc: Business Segment Revenue Share, 2022 (%)
Figure 177 Siemens Healthineers: Revenue, 2018-2022 (US$ million, AGR%)
Figure 178 Siemens Healthineers: Regional Revenue Share, 2022 (%)
Figure 179 Siemens Healthineers: Business Segment Revenue Share, 2022 (%)
Figure 180 ABB Robotics: Revenue, 2018-2022 (US$ million, AGR%)
Figure 181 ABB Robotics: R&D, 2018-2022 (US$ million, AGR%)
Figure 182 ABB Robotics: Regional Revenue Share, 2022 (%)
Figure 183 ABB Robotics: Business Segment Revenue Share, 2022 (%)
Figure 184 Rockwell Automation, Inc.: Revenue, 2018-2022 (US$ million, AGR%)
Figure 185 Rockwell Automation, Inc.: Regional Revenue Share, 2022 (%)
Figure 186 Rockwell Automation, Inc.: Business Segment Revenue Share, 2022 (%)
Figure 187 Thermo Fisher Scientific Inc.: Revenue, 2018-2022 (US$ million, AGR%)
Figure 188 Thermo Fisher Scientific Inc: R&D, 2018-2022 (US$ million, AGR%)
Figure 189 Thermo Fisher Scientific Inc.: Regional Revenue Share, 2022 (%)
Figure 190 Thermo Fisher Scientific Inc.: Business Segment Revenue Share, 2022 (%)
Figure 191 Sartorius Stedim Biotech SA: Revenue, 2017-2021 (US$ million, AGR%)
Figure 192 Sartorius Stedim Biotech SA: R&D, 2017-2021 (US$ million, AGR%)
Figure 193 Sartorius Stedim Biotech SA: Regional Revenue Share, 2022 (%)
Figure 194 Sartorius Stedim Biotech SA: Business Segment Revenue Share, 2022 (%)
Figure 195 Emerson Electric Co.: Revenue, 2018-2022 (US$ million, AGR%)
Figure 196 Emerson Electric Co: R&D, 2018-2022 (US$ million, AGR%)
Figure 197 Emerson Electric Co.: Regional Revenue Share, 2022 (%)
Figure 198 Emerson Electric Co.: Business Segment Revenue Share, 2022 (%)
Figure 199 AMETEK: Revenue, 2017-2021 (US$ million, AGR%)
Figure 200 AMETEK: Regional Revenue Share, 2022 (%)
Figure 201 AMETEK: Business Segment Revenue Share, 2022 (%)
Figure 202 Autodesk, Inc.: Revenue,2018-2022 (US$ million, AGR%)
Figure 203 Autodesk, Inc.: R&D, 2018-2022 (US$ million, AGR%)
Figure 204 Autodesk, Inc.: Regional Revenue Share, 2022 (%)
Figure 205 Autodesk, Inc.: Business Segment Revenue Share, 2022 (%)
ページTOPに戻る
Summary
Report Details
The Automation in Biopharma Industry Market Report 2023-2033: This report will prove invaluable to leading firms striving for new revenue pockets if they wish to better understand the industry and its underlying dynamics. It will be useful for companies that would like to expand into different industries or to expand their existing operations in a new region.
Automation in biopharma industry is a term used to describe the use of advanced technologies and automated systems in the biopharmaceutical industry to enhance the manufacturing process’s efficiency, accuracy, and reliability. It can improve drug production’s consistency and quality through various means.
The primary advantage of biopharma automation is that it enhances accuracy and precision. Automated systems can be programmed to perform tasks with increased accuracy and precision, reducing the likelihood of errors and inconsistencies that may affect drug quality. Biopharma automation can also reduce the risk of contamination by reducing the need for human intervention, thereby improving product purity.
Another significant benefit of biopharma automation is improved efficiency. Automated systems can operate continuously and perform repetitive tasks much more quickly than humans, reducing manufacturing time and increasing productivity. This can result in significant cost savings and faster drug production.
Biopharma automation also provides enhanced process control. Automated systems can monitor and control manufacturing processes more closely, ensuring that critical process parameters are maintained within a narrow range. This can result in consistent product quality and a reduced risk of batch failures.
Overall, biopharma automation has numerous benefits in terms of increased efficiency, reduced risk of errors and contamination, and improved product quality and consistency, making it an essential tool in the biopharmaceutical industry.
What Questions Should You Ask before Buying a Market Research Report?
• How is the automation in biopharma industry market evolving?
• What is driving and restraining the automation in biopharma industry market?
• How will each automation in biopharma industry submarket segment grow over the forecast period and how much revenue will these submarkets account for in 2033?
• How will the market shares for each automation in biopharma industry submarket develop from 2023 to 2033?
• What will be the main driver for the overall market from 2023 to 2033?
• Will leading automation in biopharma industry markets broadly follow the macroeconomic dynamics, or will individual national markets outperform others?
• How will the market shares of the national markets change by 2033 and which geographical region will lead the market in 2033?
• Who are the leading players and what are their prospects over the forecast period?
• What are the automation in biopharma industry projects for these leading companies?
• How will the industry evolve during the period between 2023 and 2033? What are the implications of automation in biopharma industry projects taking place now and over the next 10 years?
• Is there a greater need for product commercialisation to further scale the automation in biopharma industry market?
• Where is the automation in biopharma industry market heading and how can you ensure you are at the forefront of the market?
• What are the best investment options for new product and service lines?
• What are the key prospects for moving companies into a new growth path and C-suite?
You need to discover how this will impact the automation in biopharma industry market today, and over the next 10 years:
• Our 396-page report provides 134 tables and 205 charts/graphs exclusively to you.
• The report highlights key lucrative areas in the industry so you can target them – NOW.
• It contains in-depth analysis of global, regional and national sales and growth.
• It highlights for you the key successful trends, changes and revenue projections made by your competitors.
This report tells you TODAY how the automation in biopharma industry market will develop in the next 10 years, and in line with the variations in COVID-19 economic recession and bounce. This market is more critical now than at any point over the last 10 years.
Forecasts to 2033 and other analyses reveal commercial prospects
• In addition to revenue forecasting to 2033, our new study provides you with recent results, growth rates, and market shares.
• You will find original analyses, with business outlooks and developments.
• Discover qualitative analyses (including market dynamics, drivers, opportunities, restraints and challenges), cost structure, impact of rising automation in biopharma industry prices and recent developments.
This report includes data analysis and invaluable insight into how COVID-19 will affect the industry and your company. Four COVID-19 recovery patterns and their impact, namely, “V”, “L”, “W” and “U” are discussed in this report.
Segments Covered in the Report
Technology
• Automation Technology
• Digitisation Technology
Application
• Clinical Phase
• Drug Discovery Phase
• Production Phase
Component
• Automation Hardware
• Automation Software
• Services Project Phase
• Services Operation Phase
Automation Technology
• Supervisory Control and Data Acquisition (SCADA)
• Distributed Control Systems (DCS)
• Programmable Logic Controllers (PLC)
• Manufacturing Execution System (MES)
• Human-machine Interface (HMI)
• Advanced Process Control (APC)
• Enterprise Resource Planning (ERP)
• Laboratory Information Management System (LIMS)
• Customer Relationship Management (CRM)
• Corrective and Preventive Actions (CAPA)
• Other Automation Technologies
Digitisation Technology
• Internet of things (IoT)
• Artificial Intelligence (AI)
• Digital Twin Technology
• Augmented Reality (AR) and Virtual Reality (VR)
• Predictive Analytics
• Cloud Computing
In addition to the revenue predictions for the overall world market and segments, you will also find revenue forecasts for four regional and 20 leading national markets:
North America
• U.S.
• Canada
Europe
• Germany
• UK
• France
• Italy
• Spain
• Rest of Europe
Asia Pacific
• China
• India
• Japan
• South Korea
• Australia
• Rest of Asia Pacific
Latin America
• Brazil
• Mexico
• Rest of Latin America
Middle East & Africa
• GCC
• South Africa
• Rest of Middle East & Africa
The report also includes profiles and for some of the leading companies in the Automation in Biopharma Industry Market, 2023 to 2033, with a focus on this segment of these companies’ operations.
Leading companies and the potential for market growth
• ABB Robotics
• Acieta LLC
• ADLINK Technology Inc.
• AMETEK, Inc.
• Autodesk, Inc.
• Baumueller-Nuermont Corp
• Emerson Electric Co.
• Kawasaki Robotics
• PerkinElmer, Inc.
• RheoSense Inc.
• Rockwell Automation, Inc.
• Sartorius Stedim Biotech SA
• Siemens Healthineers
• TetraScience, Inc.
• Thermo Fisher Scientific Inc.
Overall world revenue for Automation in Biopharma Industry Market, 2023 to 2033 in terms of value the market will surpass US$1,855.0 million in 2023, our work calculates. We predict strong revenue growth through to 2033. Our work identifies which organisations hold the greatest potential. Discover their capabilities, progress, and commercial prospects, helping you stay ahead.
How will the Automation in Biopharma Industry Market, 2023 to 2033 report help you?
In summary, our 390+ page report provides you with the following knowledge:
• Revenue forecasts to 2033 for Automation in Biopharma Industry Market, 2023 to 2033 Market, with forecasts for technology, application, component, automation technology, digitisation technology, and company size, each forecast at a global and regional level – discover the industry’s prospects, finding the most lucrative places for investments and revenues.
• Revenue forecasts to 2033 for five regional and 20 key national markets – See forecasts for the Automation in Biopharma Industry Market, 2023 to 2033 market in North America, Europe, Asia-Pacific, Latin America and Middle East & Africa. Also forecasted is the market in the US, Canada, Brazil, Germany, France, UK, Italy, China, India, Japan, and Australia among other prominent economies.
• Prospects for established firms and those seeking to enter the market – including company profiles for 15 of the major companies involved in the Automation in Biopharma Industry Market, 2023 to 2033.
Find quantitative and qualitative analyses with independent predictions. Receive information that only our report contains, staying informed with invaluable business intelligence.
Information found nowhere else
With our new report, you are less likely to fall behind in knowledge or miss out on opportunities. See how our work could benefit your research, analyses, and decisions. Visiongain’s study is for everybody needing commercial analyses for the Automation in Biopharma Industry Market, 2023 to 2033, market-leading companies. You will find data, trends and predictions.
ページTOPに戻る
Table of Contents
Table of Contents
1 Report Overview
1.1 Objectives of the Study
1.2 Introduction to Automation in Biopharma Industry Market
1.3 What This Report Delivers
1.4 Why You Should Read This Report
1.5 Key Questions Answered by This Analytical Report
1.6 Who is This Report for?
1.7 Methodology
1.7.1 Market Definitions
1.7.2 Market Evaluation & Forecasting Methodology
1.7.3 Data Validation
1.7.3.1 Primary Research
1.7.3.2 Secondary Research
1.8 Frequently Asked Questions (FAQs)
1.9 Associated Visiongain Reports
1.10 About Visiongain
2 Executive Summary
3 Industry Structure
3.1.1 Technology is at the Forefront
3.1.2 Automated Manufacturing
3.1.3 Digital Twin in Pharmaceutical Manufacturing
3.1.3.1 PAT Methods
3.1.4 Process Modeling
3.1.5 Advanced Process Control
3.1.6 Regulatory Developments and Trends in Biopharma
3.2 Overview of Automation in Biopharma Industry 4.0
3.2.1 Types & Levels of Automation in Biopharma
3.2.2 Biopharma, Digital Applications, and Industry 4.0
3.2.2.1 Supply Chain
3.2.2.2 Streamlining Marketing Efforts
3.2.2.3 Acquiring Talent More Efficiently
3.2.3 Manufacturing and Supply Chain
3.2.4 Recent Trends & Developments
4 Market Overview
4.1 Key Findings
4.2 Market Dynamics
4.2.1 Market Drivers
4.2.1.1 Labour Shortages Comprising Both High- and Low-Skilled Workers Were a Problem for Manufacturers Before the Pandemic
4.2.1.2 Need for Increased Machine Flexibility
4.2.1.3 Technological Advancements to Improve Product Safety
4.2.1.4 Automation Drives Efficiencies
4.2.2 Market Restraints
4.2.2.1 Need for High Capital Investment Limits the Market Expansion
4.2.2.2 Stringent Regulatory Norms to Challenge Market Growth
4.2.2.3 Smaller Datasets
4.2.3 Market Opportunities
4.2.3.1 Working Smarter Using Digital Labour
4.2.3.2 Robotics are Increasingly Regarded as Valuable to Operations
4.2.3.3 Faster Hypothesis to Testing Cycles
4.3 SWOT Analysis
4.3.1 Market Strengths
4.3.2 Market Weaknesses
4.3.3 Market Opportunities
4.3.4 Market Threats
4.4 Porter’s Five Forces Analysis
4.4.1 Threat of New Entrants
4.4.2 Threat from Substitutes
4.4.3 Bargaining Power of Suppliers
4.4.4 Bargaining Power of Buyers
4.4.5 Competitive Rivalry
4.5 PESTLE Analysis
4.5.1 Political Factors
4.5.2 Economic Factors
4.5.3 Sociocultural Factors
4.5.4 Technological Factors
4.5.5 Legal Factors
4.5.6 Environmental Factors
4.6 Significance of Automation in the Pharmaceutical Industries
4.6.1 Automated Filling, Inspection, and Packaging
4.6.2 Making Personalised Medicines a Reality
4.6.3 Involving Robotics in the Laboratory
4.6.4 Continuous, Uninterrupted Manufacturing
4.6.5 Automatic Control
4.7 COVID-19 Impact Analysis
4.7.1 “V-Shaped Recovery”
4.7.2 “U-Shaped Recovery”
4.7.3 “W-Shaped Recovery”
4.7.4 “L-Shaped Recovery”
5 Automation in Biopharma Industry Market Analysis
5.1 Key Findings
5.2 Automation in Biopharma Industry Market Forecast
5.3 Market Size by Region, 2023-2033 (US$ Mn)
5.4 Market Size by Technology, 2023-2033 (US$ Mn)
5.5 Market Size by Application, 2023-2033 (US$ Mn)
5.6 Market Size by Component, 2023-2033 (US$ Mn)
5.7 Market Size by Automation Technology, 2023-2033 (US$ Mn)
5.8 Market Size by Digitization Technology, 2023-2033 (US$ Mn)
6 Automation in Biopharma Industry Market Analysis by Technology
6.1 Key Findings
6.1.1 Technology Segment: Market Attractiveness Index
6.1.2 Market Share by Technology, 2023 & 2033 (%)
6.1.3 Automation in Biopharma Industry Market by Technology
6.2 Automation Technology
6.2.1 Market Size by Region, 2023-2033 (US$ Mn)
6.2.2 Market Share by Region, 2023 & 2033 (%)
6.3 Digitalization Technology
6.3.1 Market Size by Region, 2023-2033 (US$ Mn)
6.3.2 Market Share by Region, 2023 & 2033 (%)
7 Automation in Biopharma Industry Market Analysis by Application
7.1 Key Findings
7.1.1 Application Segment: Market Attractiveness Index
7.1.2 Market Share by Application, 2023 & 2033 (%)
7.1.3 Automation in Biopharma Industry Market by Application
7.2 Clinical Phase
7.2.1 Market Size by Region, 2023-2033 (US$ Mn)
7.2.2 Market Share by Region, 2023 & 2033 (%)
7.3 Drug Discovery Phase
7.3.1 Market Size by Region, 2023-2033 (US$ Mn)
7.3.2 Market Share by Region, 2023 & 2033 (%)
7.4 Production Phase
7.4.1 Market Size by Region, 2023-2033 (US$ Mn)
7.4.2 Market Share by Region, 2023 & 2033 (%)
8 Automation in Biopharma Industry Market Analysis by Components
8.1 Key Findings
8.1.1 Components Segment: Market Attractiveness Index
8.1.2 Market Share by Components, 2023 & 2033 (%)
8.1.3 Automation in Biopharma Industry Market by Component
8.2 Automation Hardware
8.2.1 Processing equipment
8.2.2 Packaging Equipment
8.2.3 Market Size by Region, 2023-2033 (US$ Mn)
8.2.4 Market Share by Region, 2023 & 2033 (%)
8.3 Automation Software
8.3.1 Market Size by Region, 2023-2033 (US$ Mn)
8.3.2 Market Share by Region, 2023 & 2033 (%)
8.4 Services Project Phase
8.4.1 Market Size by Region, 2023-2033 (US$ Mn)
8.4.2 Market Share by Region, 2023 & 2033 (%)
8.5 Service Operations Phase
8.5.1 Market Size by Region, 2023-2033 (US$ Mn)
8.5.2 Market Share by Region, 2023 & 2033 (%)
9 Automation in Biopharma Industry Analysis by Automation Technology
9.1 Key Findings
9.1.1 Automation Technology Segment: Market Attractiveness Index
9.1.2 Automation in Biopharma Industry Market by Automation Technology
9.2 Supervisory Control and Data Acquisition (SCADA)
9.2.1 Market Size by Region, 2023-2033 (US$ Mn)
9.2.2 Market Share by Region, 2023 & 2033 (%)
9.3 Distributed Control Systems (DCS)
9.3.1 Market Size by Region, 2023-2033 (US$ Mn)
9.3.2 Market Share by Region, 2023 & 2033 (%)
9.4 Programmable Logic Controllers (PLC)
9.4.1 Market Size by Region, 2023-2033 (US$ Mn)
9.4.2 Market Share by Region, 2023 & 2033 (%)
9.5 Manufacturing Execution System (MES)
9.5.1 Market Size by Region, 2023-2033 (US$ Mn)
9.5.2 Market Share by Region, 2023 & 2033 (%)
9.6 Human-machine Interface (HMI)
9.6.1 Market Size by Region, 2023-2033 (US$ Mn)
9.6.2 Market Share by Region, 2023 & 2033 (%)
9.7 Advanced Process Control (APC)
9.7.1 Market Size by Region, 2023-2033 (US$ Mn)
9.7.2 Market Share by Region, 2023 & 2033 (%)
9.8 Enterprise Resource Planning (ERP)
9.8.1 Market Size by Region, 2023-2033 (US$ Mn)
9.8.2 Market Share by Region, 2023 & 2033 (%)
9.9 Laboratory Information Management System (LIMS)
9.9.1 Market Size by Region, 2023-2033 (US$ Mn)
9.9.2 Market Share by Region, 2023 & 2033 (%)
9.10 Customer Relationship Management (CRM)
9.10.1 Market Size by Region, 2023-2033 (US$ Mn)
9.10.2 Market Share by Region, 2023 & 2033 (%)
9.11 Corrective and Preventive Actions (CAPA)
9.11.1 Market Size by Region, 2023-2033 (US$ Mn)
9.11.2 Market Share by Region, 2023 & 2033 (%)
9.12 Other Automation Technologies
9.12.1 Market Size by Region, 2023-2033 (US$ Mn)
9.12.2 Market Share by Region, 2023 & 2033 (%)
10 Automation in Biopharma Industry Market Analysis by Digitalization Technology
10.1 Key Findings
10.1.1 Digitalization Technology Segment: Market Attractiveness Index
10.1.2 Market Share by Digitization Technology, 2023 & 2033 (%)
10.1.3 Automation in Biopharma Industry Market by Digitization Technology
10.2 Internet of things (IoT)
10.2.1 Market Size by Region, 2023-2033 (US$ Mn)
10.2.2 Market Share by Region, 2023 & 2033 (%)
10.3 Artificial intelligence (AI)
10.3.1 Market Size by Region, 2023-2033 (US$ Mn)
10.3.2 Market Share by Region, 2023 & 2033 (%)
10.4 Digital Twin Technology
10.4.1 Market Size by Region, 2023-2033 (US$ Mn)
10.4.2 Market Share by Region, 2023 & 2033 (%)
10.5 Augmented Reality (AR) and Virtual Reality (VR)
10.5.1 Augmented Reality (AR) Technology
10.5.2 Virtual Reality (VR) Technology
10.5.3 Market Size by Region, 2023-2033 (US$ Mn)
10.5.4 Market Share by Region, 2023 & 2033 (%)
10.6 Predictive Analytics
10.6.1 Market Size by Region, 2023-2033 (US$ Mn)
10.6.2 Market Share by Region, 2023 & 2033 (%)
10.7 Cloud Computing
10.7.1 Market Size by Region, 2023-2033 (US$ Mn)
10.7.2 Market Share by Region, 2023 & 2033 (%)
11 North America Automation in Biopharma Industry Market Analysis
11.1 Key Findings
11.2 North America Automation in Biopharma Industry Market Attractiveness Index
11.3 North America Automation in Biopharma Industry Market Size Estimation & Forecast by Country
11.4 North America Automation in Biopharma Industry Market Size Estimation & Forecast by Technology
11.5 North America Automation in Biopharma Industry Market Size Estimation & Forecast by Application
11.6 North America Automation in Biopharma Industry Market Size Estimation & Forecast by Component
11.7 North America Automation in Biopharma Industry Market Size Estimation & Forecast by Automation Technology
11.8 North America Automation in Biopharma Industry Market Size Estimation & Forecast by Digitization Technology
11.9 U.S Automation in Biopharma Industry Market
11.10 Canada Automation in Biopharma Industry Market
12 Europe Biopharma Industry Market Analysis
12.1 Key Findings
12.2 Europe Automation in Biopharma Industry Market Attractiveness Index
12.3 Europe Automation in Biopharma Industry Market Size Estimation & Forecast by Country
12.4 Europe Automation in Biopharma Industry Market Size Estimation & Forecast by Technology
12.5 Europe Automation in Biopharma Industry Market Size Estimation & Forecast by Application
12.6 Europe Automation in Biopharma Industry Market Size Estimation & Forecast by Component
12.7 Europe Automation in Biopharma Industry Market Size Estimation & Forecast by Automation Technology
12.8 Europe Automation in Biopharma Industry Market Size Estimation & Forecast by Digitization Technology
12.9 Germany Automation in Biopharma Industry Market Analysis
12.10 UK Automation in Biopharma Industry Market Analysis
12.11 France Automation in Biopharma Industry Market Analysis
12.12 Italy Automation in Biopharma Industry Market Analysis
12.13 Spain Automation in Biopharma Industry Market Analysis
12.14 Rest of Europe Automation in Biopharma Industry Market Analysis
13 Asia-Pacific Biopharma Industry Market Analysis
13.1 Key Findings
13.2 Asia-Pacific Automation in Biopharma Industry Market Attractiveness Index
13.3 Asia-Pacific Automation in Biopharma Industry Market Size Estimation & Forecast by Country
13.4 Asia-Pacific Automation in Biopharma Industry Market Size Estimation & Forecast by Technology
13.5 Asia-Pacific Automation in Biopharma Industry Market Size Estimation & Forecast by Application
13.6 Asia-Pacific Automation in Biopharma Industry Market Size Estimation & Forecast by Component
13.7 Asia-Pacific Automation in Biopharma Industry Market Size Estimation & Forecast by Automation Technology
13.8 Asia-Pacific Automation in Biopharma Industry Market Size Estimation & Forecast by Digitization Technology
13.9 China Automation in Biopharma Industry Market Analysis
13.10 India Automation in Biopharma Industry Market Analysis
13.11 Japan Automation in Biopharma Industry Market Analysis
13.12 South Korea Automation in Biopharma Industry Market Analysis
13.13 Australia Automation in Biopharma Industry Market Analysis
13.14 Rest of Asia-Pacific Automation in Biopharma Industry Market Analysis
14 Latin America Automation in Biopharma Industry Market Analysis
14.1 Key Findings
14.2 Latin America Automation in Biopharma Industry Market Attractiveness Index
14.3 Latin America Automation in Biopharma Industry Market Size Estimation & Forecast by Country
14.4 Latin America Automation in Biopharma Industry Market Size Estimation & Forecast by Technology
14.5 Latin America Automation in Biopharma Industry Market Size Estimation & Forecast by Application
14.6 Latin America Automation in Biopharma Industry Market Size Estimation & Forecast by Component
14.7 Latin America Automation in Biopharma Industry Market Size Estimation & Forecast by Automation Technology
14.8 Latin America Automation in Biopharma Industry Market Size Estimation & Forecast by Digitization Technology
14.9 Brazil Automation in Biopharma Industry Market Analysis
14.10 Mexico Automation in Biopharma Industry Market Analysis
14.11 Rest of Latin America Automation in Biopharma Industry Market Analysis
15 MEA Biopharma Industry Market Analysis
15.1 Key Findings
15.2 MEA Automation in Biopharma Industry Market Attractiveness Index
15.3 MEA Automation in Biopharma Industry Market Size Estimation & Forecast by Country
15.4 MEA Automation in Biopharma Industry Market Size Estimation & Forecast by Technology
15.5 MEA Automation in Biopharma Industry Market Size Estimation & Forecast by Application
15.6 MEA Automation in Biopharma Industry Market Size Estimation & Forecast by Component
15.7 MEA Automation in Biopharma Industry Market Size Estimation & Forecast by Automation Technology
15.8 MEA Automation in Biopharma Industry Market Size Estimation & Forecast by Digitization Technology
15.9 GCC Automation in Biopharma Industry Market Analysis
15.10 South Africa Automation in Biopharma Industry Market Analysis
15.11 Rest of MEA Automation in Biopharma Industry Market Analysis
16 Company Profiles
16.1 PerkinElmer, Inc.
16.1.1 Company Snapshot
16.1.2 Company Overview
16.1.3 Financial Analysis
16.1.3.1 Revenue, 2018-2022
16.1.3.2 R&D, 2018-2022
16.1.3.3 Regional Revenue Share, 2022 (%)
16.1.3.4 Business Segment Revenue Share, 2022 (%)
16.1.4 Product Benchmarking
16.1.5 Strategic Outlook
16.2 Siemens Healthineers
16.2.1 Company Snapshot
16.2.2 Company Overview
16.2.3 Financial Analysis
16.2.3.1 Revenue, 2018-2022
16.2.3.2 Regional Revenue Share, 2022 (%)
16.2.3.3 Business Segment Revenue Share, 2022 (%)
16.2.4 Product Benchmarking
16.2.5 Strategic Outlook
16.3 ABB Robotics
16.3.1 Company Snapshot
16.3.2 Company Overview
16.3.3 Financial Analysis
16.3.3.1 Revenue, 2018-2022
16.3.3.2 R&D, 2018-2022
16.3.3.3 Regional Revenue Share, 2022 (%)
16.3.3.4 Business Segment Revenue Share, 2022 (%)
16.3.4 Product Benchmarking
16.3.5 Strategic Outlook
16.4 Rockwell Automation, Inc.
16.4.1 Company Snapshot
16.4.2 Company Overview
16.4.3 Financial Analysis
16.4.3.1 Revenue, 2018-2022
16.4.3.2 Regional Revenue Share, 2022 (%)
16.4.3.3 Business Segment Revenue Share, 2022 (%)
16.4.4 Product Benchmarking
16.4.5 Strategic Outlook
16.5 Thermo Fisher Scientific Inc.
16.5.1 Company Snapshot
16.5.2 Company Overview
16.5.3 Financial Analysis
16.5.3.1 Revenue, 2018-2022
16.5.3.2 R&D, 2018-2022
16.5.3.3 Regional Revenue Share, 2022 (%)
16.5.3.4 Business Segment Revenue Share, 2022 (%)
16.5.4 Product Benchmarking
16.5.5 Strategic Outlook
16.6 Sartorius Stedim Biotech SA
16.6.1 Company Snapshot
16.6.2 Company Overview
16.6.3 Financial Analysis
16.6.3.1 Revenue, 2017-2021
16.6.3.2 R&D, 2017-2021
16.6.3.3 Regional Revenue Share, 2022 (%)
16.6.3.4 Business Segment Revenue Share, 2022 (%)
16.6.4 Product Benchmarking
16.6.5 Strategic Outlook
16.7 RheoSense Inc.
16.7.1 Company Snapshot
16.7.2 Company Overview
16.7.3 Product Benchmarking
16.7.4 Strategic Outlook
16.8 Emerson Electric Co.
16.8.1 Company Snapshot
16.8.2 Company Overview
16.8.3 Financial Analysis
16.8.3.1 Revenue, 2018-2022
16.8.3.2 R&D, 2018-2022
16.8.3.3 Regional Revenue Share, 2022 (%)
16.8.3.4 Business Segment Revenue Share, 2022 (%)
16.8.4 Product Benchmarking
16.8.5 Strategic Outlook
16.9 TetraScience, Inc.
16.9.1 Company Snapshot
16.9.2 Company Overview
16.9.3 Product Benchmarking
16.9.4 Strategic Outlook
16.10 ADLINK Technology Inc.
16.10.1 Company Snapshot
16.10.2 Company Overview
16.10.3 Product Benchmarking
16.11 Acieta LLC
16.11.1 Company Snapshot
16.11.2 Company Overview
16.11.3 Product Benchmarking
16.12 AMETEK
16.12.1 Company Snapshot
16.12.2 Company Overview
16.12.3 Financial Analysis
16.12.3.1 Revenue, 2017-2021
16.12.3.2 Regional Revenue Share, 2022 (%)
16.12.3.3 Business Segment Revenue Share, 2022 (%)
16.12.4 Product Benchmarking
16.12.5 Strategic Outlook
16.13 Autodesk, Inc.
16.13.1 Company Snapshot
16.13.2 Company Overview
16.13.3 Financial Analysis
16.13.3.1 Revenue, 2018-2022
16.13.3.2 R&D, 2018-2022
16.13.3.3 Regional Revenue Share, 2022 (%)
16.13.3.4 Business Segment Revenue Share, 2022 (%)
16.13.4 Product Benchmarking
16.14 Baumueller-Nuermont Corp.
16.14.1 Company Snapshot
16.14.2 Company Overview
16.14.3 Product Benchmarking
16.14.4 Strategic Outlook
16.15 Kawasaki Robotics
16.15.1 Company Snapshot
16.15.2 Company Overview
16.15.3 Product Benchmarking
17 Conclusion and Recommendations
17.1 Concluding Remarks from Visiongain
17.2 Recommendations for Market Players
List of Tables
Table 1 Automation in Biopharma Industry Market Snapshot, 2023 & 2033 (US$ million, CAGR %)
Table 2 Automation in Biopharma Industry Market by Region, 2023-2033 (US$ Mn, AGR (%), CAGR (%)) (V-Shaped Recovery Scenario)
Table 3 Automation in Biopharma Industry Market by Region, 2023-2033 (US$ Mn, AGR (%), CAGR (%)) (U-Shaped Recovery Scenario)
Table 4 Automation in Biopharma Industry Market by Region, 2023-2033 (US$ Mn, AGR (%), CAGR (%)) (W-Shaped Recovery Scenario)
Table 5 Automation in Biopharma Industry Market by Region, 2023-2033 (US$ Mn, AGR (%), CAGR (%)) (L-Shaped Recovery Scenario)
Table 6 Automation in Biopharma Industry Market Forecast, 2023-2033 (US$ Mn, AGR (%), CAGR (%))
Table 7 Automation in Biopharma Industry Market by Region, 2023-2033 (US$ Mn, AGR (%), CAGR (%))
Table 8 Automation in Biopharma Industry Market by Technology, 2023-2033 (US$ Mn, AGR (%), CAGR (%))
Table 9 Automation in Biopharma Industry Market by Application, 2023-2033 (US$ Mn, AGR (%), CAGR (%))
Table 10 Automation in Biopharma Industry Market by Component, 2023-2033 (US$ Mn, AGR (%), CAGR (%))
Table 11 Automation in Biopharma Industry Market by Automation Technology, 2023-2033 (US$ Mn, AGR (%), CAGR (%))
Table 12 Automation in Biopharma Industry Market by Digitization Technology, 2023-2033 (US$ Mn, AGR (%), CAGR (%))
Table 13 Automation in Biopharma Industry Market by Technology, 2023-2033 (US$ Mn, AGR (%), CAGR (%))
Table 14 Automation Technology Market by Region, 2023-2033 (US$ Mn, AGR (%), CAGR (%))
Table 15 Digitization Technology Market by Region, 2023-2033 (US$ Mn, AGR (%), CAGR (%))
Table 16 Automation in Biopharma Industry Market by Application, 2023-2033 (US$ Mn, AGR (%), CAGR (%))
Table 17 Clinical Phase Market by Region, 2023-2033 (US$ Mn, AGR (%), CAGR (%))
Table 18 Drug Discovery Phase Market by Region, 2023-2033 (US$ Mn, AGR (%), CAGR (%))
Table 19 Production Phase Market by Region, 2023-2033 (US$ Mn, AGR (%), CAGR (%))
Table 20 Automation in Biopharma Industry Market by Component, 2023-2033 (US$ Mn, AGR (%), CAGR (%))
Table 21 Automation Hardware Market by Region, 2023-2033 (US$ Mn, AGR (%), CAGR (%))
Table 22 Automation Software Market by Region, 2023-2033 (US$ Mn, AGR (%), CAGR (%))
Table 23 Services Project Phase Market by Region, 2023-2033 (US$ Mn, AGR (%), CAGR (%))
Table 24 Global Services Operation Phase Market by Region, 2023-2033 (US$ Mn, AGR (%), CAGR (%))
Table 25 Automation in Biopharma Industry Market by Automation Technology, 2023-2033 (US$ Mn, AGR (%), CAGR (%))
Table 26 Supervisory Control and Data Acquisition (SCADA) Market by Region, 2023-2033 (US$ Mn, AGR (%), CAGR (%))
Table 27 Distributed Control Systems (DCS) Market by Region, 2023-2033 (US$ Mn, AGR (%), CAGR (%))
Table 28 Programmable Logic Controllers (PLC) Market by Region, 2023-2033 (US$ Mn, AGR (%), CAGR (%))
Table 29 Manufacturing Execution System (MES) Market by Region, 2023-2033 (US$ Mn, AGR (%), CAGR (%))
Table 30 Human-machine Interface (HMI) Market by Region, 2023-2033 (US$ Mn, AGR (%), CAGR (%))
Table 31 Advanced Process Control (APC) Market by Region, 2023-2033 (US$ Mn, AGR (%), CAGR (%))
Table 32 Enterprise Resource Planning (ERP) Market by Region, 2023-2033 (US$ Mn, AGR (%), CAGR (%))
Table 33 Laboratory Information Management System (LIMS) Market by Region, 2023-2033 (US$ Mn, AGR (%), CAGR (%))
Table 34 Customer Relationship Management (CRM) Market by Region, 2023-2033 (US$ Mn, AGR (%), CAGR (%))
Table 35 Corrective and Preventive Actions (CAPA) Market by Region, 2023-2033 (US$ Mn, AGR (%), CAGR (%))
Table 36 Other Automation Technologies Market by Region, 2023-2033 (US$ Mn, AGR (%), CAGR (%))
Table 37 Automation in Biopharma Industry Market by Digitization Technology, 2023-2033 (US$ Mn, AGR (%), CAGR (%))
Table 38 Internet of things (IoT) Market by Region, 2023-2033 (US$ Mn, AGR (%), CAGR (%))
Table 39 Artificial intelligence (AI) Market by Region, 2023-2033 (US$ Mn, AGR (%), CAGR (%))
Table 40 Digital Twin Technology Market by Region, 2023-2033 (US$ Mn, AGR (%), CAGR (%))
Table 41 Augmented Reality (AR) and Virtual Reality (VR) Market by Region, 2023-2033 (US$ Mn, AGR (%), CAGR (%))
Table 42 Predictive Analytics Market by Region, 2023-2033 (US$ Mn, AGR (%), CAGR (%))
Table 43 Cloud Computing Market by Region, 2023-2033 (US$ Mn, AGR (%), CAGR (%))
Table 44 North America Automation in Biopharma Industry Market by Country, 2023-2033 (US$ Mn, AGR (%), CAGR (%))
Table 45 North America Automation in Biopharma Industry Market by Technology, 2023-2033 (US$ Mn, AGR (%), CAGR (%))
Table 46 North America Automation in Biopharma Industry Market by Application, 2023-2033 (US$ Mn, AGR (%), CAGR (%))
Table 47 North America Automation in Biopharma Industry Market by Component, 2023-2033 (US$ Mn, AGR (%), CAGR (%))
Table 48 North America Automation in Biopharma Industry Market by Automation Technology, 2023-2033 (US$ Mn, AGR (%), CAGR (%))
Table 49 North America Automation in Biopharma Industry Market by Digitization Technology, 2023-2033 (US$ Mn, AGR (%), CAGR (%))
Table 50 US Automation in Biopharma Industry Market by Value, 2023-2033 (US$ Mn, AGR (%), CAGR (%))
Table 51 Canada Automation in Biopharma Industry Market by Value, 2023-2033 (US$ Mn, AGR (%), CAGR (%))
Table 52 Europe Automation in Biopharma Industry Market by Country, 2023-2033 (US$ Mn, AGR (%), CAGR (%))
Table 53 Europe Automation in Biopharma Industry Market by Technology, 2023-2033 (US$ Mn, AGR (%), CAGR (%))
Table 54 Europe Automation in Biopharma Industry Market by Application, 2023-2033 (US$ Mn, AGR (%), CAGR (%))
Table 55 Europe Automation in Biopharma Industry Market by Component, 2023-2033 (US$ Mn, AGR (%), CAGR (%))
Table 56 Europe Automation in Biopharma Industry Market by Automation Technology, 2023-2033 (US$ Mn, AGR (%), CAGR (%))
Table 57 Europe Automation in Biopharma Industry Market by Digitization Technology, 2023-2033 (US$ Mn, AGR (%), CAGR (%))
Table 58 Germany Automation in Biopharma Industry Market by Value, 2023-2033 (US$ Mn, AGR (%), CAGR (%))
Table 59 UK Automation in Biopharma Industry Market by Value, 2023-2033 (US$ Mn, AGR (%), CAGR (%))
Table 60 France Automation in Biopharma Industry Market by Value, 2023-2033 (US$ Mn, AGR (%), CAGR (%))
Table 61 Italy Automation in Biopharma Industry Market by Value, 2023-2033 (US$ Mn, AGR (%), CAGR (%))
Table 62 Spain Automation in Biopharma Industry Market by Value, 2023-2033 (US$ Mn, AGR (%), CAGR (%))
Table 63 Rest of Europe Automation in Biopharma Industry Market by Value, 2023-2033 (US$ Mn, AGR (%), CAGR (%))
Table 64 Asia-Pacific Automation in Biopharma Industry Market by Country, 2023-2033 (US$ Mn, AGR (%), CAGR (%))
Table 65 Asia-Pacific Automation in Biopharma Industry Market by Technology, 2023-2033 (US$ Mn, AGR (%), CAGR (%))
Table 66 Asia-Pacific Automation in Biopharma Industry Market by Application, 2023-2033 (US$ Mn, AGR (%), CAGR (%))
Table 67 Asia-Pacific Automation in Biopharma Industry Market by Component, 2023-2033 (US$ Mn, AGR (%), CAGR (%))
Table 68 Asia-Pacific Automation in Biopharma Industry Market by Automation Technology, 2023-2033 (US$ Mn, AGR (%), CAGR (%))
Table 69 Asia-Pacific Automation in Biopharma Industry Market by Digitization Technology, 2023-2033 (US$ Mn, AGR (%), CAGR (%))
Table 70 China Automation in Biopharma Industry Market by Value, 2023-2033 (US$ Mn, AGR (%), CAGR (%))
Table 71 India Automation in Biopharma Industry Market by Value, 2023-2033 (US$ Mn, AGR (%), CAGR (%))
Table 72 Japan Automation in Biopharma Industry Market by Value, 2023-2033 (US$ Mn, AGR (%), CAGR (%))
Table 73 South Korea Automation in Biopharma Industry Market by Value, 2023-2033 (US$ Mn, AGR (%), CAGR (%))
Table 74 Australia Automation in Biopharma Industry Market by Value, 2023-2033 (US$ Mn, AGR (%), CAGR (%))
Table 75 Rest of Asia-Pacific Automation in Biopharma Industry Market by Value, 2023-2033 (US$ Mn, AGR (%), CAGR (%))
Table 76 Latin America Automation in Biopharma Industry Market by Country, 2023-2033 (US$ Mn, AGR (%), CAGR (%))
Table 77 Latin America Automation in Biopharma Industry Market by Technology, 2023-2033 (US$ Mn, AGR (%), CAGR (%))
Table 78 Latin America Automation in Biopharma Industry Market by Application, 2023-2033 (US$ Mn, AGR (%), CAGR (%))
Table 79 Latin America Automation in Biopharma Industry Market by Component, 2023-2033 (US$ Mn, AGR (%), CAGR (%))
Table 80 Latin America Automation in Biopharma Industry Market by Automation Technology, 2023-2033 (US$ Mn, AGR (%), CAGR (%))
Table 81 Latin America Automation in Biopharma Industry Market by Digitization Technology, 2023-2033 (US$ Mn, AGR (%), CAGR (%))
Table 82 Brazil Automation in Biopharma Industry Market by Value, 2023-2033 (US$ Mn, AGR (%), CAGR (%))
Table 83 Mexico Automation in Biopharma Industry Market by Value, 2023-2033 (US$ Mn, AGR (%), CAGR (%))
Table 84 Rest of Latin America Automation in Biopharma Industry Market by Value, 2023-2033 (US$ Mn, AGR (%), CAGR (%))
Table 85 MEA Automation in Biopharma Industry Market by Country, 2023-2033 (US$ Mn, AGR (%), CAGR (%))
Table 86 MEA Automation in Biopharma Industry Market by Technology, 2023-2033 (US$ Mn, AGR (%), CAGR (%))
Table 87 MEA Automation in Biopharma Industry Market by Application, 2023-2033 (US$ Mn, AGR (%), CAGR (%))
Table 88 MEA Automation in Biopharma Industry Market by Component, 2023-2033 (US$ Mn, AGR (%), CAGR (%))
Table 89 MEA Automation in Biopharma Industry Market by Automation Technology, 2023-2033 (US$ Mn, AGR (%), CAGR (%))
Table 90 MEA Automation in Biopharma Industry Market by Digitization Technology, 2023-2033 (US$ Mn, AGR (%), CAGR (%))
Table 91 GCC Automation in Biopharma Industry Market by Value, 2023-2033 (US$ Mn, AGR (%), CAGR (%))
Table 92 South Africa Automation in Biopharma Industry Market by Value, 2023-2033 (US$ Mn, AGR (%), CAGR (%))
Table 93 Rest of MEA Automation in Biopharma Industry Market by Value, 2023-2033 (US$ Mn, AGR (%), CAGR (%))
Table 94 PerkinElmer Inc : Key Details, (CEO, HQ, Revenue, Founded, No. of Employees, Company Type, Website, Business Segment)
Table 95 PerkinElmer Inc: Product Benchmarking
Table 96 PerkinElmer Inc: Strategic Outlook
Table 97 Siemens Healthineers: Key Details, (CEO, HQ, Revenue, Founded, No. of Employees, Company Type, Website, Business Segment)
Table 98 Siemens Healthineers: Product Benchmarking
Table 99 Siemens Healthineers: Strategic Outlook
Table 100 ABB Robotics: Key Details, (CEO, HQ, Revenue, Founded, No. of Employees, Company Type, Website, Business Segment)
Table 101 ABB Robotics: Product Benchmarking
Table 102 ABB Robotics: Strategic Outlook
Table 103 Rockwell Automation, Inc.: Key Details, (CEO, HQ, Revenue, Founded, No. of Employees, Company Type, Website, Business Segment)
Table 104 Rockwell Automation, Inc.: Product Benchmarking
Table 105 Rockwell Automation, Inc.: Strategic Outlook
Table 106 Thermo Fisher Scientific Inc.: Key Details, (CEO, HQ, Revenue, Founded, No. of Employees, Company Type, Website, Business Segment)
Table 107 Thermo Fisher Scientific Inc.: Product Benchmarking
Table 108 Thermo Fisher Scientific Inc.: Strategic Outlook
Table 109 Sartorius Stedim Biotech SA: Key Details, (CEO, HQ, Revenue, Founded, No. of Employees, Company Type, Website, Business Segment)
Table 110 Sartorius Stedim Biotech SA: Product Benchmarking
Table 111 Sartorius Stedim Biotech SA: Strategic Outlook
Table 112 RheoSense Inc.: Key Details, (CEO, HQ, Revenue, Founded, No. of Employees, Company Type, Website, Business Segment)
Table 113 RheoSense Inc.: Product Benchmarking
Table 114 RheoSense Inc.: Strategic Outlook
Table 115 Emerson Electric Co.: Key Details, (CEO, HQ, Revenue, Founded, No. of Employees, Company Type, Website, Business Segment)
Table 116 Emerson Electric Co.: Product Benchmarking
Table 117 Emerson Electric Co.: Strategic Outlook
Table 118 TetraScience, Inc.: Key Details, (CEO, HQ, Revenue, Founded, No. of Employees, Company Type, Website, Business Segment)
Table 119 TetraScience, Inc.: Product Benchmarking
Table 120 TetraScience, Inc.: Strategic Outlook
Table 121 ADLINK Technology Inc.: Key Details, (CEO, HQ, Revenue, Founded, No. of Employees, Company Type, Website, Business Segment)
Table 122 ADLINK Technology Inc.: Product Benchmarking
Table 123 Acieta LLC: Key Details, (CEO, HQ, Revenue, Founded, No. of Employees, Company Type, Website, Business Segment)
Table 124 Acieta LLC: Product Benchmarking
Table 125 AMETEK: Key Details, (CEO, HQ, Revenue, Founded, No. of Employees, Company Type, Website, Business Segment)
Table 126 AMETEK: Product Benchmarking
Table 127 AMETEK: Strategic Outlook
Table 128 Autodesk, Inc.: Key Details, (CEO, HQ, Revenue, Founded, No. of Employees, Company Type, Website, Business Segment)
Table 129 Autodesk, Inc.: Product Benchmarking
Table 130 Baumueller-Nuermont Corp.: Key Details, (CEO, HQ, Revenue, Founded, No. of Employees, Company Type, Website, Business Segment)
Table 131 Baumueller-Nuermont Corp.: Product Benchmarking
Table 132 Baumueller-Nuermont Corp.: Strategic Outlook
Table 133 Kawasaki Robotics: Key Details, (CEO, HQ, Revenue, Founded, No. of Employees, Company Type, Website, Business Segment)
Table 134 Kawasaki Robotics: Product Benchmarking
List of Figures
Figure 1 Automation in Biopharma Industry Market Segmentation
Figure 2 Automation in Biopharma Industry Market Forecast by Region: Market Attractiveness Index
Figure 3 Automation in Biopharma Industry Market by Technology: Market Attractiveness Index
Figure 4 Automation in Biopharma Industry Market by Application: Market Attractiveness Index
Figure 5 Automation in Biopharma Industry Market by Components: Market Attractiveness Index
Figure 6 Automation in Biopharma Industry Market by Automation Technology: Market Attractiveness Index
Figure 7 Automation in Biopharma Industry Market by Digitalization Technology: Market Attractiveness Index
Figure 8 Automation in Biopharma Industry Market: Market Dynamics
Figure 9 Automation in Biopharma Industry Market: Porter’s Five Forces Analysis
Figure 10 Automation in Biopharma Industry Market: PEST Analysis
Figure 11 Automation in Biopharma Industry Market by Region, 2023-2033 (US$ Mn, AGR (%)) (V-Shaped Recovery Scenario)
Figure 12 Automation in Biopharma Industry Market by Region, 2023-2033 (US$ Mn, AGR (%)) (U-Shaped Recovery Scenario)
Figure 13 Automation in Biopharma Industry Market by Region, 2023-2033 (US$ Mn, AGR (%)) (W-Shaped Recovery Scenario)
Figure 14 Automation in Biopharma Industry Market by Region, 2023-2033 (US$ Mn, AGR (%)) (L-Shaped Recovery Scenario)
Figure 15 Automation in Biopharma Industry Market Forecast, 2023-2033 (US$ Mn, AGR (%))
Figure 16 Automation in Biopharma Industry Market by Region, 2023-2033 (US$ Mn, AGR (%))
Figure 17 Automation in Biopharma Industry Market by Technology, 2023-2033 (US$ Mn, AGR (%))
Figure 18 Automation in Biopharma Industry Market by Application, 2023-2033 (US$ Mn, AGR (%))
Figure 19 Automation in Biopharma Industry Market by Component, 2023-2033 (US$ Mn, AGR (%))
Figure 20 Automation in Biopharma Industry Market by Automation Technology, 2023-2033 (US$ Mn, AGR (%))
Figure 21 Automation in Biopharma Industry Market by Digitization Technology, 2023-2033 (US$ Mn, AGR (%))
Figure 22 Automation in Biopharma Industry Market by Technology: Market Attractiveness Index
Figure 23 Automation in Biopharma Industry Market Share Forecast by Technology, 2023 & 2033 (%)
Figure 24 Automation in Biopharma Industry Market by Technology, 2023-2033 (US$ Mn, AGR (%))
Figure 25 Automation Technology Market by Region, 2023-2033 (US$ Mn, AGR (%))
Figure 26 Automation Technology Market Share Forecast by Region, 2023 & 2033 (%)
Figure 27 Digitization Technology Market by Region, 2023-2033 (US$ Mn, AGR (%))
Figure 28 Digitization Technology Market Share Forecast by Region, 2023 & 2033 (%)
Figure 29 Automation in Biopharma Industry Market by Application: Market Attractiveness Index
Figure 30 Automation in Biopharma Industry Market Share Forecast by Application, 2023 & 2033 (%)
Figure 31 Automation in Biopharma Industry Market by Application, 2023-2033 (US$ Mn, AGR (%))
Figure 32 Global Clinical Phase Market by Region, 2023-2033 (US$ Mn, AGR (%))
Figure 33 Clinical Phase Market Share Forecast by Region, 2023 & 2033 (%)
Figure 34 Drug Discovery Phase Market by Region, 2023-2033 (US$ Mn, AGR (%))
Figure 35 Drug Discovery Phase Market Share Forecast by Region, 2023 & 2033 (%)
Figure 36 Production Phase Market by Region, 2023-2033 (US$ Mn, AGR (%))
Figure 37 Production Phase Market Share Forecast by Region, 2023 & 2033 (%)
Figure 38 Automation in Biopharma Industry Market by Components: Market Attractiveness Index
Figure 39 Automation in Biopharma Industry Market Share Forecast by Component, 2023 & 2033 (%)
Figure 40 Automation in Biopharma Industry Market by Component, 2023-2033 (US$ Mn, AGR (%))
Figure 41 Automation Hardware Market by Region, 2023-2033 (US$ Mn, AGR (%))
Figure 42 Automation Hardware Market Share Forecast by Region, 2023 & 2033 (%)
Figure 43 Automation Software Market by Region, 2023-2033 (US$ Mn, AGR (%))
Figure 44 Automation Software Market Share Forecast by Region, 2023 & 2033 (%)
Figure 45 Services Project Phase Market by Region, 2023-2033 (US$ Mn, AGR (%))
Figure 46 Services Project Phase Market Share Forecast by Region, 2023 & 2033 (%)
Figure 47 Global Services Operation Phase Market by Region, 2023-2033 (US$ Mn, AGR (%))
Figure 48 Services Operation Phase Market Share Forecast by Region, 2023 & 2033 (%)
Figure 49 Automation in Biopharma Industry Market by Automation Technology: Market Attractiveness Index
Figure 50 Automation in Biopharma Industry Market by Automation Technology, 2023-2033 (US$ Mn, AGR (%))
Figure 51 Supervisory Control and Data Acquisition (SCADA) Market by Region, 2023-2033 (US$ Mn, AGR (%))
Figure 52 Supervisory Control and Data Acquisition (SCADA) Market Share Forecast by Region, 2023 & 2033 (%)
Figure 53 Distributed Control Systems (DCS) Market by Region, 2023-2033 (US$ Mn, AGR (%))
Figure 54 Distributed Control Systems (DCS) Market Share Forecast by Region, 2023 & 2033 (%)
Figure 55 Programmable Logic Controllers (PLC) Market by Region, 2023-2033 (US$ Mn, AGR (%))
Figure 56 Programmable Logic Controllers (PLC) Market Share Forecast by Region, 2023 & 2033 (%)
Figure 57 Manufacturing Execution System (MES) Market by Region, 2023-2033 (US$ Mn, AGR (%))
Figure 58 Manufacturing Execution System (MES) Market Share Forecast by Region, 2023 & 2033 (%)
Figure 59 Human-machine Interface (HMI) Market by Region, 2023-2033 (US$ Mn, AGR (%))
Figure 60 Human-machine Interface (HMI) Market Share Forecast by Region, 2023 & 2033 (%)
Figure 61 Advanced Process Control (APC) Market by Region, 2023-2033 (US$ Mn, AGR (%))
Figure 62 Advanced Process Control (APC) Market Share Forecast by Region, 2023 & 2033 (%)
Figure 63 Enterprise Resource Planning (ERP) Market by Region, 2023-2033 (US$ Mn, AGR (%))
Figure 64 Enterprise Resource Planning (ERP) Market Share Forecast by Region, 2023 & 2033 (%)
Figure 65 Laboratory Information Management System (LIMS) Market by Region, 2023-2033 (US$ Mn, AGR (%))
Figure 66 Laboratory Information Management System (LIMS) Market Share Forecast by Region, 2023 & 2033 (%)
Figure 67 Customer Relationship Management (CRM) Market by Region, 2023-2033 (US$ Mn, AGR (%))
Figure 68 Customer Relationship Management (CRM) Market Share Forecast by Region, 2023 & 2033 (%)
Figure 69 Corrective and Preventive Actions (CAPA) Market by Region, 2023-2033 (US$ Mn, AGR (%))
Figure 70 Corrective and Preventive Actions (CAPA) Market Share Forecast by Region, 2023 & 2033 (%)
Figure 71 Other Automation Technologies Market by Region, 2023-2033 (US$ Mn, AGR (%))
Figure 72 Other Automation Technologies Market Share Forecast by Region, 2023 & 2033 (%)
Figure 73 Automation in Biopharma Industry Market by Digitalization Technology: Market Attractiveness Index
Figure 74 Advanced Process Control (APC) Market Share Forecast by Region, 2023 & 2033 (%)
Figure 75 Automation in Biopharma Industry Market by Digitization Technology, 2023-2033 (US$ Mn, AGR (%))
Figure 76 Internet of things (IoT) Market by Region, 2023-2033 (US$ Mn, AGR (%))
Figure 77 Internet of Things (IoT) Market Share Forecast by Region, 2023 & 2033 (%)
Figure 78 Artificial intelligence (AI) Market by Region, 2023-2033 (US$ Mn, AGR (%))
Figure 79 Artificial intelligence (AI) Market Share Forecast by Region, 2023 & 2033 (%)
Figure 80 Digital Twin Technology Market by Region, 2023-2033 (US$ Mn, AGR (%))
Figure 81 Digital Twin Technology Market Share Forecast by Region, 2023 & 2033 (%)
Figure 82 Augmented Reality (AR) and Virtual Reality (VR) Market by Region, 2023-2033 (US$ Mn, AGR (%))
Figure 83 Augmented Reality (AR) and Virtual Reality (VR) Market Share Forecast by Region, 2023 & 2033 (%)
Figure 84 Predictive Analytics Market by Region, 2023-2033 (US$ Mn, AGR (%))
Figure 85 Predictive Analytics Market Share Forecast by Region, 2023 & 2033 (%)
Figure 86 Cloud Computing Market by Region, 2023-2033 (US$ Mn, AGR (%))
Figure 87 Cloud Computing Market Share Forecast by Region, 2023 & 2033 (%)
Figure 88 North America Automation in Biopharma Industry Market Attractiveness Index
Figure 89 North America Automation in Biopharma Industry Market by Country, 2023-2033 (US$ Mn, AGR (%))
Figure 90 North America Automation in Biopharma Industry Market Share Forecast by Country, 2023 & 2033 (%)
Figure 91 North America Automation in Biopharma Industry Market by Technology, 2023-2033 (US$ Mn, AGR (%))
Figure 92 North America Automation in Biopharma Market Share Forecast by Technology, 2023 & 2033 (%)
Figure 93 North America Automation in Biopharma Industry Market by Application, 2023-2033 (US$ Mn, AGR (%))
Figure 94 North America Automation in Biopharma Market Share Forecast by Application, 2023 & 2033 (%)
Figure 95 North America Automation in Biopharma Industry Market by Component, 2023-2033 (US$ Mn, AGR (%))
Figure 96 North America Automation in Biopharma Market Share Forecast by Component, 2023 & 2033 (%)
Figure 97 North America Automation in Biopharma Industry Market by Automation Technology, 2023-2033 (US$ Mn, AGR (%))
Figure 98 North America Automation in Biopharma Market Share Forecast by Automation Technology, 2023 & 2033 (%)
Figure 99 North America Automation in Biopharma Industry Market by Digitization Technology, 2023-2033 (US$ Mn, AGR (%))
Figure 100 North America Automation in Biopharma Market Share Forecast by Digitization Technology, 2023 & 2033 (%)
Figure 101 US Automation in Biopharma Industry Market by Value, 2023-2033 (US$ Mn, AGR (%))
Figure 102 Canada Automation in Biopharma Industry Market by Value, 2023-2033 (US$ Mn, AGR (%))
Figure 103 Europe Automation in Biopharma Industry Market Attractiveness Index
Figure 104 Europe Automation in Biopharma Industry Market by Country, 2023-2033 (US$ Mn, AGR (%))
Figure 105 Europe Automation in Biopharma Industry Market Share Forecast by Country, 2023 & 2033 (%)
Figure 106 Europe Automation in Biopharma Industry Market by Technology, 2023-2033 (US$ Mn, AGR (%))
Figure 107 Europe Automation in Biopharma Market Share Forecast by Technology, 2023 & 2033 (%)
Figure 108 Europe Automation in Biopharma Industry Market by Application, 2023-2033 (US$ Mn, AGR (%))
Figure 109 Europe Automation in Biopharma Market Share Forecast by Application, 2023 & 2033 (%)
Figure 110 Europe Automation in Biopharma Industry Market by Component, 2023-2033 (US$ Mn, AGR (%))
Figure 111 Europe Automation in Biopharma Market Share Forecast by Component, 2023 & 2033 (%)
Figure 112 Europe Automation in Biopharma Industry Market by Automation Technology, 2023-2033 (US$ Mn, AGR (%))
Figure 113 Europe Automation in Biopharma Market Share Forecast by Automation Technology, 2023 & 2033 (%)
Figure 114 Europe Automation in Biopharma Industry Market by Digitization Technology, 2023-2033 (US$ Mn, AGR (%))
Figure 115 Europe Automation in Biopharma Market Share Forecast by Digitization Technology, 2023 & 2033 (%)
Figure 116 Germany Automation in Biopharma Industry Market by Value, 2023-2033 (US$ Mn, AGR (%))
Figure 117 UK Automation in Biopharma Industry Market by Value, 2023-2033 (US$ Mn, AGR (%))
Figure 118 France Automation in Biopharma Industry Market by Value, 2023-2033 (US$ Mn, AGR (%))
Figure 119 Italy Automation in Biopharma Industry Market by Value, 2023-2033 (US$ Mn, AGR (%))
Figure 120 Spain Automation in Biopharma Industry Market by Value, 2023-2033 (US$ Mn, AGR (%))
Figure 121 Rest of Europe Automation in Biopharma Industry Market by Value, 2023-2033 (US$ Mn, AGR (%))
Figure 122 Asia-Pacific Automation in Biopharma Industry Market Attractiveness Index
Figure 123 Asia-Pacific Automation in Biopharma Industry Market by Country, 2023-2033 (US$ Mn, AGR (%))
Figure 124 Asia-Pacific Automation in Biopharma Industry Market Share Forecast by Country, 2023 & 2033 (%)
Figure 125 Asia-Pacific Automation in Biopharma Industry Market by Technology, 2023-2033 (US$ Mn, AGR (%))
Figure 126 Asia-Pacific Automation in Biopharma Market Share Forecast by Technology, 2023 & 2033 (%)
Figure 127 Asia-Pacific Automation in Biopharma Industry Market by Application, 2023-2033 (US$ Mn, AGR (%))
Figure 128 Asia-Pacific Automation in Biopharma Market Share Forecast by Application, 2023 & 2033 (%)
Figure 129 Asia-Pacific Automation in Biopharma Industry Market by Component, 2023-2033 (US$ Mn, AGR (%))
Figure 130 Asia-Pacific Automation in Biopharma Market Share Forecast by Component, 2023 & 2033 (%)
Figure 131 Asia-Pacific Automation in Biopharma Industry Market by Automation Technology, 2023-2033 (US$ Mn, AGR (%))
Figure 132 Asia-Pacific Automation in Biopharma Market Share Forecast by Automation Technology, 2023 & 2033 (%)
Figure 133 Asia-Pacific Automation in Biopharma Industry Market by Digitization Technology, 2023-2033 (US$ Mn, AGR (%))
Figure 134 Asia-Pacific Automation in Biopharma Market Share Forecast by Digitization Technology, 2023 & 2033 (%)
Figure 135 China Automation in Biopharma Industry Market by Value, 2023-2033 (US$ Mn, AGR (%))
Figure 136 India Automation in Biopharma Industry Market by Value, 2023-2033 (US$ Mn, AGR (%))
Figure 137 Japan Automation in Biopharma Industry Market by Value, 2023-2033 (US$ Mn, AGR (%))
Figure 138 South Korea Automation in Biopharma Industry Market by Value, 2023-2033 (US$ Mn, AGR (%))
Figure 139 Australia Automation in Biopharma Industry Market by Value, 2023-2033 (US$ Mn, AGR (%))
Figure 140 Rest of Asia-Pacific Automation in Biopharma Industry Market by Value, 2023-2033 (US$ Mn, AGR (%))
Figure 141 Latin America Automation in Biopharma Industry Market Forecast by Country: Market Attractiveness Index
Figure 142 Latin America Automation in Biopharma Industry Market by Country, 2023-2033 (US$ Mn, AGR (%))
Figure 143 Latin America Automation in Biopharma Industry Market Share Forecast by Country, 2023 & 2033 (%)
Figure 144 Latin America Automation in Biopharma Industry Market by Technology, 2023-2033 (US$ Mn, AGR (%))
Figure 145 Latin America Automation in Biopharma Market Share Forecast by Technology, 2023 & 2033 (%)
Figure 146 Latin America Automation in Biopharma Industry Market by Application, 2023-2033 (US$ Mn, AGR (%))
Figure 147 Latin America Automation in Biopharma Market Share Forecast by Application, 2023 & 2033 (%)
Figure 148 Latin America Automation in Biopharma Industry Market by Component, 2023-2033 (US$ Mn, AGR (%))
Figure 149 Latin America Automation in Biopharma Market Share Forecast by Component, 2023 & 2033 (%)
Figure 150 Latin America Automation in Biopharma Industry Market by Automation Technology, 2023-2033 (US$ Mn, AGR (%))
Figure 151 Latin America Automation in Biopharma Market Share Forecast by Automation Technology, 2023 & 2033 (%)
Figure 152 Latin America Automation in Biopharma Industry Market by Digitization Technology, 2023-2033 (US$ Mn, AGR (%))
Figure 153 Latin America Automation in Biopharma Market Share Forecast by Digitization Technology, 2023 & 2033 (%)
Figure 154 Brazil Automation in Biopharma Industry Market by Value, 2023-2033 (US$ Mn, AGR (%))
Figure 155 Mexico Automation in Biopharma Industry Market by Value, 2023-2033 (US$ Mn, AGR (%))
Figure 156 Rest of Latin America Automation in Biopharma Industry Market by Value, 2023-2033 (US$ Mn, AGR (%))
Figure 157 MEA Automation in Biopharma Industry Market Attractiveness Index
Figure 158 MEA Automation in Biopharma Industry Market by Country, 2023-2033 (US$ Mn, AGR (%))
Figure 159 MEA Automation in Biopharma Industry Market Share Forecast by Country, 2023 & 2033 (%)
Figure 160 MEA Automation in Biopharma Industry Market by Technology, 2023-2033 (US$ Mn, AGR (%))
Figure 161 MEA Automation in Biopharma Market Share Forecast by Technology, 2023 & 2033 (%)
Figure 162 MEA Automation in Biopharma Industry Market by Application, 2023-2033 (US$ Mn, AGR (%))
Figure 163 MEA Automation in Biopharma Market Share Forecast by Application, 2023 & 2033 (%)
Figure 164 MEA Automation in Biopharma Industry Market by Component, 2023-2033 (US$ Mn, AGR (%))
Figure 165 MEA Automation in Biopharma Market Share Forecast by Component, 2023 & 2033 (%)
Figure 166 MEA Automation in Biopharma Industry Market by Automation Technology, 2023-2033 (US$ Mn, AGR (%))
Figure 167 MEA Automation in Biopharma Market Share Forecast by Automation Technology, 2023 & 2033 (%)
Figure 168 MEA Automation in Biopharma Industry Market by Digitization Technology, 2023-2033 (US$ Mn, AGR (%))
Figure 169 MEA Automation in Biopharma Market Share Forecast by Digitization Technology, 2023 & 2033 (%)
Figure 170 GCC Automation in Biopharma Industry Market by Value, 2023-2033 (US$ Mn, AGR (%))
Figure 171 South Africa Automation in Biopharma Industry Market by Value, 2023-2033 (US$ Mn, AGR (%))
Figure 172 Rest of MEA Automation in Biopharma Industry Market by Value, 2023-2033 (US$ Mn, AGR (%))
Figure 173 PerkinElmer Inc: Revenue 2018-2022 (US$ million, AGR%)
Figure 174 PerkinElmer Inc: R&D, 2018-2022 (US$ million, AGR%)
Figure 175 PerkinElmer Inc: Regional Revenue Share, 2022 (%)
Figure 176 PerkinElmer Inc: Business Segment Revenue Share, 2022 (%)
Figure 177 Siemens Healthineers: Revenue, 2018-2022 (US$ million, AGR%)
Figure 178 Siemens Healthineers: Regional Revenue Share, 2022 (%)
Figure 179 Siemens Healthineers: Business Segment Revenue Share, 2022 (%)
Figure 180 ABB Robotics: Revenue, 2018-2022 (US$ million, AGR%)
Figure 181 ABB Robotics: R&D, 2018-2022 (US$ million, AGR%)
Figure 182 ABB Robotics: Regional Revenue Share, 2022 (%)
Figure 183 ABB Robotics: Business Segment Revenue Share, 2022 (%)
Figure 184 Rockwell Automation, Inc.: Revenue, 2018-2022 (US$ million, AGR%)
Figure 185 Rockwell Automation, Inc.: Regional Revenue Share, 2022 (%)
Figure 186 Rockwell Automation, Inc.: Business Segment Revenue Share, 2022 (%)
Figure 187 Thermo Fisher Scientific Inc.: Revenue, 2018-2022 (US$ million, AGR%)
Figure 188 Thermo Fisher Scientific Inc: R&D, 2018-2022 (US$ million, AGR%)
Figure 189 Thermo Fisher Scientific Inc.: Regional Revenue Share, 2022 (%)
Figure 190 Thermo Fisher Scientific Inc.: Business Segment Revenue Share, 2022 (%)
Figure 191 Sartorius Stedim Biotech SA: Revenue, 2017-2021 (US$ million, AGR%)
Figure 192 Sartorius Stedim Biotech SA: R&D, 2017-2021 (US$ million, AGR%)
Figure 193 Sartorius Stedim Biotech SA: Regional Revenue Share, 2022 (%)
Figure 194 Sartorius Stedim Biotech SA: Business Segment Revenue Share, 2022 (%)
Figure 195 Emerson Electric Co.: Revenue, 2018-2022 (US$ million, AGR%)
Figure 196 Emerson Electric Co: R&D, 2018-2022 (US$ million, AGR%)
Figure 197 Emerson Electric Co.: Regional Revenue Share, 2022 (%)
Figure 198 Emerson Electric Co.: Business Segment Revenue Share, 2022 (%)
Figure 199 AMETEK: Revenue, 2017-2021 (US$ million, AGR%)
Figure 200 AMETEK: Regional Revenue Share, 2022 (%)
Figure 201 AMETEK: Business Segment Revenue Share, 2022 (%)
Figure 202 Autodesk, Inc.: Revenue,2018-2022 (US$ million, AGR%)
Figure 203 Autodesk, Inc.: R&D, 2018-2022 (US$ million, AGR%)
Figure 204 Autodesk, Inc.: Regional Revenue Share, 2022 (%)
Figure 205 Autodesk, Inc.: Business Segment Revenue Share, 2022 (%)
ページTOPに戻る
関連レポート(キーワード「バイオ医薬品」)
よくあるご質問
Visiongain社はどのような調査会社ですか?
英国の調査会社ヴィジョンゲイン社(Visiongain)は、通信とエネルギーのほか、自動車や化学・医薬品、金属など、広範な市場を対象に調査を行っています。自動車市場については、市場全般に関する調査のほ... もっと見る
調査レポートの納品までの日数はどの程度ですか?
在庫のあるものは速納となりますが、平均的には 3-4日と見て下さい。
但し、一部の調査レポートでは、発注を受けた段階で内容更新をして納品をする場合もあります。
発注をする前のお問合せをお願いします。
注文の手続きはどのようになっていますか?
1)お客様からの御問い合わせをいただきます。
2)見積書やサンプルの提示をいたします。
3)お客様指定、もしくは弊社の発注書をメール添付にて発送してください。
4)データリソース社からレポート発行元の調査会社へ納品手配します。
5) 調査会社からお客様へ納品されます。最近は、pdfにてのメール納品が大半です。
お支払方法の方法はどのようになっていますか?
納品と同時にデータリソース社よりお客様へ請求書(必要に応じて納品書も)を発送いたします。
お客様よりデータリソース社へ(通常は円払い)の御振り込みをお願いします。
請求書は、納品日の日付で発行しますので、翌月最終営業日までの当社指定口座への振込みをお願いします。振込み手数料は御社負担にてお願いします。
お客様の御支払い条件が60日以上の場合は御相談ください。
尚、初めてのお取引先や個人の場合、前払いをお願いすることもあります。ご了承のほど、お願いします。
データリソース社はどのような会社ですか?
当社は、世界各国の主要調査会社・レポート出版社と提携し、世界各国の市場調査レポートや技術動向レポートなどを日本国内の企業・公官庁及び教育研究機関に提供しております。
世界各国の「市場・技術・法規制などの」実情を調査・収集される時には、データリソース社にご相談ください。
お客様の御要望にあったデータや情報を抽出する為のレポート紹介や調査のアドバイスも致します。
|
|


