eクリニカルソリューション市場レポート:2023-2033
eClinical Solutions Market Report 2023-2033
レポート詳細
eクリニカルソリューションの市場レポート2023-2033 : 本レポートは、業界とその基礎となる力学をよりよく理解したい場合、新たな収益ポケットを目指す大手企業にとって貴重なものとな... もっと見る
※上記価格は部署ライセンス(Departmental licence)価格です。
その他の価格についてはデータリソースまでお問合せください。
日本語のページは自動翻訳を利用し作成しています。
実際のレポートは英文のみでご納品いたします。

|

|
サマリー
レポート詳細
eクリニカルソリューションの市場レポート2023-2033: 本レポートは、業界とその基礎となる力学をよりよく理解したい場合、新たな収益ポケットを目指す大手企業にとって貴重なものとなるでしょう。また、異業種への進出や新地域での既存事業の拡大を目指す企業にとっても有益なレポートです。
臨床試験における電子データ収集(EDC)システムの採用が増加し、業界の成長に拍車をかける
臨床試験における電子データ収集(EDC)システムの利用拡大により、eクリニカルソリューションの市場は大きく拡大しています。EDCシステムは、従来の紙ベースのデータ収集手法と比較して、以下のような多くの利点があります:
- 正確性と効率性の向上
- データ品質の向上
- 患者さんの安全性を高める
- 充実したデータ管理
- コスト削減
臨床試験でEDCシステムを使用している企業には、ファイザー、アストラゼネカ、ノバルティスなどがあります。これらの企業は、EDCシステムの使用により、効率とデータ品質が向上し、患者の安全性が向上し、コスト削減ができたと報告しています。
導入コストの高さが業界成長の妨げになる可能性が高い
eクリニカルソリューション市場の成長を制限する主な要因の1つは、導入コストの高さです。eクリニカルソリューションの導入には、通常、ハードウェア、ソフトウェア、人材への多額の投資が必要であり、特に予算が限られている組織にとっては困難となる場合があります。
また、初期費用だけでなく、eクリニカルソリューションの継続的なメンテナンスとサポート費用も高額になる可能性があります。
このような課題にもかかわらず、多くの組織がeクリニカルソリューションへの投資を選択しているのは、データの正確性の向上、効率の向上、規制要件への準拠など、多くのメリットがあるためです。
マーケットリサーチレポートを購入する前に、どのような質問をするべきか?
- eクリニカルソリューション市場はどのように進化しているのか?
- eクリニカルソリューション市場を牽引し、抑制しているものは何か?
- eクリニカルソリューションの各サブマーケットセグメントは予測期間中にどのように成長し、2033年にこれらのサブマーケットが占める売上はどの程度になるのか?
- 2023年から2033年にかけて、eクリニカルソリューションの各サブマーケットの市場シェアはどのように推移するのか?
- 2023年から2033年にかけて、市場全体の主な牽引役となるのは何か?
- 主要なeクリニカルソリューション市場は、マクロ経済のダイナミクスに幅広く追随するのか、それとも個々の国別市場が他を凌駕するのか?
- 2033年までに各国市場のシェアはどのように変化し、2033年に市場をリードするのはどの地域か?
- 主要プレイヤーは誰で、予測期間中の見通しはあ?
- 2020年から2033年の間に、業界はどのように進化していくのか?現在および今後10年間に行われるeクリニカルソリューションのプロジェクトは、どのような意味を持つのか?
- eクリニカルソリューション市場をさらに拡大するために、製品の商業化の必要性は高まっているのか?
- eクリニカルソリューション市場の方向性と、市場の最前線に立つためにはどうすればよいか?
- 新製品やサービスラインに対する最適な投資オプションは何か?
- 企業を新たな成長軌道に乗せ、C-suiteに移行させるための重要な展望は何か?
このことが、現在、そして今後10年間のeクリニカルソリューション市場にどのような影響を与えるかを知る必要があります:
- 254ページにわたる本レポートでは、97の表と147のチャート/グラフを提供し、お客様に独占的に提供します。
- 本レポートでは、業界における主要な有利な分野をハイライトしているため、今すぐその分野をターゲットにすることができます。
- 世界、地域、国の売上高と成長率を詳細に分析しています。
- 競合他社が成功した主要なトレンド、変化、収益予測をハイライトしています。
本レポートは、eクリニカルソリューション市場が今後10年間にどのように発展するか、またCOVID-19の景気後退と景気回復の変動に合わせて、今日あなたにお伝えします。この市場は、過去10年間のどの時点よりも今が重要です。
2033年までの予測やその他の分析により、商業的な展望を明らかにする。
- 本調査では、2033年までの収益予測に加え、直近の実績、成長率、市場シェアも掲載しています。
- ビジネスの展望や展開など、独自の分析がご覧いただけます。
- 定性的分析(市場力学、促進要因、機会、阻害要因、課題など)、コスト構造、eクリニカルソリューションの価格上昇の影響、最近の動向などをご覧いただけます。
本レポートでは、COVID-19が業界や貴社にどのような影響を与えるかについて、データ分析および貴重な知見を提供しています。COVID-19の4つの回収パターン、すなわち「V」「L」「W」「U」の回収パターンとその影響について考察しています。
報告書の対象セグメント
製品タイプ
- 治験管理システム(CTMS)
- クリニカルデータマネジメントシステム(CDMS)
- ランダム化および治験薬供給管理(RTSM)
- 電子臨床アウトカムアセスメント(eCOA)および電子患者報告アウトカム(ePRO)について
- クリニカルデータインテグレーションプラットフォーム(CDIP)
- 電子データキャプチャ(EDC)
- セーフティソリューション
- クリニカル・アナリティクス・プラットフォーム
- 電子裁判マスターファイル(eTMF)
- その他
デプロイメントタイプ
- クラウド型(SAAS)ソリューション
- ウェブホスト型(On-demand)ソリューション
- ライセンス型エンタープライズ(On-premises)ソリューション
エンドユーザー
- 製薬会社・バイオ医薬品会社
- 受託研究機関
- コンサルティングサービス会社
- 医療機器メーカー
- 病院・診療所
- その他
世界市場全体およびセグメントの収益予測に加え、4地域および主要20カ国市場の収益予測も掲載しています:
北米
- 米国
- カナダ
欧州
- ドイツ
- フランス
- イギリス
- イタリア
- スペイン
- その他の欧州地域
アジア太平洋
- 中国
- 日本
- インド
- オーストラリア
- 韓国
- その他のアジア太平洋地域
ラテンアメリカ
- ブラジル
- メキシコ
- その他のラテンアメリカ地域
MEA
- GCC
- 南アフリカ
- その他のMEA地域
また、eクリニカルソリューション市場の2023年から2033年にかけての主要企業のプロファイルと、これらの企業のこのセグメントに焦点を当てたいくつかの企業についても記載しています。
主要企業と市場成長の可能性
・ Clario
・ Dassault Systèmes
・ eClinical Solutions LLC
・ IBM
・ IQVIA Inc.
・ Medrio, Inc.
・ Oracle
・ Parexel International Corporation
・ Signant Health
・ Veeva Systems
eクリニカルソリューション市場の世界全体の収益、2023年から2033年までの金額ベースで、市場は2023年に89億米ドルを突破すると当研究所が算出。2033年まで収益が大きく成長すると予測しています。当社の調査では、最も大きな可能性を秘めた企業を特定しています。彼らの能力、進歩、商業的な展望を発見することで、常に先を行くことができます。
eクリニカルソリューション市場、2023年から2033年までのレポートはどのように役立つのでしょうか?
250ページ以上のレポートをまとめると、以下のような知識を得ることができます:
- eクリニカルソリューション市場、2023年から2033年までの収益予測 製品タイプ、展開タイプ、エンドユーザーごとの予測、世界と地域レベルでの各予測 - 業界の展望を発見し、投資と収益に最も有利な場所を見つけることができます。
- 4つの地域と20の主要国市場の2033年までの収益予測 - eクリニカルソリューション市場、北米、欧州、アジア太平洋、ラテンアメリカ、MEAの2023年から2033年の市場予測をご覧いただけます。また、アメリカ、カナダ、メキシコ、ブラジル、ドイツ、フランス、イギリス、イタリア、中国、インド、日本、オーストラリアなど著名な経済圏の市場も予測されています。
- 既存企業および市場参入を目指す企業の展望 - eクリニカルソリューション市場に関わる主要企業20社の企業プロファイルを含む、2023年から2033年の市場。
独自の予測による定量・定性分析をご覧いただけます。私たちのレポートだけが持つ情報を入手し、貴重なビジネスインテリジェンスとして情報を得ることができます。
他にはない情報
私たちの新しいレポートがあれば、知識に遅れをとったり、チャンスを逃したりする可能性は低くなります。私たちの研究が、あなたの研究、分析、意思決定にどのように役立つかをご覧ください。Visiongainの研究は、eクリニカルソリューション市場の2023年から2033年、市場をリードする企業の商業分析を必要とするすべての人のためのものです。データ、トレンド、予測を見つけることができます。
ページTOPに戻る
目次
目次
1 レポートの概要
1.1 研究の目的
1.2 eクリニカルソリューション市場の紹介
1.3 この報告書がもたらすもの
1.4 本レポートを読むべき理由
1.本分析レポートが回答する5つの重要な質問
1.6 本レポートは誰のためのものなのか?
1.7 方法論
1.7.1 市場の定義
1.7.2 市場評価・予測手法
1.7.3 データバリデーション
1.7.3.1 一次調査
1.7.3.2 二次調査
1.8 よくある質問(FAQ)
1.9 関連するVisiongainのレポート
1.10 ビジョンゲインについて
2 エグゼクティブサマリー
3 市場の概要
3.1 主要な調査結果
3.2 マーケットダイナミクス
3.2.1 市場促進要因
3.2.1.1 臨床試験における電子データ収集(EDC)システムの採用の増加
3.2.1.2 治験アウトソーシングの増加
3.2.1.3 リアルタイムデータ解析の需要拡大
3.2.1.4 技術的進歩
3.2.2 市場の抑制要因
3.2.2.1 高い実装コスト
3.2.2.2 データセキュリティとプライバシーへの懸念
3.2.2.3 熟練した専門家の利用が限られている
3.2.3 マーケットオポチュニティ
3.2.3.1 新興国への進出
3.2.3.2 患者中心のソリューションへの需要の高まり
3.2.3.3 新しいソリューションの開発
3.3 COVID-19の影響度分析
3.4 ポーターのファイブフォース分析
3.4.1 サプライヤーのバーゲニングパワー
3.4.2 バイヤーのバーゲニングパワー
3.4.3 競合他社のライバル関係
3.4.4 代替品による脅威
3.4.5 新規参入の脅威
3.5 PEST分析
3.5.1 政治的
3.5.2 経済的
3.5.3 社会的
3.5.4 技術的
4 eクリニカルソリューション市場分析:製品タイプ別
4.1 主な調査結果
4.2 製品タイプ別セグメント: 市場魅力度指数
4.3 eクリニカルソリューションの製品タイプ別市場規模の推定と予測
4.4 治験管理システム(CTMS)
4.4.1 地域別市場規模、2023-2033年(US$ bn)
4.4.2 2023年および2033年の地域別市場シェア(%)
4.5 臨床データ管理システム(CDMS)
4.5.1 地域別市場規模、2023-2033年(US$ bn)
4.5.2 2023年および2033年の地域別市場シェア(%)
4.6 ランダム化および治験薬供給管理(RTSM)
4.6.1 地域別市場規模、2023-2033年(US$ bn)
4.6.2 2023年および2033年の地域別市場シェア(%)
4.7 電子的臨床成果評価(eCOA)および電子的患者報告アウトカム(ePRO)について
4.7.1 地域別市場規模、2023-2033年(US$ bn)
4.7.2 2023年および2033年の地域別市場シェア(%)
4.8 クリニカルデータインテグレーションプラットフォーム(CDIP)
4.8.1 地域別市場規模、2023-2033年(US$ bn)
4.8.2 2023年および2033年の地域別市場シェア(%)
4.9 電子データキャプチャ(EDC)
4.9.1 地域別市場規模、2023-2033年(US$ bn)
4.9.2 2023年および2033年の地域別市場シェア(%)
4.10 安全対策
4.10.1 地域別市場規模、2023-2033年(US$ bn)
4.10.2 2023年および2033年の地域別市場シェア(%)
4.11 クリニカルアナリティクスプラットフォーム
4.11.1 地域別市場規模、2023-2033年(US$ bn)
4.11.2 2023年および2033年の地域別市場シェア(%)
4.12 電子裁判マスターファイル(eTMF)
4.12.1 地域別市場規模、2023-2033年(US$ bn)
4.12.2 2023年および2033年の地域別市場シェア(%)
4.13 その他
4.13.1 地域別市場規模、2023-2033年(US$ bn)
4.13.2 2023年および2033年の地域別市場シェア(%)
5 eクリニカルソリューション市場分析:デプロイメントタイプ別
5.1 主要な調査結果
5.2 デプロイメントタイプのセグメント: 市場魅力度指数
5.3 eクリニカルソリューションの展開タイプ別市場規模の推定と予測
5.4 クラウド型(SAAS)ソリューション
5.4.1 地域別市場規模、2023-2033年(US$ bn)
5.4.2 2023年および2033年の地域別市場シェア(%)
5.5 ウェブホスト型(オンデマンド型)ソリューション
5.5.1 地域別市場規模、2023-2033年(US$ bn)
5.5.2 2023年および2033年の地域別市場シェア(%)
5.6 ライセンス型エンタープライズ(オンプレミス)ソリューション
5.6.1 地域別市場規模、2023-2033年(US$ bn)
5.6.2 2023年および2033年の地域別市場シェア(%)
6 eクリニカルソリューション市場分析:エンドユーザー別
6.1 主要な調査結果
6.2 エンドユーザセグメント: 市場魅力度指数
6.3 エンドユーザー別のeクリニカルソリューションの市場規模の推定と予測
6.4 製薬会社・バイオ医薬品会社
6.4.1 地域別市場規模、2023-2033年(US$ bn)
6.4.2 2023年および2033年の地域別市場シェア(%)
6.5 受託研究機関
6.5.1 地域別市場規模、2023-2033年(US$ bn)
6.5.2 2023年および2033年の地域別市場シェア(%)
6.6 コンサルティングサービス会社
6.6.1 地域別市場規模、2023-2033年(US$ bn)
6.6.2 2023年および2033年の地域別市場シェア(%)
6.7 ホスピタル・クリニック
6.7.1 地域別市場規模、2023-2033年(US$ bn)
6.7.2 2023年および2033年の地域別市場シェア(%)
6.8 医療機器メーカー
6.8.1 地域別市場規模、2023-2033年(US$ bn)
6.8.2 2023年および2033年の地域別市場シェア(%)
6.9 その他
6.9.1 地域別市場規模、2023-2033年(US$ bn)
6.9.2 2023年および2033年の地域別市場シェア(%)
7 eクリニカルソリューション市場分析:地域別
7.1 主要な調査結果
7.2 地域別市場規模の推計と予測
8 北米のeクリニカルソリューション市場分析
8.1 キーファインディング
8.2 北米eクリニカルソリューション市場魅力度指数
8.3 北米eクリニカルソリューションの国別市場:2023年、2028年、2033年(US$ bn)
8.4 北米eクリニカルソリューションの国別市場規模推計と予測
8.5 北米eクリニカルソリューションの製品タイプ別市場規模の推定と予測
8.6 北米eクリニカルソリューションの展開タイプ別市場規模の推定と予測
8.7 北米eクリニカルソリューションのエンドユーザー別市場規模推計と予測
8.8 米国のeクリニカルソリューション市場の分析
8.9 カナダのeクリニカルソリューションの市場分析
9 欧州のeクリニカルソリューション市場分析
9.1 主要な調査結果
9.2 欧州eクリニカルソリューション市場魅力度指数
9.3 欧州eクリニカルソリューション国別市場 2023年、2028年、2033年 (US$ bn)
9.4 欧州eクリニカルソリューションの国別市場規模の推定と予測
9.5 欧州eクリニカルソリューションの製品タイプ別市場規模の推定と予測
9.6 欧州eクリニカルソリューションの展開タイプ別市場規模推定と予測
9.7 欧州eクリニカルソリューションのエンドユーザー別市場規模の推定と予測
9.8 ドイツ eクリニカルソリューション市場分析
9.9 フランス eクリニカルソリューションの市場分析
9.10 イギリス eクリニカルソリューション市場分析
9.11 イタリア eクリニカルソリューションの市場分析
9.12 スペイン eクリニカルソリューションの市場分析
9.13 その他の欧州のeクリニカルソリューション市場分析
10 アジア太平洋地域eクリニカルソリューションの市場分析
10.1 キーファインディング
10.2 アジア太平洋地域のeクリニカルソリューション市場魅力度指数
10.3 アジア太平洋地域のeクリニカルソリューションの国別市場:2023年、2028年、2033年(US$ bn)
10.4 アジア太平洋地域のeクリニカルソリューションの国別市場規模推計と予測
10.5 アジア太平洋地域のeクリニカルソリューションの製品タイプ別市場規模の推定と予測
10.6 アジア太平洋地域のeクリニカルソリューションの展開タイプ別市場規模の推定と予測
10.7 アジア太平洋地域のeクリニカルソリューションのエンドユーザー別市場規模の推定と予測
10.8 中国eクリニカルソリューションの市場分析
10.9 日本eクリニカルソリューションの市場分析
10.10 インドeクリニカルソリューションの市場分析
10.11 オーストラリアeクリニカルソリューションの市場分析
10.12 韓国 eクリニカルソリューションの市場分析
10.13 その他のアジア太平洋地域のeクリニカルソリューションの市場分析
11 ラテンアメリカのeクリニカルソリューション市場分析
11.1 主要な調査結果
11.2 ラテンアメリカeクリニカルソリューション市場魅力度指数
11.3 ラテンアメリカeクリニカルソリューションの国別市場、2023年、2028年、2033年(US$ bn)
11.4 ラテンアメリカeクリニカルソリューションの国別市場規模の推定と予測
11.5 ラテンアメリカeクリニカルソリューションの製品タイプ別市場規模の推定と予測
11.6 ラテンアメリカeクリニカルソリューションの展開タイプ別市場規模の推定と予測
11.7 ラテンアメリカeクリニカルソリューションのエンドユーザー別市場規模の推定と予測
11.8 ブラジルeクリニカルソリューションの市場分析
11.9 メキシコのeクリニカルソリューションの市場分析
11.10 その他のラテンアメリカの地域 eクリニカルソリューションの市場分析
12 MEAのeクリニカルソリューション市場分析
12.1 キーファインディング
12.2 MEA eクリニカルソリューション市場魅力度指数
12.3 MEA eクリニカルソリューションの国別市場、2023年、2028年、2033年(US$ bn)
12.4 MEA eクリニカルソリューションの国別市場規模の推定と予測
12.5 MEA eクリニカルソリューションの製品タイプ別市場規模の推定と予測
12.6 MEA eクリニカルソリューションの展開タイプ別市場規模の推定と予測
12.7 MEA eクリニカルソリューションのエンドユーザー別市場規模の推定と予測
12.8 GCC eクリニカルソリューションの市場分析
12.9 南アフリカのeクリニカルソリューションの市場分析
12.10 その他のMEAのeクリニカルソリューションの市場分析
13 会社概要
13.1 競合他社の状況
13.2 IBM
13.2.1 企業スナップショット
13.2.2 会社概要
13.2.3 財務分析
13.2.3.1 収益、2018-2022年
13.2.3.2 地域別市場シェア、2022年
13.2.3.3 R&D費、2018年~2022年
13.2.4 製品ベンチマーキング
13.3 Oracle
13.3.1 企業スナップショット
13.3.2 会社概要
13.3.3 財務分析
13.3.3.1 収益、2017-2021年
13.3.3.2 地域別市場シェア、2021年
13.3.3.3 R&D費用(2017年~2021年
13.3.4 製品ベンチマーキング
13.3.5 戦略的な展望
13.4 IQVIA Inc.
13.4.1 企業スナップショット
13.4.2 会社概要
13.4.3 財務分析
13.4.3.1 収益、2018-2022年
13.4.3.2 地域別市場占有率、2022年
13.4.3.3 R&D費、2018年~2022年
13.4.4 製品ベンチマーキング
13.4.5 戦略的な展望
13.5 Veeva Systems
13.5.1 企業スナップショット
13.5.2 会社概要
13.5.3 財務分析
13.5.3.1 売上高、2018年~2022年
13.5.3.2 地域別市場占有率、2022年
13.5.3.3 R&D費、2018年~2022年
13.5.4 製品ベンチマーキング
13.5.5 戦略的な展望
13.6 Dassault Systèmes
13.6.1 企業スナップショット
13.6.2 会社概要
13.6.3 財務分析
13.6.3.1 収益、2017-2021年
13.6.3.2 地域別市場占有率、2021年
13.6.3.3 R&D費用(2017年~2021年
13.6.4 製品ベンチマーキング
13.6.5 戦略的な展望
13.7 Parexel International Corporation
13.7.1 企業スナップショット
13.7.2 会社概要
13.7.3 製品ベンチマーキング
13.7.4 戦略的な展望
13.8 Medrio, Inc.
13.8.1 企業スナップショット
13.8.2 会社概要
13.8.3 製品ベンチマーキング
13.8.4 戦略的な展望
13.9 Clario
13.9.1 企業スナップショット
13.9.2 会社概要
13.9.3 製品ベンチマーキング
13.9.4 戦略的な展望
13.10 Signant Health
13.10.1 企業スナップショット
13.10.2 会社概要
13.10.3 製品ベンチマーキング
13.10.4 戦略的な展望
13.11 eClinical Solutions LLC
13.11.1 企業スナップショット
13.11.2 会社概要
13.11.3 製品ベンチマーキング
13.11.4 戦略的な展望
14 結論と提言
14.1 ビジョンゲインからの結びの言葉
14.2 市場関係者への提言
表の一覧
Table 1 eClinical Solutions Market Snapshot, 2023 & 2033 (US$ billion, CAGR %)
Table 2 Global eClinical Solutions Market Forecast by Region 2023-2033 (US$ bn, AGR%, CAGR%): "V" Shaped Recovery
Table 3 Global eClinical Solutions Market Forecast by Region 2023-2033 (US$ bn, AGR%, CAGR%): "U" Shaped Recovery
Table 4 Global eClinical Solutions Market Forecast by Region 2023-2033 (US$ bn, AGR%, CAGR%): "W" Shaped Recovery
Table 5 Global eClinical Solutions Market Forecast by Region 2023-2033 (US$ bn, AGR%, CAGR%): "L" Shaped Recovery
Table 6 Global eClinical Solutions Market Forecast by Product Type, 2023-2033 (US$ bn, AGR%, CAGR%)
Table 7 Clinical Trial Management Systems (CTMS) Market Forecast by Region, 2023-2033 (US$ bn, AGR%, CAGR%)
Table 8 Clinical Data Management Systems (CDMS) Market Forecast by Region, 2023-2033 (US$ bn, AGR%, CAGR%)
Table 9 Randomization and trial Supply Management Market Forecast by Region, 2023-2033 (US$ bn, AGR%, CAGR%)
Table 10 Electronic Clinical Outcome Assessments (eCOA) and Electronic Patient-reported Outcomes (ePRO) Market Forecast by Region, 2023-2033 (US$ bn, AGR%, CAGR%)
Table 11 Clinical Data Integration Platform Market Forecast by Region, 2023-2033 (US$ bn, AGR%, CAGR%)
Table 12 Electronic Data Capture (EDC) Market Forecast by Region, 2023-2033 (US$ bn, AGR%, CAGR%)
Table 13 Safety Solutions Market Forecast by Region, 2023-2033 (US$ bn, AGR%, CAGR%)
Table 14 Clinical Analytics Platforms Market Forecast by Region, 2023-2033 (US$ bn, AGR%, CAGR%)
Table 15 Electronic Trial Master File (eTMF) Market Forecast by Region, 2023-2033 (US$ bn, AGR%, CAGR%)
Table 16 Other Product Types Market Forecast by Region, 2023-2033 (US$ bn, AGR%, CAGR%)
Table 17 Global eClinical Solutions Market Forecast by Deployment Type, 2023-2033 (US$ bn, AGR%, CAGR%)
Table 18 Cloud-based (SAAS) Solutions Market Forecast by Region, 2023-2033 (US$ bn, AGR%, CAGR%)
Table 19 Web-hosted (On-demand) Solutions Market Forecast by Region, 2023-2033 (US$ bn, AGR%, CAGR%)
Table 20 Licensed Enterprise (On-premises) Solutions Market Forecast by Region, 2023-2033 (US$ bn, AGR%, CAGR%)
Table 21 Global eClinical Solutions Market Forecast by End-users, 2023-2033 (US$ bn, AGR%, CAGR%)
Table 22 Pharmaceutical and Biopharmaceutical Companies Market Forecast by Region, 2023-2033 (US$ bn, AGR%, CAGR%)
Table 23 Contract Research Organizations Market Forecast by Region, 2023-2033 (US$ bn, AGR%, CAGR%)
Table 24 Consulting Service Companies Market Forecast by Region, 2023-2033 (US$ bn, AGR%, CAGR%)
Table 25 Hospitals & Clinics Market Forecast by Region, 2023-2033 (US$ bn, AGR%, CAGR%)
Table 26 Medical Device Manufacturers Market Forecast by Region, 2023-2033 (US$ bn, AGR%, CAGR%)
Table 27 Others Market Forecast by Region, 2023-2033 (US$ bn, AGR%, CAGR%)
Table 28 Global eClinical Solutions Market Forecast by Region, 2023-2033 (US$ bn, AGR%, CAGR%)
Table 29 North America eClinical Solutions Market Forecast by Country, 2023-2033 (US$ bn, AGR%, CAGR%)
Table 30 North America eClinical Solutions Market Forecast by Product Type, 2023-2033 (US$ bn, AGR%, CAGR%)
Table 31 North America eClinical Solutions Market Forecast by Deployment Type, 2023-2033 (US$ bn, AGR%, CAGR%)
Table 32 North America eClinical Solutions Market Forecast by End-users, 2023-2033 (US$ bn, AGR%, CAGR%)
Table 33 U.S. eClinical Solutions Market Forecast, 2023-2033 (US$ bn, AGR%, CAGR%)
Table 34 Canada eClinical Solutions Market Forecast, 2023-2033 (US$ bn, AGR%, CAGR%)
Table 35 Europe eClinical Solutions Market Forecast by Country, 2023-2033 (US$ bn, AGR%, CAGR%)
Table 36 Europe eClinical Solutions Market Forecast by Product Type, 2023-2033 (US$ bn, AGR%, CAGR%)
Table 37 Europe eClinical Solutions Market Forecast by Deployment Type, 2023-2033 (US$ bn, AGR%, CAGR%)
Table 38 Europe eClinical Solutions Market Forecast by End-users, 2023-2033 (US$ bn, AGR%, CAGR%)
Table 39 Germany eClinical Solutions Market Forecast, 2023-2033 (US$ bn, AGR%, CAGR%)
Table 40 France eClinical Solutions Market Forecast, 2023-2033 (US$ bn, AGR%, CAGR%)
Table 41 UK eClinical Solutions Market Forecast, 2023-2033 (US$ bn, AGR%, CAGR%)
Table 42 Italy eClinical Solutions Market Forecast, 2023-2033 (US$ bn, AGR%, CAGR%)
Table 43 Spain eClinical Solutions Market Forecast, 2023-2033 (US$ bn, AGR%, CAGR%)
Table 44 Rest of Europe eClinical Solutions Market Forecast, 2023-2033 (US$ bn, AGR%, CAGR%)
Table 45 Asia Pacific eClinical Solutions Market Forecast by Country, 2023-2033 (US$ bn, AGR%, CAGR%)
Table 46 Asia Pacific eClinical Solutions Market Forecast by Product Type, 2023-2033 (US$ bn, AGR%, CAGR%)
Table 47 Asia Pacific eClinical Solutions Market Forecast by Deployment Type, 2023-2033 (US$ bn, AGR%, CAGR%)
Table 48 Asia Pacific eClinical Solutions Market Forecast by End-users, 2023-2033 (US$ bn, AGR%, CAGR%)
Table 49 China eClinical Solutions Market Forecast, 2023-2033 (US$ bn, AGR%, CAGR%)
Table 50 Japan eClinical Solutions Market Forecast, 2023-2033 (US$ bn, AGR%, CAGR%)
Table 51 India eClinical Solutions Market Forecast, 2023-2033 (US$ bn, AGR%, CAGR%)
Table 52 Australia eClinical Solutions Market Forecast, 2023-2033 (US$ bn, AGR%, CAGR%)
Table 53 South Korea eClinical Solutions Market Forecast, 2023-2033 (US$ bn, AGR%, CAGR%)
Table 54 Rest of Asia Pacific eClinical Solutions Market Forecast, 2023-2033 (US$ bn, AGR%, CAGR%)
Table 55 Latin America eClinical Solutions Market Forecast by Country, 2023-2033 (US$ bn, AGR%, CAGR%)
Table 56 Latin America eClinical Solutions Market Forecast by Product Type, 2023-2033 (US$ bn, AGR%, CAGR%)
Table 57 Latin America eClinical Solutions Market Forecast by Deployment Type, 2023-2033 (US$ bn, AGR%, CAGR%)
Table 58 Latin America eClinical Solutions Market Forecast by End-users, 2023-2033 (US$ bn, AGR%, CAGR%)
Table 59 Brazil eClinical Solutions Market Forecast, 2023-2033 (US$ bn, AGR%, CAGR%)
Table 60 Mexico eClinical Solutions Market Forecast, 2023-2033 (US$ bn, AGR%, CAGR%)
Table 61 Rest of Latin America eClinical Solutions Market Forecast, 2023-2033 (US$ bn, AGR%, CAGR%)
Table 62 MEA eClinical Solutions Market Forecast by Country, 2023-2033 (US$ bn, AGR%, CAGR%)
Table 63 MEA eClinical Solutions Market Forecast by Product Type, 2023-2033 (US$ bn, AGR%, CAGR%)
Table 64 MEA eClinical Solutions Market Forecast by Deployment Type, 2023-2033 (US$ bn, AGR%, CAGR%)
Table 65 MEA eClinical Solutions Market Forecast by End-users, 2023-2033 (US$ bn, AGR%, CAGR%)
Table 66 GCC eClinical Solutions Market Forecast, 2023-2033 (US$ bn, AGR%, CAGR%)
Table 67 South Africa eClinical Solutions Market Forecast, 2023-2033 (US$ bn, AGR%, CAGR%)
Table 68 Rest of MEA eClinical Solutions Market Forecast, 2023-2033 (US$ bn, AGR%, CAGR%)
Table 69 IBM: Key Details, (CEO, HQ, Revenue, Founded, No. of Employees, Company Type, Website, Business Segment)
Table 70 IBM: Product Benchmarking
Table 71 Oracle: Key Details, (CEO, HQ, Revenue, Founded, No. of Employees, Company Type, Website, Business Segment)
Table 72 Oracle: Product Benchmarking
Table 73 Oracle: Strategic Outlook
Table 74 IQVIA Inc: Key Details, (CEO, HQ, Revenue, Founded, No. of Employees, Company Type, Website, Business Segment)
Table 75 IQVIA Inc: Product Benchmarking
Table 76 IQVIA Inc: Strategic Outlook
Table 77 Veeva Systems: Key Details, (CEO, HQ, Revenue, Founded, No. of Employees, Company Type, Website, Business Segment)
Table 78 Veeva Systems: Product Benchmarking
Table 79 Veeva Systems: Strategic Outlook
Table 80 Dassault Systèmes: Key Details, (CEO, HQ, Revenue, Founded, No. of Employees, Company Type, Website, Business Segment)
Table 81 Dassault Systèmes: Product Benchmarking
Table 82 Dassault Systèmes: Strategic Outlook
Table 83 Parexel International Corporation: Key Details, (CEO, HQ, Revenue, Founded, No. of Employees, Company Type, Website, Business Segment)
Table 84 Parexel International Corporation.: Product Benchmarking
Table 85 Dassault Systèmes: Strategic Outlook
Table 86 Medrio, Inc.: Key Details, (CEO, HQ, Revenue, Founded, No. of Employees, Company Type, Website, Business Segment)
Table 87 Medrio, Inc.: Product Benchmarking
Table 88 Dassault Systèmes: Strategic Outlook
Table 89 Clario: Key Details, (CEO, HQ, Revenue, Founded, No. of Employees, Company Type, Website, Business Segment)
Table 90 Clario: Product Benchmarking
Table 91 Dassault Systèmes: Strategic Outlook
Table 92 Signant Health: Key Details, (CEO, HQ, Revenue, Founded, No. of Employees, Company Type, Website, Business Segment)
Table 93 Signant Health: Product Benchmarking
Table 94 Dassault Systèmes: Strategic Outlook
Table 95 eClinical Solutions LLC: Key Details, (CEO, HQ, Revenue, Founded, No. of Employees, Company Type, Website, Business Segment)
Table 96 eClinical Solutions LLC: Product Benchmarking
Table 97 eClinical Solutions LLC: Strategic Outlook
図の一覧
Figure 1 eClinical Solutions Market Segmentation
Figure 2 eClinical Solutions Market by Product Type: Market Attractiveness Index
Figure 3 eClinical Solutions Market Forecast by Deployment Type: Market Attractiveness Index
Figure 4 eClinical Solutions Market Forecast by End-users: Market Attractiveness Index
Figure 5 eClinical Solutions Market Attractiveness Index by Region
Figure 6 eClinical Solutions Market: Market Dynamics
Figure 7 eClinical Solutions Market by Region, 2023-2033 (US$ bn, AGR (%), CAGR (%)): “V” Shaped Recovery
Figure 8 eClinical Solutions Market by Region, 2023-2033 (US$ bn, AGR (%), CAGR (%)): “U” Shaped Recovery
Figure 9 eClinical Solutions Market by Region, 2023-2033 (US$ bn, AGR (%), CAGR (%)): “W” Shaped Recovery
Figure 10 eClinical Solutions Market by Region, 2023-2033 (US$ bn, AGR (%), CAGR (%)): “L” Shaped Recovery
Figure 11 eClinical Solutions Market: Porter’s Five Forces Analysis
Figure 12 eClinical Solutions Market Forecast by Product Type: Market Attractiveness Index
Figure 13 eClinical Solutions Market Forecast By Product Type, 2023-2033 (US$ bn)
Figure 14 eClinical Solutions Market Share Forecast by Product Type, 2023, 2028, 2033 (%)
Figure 15 Clinical Trial Management Systems (CTMS) Market Forecast by Region, 2023 2033 (US$ bn)
Figure 16 Clinical Trial Management Systems (CTMS) Market Share Forecast by Region, 2023 & 2033 (%)
Figure 17 Clinical Data Management Systems (CDMS) Market Forecast by Region, 2023-2033 (US$ bn)
Figure 18 Clinical Data Management Systems (CDMS) Market Share Forecast by Region, 2023 & 2033 (%)
Figure 19 Randomization and Trial Supply Management Market Forecast by Region, 2023-2033 (US$ bn)
Figure 20 Randomization and Trial Supply Management Market Share Forecast by Region, 2023 & 2033 (%)
Figure 21 Electronic Clinical Outcome Assessments (eCOA) and Electronic Patient-reported Outcomes (ePRO) Market Forecast by Region, 2023-2033 (US$ bn)
Figure 22 Electronic Clinical Outcome Assessments (eCOA) and Electronic Patient-reported Outcomes (ePRO) Market Share Forecast by Region, 2023 & 2033 (%)
Figure 23 Clinical Data Integration Platform Market Forecast by Region, 2023-2033 (US$ bn)
Figure 24 Clinical Data Integration Platform Market Share Forecast by Region, 2023 & 2033 (%)
Figure 25 Electronic Data Capture (EDC) Market Forecast by Region, 2023-2033 (US$ bn)
Figure 26 Electronic Data Capture (EDC) Market Share Forecast by Region, 2023 & 2033 (%)
Figure 27 Safety solutions Market Forecast by Region, 2023-2033 (US$ bn)
Figure 28 Safety solutions Market Share Forecast by Region, 2023 & 2033 (%)
Figure 29 Clinical Analytics Platforms Market Forecast by Region, 2023-2033 (US$ bn)
Figure 30 Clinical Analytics Platforms Market Share Forecast by Region, 2023 & 2033 (%)
Figure 31 Electronic Trial Master File (eTMF) Market Forecast by Region, 2023-2033 (US$ bn)
Figure 32 Electronic Trial Master File (eTMF) Market Share Forecast by Region, 2023 & 2033 (%)
Figure 33 Others Market Forecast by Region, 2023-2033 (US$ bn)
Figure 34 Others Market Share Forecast by Region, 2023 & 2033 (%)
Figure 35 eClinical Solutions Market Forecast by Deployment Type: Market Attractiveness Index
Figure 36 eClinical Solutions Market Forecast By Deployment Type, 2023-2033 (US$ bn)
Figure 37 eClinical Solutions Market Share Forecast by Deployment Type, 2023, 2028, 2033 (%)
Figure 38 Cloud-based (SAAS) Solutions Market Forecast by Region, 2023-2033 (US$ bn)
Figure 39 Cloud-based (SAAS) Solutions Market Share Forecast by Region, 2023 & 2033 (%)
Figure 40 Web-hosted (On-demand) Solutions Market Forecast by Region, 2023-2033 (US$ bn)
Figure 41 Web-hosted (On-demand) Solutions Market Share Forecast by Region, 2023 & 2033 (%)
Figure 42 Licensed Enterprise (On-premises) Solutions Market Forecast by Region, 2023-2033 (US$ bn)
Figure 43 Licensed Enterprise (On-premises) Solutions Market Share Forecast by Region, 2023 & 2033 (%)
Figure 44 eClinical Solutions Market Forecast by End-users: Market Attractiveness Index
Figure 45 eClinical Solutions Market Forecast By End-users, 2023-2033 (US$ bn)
Figure 46 eClinical Solutions Market Share Forecast by End-users, 2023, 2028, 2033 (%)
Figure 47 Pharmaceutical and Biopharmaceutical Companies Market Forecast by Region, 2023-2033 (US$ bn)
Figure 48 Pharmaceutical and Biopharmaceutical Companies Market Share Forecast by Region, 2023 & 2033 (%)
Figure 49 Contract Research Organizations Market Forecast by Region, 2023-2033 (US$ bn)
Figure 50 Contract Research Organizations Market Share Forecast by Region, 2023 & 2033 (%)
Figure 51 Consulting Service Companies Market Forecast by Region, 2023-2033 (US$ bn)
Figure 52 Consulting Service Companies Market Share Forecast by Region, 2023 & 2033 (%)
Figure 53 Hospitals and Clinics Market Forecast by Region, 2023-2033 (US$ bn)
Figure 54 Hospitals and Clinics Market Share Forecast by Region, 2023 & 2033 (%)
Figure 55 Medical Device Manufacturers Market Forecast by Region, 2023-2033 (US$ bn)
Figure 56 Medical Device Manufacturers Market Share Forecast by Region, 2023 & 2033 (%)
Figure 57 Others Market Forecast by Region, 2023-2033 (US$ bn)
Figure 58 Others Market Share Forecast by Region, 2023 & 2033 (%)
Figure 59 eClinical Solutions Market Forecast by Region 2023 & 2033 (Revenue, CAGR%)
Figure 60 eClinical Solutions Market Share Forecast by Region 2023, 2028, 2033(%)
Figure 61 eClinical Solutions Market by Region, 2023-2033 (US$ bn, AGR (%), CAGR (%))
Figure 62 North America eClinical Solutions Market Attractiveness Index
Figure 63 North America eClinical Solutions Market by Region, 2023, 2028 & 2033 (US$ bn)
Figure 64 North America eClinical Solutions Market Forecast by Country, 2023-2033 (US$ bn)
Figure 65 North America eClinical Solutions Market Share Forecast by Country, 2023 & 2033 (%)
Figure 66 North America eClinical Solutions Market Forecast by Product Type, 2023-2033 (US$ bn)
Figure 67 North America eClinical Solutions Market Share Forecast by Type, 2023 & 2033 (%)
Figure 68 North America eClinical Solutions Market Forecast by Deployment Type, 2023-2033 (US$ bn)
Figure 69 North America eClinical Solutions Market Share Forecast by Deployment Type, 2023 & 2033 (%)
Figure 70 North America eClinical Solutions Market Forecast by End-users, 2023-2033 (US$ bn)
Figure 71 North America eClinical Solutions Market Share Forecast by End-users, 2023 & 2033 (%)
Figure 72 U.S. eClinical Solutions Market Forecast, 2023-2033 (US$ bn, AGR %)
Figure 73 Canada eClinical Solutions Market Forecast, 2023-2033 (US$ bn, AGR %)
Figure 74 Europe eClinical Solutions Market Attractiveness Index
Figure 75 Europe eClinical Solutions Market by Region, 2023, 2028 & 2033 (US$ bn)
Figure 76 Europe eClinical Solutions Market Forecast by Country, 2023-2033 (US$ bn)
Figure 77 Europe eClinical Solutions Market Share Forecast by Country, 2023 & 2033 (%)
Figure 78 Europe eClinical Solutions Market Forecast by Product Type, 2023-2033 (US$ bn)
Figure 79 Europe eClinical Solutions Market Share Forecast by Product Type, 2023 & 2033 (%)
Figure 80 Europe eClinical Solutions Market Forecast by Deployment Type, 2023-2033 (US$ bn)
Figure 81 Europe eClinical Solutions Market Share Forecast by Deployment Type, 2023 & 2033 (%)
Figure 82 Europe eClinical Solutions Market Forecast by End-users, 2023-2033 (US$ bn)
Figure 83 Europe eClinical Solutions Market Share Forecast by End-users, 2023 & 2033 (%)
Figure 84 Germany eClinical Solutions Market Forecast, 2023-2033 (US$ bn, AGR %)
Figure 85 France Clinical Trial Packaging and Labelling Market Forecast, 2023-2033 (US$ bn, AGR %)
Figure 86 UK eClinical Solutions Market Forecast, 2023-2033 (US$ bn, AGR %)
Figure 87 Italy eClinical Solutions Market Forecast, 2023-2033 (US$ bn, AGR %)
Figure 88 Spain eClinical Solutions Market Forecast, 2023-2033 (US$ bn, AGR %)
Figure 89 Rest of Europe eClinical Solutions Market Forecast, 2023-2033 (US$ bn, AGR %)
Figure 90 Asia Pacific eClinical Solutions Market Attractiveness Index
Figure 91 Asia Pacific eClinical Solutions Market by Region, 2023, 2028 & 2033 (US$ bn)
Figure 92 Asia Pacific eClinical Solutions Market Forecast by Country, 2023-2033 (US$ bn)
Figure 93 Asia Pacific eClinical Solutions Market Share Forecast by Country, 2023 & 2033 (%)
Figure 94 Asia Pacific eClinical Solutions Market Forecast by Product Type, 2023-2033 (US$ bn)
Figure 95 Asia Pacific eClinical Solutions Market Share Forecast by Product Type, 2023 & 2033 (%)
Figure 96 Asia Pacific eClinical Solutions Market Forecast by Deployment Type, 2023-2033 (US$ bn)
Figure 97 Asia Pacific eClinical Solutions Market Share Forecast by Deployment Type, 2023 & 2033 (%)
Figure 98 Asia Pacific eClinical Solutions Market Forecast by End-users, 2023-2033 (US$ bn)
Figure 99 Asia Pacific eClinical Solutions Market Share Forecast by End-users, 2023 & 2038 (%)
Figure 100 China eClinical Solutions Market Forecast, 2023-2033 (US$ bn, AGR %)
Figure 101 Japan eClinical Solutions Market Forecast, 2023-2033 (US$ bn, AGR %)
Figure 102 India eClinical Solutions Market Forecast, 2023-2033 (US$ bn, AGR %)
Figure 103 Australia eClinical Solutions Market Forecast, 2023-2033 (US$ bn, AGR %)
Figure 104 South Korea eClinical Solutions Market Forecast, 2023-2033 (US$ bn, AGR %)
Figure 105 Rest of Asia Pacific eClinical Solutions Market Forecast, 2023-2033 (US$ bn, AGR %)
Figure 106 Latin America eClinical Solutions Market Attractiveness Index
Figure 107 Latin America eClinical Solutions Market by Region, 2023, 2028 & 2033 (US$ bn)
Figure 108 Latin America eClinical Solutions Market Forecast by Country, 2023-2033 (US$ bn)
Figure 109 Latin America eClinical Solutions Market Share Forecast by Country, 2023 & 2033 (%)
Figure 110 Latin America eClinical Solutions Market Forecast by Product Type, 2023-2033 (US$ bn)
Figure 111 Latin America eClinical Solutions Market Share Forecast by Product Type, 2023 & 2033 (%)
Figure 112 Latin America eClinical Solutions Market Forecast by Deployment Type, 2023-2033 (US$ bn)
Figure 113 Latin America eClinical Solutions Market Share Forecast by Deployment Type, 2023 & 2033 (%)
Figure 114 Latin America eClinical Solutions Market Forecast by End-users, 2023-2033 (US$ bn)
Figure 115 Latin America eClinical Solutions Market Share Forecast by End-users, 2023 & 2038 (%)
Figure 116 Brazil eClinical Solutions Market Forecast, 2023-2033 (US$ bn, AGR %)
Figure 117 Mexico eClinical Solutions Market Forecast, 2023-2033 (US$ bn, AGR %)
Figure 118 Rest of Latin America eClinical Solutions Market Forecast, 2023-2033 (US$ bn, AGR %)
Figure 119 MEA eClinical Solutions Market Attractiveness Index
Figure 120 MEA eClinical Solutions Market by Region, 2023, 2028 & 2033 (US$ bn)
Figure 121 MEA eClinical Solutions Market Forecast by Country, 2023-2033 (US$ bn)
Figure 122 MEA eClinical Solutions Market Share Forecast by Country, 2023 & 2033 (%)
Figure 123 MEA eClinical Solutions Market Forecast by Product Type, 2023-2033 (US$ bn)
Figure 124 MEA eClinical Solutions Market Share Forecast by Product Type, 2023 & 2033 (%)
Figure 125 MEA eClinical Solutions Market Forecast by Deployment Type, 2023-2033 (US$ bn)
Figure 126 MEA eClinical Solutions Market Share Forecast by Deployment Type, 2023 & 2033 (%)
Figure 127 MEA eClinical Solutions Market Forecast by End-users, 2023-2033 (US$ bn)
Figure 128 MEA eClinical Solutions Market Share Forecast by End-users, 2023 & 2033 (%)
Figure 129 GCC eClinical Solutions Market Forecast, 2023-2033 (US$ bn, AGR %)
Figure 130 South Africa eClinical Solutions Market Forecast, 2023-2033 (US$ bn, AGR %)
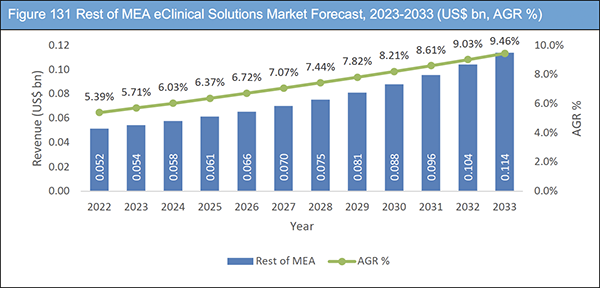
Figure 131 Rest of MEA eClinical Solutions Market Forecast, 2023-2033 (US$ bn, AGR %)
Figure 132 eClinical Solutions Market: Company Share Analysis
Figure 133 IBM: Revenue, 2018-2022 (US$ Million, AGR%)
Figure 134 IBM: Regional Market Shares, 2022
Figure 135 IBM: R&D Expense, 2018-2022 (US$ million, AGR%)
Figure 136 Oracle: Revenue, 2017-2021 (US$ Million, AGR%)
Figure 137 Oracle: Regional Market Shares, 2021
Figure 138 Oracle: R&D Expense, 2017-2021 (US$ million, AGR%)
Figure 139 IQVIA Inc: Annual Revenue, 2018-2022 (US$ million, AGR%)
Figure 140 IQVIA Inc: Regional Market Shares, 2022
Figure 141 IQVIA Inc: R&D Expense, 2018-2022 (US$ million, AGR%)
Figure 142 Veeva Systems: Revenue, 2018-2022 (US$ Million, AGR%)
Figure 143 Veeva Systems: Regional Market Shares, 2022
Figure 144 Veeva Systems: R&D Expense, 2018-2022 (US$ million, AGR%)
Figure 145 Dassault Systèmes: Revenue, 2017-2021 (US$ Million, AGR%)
Figure 146 Dassault Systèmes: Regional Market Shares, 2021
Figure 147 Dassault Systèmes: R&D Expense, 2017-2021 (US$ million, AGR%)
ページTOPに戻る
Summary
Report Details
The eClinical solutions Market Report 2023-2033: This report will prove invaluable to leading firms striving for new revenue pockets if they wish to better understand the industry and its underlying dynamics. It will be useful for companies that would like to expand into different industries or to expand their existing operations in a new region.
Rising Adoption of Electronic Data Capture (EDC) Systems in Clinical Trials to Spur Industry Growth
The market for eClinical solutions is expanding significantly as a result of the increased use of electronic data capture (EDC) systems in clinical trials. EDC systems have a number of advantages over conventional paper-based data collection techniques, including:
• Increased accuracy and efficiency
• Improved data quality
• Enhanced patient safety
• Enhanced data management
• Cost savings
Companies using EDC systems in clinical trials include Pfizer, AstraZeneca, and Novartis. These companies have reported increased efficiency and data quality, as well as improved patient safety and cost savings, as a result of their use of EDC systems.
High Installation Costs Likely to Challenge Industry Growth
One of the main factors limiting the growth of the eClinical solutions market is the high installation cost. The implementation of eClinical solutions typically requires a significant investment in hardware, software, and personnel, which can be a challenge for some organisations, particularly those with limited budgets.
In addition to the upfront costs, the ongoing maintenance and support costs for eClinical solutions can also be high, as organisations must continuously invest in technology upgrades, security measures, and other infrastructure improvements.
Despite these challenges, many organisations are choosing to invest in eClinical solutions due to the numerous benefits they provide, including improved data accuracy, increased efficiency, and compliance with regulatory requirements.
What Questions Should You Ask before Buying a Market Research Report?
• How is the eClinical solutions market evolving?
• What is driving and restraining the eClinical solutions market?
• How will each eClinical solutions submarket segment grow over the forecast period and how much revenue will these submarkets account for in 2033?
• How will the market shares for each eClinical solutions submarket develop from 2023 to 2033?
• What will be the main driver for the overall market from 2023 to 2033?
• Will leading eClinical solutions markets broadly follow the macroeconomic dynamics, or will individual national markets outperform others?
• How will the market shares of the national markets change by 2033 and which geographical region will lead the market in 2033?
• Who are the leading players and what are their prospects over the forecast period?
• How will the industry evolve during the period between 2020 and 2033? What are the implications of eClinical solutions projects taking place now and over the next 10 years?
• Is there a greater need for product commercialisation to further scale the eClinical solutions market?
• Where is the eClinical solutions market heading and how can you ensure you are at the forefront of the market?
• What are the best investment options for new product and service lines?
• What are the key prospects for moving companies into a new growth path and C-suite?
You need to discover how this will impact the eClinical solutions market today, and over the next 10 years:
• Our 254-page report provides 97 tables and 147 charts/graphs exclusively to you.
• The report highlights key lucrative areas in the industry so you can target them – NOW.
• It contains in-depth analysis of global, regional and national sales and growth.
• It highlights for you the key successful trends, changes and revenue projections made by your competitors.
This report tells you TODAY how the eClinical solutions market will develop in the next 10 years, and in line with the variations in COVID-19 economic recession and bounce. This market is more critical now than at any point over the last 10 years.
Forecasts to 2033 and other analyses reveal commercial prospects
• In addition to revenue forecasting to 2033, our new study provides you with recent results, growth rates, and market shares.
• You will find original analyses, with business outlooks and developments.
• Discover qualitative analyses (including market dynamics, drivers, opportunities, restraints and challenges), cost structure, impact of rising eClinical solutions prices and recent developments.
This report includes data analysis and invaluable insight into how COVID-19 will affect the industry and your company. Four COVID-19 recovery patterns and their impact, namely, “V”, “L”, “W” and “U” are discussed in this report.
Segments Covered in the Report
Product Type
• Clinical Trial Management Systems (CTMS)
• Clinical Data Management Systems (CDMS)
• Randomisation and Trial Supply Management (RTSM)
• Electronic Clinical Outcome Assessments (eCOA) and Electronic Patient-reported Outcomes (ePRO)
• Clinical Data Integration Platform (CDIP)
• Electronic Data Capture (EDC)
• Safety Solutions
• Clinical Analytics Platforms
• Electronic Trial Master File (eTMF)
• Others
Deployment Type
• Cloud-based (SAAS) Solutions
• Web-hosted (On-demand) Solutions
• Licensed Enterprise (On-premises) Solutions
End-users
• Pharmaceutical and Biopharmaceutical Companies
• Contract Research Organisations
• Consulting Service Companies
• Medical Device Manufacturers
• Hospitals and Clinics
• Others
In addition to the revenue predictions for the overall world market and segments, you will also find revenue forecasts for four regional and 20 leading national markets:
North America
• U.S.
• Canada
Europe
• Germany
• France
• UK
• Italy
• Spain
• Rest of Europe
Asia Pacific
• China
• Japan
• India
• Australia
• South Korea
• Rest of Asia Pacific
Latin America
• Brazil
• Mexico
• Rest of Latin America
MEA
• GCC
• South Africa
• Rest of MEA
The report also includes profiles and for some of the leading companies in the eClinical solutions Market, 2023 to 2033, with a focus on this segment of these companies’ operations.
Leading companies and the potential for market growth
• Clario
• Dassault Systèmes
• eClinical Solutions LLC
• IBM
• IQVIA Inc.
• Medrio, Inc.
• Oracle
• Parexel International Corporation
• Signant Health
• Veeva Systems
Overall world revenue for eClinical solutions market, 2023 to 2033 in terms of value the market will surpass US$8.9 billion in 2023, our work calculates. We predict strong revenue growth through to 2033. Our work identifies which organisations hold the greatest potential. Discover their capabilities, progress, and commercial prospects, helping you stay ahead.
How will the eClinical solutions market, 2023 to 2033 report help you?
In summary, our 250+ page report provides you with the following knowledge:
• Revenue forecasts to 2033 for eClinical solutions market, 2023 to 2033 Market, with forecasts for product type, deployment type, and end users, each forecast at a global and regional level – discover the industry’s prospects, finding the most lucrative places for investments and revenues.
• Revenue forecasts to 2033 for four regional and 20 key national markets – See forecasts for the eClinical solutions Market, 2023 to 2033 market in North America, Europe, Asia-Pacific, Latin America and MEA. Also forecasted is the market in the US, Canada, Mexico, Brazil, Germany, France, UK, Italy, China, India, Japan, and Australia among other prominent economies.
• Prospects for established firms and those seeking to enter the market – including company profiles for 20 of the major companies involved in the eClinical solutions Market, 2023 to 2033.
Find quantitative and qualitative analyses with independent predictions. Receive information that only our report contains, staying informed with invaluable business intelligence.
Information found nowhere else
With our new report, you are less likely to fall behind in knowledge or miss out on opportunities. See how our work could benefit your research, analyses, and decisions. Visiongain’s study is for everybody needing commercial analyses for the eClinical solutions market, 2023 to 2033, market-leading companies. You will find data, trends and predictions.
ページTOPに戻る
Table of Contents
Table of Contents
1 Report Overview
1.1 Objectives of the Study
1.2 Introduction to eClinical Solutions Market
1.3 What This Report Delivers
1.4 Why You Should Read This Report
1.5 Key Questions Answered by This Analytical Report
1.6 Who is This Report for?
1.7 Methodology
1.7.1 Market Definitions
1.7.2 Market Evaluation & Forecasting Methodology
1.7.3 Data Validation
1.7.3.1 Primary Research
1.7.3.2 Secondary Research
1.8 Frequently Asked Questions (FAQs)
1.9 Associated Visiongain Reports
1.10 About Visiongain
2 Executive Summary
3 Market Overview
3.1 Key Findings
3.2 Market Dynamics
3.2.1 Market Driving Factors
3.2.1.1 Increased Adoption of Electronic Data Capture (EDC) Systems In Clinical Trials
3.2.1.2 Rise in Clinical Trial Outsourcing
3.2.1.3 Growing Demand for Real-Time Data Analysis
3.2.1.4 Technological Advancements
3.2.2 Market Restraining Factors
3.2.2.1 High Implementation Costs
3.2.2.2 Data Security and Privacy Concerns
3.2.2.3 Limited Availability of Skilled Professional
3.2.3 Market Opportunities
3.2.3.1 Expansion into Emerging Markets
3.2.3.2 Increasing Demand for Patient-centric Solutions
3.2.3.3 Development of New Solutions
3.3 COVID-19 Impact Analysis
3.4 Porter’s Five Forces Analysis
3.4.1 Bargaining Power of Suppliers
3.4.2 Bargaining Power of Buyers
3.4.3 Competitive Rivalry
3.4.4 Threat from Substitutes
3.4.5 Threat of New Entrants
3.5 PEST Analysis
3.5.1 Political
3.5.2 Economical
3.5.3 Social
3.5.4 Technological
4 eClinical Solutions Market Analysis by Product Type
4.1 Key Findings
4.2 Product Type Segment: Market Attractiveness Index
4.3 eClinical Solutions Market Size Estimation and Forecast by Product Type
4.4 Clinical Trial Management Systems (CTMS)
4.4.1 Market Size by Region, 2023-2033 (US$ bn)
4.4.2 Market Share by Region, 2023 & 2033 (%)
4.5 Clinical Data Management Systems (CDMS)
4.5.1 Market Size by Region, 2023-2033 (US$ bn)
4.5.2 Market Share by Region, 2023 & 2033 (%)
4.6 Randomization and Trial Supply Management (RTSM)
4.6.1 Market Size by Region, 2023-2033 (US$ bn)
4.6.2 Market Share by Region, 2023 & 2033 (%)
4.7 Electronic Clinical Outcome Assessments (eCOA) and Electronic Patient-reported Outcomes (ePRO)
4.7.1 Market Size by Region, 2023-2033 (US$ bn)
4.7.2 Market Share by Region, 2023 & 2033 (%)
4.8 Clinical Data Integration Platform (CDIP)
4.8.1 Market Size by Region, 2023-2033 (US$ bn)
4.8.2 Market Share by Region, 2023 & 2033 (%)
4.9 Electronic Data Capture (EDC)
4.9.1 Market Size by Region, 2023-2033 (US$ bn)
4.9.2 Market Share by Region, 2023 & 2033 (%)
4.10 Safety solutions
4.10.1 Market Size by Region, 2023-2033 (US$ bn)
4.10.2 Market Share by Region, 2023 & 2033 (%)
4.11 Clinical Analytics Platforms
4.11.1 Market Size by Region, 2023-2033 (US$ bn)
4.11.2 Market Share by Region, 2023 & 2033 (%)
4.12 Electronic Trial Master File (eTMF)
4.12.1 Market Size by Region, 2023-2033 (US$ bn)
4.12.2 Market Share by Region, 2023 & 2033 (%)
4.13 Others
4.13.1 Market Size by Region, 2023-2033 (US$ bn)
4.13.2 Market Share by Region, 2023 & 2033 (%)
5 eClinical Solutions Market Analysis by Deployment Type
5.1 Key Findings
5.2 Deployment type Segment: Market Attractiveness Index
5.3 eClinical Solutions Market Size Estimation and Forecast by Deployment Type
5.4 Cloud-based (SAAS) Solutions
5.4.1 Market Size by Region, 2023-2033 (US$ bn)
5.4.2 Market Share by Region, 2023 & 2033 (%)
5.5 Web-hosted (On-Demand) Solutions
5.5.1 Market Size by Region, 2023-2033 (US$ bn)
5.5.2 Market Share by Region, 2023 & 2033 (%)
5.6 Licensed Enterprise (On-premises) Solutions
5.6.1 Market Size by Region, 2023-2033 (US$ bn)
5.6.2 Market Share by Region, 2023 & 2033 (%)
6 eClinical Solutions Market Analysis by End-users
6.1 Key Findings
6.2 End-users Segment: Market Attractiveness Index
6.3 eClinical Solutions Market Size Estimation and Forecast by End-users
6.4 Pharmaceutical and Biopharmaceutical Companies
6.4.1 Market Size by Region, 2023-2033 (US$ bn)
6.4.2 Market Share by Region, 2023 & 2033 (%)
6.5 Contract Research Organizations
6.5.1 Market Size by Region, 2023-2033 (US$ bn)
6.5.2 Market Share by Region, 2023 & 2033 (%)
6.6 Consulting Service Companies
6.6.1 Market Size by Region, 2023-2033 (US$ bn)
6.6.2 Market Share by Region, 2023 & 2033 (%)
6.7 Hospitals and Clinics
6.7.1 Market Size by Region, 2023-2033 (US$ bn)
6.7.2 Market Share by Region, 2023 & 2033 (%)
6.8 Medical Device Manufacturers
6.8.1 Market Size by Region, 2023-2033 (US$ bn)
6.8.2 Market Share by Region, 2023 & 2033 (%)
6.9 Others
6.9.1 Market Size by Region, 2023-2033 (US$ bn)
6.9.2 Market Share by Region, 2023 & 2033 (%)
7 eClinical Solutions Market Analysis by Region
7.1 Key Findings
7.2 Regional Market Size Estimation and Forecast
8 North America eClinical Solutions Market Analysis
8.1 Key Findings
8.2 North America eClinical Solutions Market Attractiveness Index
8.3 North America eClinical Solutions Market by Country, 2023, 2028 & 2033 (US$ bn)
8.4 North America eClinical Solutions Market Size Estimation and Forecast by Country
8.5 North America eClinical Solutions Market Size Estimation and Forecast by Product Type
8.6 North America eClinical Solutions Market Size Estimation and Forecast by Deployment Type
8.7 North America eClinical Solutions Market Size Estimation and Forecast by End-users
8.8 U.S. eClinical Solutions Market Analysis
8.9 Canada eClinical Solutions Market Analysis
9 Europe eClinical Solutions Market Analysis
9.1 Key Findings
9.2 Europe eClinical Solutions Market Attractiveness Index
9.3 Europe eClinical Solutions Market by Country, 2023, 2028 & 2033 (US$ bn)
9.4 Europe eClinical Solutions Market Size Estimation and Forecast by Country
9.5 Europe eClinical Solutions Market Size Estimation and Forecast by Product Type
9.6 Europe eClinical Solutions Market Size Estimation and Forecast by Deployment Type
9.7 Europe eClinical Solutions Market Size Estimation and Forecast by End-users
9.8 Germany eClinical Solutions Market Analysis
9.9 France eClinical Solutions Market Analysis
9.10 UK eClinical Solutions Market Analysis
9.11 Italy eClinical Solutions Market Analysis
9.12 Spain eClinical Solutions Market Analysis
9.13 Rest of Europe eClinical Solutions Market Analysis
10 Asia Pacific eClinical Solutions Market Analysis
10.1 Key Findings
10.2 Asia Pacific eClinical Solutions Market Attractiveness Index
10.3 Asia Pacific eClinical Solutions Market by Country, 2023, 2028 & 2033 (US$ bn)
10.4 Asia Pacific eClinical Solutions Market Size Estimation and Forecast by Country
10.5 Asia Pacific eClinical Solutions Market Size Estimation and Forecast by Product Type
10.6 Asia Pacific eClinical Solutions Market Size Estimation and Forecast by Deployment Type
10.7 Asia Pacific eClinical Solutions Market Size Estimation and Forecast by End-users
10.8 China eClinical Solutions Market Analysis
10.9 Japan eClinical Solutions Market Analysis
10.10 India eClinical Solutions Market Analysis
10.11 Australia eClinical Solutions Market Analysis
10.12 South Korea eClinical Solutions Market Analysis
10.13 Rest of Asia Pacific eClinical Solutions Market Analysis
11 Latin America eClinical Solutions Market Analysis
11.1 Key Findings
11.2 Latin America eClinical Solutions Market Attractiveness Index
11.3 Latin America eClinical Solutions Market by Country, 2023, 2028 & 2033 (US$ bn)
11.4 Latin America eClinical Solutions Market Size Estimation and Forecast by Country
11.5 Latin America eClinical Solutions Market Size Estimation and Forecast by Product Type
11.6 Latin America eClinical Solutions Market Size Estimation and Forecast by Deployment Type
11.7 Latin America eClinical Solutions Market Size Estimation and Forecast by End-users
11.8 Brazil eClinical Solutions Market Analysis
11.9 Mexico eClinical Solutions Market Analysis
11.10 Rest of Latin America eClinical Solutions Market Analysis
12 MEA eClinical Solutions Market Analysis
12.1 Key Findings
12.2 MEA eClinical Solutions Market Attractiveness Index
12.3 MEA eClinical Solutions Market by Country, 2023, 2028 & 2033 (US$ bn)
12.4 MEA eClinical Solutions Market Size Estimation and Forecast by Country
12.5 MEA eClinical Solutions Market Size Estimation and Forecast by Product Type
12.6 MEA eClinical Solutions Market Size Estimation and Forecast by Deployment Type
12.7 MEA eClinical Solutions Market Size Estimation and Forecast by End-users
12.8 GCC eClinical Solutions Market Analysis
12.9 South Africa eClinical Solutions Market Analysis
12.10 Rest of MEA eClinical Solutions Market Analysis
13 Company Profiles
13.1 Competitive Landscape
13.2 IBM
13.2.1 Company Snapshot
13.2.2 Company Overview
13.2.3 Financial Analysis
13.2.3.1 Revenue, 2018-2022
13.2.3.2 Regional Market Shares, 2022
13.2.3.3 R&D Expense, 2018-2022
13.2.4 Product Benchmarking
13.3 Oracle
13.3.1 Company Snapshot
13.3.2 Company Overview
13.3.3 Financial Analysis
13.3.3.1 Revenue, 2017-2021
13.3.3.2 Regional Market Shares, 2021
13.3.3.3 R&D Expense, 2017-2021
13.3.4 Product Benchmarking
13.3.5 Strategic Outlook
13.4 IQVIA Inc.
13.4.1 Company Snapshot
13.4.2 Company Overview
13.4.3 Financial Analysis
13.4.3.1 Revenue, 2018-2022
13.4.3.2 Regional Market Shares, 2022
13.4.3.3 R&D Expense, 2018-2022
13.4.4 Product Benchmarking
13.4.5 Strategic Outlook
13.5 Veeva Systems
13.5.1 Company Snapshot
13.5.2 Company Overview
13.5.3 Financial Analysis
13.5.3.1 Revenue, 2018-2022
13.5.3.2 Regional Market Shares, 2022
13.5.3.3 R&D Expense, 2018-2022
13.5.4 Product Benchmarking
13.5.5 Strategic Outlook
13.6 Dassault Systèmes
13.6.1 Company Snapshot
13.6.2 Company Overview
13.6.3 Financial Analysis
13.6.3.1 Revenue, 2017-2021
13.6.3.2 Regional Market Shares, 2021
13.6.3.3 R&D Expense, 2017-2021
13.6.4 Product Benchmarking
13.6.5 Strategic Outlook
13.7 Parexel International Corporation
13.7.1 Company Snapshot
13.7.2 Company Overview
13.7.3 Product Benchmarking
13.7.4 Strategic Outlook
13.8 Medrio, Inc.
13.8.1 Company Snapshot
13.8.2 Company Overview
13.8.3 Product Benchmarking
13.8.4 Strategic Outlook
13.9 Clario
13.9.1 Company Snapshot
13.9.2 Company Overview
13.9.3 Product Benchmarking
13.9.4 Strategic Outlook
13.10 Signant Health
13.10.1 Company Snapshot
13.10.2 Company Overview
13.10.3 Product Benchmarking
13.10.4 Strategic Outlook
13.11 eClinical Solutions LLC
13.11.1 Company Snapshot
13.11.2 Company Overview
13.11.3 Product Benchmarking
13.11.4 Strategic Outlook
14 Conclusion and Recommendations
14.1 Concluding Remarks from Visiongain
14.2 Recommendations for Market Players
List of Tables
Table 1 eClinical Solutions Market Snapshot, 2023 & 2033 (US$ billion, CAGR %)
Table 2 Global eClinical Solutions Market Forecast by Region 2023-2033 (US$ bn, AGR%, CAGR%): "V" Shaped Recovery
Table 3 Global eClinical Solutions Market Forecast by Region 2023-2033 (US$ bn, AGR%, CAGR%): "U" Shaped Recovery
Table 4 Global eClinical Solutions Market Forecast by Region 2023-2033 (US$ bn, AGR%, CAGR%): "W" Shaped Recovery
Table 5 Global eClinical Solutions Market Forecast by Region 2023-2033 (US$ bn, AGR%, CAGR%): "L" Shaped Recovery
Table 6 Global eClinical Solutions Market Forecast by Product Type, 2023-2033 (US$ bn, AGR%, CAGR%)
Table 7 Clinical Trial Management Systems (CTMS) Market Forecast by Region, 2023-2033 (US$ bn, AGR%, CAGR%)
Table 8 Clinical Data Management Systems (CDMS) Market Forecast by Region, 2023-2033 (US$ bn, AGR%, CAGR%)
Table 9 Randomization and trial Supply Management Market Forecast by Region, 2023-2033 (US$ bn, AGR%, CAGR%)
Table 10 Electronic Clinical Outcome Assessments (eCOA) and Electronic Patient-reported Outcomes (ePRO) Market Forecast by Region, 2023-2033 (US$ bn, AGR%, CAGR%)
Table 11 Clinical Data Integration Platform Market Forecast by Region, 2023-2033 (US$ bn, AGR%, CAGR%)
Table 12 Electronic Data Capture (EDC) Market Forecast by Region, 2023-2033 (US$ bn, AGR%, CAGR%)
Table 13 Safety Solutions Market Forecast by Region, 2023-2033 (US$ bn, AGR%, CAGR%)
Table 14 Clinical Analytics Platforms Market Forecast by Region, 2023-2033 (US$ bn, AGR%, CAGR%)
Table 15 Electronic Trial Master File (eTMF) Market Forecast by Region, 2023-2033 (US$ bn, AGR%, CAGR%)
Table 16 Other Product Types Market Forecast by Region, 2023-2033 (US$ bn, AGR%, CAGR%)
Table 17 Global eClinical Solutions Market Forecast by Deployment Type, 2023-2033 (US$ bn, AGR%, CAGR%)
Table 18 Cloud-based (SAAS) Solutions Market Forecast by Region, 2023-2033 (US$ bn, AGR%, CAGR%)
Table 19 Web-hosted (On-demand) Solutions Market Forecast by Region, 2023-2033 (US$ bn, AGR%, CAGR%)
Table 20 Licensed Enterprise (On-premises) Solutions Market Forecast by Region, 2023-2033 (US$ bn, AGR%, CAGR%)
Table 21 Global eClinical Solutions Market Forecast by End-users, 2023-2033 (US$ bn, AGR%, CAGR%)
Table 22 Pharmaceutical and Biopharmaceutical Companies Market Forecast by Region, 2023-2033 (US$ bn, AGR%, CAGR%)
Table 23 Contract Research Organizations Market Forecast by Region, 2023-2033 (US$ bn, AGR%, CAGR%)
Table 24 Consulting Service Companies Market Forecast by Region, 2023-2033 (US$ bn, AGR%, CAGR%)
Table 25 Hospitals & Clinics Market Forecast by Region, 2023-2033 (US$ bn, AGR%, CAGR%)
Table 26 Medical Device Manufacturers Market Forecast by Region, 2023-2033 (US$ bn, AGR%, CAGR%)
Table 27 Others Market Forecast by Region, 2023-2033 (US$ bn, AGR%, CAGR%)
Table 28 Global eClinical Solutions Market Forecast by Region, 2023-2033 (US$ bn, AGR%, CAGR%)
Table 29 North America eClinical Solutions Market Forecast by Country, 2023-2033 (US$ bn, AGR%, CAGR%)
Table 30 North America eClinical Solutions Market Forecast by Product Type, 2023-2033 (US$ bn, AGR%, CAGR%)
Table 31 North America eClinical Solutions Market Forecast by Deployment Type, 2023-2033 (US$ bn, AGR%, CAGR%)
Table 32 North America eClinical Solutions Market Forecast by End-users, 2023-2033 (US$ bn, AGR%, CAGR%)
Table 33 U.S. eClinical Solutions Market Forecast, 2023-2033 (US$ bn, AGR%, CAGR%)
Table 34 Canada eClinical Solutions Market Forecast, 2023-2033 (US$ bn, AGR%, CAGR%)
Table 35 Europe eClinical Solutions Market Forecast by Country, 2023-2033 (US$ bn, AGR%, CAGR%)
Table 36 Europe eClinical Solutions Market Forecast by Product Type, 2023-2033 (US$ bn, AGR%, CAGR%)
Table 37 Europe eClinical Solutions Market Forecast by Deployment Type, 2023-2033 (US$ bn, AGR%, CAGR%)
Table 38 Europe eClinical Solutions Market Forecast by End-users, 2023-2033 (US$ bn, AGR%, CAGR%)
Table 39 Germany eClinical Solutions Market Forecast, 2023-2033 (US$ bn, AGR%, CAGR%)
Table 40 France eClinical Solutions Market Forecast, 2023-2033 (US$ bn, AGR%, CAGR%)
Table 41 UK eClinical Solutions Market Forecast, 2023-2033 (US$ bn, AGR%, CAGR%)
Table 42 Italy eClinical Solutions Market Forecast, 2023-2033 (US$ bn, AGR%, CAGR%)
Table 43 Spain eClinical Solutions Market Forecast, 2023-2033 (US$ bn, AGR%, CAGR%)
Table 44 Rest of Europe eClinical Solutions Market Forecast, 2023-2033 (US$ bn, AGR%, CAGR%)
Table 45 Asia Pacific eClinical Solutions Market Forecast by Country, 2023-2033 (US$ bn, AGR%, CAGR%)
Table 46 Asia Pacific eClinical Solutions Market Forecast by Product Type, 2023-2033 (US$ bn, AGR%, CAGR%)
Table 47 Asia Pacific eClinical Solutions Market Forecast by Deployment Type, 2023-2033 (US$ bn, AGR%, CAGR%)
Table 48 Asia Pacific eClinical Solutions Market Forecast by End-users, 2023-2033 (US$ bn, AGR%, CAGR%)
Table 49 China eClinical Solutions Market Forecast, 2023-2033 (US$ bn, AGR%, CAGR%)
Table 50 Japan eClinical Solutions Market Forecast, 2023-2033 (US$ bn, AGR%, CAGR%)
Table 51 India eClinical Solutions Market Forecast, 2023-2033 (US$ bn, AGR%, CAGR%)
Table 52 Australia eClinical Solutions Market Forecast, 2023-2033 (US$ bn, AGR%, CAGR%)
Table 53 South Korea eClinical Solutions Market Forecast, 2023-2033 (US$ bn, AGR%, CAGR%)
Table 54 Rest of Asia Pacific eClinical Solutions Market Forecast, 2023-2033 (US$ bn, AGR%, CAGR%)
Table 55 Latin America eClinical Solutions Market Forecast by Country, 2023-2033 (US$ bn, AGR%, CAGR%)
Table 56 Latin America eClinical Solutions Market Forecast by Product Type, 2023-2033 (US$ bn, AGR%, CAGR%)
Table 57 Latin America eClinical Solutions Market Forecast by Deployment Type, 2023-2033 (US$ bn, AGR%, CAGR%)
Table 58 Latin America eClinical Solutions Market Forecast by End-users, 2023-2033 (US$ bn, AGR%, CAGR%)
Table 59 Brazil eClinical Solutions Market Forecast, 2023-2033 (US$ bn, AGR%, CAGR%)
Table 60 Mexico eClinical Solutions Market Forecast, 2023-2033 (US$ bn, AGR%, CAGR%)
Table 61 Rest of Latin America eClinical Solutions Market Forecast, 2023-2033 (US$ bn, AGR%, CAGR%)
Table 62 MEA eClinical Solutions Market Forecast by Country, 2023-2033 (US$ bn, AGR%, CAGR%)
Table 63 MEA eClinical Solutions Market Forecast by Product Type, 2023-2033 (US$ bn, AGR%, CAGR%)
Table 64 MEA eClinical Solutions Market Forecast by Deployment Type, 2023-2033 (US$ bn, AGR%, CAGR%)
Table 65 MEA eClinical Solutions Market Forecast by End-users, 2023-2033 (US$ bn, AGR%, CAGR%)
Table 66 GCC eClinical Solutions Market Forecast, 2023-2033 (US$ bn, AGR%, CAGR%)
Table 67 South Africa eClinical Solutions Market Forecast, 2023-2033 (US$ bn, AGR%, CAGR%)
Table 68 Rest of MEA eClinical Solutions Market Forecast, 2023-2033 (US$ bn, AGR%, CAGR%)
Table 69 IBM: Key Details, (CEO, HQ, Revenue, Founded, No. of Employees, Company Type, Website, Business Segment)
Table 70 IBM: Product Benchmarking
Table 71 Oracle: Key Details, (CEO, HQ, Revenue, Founded, No. of Employees, Company Type, Website, Business Segment)
Table 72 Oracle: Product Benchmarking
Table 73 Oracle: Strategic Outlook
Table 74 IQVIA Inc: Key Details, (CEO, HQ, Revenue, Founded, No. of Employees, Company Type, Website, Business Segment)
Table 75 IQVIA Inc: Product Benchmarking
Table 76 IQVIA Inc: Strategic Outlook
Table 77 Veeva Systems: Key Details, (CEO, HQ, Revenue, Founded, No. of Employees, Company Type, Website, Business Segment)
Table 78 Veeva Systems: Product Benchmarking
Table 79 Veeva Systems: Strategic Outlook
Table 80 Dassault Systèmes: Key Details, (CEO, HQ, Revenue, Founded, No. of Employees, Company Type, Website, Business Segment)
Table 81 Dassault Systèmes: Product Benchmarking
Table 82 Dassault Systèmes: Strategic Outlook
Table 83 Parexel International Corporation: Key Details, (CEO, HQ, Revenue, Founded, No. of Employees, Company Type, Website, Business Segment)
Table 84 Parexel International Corporation.: Product Benchmarking
Table 85 Dassault Systèmes: Strategic Outlook
Table 86 Medrio, Inc.: Key Details, (CEO, HQ, Revenue, Founded, No. of Employees, Company Type, Website, Business Segment)
Table 87 Medrio, Inc.: Product Benchmarking
Table 88 Dassault Systèmes: Strategic Outlook
Table 89 Clario: Key Details, (CEO, HQ, Revenue, Founded, No. of Employees, Company Type, Website, Business Segment)
Table 90 Clario: Product Benchmarking
Table 91 Dassault Systèmes: Strategic Outlook
Table 92 Signant Health: Key Details, (CEO, HQ, Revenue, Founded, No. of Employees, Company Type, Website, Business Segment)
Table 93 Signant Health: Product Benchmarking
Table 94 Dassault Systèmes: Strategic Outlook
Table 95 eClinical Solutions LLC: Key Details, (CEO, HQ, Revenue, Founded, No. of Employees, Company Type, Website, Business Segment)
Table 96 eClinical Solutions LLC: Product Benchmarking
Table 97 eClinical Solutions LLC: Strategic Outlook
List of Figures
Figure 1 eClinical Solutions Market Segmentation
Figure 2 eClinical Solutions Market by Product Type: Market Attractiveness Index
Figure 3 eClinical Solutions Market Forecast by Deployment Type: Market Attractiveness Index
Figure 4 eClinical Solutions Market Forecast by End-users: Market Attractiveness Index
Figure 5 eClinical Solutions Market Attractiveness Index by Region
Figure 6 eClinical Solutions Market: Market Dynamics
Figure 7 eClinical Solutions Market by Region, 2023-2033 (US$ bn, AGR (%), CAGR (%)): “V” Shaped Recovery
Figure 8 eClinical Solutions Market by Region, 2023-2033 (US$ bn, AGR (%), CAGR (%)): “U” Shaped Recovery
Figure 9 eClinical Solutions Market by Region, 2023-2033 (US$ bn, AGR (%), CAGR (%)): “W” Shaped Recovery
Figure 10 eClinical Solutions Market by Region, 2023-2033 (US$ bn, AGR (%), CAGR (%)): “L” Shaped Recovery
Figure 11 eClinical Solutions Market: Porter’s Five Forces Analysis
Figure 12 eClinical Solutions Market Forecast by Product Type: Market Attractiveness Index
Figure 13 eClinical Solutions Market Forecast By Product Type, 2023-2033 (US$ bn)
Figure 14 eClinical Solutions Market Share Forecast by Product Type, 2023, 2028, 2033 (%)
Figure 15 Clinical Trial Management Systems (CTMS) Market Forecast by Region, 2023 2033 (US$ bn)
Figure 16 Clinical Trial Management Systems (CTMS) Market Share Forecast by Region, 2023 & 2033 (%)
Figure 17 Clinical Data Management Systems (CDMS) Market Forecast by Region, 2023-2033 (US$ bn)
Figure 18 Clinical Data Management Systems (CDMS) Market Share Forecast by Region, 2023 & 2033 (%)
Figure 19 Randomization and Trial Supply Management Market Forecast by Region, 2023-2033 (US$ bn)
Figure 20 Randomization and Trial Supply Management Market Share Forecast by Region, 2023 & 2033 (%)
Figure 21 Electronic Clinical Outcome Assessments (eCOA) and Electronic Patient-reported Outcomes (ePRO) Market Forecast by Region, 2023-2033 (US$ bn)
Figure 22 Electronic Clinical Outcome Assessments (eCOA) and Electronic Patient-reported Outcomes (ePRO) Market Share Forecast by Region, 2023 & 2033 (%)
Figure 23 Clinical Data Integration Platform Market Forecast by Region, 2023-2033 (US$ bn)
Figure 24 Clinical Data Integration Platform Market Share Forecast by Region, 2023 & 2033 (%)
Figure 25 Electronic Data Capture (EDC) Market Forecast by Region, 2023-2033 (US$ bn)
Figure 26 Electronic Data Capture (EDC) Market Share Forecast by Region, 2023 & 2033 (%)
Figure 27 Safety solutions Market Forecast by Region, 2023-2033 (US$ bn)
Figure 28 Safety solutions Market Share Forecast by Region, 2023 & 2033 (%)
Figure 29 Clinical Analytics Platforms Market Forecast by Region, 2023-2033 (US$ bn)
Figure 30 Clinical Analytics Platforms Market Share Forecast by Region, 2023 & 2033 (%)
Figure 31 Electronic Trial Master File (eTMF) Market Forecast by Region, 2023-2033 (US$ bn)
Figure 32 Electronic Trial Master File (eTMF) Market Share Forecast by Region, 2023 & 2033 (%)
Figure 33 Others Market Forecast by Region, 2023-2033 (US$ bn)
Figure 34 Others Market Share Forecast by Region, 2023 & 2033 (%)
Figure 35 eClinical Solutions Market Forecast by Deployment Type: Market Attractiveness Index
Figure 36 eClinical Solutions Market Forecast By Deployment Type, 2023-2033 (US$ bn)
Figure 37 eClinical Solutions Market Share Forecast by Deployment Type, 2023, 2028, 2033 (%)
Figure 38 Cloud-based (SAAS) Solutions Market Forecast by Region, 2023-2033 (US$ bn)
Figure 39 Cloud-based (SAAS) Solutions Market Share Forecast by Region, 2023 & 2033 (%)
Figure 40 Web-hosted (On-demand) Solutions Market Forecast by Region, 2023-2033 (US$ bn)
Figure 41 Web-hosted (On-demand) Solutions Market Share Forecast by Region, 2023 & 2033 (%)
Figure 42 Licensed Enterprise (On-premises) Solutions Market Forecast by Region, 2023-2033 (US$ bn)
Figure 43 Licensed Enterprise (On-premises) Solutions Market Share Forecast by Region, 2023 & 2033 (%)
Figure 44 eClinical Solutions Market Forecast by End-users: Market Attractiveness Index
Figure 45 eClinical Solutions Market Forecast By End-users, 2023-2033 (US$ bn)
Figure 46 eClinical Solutions Market Share Forecast by End-users, 2023, 2028, 2033 (%)
Figure 47 Pharmaceutical and Biopharmaceutical Companies Market Forecast by Region, 2023-2033 (US$ bn)
Figure 48 Pharmaceutical and Biopharmaceutical Companies Market Share Forecast by Region, 2023 & 2033 (%)
Figure 49 Contract Research Organizations Market Forecast by Region, 2023-2033 (US$ bn)
Figure 50 Contract Research Organizations Market Share Forecast by Region, 2023 & 2033 (%)
Figure 51 Consulting Service Companies Market Forecast by Region, 2023-2033 (US$ bn)
Figure 52 Consulting Service Companies Market Share Forecast by Region, 2023 & 2033 (%)
Figure 53 Hospitals and Clinics Market Forecast by Region, 2023-2033 (US$ bn)
Figure 54 Hospitals and Clinics Market Share Forecast by Region, 2023 & 2033 (%)
Figure 55 Medical Device Manufacturers Market Forecast by Region, 2023-2033 (US$ bn)
Figure 56 Medical Device Manufacturers Market Share Forecast by Region, 2023 & 2033 (%)
Figure 57 Others Market Forecast by Region, 2023-2033 (US$ bn)
Figure 58 Others Market Share Forecast by Region, 2023 & 2033 (%)
Figure 59 eClinical Solutions Market Forecast by Region 2023 & 2033 (Revenue, CAGR%)
Figure 60 eClinical Solutions Market Share Forecast by Region 2023, 2028, 2033(%)
Figure 61 eClinical Solutions Market by Region, 2023-2033 (US$ bn, AGR (%), CAGR (%))
Figure 62 North America eClinical Solutions Market Attractiveness Index
Figure 63 North America eClinical Solutions Market by Region, 2023, 2028 & 2033 (US$ bn)
Figure 64 North America eClinical Solutions Market Forecast by Country, 2023-2033 (US$ bn)
Figure 65 North America eClinical Solutions Market Share Forecast by Country, 2023 & 2033 (%)
Figure 66 North America eClinical Solutions Market Forecast by Product Type, 2023-2033 (US$ bn)
Figure 67 North America eClinical Solutions Market Share Forecast by Type, 2023 & 2033 (%)
Figure 68 North America eClinical Solutions Market Forecast by Deployment Type, 2023-2033 (US$ bn)
Figure 69 North America eClinical Solutions Market Share Forecast by Deployment Type, 2023 & 2033 (%)
Figure 70 North America eClinical Solutions Market Forecast by End-users, 2023-2033 (US$ bn)
Figure 71 North America eClinical Solutions Market Share Forecast by End-users, 2023 & 2033 (%)
Figure 72 U.S. eClinical Solutions Market Forecast, 2023-2033 (US$ bn, AGR %)
Figure 73 Canada eClinical Solutions Market Forecast, 2023-2033 (US$ bn, AGR %)
Figure 74 Europe eClinical Solutions Market Attractiveness Index
Figure 75 Europe eClinical Solutions Market by Region, 2023, 2028 & 2033 (US$ bn)
Figure 76 Europe eClinical Solutions Market Forecast by Country, 2023-2033 (US$ bn)
Figure 77 Europe eClinical Solutions Market Share Forecast by Country, 2023 & 2033 (%)
Figure 78 Europe eClinical Solutions Market Forecast by Product Type, 2023-2033 (US$ bn)
Figure 79 Europe eClinical Solutions Market Share Forecast by Product Type, 2023 & 2033 (%)
Figure 80 Europe eClinical Solutions Market Forecast by Deployment Type, 2023-2033 (US$ bn)
Figure 81 Europe eClinical Solutions Market Share Forecast by Deployment Type, 2023 & 2033 (%)
Figure 82 Europe eClinical Solutions Market Forecast by End-users, 2023-2033 (US$ bn)
Figure 83 Europe eClinical Solutions Market Share Forecast by End-users, 2023 & 2033 (%)
Figure 84 Germany eClinical Solutions Market Forecast, 2023-2033 (US$ bn, AGR %)
Figure 85 France Clinical Trial Packaging and Labelling Market Forecast, 2023-2033 (US$ bn, AGR %)
Figure 86 UK eClinical Solutions Market Forecast, 2023-2033 (US$ bn, AGR %)
Figure 87 Italy eClinical Solutions Market Forecast, 2023-2033 (US$ bn, AGR %)
Figure 88 Spain eClinical Solutions Market Forecast, 2023-2033 (US$ bn, AGR %)
Figure 89 Rest of Europe eClinical Solutions Market Forecast, 2023-2033 (US$ bn, AGR %)
Figure 90 Asia Pacific eClinical Solutions Market Attractiveness Index
Figure 91 Asia Pacific eClinical Solutions Market by Region, 2023, 2028 & 2033 (US$ bn)
Figure 92 Asia Pacific eClinical Solutions Market Forecast by Country, 2023-2033 (US$ bn)
Figure 93 Asia Pacific eClinical Solutions Market Share Forecast by Country, 2023 & 2033 (%)
Figure 94 Asia Pacific eClinical Solutions Market Forecast by Product Type, 2023-2033 (US$ bn)
Figure 95 Asia Pacific eClinical Solutions Market Share Forecast by Product Type, 2023 & 2033 (%)
Figure 96 Asia Pacific eClinical Solutions Market Forecast by Deployment Type, 2023-2033 (US$ bn)
Figure 97 Asia Pacific eClinical Solutions Market Share Forecast by Deployment Type, 2023 & 2033 (%)
Figure 98 Asia Pacific eClinical Solutions Market Forecast by End-users, 2023-2033 (US$ bn)
Figure 99 Asia Pacific eClinical Solutions Market Share Forecast by End-users, 2023 & 2038 (%)
Figure 100 China eClinical Solutions Market Forecast, 2023-2033 (US$ bn, AGR %)
Figure 101 Japan eClinical Solutions Market Forecast, 2023-2033 (US$ bn, AGR %)
Figure 102 India eClinical Solutions Market Forecast, 2023-2033 (US$ bn, AGR %)
Figure 103 Australia eClinical Solutions Market Forecast, 2023-2033 (US$ bn, AGR %)
Figure 104 South Korea eClinical Solutions Market Forecast, 2023-2033 (US$ bn, AGR %)
Figure 105 Rest of Asia Pacific eClinical Solutions Market Forecast, 2023-2033 (US$ bn, AGR %)
Figure 106 Latin America eClinical Solutions Market Attractiveness Index
Figure 107 Latin America eClinical Solutions Market by Region, 2023, 2028 & 2033 (US$ bn)
Figure 108 Latin America eClinical Solutions Market Forecast by Country, 2023-2033 (US$ bn)
Figure 109 Latin America eClinical Solutions Market Share Forecast by Country, 2023 & 2033 (%)
Figure 110 Latin America eClinical Solutions Market Forecast by Product Type, 2023-2033 (US$ bn)
Figure 111 Latin America eClinical Solutions Market Share Forecast by Product Type, 2023 & 2033 (%)
Figure 112 Latin America eClinical Solutions Market Forecast by Deployment Type, 2023-2033 (US$ bn)
Figure 113 Latin America eClinical Solutions Market Share Forecast by Deployment Type, 2023 & 2033 (%)
Figure 114 Latin America eClinical Solutions Market Forecast by End-users, 2023-2033 (US$ bn)
Figure 115 Latin America eClinical Solutions Market Share Forecast by End-users, 2023 & 2038 (%)
Figure 116 Brazil eClinical Solutions Market Forecast, 2023-2033 (US$ bn, AGR %)
Figure 117 Mexico eClinical Solutions Market Forecast, 2023-2033 (US$ bn, AGR %)
Figure 118 Rest of Latin America eClinical Solutions Market Forecast, 2023-2033 (US$ bn, AGR %)
Figure 119 MEA eClinical Solutions Market Attractiveness Index
Figure 120 MEA eClinical Solutions Market by Region, 2023, 2028 & 2033 (US$ bn)
Figure 121 MEA eClinical Solutions Market Forecast by Country, 2023-2033 (US$ bn)
Figure 122 MEA eClinical Solutions Market Share Forecast by Country, 2023 & 2033 (%)
Figure 123 MEA eClinical Solutions Market Forecast by Product Type, 2023-2033 (US$ bn)
Figure 124 MEA eClinical Solutions Market Share Forecast by Product Type, 2023 & 2033 (%)
Figure 125 MEA eClinical Solutions Market Forecast by Deployment Type, 2023-2033 (US$ bn)
Figure 126 MEA eClinical Solutions Market Share Forecast by Deployment Type, 2023 & 2033 (%)
Figure 127 MEA eClinical Solutions Market Forecast by End-users, 2023-2033 (US$ bn)
Figure 128 MEA eClinical Solutions Market Share Forecast by End-users, 2023 & 2033 (%)
Figure 129 GCC eClinical Solutions Market Forecast, 2023-2033 (US$ bn, AGR %)
Figure 130 South Africa eClinical Solutions Market Forecast, 2023-2033 (US$ bn, AGR %)
Figure 131 Rest of MEA eClinical Solutions Market Forecast, 2023-2033 (US$ bn, AGR %)
Figure 132 eClinical Solutions Market: Company Share Analysis
Figure 133 IBM: Revenue, 2018-2022 (US$ Million, AGR%)
Figure 134 IBM: Regional Market Shares, 2022
Figure 135 IBM: R&D Expense, 2018-2022 (US$ million, AGR%)
Figure 136 Oracle: Revenue, 2017-2021 (US$ Million, AGR%)
Figure 137 Oracle: Regional Market Shares, 2021
Figure 138 Oracle: R&D Expense, 2017-2021 (US$ million, AGR%)
Figure 139 IQVIA Inc: Annual Revenue, 2018-2022 (US$ million, AGR%)
Figure 140 IQVIA Inc: Regional Market Shares, 2022
Figure 141 IQVIA Inc: R&D Expense, 2018-2022 (US$ million, AGR%)
Figure 142 Veeva Systems: Revenue, 2018-2022 (US$ Million, AGR%)
Figure 143 Veeva Systems: Regional Market Shares, 2022
Figure 144 Veeva Systems: R&D Expense, 2018-2022 (US$ million, AGR%)
Figure 145 Dassault Systèmes: Revenue, 2017-2021 (US$ Million, AGR%)
Figure 146 Dassault Systèmes: Regional Market Shares, 2021
Figure 147 Dassault Systèmes: R&D Expense, 2017-2021 (US$ million, AGR%)
ページTOPに戻る
本レポートと同じKEY WORD()の最新刊レポート
- 本レポートと同じKEY WORDの最新刊レポートはありません。
よくあるご質問
Visiongain社はどのような調査会社ですか?
英国の調査会社ヴィジョンゲイン社(Visiongain)は、通信とエネルギーのほか、自動車や化学・医薬品、金属など、広範な市場を対象に調査を行っています。自動車市場については、市場全般に関する調査のほ... もっと見る
調査レポートの納品までの日数はどの程度ですか?
在庫のあるものは速納となりますが、平均的には 3-4日と見て下さい。
但し、一部の調査レポートでは、発注を受けた段階で内容更新をして納品をする場合もあります。
発注をする前のお問合せをお願いします。
注文の手続きはどのようになっていますか?
1)お客様からの御問い合わせをいただきます。
2)見積書やサンプルの提示をいたします。
3)お客様指定、もしくは弊社の発注書をメール添付にて発送してください。
4)データリソース社からレポート発行元の調査会社へ納品手配します。
5) 調査会社からお客様へ納品されます。最近は、pdfにてのメール納品が大半です。
お支払方法の方法はどのようになっていますか?
納品と同時にデータリソース社よりお客様へ請求書(必要に応じて納品書も)を発送いたします。
お客様よりデータリソース社へ(通常は円払い)の御振り込みをお願いします。
請求書は、納品日の日付で発行しますので、翌月最終営業日までの当社指定口座への振込みをお願いします。振込み手数料は御社負担にてお願いします。
お客様の御支払い条件が60日以上の場合は御相談ください。
尚、初めてのお取引先や個人の場合、前払いをお願いすることもあります。ご了承のほど、お願いします。
データリソース社はどのような会社ですか?
当社は、世界各国の主要調査会社・レポート出版社と提携し、世界各国の市場調査レポートや技術動向レポートなどを日本国内の企業・公官庁及び教育研究機関に提供しております。
世界各国の「市場・技術・法規制などの」実情を調査・収集される時には、データリソース社にご相談ください。
お客様の御要望にあったデータや情報を抽出する為のレポート紹介や調査のアドバイスも致します。
|
|

