サマリー
レポート詳細
スリープテック市場レポート 2023-2033:本レポートは、新たな収益源の開拓を目指すリーディングカンパニーにとって、業界とその基礎となる力学をより深く理解する上で、非常に貴重なものとなるでしょう。また、異業種への進出や新地域での既存事業の拡大を目指す企業にとっても有益なレポートです。
スリープテック分野への投資とイノベーションが産業の成長を促進する
世界のスリープテックの展望は、この分野への投資、革新、成長の増加の傾向を示しています。スリープテックの機器や製品は、消費者のニーズや需要の変化に対応するため、より高度で多様なものになりつつあります。スマート寝具からウェアラブル睡眠トラッキングデバイスまで、選択肢はより洗練され、大衆がアクセスできるようになってきています。睡眠の重要性と、それが健康やウェルビーイング全般に与える影響についての認識が高まり、スリープテック・ソリューションへの関心が高まっています。消費者が睡眠の質と量を改善しようとするため、このことがスリープテック市場の成長を促しています。また、人工知能(AI)や機械学習(ML)などの技術の進歩が、より効果的な睡眠ソリューションの開発に活かされていることも、市場を牽引しています。継続的なイノベーションにより、スリープテックの未来は有望であり、今後数年間はさらなる成長が期待されます。
マーケットリサーチレポートを購入する前に、どのような質問をするべきか?
- スリープテック市場はどのように進化しているのか?
- スリープテック市場を牽引し、抑制しているものは何か?
- スリープテックサブマーケットの各セグメントは予測期間中にどのように成長し、2033年にこれらのサブマーケットが占める売上はどの程度になるのか?
- 2023年から2033年にかけて、スリープテックサブマーケットごとの市場シェアはどのように推移するのか?
- 2023年から2033年にかけて、市場全体の主な牽引役となるのは何か?
- 主要なスリープテック市場は、マクロ経済ダイナミクスに幅広く追随するのか、それとも個々の国別市場が他を凌駕するのか?
- 2033年までに各国市場のシェアはどのように変化し、2033年に市場をリードするのはどの地域か?
- 主要プレイヤーは誰で、予測期間中の見通しはどうなっているのか?
- これらの主要企業のスリープテックプロジェクトは何か?
- 2023年から2033年の間に、業界はどのように進化していくのか?現在および今後10年間に行われるスリープ・テック・プロジェクトにはどのような意味があるのでしょうか?
- スリープテック市場をさらに拡大するために、製品の商業化の必要性は高まっているのか?
- スリープテック市場の方向性と、市場の最前線に立つためにはどうすればよいか?
- 新製品やサービスラインへの最適な投資方法は何か?
- 企業を新たな成長軌道に乗せ、C-suiteに移行させるための重要な展望は何か?
このことが、現在、そして今後10年間のスリープテック市場にどのような影響を与えるかを見極める必要があります:
- 274ページにわたる本レポートでは、115の表と157のチャート/グラフを独占的に提供します。
- 本レポートでは、業界における主要な収益性の高い分野を取り上げているため、今すぐその分野をターゲットにすることができます。
- 世界、地域、国の売上高と成長率を詳細に分析しています。
- 競合他社が成功した主要なトレンド、変化、収益予測をハイライトしています。
本レポートは、スリープテック市場が今後10年間にどのように発展するか、またCOVID-19の景気後退やバウンスの変動に合わせて、今日あなたにお伝えします。この市場は、過去10年間のどの時点よりも今が重要です。
2033年までの予測やその他の分析により、商業的な展望を明らかにする。
- 今回の調査では、2033年までの収益予測に加え、直近の実績、成長率、市場シェアも掲載しています。
- ビジネスの展望や展開など、独自の分析がご覧いただけます。
- 定性的な分析(市場力学、促進要因、機会、阻害要因、課題など)、コスト構造、スリープテック価格上昇の影響、最近の動向などをご覧いただけます。
本レポートでは、COVID-19が業界や貴社にどのような影響を与えるかについて、データ分析および貴重な知見を提供しています。COVID-19の4つの回収パターン、すなわち「V」「L」「W」「U」の回収パターンとその影響について考察しています。
報告書の対象セグメント
製品
・ ウェアラブル
- スマートウォッチ・バンド
- その他ウェアラブル
・ ノンウェアラブル
・ ベッド
・ スリープモニタ
・ その他非装着品
流通チャネル
- Direct to Consumer(DtC
- ホスピタルネットワークス
- スペシャリティクリニックネットワークス
- その他の流通チャネル
性別
・ 男性
- < 18
- 18-36
- 37-55
- > 55
・ 女性
- < 18
- 18-36
- 37-55
- > 55
アプリケーション
- 不眠症
- 閉塞性睡眠時無呼吸症候群
- ナルコレプシー
- 持続陽圧呼吸療法 (CPAP)
- レストレスレッグス症候群(RLS)
- その他の用途
世界市場全体およびセグメントの収益予測に加え、4地域および主要20カ国市場の収益予測も掲載しています:
北米
- U.S.
- カナダ
欧州
- ドイツ
- スペイン
- イギリス
- フランス
- イタリア
- その他の欧州地域
アジア太平洋
- 中国
- 日本
- インド
- オーストラリア
- 韓国
- その他のアジア太平洋地域
ラテンアメリカ
- ブラジル
- メキシコ
- その他のラテンアメリカ地域
中近東・アフリカ
- サウジアラビア
- トルコ
- 南アフリカ
- その他の中東・アフリカ地域
スリープテック市場の2023年から2033年にかけての主要企業のプロファイルと、これらの企業のこのセグメントに焦点を当てたいくつかの企業についても報告しています。
主要企業と市場成長の可能性
・ Beddit (Apple)
・ Casper Sleep
・ Compumedics Limited
・ Eight Sleep
・ Koninklijke Philips N.V.( Philips)
・ Nihon Kohden Corporation
・ Oura Health Oy
・ ResMed
・ Sleepace
・ Xiaomi Corporation
スリープテック市場の世界全体の収益、金額ベースで2023年から2033年まで、市場は2023年に180億米ドルを突破すると、私たちの仕事は計算されます。2033年まで収益が大きく伸びることが予測されます。当社の調査では、最も大きな可能性を秘めた企業を特定しています。彼らの能力、進歩、商業的展望を発見することで、先手を打つことができます。
スリープテック市場、2023年から2033年までのレポートはどのように役立つのでしょうか?
まとめると、370ページを超えるレポートでは、以下のような知識を得ることができます:
- スリープテック市場、2023年から2033年までの収益予測ウェアラブル、ノンウェアラブル、流通チャネル、性別、用途、企業規模の各予測を世界および地域レベルで掲載 - 業界の展望を発見し、投資と収益のための最も有利な場所を見つけることができます。
- 4つの地域と20の主要国市場の2033年までの収益予測 - Sleep Tech Market, 2023 to 2033の北米、欧州、アジア太平洋、ラテンアメリカ、中東&アフリカの市場予測をご覧いただけます。また、米国、カナダ、ブラジル、ドイツ、フランス、英国、イタリア、中国、インド、日本、オーストラリアなど、著名な経済圏の市場も予測しています。
- 既存企業および市場参入を目指す企業の展望 - Sleep Tech市場に関わる主要企業10社の企業プロファイルを含む、2023年から2033年までの予測。
独自の予測による定量・定性分析をご覧いただけます。私たちのレポートだけが持つ情報を入手し、貴重なビジネスインテリジェンスとして情報を得ることができます。
他にはない情報
私たちの新しいレポートがあれば、知識に遅れをとったり、チャンスを逃したりする可能性は低くなります。私たちの仕事があなたの調査、分析、意思決定にどのように役立つかをご覧ください。Visiongainの調査は、スリープテック市場、2023年から2033年、市場をリードする企業の商業分析を必要とするすべての人のためのものです。データ、トレンド、予測をご覧いただけます。
ページTOPに戻る
目次
目次
1 レポートの概要
1.1 研究の目的
1.2 スリープテック市場の紹介
1.3 この報告書がもたらすもの
1.4 本レポートを読むべき理由
1.本分析レポートが回答する5つの重要な質問
1.6 本レポートは誰のためのものか?
1.7 調査方法
1.7.1 市場の定義
1.7.2 市場評価・予測手法
1.7.3 データバリデーション
1.8 よくある質問(FAQ)
1.9 関連するVisiongainのレポート
1.10 ビジョンゲインについて
2 エグゼクティブサマリー
3 市場の概要
3.1 キーファインディング
3.2 マーケットダイナミクス
3.2.1 市場促進要因
3.2.2 市場の抑制要因
3.2.3 マーケットオポチュニティ
3.3 サプライチェーン
3.4 バリューチェーン
3.4.1 主要な活動
3.4.2 サポート活動
3.5 COVID-19の影響度分析
3.6 ポーターのファイブフォース分析
3.6.1 サプライヤーパワー
3.6.2 バイヤーパワー
3.6.3 競争力のあるライバル
3.6.4 代替品による脅威
3.6.5 新規参入の脅威
3.7 PEST分析
3.7.1 政治的要因
3.7.2 経済的要因
3.7.3 社会的要因
3.7.4 技術的要因
3.7.5 環境要素
3.7.6 法的側面
4 スリープテック市場分析:ウェアラブル別
4.1 キーファインディング
4.2 ウェアラブルセグメント:市場魅力度指数
4.3 スリープテック市場のウェアラブル別シェア、2023年&2033年
4.4 ウェアラブルによるスリープテック市場
4.5 スマートウォッチとブランド
4.5.1 地域別市場規模、2023-2033年(US$ Bn)
4.5.2 2023年&2033年地域別市場シェア(%)
4.6 その他のウェアラブル
4.6.1 地域別市場シェア、2023年&2033年(US$ Bn)
4.6.2 2023年&2033年地域別市場シェア(%)
5 スリープテック市場分析:ノンウェアラブル別
5.1 キーファインディング
5.2 非ウェアラブルセグメント:市場魅力度指数
5.3 スリープテック市場ノンウェアラブル別シェア、2023年&2033年
5.4 スリープテック市場ノンウェアラブル別
5.5 ベッド
5.5.1 地域別市場シェア、2023年&2033年(US$ Bn)
5.5.2 2023年&2033年地域別市場シェア(%)
5.6 スリープモニタ
5.6.1 地域別市場シェア、2023年&2033年(US$ Bn)
5.6.2 2023年&2033年地域別市場シェア(%)
5.7 その他ノンウェアラブル
5.7.1 地域別市場シェア、2023年&2033年(US$ Bn)
5.7.2 2023年&2033年地域別市場シェア(%)
6 スリープテック市場分析:流通チャネル別
6.1 キーファインディング
6.2 流通チャネルセグメント:市場魅力度指数
6.3 スリープテック市場流通チャネル別シェア、2023年&2033年
6.4 スリープテック市場:流通チャネル別
6.5 Direct-to-Consumer (DTC)
6.5.1 地域別市場シェア、2023年&2033年(US$ Bn)
6.5.2 2023年&2033年地域別市場シェア(%)
6.6 ホスピタルネットワーク
6.6.1 地域別市場シェア、2023年&2033年(US$ Bn)
6.6.2 2023年&2033年地域別市場シェア(%)
6.7 スペシャリティクリニックネットワーク
6.7.1 地域別市場シェア、2023年&2033年(US$ Bn)
6.7.2 2023年&2033年地域別市場シェア(%)
6.8 その他の流通経路
6.8.1 地域別市場シェア、2023年&2033年(US$ Bn)
6.8.2 2023年&2033年地域別市場シェア(%)
7 スリープテック市場分析:男性年齢層別
7.1 キーファインディング
7.2 男性年齢層セグメント:市場魅力度指数
7.3 スリープテックの男性年齢層別市場シェア、2023年&2033年
7.4 スリープテック市場:男性年齢層別
7.5 男性 55歳 解析
7.8.1 地域別市場シェア、2023年&2033年(US$ Bn)
7.8.2 2023年&2033年地域別市場シェア(%)
8 スリープテック市場分析:女性年齢層別
8.1 キーファインディング
8.2 女性の年齢層別セグメント:市場魅力度指数
8.3 スリープテック市場の女性年齢層別シェア、2023年&2033年
8.4 スリープテック市場:女性年齢層別
8.5 エイジ55の分析
8.8.1 地域別市場シェア、2023年&2033年(US$ Bn)
8.8.2 2023年&2033年地域別市場シェア(%)
9 スリープテックの市場分析:用途別
9.1 キーファインディング
9.2 用途別セグメント:市場魅力度指数
9.3 スリープテックの用途別市場シェア、2023年&2033年
9.3.1 スリープテックの用途別市場
9.4 不眠症
9.4.1 地域別市場シェア、2023年&2033年(US$ Bn)
9.4.2 2023年&2033年地域別市場シェア(%)
9.5 閉塞性睡眠時無呼吸症候群
9.5.1 地域別市場シェア、2023年&2033年(US$ Bn)
9.5.2 2023年&2033年地域別市場シェア(%)
9.6 ナルコレプシー
9.6.1 地域別市場シェア、2023年&2033年(US$ Bn)
9.6.2 2023年&2033年地域別市場シェア(%)
9.7 持続陽圧呼吸療法(CPAP)
9.7.1 地域別市場シェア、2023年&2033年(US$ Bn)
9.7.2 2023年&2033年地域別市場シェア(%)
9.8 レストレスレッグス症候群 (RLS)
9.8.1 地域別市場シェア、2023年&2033年(US$ Bn)
9.8.2 2023年&2033年地域別市場シェア(%)
9.9 その他の用途
9.9.1 地域別市場シェア、2023年&2033年(US$ Bn)
9.9.2 2023年&2033年地域別市場シェア(%)
10 スリープテック市場分析:地域別
10.1 キーファインディング
10.2 スリープテック市場の地域別市場魅力度指数
10.3 スリープテックの地域別市場シェア、2023年&2033年
10.4 スリープテックの地域別市場予測
11 北米のスリープテックの市場分析
11.1 キーファインディング
11.2 北米スリープテックの国別市場規模
11.3 北米スリープテック市場規模:ウェアラブル別
11.4 北米スリープテック市場規模:ノンウェアラブル別
11.5 北米スリープテック市場規模:流通チャネル別
11.6 北米スリープテック市場規模:男性年齢層別
11.7 北米スリープテック市場規模:女性年齢層別
11.8 北米スリープテック市場規模:用途別
11.9 米国のスリープテック市場分析
11.10 カナダのスリープテック市場の分析
12 欧州のスリープテック市場分析
12.1 キーファインディング
12.2 欧州のスリープテック市場規模:国別
12.3 欧州のスリープテック市場規模:ウェアラブル別
12.4 欧州のスリープテック市場規模:ノンウェアラブル別
12.5 欧州のスリープテック市場規模:流通チャネル別
12.6 欧州のスリープテック市場規模:男性年齢層別
12.7 欧州のスリープテック市場規模:女性年齢層別
12.8 欧州のスリープテック市場規模:用途別
12.9 ドイツのスリープテック市場の分析
12.10 イギリスのスリープテック市場分析
12.11 フランスのスリープテック市場の分析
12.12 イタリア スリープテックの市場分析
12.13 スペイン スリープテック市場分析
12.14 その他の欧州のスリープテックの市場分析
13 アジア太平洋地域のスリープテック市場分析
13.1 キーファインディング
13.2 アジア太平洋地域のスリープテック市場規模:国別
13.3 アジア太平洋地域のスリープテック市場規模:ウェアラブル別
13.4 アジア太平洋地域のスリープテック市場規模:ノンウェアラブル別
13.5 アジア太平洋地域のスリープテック市場規模:流通チャネル別
13.6 アジア太平洋地域のスリープテック市場規模:男性年齢層別
13.7 アジア太平洋地域のスリープテック市場規模:女性年齢層別
13.8 アジア太平洋地域のスリープテック市場規模:用途別
13.9 中国スリープテック市場分析
13.10 インドのスリープテック市場の分析
13.11 日本スリープテック市場分析
13.12 韓国スリープテック市場分析
13.13 オーストラリアのスリープテック市場分析
13.14 その他のアジア太平洋地域のスリープテックの市場分析
14 ラテンアメリカのスリープテック市場分析
14.1 主要な調査結果
14.2 ラテンアメリカのスリープテック市場規模:国別
14.3 ラテンアメリカのスリープテック市場規模:ウェアラブル別
14.4 ラテンアメリカのスリープテック市場規模:ノンウェアラブル別
14.5 ラテンアメリカのスリープテックの市場規模:流通チャネル別
14.6 ラテンアメリカのスリープテック市場規模:男性年齢層別
14.7 ラテンアメリカのスリープテック市場規模:女性年齢層別
14.8 ラテンアメリカのスリープテック市場規模:用途別
14.9 ブラジルスリープテック市場分析
14.10 メキシコ スリープテック市場分析
14.11 その他のラテンアメリカのスリープテックの市場分析
15 中東・アフリカ スリープテック市場分析
15.1 キーファインディング
15.2 中東・アフリカ スリープテックの国別市場規模
15.3 中東・アフリカ スリープテック市場規模:ウェアラブル別
15.4 中東・アフリカ スリープテック市場規模:ノンウェアラブル別
15.5 中東・アフリカ スリープテックの市場規模:流通チャネル別
15.6 中東・アフリカ スリープテック市場規模:男性年齢層別
15.7 中東・アフリカ スリープテック市場規模:女性年齢層別
15.8 中東・アフリカ スリープテック市場規模:用途別
15.9 サウジアラビアのスリープテック市場の分析
15.10 南アフリカのスリープテックの市場分析
15.11 トルコのスリープテック市場の分析
15.12 MEAのその他の地域のスリープテック市場の分析
16 会社概要
16.1 Eight Sleep
16.1.1 企業スナップショット
16.1.2 会社概要
16.1.3 製品ベンチマーキング
16.1.4 戦略的な展望
16.2 Koninklijke Philips N.V. ( Philips)
16.2.1 企業スナップショット
16.2.2 会社概要
16.2.3 財務分析
16.2.4 製品ベンチマーキング
16.3 Casper Sleep
16.3.1 企業スナップショット
16.3.2 会社概要
16.3.3 製品ベンチマーキング
16.4 Sleepace
16.4.1 企業スナップショット
16.4.2 会社概要
16.4.3 製品ベンチマーキング
16.5 Xiaomi Corporation
16.5.1 企業スナップショット
16.5.2 会社概要
16.5.3 製品ベンチマーキング
16.6 Oura Health Oy
16.6.1 企業スナップショット
16.6.2 会社概要
16.6.3 製品ベンチマーキング
16.6.4 戦略的な展望
16.7 Compumedics Limited
16.7.1 企業スナップショット
16.7.2 会社概要
16.7.3 製品ベンチマーキング
16.8 Nihon Kohden Corporation
16.8.1 企業スナップショット
16.8.2 会社概要
16.8.3 財務分析
16.8.4 製品ベンチマーキング
16.8.5 戦略的な展望
16.9 Beddit(Apple)
16.9.1 企業スナップショット
16.9.2 会社概要
16.9.3 財務分析
16.9.4 製品ベンチマーキング
16.10 ResMed
16.10.1 企業スナップショット
16.10.2 会社概要
16.10.3 財務分析
16.10.4 製品ベンチマーキング
16.10.5 戦略的な展望
17 結論と提言
17.1 ビジョンゲインからの結びの言葉
17.2 市場関係者への提言
表の一覧
Table 1 Sleep Tech Market Snapshot, 2023 & 2033 (US$ billion, CAGR %)
Table 2 Sleep Tech Market by Region, 2023-2033 (US$ Bn, AGR (%), CAGR (%)) (V-Shaped Recovery Scenario)
Table 3 Sleep Tech Market by Region, 2023-2033 (US$ Bn, AGR (%), CAGR (%)) (W-Shaped Recovery Scenario)
Table 4 Sleep Tech Market by Region, 2023-2033 (US$ Bn, AGR (%), CAGR (%)) (U-Shaped Recovery Scenario)
Table 5 Sleep Tech Market by Region, 2023-2033 (US$ Bn, AGR (%), CAGR (%)) (L-Shaped Recovery Scenario)
Table 6 Sleep Tech Market by Wearables, 2023-2033 (US$ Bn, AGR (%), CAGR (%))
Table 7 Smart Watches and Bands Market by Region, 2023-2033 (US$ Bn, AGR (%), CAGR (%))
Table 8 Other Wearables Market by Region, 2023-2033 (US$ Bn, AGR (%), CAGR (%))
Table 9 Sleep Tech Market by Non-wearables, 2023-2033 (US$ Bn, AGR (%), CAGR (%))
Table 10 Beds Market by Region, 2023-2033 (US$ Bn, AGR (%), CAGR (%))
Table 11 Sleep Monitors Market by Region, 2023-2033 (US$ Bn, AGR (%), CAGR (%))
Table 12 Other Non-wearables Market by Region, 2023-2033 (US$ Bn, AGR (%), CAGR (%))
Table 13 Sleep Tech Market by Distribution Channel, 2023-2033 (US$ Bn, AGR (%), CAGR (%))
Table 14 Direct-to-Consumer (DTC) Market by Region, 2023-2033 (US$ Bn, AGR (%), CAGR (%))
Table 15 Hospital Networks Market by Region, 2023-2033 (US$ Bn, AGR (%), CAGR (%))
Table 16 Specialty Clinics Networks Market by Region, 2023-2033 (US$ Bn, AGR (%), CAGR (%))
Table 17 Other Distribution Channels Market by Region, 2023-2033 (US$ Bn, AGR (%), CAGR (%))
Table 18 Sleep Tech Market by Male Age Group, 2023-2033 (US$ Bn, AGR (%), CAGR (%))
Table 19 Male Age 55 Market by Region, 2023-2033 (US$ Bn, AGR (%), CAGR (%))
Table 23 Sleep Tech Market by Female Age Group, 2023-2033 (US$ Bn, AGR (%), CAGR (%))
Table 24 Female Age 55 Market by Region, 2023-2033 (US$ Bn, AGR (%), CAGR (%))
Table 28 Sleep Tech Market by Application, 2023-2033 (US$ Bn, AGR (%), CAGR (%))
Table 29 Insomnia Market by Region, 2023-2033 (US$ Bn, AGR (%), CAGR (%))
Table 30 Obstructive Sleep Apnea Market by Region, 2023-2033 (US$ Bn, AGR (%), CAGR (%))
Table 31 Narcolepsy Market by Region, 2023-2033 (US$ Bn, AGR (%), CAGR (%))
Table 32 Continuous Positive Air Pressure (CPAP) Market by Region, 2023-2033 (US$ Bn, AGR (%), CAGR (%))
Table 33 Restless Legs Syndrome (RLS) Market by Region, 2023-2033 (US$ Bn, AGR (%), CAGR (%))
Table 34 Other Applications Market by Region, 2023-2033 (US$ Bn, AGR (%), CAGR (%))
Table 35 Sleep Tech Market by Region, 2023-2033 (US$ Bn, AGR (%), CAGR (%))
Table 36 North America Sleep Tech Market by Country, 2023-2033 (US$ Bn, AGR (%), CAGR (%))
Table 37 North America Sleep Tech Market by Wearables, 2023-2033 (US$ Bn, AGR (%), CAGR (%))
Table 38 North America Sleep Tech Market by Non-wearables, 2023-2033 (US$ Bn, AGR (%), CAGR (%))
Table 39 North America Sleep Tech Market by Distribution Channel, 2023-2033 (US$ Bn, AGR (%), CAGR (%))
Table 40 North America Sleep Tech Market by Male Age Group, 2023-2033 (US$ Bn, AGR (%), CAGR (%))
Table 41 North America Sleep Tech Market by Female Age Group, 2023-2033 (US$ Bn, AGR (%), CAGR (%))
Table 42 North America Sleep Tech Market by Application, 2023-2033 (US$ Bn, AGR (%), CAGR (%))
Table 43 U.S. Sleep Tech Market by Value, 2023-2033 (US$ Bn, AGR (%), CAGR (%))
Table 44 Canada Sleep Tech Market by Value, 2023-2033 (US$ Bn, AGR (%), CAGR (%))
Table 45 Europe Sleep Tech Market by Country, 2023-2033 (US$ Bn, AGR (%), CAGR (%))
Table 46 Europe Sleep Tech Market by Wearables, 2023-2033 (US$ Bn, AGR (%), CAGR (%))
Table 47 Europe Sleep Tech Market by Non-wearables, 2023-2033 (US$ Bn, AGR (%), CAGR (%))
Table 48 Europe Sleep Tech Market by Distribution Channel, 2023-2033 (US$ Bn, AGR (%), CAGR (%))
Table 49 Europe Sleep Tech Market by Male Age Group, 2023-2033 (US$ Bn, AGR (%), CAGR (%))
Table 50 Europe Sleep Tech Market by Female Age Group, 2023-2033 (US$ Bn, AGR (%), CAGR (%))
Table 51 Europe Sleep Tech Market by Application, 2023-2033 (US$ Bn, AGR (%), CAGR (%))
Table 52 Germany Sleep Tech Market by Value, 2023-2033 (US$ Bn, AGR (%), CAGR (%))
Table 53 UK Sleep Tech Market by Value, 2023-2033 (US$ Bn, AGR (%), CAGR (%))
Table 54 France Sleep Tech Market by Value, 2023-2033 (US$ Bn, AGR (%), CAGR (%))
Table 55 Italy Sleep Tech Market by Value, 2023-2033 (US$ Bn, AGR (%), CAGR (%))
Table 56 Spain Sleep Tech Market by Value, 2023-2033 (US$ Bn, AGR (%), CAGR (%))
Table 57 Rest of Europe Sleep Tech Market by Value, 2023-2033 (US$ Bn, AGR (%), CAGR (%))
Table 58 Asia-Pacific Sleep Tech Market by Country, 2023-2033 (US$ Bn, AGR (%), CAGR (%))
Table 59 Asia-Pacific Sleep Tech Market by Wearables, 2023-2033 (US$ Bn, AGR (%), CAGR (%))
Table 60 Asia-Pacific Sleep Tech Market by Non-wearables, 2023-2033 (US$ Bn, AGR (%), CAGR (%))
Table 61 Asia-Pacific Sleep Tech Market by Distribution Channel, 2023-2033 (US$ Bn, AGR (%), CAGR (%))
Table 62 Asia-Pacific Sleep Tech Market by Male Age Group, 2023-2033 (US$ Bn, AGR (%), CAGR (%))
Table 63 Asia-Pacific Sleep Tech Market by Female Age Group, 2023-2033 (US$ Bn, AGR (%), CAGR (%))
Table 64 Asia-Pacific Sleep Tech Market by Application, 2023-2033 (US$ Bn, AGR (%), CAGR (%))
Table 65 China Sleep Tech Market by Value, 2023-2033 (US$ Bn, AGR (%), CAGR (%))
Table 66 India Sleep Tech Market by Value, 2023-2033 (US$ Bn, AGR (%), CAGR (%))
Table 67 Japan Sleep Tech Market by Value, 2023-2033 (US$ Bn, AGR (%), CAGR (%))
Table 68 South Korea Sleep Tech Market by Value, 2023-2033 (US$ Bn, AGR (%), CAGR (%))
Table 69 Australia Sleep Tech Market by Value, 2023-2033 (US$ Bn, AGR (%), CAGR (%))
Table 70 Rest of Asia-Pacific Sleep Tech Market by Value, 2023-2033 (US$ Bn, AGR (%), CAGR (%))
Table 71 Latin America Sleep Tech Market by Country, 2023-2033 (US$ Bn, AGR (%), CAGR (%))
Table 72 Latin America Sleep Tech Market by Wearables, 2023-2033 (US$ Bn, AGR (%), CAGR (%))
Table 73 Latin America Sleep Tech Market by Non-Wearables, 2023-2033 (US$ Bn, AGR (%), CAGR (%))
Table 74 Latin America Sleep Tech Market by Distribution Channel, 2023-2033 (US$ Bn, AGR (%), CAGR (%))
Table 75 Latin America Sleep Tech Market by Male Age Group, 2023-2033 (US$ Bn, AGR (%), CAGR (%))
Table 76 Latin America Sleep Tech Market by Female Age Group, 2023-2033 (US$ Bn, AGR (%), CAGR (%))
Table 77 Latin America Sleep Tech Market by Application, 2023-2033 (US$ Bn, AGR (%), CAGR (%))
Table 78 Brazil Sleep Tech Market by Value, 2023-2033 (US$ Bn, AGR (%), CAGR (%))
Table 79 Mexico Sleep Tech Market by Value, 2023-2033 (US$ Bn, AGR (%), CAGR (%))
Table 80 Rest of Latin America Sleep Tech Market by Value, 2023-2033 (US$ Bn, AGR (%), CAGR (%))
Table 81 Middle East & Africa Sleep Tech Market by Country, 2023-2033 (US$ Bn, AGR (%), CAGR (%))
Table 82 Middle East & Africa Sleep Tech Market by Wearables, 2023-2033 (US$ Bn, AGR (%), CAGR (%))
Table 83 Middle East & Africa Sleep Tech Market by Non-wearables, 2023-2033 (US$ Bn, AGR (%), CAGR (%))
Table 84 Middle East & Africa Sleep Tech Market by Distribution Channel, 2023-2033 (US$ Bn, AGR (%), CAGR (%))
Table 85 Middle East & Africa Sleep Tech Market by Male Age Group, 2023-2033 (US$ Bn, AGR (%), CAGR (%))
Table 86 Middle East & Africa Sleep Tech Market by Female Age Group, 2023-2033 (US$ Bn, AGR (%), CAGR (%))
Table 87 Middle East & Africa Sleep Tech Market by Application, 2023-2033 (US$ Bn, AGR (%), CAGR (%))
Table 88 Saudi Arabia Sleep Tech Market by Value, 2023-2033 (US$ Bn, AGR (%), CAGR (%))
Table 89 South Africa Sleep Tech Market by Value, 2023-2033 (US$ Bn, AGR (%), CAGR (%))
Table 90 Turkey Sleep Tech Market by Value, 2023-2033 (US$ Bn, AGR (%), CAGR (%))
Table 91 Rest of Middle East & Africa Sleep Tech Market by Value, 2023-2033 (US$ Bn, AGR (%), CAGR (%))
Table 92 Eight Sleep: Key Details, (CEO, HQ, Revenue, Founded, No. of Employees, Company Type, Website, Business Segment)
Table 93 Eight Sleep: Product Benchmarking
Table 94 Eight Sleep: Strategic Outlook
Table 95 Koninklijke Philips N.V. (Philips): Key Details, (CEO, HQ, Revenue, Founded, No. of Employees, Company Type, Website, Business Segment)
Table 96 Koninklijke Philips N.V. (Philips): Product Benchmarking
Table 97 Casper Sleep: Key Details, (CEO, HQ, Revenue, Founded, No. of Employees, Company Type, Website, Business Segment)
Table 98 Casper: Product Benchmarking
Table 99 Sleepace: Key Details, (CEO, HQ, Revenue, Founded, No. of Employees, Company Type, Website, Business Segment)
Table 100 Sleepace: Product Benchmarking
Table 101 Xiaomi Corporation: Key Details, (CEO, HQ, Revenue, Founded, No. of Employees, Company Type, Website, Business Segment)
Table 102 Xiaomi Corporation: Product Benchmarking
Table 103 Oura Health Oy: Key Details, (CEO, HQ, Revenue, Founded, No. of Employees, Company Type, Website, Business Segment)
Table 104 Oura Health Oy: Product Benchmarking
Table 105 Oura Health Oy: Strategic Outlook
Table 106 Compumedics Limited: Key Details, (CEO, HQ, Revenue, Founded, No. of Employees, Company Type, Website, Business Segment)
Table 107 Compumedics Limited: Product Benchmarking
Table 108 Nihon Kohden Corporation: Key Details, (CEO, HQ, Revenue, Founded, No. of Employees, Company Type, Website, Business Segment)
Table 109 Nihon Kohden Corporation : Product Benchmarking
Table 110 Nihon Kohden Corporation: Strategic Outlook
Table 111 Beddit (Apple): Key Details, (CEO, HQ, Revenue, Founded, No. of Employees, Company Type, Website, Business Segment)
Table 112 Beddit (Apple): Product Benchmarking
Table 113 ResMed: Key Details, (CEO, HQ, Revenue, Founded, No. of Employees, Company Type, Website, Business Segment)
Table 114 ResMed: Product Benchmarking
Table 115 ResMed: Strategic Outlook
図の一覧
Figure 1 Sleep Tech Market Segmentation
Figure 2 Sleep Tech Market by Region: Market Attractiveness Index
Figure 3 Sleep Tech Market by Wearables: Market Attractiveness Index
Figure 4 Sleep Tech Market by Non-wearables: Market Attractiveness Index
Figure 5 Sleep Tech Market by Distribution Channels: Market Attractiveness Index
Figure 6 Sleep Tech Market by Gender: Market Attractiveness Index
Figure 7 Sleep Tech Market by Application: Market Attractiveness Index
Figure 8 Sleep Tech Market: Market Dynamics
Figure 9 COVID Impact Analysis: Sleep Tech Market Recovery Scenarios 2023-2033 (US$ Bn, CAGR (%))
Figure 10 Sleep Tech Market by Region, 2023-2033 (US$ Bn, AGR (%)) (V-Shaped Recovery Scenario)
Figure 11 Sleep Tech Market by Region, 2023-2033 (US$ Bn, AGR (%)) (W-Shaped Recovery Scenario)
Figure 12 Sleep Tech Market by Region, 2023-2033 (US$ Bn, AGR (%)) (U-Shaped Recovery Scenario)
Figure 13 Sleep Tech Market by Region, 2023-2033 (US$ Bn, AGR (%)) (L-Shaped Recovery Scenario)
Figure 14 Sleep Tech Market: Porter’s Five Forces Analysis
Figure 15 Sleep Tech Market: PEST Analysis
Figure 16 Sleep Tech Market Forecast by Wearables 2023-2033 (Revenue, CAGR%)
Figure 17 Sleep Tech Market Share Forecast by Wearables, 2023& 2033 (%)
Figure 18 Sleep Tech Market by Wearables, 2023-2033 (US$ Bn, AGR (%))
Figure 19 Smart Watches and Bands Market by Region, 2023-2033 (US$ Bn, AGR (%))
Figure 20 Smart Watches and Bands Market Share Forecast by Region, 2023 & 2033 (%)
Figure 21 Other Wearables Market by Region, 2023-2033 (US$ Bn, AGR (%))
Figure 22 Other Wearables Market Share Forecast by Region, 2023 & 2033 (%)
Figure 23 Sleep Tech Market Forecast by Non-wearables Segment: Market Attractiveness Index
Figure 24 Sleep Tech Market Share Forecast by Components, 2023, 20323(%)
Figure 25 Sleep Tech Market by Non-wearables, 2023-2033 (US$ Bn, AGR (%))
Figure 26 Beds Market by Region, 2023-2033 (US$ Bn, AGR (%))
Figure 27 Beds Market Share Forecast by Region, 2023 & 2033 (%)
Figure 28 Sleep Monitors Market by Region, 2023-2033 (US$ Bn, AGR (%))
Figure 29 Sleep Monitors Market Share Forecast by Region, 2023 & 2033 (%)
Figure 30 Other Non-wearables Market by Region, 2023-2033 (US$ Bn, AGR (%))
Figure 31 Other Non-wearables Market Share Forecast by Region, 2023 & 2033 (%)
Figure 32 Sleep Tech Market Forecast by Distribution Channel Segment: Market Attractiveness Index
Figure 33 Sleep Tech Market Share Forecast by Distribution Channels, 2023, 2033 (%)
Figure 34 Sleep Tech Market by Distribution Channel, 2023-2033 (US$ Bn, AGR (%))
Figure 35 Direct-to-Consumer (DTC) Market by Region, 2023-2033 (US$ Bn, AGR (%))
Figure 36 Direct-to-Consumer (DTC) Market Share Forecast by Region, 2023 & 2033 (%)
Figure 37 Hospital Networks Market by Region, 2023-2033 (US$ Bn, AGR (%))
Figure 38 Hospital Networks Market Share Forecast by Region, 2023 & 2033 (%)
Figure 39 Specialty Clinics Networks Market by Region, 2023-2033 (US$ Bn, AGR (%))
Figure 40 Specialty Clinics Networks Market Share Forecast by Region, 2023 & 2033 (%)
Figure 41 Other Distribution Channels Market by Region, 2023-2033 (US$ Bn, AGR (%))
Figure 42 Other Distribution Channels Market Share Forecast by Region, 2023 & 2033 (%)
Figure 43 Sleep Tech Market Forecast by Male Age Group Segment: Market Attractiveness Index
Figure 44 Sleep Tech Market Share Forecast by Male Age Group, 2023, 2033 (%)
Figure 45 Sleep Tech Market by Male Age Group, 2023-2033 (US$ Bn, AGR (%))
Figure 46 Male Age <18 Market by Region, 2023-2033 (US$ Bn, AGR (%))
Figure 47 Male Age 55 Market by Region, 2023-2033 (US$ Bn, AGR (%))
Figure 53 Male Age >55 Market Share Forecast by Region, 2023 & 2033 (%)
Figure 54 Sleep Tech Market Forecast by Female Age Group Segment: Market Attractiveness Index
Figure 55 Sleep Tech Market Share Forecast by Female Age Group, 2023, 2033 (%)
Figure 56 Sleep Tech Market by Female Age Group, 2023-2033 (US$ Bn, AGR (%))
Figure 57 Female Age <18 Market by Region, 2023-2033 (US$ Bn, AGR (%))
Figure 58 Female Age 55 Market by Region, 2023-2033 (US$ Bn, AGR (%))
Figure 63 Female Age >55 Market Share Forecast by Region, 2023 & 2033 (%)
Figure 64 Sleep Tech Market Forecast by Application Segment: Market Attractiveness Index
Figure 65 Sleep Tech Market Share Forecast by Application, 2023, 2033 (%)
Figure 66 Sleep Tech Market by Application, 2023-2033 (US$ Bn, AGR (%))
Figure 67 Insomnia Market by Region, 2023-2033 (US$ Bn, AGR (%))
Figure 68 Insomnia Market Share Forecast by Region, 2023 & 2033 (%)
Figure 69 Global Obstructive Sleep Apnea Market by Region, 2023-2033 (US$ Bn, AGR (%))
Figure 70 Obstructive Sleep Apnea Market Share Forecast by Region, 2023 & 2033 (%)
Figure 71 Narcolepsy Market by Region, 2023-2033 (US$ Bn, AGR (%))
Figure 72 Narcolepsy Market Share Forecast by Region, 2023 & 2033 (%)
Figure 73 Continuous Positive Air Pressure (CPAP) Market by Region, 2023-2033 (US$ Bn, AGR (%))
Figure 74 Continuous Positive Air Pressure (CPAP) Market Share Forecast by Region, 2023 & 2033 (%)
Figure 75 Restless Legs Syndrome (RLS) Market by Region, 2023-2033 (US$ Bn, AGR (%)
Figure 76 Restless Legs Syndrome (RLS) Market Share Forecast by Region, 2023 & 2033 (%)
Figure 77 Other Applications Market by Region, 2023-2033 (US$ Bn, AGR (%))
Figure 78 Other Applications Market Share Forecast by Region, 2023 & 2033 (%)
Figure 79 Sleep Tech Market Forecast by Region 2023-2033: Market Attractiveness Index
Figure 80 Sleep Tech Market Share Forecast by Application, 2023, 2033 (%)
Figure 81 Sleep Tech Market by Region, 2023-2033 (US$ Bn, AGR (%))
Figure 82 North America Sleep Tech Market by Country, 2023-2033 (US$ Bn, AGR (%))
Figure 83 North America Sleep Tech Market by Wearables, 2023-2033 (US$ Bn, AGR (%))
Figure 84 North America Sleep Tech Market by Non-wearables, 2023-2033 (US$ Bn, AGR (%))
Figure 85 North America Sleep Tech Market by Distribution Channel, 2023-2033 (US$ Bn, AGR (%))
Figure 86 North America Sleep Tech Market by Male Age Group, 2023-2033 (US$ Bn, AGR (%))
Figure 87 North America Sleep Tech Market by Female Age Group, 2023-2033 (US$ Bn, AGR (%))
Figure 88 North America Sleep Tech Market by Application, 2023-2033 (US$ Bn, AGR (%))
Figure 89 U.S. Sleep Tech Market by Value, 2023-2033 (US$ Bn, AGR (%))
Figure 90 Canada Sleep Tech Market by Value, 2023-2033 (US$ Bn, AGR (%))
Figure 91 Europe Sleep Tech Market by Country, 2023-2033 (US$ Bn, AGR (%))
Figure 92 Europe Sleep Tech Market by Wearables, 2023-2033 (US$ Bn, AGR (%))
Figure 93 Europe Sleep Tech Market by Non-wearables, 2023-2033 (US$ Bn, AGR (%))
Figure 94 Europe Sleep Tech Market by Distribution Channel, 2023-2033 (US$ Bn, AGR (%))
Figure 95 Europe Sleep Tech Market by Male Age Group, 2023-2033 (US$ Bn, AGR (%))
Figure 96 Europe Sleep Tech Market by Female Age Group, 2023-2033 (US$ Bn, AGR (%))
Figure 97 Europe Sleep Tech Market by Application, 2023-2033 (US$ Bn, AGR (%))
Figure 98 Germany Sleep Tech Market by Value, 2023-2033 (US$ Bn, AGR (%))
Figure 99 UK Sleep Tech Market by Value, 2023-2033 (US$ Bn, AGR (%))
Figure 100 France Sleep Tech Market by Value, 2023-2033 (US$ Bn, AGR (%))
Figure 101 Italy Sleep Tech Market by Value, 2023-2033 (US$ Bn, AGR (%))
Figure 102 Spain Sleep Tech Market by Value, 2023-2033 (US$ Bn, AGR (%))
Figure 103 Rest of Europe Sleep Tech Market by Value, 2023-2033 (US$ Bn, AGR (%))
Figure 104 Asia-Pacific Sleep Tech Market by Country, 2023-2033 (US$ Bn, AGR (%))
Figure 105 Asia-Pacific Sleep Tech Market by Wearables, 2023-2033 (US$ Bn, AGR (%))
Figure 106 Asia-Pacific Sleep Tech Market by Non-wearables, 2023-2033 (US$ Bn, AGR (%))
Figure 107 Asia-Pacific Sleep Tech Market by Distribution Channel, 2023-2033 (US$ Bn, AGR (%))
Figure 108 Asia-Pacific Sleep Tech Market by Male Age Group, 2023-2033 (US$ Bn, AGR (%))
Figure 109 Asia-Pacific Sleep Tech Market by Female Age Group, 2023-2033 (US$ Bn, AGR (%))
Figure 110 Asia-Pacific Sleep Tech Market by Application, 2023-2033 (US$ Bn, AGR (%))
Figure 111 China Sleep Tech Market by Value, 2023-2033 (US$ Bn, AGR (%))
Figure 112 India Sleep Tech Market by Value, 2023-2033 (US$ Bn, AGR (%))
Figure 113 Japan Sleep Tech Market by Value, 2023-2033 (US$ Bn, AGR (%))
Figure 114 South Korea Sleep Tech Market by Value, 2023-2033 (US$ Bn, AGR (%))
Figure 115 Australia Sleep Tech Market by Value, 2023-2033 (US$ Bn, AGR (%))
Figure 116 Rest of Asia-Pacific Sleep Tech Market by Value, 2023-2033 (US$ Bn, AGR (%))
Figure 117 Latin America Sleep Tech Market by Country, 2023-2033 (US$ Bn, AGR (%))
Figure 118 Latin America Sleep Tech Market by Wearables, 2023-2033 (US$ Bn, AGR (%))
Figure 119 Latin America Sleep Tech Market by Non-wearables, 2023-2033 (US$ Bn, AGR (%))
Figure 120 Latin America Sleep Tech Market by Distribution Channel, 2023-2033 (US$ Bn, AGR (%))
Figure 121 Latin America Sleep Tech Market by Male Age Group, 2023-2033 (US$ Bn, AGR (%))
Figure 122 Latin America Sleep Tech Market by Female Age Group, 2023-2033 (US$ Bn, AGR (%))
Figure 123 Latin America Sleep Tech Market by Application, 2023-2033 (US$ Bn, AGR (%))
Figure 124 Brazil Sleep Tech Market by Value, 2023-2033 (US$ Bn, AGR (%))
Figure 125 Mexico Sleep Tech Market by Value, 2023-2033 (US$ Bn, AGR (%))
Figure 126 Rest of Latin America Sleep Tech Market by Value, 2023-2033 (US$ Bn, AGR (%))
Figure 127 Middle East & Africa Sleep Tech Market by Country, 2023-2033 (US$ Bn, AGR (%))
Figure 128 Middle East & Africa Sleep Tech Market by Wearables, 2023-2033 (US$ Bn, AGR (%))
Figure 129 Middle East & Africa Sleep Tech Market by Non-wearables, 2023-2033 (US$ Bn, AGR (%))
Figure 130 Middle East & Africa Sleep Tech Market by Distribution Channel, 2023-2033 (US$ Bn, AGR (%))
Figure 131 Middle East & Africa Sleep Tech Market by Male Age Group, 2023-2033 (US$ Bn, AGR (%))
Figure 132 Middle East & Africa Sleep Tech Market by Female Age Group, 2023-2033 (US$ Bn, AGR (%))
Figure 133 Middle East & Africa Sleep Tech Market by Application, 2023-2033 (US$ Bn, AGR (%))
Figure 134 Saudi Arabia Sleep Tech Market by Value, 2023-2033 (US$ Bn, AGR (%))
Figure 135 South Africa Sleep Tech Market by Value, 2023-2033 (US$ Bn, AGR (%))
Figure 136 Turkey Sleep Tech Market by Value, 2023-2033 (US$ Bn, AGR (%))
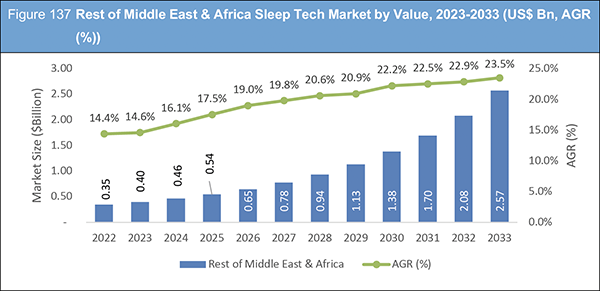
Figure 137 Rest of Middle East & Africa Sleep Tech Market by Value, 2023-2033 (US$ Bn, AGR (%))
Figure 138 Koninklijke Philips N.V. (Philips): Net Revenue, 2017-2021 (US$ million, AGR%)
Figure 139 Koninklijke Philips N.V. (Philips): Gross Profit, 2017-2021 (US$ million, AGR%)
Figure 140 Koninklijke Philips N.V. (Philips:)R&D, 2017-2021 (US$ million, AGR%)
Figure 141 Koninklijke Philips N.V. (Philips): Regional Revenue Share 2021 (%)
Figure 142 Koninklijke Philips N.V. (Philips): Business Segment Revenue Share 2021 (%)
Figure 143 Nihon Kohden Corporation: Net Revenue, 2017-2021 (US$ million, AGR%)
Figure 144 Nihon Kohden Corporation: Gross Profit, 2017-2021 (US$ million, AGR%)
Figure 145 Nihon Kohden Corporation : Regional Revenue Share 2021 (%)
Figure 146 Nihon Kohden Corporation: Business Segment Revenue Share 2021 (%)
Figure 147 Beddit (Apple): Net Revenue, 2017-2021 (US$ million, AGR%)
Figure 148 Beddit (Apple): Gross Profit, 2017-2021 (US$ million, AGR%)
Figure 149 Beddit (Apple): R&D, 2017-2021 (US$ million, AGR%)
Figure 150 Beddit (Apple): Regional Revenue Share 2021 (%)
Figure 151 Beddit (Apple): Business Segment Revenue Share 2021 (%)
Figure 152 ResMed: Net Revenue, 2017-2021 (US$ million, AGR%)
Figure 153 ResMed: Gross Profit, 2017-2021 (US$ million, AGR%)
Figure 154 ResMed: R&D, 2017-2021 (US$ million, AGR%)
Figure 155 ResMed : Regional Revenue Share 2021 (%)
Figure 156 ResMed : Business Segment Revenue Share 2021 (%)


