手術用ロボットの市場レポート:2023-2033
Surgical Robots Market Report 2023-2033
レポート詳細
手術用ロボットの市場レポート 2023-2033 :本レポートは、新たな収益源の開拓を目指すリーディングカンパニーにとって、業界とその基礎となる力学をより深く理解する上で、非常に貴重な... もっと見る
※上記価格は部署ライセンス(Departmental licence)価格です。
その他の価格についてはデータリソースまでお問合せください。
日本語のページは自動翻訳を利用し作成しています。
実際のレポートは英文のみでご納品いたします。

|

|
サマリー
レポート詳細
手術用ロボットの市場レポート 2023-2033:本レポートは、新たな収益源の開拓を目指すリーディングカンパニーにとって、業界とその基礎となる力学をより深く理解する上で、非常に貴重なものとなるでしょう。また、異業種への進出や新地域での既存事業の拡大を目指す企業にとっても有益なレポートです。
低侵襲手術の需要拡大
手術用ロボットは近年大きな進歩を遂げ、医師による低侵襲手術の実施が容易になっています。その結果、手術用ロボットの需要が増加し、市場の成長を牽引しています。ロボット工学とコンピューター技術の進歩は、新しく改良された手術用ロボットの開発に道を開き、手術をより正確かつ効率的に行うことができるようになりました。これが、手術用ロボット市場の成長を後押ししています。しかし、手術用ロボット市場が直面する大きな課題として、システムのコストが高く、多くの医療従事者にとって手が届きにくいということが挙げられます。しかし、技術の進歩やコストの低下により、市場はより身近なものになると予想されます。
マーケットリサーチレポートを購入する前に、どのような質問をするべきか?
- 手術用ロボット市場はどのように進化しているのか?
- 手術用ロボット市場を牽引し、抑制しているものは何か?
- 手術用ロボットの各サブマーケットセグメントは予測期間中にどのように成長し、2033年にこれらのサブマーケットが占める収益はどの程度になるのか?
- 2023年から2033年にかけて、各サブマーケットの市場シェアはどのように推移するのか?
- 2023年から2033年にかけて、市場全体の主な牽引役となるのは何か?
- 主要な手術用ロボット市場はマクロ経済ダイナミクスに広く追随するのか、それとも個々の国別市場が他を凌駕するのか?
- 2033年までに各国市場のシェアはどのように変化し、2033年に市場をリードするのはどの地域か?
- 主要プレイヤーは誰で、予測期間中の見通しはどうなっているのか?
- これらの主要企業の手術用ロボットのプロジェクトは何か?
- 2023年から2033年の間に、業界はどのように進化していくのか?現在および今後10年間に行われる手術用ロボットのプロジェクトには、どのような意味があるのか?
- 手術用ロボット市場をさらに拡大するために、製品の商業化の必要性は高まっているのか?
- 手術用ロボット市場はどこへ向かっているのか、そして市場の最前線に立つためにはどうすればよいのか?
- 新製品やサービスラインへの最適な投資方法は何か?
- 企業を新たな成長軌道に乗せ、C-suiteに移行させるための重要な展望とは?
このことが、現在、そして今後10年間の手術用ロボット市場にどのような影響を与えるかを見極める必要があります。
- 256ページにわたる本レポートでは、105の表と133のチャート/グラフを独占的に提供します。
- 本レポートでは、業界における主要な収益性の高い分野を取り上げているため、今すぐその分野をターゲットにすることができます。
- 世界、地域、国の売上と成長に関する詳細な分析が含まれています。
- 競合他社が成功した主要なトレンド、変化、収益予測をハイライトしています。
本レポートは、今後10年間、手術用ロボット市場がどのように発展していくのか、またCOVID-19の景気後退やバウンスの変化に合わせて、今日のあなたにお伝えします。この市場は、過去10年間のどの時点よりも今が重要です。
2033年までの予測やその他の分析により、商業的な展望を明らかにする。
- 2033年までの収益予測に加え、直近の実績や成長率、市場シェアなど、本調査では
- ビジネスの展望や展開など、独自の分析がご覧いただけます。
- 定性的分析(市場力学、促進要因、機会、阻害要因、課題など)、コスト構造、手術用ロボット価格上昇の影響、最近の動向をご覧いただけます。
本レポートでは、COVID-19が業界や貴社にどのような影響を与えるかについて、データ分析および貴重な知見を提供しています。COVID-19の4つの回収パターン、すなわち「V」、「L」、「W」、「U」の回収パターンとその影響について考察しています。
報告書の対象セグメント
コンポーネント
- ロボットシステム
- インストゥルメントとアクセサリー
- サービス内容
サービス
- オンサイトトレーニングサービス
- アフターセールスサービス
- プレインストールコンサルティングサービス
- アンシラリーサービス
用途
- 一般外科
- 婦人科手術
- 泌尿器外科
- 脳神経外科
- 整形外科
- その他の用途
エンドユーザー
- 外来手術センター
- ホスピタルズ
世界市場全体およびセグメントの収益予測に加え、4地域および主要20カ国市場の収益予測も掲載しています。
北米
- U.S.
- カナダ
欧州
- ドイツ
- スペイン
- イギリス
- フランス
- イタリア
- その他の欧州地域
アジア太平洋
- 中国
- 日本
- インド
- オーストラリア
- 韓国
- その他のアジア太平洋地域
ラテンアメリカ
- ブラジル
- メキシコ
- その他のラテンアメリカ
中近東・アフリカ
- GCC
- 南ア
- その他の中東・アフリカ地域
2023年から2033年にかけての手術用ロボット市場の主要企業のプロファイルと、これらの企業のこのセグメントに焦点を当てたいくつかの企業についても報告しています。
主要企業と市場成長の可能性
・ Accuray, Inc.
・ Asensus Surgical
・ Intuitive Surgical, Inc.
・ Johnson & Johnson Services, Inc.
・ Medrobotics Corporation
・ Medtronic plc
・ Renishaw
・ Siemens Healthcare GmbH
・ Smith & Nephew plc
・ Stryker Corporation
・ Think Surgical, Inc.
・ Titan Medical Inc.
・ Zimmer Biomet
外科用ロボット市場の世界全体の収益、金額ベースで2023年から2033年まで、市場は2023年に90億米ドルを突破すると、私たちの仕事は計算されます。2033年まで収益が大きく伸びることが予測されます。当社の調査では、最も大きな可能性を秘めた企業を特定しています。彼らの能力、進歩、商業的展望を発見することで、先手を打つことができます。
手術用ロボットの市場、2023年から2033年までのレポートはどのように役立つのでしょうか?
250ページ以上のレポートをまとめると、以下のような知識を得ることができます。
- 手術用ロボット市場、2023年から2033年までの収益予測:エンドユーザー、コンポーネント、サービス、システム、アプリケーション、企業規模の各予測を世界および地域レベルで掲載 - 業界の展望を発見し、投資や収益に最も有利な場所を見つけることができます。
- 4つの地域と20の主要国市場の2033年までの収益予測 - 北米、欧州、アジア太平洋、LAMEAの外科用ロボット市場、2023年から2033年の市場予測をご覧ください。また、米国、カナダ、ブラジル、ドイツ、フランス、英国、イタリア、中国、インド、日本、オーストラリアなど、著名な経済圏の市場も予測されています。
- 既存企業および市場参入を目指す企業の展望 - 2023年から2033年の外科用ロボット市場に関わる主要企業13社の企業プロファイルを含む。
独自の予測による定量・定性分析をご覧いただけます。私たちのレポートだけが持つ情報を入手し、貴重なビジネスインテリジェンスとして情報を得ることができます。
他にはない情報
私たちの新しいレポートがあれば、知識に遅れをとったり、チャンスを逃したりする可能性は低くなります。私たちの仕事が、あなたの調査、分析、意思決定にどのように役立つかをご覧ください。Visiongainの調査は、外科用ロボット市場、2023年から2033年、市場をリードする企業のための商業的分析を必要とするすべての人のためのものです。データ、トレンド、予測を見つけることができます。
ページTOPに戻る
目次
目次
1.レポート概要
1.1 研究の目的
1.2 手術用ロボット市場の紹介
1.3 この報告書がもたらすもの
1.4 本レポートを読むべき理由
1.本分析レポートが回答する5つの重要な質問
1.6 本レポートは誰のためのものなのか?
1.7 方法論
1.7.1 市場の定義
1.7.2 市場評価・予測手法
1.7.3 データバリデーション
1.7.3.1 一次調査
1.7.3.2 セカンダリーリサーチ
1.8 よくある質問(FAQ)
1.9 関連するVisiongainのレポート
1.10 ビジョンゲインについて
2 エグゼクティブサマリー
3 市場の概要
3.1 キーファインディング
3.2 マーケットダイナミクス
3.2.1 市場促進要因
3.2.1.1 手術件数の増加と低侵襲手術の需要拡大
3.2.1.2 従来の手順に比べ、高い精度と正確性
3.2.2 市場の抑制要因
3.2.2.1 手術用ロボットの使用に伴う安全性への懸念
3.2.2.2 機器の初期費用やメンテナンス費用が高い
3.2.3 マーケットオポチュニティ
3.2.3.1 手術用ロボットの開発ポテンシャル
3.2.3.2 テレサージェリー法の成功例
3.3 サプライチェーンの概要
3.4 バリューチェーンの概要
3.5 COVID-19の影響度分析
3.6 ポーターのファイブフォース分析
3.6.1 サプライヤーのバーゲニングパワー
3.6.2 バイヤーパワー
3.6.3 競争力のあるライバル
3.6.4 代替品による脅威
3.6.5 新規参入の脅威
3.7 PESTLE分析
3.7.1 政治的要因
3.7.2 経済的要因
3.7.3 社会的要因
3.7.4 技術的要因
4 手術用ロボット市場分析:エンドユーザー別
4.1 キーファインディング
4.2 エンドユーザセグメント。市場魅力度指数
4.3 手術用ロボットのエンドユーザー別市場シェア、2023年&2033年
4.4 手術用ロボットのエンドユーザー別市場
4.5 外来手術センター
4.5.1 地域別市場規模、2023-2033年(US$ bn)
4.5.2 2023年&2033年地域別市場シェア(%)
4.6 ホスピタル
4.6.1 地域別市場規模、2023-2033年(US$ bn)
4.6.2 2023年&2033年地域別市場シェア(%)
5 手術用ロボット市場分析:コンポーネント別
5.1 キーファインディング
5.2 コンポーネントセグメント。市場魅力度指数
5.3 手術用ロボットのコンポーネント別市場シェア、2023年&2033年
5.4 手術用ロボットのコンポーネント別市場
5.5 ロボティクスシステム
5.5.1 病院における材料搬送のための移動ロボットアプリケーション
5.5.2 外骨格
5.5.3 サージカルロボット
5.5.4 移動型テレケアロボット
5.5.5 地域別市場規模、2023-2033年(US$ bn)
5.5.6 2023年&2033年地域別市場シェア(%)
5.6 インストゥルメントとアクセサリー
5.6.1 MISマルチアームロボットプラットフォーム
5.6.2 高い冗長性を持つロボットプラットフォーム
5.6.3 MIS用コンティニュアムロボット
5.6.4 ソフトロボティクスを活用した手術用ロボティクス
5.6.5 ロボットハイブリッドプラットフォーム
5.6.6 地域別市場規模、2023-2033年(US$ bn)
5.6.7 2023年&2033年地域別市場シェア(%)
5.7 サービス
5.7.1 地域別市場規模、2023-2033年(US$ bn)
5.7.2 2023年&2033年地域別市場シェア(%)
6 手術用ロボット市場分析:サービス別
6.1 キーファインディング
6.2 サービス分野。市場魅力度指数
6.3 手術用ロボットのサービス別市場シェア、2023年&2033年
6.4 手術用ロボットのサービス別市場
6.5 オンサイトトレーニングサービス
6.5.1 地域別市場規模、2023-2033年(US$ bn)
6.5.2 2023年&2033年地域別市場シェア(%)
6.6 アフターセールスサービス
6.6.1 地域別市場規模、2023-2033年(US$ bn)
6.6.2 2023年&2033年地域別市場シェア(%)
6.7 プレインストールコンサルティングサービス
6.7.1 地域別市場規模、2023-2033年(US$ bn)
6.7.2 2023年&2033年地域別市場シェア(%)
6.8 アンシラリーサービス
6.8.1 地域別市場規模、2023-2033年(US$ bn)
6.8.2 2023年&2033年地域別市場シェア(%)
7 手術用ロボット市場分析:用途別
7.1 キーファインディング
7.2 用途別セグメント。市場魅力度指数
7.3 手術用ロボットの用途別市場シェア、2023年&2033年
7.3.1 手術用ロボットの用途別市場
7.4 一般外科
7.4.1 地域別市場規模、2023-2033年(US$ bn)
7.4.2 2023年&2033年地域別市場シェア(%)
7.5 婦人科手術
7.5.1 地域別市場規模、2023-2033年(US$ bn)
7.5.2 2023年&2033年地域別市場シェア(%)
7.6 泌尿器科手術
7.6.1 地域別市場規模、2023-2033年(US$ bn)
7.6.2 2023年&2033年地域別市場シェア(%)
7.7 脳神経外科
7.7.1 地域別市場規模、2023-2033年(US$ bn)
7.7.2 2023年&2033年地域別市場シェア(%)
7.8 整形外科
7.8.1 地域別市場規模、2023-2033年(US$ bn)
7.8.2 2023年&2033年地域別市場シェア(%)
7.9 その他の手術
7.9.1 地域別市場規模、2023-2033年(US$ bn)
7.9.2 2023年&2033年地域別市場シェア(%)
8 手術用ロボット市場分析:地域別
8.1 キーファインディング
8.2 手術用ロボットの地域別市場魅力度指数
8.3 手術用ロボットの地域別市場シェア、2023年&2033年
8.4 地域別市場規模、2023-2033年(US$ bn)
9 北米の手術用ロボット市場分析
9.1 キーファインディング
9.2 北米手術用ロボット市場魅力度指数
9.3 北米手術用ロボットの国別市場規模推計と予測
9.4 北米手術用ロボットのエンドユーザー別市場規模の推定と予測
9.5 北米手術用ロボットのコンポーネント別市場規模の推定と予測
9.6 北米手術用ロボットのサービス別市場規模推計と予測
9.7 北米手術用ロボットの用途別市場規模の推定と予測
9.8 米国の手術用ロボット市場の分析
9.9 カナダの手術用ロボットの市場分析
10 欧州の手術用ロボット市場分析
10.1 キーファインディング
10.2 欧州手術用ロボット市場魅力度指数
10.3 欧州手術用ロボットの国別市場規模の推定と予測
10.4 欧州手術用ロボットのエンドユーザー別市場規模の推定と予測
10.5 欧州手術用ロボットのコンポーネント別市場規模の推定と予測
10.6 欧州手術用ロボット市場規模推定とサービス別予測
10.7 欧州手術用ロボットの用途別市場規模の推定と予測
10.8 ドイツの手術用ロボットの市場分析
10.9 英国手術用ロボットの市場分析
10.10 フランス 手術用ロボットの市場分析
10.11 イタリア 手術用ロボットの市場分析
10.12 スペインの手術用ロボットの市場分析
10.13 その他の欧州市場予測
11 アジア太平洋地域の手術用ロボット市場分析
11.1 キーファインディング
11.2 アジア太平洋地域の手術用ロボット市場魅力度指数
11.3 アジア太平洋地域の手術用ロボットの国別市場規模推計と予測
11.4 アジア太平洋地域の手術用ロボットのエンドユーザー別市場規模の推定と予測
11.5 アジア太平洋地域の手術用ロボットのコンポーネント別市場規模の推定と予測
11.6 アジア太平洋地域の手術用ロボットのサービス別市場規模の推定と予測
11.7 アジア太平洋地域の手術用ロボットの用途別市場規模の推定と予測
11.8 日本の手術用ロボットの市場分析
11.9 中国の手術用ロボットの市場分析
11.10 インドの手術用ロボットの市場分析
11.11 韓国の手術用ロボット市場分析
11.12 オーストラリアの手術用ロボットの市場分析
11.13 その他のアジア太平洋地域の手術用ロボットの市場分析
12 ラテンアメリカの手術用ロボット市場分析
12.1 キーファインディング
12.2 ラテンアメリカの手術用ロボット市場魅力度指数
12.3 ラテンアメリカの手術用ロボットの国別市場規模の推定と予測
12.4 ラテンアメリカの手術用ロボットのエンドユーザー別市場規模の推定と予測
12.5 ラテンアメリカの手術用ロボットのコンポーネント別市場規模の推定と予測
12.6 ラテンアメリカの手術用ロボットのサービス別市場規模の推定と予測
12.7 ラテンアメリカの手術用ロボットの用途別市場規模の推定と予測
12.8 ブラジル手術用ロボットの市場分析
12.9 メキシコ手術用ロボットの市場分析
12.10 その他のラテンアメリカの手術用ロボットの市場分析
13 中東・アフリカの手術用ロボット市場分析
13.1 キーファインディング
13.2 中東・アフリカ手術用ロボット市場魅力度指数
13.3 中東・アフリカ手術用ロボットの国別市場規模の推定と予測
13.4 中東・アフリカ手術用ロボットのエンドユーザー別市場規模の推定と予測
13.5 中東・アフリカ手術用ロボットのコンポーネント別市場規模の推定と予測
13.6 中東・アフリカ手術用ロボットのサービス別市場規模の推定と予測
13.7 中東・アフリカ手術用ロボットの用途別市場規模の推定と予測
13.8 GCC手術用ロボットの市場分析
13.9 南アフリカの手術用ロボットの市場分析
13.10 その他のMEAの手術用ロボットの市場分析
14 主要企業のプロフィール
14.1 Intuitive Surgical, Inc.
14.1.1 企業スナップショット
14.1.2 会社概要
14.1.3 財務分析
14.1.3.1 純収益、2017-2021年
14.1.3.2 売上総利益、2017-2021年
14.1.3.3 r&d、2017-2021年
14.1.3.4 地域別売上分析、2021年
14.1.4 製品ベンチマーキング
14.1.5 戦略的な展望
14.2 Stryker Corporation
14.2.1 企業スナップショット
14.2.2 会社概要
14.2.3 財務分析
14.2.3.1 純収益、2017-2021年
14.2.3.2 売上総利益、2017-2021年
14.2.3.3 R&D、2017年~2021年
14.2.3.4 地域別売上分析、2021年
14.2.3.5 ビジネスセグメント収益分析、2021年
14.2.4 製品ベンチマーキング
14.2.5 戦略的な展望
14.3 Medtronic plc
14.3.1 企業スナップショット
14.3.2 会社概要
14.3.3 財務分析
14.3.3.1 純収益、2017-2021年
14.3.3.2 売上総利益、2017-2021年
14.3.3.3 r&d、2017年~2021年
14.3.3.4 ビジネスセグメント収益分析、2021年
14.3.4 製品ベンチマーキング
14.3.5 戦略的な展望
14.4 Smith & Nephew plc
14.4.1 企業スナップショット
14.4.2 会社概要
14.4.3 財務分析
14.4.3.1 純収益、2017-2021年
14.4.3.2 R&D、2017年~2021年
14.4.3.3 地域別売上分析、2021年
14.4.3.4 ビジネスセグメント収益分析、2021年
14.4.4 製品ベンチマーキング
14.4.5 戦略的な展望
14.5 Zimmer Biomet
14.5.1 企業スナップショット
14.5.2 会社概要
14.5.3 財務分析
14.5.3.1 純収益、2017-2021年
14.5.3.2 R&D、2017年~2021年
14.5.3.3 地域別売上分析、2021年
14.5.3.4 ビジネスセグメント収益分析、2021年
14.5.4 製品ベンチマーキング
14.5.5 戦略的な展望
14.6 Asensus Surgical
14.6.1 企業スナップショット
14.6.2 会社概要
14.6.3 製品ベンチマーキング
14.7 Renishaw
14.7.1 企業スナップショット
14.7.2 会社概要
14.7.3 製品ベンチマーキング
14.8 Medrobotics Corporation
14.8.1 企業スナップショット
14.8.2 会社概要
14.8.3 製品ベンチマーキング
14.9 Titan Medical Inc.
14.9.1 企業スナップショット
14.9.2 会社概要
14.9.3 製品ベンチマーキング
14.9.4 戦略的な展望
14.10 Think Surgical
14.10.1 企業スナップショット
14.10.2 会社概要
14.10.3 製品ベンチマーキング
14.10.4 戦略的な展望
14.11 Siemens Healthcare GmbH
14.11.1 企業スナップショット
14.11.2 会社概要
14.11.3 製品ベンチマーキング
14.12 Johnson & Johnson Services, Inc.
14.12.1 企業スナップショット
14.12.2 会社概要
14.12.3 財務分析
14.12.3.1 純収益、2017-2021年
14.12.3.2 売上総利益、2017-2021年
14.12.3.3 R&D、2017年~2021年
14.12.4 製品ベンチマーキング
14.12.5 戦略的な展望
14.13 Accuray, Inc.
14.13.1 企業スナップショット
14.13.2 会社概要
14.13.3 製品ベンチマーキング
14.13.4 戦略的な展望
15 結論と提言
15.1 ビジョンゲインからの結びの言葉
15.2 市場関係者への提言
表の一覧
Table 1 Surgical Robots Market Snapshot, 2023 & 2033 (US$ billion, CAGR %)
Table 2 Surgical Robots Market by Region, 2023-2033 (US$ bn, AGR (%), CAGR (%)) (V-Shaped Recovery Scenario)
Table 3 Surgical Robots Market by Region, 2023-2033 (US$ bn, AGR (%), CAGR (%)) (W-Shaped Recovery Scenario)
Table 4 Surgical Robots Market by Region, 2023-2033 (US$ bn, AGR (%), CAGR (%)) (U-Shaped Recovery Scenario)
Table 5 Surgical Robots Market by Region, 2023-2033 (US$ bn, AGR (%), CAGR (%)) (L-Shaped Recovery Scenario)
Table 6 Surgical Robots Market by End-User, 2023-2033 (US$ bn, AGR (%), CAGR (%))
Table 7 Ambulatory Surgery Centers Market Forecast by Region, 2023-2033 (US$ bn, AGR (%), CAGR (%))
Table 8 Hospitals Market by Region, 2023-2033 (US$ bn, AGR (%), CAGR (%))
Table 9 Surgical Robots Market by Components, 2023-2033 (US$ bn, AGR (%), CAGR (%))
Table 10 Robotic Systems Market by Region, 2023-2033 (US$ bn, AGR (%), CAGR (%))
Table 11 Instruments and Accessories Market by Region, 2023-2033 (US$ bn, AGR (%), CAGR (%))
Table 12 Services Market by Region, 2023-2033 (US$ bn, AGR (%), CAGR (%))
Table 13 Surgical Robots Market by Services, 2023-2033 (US$ bn, AGR (%), CAGR (%))
Table 14 Onsite Training Services Market by Region, 2023-2033 (US$ bn, AGR (%), CAGR (%))
Table 15 After Sales Services Market by Region, 2023-2033 (US$ bn, AGR (%), CAGR (%))
Table 16 Pre-Installation Consulting Services Market by Region, 2023-2033 (US$ bn, AGR (%), CAGR (%))
Table 17 Ancillary Services Market by Region, 2023-2033 (US$ bn, AGR (%), CAGR (%))
Table 18 Surgical Robots Market by Application, 2023-2033 (US$ bn, AGR (%), CAGR (%))
Table 19 General Surgery Market by Region, 2023-2033 (US$ bn, AGR (%), CAGR (%))
Table 20 Global Gynecological Surgery Market by Region, 2023-2033 (US$ bn, AGR (%), CAGR (%))
Table 21 Urological Surgery Market by Region, 2023-2033 (US$ bn, AGR (%), CAGR (%))
Table 22 Neurosurgery Market by Region, 2023-2033 (US$ bn, AGR (%), CAGR (%))
Table 23 Global Orthopedic Surgery Market by Region, 2023-2033 (US$ bn, AGR (%), CAGR (%))
Table 24 Other Applications Market by Region, 2023-2033 (US$ bn, AGR (%), CAGR (%))
Table 25 Surgical Robots Market by Region, 2023-2033 (US$ bn, AGR (%), CAGR (%))
Table 26 North America Surgical Robots Market by Country, 2023-2033 (US$ bn, AGR (%), CAGR (%))
Table 27 North America Surgical Robots Market by End-User, 2023-2033 (US$ bn, AGR (%), CAGR (%))
Table 28 North America Surgical Robots Market by Components, 2023-2033 (US$ bn, AGR (%), CAGR (%))
Table 29 North America Surgical Robots Market by Services, 2023-2033 (US$ bn, AGR (%), CAGR (%))
Table 30 North America Surgical Robots Market by Application, 2023-2033 (US$ bn, AGR (%), CAGR (%))
Table 31 US Surgical Robots Market by Value, 2023-2033 (US$ bn, AGR (%), CAGR (%))
Table 32 Canada Surgical Robots Market by Value, 2023-2033 (US$ bn, AGR (%), CAGR (%))
Table 33 Europe Surgical Robots Market by Country, 2023-2033 (US$ bn, AGR (%), CAGR (%))
Table 34 Europe Surgical Robots Market by End-User, 2023-2033 (US$ bn, AGR (%), CAGR (%))
Table 35 Europe Surgical Robots Market by Components, 2023-2033 (US$ bn, AGR (%), CAGR (%))
Table 36 Europe Surgical Robots Market by Services, 2023-2033 (US$ bn, AGR (%), CAGR (%))
Table 37 Europe Surgical Robots Market by Application, 2023-2033 (US$ bn, AGR (%), CAGR (%))
Table 38 Germany Surgical Robots Market by Value, 2023-2033 (US$ bn, AGR (%), CAGR (%))
Table 39 UK Surgical Robots Market by Value, 2023-2033 (US$ bn, AGR (%), CAGR (%))
Table 40 France Surgical Robots Market by Value, 2023-2033 (US$ bn, AGR (%), CAGR (%))
Table 41 Italy Surgical Robots Market by Value, 2023-2033 (US$ bn, AGR (%), CAGR (%))
Table 42 Spain Surgical Robots Market by Value, 2023-2033 (US$ bn, AGR (%), CAGR (%))
Table 43 Rest of Europe Surgical Robots Market by Value, 2023-2033 (US$ bn, AGR (%), CAGR (%))
Table 44 Asia-Pacific Surgical Robots Market by Country, 2023-2033 (US$ bn, AGR (%), CAGR (%))
Table 45 Asia-Pacific Surgical Robots Market by End-User, 2023-2033 (US$ bn, AGR (%), CAGR (%))
Table 46 Asia-Pacific Surgical Robots Market by Components, 2023-2033 (US$ bn, AGR (%), CAGR (%))
Table 47 Asia-Pacific Surgical Robots Market by Services, 2023-2033 (US$ bn, AGR (%), CAGR (%))
Table 48 Asia-Pacific Surgical Robots Market by Application, 2023-2033 (US$ bn, AGR (%), CAGR (%))
Table 49 Japan Surgical Robots Market by Value, 2023-2033 (US$ bn, AGR (%), CAGR (%))
Table 50 China Surgical Robots Market by Value, 2023-2033 (US$ bn, AGR (%), CAGR (%))
Table 51 India Surgical Robots Market by Value, 2023-2033 (US$ bn, AGR (%), CAGR (%))
Table 52 South Korea Surgical Robots Market by Value, 2023-2033 (US$ bn, AGR (%), CAGR (%))
Table 53 Australia Surgical Robots Market by Value, 2023-2033 (US$ bn, AGR (%), CAGR (%))
Table 54 Rest of Asia-Pacific Surgical Robots Market by Value, 2023-2033 (US$ bn, AGR (%), CAGR (%))
Table 55 Latin America Surgical Robots Market by Country, 2023-2033 (US$ bn, AGR (%), CAGR (%))
Table 56 Latin America Surgical Robots Market by End-User, 2023-2033 (US$ bn, AGR (%), CAGR (%))
Table 57 Latin America Surgical Robots Market by Components, 2023-2033 (US$ bn, AGR (%), CAGR (%))
Table 58 Latin America Surgical Robots Market by Services, 2023-2033 (US$ bn, AGR (%), CAGR (%))
Table 59 Latin America Surgical Robots Market by Application, 2023-2033 (US$ bn, AGR (%), CAGR (%))
Table 60 Brazil Surgical Robots Market by Value, 2023-2033 (US$ bn, AGR (%), CAGR (%))
Table 61 Mexico Surgical Robots Market by Value, 2023-2033 (US$ bn, AGR (%), CAGR (%))
Table 62 Rest of Latin America Surgical Robots Market by Value, 2023-2033 (US$ bn, AGR (%), CAGR (%))
Table 63 Middle East & Africa Surgical Robots Market by Country, 2023-2033 (US$ bn, AGR (%), CAGR (%))
Table 64 Middle East & Africa Surgical Robots Market by End-User, 2023-2033 (US$ bn, AGR (%), CAGR (%))
Table 65 Middle East & Africa Surgical Robots Market by Components, 2023-2033 (US$ bn, AGR (%), CAGR (%))
Table 66 Middle East & Africa Surgical Robots Market by Services, 2023-2033 (US$ bn, AGR (%), CAGR (%))
Table 67 Middle East & Africa Surgical Robots Market by Application, 2023-2033 (US$ bn, AGR (%), CAGR (%))
Table 68 GCC Surgical Robots Market by Value, 2023-2033 (US$ bn, AGR (%), CAGR (%))
Table 69 South Africa Surgical Robots Market by Value, 2023-2033 (US$ bn, AGR (%), CAGR (%))
Table 70 Rest of Middle East & Africa Surgical Robots Market by Value, 2023-2033 (US$ bn, AGR (%), CAGR (%))
Table 71 Intuitive Surgical, Inc: Key Details, (CEO, HQ, Revenue, Founded, No. of Employees, Company Type, Website, Business Segment)
Table 72 Intuitive Surgical, Inc: Product Benchmarking
Table 73 Intuitive Surgical, Inc: Strategic Outlook
Table 74 Stryker Corporation: Key Details, (CEO, HQ, Revenue, Founded, No. of Employees, Company Type, Website, Business Segment)
Table 75 Stryker Corporation: Product Benchmarking
Table 76 Stryker Corporation: Strategic Outlook
Table 77 Medtronic: Key Details, (CEO, HQ, Revenue, Founded, No. of Employees, Company Type, Website, Business Segment)
Table 78 Medtronic: Product Benchmarking
Table 79 Medtronic: Strategic Outlook
Table 80 Smith & Nephew: Key Details, (CEO, HQ, Revenue, Founded, No. of Employees, Company Type, Website, Business Segment)
Table 81 Smith & Nephew: Product Benchmarking
Table 82 Smith & Nephew: Strategic Outlook
Table 83 Zimmer Biomet: Key Details, (CEO, HQ, Revenue, Founded, No. of Employees, Company Type, Website, Business Segment)
Table 84 Zimmer Biomet: Product Benchmarking
Table 85 Zimmer Biomet: Strategic Outlook
Table 86 Asensus Surgical: Key Details, (CEO, HQ, Revenue, Founded, No. of Employees, Company Type, Website, Business Segment)
Table 87 Asensus Surgical: Product Benchmarking
Table 88 Renishaw: Key Details, (CEO, HQ, Revenue, Founded, No. of Employees, Company Type, Website, Business Segment)
Table 89 Renishaw: Product Benchmarking
Table 90 Medrobotics Corporation: Key Details, (CEO, HQ, Revenue, Founded, No. of Employees, Company Type, Website, Business Segment)
Table 91 Medrobotics Corporation: Product Benchmarking
Table 92 Titan Medical Inc: Key Details, (CEO, HQ, Revenue, Founded, No. of Employees, Company Type, Website, Business Segment)
Table 93 Titan Medical Inc: Product Benchmarking
Table 94 Titan Medical Inc: Strategic Outlook
Table 95 Think Surgical: Key Details, (CEO, HQ, Revenue, Founded, No. of Employees, Company Type, Website, Business Segment)
Table 96 Think Surgical: Product Benchmarking
Table 97 Think Surgical: Strategic Outlook
Table 98 Siemens Healthcare GmbH: Key Details, (CEO, HQ, Revenue, Founded, No. of Employees, Company Type, Website, Business Segment)
Table 99 Siemens Healthcare GmbH: Product Benchmarking
Table 100 Johnson & Johnson Services, Inc.: Key Details, (CEO, HQ, Revenue, Founded, No. of Employees, Company Type, Website, Business Segment)
Table 101 Johnson & Johnson Services, Inc.: Product Benchmarking
Table 102 Johnson & Johnson Services, Inc.: Strategic Outlook
Table 103 Accuray: Key Details, (CEO, HQ, Revenue, Founded, No. of Employees, Company Type, Website, Business Segment)
Table 104 Accuray: Product Benchmarking
Table 105 Accuray: Strategic Outlook
図の一覧
Figure 1 Surgical Robots Market Segmentation
Figure 2 Surgical Robots Market Forecast by Region: Market Attractiveness Index
Figure 3 Surgical Robots Market by End-user: Market Attractiveness Index
Figure 4 Surgical Robots Market by Components: Market Attractiveness Index
Figure 5 Surgical Robots Market by Services: Market Attractiveness Index
Figure 6 Surgical Robots Market by Application: Market Attractiveness Index
Figure 7 Surgical Robots Market: Market Dynamics
Figure 8 COVID Impact Analysis: Recovery Scenarios 2023-2033 (US$ bn, CAGR (%))
Figure 9 Surgical Robots Market by Region, 2023-2033 (US$ bn, AGR (%)) (V-Shaped Recovery Scenario)
Figure 10 Surgical Robots Market by Region, 2023-2033 (US$ bn, AGR (%)) (W-Shaped Recovery Scenario)
Figure 11 Surgical Robots Market by Region, 2023-2033 (US$ bn, AGR (%)) (U-Shaped Recovery Scenario)
Figure 12 Surgical Robots Market by Region, 2023-2033 (US$ bn, AGR (%)) (L-Shaped Recovery Scenario)
Figure 13 Surgical Robots Market: Porter’s Five Forces Analysis
Figure 14 Surgical Robots Market Forecast by End-user: Market Attractiveness Index
Figure 15 Surgical Robots Market Share Forecast by End-user, 2023& 2033 (%)
Figure 16 Surgical Robots Market by End-User, 2023-2033 (US$ bn, AGR (%))
Figure 17 Ambulatory Surgery Centers Market by Region, 2023-2033 (US$ bn, AGR (%))
Figure 18 Ambulatory Surgery Centers Market Forecast by Region, 2023 & 2033 (%)
Figure 19 Hospitals Market by Region, 2023-2033 (US$ bn, AGR (%))
Figure 20 Hospitals Market Share Forecast by Region, 2023 & 2033 (%)
Figure 21 Surgical Robots Market by Components: Market Attractiveness Index
Figure 22 Surgical Robots Market Share Forecast by Components, 2023, 20323(%)
Figure 23 Surgical Robots Market by Components, 2023-2033 (US$ bn, AGR (%))
Figure 24 Robotic Systems Market by Region, 2023-2033 (US$ bn, AGR (%))
Figure 25 Robotic Systems Market Share Forecast by Region, 2023 & 2033 (%)
Figure 26 Hybrid Robotic System Combining Robot and Rigid 6 DOF Robotic Arm
Figure 27 Instruments and Accessories Market by Region, 2023-2033 (US$ bn, AGR (%))
Figure 28 Instruments and Accessories Market Share Forecast by Region, 2023 & 2033 (%)
Figure 29 Services Market by Region, 2023-2033 (US$ bn, AGR (%))
Figure 30 Services Market Share Forecast by Region, 2023 & 2033 (%)
Figure 31 Surgical Robots Market by Services: Market Attractiveness Index
Figure 32 Surgical Robots Market Share Forecast by Services, 2023, 2033 (%)
Figure 33 Surgical Robots Market by Services, 2023-2033 (US$ bn, AGR (%))
Figure 34 Onsite Training Services Market by Region, 2023-2033 (US$ bn, AGR (%))
Figure 35 Onsite Training Services Market Share Forecast by Region, 2023 & 2033 (%)
Figure 36 After Sales Services Market by Region, 2023-2033 (US$ bn, AGR (%))
Figure 37 After Sales Services Market Share Forecast by Region, 2023 & 2033 (%)
Figure 38 Pre-Installation Consulting Services Market by Region, 2023-2033 (US$ bn, AGR (%))
Figure 39 Pre-Installation Consulting Services Market Share Forecast by Region, 2023 & 2033 (%)
Figure 40 Ancillary Services Market by Region, 2023-2033 (US$ bn, AGR (%))
Figure 41 Ancillary Services Market Share Forecast by Region, 2023 & 2033 (%)
Figure 42 Surgical Robots Market by Application: Market Attractiveness Index
Figure 43 Surgical Robots Market Share Forecast by Application, 2023, 2033 (%)
Figure 44 Surgical Robots Market by Application, 2023-2033 (US$ bn, AGR (%))
Figure 45 General Surgery Market by Region, 2023-2033 (US$ bn, AGR (%))
Figure 46 General Surgery Market Share Forecast by Region, 2023 & 2033 (%)
Figure 47 Global Gynecological Surgery Market by Region, 2023-2033 (US$ bn, AGR (%))
Figure 48 Gynecological Surgery Market Share Forecast by Region, 2023 & 2033 (%)
Figure 49 Urological Surgery Market by Region, 2023-2033 (US$ bn, AGR (%))
Figure 50 Urological Surgery Market Share Forecast by Region, 2023 & 2033 (%)
Figure 51 Neurosurgery Market by Region, 2023-2033 (US$ bn, AGR (%))
Figure 52 Neurosurgery Market Share Forecast by Region, 2023 & 2033 (%)
Figure 53 Global Orthopedic Surgery Market by Region, 2023-2033 (US$ bn, AGR (%))
Figure 54 Orthopedic Surgery Market Share Forecast by Region, 2023 & 2033 (%)
Figure 55 Global Other Application Market by Region, 2023-2033 (US$ bn, AGR (%))
Figure 56 Market Share Forecast by Region, 2023 & 2033 (%)
Figure 57 Surgical Robots Market Forecast by Region 2023-2033: Market Attractiveness Index
Figure 58 Surgical Robots Market Share Forecast by Application, 2023, 2033 (%)
Figure 59 Surgical Robots Market by Region, 2023-2033 (US$ bn, AGR (%))
Figure 60 North America Surgical Robots Market Attractiveness Index
Figure 61 North America Surgical Robots Market by Country, 2023-2033 (US$ bn, AGR (%))
Figure 62 North America Surgical Robots Market by End-User, 2023-2033 (US$ bn, AGR (%))
Figure 63 North America Surgical Robots Market by Components, 2023-2033 (US$ bn, AGR (%))
Figure 64 North America Surgical Robots Market by Services, 2023-2033 (US$ bn, AGR (%))
Figure 65 North America Surgical Robots Market by Application, 2023-2033 (US$ bn, AGR (%))
Figure 66 US Surgical Robots Market by Value, 2023-2033 (US$ bn, AGR (%))
Figure 67 Canada Surgical Robots Market by Value, 2023-2033 (US$ bn, AGR (%))
Figure 68 Europe Surgical Robots Market Attractive Index
Figure 69 Europe Surgical Robots Market by Country, 2023-2033 (US$ bn, AGR (%))
Figure 70 Europe Surgical Robots Market by End-User, 2023-2033 (US$ bn, AGR (%))
Figure 71 Europe Surgical Robots Market by Components, 2023-2033 (US$ bn, AGR (%))
Figure 72 Europe Surgical Robots Market by Services, 2023-2033 (US$ bn, AGR (%))
Figure 73 Europe Surgical Robots Market by Application, 2023-2033 (US$ bn, AGR (%))
Figure 74 Germany Surgical Robots Market by Value, 2023-2033 (US$ bn, AGR (%))
Figure 75 UK Surgical Robots Market by Value, 2023-2033 (US$ bn, AGR (%))
Figure 76 France Surgical Robots Market by Value, 2023-2033 (US$ bn, AGR (%))
Figure 77 Italy Surgical Robots Market by Value, 2023-2033 (US$ bn, AGR (%))
Figure 78 Spain Surgical Robots Market by Value, 2023-2033 (US$ bn, AGR (%))
Figure 79 Rest of Europe Surgical Robots Market by Value, 2023-2033 (US$ bn, AGR (%))
Figure 80 Asia-Pacific Surgical Robots Market Attractiveness Index
Figure 81 Asia-Pacific Surgical Robots Market by Country, 2023-2033 (US$ bn, AGR (%))
Figure 82 Asia-Pacific Surgical Robots Market by End-User, 2023-2033 (US$ bn, AGR (%))
Figure 83 Asia-Pacific Surgical Robots Market by Components, 2023-2033 (US$ bn, AGR (%))
Figure 84 Asia-Pacific Surgical Robots Market by Services, 2023-2033 (US$ bn, AGR (%))
Figure 85 Asia-Pacific Surgical Robots Market by Application, 2023-2033 (US$ bn, AGR (%))
Figure 86 Japan Surgical Robots Market by Value, 2023-2033 (US$ bn, AGR (%))
Figure 87 China Surgical Robots Market by Value, 2023-2033 (US$ bn, AGR (%))
Figure 88 India Surgical Robots Market by Value, 2023-2033 (US$ bn, AGR (%))
Figure 89 South Korea Surgical Robots Market by Value, 2023-2033 (US$ bn, AGR (%))
Figure 90 Australia Surgical Robots Market by Value, 2023-2033 (US$ bn, AGR (%))
Figure 91 Rest of Asia-Pacific Surgical Robots Market by Value, 2023-2033 (US$ bn, AGR (%))
Figure 92 Latin America Surgical Robots Market Attractiveness Index
Figure 93 Latin America Surgical Robots Market by Country, 2023-2033 (US$ bn, AGR (%))
Figure 94 Latin America Surgical Robots Market by End-User, 2023-2033 (US$ bn, AGR (%))
Figure 95 Latin America Surgical Robots Market by Components, 2023-2033 (US$ bn, AGR (%))
Figure 96 Latin America Surgical Robots Market by Services, 2023-2033 (US$ bn, AGR (%))
Figure 97 Latin America Surgical Robots Market by Application, 2023-2033 (US$ bn, AGR (%))
Figure 98 Brazil Surgical Robots Market by Value, 2023-2033 (US$ bn, AGR (%))
Figure 99 Mexico Surgical Robots Market by Value, 2023-2033 (US$ bn, AGR (%))
Figure 100 Rest of Latin America Surgical Robots Market by Value, 2023-2033 (US$ Bn, AGR (%)
Figure 101 Middle East & Africa Surgical Robots Market Attractiveness Index
Figure 102 Middle East & Africa Surgical Robots Market by Country, 2023-2033 (US$ bn, AGR (%))
Figure 103 Middle East & Africa Surgical Robots Market by End-User, 2023-2033 (US$ bn, AGR (%))
Figure 104 Middle East & Africa Surgical Robots Market by Components, 2023-2033 (US$ bn, AGR (%))
Figure 105 Middle East & Africa Surgical Robots Market by Services, 2023-2033 (US$ bn, AGR (%))
Figure 106 Middle East & Africa Surgical Robots Market by Application, 2023-2033 (US$ bn, AGR (%))
Figure 107 GCC Surgical Robots Market by Value, 2023-2033 (US$ bn, AGR (%))
Figure 108 South Africa Surgical Robots Market by Value, 2023-2033 (US$ bn, AGR (%))
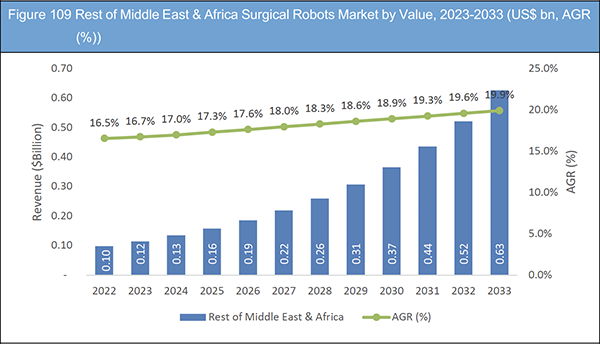
Figure 109 Rest of Middle East & Africa Surgical Robots Market by Value, 2023-2033 (US$ bn, AGR (%))
Figure 110 Intuitive Surgical, Inc.: Net Revenue, 2017-2021 (US$ million, AGR%)
Figure 111 Intuitive Surgical, Inc: Gross Profit, 2017-2021 (US$ million, AGR%)
Figure 112 Intuitive Surgical, Inc: R&D, 2017-2021 (US$ million, AGR%)
Figure 113 Intuitive Surgical, Inc: Regional Revenue, 2021 (%)
Figure 114 Stryker Corporation: Net Revenue, 2017-2021 (US$ million, AGR%)
Figure 115 Stryker Corporation: Gross Profit, 2017-2021 (US$ million, AGR%)
Figure 116 Stryker Corporation: R&D, 2017-2021 (US$ million, AGR%)
Figure 117 Stryker Corporation: Regional Revenue, 2021 (%)
Figure 118 Stryker Corporation: Business Segment Revenue, 2021 (%)
Figure 119 Medtronic: Net Revenue, 2017-2021 (US$ million, AGR%)
Figure 120 Medtronic: Gross Profit, 2017-2021 (US$ million, AGR%)
Figure 121 Medtronic: R&D, 2017-2021 (US$ million, AGR%)
Figure 122 Medtronic: Business Segment Revenue, 2021 (%)
Figure 123 Smith & Nephew: Net Revenue, 2017-2021 (US$ million, AGR%)
Figure 124 Smith & Nephew: R&D, 2017-2021 (US$ million, AGR%)
Figure 125 Smith & Nephew: Regional Revenue, 2021 (%)
Figure 126 Smith & Nephew: Business Segment Revenue, 2021 (%)
Figure 127 Zimmer Biomet: Net Revenue, 2017-2021 (US$ million, AGR%)
Figure 128 Zimmer Biomet: R&D, 2017-2021 (US$ million, AGR%)
Figure 129 Zimmer Biomet: Regional Revenue, 2021 (%)
Figure 130 Zimmer Biomet: Business Segment Revenue, 2021 (%)
Figure 131 Johnson & Johnson Services, Inc.: Net Revenue, 2017-2021 (US$ million, AGR%)
Figure 132 Johnson & Johnson Services, Inc.: Gross Profit, 2017-2021 (US$ million, AGR%)
Figure 133 Johnson & Johnson Services, Inc.: R&D, 2017-2021 (US$ million, AGR%)
ページTOPに戻る
Summary
Report Details
The Surgical Robots Market Report 2023-2033: This report will prove invaluable to leading firms striving for new revenue pockets if they wish to better understand the industry and its underlying dynamics. It will be useful for companies that would like to expand into different industries or to expand their existing operations in a new region.
Increasing Demand for Minimally Invasive Surgeries
Surgical robots have made significant advances in recent years, making it easier for physicians to perform minimally invasive procedures. This, in turn, has led to an increase in demand for surgical robots, driving the market growth. The advancements in robotics and computer technologies have paved the way for the development of new and improved surgical robots, making surgeries more accurate and efficient. This has fuelled the growth of the surgical robot market. However, one major challenge facing the surgical robot market is the high cost of the systems, which can make them inaccessible for many healthcare providers. However, the market is expected to become more accessible as technology advances and costs decrease.
What Questions Should You Ask before Buying a Market Research Report?
• How is the surgical robots market evolving?
• What is driving and restraining the surgical robots market?
• How will each surgical robots submarket segment grow over the forecast period and how much revenue will these submarkets account for in 2033?
• How will the market shares for each surgical robots submarket develop from 2023 to 2033?
• What will be the main driver for the overall market from 2023 to 2033?
• Will leading surgical robots markets broadly follow the macroeconomic dynamics, or will individual national markets outperform others?
• How will the market shares of the national markets change by 2033 and which geographical region will lead the market in 2033?
• Who are the leading players and what are their prospects over the forecast period?
• What are the surgical robots projects for these leading companies?
• How will the industry evolve during the period between 2023 and 2033? What are the implications of surgical robots projects taking place now and over the next 10 years?
• Is there a greater need for product commercialisation to further scale the surgical robots market?
• Where is the surgical robots market heading and how can you ensure you are at the forefront of the market?
• What are the best investment options for new product and service lines?
• What are the key prospects for moving companies into a new growth path and C-suite?
You need to discover how this will impact the surgical robots market today, and over the next 10 years:
• Our 256-page report provides 105 tables and 133 charts/graphs exclusively to you.
• The report highlights key lucrative areas in the industry so you can target them – NOW.
• It contains in-depth analysis of global, regional and national sales and growth.
• It highlights for you the key successful trends, changes and revenue projections made by your competitors.
This report tells you TODAY how the surgical robots market will develop in the next 10 years, and in line with the variations in COVID-19 economic recession and bounce. This market is more critical now than at any point over the last 10 years.
Forecasts to 2033 and other analyses reveal commercial prospects
• In addition to revenue forecasting to 2033, our new study provides you with recent results, growth rates, and market shares.
• You will find original analyses, with business outlooks and developments.
• Discover qualitative analyses (including market dynamics, drivers, opportunities, restraints and challenges), cost structure, impact of rising surgical robots prices and recent developments.
This report includes data analysis and invaluable insight into how COVID-19 will affect the industry and your company. Four COVID-19 recovery patterns and their impact, namely, “V”, “L”, “W” and “U” are discussed in this report.
Segments Covered in the Report
Components
• Robotic Systems
• Instruments and Accessories
• Services
Services
• Onsite Training Services
• After Sales Services
• Pre-Installation Consulting Services
• Ancillary Services
Application
• General Surgery
• Gynecological Surgery
• Urological Surgery
• Neurosurgery
• Orthopaedic Surgery
• Other Applications
End-users
• Ambulatory Surgery Centers
• Hospitals
In addition to the revenue predictions for the overall world market and segments, you will also find revenue forecasts for four regional and 20 leading national markets:
North America
• U.S.
• Canada
Europe
• Germany
• Spain
• United Kingdom
• France
• Italy
• Rest of Europe
Asia Pacific
• China
• Japan
• India
• Australia
• South Korea
• Rest of Asia Pacific
Latin America
• Brazil
• Mexico
• Rest of Latin America
Middle East & Africa
• GCC
• South Africa
• Rest of Middle East & Africa
The report also includes profiles and for some of the leading companies in the Surgical Robots Market, 2023 to 2033, with a focus on this segment of these companies’ operations.
Leading companies and the potential for market growth
• Accuray, Inc.
• Asensus Surgical
• Intuitive Surgical, Inc.
• Johnson & Johnson Services, Inc.
• Medrobotics Corporation
• Medtronic plc
• Renishaw
• Siemens Healthcare GmbH
• Smith & Nephew plc
• Stryker Corporation
• Think Surgical, Inc.
• Titan Medical Inc.
• Zimmer Biomet
Overall world revenue for Surgical Robots Market, 2023 to 2033 in terms of value the market will surpass US$9 billion in 2023, our work calculates. We predict strong revenue growth through to 2033. Our work identifies which organizations hold the greatest potential. Discover their capabilities, progress, and commercial prospects, helping you stay ahead.
How will the Surgical Robots Market, 2023 to 2033 report help you?
In summary, our 250+ page report provides you with the following knowledge:
• Revenue forecasts to 2033 for Surgical Robots Market, 2023 to 2033 Market, with forecasts for end-user, components, services, system, application and company size, each forecast at a global and regional level – discover the industry’s prospects, finding the most lucrative places for investments and revenues.
• Revenue forecasts to 2033 for four regional and 20 key national markets – See forecasts for the Surgical Robots Market, 2023 to 2033 market in North America, Europe, Asia-Pacific and LAMEA. Also forecasted is the market in the US, Canada, Brazil, Germany, France, UK, Italy, China, India, Japan, and Australia among other prominent economies.
• Prospects for established firms and those seeking to enter the market – including company profiles for 13 of the major companies involved in the Surgical Robots Market, 2023 to 2033.
Find quantitative and qualitative analyses with independent predictions. Receive information that only our report contains, staying informed with invaluable business intelligence.
Information found nowhere else
With our new report, you are less likely to fall behind in knowledge or miss out on opportunities. See how our work could benefit your research, analyses, and decisions. Visiongain’s study is for everybody needing commercial analyses for the Surgical Robots Market, 2023 to 2033, market-leading companies. You will find data, trends and predictions.
ページTOPに戻る
Table of Contents
Table of Contents
1. Report Overview
1.1 Objectives of the Study
1.2 Introduction to Surgical Robots Market
1.3 What This Report Delivers
1.4 Why You Should Read This Report
1.5 Key Questions Answered by This Analytical Report
1.6 Who is This Report for?
1.7 Methodology
1.7.1 Market Definitions
1.7.2 Market Evaluation & Forecasting Methodology
1.7.3 Data Validation
1.7.3.1 Primary Research
1.7.3.2 Secondary Research
1.8 Frequently Asked Questions (FAQs)
1.9 Associated Visiongain Reports
1.10 About Visiongain
2 Executive Summary
3 Market Overview
3.1 Key Findings
3.2 Market Dynamics
3.2.1 Market Driving Factors
3.2.1.1 Increasing Volume of Surgical Procedures and Growing Demand for Minimally Invasive Surgical Procedures
3.2.1.2 High Precision and Accuracy Compared to Conventional Procedures
3.2.2 Market Restraining Factors
3.2.2.1 Safety Concerns Associated with the Use of Surgical Robots
3.2.2.2 High Initial and Maintenance Costs of the Equipment
3.2.3 Market Opportunities
3.2.3.1 Development Potential of Surgical Robots
3.2.3.2 Success of Telesurgical Method
3.3 Supply Chain Overview
3.4 Value Chain Overview
3.5 COVID-19 Impact Analysis
3.6 Porter’s Five Forces Analysis
3.6.1 Bargaining Power of Suppliers
3.6.2 Buyer Power
3.6.3 Competitive Rivalry
3.6.4 Threat from Substitutes
3.6.5 Threat of New Entrants
3.7 PESTLE Analysis
3.7.1 Political Factors
3.7.2 Economic Factors
3.7.3 Social Factors
3.7.4 Technological Factors
4 Surgical Robots Market Analysis by End-user
4.1 Key Findings
4.2 End-user Segment: Market Attractiveness Index
4.3 Surgical Robots Market Share by End-user, 2023 & 2033
4.4 Surgical Robots Market by End-user
4.5 Ambulatory Surgery Centre
4.5.1 Market Size by Region, 2023-2033 (US$ bn)
4.5.2 Market Share by Region, 2023 & 2033 (%)
4.6 Hospitals
4.6.1 Market Size by Region, 2023-2033 (US$ bn)
4.6.2 Market Share by Region, 2023 & 2033 (%)
5 Surgical Robots Market Analysis by Components
5.1 Key Findings
5.2 Components Segment: Market Attractiveness Index
5.3 Surgical Robots Market Share by Components, 2023 & 2033
5.4 Surgical Robots Market by Components
5.5 Robotic Systems
5.5.1 Mobile Robotic Applications for Material Transportation in Hospitals
5.5.2 Exoskeletons
5.5.3 Surgical Robots
5.5.4 Mobile Telecare Robots
5.5.5 Market Size by Region, 2023-2033 (US$ bn)
5.5.6 Market Share by Region, 2023 & 2033 (%)
5.6 Instruments and Accessories
5.6.1 MIS Multi-arm Robotic Platforms
5.6.2 Robotic Platforms with High Redundancy
5.6.3 Continuum Robots for MIS
5.6.4 Robotics for Surgery Using Soft Robotics
5.6.5 Robotic Hybrid Platforms
5.6.6 Market Size by Region, 2023-2033 (US$ bn)
5.6.7 Market Share by Region, 2023 & 2033 (%)
5.7 Services
5.7.1 Market Size by Region, 2023-2033 (US$ bn)
5.7.2 Market Share by Region, 2023 & 2033 (%)
6 Surgical Robots Market Analysis by Services
6.1 Key Findings
6.2 Services Segment: Market Attractiveness Index
6.3 Surgical Robots Market Share by Services, 2023 & 2033
6.4 Surgical Robots Market by Services
6.5 Onsite Training Services
6.5.1 Market Size by Region, 2023-2033 (US$ bn)
6.5.2 Market Share by Region, 2023 & 2033 (%)
6.6 After Sales Services
6.6.1 Market Size by Region, 2023-2033 (US$ bn)
6.6.2 Market Share by Region, 2023 & 2033 (%)
6.7 Pre-Installation Consulting Services
6.7.1 Market Size by Region, 2023-2033 (US$ bn)
6.7.2 Market Share by Region, 2023 & 2033 (%)
6.8 Ancillary Services
6.8.1 Market Size by Region, 2023-2033 (US$ bn)
6.8.2 Market Share by Region, 2023 & 2033 (%)
7 Surgical Robots Market Analysis by Application
7.1 Key Findings
7.2 Application Segment: Market Attractiveness Index
7.3 Surgical Robots Market Share by Application, 2023 & 2033
7.3.1 Surgical Robots Market by Application
7.4 General Surgery
7.4.1 Market Size by Region, 2023-2033 (US$ bn)
7.4.2 Market Share by Region, 2023 & 2033 (%)
7.5 Gynaecological Surgery
7.5.1 Market Size by Region, 2023-2033 (US$ bn)
7.5.2 Market Share by Region, 2023 & 2033 (%)
7.6 Urological Surgery
7.6.1 Market Size by Region, 2023-2033 (US$ bn)
7.6.2 Market Share by Region, 2023 & 2033 (%)
7.7 Neurosurgery
7.7.1 Market Size by Region, 2023-2033 (US$ bn)
7.7.2 Market Share by Region, 2023 & 2033 (%)
7.8 Orthopaedic Surgery
7.8.1 Market Size by Region, 2023-2033 (US$ bn)
7.8.2 Market Share by Region, 2023 & 2033 (%)
7.9 Other Surgery
7.9.1 Market Size by Region, 2023-2033 (US$ bn)
7.9.2 Market Share by Region, 2023 & 2033 (%)
8 Surgical Robots Market Analysis by Region
8.1 Key Findings
8.2 Surgical Robots by Region Market Attractiveness Index
8.3 Surgical Robots Market Share by Region, 2023 & 2033
8.4 Market Size by Region, 2023-2033 (US$ bn)
9 North America Surgical Robots Market Analysis
9.1 Key Findings
9.2 North America Surgical Robots Market Attractiveness Index
9.3 North America Surgical Robots Market Size Estimation and Forecast by Country
9.4 North America Surgical Robots Market Size Estimation and Forecast by End-user
9.5 North America Surgical Robots Market Size Estimation and Forecast by Components
9.6 North America Surgical Robots Market Size Estimation and Forecast by Services
9.7 North America Surgical Robots Market Size Estimation and Forecast by Application
9.8 U.S. Surgical Robots Market Analysis
9.9 Canada Surgical Robots Market Analysis
10 Europe Surgical Robots Market Analysis
10.1 Key Findings
10.2 Europe Surgical Robots Market Attractiveness Index
10.3 Europe Surgical Robots Market Size Estimation and Forecast by Country
10.4 Europe Surgical Robots Market Size Estimation and Forecast by End-user
10.5 Europe Surgical Robots Market Size Estimation and Forecast by Components
10.6 Europe Surgical Robots Market Size Estimation and Forecast by Services
10.7 Europe Surgical Robots Market Size Estimation and Forecast by Application
10.8 Germany Surgical Robots Market Analysis
10.9 UK Surgical Robots Market Analysis
10.10 France Surgical Robots Market Analysis
10.11 Italy Surgical Robots Market Analysis
10.12 Spain Surgical Robots Market Analysis
10.13 Rest of Europe Market Forecast
11 Asia-Pacific Surgical Robots Market Analysis
11.1 Key Findings
11.2 Asia-Pacific Surgical Robots Market Attractiveness Index
11.3 Asia-Pacific Surgical Robots Market Size Estimation and Forecast by Country
11.4 Asia-Pacific Surgical Robots Market Size Estimation and Forecast by End-user
11.5 Asia-Pacific Surgical Robots Market Size Estimation and Forecast by Components
11.6 Asia-Pacific Surgical Robots Market Size Estimation and Forecast by Services
11.7 Asia-Pacific Surgical Robots Market Size Estimation and Forecast by Application
11.8 Japan Surgical Robots Market Analysis
11.9 China Surgical Robots Market Analysis
11.10 India Surgical Robots Market Analysis
11.11 South Korea Surgical Robots Market Analysis
11.12 Australia Surgical Robots Market Analysis
11.13 Rest of Asia Pacific Surgical Robots Market Analysis
12 Latin America Surgical Robots Market Analysis
12.1 Key Findings
12.2 Latin America Surgical Robots Market Attractiveness Index
12.3 Latin America Surgical Robots Market Size Estimation and Forecast by Country
12.4 Latin America Surgical Robots Market Size Estimation and Forecast by End-user
12.5 Latin America Surgical Robots Market Size Estimation and Forecast by Components
12.6 Latin America Surgical Robots Market Size Estimation and Forecast by Services
12.7 Latin America Surgical Robots Market Size Estimation and Forecast by Application
12.8 Brazil Surgical Robots Market Analysis
12.9 Mexico Surgical Robots Market Analysis
12.10 Rest of Latin America Surgical Robots Market Analysis
13 Middle East & Africa Surgical Robots Market Analysis
13.1 Key Findings
13.2 Middle East & Africa Surgical Robots Market Attractiveness Index
13.3 Middle East & Africa Surgical Robots Market Size Estimation and Forecast by Country
13.4 Middle East & Africa Surgical Robots Market Size Estimation and Forecast by End-user
13.5 Middle East & Africa Surgical Robots Market Size Estimation and Forecast by Components
13.6 Middle East & Africa Surgical Robots Market Size Estimation and Forecast by Services
13.7 Middle East & Africa Surgical Robots Market Size Estimation and Forecast by Application
13.8 GCC Surgical Robots Market Analysis
13.9 South Africa Surgical Robots Market Analysis
13.10 Rest of MEA Surgical Robots Market Analysis
14 Company Profiles
14.1 Intuitive Surgical, Inc.
14.1.1 Company Snapshot
14.1.2 Company Overview
14.1.3 Financial Analysis
14.1.3.1 Net Revenue, 2017-2021
14.1.3.2 Gross Profit, 2017-2021
14.1.3.3 R&D, 2017-2021
14.1.3.4 Regional Revenue Analysis, 2021
14.1.4 Product Benchmarking
14.1.5 Strategic Outlook
14.2 Stryker Corporation
14.2.1 Company Snapshot
14.2.2 Company Overview
14.2.3 Financial Analysis
14.2.3.1 Net Revenue, 2017-2021
14.2.3.2 Gross Profit, 2017-2021
14.2.3.3 R&D, 2017-2021
14.2.3.4 Regional Revenue Analysis, 2021
14.2.3.5 Business Segment Revenue Analysis, 2021
14.2.4 Product Benchmarking
14.2.5 Strategic Outlook
14.3 Medtronic plc
14.3.1 Company Snapshot
14.3.2 Company Overview
14.3.3 Financial Analysis
14.3.3.1 Net Revenue, 2017-2021
14.3.3.2 Gross Profit, 2017-2021
14.3.3.3 R&D, 2017-2021
14.3.3.4 Business Segment Revenue Analysis, 2021
14.3.4 Product Benchmarking
14.3.5 Strategic Outlook
14.4 Smith & Nephew plc
14.4.1 Company Snapshot
14.4.2 Company Overview
14.4.3 Financial Analysis
14.4.3.1 Net Revenue, 2017-2021
14.4.3.2 R&D, 2017-2021
14.4.3.3 Regional Revenue Analysis, 2021
14.4.3.4 Business Segment Revenue Analysis, 2021
14.4.4 Product Benchmarking
14.4.5 Strategic Outlook
14.5 Zimmer Biomet
14.5.1 Company Snapshot
14.5.2 Company Overview
14.5.3 Financial Analysis
14.5.3.1 Net Revenue, 2017-2021
14.5.3.2 R&D, 2017-2021
14.5.3.3 Regional Revenue Analysis, 2021
14.5.3.4 Business Segment Revenue Analysis, 2021
14.5.4 Product Benchmarking
14.5.5 Strategic Outlook
14.6 Asensus Surgical
14.6.1 Company Snapshot
14.6.2 Company Overview
14.6.3 Product Benchmarking
14.7 Renishaw
14.7.1 Company Snapshot
14.7.2 Company Overview
14.7.3 Product Benchmarking
14.8 Medrobotics Corporation
14.8.1 Company Snapshot
14.8.2 Company Overview
14.8.3 Product Benchmarking
14.9 Titan Medical Inc.
14.9.1 Company Snapshot
14.9.2 Company Overview
14.9.3 Product Benchmarking
14.9.4 Strategic Outlook
14.10 Think Surgical
14.10.1 Company Snapshot
14.10.2 Company Overview
14.10.3 Product Benchmarking
14.10.4 Strategic Outlook
14.11 Siemens Healthcare GmbH
14.11.1 Company Snapshot
14.11.2 Company Overview
14.11.3 Product Benchmarking
14.12 Johnson & Johnson Services, Inc.
14.12.1 Company Snapshot
14.12.2 Company Overview
14.12.3 Financial Analysis
14.12.3.1 Net Revenue, 2017-2021
14.12.3.2 Gross Profit, 2017-2021
14.12.3.3 R&D, 2017-2021
14.12.4 Product Benchmarking
14.12.5 Strategic Outlook
14.13 Accuray, Inc.
14.13.1 Company Snapshot
14.13.2 Company Overview
14.13.3 Product Benchmarking
14.13.4 Strategic Outlook
15 Conclusion and Recommendations
15.1 Concluding Remarks from Visiongain
15.2 Recommendations for Market Players
List of Tables
Table 1 Surgical Robots Market Snapshot, 2023 & 2033 (US$ billion, CAGR %)
Table 2 Surgical Robots Market by Region, 2023-2033 (US$ bn, AGR (%), CAGR (%)) (V-Shaped Recovery Scenario)
Table 3 Surgical Robots Market by Region, 2023-2033 (US$ bn, AGR (%), CAGR (%)) (W-Shaped Recovery Scenario)
Table 4 Surgical Robots Market by Region, 2023-2033 (US$ bn, AGR (%), CAGR (%)) (U-Shaped Recovery Scenario)
Table 5 Surgical Robots Market by Region, 2023-2033 (US$ bn, AGR (%), CAGR (%)) (L-Shaped Recovery Scenario)
Table 6 Surgical Robots Market by End-User, 2023-2033 (US$ bn, AGR (%), CAGR (%))
Table 7 Ambulatory Surgery Centers Market Forecast by Region, 2023-2033 (US$ bn, AGR (%), CAGR (%))
Table 8 Hospitals Market by Region, 2023-2033 (US$ bn, AGR (%), CAGR (%))
Table 9 Surgical Robots Market by Components, 2023-2033 (US$ bn, AGR (%), CAGR (%))
Table 10 Robotic Systems Market by Region, 2023-2033 (US$ bn, AGR (%), CAGR (%))
Table 11 Instruments and Accessories Market by Region, 2023-2033 (US$ bn, AGR (%), CAGR (%))
Table 12 Services Market by Region, 2023-2033 (US$ bn, AGR (%), CAGR (%))
Table 13 Surgical Robots Market by Services, 2023-2033 (US$ bn, AGR (%), CAGR (%))
Table 14 Onsite Training Services Market by Region, 2023-2033 (US$ bn, AGR (%), CAGR (%))
Table 15 After Sales Services Market by Region, 2023-2033 (US$ bn, AGR (%), CAGR (%))
Table 16 Pre-Installation Consulting Services Market by Region, 2023-2033 (US$ bn, AGR (%), CAGR (%))
Table 17 Ancillary Services Market by Region, 2023-2033 (US$ bn, AGR (%), CAGR (%))
Table 18 Surgical Robots Market by Application, 2023-2033 (US$ bn, AGR (%), CAGR (%))
Table 19 General Surgery Market by Region, 2023-2033 (US$ bn, AGR (%), CAGR (%))
Table 20 Global Gynecological Surgery Market by Region, 2023-2033 (US$ bn, AGR (%), CAGR (%))
Table 21 Urological Surgery Market by Region, 2023-2033 (US$ bn, AGR (%), CAGR (%))
Table 22 Neurosurgery Market by Region, 2023-2033 (US$ bn, AGR (%), CAGR (%))
Table 23 Global Orthopedic Surgery Market by Region, 2023-2033 (US$ bn, AGR (%), CAGR (%))
Table 24 Other Applications Market by Region, 2023-2033 (US$ bn, AGR (%), CAGR (%))
Table 25 Surgical Robots Market by Region, 2023-2033 (US$ bn, AGR (%), CAGR (%))
Table 26 North America Surgical Robots Market by Country, 2023-2033 (US$ bn, AGR (%), CAGR (%))
Table 27 North America Surgical Robots Market by End-User, 2023-2033 (US$ bn, AGR (%), CAGR (%))
Table 28 North America Surgical Robots Market by Components, 2023-2033 (US$ bn, AGR (%), CAGR (%))
Table 29 North America Surgical Robots Market by Services, 2023-2033 (US$ bn, AGR (%), CAGR (%))
Table 30 North America Surgical Robots Market by Application, 2023-2033 (US$ bn, AGR (%), CAGR (%))
Table 31 US Surgical Robots Market by Value, 2023-2033 (US$ bn, AGR (%), CAGR (%))
Table 32 Canada Surgical Robots Market by Value, 2023-2033 (US$ bn, AGR (%), CAGR (%))
Table 33 Europe Surgical Robots Market by Country, 2023-2033 (US$ bn, AGR (%), CAGR (%))
Table 34 Europe Surgical Robots Market by End-User, 2023-2033 (US$ bn, AGR (%), CAGR (%))
Table 35 Europe Surgical Robots Market by Components, 2023-2033 (US$ bn, AGR (%), CAGR (%))
Table 36 Europe Surgical Robots Market by Services, 2023-2033 (US$ bn, AGR (%), CAGR (%))
Table 37 Europe Surgical Robots Market by Application, 2023-2033 (US$ bn, AGR (%), CAGR (%))
Table 38 Germany Surgical Robots Market by Value, 2023-2033 (US$ bn, AGR (%), CAGR (%))
Table 39 UK Surgical Robots Market by Value, 2023-2033 (US$ bn, AGR (%), CAGR (%))
Table 40 France Surgical Robots Market by Value, 2023-2033 (US$ bn, AGR (%), CAGR (%))
Table 41 Italy Surgical Robots Market by Value, 2023-2033 (US$ bn, AGR (%), CAGR (%))
Table 42 Spain Surgical Robots Market by Value, 2023-2033 (US$ bn, AGR (%), CAGR (%))
Table 43 Rest of Europe Surgical Robots Market by Value, 2023-2033 (US$ bn, AGR (%), CAGR (%))
Table 44 Asia-Pacific Surgical Robots Market by Country, 2023-2033 (US$ bn, AGR (%), CAGR (%))
Table 45 Asia-Pacific Surgical Robots Market by End-User, 2023-2033 (US$ bn, AGR (%), CAGR (%))
Table 46 Asia-Pacific Surgical Robots Market by Components, 2023-2033 (US$ bn, AGR (%), CAGR (%))
Table 47 Asia-Pacific Surgical Robots Market by Services, 2023-2033 (US$ bn, AGR (%), CAGR (%))
Table 48 Asia-Pacific Surgical Robots Market by Application, 2023-2033 (US$ bn, AGR (%), CAGR (%))
Table 49 Japan Surgical Robots Market by Value, 2023-2033 (US$ bn, AGR (%), CAGR (%))
Table 50 China Surgical Robots Market by Value, 2023-2033 (US$ bn, AGR (%), CAGR (%))
Table 51 India Surgical Robots Market by Value, 2023-2033 (US$ bn, AGR (%), CAGR (%))
Table 52 South Korea Surgical Robots Market by Value, 2023-2033 (US$ bn, AGR (%), CAGR (%))
Table 53 Australia Surgical Robots Market by Value, 2023-2033 (US$ bn, AGR (%), CAGR (%))
Table 54 Rest of Asia-Pacific Surgical Robots Market by Value, 2023-2033 (US$ bn, AGR (%), CAGR (%))
Table 55 Latin America Surgical Robots Market by Country, 2023-2033 (US$ bn, AGR (%), CAGR (%))
Table 56 Latin America Surgical Robots Market by End-User, 2023-2033 (US$ bn, AGR (%), CAGR (%))
Table 57 Latin America Surgical Robots Market by Components, 2023-2033 (US$ bn, AGR (%), CAGR (%))
Table 58 Latin America Surgical Robots Market by Services, 2023-2033 (US$ bn, AGR (%), CAGR (%))
Table 59 Latin America Surgical Robots Market by Application, 2023-2033 (US$ bn, AGR (%), CAGR (%))
Table 60 Brazil Surgical Robots Market by Value, 2023-2033 (US$ bn, AGR (%), CAGR (%))
Table 61 Mexico Surgical Robots Market by Value, 2023-2033 (US$ bn, AGR (%), CAGR (%))
Table 62 Rest of Latin America Surgical Robots Market by Value, 2023-2033 (US$ bn, AGR (%), CAGR (%))
Table 63 Middle East & Africa Surgical Robots Market by Country, 2023-2033 (US$ bn, AGR (%), CAGR (%))
Table 64 Middle East & Africa Surgical Robots Market by End-User, 2023-2033 (US$ bn, AGR (%), CAGR (%))
Table 65 Middle East & Africa Surgical Robots Market by Components, 2023-2033 (US$ bn, AGR (%), CAGR (%))
Table 66 Middle East & Africa Surgical Robots Market by Services, 2023-2033 (US$ bn, AGR (%), CAGR (%))
Table 67 Middle East & Africa Surgical Robots Market by Application, 2023-2033 (US$ bn, AGR (%), CAGR (%))
Table 68 GCC Surgical Robots Market by Value, 2023-2033 (US$ bn, AGR (%), CAGR (%))
Table 69 South Africa Surgical Robots Market by Value, 2023-2033 (US$ bn, AGR (%), CAGR (%))
Table 70 Rest of Middle East & Africa Surgical Robots Market by Value, 2023-2033 (US$ bn, AGR (%), CAGR (%))
Table 71 Intuitive Surgical, Inc: Key Details, (CEO, HQ, Revenue, Founded, No. of Employees, Company Type, Website, Business Segment)
Table 72 Intuitive Surgical, Inc: Product Benchmarking
Table 73 Intuitive Surgical, Inc: Strategic Outlook
Table 74 Stryker Corporation: Key Details, (CEO, HQ, Revenue, Founded, No. of Employees, Company Type, Website, Business Segment)
Table 75 Stryker Corporation: Product Benchmarking
Table 76 Stryker Corporation: Strategic Outlook
Table 77 Medtronic: Key Details, (CEO, HQ, Revenue, Founded, No. of Employees, Company Type, Website, Business Segment)
Table 78 Medtronic: Product Benchmarking
Table 79 Medtronic: Strategic Outlook
Table 80 Smith & Nephew: Key Details, (CEO, HQ, Revenue, Founded, No. of Employees, Company Type, Website, Business Segment)
Table 81 Smith & Nephew: Product Benchmarking
Table 82 Smith & Nephew: Strategic Outlook
Table 83 Zimmer Biomet: Key Details, (CEO, HQ, Revenue, Founded, No. of Employees, Company Type, Website, Business Segment)
Table 84 Zimmer Biomet: Product Benchmarking
Table 85 Zimmer Biomet: Strategic Outlook
Table 86 Asensus Surgical: Key Details, (CEO, HQ, Revenue, Founded, No. of Employees, Company Type, Website, Business Segment)
Table 87 Asensus Surgical: Product Benchmarking
Table 88 Renishaw: Key Details, (CEO, HQ, Revenue, Founded, No. of Employees, Company Type, Website, Business Segment)
Table 89 Renishaw: Product Benchmarking
Table 90 Medrobotics Corporation: Key Details, (CEO, HQ, Revenue, Founded, No. of Employees, Company Type, Website, Business Segment)
Table 91 Medrobotics Corporation: Product Benchmarking
Table 92 Titan Medical Inc: Key Details, (CEO, HQ, Revenue, Founded, No. of Employees, Company Type, Website, Business Segment)
Table 93 Titan Medical Inc: Product Benchmarking
Table 94 Titan Medical Inc: Strategic Outlook
Table 95 Think Surgical: Key Details, (CEO, HQ, Revenue, Founded, No. of Employees, Company Type, Website, Business Segment)
Table 96 Think Surgical: Product Benchmarking
Table 97 Think Surgical: Strategic Outlook
Table 98 Siemens Healthcare GmbH: Key Details, (CEO, HQ, Revenue, Founded, No. of Employees, Company Type, Website, Business Segment)
Table 99 Siemens Healthcare GmbH: Product Benchmarking
Table 100 Johnson & Johnson Services, Inc.: Key Details, (CEO, HQ, Revenue, Founded, No. of Employees, Company Type, Website, Business Segment)
Table 101 Johnson & Johnson Services, Inc.: Product Benchmarking
Table 102 Johnson & Johnson Services, Inc.: Strategic Outlook
Table 103 Accuray: Key Details, (CEO, HQ, Revenue, Founded, No. of Employees, Company Type, Website, Business Segment)
Table 104 Accuray: Product Benchmarking
Table 105 Accuray: Strategic Outlook
List of Figures
Figure 1 Surgical Robots Market Segmentation
Figure 2 Surgical Robots Market Forecast by Region: Market Attractiveness Index
Figure 3 Surgical Robots Market by End-user: Market Attractiveness Index
Figure 4 Surgical Robots Market by Components: Market Attractiveness Index
Figure 5 Surgical Robots Market by Services: Market Attractiveness Index
Figure 6 Surgical Robots Market by Application: Market Attractiveness Index
Figure 7 Surgical Robots Market: Market Dynamics
Figure 8 COVID Impact Analysis: Recovery Scenarios 2023-2033 (US$ bn, CAGR (%))
Figure 9 Surgical Robots Market by Region, 2023-2033 (US$ bn, AGR (%)) (V-Shaped Recovery Scenario)
Figure 10 Surgical Robots Market by Region, 2023-2033 (US$ bn, AGR (%)) (W-Shaped Recovery Scenario)
Figure 11 Surgical Robots Market by Region, 2023-2033 (US$ bn, AGR (%)) (U-Shaped Recovery Scenario)
Figure 12 Surgical Robots Market by Region, 2023-2033 (US$ bn, AGR (%)) (L-Shaped Recovery Scenario)
Figure 13 Surgical Robots Market: Porter’s Five Forces Analysis
Figure 14 Surgical Robots Market Forecast by End-user: Market Attractiveness Index
Figure 15 Surgical Robots Market Share Forecast by End-user, 2023& 2033 (%)
Figure 16 Surgical Robots Market by End-User, 2023-2033 (US$ bn, AGR (%))
Figure 17 Ambulatory Surgery Centers Market by Region, 2023-2033 (US$ bn, AGR (%))
Figure 18 Ambulatory Surgery Centers Market Forecast by Region, 2023 & 2033 (%)
Figure 19 Hospitals Market by Region, 2023-2033 (US$ bn, AGR (%))
Figure 20 Hospitals Market Share Forecast by Region, 2023 & 2033 (%)
Figure 21 Surgical Robots Market by Components: Market Attractiveness Index
Figure 22 Surgical Robots Market Share Forecast by Components, 2023, 20323(%)
Figure 23 Surgical Robots Market by Components, 2023-2033 (US$ bn, AGR (%))
Figure 24 Robotic Systems Market by Region, 2023-2033 (US$ bn, AGR (%))
Figure 25 Robotic Systems Market Share Forecast by Region, 2023 & 2033 (%)
Figure 26 Hybrid Robotic System Combining Robot and Rigid 6 DOF Robotic Arm
Figure 27 Instruments and Accessories Market by Region, 2023-2033 (US$ bn, AGR (%))
Figure 28 Instruments and Accessories Market Share Forecast by Region, 2023 & 2033 (%)
Figure 29 Services Market by Region, 2023-2033 (US$ bn, AGR (%))
Figure 30 Services Market Share Forecast by Region, 2023 & 2033 (%)
Figure 31 Surgical Robots Market by Services: Market Attractiveness Index
Figure 32 Surgical Robots Market Share Forecast by Services, 2023, 2033 (%)
Figure 33 Surgical Robots Market by Services, 2023-2033 (US$ bn, AGR (%))
Figure 34 Onsite Training Services Market by Region, 2023-2033 (US$ bn, AGR (%))
Figure 35 Onsite Training Services Market Share Forecast by Region, 2023 & 2033 (%)
Figure 36 After Sales Services Market by Region, 2023-2033 (US$ bn, AGR (%))
Figure 37 After Sales Services Market Share Forecast by Region, 2023 & 2033 (%)
Figure 38 Pre-Installation Consulting Services Market by Region, 2023-2033 (US$ bn, AGR (%))
Figure 39 Pre-Installation Consulting Services Market Share Forecast by Region, 2023 & 2033 (%)
Figure 40 Ancillary Services Market by Region, 2023-2033 (US$ bn, AGR (%))
Figure 41 Ancillary Services Market Share Forecast by Region, 2023 & 2033 (%)
Figure 42 Surgical Robots Market by Application: Market Attractiveness Index
Figure 43 Surgical Robots Market Share Forecast by Application, 2023, 2033 (%)
Figure 44 Surgical Robots Market by Application, 2023-2033 (US$ bn, AGR (%))
Figure 45 General Surgery Market by Region, 2023-2033 (US$ bn, AGR (%))
Figure 46 General Surgery Market Share Forecast by Region, 2023 & 2033 (%)
Figure 47 Global Gynecological Surgery Market by Region, 2023-2033 (US$ bn, AGR (%))
Figure 48 Gynecological Surgery Market Share Forecast by Region, 2023 & 2033 (%)
Figure 49 Urological Surgery Market by Region, 2023-2033 (US$ bn, AGR (%))
Figure 50 Urological Surgery Market Share Forecast by Region, 2023 & 2033 (%)
Figure 51 Neurosurgery Market by Region, 2023-2033 (US$ bn, AGR (%))
Figure 52 Neurosurgery Market Share Forecast by Region, 2023 & 2033 (%)
Figure 53 Global Orthopedic Surgery Market by Region, 2023-2033 (US$ bn, AGR (%))
Figure 54 Orthopedic Surgery Market Share Forecast by Region, 2023 & 2033 (%)
Figure 55 Global Other Application Market by Region, 2023-2033 (US$ bn, AGR (%))
Figure 56 Market Share Forecast by Region, 2023 & 2033 (%)
Figure 57 Surgical Robots Market Forecast by Region 2023-2033: Market Attractiveness Index
Figure 58 Surgical Robots Market Share Forecast by Application, 2023, 2033 (%)
Figure 59 Surgical Robots Market by Region, 2023-2033 (US$ bn, AGR (%))
Figure 60 North America Surgical Robots Market Attractiveness Index
Figure 61 North America Surgical Robots Market by Country, 2023-2033 (US$ bn, AGR (%))
Figure 62 North America Surgical Robots Market by End-User, 2023-2033 (US$ bn, AGR (%))
Figure 63 North America Surgical Robots Market by Components, 2023-2033 (US$ bn, AGR (%))
Figure 64 North America Surgical Robots Market by Services, 2023-2033 (US$ bn, AGR (%))
Figure 65 North America Surgical Robots Market by Application, 2023-2033 (US$ bn, AGR (%))
Figure 66 US Surgical Robots Market by Value, 2023-2033 (US$ bn, AGR (%))
Figure 67 Canada Surgical Robots Market by Value, 2023-2033 (US$ bn, AGR (%))
Figure 68 Europe Surgical Robots Market Attractive Index
Figure 69 Europe Surgical Robots Market by Country, 2023-2033 (US$ bn, AGR (%))
Figure 70 Europe Surgical Robots Market by End-User, 2023-2033 (US$ bn, AGR (%))
Figure 71 Europe Surgical Robots Market by Components, 2023-2033 (US$ bn, AGR (%))
Figure 72 Europe Surgical Robots Market by Services, 2023-2033 (US$ bn, AGR (%))
Figure 73 Europe Surgical Robots Market by Application, 2023-2033 (US$ bn, AGR (%))
Figure 74 Germany Surgical Robots Market by Value, 2023-2033 (US$ bn, AGR (%))
Figure 75 UK Surgical Robots Market by Value, 2023-2033 (US$ bn, AGR (%))
Figure 76 France Surgical Robots Market by Value, 2023-2033 (US$ bn, AGR (%))
Figure 77 Italy Surgical Robots Market by Value, 2023-2033 (US$ bn, AGR (%))
Figure 78 Spain Surgical Robots Market by Value, 2023-2033 (US$ bn, AGR (%))
Figure 79 Rest of Europe Surgical Robots Market by Value, 2023-2033 (US$ bn, AGR (%))
Figure 80 Asia-Pacific Surgical Robots Market Attractiveness Index
Figure 81 Asia-Pacific Surgical Robots Market by Country, 2023-2033 (US$ bn, AGR (%))
Figure 82 Asia-Pacific Surgical Robots Market by End-User, 2023-2033 (US$ bn, AGR (%))
Figure 83 Asia-Pacific Surgical Robots Market by Components, 2023-2033 (US$ bn, AGR (%))
Figure 84 Asia-Pacific Surgical Robots Market by Services, 2023-2033 (US$ bn, AGR (%))
Figure 85 Asia-Pacific Surgical Robots Market by Application, 2023-2033 (US$ bn, AGR (%))
Figure 86 Japan Surgical Robots Market by Value, 2023-2033 (US$ bn, AGR (%))
Figure 87 China Surgical Robots Market by Value, 2023-2033 (US$ bn, AGR (%))
Figure 88 India Surgical Robots Market by Value, 2023-2033 (US$ bn, AGR (%))
Figure 89 South Korea Surgical Robots Market by Value, 2023-2033 (US$ bn, AGR (%))
Figure 90 Australia Surgical Robots Market by Value, 2023-2033 (US$ bn, AGR (%))
Figure 91 Rest of Asia-Pacific Surgical Robots Market by Value, 2023-2033 (US$ bn, AGR (%))
Figure 92 Latin America Surgical Robots Market Attractiveness Index
Figure 93 Latin America Surgical Robots Market by Country, 2023-2033 (US$ bn, AGR (%))
Figure 94 Latin America Surgical Robots Market by End-User, 2023-2033 (US$ bn, AGR (%))
Figure 95 Latin America Surgical Robots Market by Components, 2023-2033 (US$ bn, AGR (%))
Figure 96 Latin America Surgical Robots Market by Services, 2023-2033 (US$ bn, AGR (%))
Figure 97 Latin America Surgical Robots Market by Application, 2023-2033 (US$ bn, AGR (%))
Figure 98 Brazil Surgical Robots Market by Value, 2023-2033 (US$ bn, AGR (%))
Figure 99 Mexico Surgical Robots Market by Value, 2023-2033 (US$ bn, AGR (%))
Figure 100 Rest of Latin America Surgical Robots Market by Value, 2023-2033 (US$ Bn, AGR (%)
Figure 101 Middle East & Africa Surgical Robots Market Attractiveness Index
Figure 102 Middle East & Africa Surgical Robots Market by Country, 2023-2033 (US$ bn, AGR (%))
Figure 103 Middle East & Africa Surgical Robots Market by End-User, 2023-2033 (US$ bn, AGR (%))
Figure 104 Middle East & Africa Surgical Robots Market by Components, 2023-2033 (US$ bn, AGR (%))
Figure 105 Middle East & Africa Surgical Robots Market by Services, 2023-2033 (US$ bn, AGR (%))
Figure 106 Middle East & Africa Surgical Robots Market by Application, 2023-2033 (US$ bn, AGR (%))
Figure 107 GCC Surgical Robots Market by Value, 2023-2033 (US$ bn, AGR (%))
Figure 108 South Africa Surgical Robots Market by Value, 2023-2033 (US$ bn, AGR (%))
Figure 109 Rest of Middle East & Africa Surgical Robots Market by Value, 2023-2033 (US$ bn, AGR (%))
Figure 110 Intuitive Surgical, Inc.: Net Revenue, 2017-2021 (US$ million, AGR%)
Figure 111 Intuitive Surgical, Inc: Gross Profit, 2017-2021 (US$ million, AGR%)
Figure 112 Intuitive Surgical, Inc: R&D, 2017-2021 (US$ million, AGR%)
Figure 113 Intuitive Surgical, Inc: Regional Revenue, 2021 (%)
Figure 114 Stryker Corporation: Net Revenue, 2017-2021 (US$ million, AGR%)
Figure 115 Stryker Corporation: Gross Profit, 2017-2021 (US$ million, AGR%)
Figure 116 Stryker Corporation: R&D, 2017-2021 (US$ million, AGR%)
Figure 117 Stryker Corporation: Regional Revenue, 2021 (%)
Figure 118 Stryker Corporation: Business Segment Revenue, 2021 (%)
Figure 119 Medtronic: Net Revenue, 2017-2021 (US$ million, AGR%)
Figure 120 Medtronic: Gross Profit, 2017-2021 (US$ million, AGR%)
Figure 121 Medtronic: R&D, 2017-2021 (US$ million, AGR%)
Figure 122 Medtronic: Business Segment Revenue, 2021 (%)
Figure 123 Smith & Nephew: Net Revenue, 2017-2021 (US$ million, AGR%)
Figure 124 Smith & Nephew: R&D, 2017-2021 (US$ million, AGR%)
Figure 125 Smith & Nephew: Regional Revenue, 2021 (%)
Figure 126 Smith & Nephew: Business Segment Revenue, 2021 (%)
Figure 127 Zimmer Biomet: Net Revenue, 2017-2021 (US$ million, AGR%)
Figure 128 Zimmer Biomet: R&D, 2017-2021 (US$ million, AGR%)
Figure 129 Zimmer Biomet: Regional Revenue, 2021 (%)
Figure 130 Zimmer Biomet: Business Segment Revenue, 2021 (%)
Figure 131 Johnson & Johnson Services, Inc.: Net Revenue, 2017-2021 (US$ million, AGR%)
Figure 132 Johnson & Johnson Services, Inc.: Gross Profit, 2017-2021 (US$ million, AGR%)
Figure 133 Johnson & Johnson Services, Inc.: R&D, 2017-2021 (US$ million, AGR%)
ページTOPに戻る
-
医療用プラスチックコンパウンドの世界市場製品別(ポリ塩化ビニル、ポリエチレン、ポリプロピレン、ポリスチレン、ポリエステル、ポリカーボネート、ポリウレタン、アクリル、その他)、用途別(ディスポーザブル、カテーテル、手術器具、医療用バッグ、インプラント、ドラッグデリバリーシステム、その他)、地域別の分析とCOVID-19の影響と動向、2029年までの予測
-
泌尿器科手術器具の世界市場規模調査、製品別(内視鏡、エンビジョンシステム、周辺システム、消耗品・アクセサリー)、用途別(慢性腎臓病、前立腺肥大症、尿路結石、尿失禁・骨盤臓器脱、腫瘍、その他用途)、地域別予測:2022-2032年
-
ヘルスケア/メディカルシミュレーション市場:製品・サービス(解剖モデル、患者シミュレータ(ハイフィデリティ、ローフィデリティ)、タスクトレーナー、手術シミュレータ、ソフトウェア、サービス)、エンドユーザー(学術機関、病院)別 - 2027年までの世界市場予測
-
Medical Power Supply Market by Converter Type (AC-DC, DC-DC), Application (MRI, ECG, EEG, PET, CT Scan, Ultrasound, X-ray, RF Mammography, Surgical Equipment, Dental Equipment), Manufacturing Type (Enclosed, External, U Bracket) - Global Forecasts to 2027
-
動物用創傷治療市場:製品別(外科用(縫合糸&ステープラー、接着剤)、高機能(ハイドロコロイド、ハイドロゲルドレッシング)、従来型(テープ、ドレッシング、包帯)、動物種別(猫、犬、馬、豚)、エンドユーザー(病院、クリニック)-2027年までの世界市場予測
-
病院用ガウンの市場規模、シェア、動向分析レポート:タイプ別(手術用、非手術用、患者用ガウン)、使用性別(使い捨て、再利用可能)、リスクタイプ別(最小、最大)、地域別、およびセグメント予測、2022年~2030年
-
中国の外科用バイポーラ鉗子の市場レポートと予測 2021-2027年
-
ヘルスケア/医療シミュレーション市場:製品・サービス別(患者シミュレーター、高忠実度シミュレーター、低忠実度シミュレーター、タスクトレーナー、手術シミュレーター、バーチャルチューターエンドユーザー別(学術機関、病院) - 2026年までの世界予測
-
世界の歯科診断・外科市場は、タイプ別(歯科用機器・システム、歯科用レーザー、歯科用放射線機器、その他)、治療法別(矯正、歯内療法、歯周療法、補綴)、エンドユーザー別(病院、診療所)、地域別予測2021-2027で構成されています。
よくあるご質問
Visiongain社はどのような調査会社ですか?
英国の調査会社ヴィジョンゲイン社(Visiongain)は、通信とエネルギーのほか、自動車や化学・医薬品、金属など、広範な市場を対象に調査を行っています。自動車市場については、市場全般に関する調査のほ... もっと見る
調査レポートの納品までの日数はどの程度ですか?
在庫のあるものは速納となりますが、平均的には 3-4日と見て下さい。
但し、一部の調査レポートでは、発注を受けた段階で内容更新をして納品をする場合もあります。
発注をする前のお問合せをお願いします。
注文の手続きはどのようになっていますか?
1)お客様からの御問い合わせをいただきます。
2)見積書やサンプルの提示をいたします。
3)お客様指定、もしくは弊社の発注書をメール添付にて発送してください。
4)データリソース社からレポート発行元の調査会社へ納品手配します。
5) 調査会社からお客様へ納品されます。最近は、pdfにてのメール納品が大半です。
お支払方法の方法はどのようになっていますか?
納品と同時にデータリソース社よりお客様へ請求書(必要に応じて納品書も)を発送いたします。
お客様よりデータリソース社へ(通常は円払い)の御振り込みをお願いします。
請求書は、納品日の日付で発行しますので、翌月最終営業日までの当社指定口座への振込みをお願いします。振込み手数料は御社負担にてお願いします。
お客様の御支払い条件が60日以上の場合は御相談ください。
尚、初めてのお取引先や個人の場合、前払いをお願いすることもあります。ご了承のほど、お願いします。
データリソース社はどのような会社ですか?
当社は、世界各国の主要調査会社・レポート出版社と提携し、世界各国の市場調査レポートや技術動向レポートなどを日本国内の企業・公官庁及び教育研究機関に提供しております。
世界各国の「市場・技術・法規制などの」実情を調査・収集される時には、データリソース社にご相談ください。
お客様の御要望にあったデータや情報を抽出する為のレポート紹介や調査のアドバイスも致します。
|
|


