希少疾患市場レポート:2023-2033
Rare Diseases Market Report 2023-2033
レポート詳細
希少疾患市場レポート 2023-2033 : 本レポートは、業界とその基礎となるダイナミクスをよりよく理解したい場合、新たな収益ポケットを目指す大手企業にとって貴重なものとなります。ま... もっと見る
※上記価格は部署ライセンス(Departmental licence)価格です。
その他の価格についてはデータリソースまでお問合せください。
日本語のページは自動翻訳を利用し作成しています。
実際のレポートは英文のみでご納品いたします。
サマリー
レポート詳細
希少疾患市場レポート 2023-2033: 本レポートは、業界とその基礎となるダイナミクスをよりよく理解したい場合、新たな収益ポケットを目指す大手企業にとって貴重なものとなります。また、異業種への進出や新地域での既存事業の拡大を目指す企業にとっても有益なレポートです。
在宅医療は今後大きな成長が期待される
高齢で虚弱な人が複数の疾患を抱えている場合、満たされていないニーズがありますが、現在の多くの支援サービスは、希少疾患や超希少疾患の患者さんに焦点を当てています。また、若年層であっても、多くの慢性疾患を抱える患者さんが存在します。そのため、在宅医療を拡大することは、より大きな患者層や医療システムにプラスの効果をもたらす可能性があります。
医療の複雑性が高いため、併存疾患や多疾患の管理は特に困難である。心不全の患者さんが、がんの点滴治療も必要な場合、点滴施設まで移動しなければならないため、利尿剤の投与タイミングが問題となります。在宅医療は、医療水準の向上、患者満足度の向上、経費削減のための強力な起爆剤となる可能性があります。複雑な疾患や希少疾患を持つ患者や介護者にとって、明らかに明確なメリットがある一方で、治療の複雑さや併存疾患や多疾病の影響により困難に直面する、より広範囲な疾患を持つ患者集団にとってもメリットがあります。
マーケットリサーチレポートを購入する前に、どのような質問をするべきか?
- 希少疾患市場はどのように進化しているのか?
- 希少疾患市場を牽引し、抑制しているものは何か?
- 各希少疾患サブマーケットセグメントは予測期間中にどのように成長し、2033年にこれらのサブマーケットが占める売上はいくらになるのか?
- 2023年から2033年にかけて、各希少疾患サブマーケットの市場シェアはどのように推移するのか?
- 2023年から2033年にかけて、市場全体の主な牽引役となるのは何か?
- 希少疾患の主要市場はマクロ経済のダイナミクスに広く追随するのか、それとも個々の国内市場が他を凌駕するのか?
- 2033年までに各国市場のシェアはどのように変化し、2033年に市場をリードするのはどの地域か?
- 主要プレイヤーは誰で、予測期間中の見通しはどうなっているのか?
- これらの主要企業の希少疾患プロジェクトは何か?
- - 2023年から2033年の間に、業界はどのように発展していくのか?現在および今後10年間に行われる希少疾患プロジェクトはどのような意味を持つのか?
- 希少疾患市場をさらに拡大するために、製品の商業化の必要性は高まっているのでしょうか?
- 希少疾患市場の方向性と、市場の最前線に立つためにはどうしたらよいか?
- 新製品やサービスラインに対する最適な投資オプションは何か?
- 企業を新たな成長軌道に乗せ、C-suiteに移行させるための重要な展望は何か?
このことが、現在、そして今後10年間の希少疾病市場にどのような影響を与えるかを見極める必要があります:
- 290ページにわたる本レポートでは、107の表と186のチャート/グラフを独占的に提供します。
- 本レポートでは、業界における主要な収益性の高い分野を取り上げており、今すぐその分野をターゲットにすることができます。
- 世界、地域、国の売上と成長を詳細に分析しています。
- 競合他社が成功した主要なトレンド、変化、収益予測をハイライトしています。
本レポートは、希少疾患市場が今後10年間にどのように発展するか、またCOVID-19の景気後退やバウンスの変化に合わせて、今日あなたにお伝えします。この市場は、過去10年間のどの時点よりも今が重要です。
2033年までの予測やその他の分析により、商業的な展望を明らかにする。
- 2033年までの収益予測に加え、直近の実績や成長率、市場シェアなど、本調査では
- ビジネスの展望や展開など、独自の分析がご覧いただけます。
- 定性的分析(市場力学、促進要因、機会、阻害要因など)、ポーターのファイブフォース分析、PEST分析、最近の動向をご覧いただけます。
本レポートには、COVID-19が業界や貴社にどのような影響を与えるかについてのデータ分析および貴重な洞察が含まれています。COVID-19の4つの回収パターンとその影響、すなわち「V」、「L」、「W」、「U」については、本レポートで解説しています。
報告書の対象セグメント
疾患別
- がん
- 代謝性疾患
- 神経系疾患
- 血液疾患
- 感染症
- 筋骨格系疾患
- 循環器疾患
- その他
タイプ
- 非生物製剤
- 生物製剤
エンドユーザー
- 専門薬局
- 病院薬局
- 小売薬局
年齢
- 成人
- 小児
世界市場全体およびセグメントの収益予測に加え、5つの地域および21の主要国市場の収益予測も掲載しています:
北米
- 米国
- カナダ
欧州
- ドイツ
- 英国
- フランス
- イタリア
- スペイン
- ロシア
- その他の欧州地域
アジア太平洋
- 日本
- 中国
- インド
- オーストラリア
- 韓国
- その他のアジア太平洋地域
ラテンアメリカ
- ブラジル
- メキシコ
- その他のラテンアメリカ
MEA
- GCC
- 南ア
- その他のMEA地域
.png)
また、希少疾患市場の2023年から2033年にかけての主要企業のプロファイルと、これらの企業のこのセグメントに焦点を当てたいくつかの企業についても記載しています。
主要企業と市場成長の可能性
・ AbbVie Inc.
・ Alexion Pharmaceuticals, Inc. (AstraZeneca)
・ Amgen Inc.
・ Biogen Inc.
・ Bristol-Myers Squibb Company
・ F. Hoffmann-La Roche Ltd.
・ Johnson & Johnson Services, Inc.
・ Merck & Co Inc.
・ Novartis AG
・ Pfizer Inc.
・ Sanofi S.A.
・ Takeda Pharmaceuticals
・ Teva Pharmaceuticals
希少疾患市場の世界全体の収益、2023年から2033年までの金額ベースで、2023年に2050億米ドルを突破することが、当研究所の計算で判明しました。2033年まで収益が大きく伸びることが予測されます。当社の調査では、最も大きな可能性を秘めた企業を特定しています。企業の能力、進歩、商業的展望を明らかにすることで、常に優位に立つことができるようにします。
希少疾患市場、2023年から2033年までのレポートはどのように役立つのでしょうか?
要約すると、290ページに及ぶ本レポートは以下の知識を提供します:
- 希少疾患市場、2023年から2033年までの収益予測:疾患、タイプ、エンドユーザー、年齢の各予測を世界および地域レベルで掲載 - 業界の展望を発見し、投資や収益に最も有利な場所を見つけることができます。
- 5つの地域と21の主要国市場の2033年までの収益予測 - 希少疾患市場、2023年から2033年の北米、欧州、アジア太平洋、ラテンアメリカ、MEAの市場予測をご覧いただけます。また、米国、カナダ、メキシコ、ブラジル、ドイツ、フランス、英国、イタリア、中国、インド、日本、オーストラリアなど、著名な経済圏の市場も予測しています。
- 既存企業および市場参入を目指す企業の展望 - 希少疾患市場に関わる主要企業13社の企業プロファイルを含む、2023年から2033年の市場。
独自の予測による定量・定性分析をご覧いただけます。私たちのレポートだけが持つ情報を入手し、貴重なビジネスインテリジェンスとして情報を得ることができます。
他にはない情報
私たちの新しいレポートがあれば、知識に遅れをとったり、チャンスを逃したりする可能性は低くなります。私たちの仕事があなたの調査、分析、意思決定にどのように役立つかをご覧ください。Visiongainの研究は、希少疾患市場、2023年から2033年、市場をリードする企業の商業分析を必要とするすべての人のためのものです。データ、トレンド、予測を見つけることができます。
ページTOPに戻る
目次
レポート詳細
1. レポートの概要
1.1 研究の目的
1.2 希少疾患市場の紹介
1.3 本レポートの特徴
1.4 本レポートを読むべき理由
1.5 本分析レポートが回答する主な質問は以下の通りです
1.6 本レポートは誰のためのものか?
1.7 方法論
1.7.1 市場の定義
1.7.2 市場評価・予測手法
1.7.3 データバリデーション
1.7.3.1 一次調査
1.7.3.2 セカンダリーリサーチ
1.8 よくある質問(FAQ)
1.9 Visiongainの関連レポート
1.10 Visiongainについて
2 エグゼクティブサマリー
3 市場概要
3.1 主要な調査結果
3.2 マーケットダイナミクス
3.2.1 市場促進要因
3.2.1.1 認可件数の増加が市場成長を促進する
3.2.1.2 主要プレイヤーによるロバストパイプライン
3.2.1.2.1 ファイザー希少疾患パイプライン
3.2.1.2.2 サノフィジェンザイム株式会社 希少疾患パイプライン
3.2.1.2.3 ノボノルディスク 希少疾患パイプライン
3.2.1.3 認知度の向上
3.2.2 市場の抑制要因
3.2.2.1 高い研究開発費
3.2.2.2 高い参入障壁が市場成長を阻む
3.2.2.3 患者の身体管理が市場成長の妨げになる可能性が高い
3.2.3 市場参入の機会
3.2.3.1 新興国からの需要の増加
3.2.3.2 有利な成長が期待される在宅医療
3.2.3.3 政府支援の強化
3.2.3.4 希少疾患の適応症別臨床活動状況
3.3 COVID-19の影響度分析
3.4 ポーターのファイブフォース分析
3.4.1 買い手のバーゲニングパワー(低)
3.4.2 サプライヤーのバーゲニングパワー(中)
3.4.3 代替品の脅威(低)
3.4.4 新規参入の脅威(低)
3.4.5 業界の競争力(高)
4 希少疾患市場分析:疾患別
4.1 主要な調査結果
4.2 疾患別セグメント市場魅力度指数
4.3 希少疾患の疾患別市場規模の推定と予測
4.4 がん
4.4.1 地域別市場予測、2023-2033年(US$ bn)
4.4.2 地域別市場シェア、2023年&2033年(%)
4.5 代謝性疾患
4.5.1 地域別市場予測、2023-2033年(US$ bn)
4.5.2 地域別市場シェア、2023年&2033年(%)
4.6 神経系疾患
4.6.1 地域別市場予測、2023-2033年(US$ bn)
4.6.2 地域別市場シェア、2023年&2033年(%)
4.7 血液疾患
4.7.1 地域別市場予測、2023-2033年(US$ bn)
4.7.2 地域別市場シェア、2023年&2033年(%)
4.8 感染症
4.8.1 地域別市場予測、2023-2033年(US$ bn)
4.8.2 地域別市場シェア、2023年&2033年(%)
4.9 筋骨格系疾患
4.9.1 地域別市場予測、2023-2033年(US$ bn)
4.9.2 地域別市場シェア、2023年&2033年(%)
4.10 心血管系疾患
4.10.1 地域別市場予測、2023-2033年(US$ bn)
4.10.2 地域別市場シェア、2023年&2033年(%)
4.11 その他
4.11.1 地域別市場予測、2023-2033年(US$ bn)
4.11.2 地域別市場シェア、2023年&2033年(%)
5 希少疾患市場分析:タイプ別
5.1 主要な調査結果
5.2 タイプ別セグメント 市場魅力度指数
5.3 希少疾患の種類別市場規模の推定と予測
5.4 非生物製剤
5.4.1 地域別市場予測、2023-2033年(US$ bn)
5.4.2 地域別市場シェア、2023年&2033年(%)
5.5 生物製剤
5.5.1 地域別市場予測、2023-2033年(US$ bn)
5.5.2 地域別市場シェア、2023年&2033年(%)
6 希少疾患市場分析:エンドユーザー別
6.1 主要な調査結果
6.2 エンドユーザセグメント: 市場魅力度指数
6.3 希少疾患のエンドユーザー別市場規模の推定と予測
6.4 専門薬局
6.4.1 地域別市場予測、2023-2033年(US$ bn)
6.4.2 地域別市場シェア、2023年&2033年(%)
6.5 病院内薬局
6.5.1 地域別市場予測、2023-2033年(US$ bn)
6.5.2 地域別市場シェア、2023年&2033年(%)
6.6 小売薬局
6.6.1 地域別市場予測、2023-2033年(US$ bn)
6.6.2 地域別市場シェア、2023年&2033年(%)
7 希少疾患市場分析:年齢別
7.1 主要な調査結果
7.2 年齢別セグメント: 市場魅力度指数
7.3 希少疾患の年齢別市場規模の推定と予測
7.4 成人
7.4.1 地域別市場予測、2023-2033年(US$ bn)
7.4.2 地域別市場シェア、2023年&2033年(%)
7.5 小児
7.5.1 地域別市場予測、2023-2033年(US$ bn)
7.5.2 地域別市場シェア、2023年&2033年(%)
8 希少疾患市場分析:地域別
8.1 主要な調査結果
8.2 地域別市場規模の推計と予測
9 北米の希少疾患市場分析
9.1 主要な調査結果
9.2 北米希少疾患市場魅力度指数
9.3 国別市場規模、2023年、2028年、2033年(US$ bn)
9.4 国別市場規模の推定と予測、2023-2033年(US$ bn)
9.5 疾患別市場規模の推定と予測、2023-2033年(US$ bn
9.6 タイプ別市場規模の推定と予測、2023-2033年(US$ bn)
9.7 エンドユーザー別市場規模の推定と予測、2023-2033年(US$ bn)
9.8 年齢別市場規模の推定と予測、2023-2033年(US$ bn)
9.9 米国の希少疾患市場分析
9.10 カナダの希少疾患市場分析
10 欧州の希少疾病市場分析
10.1 キーファインディング
10.2 欧州レア疾患市場魅力度指数
10.3 国別市場規模、2023年、2028年&2033年(US$ bn)
10.4 国別市場規模の推定と予測、2023-2033年(US$ bn)
10.5 疾患別市場規模の推定と予測、2023-2033年(US$ bn
10.6 タイプ別市場規模の推定と予測、2023-2033年(US$ bn)
10.7 エンドユーザー別市場規模の推定と予測、2023-2033年(US$ bn)
10.8 年齢別市場規模の推定と予測、2023-2033年の(US$ bn)
10.9 ドイツの希少疾病市場の分析
10.10 英国希少疾患市場の分析
10.11 フランスの希少疾病市場の分析
10.12 イタリア 希少疾病の市場分析
10.13 スペインの希少疾病市場の分析
10.14 ロシア レア疾患市場の分析
10.15 その他の欧州のレア疾患市場の分析
11 アジア太平洋地域の希少疾患市場分析
11.1 主要な調査結果
11.2 アジア太平洋地域の希少疾患市場魅力度指数
11.3 国別市場規模、2023年、2028年、2033年(US$ bn
11.4 国別市場規模の推定と予測、2023-2033年(US$ bn)
11.5 疾患別市場規模の推定と予測、2023-2033年、(US$ bn
11.6 タイプ別市場規模の推定と予測、2023-2033年(US$ bn)
11.7 エンドユーザー別市場規模の推定と予測、2023-2033年(US$ bn)
11.8 年齢別市場規模推計と予測、2023-2033年(US$ bn)
11.9 日本希少疾患市場分析
11.10 中国 希少疾患市場分析
11.11 インド 希少疾患市場分析
11.12 オーストラリア 希少疾患市場分析
11.13 韓国 希少疾患市場分析
11.14 その他のアジア太平洋地域の希少疾患市場の分析
12 ラテンアメリカの希少疾患市場分析
12.1 キーファインディング
12.2 ラテンアメリカ 希少疾患市場魅力度指数
12.3 国別市場規模、2023年、2028年、2033年(US$ bn)
12.4 国別市場規模の推定と予測、2023-2033年(US$ bn)
12.5 疾患別市場規模の推定と予測、2023-2033年(US$ bn
12.6 タイプ別市場規模の推定と予測、2023-2033年(US$ bn)
12.7 エンドユーザー別市場規模の推定と予測、2023-2033年(US$ bn)
12.8 年齢別市場規模の推定と予測、2023-2033年(US$ bn)
12.9 ブラジル希少疾患市場分析
12.10 メキシコ 希少疾患市場分析
12.11 ラテンアメリカの残りの希少疾患市場の分析
13 MEAの希少疾患市場の分析
13.1 キーファインディング
13.2 MEA 希少疾患市場魅力度指数
13.3 国別市場規模、2023年、2028年、2033年(US$ bn)
13.4 国別市場規模の推定と予測、2023-2033年(US$ bn)
13.5 疾患別市場規模の推定と予測、2023-2033年(US$ bn)
13.6 タイプ別市場規模の推定と予測、2023-2033年(US$ bn)
13.7 エンドユーザー別市場規模の推定と予測、2023-2033年(US$ bn)
13.8 年齢別市場規模の推定と予測、2023-2033年(US$ bn)
13.9 GCC 希少疾患市場分析
13.10 南アフリカ 希少疾患市場分析
13.11 MEAのその他の地域の希少疾患市場の分析
14 会社概要
14.1 AbbVie Inc.
14.1.1 企業スナップショット
14.1.2 会社概要
14.1.3 財務分析
14.1.3.1 純収益、2015-2022年
14.1.3.2 地域別市場シェア、2021年
14.1.3.3 売上総利益、2015-2022年
14.1.3.4 R&D、2015年~2022年
14.1.4 製品ベンチマーキング
14.2 Alexion Pharmaceuticals, Inc. (AstraZeneca)
14.2.1 企業スナップショット
14.2.2 会社概要
14.2.3 製品ベンチマーキング
14.2.4 戦略的な展望
14.3 Amgen Inc.
14.3.1 企業スナップショット
14.3.2 会社概要
14.3.3 財務分析
14.3.3.1 純収益、2015年~2022年
14.3.3.2 地域別市場シェア、2022年
14.3.3.3 売上総利益、2015年~2022年
14.3.3.4 R&D、2015年~2022年
14.3.4 製品ベンチマーキング
14.3.5 戦略的な展望
14.4 Biogen Inc.
14.4.1 企業スナップショット
14.4.2 会社概要
14.4.3 財務分析
14.4.3.1 純収益、2015-2021年
14.4.3.2 売上総利益、2015-2021年
14.4.3.3 R&D、2015年~2021年
14.4.4 製品ベンチマーキング
14.4.5 戦略的な展望
14.5 F. Hoffmann-La Roche Ltd.
14.5.1 企業スナップショット
14.5.2 会社概要
14.5.3 財務分析
14.5.3.1 純収益、2015-2021年
14.5.3.2 売上総利益、2015-2021年
14.5.3.3 R&D、2015年~2021年
14.5.4 製品ベンチマーキング
14.5.5 戦略的な展望
14.6 Johnson & Johnson Services, Inc.
14.6.1 企業スナップショット
14.6.2 会社概要
14.6.3 財務分析
14.6.3.1 純収益、2015-2022年
14.6.3.2 地域別市場占有率、2021年
14.6.3.3 売上総利益、2015-2022年
14.6.3.4 R&D、2015年~2022年
14.6.4 製品ベンチマーキング
14.6.5 戦略的な展望
14.7 Merck & Co Inc.
14.7.1 企業スナップショット
14.7.2 会社概要
14.7.3 財務分析
14.7.3.1 純収益、2015-2022年
14.7.3.2 地域別市場占有率、2021年
14.7.3.3 売上総利益、2015-2022年
14.7.3.4 R&D、2015年~2022年
14.7.4 製品ベンチマーキング
14.8 Novartis AG
14.8.1 企業スナップショット
14.8.2 会社概要
14.8.3 財務分析
14.8.3.1 純収益、2015-2022年
14.8.3.2 地域別市場占有率、2021年
14.8.3.3 売上総利益、2015年~2022年
14.8.3.4 R&D、2015年~2022年
14.8.4 製品ベンチマーキング
14.8.5 戦略的な展望
14.9 Pfizer Inc.
14.9.1 企業スナップショット
14.9.2 会社概要
14.9.3 財務分析
14.9.3.1 純収益、2015-2022年
14.9.3.2 地域別市場占有率、2021年
14.9.3.3 売上総利益、2015-2022年
14.9.3.4 R&D、2015年~2022年
14.9.4 製品ベンチマーキング
14.9.5 戦略的な展望
14.10 Sanofi S.A.
14.10.1 企業スナップショット
14.10.2 会社概要
14.10.3 財務分析
14.10.3.1 純収益、2015-2022年
14.10.3.2 地域別市場占有率、2021年
14.10.3.3 売上総利益、2015年~2022年
14.10.3.4 R&D、2015年~2022年
14.10.4 製品ベンチマーキング
14.11 Takeda Pharmaceuticals
14.11.1 企業スナップショット
14.11.2 会社概要
14.11.3 財務分析
14.11.3.1 純収益、2015-2022年
14.11.3.2 売上総利益、2015年~2022年
14.11.3.3 R&D、2015年~2022年
14.11.4 製品ベンチマーキング
14.11.5 戦略的な展望
14.12 Teva Pharmaceuticals
14.12.1 企業スナップショット
14.12.2 会社概要
14.12.3 財務分析
14.12.3.1 純収益、2015-2021年
14.12.3.2 地域別市場占有率、2021年
14.12.3.3 売上総利益、2015-2021年
14.12.3.4 R&D、2015-2021年
14.12.4 製品ベンチマーキング
14.12.5 戦略的な展望
14.13 Bristol-Myers Squibb Company
14.13.1 企業スナップショット
14.13.2 会社概要
14.13.3 財務分析
14.13.3.1 純収益、2015-2022年
14.13.3.2 売上総利益、2015年~2022年
14.13.3.3 R&D、2015年~2022年
14.13.4 製品ベンチマーキング
14.13.5 戦略的な展望
15 結論と提言
15.1 ビジョンゲインからの結びの言葉
15.2 市場関係者への提言
表の一覧
Table 1 Prevalence Criteria Used by Regulatory Agencies to Define Rare Diseases
Table 2 Rare Diseases Market Snapshot, 2023 & 2033 (US$ billion, CAGR %)
Table 3 Rare Diseases Market Forecast by Region, 2023-2033 (US$ bn, AGR%, CAGR%): "V" Shaped Recovery
Table 4 Rare Diseases Market Forecast by Region, 2023-2033 (US$ bn, AGR%, CAGR%): "U" Shaped Recovery
Table 5 Rare Diseases Market Forecast by Region, 2023-2033 (US$ bn, AGR%, CAGR%): "W" Shaped Recovery
Table 6 Rare Diseases Market Forecast by Region, 2023-2033 (US$ bn, AGR%, CAGR%): "L" Shaped Recovery
Table 7 Key Factors Affecting the Bargaining Power of Buyer
Table 8 Key Factors Affecting the Bargaining Power of Suppliers
Table 9 Key Factors Affecting the Threat of Substitutes
Table 10 Key Factors Affecting the Threat of New Entrants
Table 11 Key Factors Affecting the Industry Rivalry
Table 12 Rare Diseases Market Forecast by Disease, 2023-2033 (US$ bn, AGR%, CAGR%)
Table 13 Cancer Segment Market Forecast by Region, 2023-2033 (US$ bn, AGR%, CAGR%)
Table 14 Metabolic Diseases Segment Market Forecast by Region, 2023-2033 (US$ bn, AGR%, CAGR%)
Table 15 Neurological Conditions Segment Market Forecast by Region, 2023-2033 (US$ bn, AGR%, CAGR%)
Table 16 Hematologic Disorders Segment Market Forecast by Region, 2023-2033 (US$ bn, AGR%, CAGR%)
Table 17 Infectious Diseases Segment Market Forecast by Region, 2023-2033 (US$ bn, AGR%, CAGR%)
Table 18 Musculoskeletal Disorders Segment Market Forecast by Region, 2023-2033 (US$ bn, AGR%, CAGR%)
Table 19 Cardiovascular Disorders Segment Market Forecast by Region, 2023-2033 (US$ bn, AGR%, CAGR%)
Table 20 Others Segment Market Forecast by Region, 2023-2033 (US$ bn, AGR%, CAGR%)
Table 21 Rare Diseases Market Forecast by Type, 2023-2033 (US$ bn, AGR%, CAGR%)
Table 22 Non-biologics Segment Market Forecast by Region, 2023-2033 (US$ bn, AGR%, CAGR%)
Table 23 Biologics Segment Market Forecast by Region, 2023-2033 (US$ bn, AGR%, CAGR%)
Table 24 Rare Diseases Market Forecast by End-use, 2023-2033 (US$ bn, AGR%, CAGR%)
Table 25 Specialty Pharmacies Segment Market Forecast by Region, 2023-2033 (US$ bn, AGR%, CAGR%)
Table 26 Hospital Pharmacies Segment Market Forecast by Region, 2023-2033 (US$ bn, AGR%, CAGR%)
Table 27 Retail Pharmacies Segment Market Forecast by Region, 2023-2033 (US$ bn, AGR%, CAGR%)
Table 28 Rare Diseases Market Forecast by End-user, 2023-2033 (US$ bn, AGR%, CAGR%)
Table 29 Adult Segment Market Forecast by Region, 2023-2033 (US$ bn, AGR%, CAGR%)
Table 30 Pediatric Segment Market Forecast by Region, 2023-2033 (US$ bn, AGR%, CAGR%)
Table 31 Rare Diseases Market Forecast by Region, 2023-2033 (US$ bn, AGR%, CAGR%)
Table 32 North America Rare Diseases Market Forecast by Country, 2023-2033 (US$ bn, AGR%, CAGR%)
Table 33 North America Rare Diseases Market Forecast by Disease, 2023-2033 (US$ bn, AGR%, CAGR%)
Table 34 North America Rare Diseases Market Forecast by Disease, 2023-2033 (US$ bn, AGR%, CAGR%)
Table 35 North America Rare Diseases Market Forecast by End-use, 2023-2033 (US$ bn, AGR%, CAGR%)
Table 36 North America Rare Diseases Market Forecast by Age, 2023-2033 (US$ bn, AGR%, CAGR%)
Table 37 U.S. Rare Diseases Market Forecast, 2023-2033 (US$ bn, AGR%, CAGR%)
Table 38 Canada Rare Diseases Market Forecast, 2023-2033 (US$ bn, AGR%, CAGR%)
Table 39 Europe Rare Diseases Market Forecast by Country, 2023-2033 (US$ bn, AGR%, CAGR%)
Table 40 Europe Rare Diseases Market Forecast by Disease, 2023-2033 (US$ bn, AGR%, CAGR%)
Table 41 Europe Rare Diseases Market Forecast by Disease, 2023-2033 (US$ bn, AGR%, CAGR%)
Table 42 Europe Rare Diseases Market Forecast by End-use, 2023-2033 (US$ bn, AGR%, CAGR%)
Table 43 Europe Rare Diseases Market Forecast by Age, 2023-2033 (US$ bn, AGR%, CAGR%)
Table 44 Germany Rare Diseases Market Forecast, 2023-2033 (US$ bn, AGR%, CAGR%)
Table 45 UK Rare Diseases Market Forecast, 2023-2033 (US$ bn, AGR%, CAGR%)
Table 46 France Rare Diseases Market Forecast, 2023-2033 (US$ bn, AGR%, CAGR%)
Table 47 Italy Rare Diseases Market Forecast, 2023-2033 (US$ bn, AGR%, CAGR%)
Table 48 Spain Rare Diseases Market Forecast, 2023-2033 (US$ bn, AGR%, CAGR%)
Table 49 Russia Rare Diseases Market Forecast, 2023-2033 (US$ bn, AGR%, CAGR%)
Table 50 Rest of Europe Rare Diseases Market Forecast, 2023-2033 (US$ bn, AGR%, CAGR%)
Table 51 Asia Pacific Rare Diseases Market Forecast by Country, 2023-2033 (US$ bn, AGR%, CAGR%)
Table 52 Asia Pacific Rare Diseases Market Forecast by Disease, 2023-2033 (US$ bn, AGR%, CAGR%)
Table 53 Asia Pacific Rare Diseases Market Forecast by Disease, 2023-2033 (US$ bn, AGR%, CAGR%)
Table 54 Asia Pacific Rare Diseases Market Forecast by End-use, 2023-2033 (US$ bn, AGR%, CAGR%)
Table 55 Asia Pacific Rare Diseases Market Forecast by Age, 2023-2033 (US$ bn, AGR%, CAGR%)
Table 56 Japan Rare Diseases Market Forecast, 2023-2033 (US$ bn, AGR%, CAGR%)
Table 57 China Rare Diseases Market Forecast, 2023-2033 (US$ bn, AGR%, CAGR%)
Table 58 India Rare Diseases Market Forecast, 2023-2033 (US$ bn, AGR%, CAGR%)
Table 59 Australia Rare Diseases Market Forecast, 2023-2033 (US$ bn, AGR%, CAGR%)
Table 60 South Korea Rare Diseases Market Forecast, 2023-2033 (US$ bn, AGR%, CAGR%)
Table 61 Rest of Asia Pacific Rare Diseases Market Forecast, 2023-2033 (US$ bn, AGR%, CAGR%)
Table 62 Latin America Rare Diseases Market Forecast by Country, 2023-2033 (US$ bn, AGR%, CAGR%)
Table 63 Latin America Rare Diseases Market Forecast by Disease, 2023-2033 (US$ bn, AGR%, CAGR%)
Table 64 Latin America Rare Diseases Market Forecast by Disease, 2023-2033 (US$ bn, AGR%, CAGR%)
Table 65 Latin America Rare Diseases Market Forecast by End-use, 2023-2033 (US$ bn, AGR%, CAGR%)
Table 66 Latin America Rare Diseases Market Forecast by Age, 2023-2033 (US$ bn, AGR%, CAGR%)
Table 67 Brazil Rare Diseases Market Forecast, 2023-2033 (US$ bn, AGR%, CAGR%)
Table 68 Mexico Rare Diseases Market Forecast, 2023-2033 (US$ bn, AGR%, CAGR%)
Table 69 Rest of Latin America Rare Diseases Market Forecast, 2023-2033 (US$ bn, AGR%, CAGR%)
Table 70 MEA Rare Diseases Market Forecast by Country, 2023-2033 (US$ bn, AGR%, CAGR%)
Table 71 MEA Rare Diseases Market Forecast by Disease, 2023-2033 (US$ bn, AGR%, CAGR%)
Table 72 MEA Rare Diseases Market Forecast by Disease, 2023-2033 (US$ bn, AGR%, CAGR%)
Table 73 MEA Rare Diseases Market Forecast by End-use, 2023-2033 (US$ bn, AGR%, CAGR%)
Table 74 MEA Rare Diseases Market Forecast by Age, 2023-2033 (US$ bn, AGR%, CAGR%)
Table 75 GCC Rare Diseases Market Forecast, 2023-2033 (US$ bn, AGR%, CAGR%)
Table 76 South Africa Rare Diseases Market Forecast, 2023-2033 (US$ bn, AGR%, CAGR%)
Table 77 Rest of MEA Rare Diseases Market Forecast, 2023-2033 (US$ bn, AGR%, CAGR%)
Table 78 AbbVie Inc.: Key Details, (CEO, HQ, Revenue, Founded, No. of Employees, Company Type, Website, Business Segment)
Table 79 AbbVie Inc.: Product Benchmarking
Table 80 Alexion Pharmaceuticals, Inc.: Key Details, (CEO, HQ, Revenue, Founded, No. of Employees, Company Type, Website, Business Segment)
Table 81 Alexion Pharmaceuticals, Inc.: Product Benchmarking
Table 82 Alexion Pharmaceuticals, Inc.: Strategic Outlook
Table 83 Amgen Inc.: Key Details, (CEO, HQ, Revenue, Founded, No. of Employees, Company Type, Website, Business Segment)
Table 84 Amgen Inc.: Product Benchmarking
Table 85 Amgen Inc.: Strategic Outlook
Table 86 Biogen Inc.: Key Details, (CEO, HQ, Revenue, Founded, No. of Employees, Company Type, Website, Business Segment)
Table 87 Biogen Inc.: Product Benchmarking
Table 88 Biogen Inc.: Strategic Outlook
Table 89 F. Hoffmann-La Roche Ltd.: Key Details, (CEO, HQ, Revenue, Founded, No. of Employees, Company Type, Website, Business Segment)
Table 90 F. Hoffmann-La Roche Ltd.: Product Benchmarking
Table 91 F. Hoffmann-La Roche Ltd.: Strategic Outlook
Table 92 Johnson & Johnson Services, Inc.: Key Details, (CEO, HQ, Revenue, Founded, No. of Employees, Company Type, Website, Business Segment)
Table 93 Johnson & Johnson Services, Inc.: Product Benchmarking
Table 94 Johnson & Johnson Services, Inc.: Strategic Outlook
Table 95 Merck & Co Inc.: Key Details, (CEO, HQ, Revenue, Founded, No. of Employees, Company Type, Website, Business Segment)
Table 96 Merck & Co Inc.: Product Benchmarking
Table 97 Novartis AG: Key Details, (CEO, HQ, Revenue, Founded, No. of Employees, Company Type, Website, Business Segment)
Table 98 Novartis AG: Product Benchmarking
Table 99 Novartis AG: Strategic Outlook
Table 100 Pfizer Inc.: Key Details, (CEO, HQ, Revenue, Founded, No. of Employees, Company Type, Website, Business Segment)
Table 101 Pfizer Inc.: Product Benchmarking
Table 102 Pfizer Inc.: Strategic Outlook
Table 103 Sanofi S.A.: Key Details, (CEO, HQ, Revenue, Founded, No. of Employees, Company Type, Website, Business Segment)
Table 104 Sanofi S.A.: Product Benchmarking
Table 105 Takeda Pharmaceuticals: Key Details, (CEO, HQ, Revenue, Founded, No. of Employees, Company Type, Website, Business Segment)
Table 106 Takeda Pharmaceuticals: Product Benchmarking
Table 107 Takeda Pharmaceuticals: Strategic Outlook
Table 108 Teva Pharmaceuticals: Key Details, (CEO, HQ, Revenue, Founded, No. of Employees, Company Type, Website, Business Segment)
Table 109 Teva Pharmaceuticals: Product Benchmarking
Table 110 Teva Pharmaceuticals: Strategic Outlook
Table 111 Bristol-Myers Squibb Company: Key Details, (CEO, HQ, Revenue, Founded, No. of Employees, Company Type, Website, Business Segment)
Table 112 Bristol-Myers Squibb Company: Product Benchmarking
Table 113 Bristol-Myers Squibb Company: Strategic Outlook
図の一覧
Figure 1 Rare Diseases Market Segmentation
Figure 2 Rare Diseases Market by Diseases: Market Attractiveness Index
Figure 3 Rare Diseases Market by Type: Market Attractiveness Index
Figure 4 Rare Diseases Market by End-users: Market Attractiveness Index
Figure 5 Rare Diseases Market by Age: Market Attractiveness Index
Figure 6 Rare Diseases Market Attractiveness Index by Region
Figure 7 Rare Diseases Market: Market Dynamics
Figure 8 CDER’s Annual Novel Drug Approvals: 2011 – 2022
Figure 9 Rare Diseases Clinical Activity by Indication
Figure 10 Rare Diseases Clinical Activity by Indication
Figure 11 Rare versus Prevalent Diseases Clinical Trials by Phase
Figure 12 Rare Diseases Market by Region, 2023-2033 (US$ bn, AGR %): “V” Shaped Recovery
Figure 13 Rare Diseases Market by Region, 2023-2033 (US$ bn, AGR %): “U” Shaped Recovery
Figure 14 Rare Diseases Market by Region, 2023-2033 (US$ bn, AGR %): “W” Shaped Recovery
Figure 15 Rare Diseases Market by Region, 2023-2033 (US$ bn, AGR %): “L” Shaped Recovery
Figure 16 Global Rare Disease Market: Porter’s Five Forces Analysis
Figure 17 Rare Diseases Market Attractiveness Index by Diseases
Figure 18 Rare Diseases Market Forecast by Diseases, 2023-2033 (US$ billion)
Figure 19 Rare Diseases Market Share Forecast by Diseases, 2023, 2028, 2033 (%)
Figure 20 Cancer Market Forecast by Region, 2023-2033 (US$ billion)
Figure 21 Cancer Market Share Forecast by Region, 2023 & 2033 (%)
Figure 22 Metabolic Diseases Market Forecast by Region, 2023-2033 (US$ billion)
Figure 23 Metabolic Diseases Market Share Forecast by Region, 2023 & 2033 (%)
Figure 24 Neurological Conditions Market Forecast by Region, 2023-2033 (US$ billion)
Figure 25 Neurological Conditions Market Share Forecast by Region, 2023 & 2033 (%)
Figure 26 Hematologic Disorders Market Forecast by Region, 2023-2033 (US$ billion)
Figure 27 Hematologic Disorders Market Share Forecast by Region, 2023 & 2033 (%)
Figure 28 Infectious Diseases Market Forecast by Region, 2023-2033 (US$ billion)
Figure 29 Infectious Diseases Market Share Forecast by Region, 2023 & 2033 (%)
Figure 30 Musculoskeletal Disorders Market Forecast by Region, 2023-2033 (US$ billion)
Figure 31 Musculoskeletal Disorders Market Share Forecast by Region, 2023 & 2033 (%)
Figure 32 Cardiovascular Disorders Market Forecast by Region, 2023-2033 (US$ billion)
Figure 33 Cardiovascular Disorders Market Share Forecast by Region, 2023 & 2033 (%)
Figure 34 Others Market Forecast by Region, 2023-2033 (US$ billion)
Figure 35 Others Market Share Forecast by Region, 2023 & 2033 (%)
Figure 36 Rare Diseases Market Attractiveness Index by Diseases
Figure 37 Rare Diseases Market Forecast by Type, 2023-2033 (US$ billion)
Figure 38 Rare Diseases Market Share Forecast by Type, 2023, 2028, 2033 (%)
Figure 39 Non-biologics Market Forecast by Region, 2023-2033 (US$ billion)
Figure 40 Non-biologics Market Share Forecast by Region, 2023 & 2033 (%)
Figure 41 Biologics Market Forecast by Region, 2023-2033 (US$ billion)
Figure 42 Biologics Market Share Forecast by Region, 2023 & 2033 (%)
Figure 43 Rare Diseases Market Attractiveness Index by End-users
Figure 44 Rare Diseases Market Forecast by End-users, 2023-2033 (US$ billion)
Figure 45 Rare Diseases Market Share Forecast by End-users, 2023, 2028, 2033 (%)
Figure 46 Specialty Pharmacies Market Forecast by Region, 2023-2033 (US$ billion)
Figure 47 Specialty Pharmacies Market Share Forecast by Region, 2023 & 2033 (%)
Figure 48 Hospital Pharmacies Market Forecast by Region, 2023-2033 (US$ billion)
Figure 49 Hospital Pharmacies Market Share Forecast by Region, 2023 & 2033 (%)
Figure 50 Retail Pharmacies Market Forecast by Region, 2023-2033 (US$ billion)
Figure 51 Retail Pharmacies Market Share Forecast by Region, 2023 & 2033 (%)
Figure 52 Rare Diseases Market Attractiveness Index by Age
Figure 53 Rare Diseases Market Forecast by Age, 2023-2033 (US$ billion)
Figure 54 Rare Diseases Market Share Forecast by Age, 2023, 2028, 2033 (%)
Figure 55 Adult Market Forecast by Region, 2023-2033 (US$ billion)
Figure 56 Adult Market Share Forecast by Region, 2023 & 2033 (%)
Figure 57 Pediatric Market Forecast by Region, 2023-2033 (US$ billion)
Figure 58 Pediatric Market Share Forecast by Region, 2023 & 2033 (%)
Figure 59 Rare Diseases Market Forecast by Region 2023, 2028, 2033 (Revenue, CAGR%)
Figure 60 Rare Diseases Market Share Forecast by Region 2023, 2028, 2033 (%)
Figure 61 Rare Diseases Market by Region, 2023-2033 (US$ bn)
Figure 62 North America Rare Diseases Market Attractiveness Index
Figure 63 North America Rare Diseases Market by Region, 2023, 2028 & 2033 (US$ billion)
Figure 64 North America Rare Diseases Market Forecast by Country, 2023-2033 (US$ billion)
Figure 65 North America Rare Diseases Market Share Forecast by Country, 2023 & 2033 (%)
Figure 66 North America Rare Diseases Market Forecast by Diseases, 2023-2033 (US$ billion)
Figure 67 North America Rare Diseases Market Share Forecast by Diseases, 2023 & 2033 (%)
Figure 68 North America Rare Diseases Market Forecast by Type, 2023-2033 (US$ billion)
Figure 69 North America Rare Diseases Market Share Forecast by Type, 2023 & 2033 (%)
Figure 70 North America Rare Diseases Market Forecast by End-users, 2023-2033 (US$ billion)
Figure 71 North America Rare Diseases Market Share Forecast by End-users, 2023 & 2033 (%)
Figure 72 North America Rare Diseases Market Forecast by Age, 2023-2033 (US$ billion)
Figure 73 North America Rare Diseases Market Share Forecast by Age, 2023 & 2033 (%)
Figure 74 U.S. Rare Diseases Market Forecast, 2023-2033 (US$ billion, AGR %)
Figure 75 Canada Rare Diseases Market Forecast, 2023-2033 (US$ billion, AGR %)
Figure 76 Europe Rare Diseases Market Attractiveness Index
Figure 77 Europe Rare Diseases Market by Region, 2023, 2028 & 2033 (US$ billion)
Figure 78 Europe Rare Diseases Market Forecast by Country, 2023-2033 (US$ billion)
Figure 79 Europe Rare Diseases Market Share Forecast by Country, 2023 & 2033 (%)
Figure 80 Europe Rare Diseases Market Forecast by Diseases, 2023-2033 (US$ billion)
Figure 81 Europe Rare Diseases Market Share Forecast by Diseases, 2023 & 2033 (%)
Figure 82 Europe Rare Diseases Market Forecast by Type, 2023-2033 (US$ billion)
Figure 83 Europe Rare Diseases Market Share Forecast by Type, 2023 & 2033 (%)
Figure 84 Europe Rare Diseases Market Forecast by End-users, 2023-2033 (US$ billion)
Figure 85 Europe Rare Diseases Market Share Forecast by End-users, 2023 & 2033 (%)
Figure 86 Europe Rare Diseases Market Forecast by Age, 2023-2033 (US$ billion)
Figure 87 Europe Rare Diseases Market Share Forecast by Age, 2023 & 2033 (%)
Figure 88 Germany Rare Diseases Market Forecast, 2023-2033 (US$ billion, AGR %)
Figure 89 UK Rare Diseases Market Forecast, 2023-2033 (US$ billion, AGR %)
Figure 90 France Rare Diseases Market Forecast, 2023-2033 (US$ billion, AGR %)
Figure 91 Italy Rare Diseases Market Forecast, 2023-2033 (US$ billion, AGR %)
Figure 92 Spain Rare Diseases Market Forecast, 2023-2033 (US$ billion, AGR %)
Figure 93 Russia Rare Diseases Market Forecast, 2023-2033 (US$ billion, AGR %)
Figure 94 Rest of Europe Rare Diseases Market Forecast, 2023-2033 (US$ billion, AGR %)
Figure 95 Asia Pacific Rare Diseases Market Attractiveness Index
Figure 96 Asia Pacific Rare Diseases Market by Region, 2023, 2028 & 2033 (US$ billion)
Figure 97 Asia Pacific Rare Diseases Market Forecast by Country, 2023-2033 (US$ billion)
Figure 98 Asia Pacific Rare Diseases Market Share Forecast by Country, 2023 & 2033 (%)
Figure 99 Asia Pacific Rare Diseases Market Forecast by Diseases, 2023-2033 (US$ billion)
Figure 100 Asia Pacific Rare Diseases Market Share Forecast by Diseases, 2023 & 2033 (%)
Figure 101 Asia Pacific Rare Diseases Market Forecast by Type, 2023-2033 (US$ billion)
Figure 102 Asia Pacific Rare Diseases Market Share Forecast by Type, 2023 & 2033 (%)
Figure 103 Asia Pacific Rare Diseases Market Forecast by End-users, 2023-2033 (US$ billion)
Figure 104 Asia Pacific Rare Diseases Market Share Forecast by End-users, 2023 & 2033 (%)
Figure 105 Asia Pacific Rare Diseases Market Forecast by Age, 2023-2033 (US$ billion)
Figure 106 Asia Pacific Rare Diseases Market Share Forecast by Age, 2023 & 2033 (%)
Figure 107 Japan Rare Diseases Market Forecast, 2023-2033 (US$ billion, AGR %)
Figure 108 China Rare Diseases Market Forecast, 2023-2033 (US$ billion, AGR %)
Figure 109 India Rare Diseases Market Forecast, 2023-2033 (US$ billion, AGR %)
Figure 110 Australia Rare Diseases Market Forecast, 2023-2033 (US$ billion, AGR %)
Figure 111 South Korea Rare Diseases Market Forecast, 2023-2033 (US$ billion, AGR %)
Figure 112 Rest of Asia Pacific Rare Diseases Market Forecast, 2023-2033 (US$ billion, AGR %)
Figure 113 Latin America Rare Diseases Market Attractiveness Index
Figure 114 Latin America Rare Diseases Market by Region, 2023, 2028 & 2033 (US$ billion)
Figure 115 Latin America Rare Diseases Market Forecast by Country, 2023-2033 (US$ billion)
Figure 116 Latin America Rare Diseases Market Share Forecast by Country, 2023 & 2033 (%)
Figure 117 Latin America Rare Diseases Market Forecast by Diseases, 2023-2033 (US$ billion)
Figure 118 Latin America Rare Diseases Market Share Forecast by Diseases, 2023 & 2033 (%)
Figure 119 Latin America Rare Diseases Market Forecast by Type, 2023-2033 (US$ billion)
Figure 120 Latin America Rare Diseases Market Share Forecast by Type, 2023 & 2033 (%)
Figure 121 Latin America Rare Diseases Market Forecast by End-users, 2023-2033 (US$ billion)
Figure 122 Latin America Rare Diseases Market Share Forecast by End-users, 2023 & 2033 (%)
Figure 123 Latin America Rare Diseases Market Forecast by Age, 2023-2033 (US$ billion)
Figure 124 Latin America Rare Diseases Market Share Forecast by Age, 2023 & 2033 (%)
Figure 125 Brazil Rare Diseases Market Forecast, 2023-2033 (US$ billion, AGR %)
Figure 126 Mexico Rare Diseases Market Forecast, 2023-2033 (US$ billion, AGR %)
Figure 127 Rest of Latin America Rare Diseases Market Forecast, 2023-2033 (US$ billion, AGR %)
Figure 128 MEA Rare Diseases Market Attractiveness Index
Figure 129 MEA Rare Diseases Market by Region, 2023, 2028 & 2033 (US$ billion)
Figure 130 MEA Rare Diseases Market Forecast by Country, 2023-2033 (US$ billion)
Figure 131 MEA Rare Diseases Market Share Forecast by Country, 2023 & 2033 (%)
Figure 132 MEA Rare Diseases Market Forecast by Diseases, 2023-2033 (US$ billion)
Figure 133 MEA Rare Diseases Market Share Forecast by Diseases, 2023 & 2033 (%)
Figure 134 MEA Rare Diseases Market Forecast by Type, 2023-2033 (US$ billion)
Figure 135 MEA Rare Diseases Market Share Forecast by Type, 2023 & 2033 (%)
Figure 136 MEA Rare Diseases Market Forecast by End-users, 2023-2033 (US$ billion)
Figure 137 MEA Rare Diseases Market Share Forecast by End-users, 2023 & 2033 (%)
Figure 138 MEA Rare Diseases Market Forecast by Age, 2023-2033 (US$ billion)
Figure 139 MEA Rare Diseases Market Share Forecast by Age, 2023 & 2033 (%)
Figure 140 GCC Rare Diseases Market Forecast, 2023-2033 (US$ billion, AGR %)
Figure 141 South Africa Rare Diseases Market Forecast, 2023-2033 (US$ billion, AGR %)
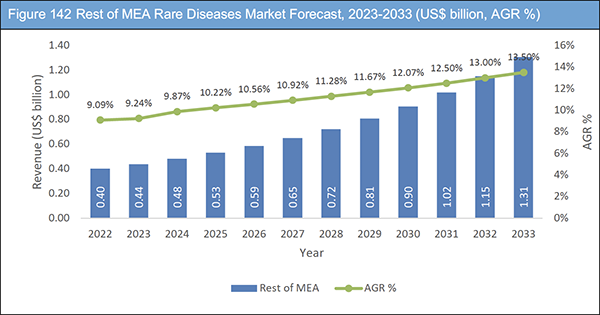
Figure 142 Rest of MEA Rare Diseases Market Forecast, 2023-2033 (US$ billion, AGR %)
Figure 143 AbbVie Inc.: Net Revenue, 2015-2022 (US$ million, AGR%)
Figure 144 AbbVie Inc.: Regional Market Shares (%), 2021
Figure 145 AbbVie Inc.: Gross Profit, 2015-2022 (US$ million, AGR%)
Figure 146 AbbVie Inc.: R&D, 2015-2022 (US$ million, AGR%)
Figure 147 Amgen Inc.: Net Revenue, 2015-2022 (US$ million, AGR%)
Figure 148 Amgen Inc.: Regional Market Shares (%), 2022
Figure 149 Amgen Inc.: Gross Profit, 2015-2022 (US$ million, AGR%)
Figure 150 Amgen Inc.: R&D, 2015-2022 (US$ million, AGR%)
Figure 151 Biogen Inc.: Net Revenue, 2015-2021 (US$ million, AGR%)
Figure 152 Biogen Inc.: Gross Profit, 2015-2021 (US$ million, AGR%)
Figure 153 Biogen Inc.: R&D, 2015-2021 (US$ million, AGR%)
Figure 154 F. Hoffmann-La Roche Ltd.: Net Revenue, 2015-2021 (US$ million, AGR%)
Figure 155 F. Hoffmann-La Roche Ltd.: Gross Profit, 2015-2021 (US$ million, AGR%)
Figure 156 F. Hoffmann-La Roche Ltd.: R&D, 2015-2021 (US$ million, AGR%)
Figure 157 Johnson & Johnson Services, Inc.: Net Revenue, 2015-2022 (US$ million, AGR%)
Figure 158 Johnson & Johnson Services, Inc.: Regional Market Shares (%), 2021
Figure 159 Johnson & Johnson Services, Inc.: Gross Profit, 2015-2022 (US$ million, AGR%)
Figure 160 Johnson & Johnson Services, Inc.: R&D, 2015-2022 (US$ million, AGR%)
Figure 161 Merck & Co Inc.: Net Revenue, 2015-2022 (US$ million, AGR%)
Figure 162 Merck & Co Inc.: Regional Market Shares (%), 2021
Figure 163 Merck & Co Inc.: Gross Profit, 2015-2022 (US$ million, AGR%)
Figure 164 Merck & Co Inc.: R&D, 2015-2022 (US$ million, AGR%)
Figure 165 Novartis AG: Net Revenue, 2015-2022 (US$ million, AGR%)
Figure 166 Novartis AG: Regional Market Shares (%), 2021
Figure 167 Novartis AG: Gross Profit, 2015-2022 (US$ million, AGR%)
Figure 168 Novartis AG: R&D, 2015-2022 (US$ million, AGR%)
Figure 169 Pfizer Inc.: Net Revenue, 2015-2022 (US$ million, AGR%)
Figure 170 Pfizer Inc.: Regional Market Shares (%), 2021
Figure 171 Pfizer Inc.: Gross Profit, 2015-2022 (US$ million, AGR%)
Figure 172 Pfizer Inc.: R&D, 2015-2022 (US$ million, AGR%)
Figure 173 Sanofi S.A.: Net Revenue, 2015-2022 (US$ million, AGR%)
Figure 174 Sanofi S.A.: Regional Market Shares (%), 2021
Figure 175 Sanofi S.A.: Gross Profit, 2015-2022 (US$ million, AGR%)
Figure 176 Sanofi S.A.: R&D, 2015-2022 (US$ million, AGR%)
Figure 177 Takeda Pharmaceuticals: Net Revenue, 2015-2022 (US$ million, AGR%)
Figure 178 Takeda Pharmaceuticals: Gross Profit, 2015-2022 (US$ million, AGR%)
Figure 179 Takeda Pharmaceuticals: R&D, 2015-2022 (US$ million, AGR%)
Figure 180 Teva Pharmaceuticals: Net Revenue, 2015-2021 (US$ million, AGR%)
Figure 181 Teva Pharmaceuticals: Regional Market Shares (%), 2021
Figure 182 Teva Pharmaceuticals: Gross Profit, 2015-2021 (US$ million, AGR%)
Figure 183 Teva Pharmaceuticals: R&D, 2015-2021 (US$ million, AGR%)
Figure 184 Bristol-Myers Squibb Company: Net Revenue, 2015-2022 (US$ million, AGR%)
Figure 185 Bristol-Myers Squibb Company: Gross Profit, 2015-2022 (US$ million, AGR%)
Figure 186 Bristol-Myers Squibb Company: R&D, 2015-2022 (US$ million, AGR%)
ページTOPに戻る
Summary
Report Details
The Rare Diseases Market Report 2023-2033: This report will prove invaluable to leading firms striving for new revenue pockets if they wish to better understand the industry and its underlying dynamics. It will be useful for companies that would like to expand into different industries or to expand their existing operations in a new region.
Home-based Care Anticipated to Offer Lucrative Growth Prospects
There are unmet requirements for elderly, frail people with multiple diseases, but many support services today focus on patients with rare or ultra-rare diseases. In addition, there are numerous chronic conditions present in sizable patient communities, even in younger age groups. Expanding home-based healthcare services could therefore have positive effects on bigger patient populations and health systems.
Due to the high degrees of medical complexity, managing comorbidities and multi-morbidities is especially difficult. A patient with heart failure who also requires infusion therapy for cancer poses a problem with timing the administration of the diuretics because the patient must travel to the infusion facility. Home-based care services may develop into a potent catalyst for raising standards of care, enhancing patient satisfaction, and cutting expenses. While there are obvious and distinct benefits for patients and carers with complex and rare diseases, there are also advantages for larger patient populations with more widespread conditions who may face difficulties due to the complexity of their therapy or the effects of comorbidities and multidisease.
What Questions Should You Ask before Buying a Market Research Report?
• How is the rare diseases market evolving?
• What is driving and restraining the rare diseases market?
• How will each rare diseases submarket segment grow over the forecast period and how much revenue will these submarkets account for in 2033?
• How will the market shares for each rare diseases submarket develop from 2023 to 2033?
• What will be the main driver for the overall market from 2023 to 2033?
• Will leading rare diseases markets broadly follow the macroeconomic dynamics, or will individual national markets outperform others?
• How will the market shares of the national markets change by 2033 and which geographical region will lead the market in 2033?
• Who are the leading players and what are their prospects over the forecast period?
• What are the rare diseases projects for these leading companies?
• How will the industry evolve during the period between 2023 and 2033? What are the implications of
rare diseases projects taking place now and over the next 10 years?
• Is there a greater need for product commercialisation to further scale the rare diseases market?
• Where is the rare diseases market heading and how can you ensure you are at the forefront of the market?
• What are the best investment options for new product and service lines?
• What are the key prospects for moving companies into a new growth path and C-suite?
You need to discover how this will impact the rare diseases market today, and over the next 10 years:
• Our 290-page report provides 107 tables and 186 charts/graphs exclusively to you.
• The report highlights key lucrative areas in the industry so you can target them – NOW.
• It contains in-depth analysis of global, regional and national sales and growth.
• It highlights for you the key successful trends, changes and revenue projections made by your competitors.
This report tells you TODAY how the rare diseases market will develop in the next 10 years, and in line with the variations in COVID-19 economic recession and bounce. This market is more critical now than at any point over the last 10 years.
Forecasts to 2033 and other analyses reveal commercial prospects
• In addition to revenue forecasting to 2033, our new study provides you with recent results, growth rates, and market shares.
• You will find original analyses, with business outlooks and developments.
• Discover qualitative analyses (including market dynamics, drivers, opportunities, and restraints), Porter’s Five Forces Analysis, PEST Analysis and recent developments.
This report includes data analysis and invaluable insight into how COVID-19 will affect the industry and your company. Four COVID-19 recovery patterns and their impact, namely, “V”, “L”, “W” and “U” are discussed in this report.
Segments Covered in the Report
Diseases
• Cancer
• Metabolic Diseases
• Neurological Conditions
• Hematologic Disorders
• Infectious Diseases
• Musculoskeletal Disorders
• Cardiovascular Disorders
• Others
Type
• Non-biologics
• Biologics
End-users
• Specialty Pharmacies
• Hospital Pharmacies
• Retail Pharmacies
Age
• Adult
• Paediatric
In addition to the revenue predictions for the overall world market and segments, you will also find revenue forecasts for five regional and 21 leading national markets:
North America
• U.S.
• Canada
Europe
• Germany
• UK
• France
• Italy
• Spain
• Russia
• Rest of Europe
Asia-Pacific
• Japan
• China
• India
• Australia
• South Korea
• Rest of Asia Pacific
Latin America
• Brazil
• Mexico
• Rest of Latin America
MEA
• GCC
• South Africa
• Rest of MEA
The report also includes profiles and for some of the leading companies in the Rare Diseases Market, 2023 to 2033, with a focus on this segment of these companies’ operations.
Leading companies and the potential for market growth
• AbbVie Inc.
• Alexion Pharmaceuticals, Inc. (AstraZeneca)
• Amgen Inc.
• Biogen Inc.
• Bristol-Myers Squibb Company
• F. Hoffmann-La Roche Ltd.
• Johnson & Johnson Services, Inc.
• Merck & Co Inc.
• Novartis AG
• Pfizer Inc.
• Sanofi S.A.
• Takeda Pharmaceuticals
• Teva Pharmaceuticals
Overall world revenue for Rare Diseases Market, 2023 to 2033 in terms of value the market will surpass US$205.0 billion in 2023, our work calculates. We predict strong revenue growth through to 2033. Our work identifies which organizations hold the greatest potential. Discover their capabilities, progress, and commercial prospects, helping you stay ahead.
How will the Rare Diseases Market, 2023 to 2033 report help you?
In summary, our 290-page report provides you with the following knowledge:
• Revenue forecasts to 2033 for Rare Diseases Market, 2023 to 2033 Market, with forecasts for diseases, type, end-users, and age, each forecast at a global and regional level – discover the industry’s prospects, finding the most lucrative places for investments and revenues.
• Revenue forecasts to 2033 for five regional and 21 key national markets – See forecasts for the Rare Diseases Market, 2023 to 2033 market in North America, Europe, Asia-Pacific, Latin America, and MEA. Also forecasted is the market in the US, Canada, Mexico, Brazil, Germany, France, UK, Italy, China, India, Japan, and Australia among other prominent economies.
• Prospects for established firms and those seeking to enter the market – including company profiles for 13 of the major companies involved in the Rare Diseases Market, 2023 to 2033.
Find quantitative and qualitative analyses with independent predictions. Receive information that only our report contains, staying informed with invaluable business intelligence.
Information found nowhere else
With our new report, you are less likely to fall behind in knowledge or miss out on opportunities. See how our work could benefit your research, analyses, and decisions. Visiongain’s study is for everybody needing commercial analyses for the Rare Diseases Market, 2023 to 2033, market-leading companies. You will find data, trends and predictions.
ページTOPに戻る
Table of Contents
Report Details
1. Report Overview
1.1 Objectives of the Study
1.2 Introduction to Rare Diseases Market
1.3 What This Report Delivers
1.4 Why You Should Read This Report
1.5 Key Questions Answered by This Analytical Report Include:
1.6 Who is This Report For?
1.7 Methodology
1.7.1 Market Definitions
1.7.2 Market Evaluation & Forecasting Methodology
1.7.3 Data Validation
1.7.3.1 Primary Research
1.7.3.2 Secondary Research
1.8 Frequently Asked Questions (FAQs)
1.9 Associated Visiongain Reports
1.10 About Visiongain
2 Executive Summary
3 Market Overview
3.1 Key Findings
3.2 Market Dynamics
3.2.1 Market Driving Factors
3.2.1.1 Increasing Number of Approval Driving Market Growth
3.2.1.2 Robust Pipeline by Major Players
3.2.1.2.1 Pfizer Rare Disease Pipeline
3.2.1.2.2 Sanofi Genzyme Corporation Rare Disease Pipeline
3.2.1.2.3 Novo Nordisk Rare Disease Pipeline
3.2.1.3 Increasing Awareness
3.2.2 Market Restraining Factors
3.2.2.1 High Research and Development Costs
3.2.2.2 High Entry Barriers to Challenge Market Growth
3.2.2.3 Physical Management of Patients Likely to Challenge Market Growth
3.2.3 Market Opportunities
3.2.3.1 Increasing Demand from Emerging Economies
3.2.3.2 Home-based Care Anticipated to Offer Lucrative Growth Prospects
3.2.3.3 Increasing Government Support
3.2.3.4 Rare Diseases Clinical Activity by Indication
3.3 COVID-19 Impact Analysis
3.4 Porter’s Five Forces Analysis
3.4.1 Bargaining Power of Buyers (Low)
3.4.2 Bargaining Power of Suppliers (medium)
3.4.3 Threat of Substitutes (Low)
3.4.4 Threat of New Entrants (Low)
3.4.5 Industry Rivalry (High)
4 Rare Diseases Market Analysis by Diseases
4.1 Key Findings
4.2 Diseases Segment: Market Attractiveness Index
4.3 Rare Diseases Market Size Estimation and Forecast by Diseases
4.4 Cancer
4.4.1 Market Forecast by Region, 2023-2033 (US$ bn)
4.4.2 Market Share by Region, 2023 & 2033 (%)
4.5 Metabolic Diseases
4.5.1 Market Forecast by Region, 2023-2033 (US$ bn)
4.5.2 Market Share by Region, 2023 & 2033 (%)
4.6 Neurological Conditions
4.6.1 Market Forecast by Region, 2023-2033 (US$ bn)
4.6.2 Market Share by Region, 2023 & 2033 (%)
4.7 Hematologic Disorders
4.7.1 Market Forecast by Region, 2023-2033 (US$ bn)
4.7.2 Market Share by Region, 2023 & 2033 (%)
4.8 Infectious Diseases
4.8.1 Market Forecast by Region, 2023-2033 (US$ bn)
4.8.2 Market Share by Region, 2023 & 2033 (%)
4.9 Musculoskeletal Disorders
4.9.1 Market Forecast by Region, 2023-2033 (US$ bn)
4.9.2 Market Share by Region, 2023 & 2033 (%)
4.10 Cardiovascular Disorders
4.10.1 Market Forecast by Region, 2023-2033 (US$ bn)
4.10.2 Market Share by Region, 2023 & 2033 (%)
4.11 Others
4.11.1 Market Forecast by Region, 2023-2033 (US$ bn)
4.11.2 Market Share by Region, 2023 & 2033 (%)
5 Rare Diseases Market Analysis by Type
5.1 Key Findings
5.2 Type Segment: Market Attractiveness Index
5.3 Rare Diseases Market Size Estimation and Forecast by Type
5.4 Non-biologics
5.4.1 Market Forecast by Region, 2023-2033 (US$ bn)
5.4.2 Market Share by Region, 2023 & 2033 (%)
5.5 Biologics
5.5.1 Market Forecast by Region, 2023-2033 (US$ bn)
5.5.2 Market Share by Region, 2023 & 2033 (%)
6 Rare Diseases Market Analysis by End-users
6.1 Key Findings
6.2 End-users Segment: Market Attractiveness Index
6.3 Rare Diseases Market Size Estimation and Forecast by End-users
6.4 Specialty Pharmacies
6.4.1 Market Forecast by Region, 2023-2033 (US$ bn)
6.4.2 Market Share by Region, 2023 & 2033 (%)
6.5 Hospital Pharmacies
6.5.1 Market Forecast by Region, 2023-2033 (US$ bn)
6.5.2 Market Share by Region, 2023 & 2033 (%)
6.6 Retail Pharmacies
6.6.1 Market Forecast by Region, 2023-2033 (US$ bn)
6.6.2 Market Share by Region, 2023 & 2033 (%)
7 Rare Diseases Market Analysis by Age
7.1 Key Findings
7.2 Age Segment: Market Attractiveness Index
7.3 Rare Diseases Market Size Estimation and Forecast by Age
7.4 Adult
7.4.1 Market Forecast by Region, 2023-2033 (US$ bn)
7.4.2 Market Share by Region, 2023 & 2033 (%)
7.5 Pediatric
7.5.1 Market Forecast by Region, 2023-2033 (US$ bn)
7.5.2 Market Share by Region, 2023 & 2033 (%)
8 Rare Diseases Market Analysis by Region
8.1 Key Findings
8.2 Regional Market Size Estimation and Forecast
9 North America Rare Diseases Market Analysis
9.1 Key Findings
9.2 North America Rare Diseases Market Attractiveness Index
9.3 Market Size by Country, 2023, 2028 & 2033 (US$ bn)
9.4 Market Size Estimation and Forecast by Country, 2023-2033 (US$ bn)
9.5 Market Size Estimation and Forecast by Diseases, 2023-2033 (US$ bn)
9.6 Market Size Estimation and Forecast by Type, 2023-2033 (US$ bn)
9.7 Market Size Estimation and Forecast by End-users, 2023-2033 (US$ bn)
9.8 Market Size Estimation and Forecast by Age, 2023-2033 (US$ bn)
9.9 U.S. Rare Diseases Market Analysis
9.10 Canada Rare Diseases Market Analysis
10 Europe Rare Diseases Market Analysis
10.1 Key Findings
10.2 Europe Rare Diseases Market Attractiveness Index
10.3 Market Size by Country, 2023, 2028 & 2033 (US$ bn)
10.4 Market Size Estimation and Forecast by Country, 2023-2033 (US$ bn)
10.5 Market Size Estimation and Forecast by Diseases, 2023-2033 (US$ bn)
10.6 Market Size Estimation and Forecast by Type, 2023-2033 (US$ bn)
10.7 Market Size Estimation and Forecast by End-users, 2023-2033 (US$ bn)
10.8 Market Size Estimation and Forecast by Age, 2023-2033 (US$ bn)
10.9 Germany Rare Diseases Market Analysis
10.10 UK Rare Diseases Market Analysis
10.11 France Rare Diseases Market Analysis
10.12 Italy Rare Diseases Market Analysis
10.13 Spain Rare Diseases Market Analysis
10.14 Russia Rare Diseases Market Analysis
10.15 Rest of Europe Rare Diseases Market Analysis
11 Asia Pacific Rare Diseases Market Analysis
11.1 Key Findings
11.2 Asia Pacific Rare Diseases Market Attractiveness Index
11.3 Market Size by Country, 2023, 2028 & 2033 (US$ bn)
11.4 Market Size Estimation and Forecast by Country, 2023-2033 (US$ bn)
11.5 Market Size Estimation and Forecast by Diseases, 2023-2033 (US$ bn)
11.6 Market Size Estimation and Forecast by Type, 2023-2033 (US$ bn)
11.7 Market Size Estimation and Forecast by End-users, 2023-2033 (US$ bn)
11.8 Market Size Estimation and Forecast by Age, 2023-2033 (US$ bn)
11.9 Japan Rare Diseases Market Analysis
11.10 China Rare Diseases Market Analysis
11.11 India Rare Diseases Market Analysis
11.12 Australia Rare Diseases Market Analysis
11.13 South Korea Rare Diseases Market Analysis
11.14 Rest of Asia Pacific Rare Diseases Market Analysis
12 Latin America Rare Diseases Market Analysis
12.1 Key Findings
12.2 Latin America Rare Diseases Market Attractiveness Index
12.3 Market Size by Country, 2023, 2028 & 2033 (US$ bn)
12.4 Market Size Estimation and Forecast by Country, 2023-2033 (US$ bn)
12.5 Market Size Estimation and Forecast by Diseases, 2023-2033 (US$ bn)
12.6 Market Size Estimation and Forecast by Type, 2023-2033 (US$ bn)
12.7 Market Size Estimation and Forecast by End-users, 2023-2033 (US$ bn)
12.8 Market Size Estimation and Forecast by Age, 2023-2033 (US$ bn)
12.9 Brazil Rare Diseases Market Analysis
12.10 Mexico Rare Diseases Market Analysis
12.11 Rest of Latin America Rare Diseases Market Analysis
13 MEA Rare Diseases Market Analysis
13.1 Key Findings
13.2 MEA Rare Diseases Market Attractiveness Index
13.3 Market Size by Country, 2023, 2028 & 2033 (US$ bn)
13.4 Market Size Estimation and Forecast by Country, 2023-2033 (US$ bn)
13.5 Market Size Estimation and Forecast by Diseases, 2023-2033 (US$ bn)
13.6 Market Size Estimation and Forecast by Type, 2023-2033 (US$ bn)
13.7 Market Size Estimation and Forecast by End-users, 2023-2033 (US$ bn)
13.8 Market Size Estimation and Forecast by Age, 2023-2033 (US$ bn)
13.9 GCC Rare Diseases Market Analysis
13.10 South Africa Rare Diseases Market Analysis
13.11 Rest of MEA Rare Diseases Market Analysis
14 Company Profiles
14.1 AbbVie Inc.
14.1.1 Company Snapshot
14.1.2 Company Overview
14.1.3 Financial Analysis
14.1.3.1 Net Revenue, 2015-2022
14.1.3.2 Regional Market Shares, 2021
14.1.3.3 Gross Profit, 2015-2022
14.1.3.4 R&D, 2015-2022
14.1.4 Product Benchmarking
14.2 Alexion Pharmaceuticals, Inc. (AstraZeneca)
14.2.1 Company Snapshot
14.2.2 Company Overview
14.2.3 Product Benchmarking
14.2.4 Strategic Outlook
14.3 Amgen Inc.
14.3.1 Company Snapshot
14.3.2 Company Overview
14.3.3 Financial Analysis
14.3.3.1 Net Revenue, 2015-2022
14.3.3.2 Regional Market Shares, 2022
14.3.3.3 Gross Profit, 2015-2022
14.3.3.4 R&D, 2015-2022
14.3.4 Product Benchmarking
14.3.5 Strategic Outlook
14.4 Biogen Inc.
14.4.1 Company Snapshot
14.4.2 Company Overview
14.4.3 Financial Analysis
14.4.3.1 Net Revenue, 2015-2021
14.4.3.2 Gross Profit, 2015-2021
14.4.3.3 R&D, 2015-2021
14.4.4 Product Benchmarking
14.4.5 Strategic Outlook
14.5 F. Hoffmann-La Roche Ltd.
14.5.1 Company Snapshot
14.5.2 Company Overview
14.5.3 Financial Analysis
14.5.3.1 Net Revenue, 2015-2021
14.5.3.2 Gross Profit, 2015-2021
14.5.3.3 R&D, 2015-2021
14.5.4 Product Benchmarking
14.5.5 Strategic Outlook
14.6 Johnson & Johnson Services, Inc.
14.6.1 Company Snapshot
14.6.2 Company Overview
14.6.3 Financial Analysis
14.6.3.1 Net Revenue, 2015-2022
14.6.3.2 Regional Market Shares, 2021
14.6.3.3 Gross Profit, 2015-2022
14.6.3.4 R&D, 2015-2022
14.6.4 Product Benchmarking
14.6.5 Strategic Outlook
14.7 Merck & Co Inc.
14.7.1 Company Snapshot
14.7.2 Company Overview
14.7.3 Financial Analysis
14.7.3.1 Net Revenue, 2015-2022
14.7.3.2 Regional Market Shares, 2021
14.7.3.3 Gross Profit, 2015-2022
14.7.3.4 R&D, 2015-2022
14.7.4 Product Benchmarking
14.8 Novartis AG
14.8.1 Company Snapshot
14.8.2 Company Overview
14.8.3 Financial Analysis
14.8.3.1 Net Revenue, 2015-2022
14.8.3.2 Regional Market Shares, 2021
14.8.3.3 Gross Profit, 2015-2022
14.8.3.4 R&D, 2015-2022
14.8.4 Product Benchmarking
14.8.5 Strategic Outlook
14.9 Pfizer Inc.
14.9.1 Company Snapshot
14.9.2 Company Overview
14.9.3 Financial Analysis
14.9.3.1 Net Revenue, 2015-2022
14.9.3.2 Regional Market Shares, 2021
14.9.3.3 Gross Profit, 2015-2022
14.9.3.4 R&D, 2015-2022
14.9.4 Product Benchmarking
14.9.5 Strategic Outlook
14.10 Sanofi S.A.
14.10.1 Company Snapshot
14.10.2 Company Overview
14.10.3 Financial Analysis
14.10.3.1 Net Revenue, 2015-2022
14.10.3.2 Regional Market Shares, 2021
14.10.3.3 Gross Profit, 2015-2022
14.10.3.4 R&D, 2015-2022
14.10.4 Product Benchmarking
14.11 Takeda Pharmaceuticals
14.11.1 Company Snapshot
14.11.2 Company Overview
14.11.3 Financial Analysis
14.11.3.1 Net Revenue, 2015-2022
14.11.3.2 Gross Profit, 2015-2022
14.11.3.3 R&D, 2015-2022
14.11.4 Product Benchmarking
14.11.5 Strategic Outlook
14.12 Teva Pharmaceuticals
14.12.1 Company Snapshot
14.12.2 Company Overview
14.12.3 Financial Analysis
14.12.3.1 Net Revenue, 2015-2021
14.12.3.2 Regional Market Shares, 2021
14.12.3.3 Gross Profit, 2015-2021
14.12.3.4 R&D, 2015-2021
14.12.4 Product Benchmarking
14.12.5 Strategic Outlook
14.13 Bristol-Myers Squibb Company
14.13.1 Company Snapshot
14.13.2 Company Overview
14.13.3 Financial Analysis
14.13.3.1 Net Revenue, 2015-2022
14.13.3.2 Gross Profit, 2015-2022
14.13.3.3 R&D, 2015-2022
14.13.4 Product Benchmarking
14.13.5 Strategic Outlook
15 Conclusion and Recommendations
15.1 Concluding Remarks from Visiongain
15.2 Recommendations for Market Players
List of Tables
Table 1 Prevalence Criteria Used by Regulatory Agencies to Define Rare Diseases
Table 2 Rare Diseases Market Snapshot, 2023 & 2033 (US$ billion, CAGR %)
Table 3 Rare Diseases Market Forecast by Region, 2023-2033 (US$ bn, AGR%, CAGR%): "V" Shaped Recovery
Table 4 Rare Diseases Market Forecast by Region, 2023-2033 (US$ bn, AGR%, CAGR%): "U" Shaped Recovery
Table 5 Rare Diseases Market Forecast by Region, 2023-2033 (US$ bn, AGR%, CAGR%): "W" Shaped Recovery
Table 6 Rare Diseases Market Forecast by Region, 2023-2033 (US$ bn, AGR%, CAGR%): "L" Shaped Recovery
Table 7 Key Factors Affecting the Bargaining Power of Buyer
Table 8 Key Factors Affecting the Bargaining Power of Suppliers
Table 9 Key Factors Affecting the Threat of Substitutes
Table 10 Key Factors Affecting the Threat of New Entrants
Table 11 Key Factors Affecting the Industry Rivalry
Table 12 Rare Diseases Market Forecast by Disease, 2023-2033 (US$ bn, AGR%, CAGR%)
Table 13 Cancer Segment Market Forecast by Region, 2023-2033 (US$ bn, AGR%, CAGR%)
Table 14 Metabolic Diseases Segment Market Forecast by Region, 2023-2033 (US$ bn, AGR%, CAGR%)
Table 15 Neurological Conditions Segment Market Forecast by Region, 2023-2033 (US$ bn, AGR%, CAGR%)
Table 16 Hematologic Disorders Segment Market Forecast by Region, 2023-2033 (US$ bn, AGR%, CAGR%)
Table 17 Infectious Diseases Segment Market Forecast by Region, 2023-2033 (US$ bn, AGR%, CAGR%)
Table 18 Musculoskeletal Disorders Segment Market Forecast by Region, 2023-2033 (US$ bn, AGR%, CAGR%)
Table 19 Cardiovascular Disorders Segment Market Forecast by Region, 2023-2033 (US$ bn, AGR%, CAGR%)
Table 20 Others Segment Market Forecast by Region, 2023-2033 (US$ bn, AGR%, CAGR%)
Table 21 Rare Diseases Market Forecast by Type, 2023-2033 (US$ bn, AGR%, CAGR%)
Table 22 Non-biologics Segment Market Forecast by Region, 2023-2033 (US$ bn, AGR%, CAGR%)
Table 23 Biologics Segment Market Forecast by Region, 2023-2033 (US$ bn, AGR%, CAGR%)
Table 24 Rare Diseases Market Forecast by End-use, 2023-2033 (US$ bn, AGR%, CAGR%)
Table 25 Specialty Pharmacies Segment Market Forecast by Region, 2023-2033 (US$ bn, AGR%, CAGR%)
Table 26 Hospital Pharmacies Segment Market Forecast by Region, 2023-2033 (US$ bn, AGR%, CAGR%)
Table 27 Retail Pharmacies Segment Market Forecast by Region, 2023-2033 (US$ bn, AGR%, CAGR%)
Table 28 Rare Diseases Market Forecast by End-user, 2023-2033 (US$ bn, AGR%, CAGR%)
Table 29 Adult Segment Market Forecast by Region, 2023-2033 (US$ bn, AGR%, CAGR%)
Table 30 Pediatric Segment Market Forecast by Region, 2023-2033 (US$ bn, AGR%, CAGR%)
Table 31 Rare Diseases Market Forecast by Region, 2023-2033 (US$ bn, AGR%, CAGR%)
Table 32 North America Rare Diseases Market Forecast by Country, 2023-2033 (US$ bn, AGR%, CAGR%)
Table 33 North America Rare Diseases Market Forecast by Disease, 2023-2033 (US$ bn, AGR%, CAGR%)
Table 34 North America Rare Diseases Market Forecast by Disease, 2023-2033 (US$ bn, AGR%, CAGR%)
Table 35 North America Rare Diseases Market Forecast by End-use, 2023-2033 (US$ bn, AGR%, CAGR%)
Table 36 North America Rare Diseases Market Forecast by Age, 2023-2033 (US$ bn, AGR%, CAGR%)
Table 37 U.S. Rare Diseases Market Forecast, 2023-2033 (US$ bn, AGR%, CAGR%)
Table 38 Canada Rare Diseases Market Forecast, 2023-2033 (US$ bn, AGR%, CAGR%)
Table 39 Europe Rare Diseases Market Forecast by Country, 2023-2033 (US$ bn, AGR%, CAGR%)
Table 40 Europe Rare Diseases Market Forecast by Disease, 2023-2033 (US$ bn, AGR%, CAGR%)
Table 41 Europe Rare Diseases Market Forecast by Disease, 2023-2033 (US$ bn, AGR%, CAGR%)
Table 42 Europe Rare Diseases Market Forecast by End-use, 2023-2033 (US$ bn, AGR%, CAGR%)
Table 43 Europe Rare Diseases Market Forecast by Age, 2023-2033 (US$ bn, AGR%, CAGR%)
Table 44 Germany Rare Diseases Market Forecast, 2023-2033 (US$ bn, AGR%, CAGR%)
Table 45 UK Rare Diseases Market Forecast, 2023-2033 (US$ bn, AGR%, CAGR%)
Table 46 France Rare Diseases Market Forecast, 2023-2033 (US$ bn, AGR%, CAGR%)
Table 47 Italy Rare Diseases Market Forecast, 2023-2033 (US$ bn, AGR%, CAGR%)
Table 48 Spain Rare Diseases Market Forecast, 2023-2033 (US$ bn, AGR%, CAGR%)
Table 49 Russia Rare Diseases Market Forecast, 2023-2033 (US$ bn, AGR%, CAGR%)
Table 50 Rest of Europe Rare Diseases Market Forecast, 2023-2033 (US$ bn, AGR%, CAGR%)
Table 51 Asia Pacific Rare Diseases Market Forecast by Country, 2023-2033 (US$ bn, AGR%, CAGR%)
Table 52 Asia Pacific Rare Diseases Market Forecast by Disease, 2023-2033 (US$ bn, AGR%, CAGR%)
Table 53 Asia Pacific Rare Diseases Market Forecast by Disease, 2023-2033 (US$ bn, AGR%, CAGR%)
Table 54 Asia Pacific Rare Diseases Market Forecast by End-use, 2023-2033 (US$ bn, AGR%, CAGR%)
Table 55 Asia Pacific Rare Diseases Market Forecast by Age, 2023-2033 (US$ bn, AGR%, CAGR%)
Table 56 Japan Rare Diseases Market Forecast, 2023-2033 (US$ bn, AGR%, CAGR%)
Table 57 China Rare Diseases Market Forecast, 2023-2033 (US$ bn, AGR%, CAGR%)
Table 58 India Rare Diseases Market Forecast, 2023-2033 (US$ bn, AGR%, CAGR%)
Table 59 Australia Rare Diseases Market Forecast, 2023-2033 (US$ bn, AGR%, CAGR%)
Table 60 South Korea Rare Diseases Market Forecast, 2023-2033 (US$ bn, AGR%, CAGR%)
Table 61 Rest of Asia Pacific Rare Diseases Market Forecast, 2023-2033 (US$ bn, AGR%, CAGR%)
Table 62 Latin America Rare Diseases Market Forecast by Country, 2023-2033 (US$ bn, AGR%, CAGR%)
Table 63 Latin America Rare Diseases Market Forecast by Disease, 2023-2033 (US$ bn, AGR%, CAGR%)
Table 64 Latin America Rare Diseases Market Forecast by Disease, 2023-2033 (US$ bn, AGR%, CAGR%)
Table 65 Latin America Rare Diseases Market Forecast by End-use, 2023-2033 (US$ bn, AGR%, CAGR%)
Table 66 Latin America Rare Diseases Market Forecast by Age, 2023-2033 (US$ bn, AGR%, CAGR%)
Table 67 Brazil Rare Diseases Market Forecast, 2023-2033 (US$ bn, AGR%, CAGR%)
Table 68 Mexico Rare Diseases Market Forecast, 2023-2033 (US$ bn, AGR%, CAGR%)
Table 69 Rest of Latin America Rare Diseases Market Forecast, 2023-2033 (US$ bn, AGR%, CAGR%)
Table 70 MEA Rare Diseases Market Forecast by Country, 2023-2033 (US$ bn, AGR%, CAGR%)
Table 71 MEA Rare Diseases Market Forecast by Disease, 2023-2033 (US$ bn, AGR%, CAGR%)
Table 72 MEA Rare Diseases Market Forecast by Disease, 2023-2033 (US$ bn, AGR%, CAGR%)
Table 73 MEA Rare Diseases Market Forecast by End-use, 2023-2033 (US$ bn, AGR%, CAGR%)
Table 74 MEA Rare Diseases Market Forecast by Age, 2023-2033 (US$ bn, AGR%, CAGR%)
Table 75 GCC Rare Diseases Market Forecast, 2023-2033 (US$ bn, AGR%, CAGR%)
Table 76 South Africa Rare Diseases Market Forecast, 2023-2033 (US$ bn, AGR%, CAGR%)
Table 77 Rest of MEA Rare Diseases Market Forecast, 2023-2033 (US$ bn, AGR%, CAGR%)
Table 78 AbbVie Inc.: Key Details, (CEO, HQ, Revenue, Founded, No. of Employees, Company Type, Website, Business Segment)
Table 79 AbbVie Inc.: Product Benchmarking
Table 80 Alexion Pharmaceuticals, Inc.: Key Details, (CEO, HQ, Revenue, Founded, No. of Employees, Company Type, Website, Business Segment)
Table 81 Alexion Pharmaceuticals, Inc.: Product Benchmarking
Table 82 Alexion Pharmaceuticals, Inc.: Strategic Outlook
Table 83 Amgen Inc.: Key Details, (CEO, HQ, Revenue, Founded, No. of Employees, Company Type, Website, Business Segment)
Table 84 Amgen Inc.: Product Benchmarking
Table 85 Amgen Inc.: Strategic Outlook
Table 86 Biogen Inc.: Key Details, (CEO, HQ, Revenue, Founded, No. of Employees, Company Type, Website, Business Segment)
Table 87 Biogen Inc.: Product Benchmarking
Table 88 Biogen Inc.: Strategic Outlook
Table 89 F. Hoffmann-La Roche Ltd.: Key Details, (CEO, HQ, Revenue, Founded, No. of Employees, Company Type, Website, Business Segment)
Table 90 F. Hoffmann-La Roche Ltd.: Product Benchmarking
Table 91 F. Hoffmann-La Roche Ltd.: Strategic Outlook
Table 92 Johnson & Johnson Services, Inc.: Key Details, (CEO, HQ, Revenue, Founded, No. of Employees, Company Type, Website, Business Segment)
Table 93 Johnson & Johnson Services, Inc.: Product Benchmarking
Table 94 Johnson & Johnson Services, Inc.: Strategic Outlook
Table 95 Merck & Co Inc.: Key Details, (CEO, HQ, Revenue, Founded, No. of Employees, Company Type, Website, Business Segment)
Table 96 Merck & Co Inc.: Product Benchmarking
Table 97 Novartis AG: Key Details, (CEO, HQ, Revenue, Founded, No. of Employees, Company Type, Website, Business Segment)
Table 98 Novartis AG: Product Benchmarking
Table 99 Novartis AG: Strategic Outlook
Table 100 Pfizer Inc.: Key Details, (CEO, HQ, Revenue, Founded, No. of Employees, Company Type, Website, Business Segment)
Table 101 Pfizer Inc.: Product Benchmarking
Table 102 Pfizer Inc.: Strategic Outlook
Table 103 Sanofi S.A.: Key Details, (CEO, HQ, Revenue, Founded, No. of Employees, Company Type, Website, Business Segment)
Table 104 Sanofi S.A.: Product Benchmarking
Table 105 Takeda Pharmaceuticals: Key Details, (CEO, HQ, Revenue, Founded, No. of Employees, Company Type, Website, Business Segment)
Table 106 Takeda Pharmaceuticals: Product Benchmarking
Table 107 Takeda Pharmaceuticals: Strategic Outlook
Table 108 Teva Pharmaceuticals: Key Details, (CEO, HQ, Revenue, Founded, No. of Employees, Company Type, Website, Business Segment)
Table 109 Teva Pharmaceuticals: Product Benchmarking
Table 110 Teva Pharmaceuticals: Strategic Outlook
Table 111 Bristol-Myers Squibb Company: Key Details, (CEO, HQ, Revenue, Founded, No. of Employees, Company Type, Website, Business Segment)
Table 112 Bristol-Myers Squibb Company: Product Benchmarking
Table 113 Bristol-Myers Squibb Company: Strategic Outlook
List of Figures
Figure 1 Rare Diseases Market Segmentation
Figure 2 Rare Diseases Market by Diseases: Market Attractiveness Index
Figure 3 Rare Diseases Market by Type: Market Attractiveness Index
Figure 4 Rare Diseases Market by End-users: Market Attractiveness Index
Figure 5 Rare Diseases Market by Age: Market Attractiveness Index
Figure 6 Rare Diseases Market Attractiveness Index by Region
Figure 7 Rare Diseases Market: Market Dynamics
Figure 8 CDER’s Annual Novel Drug Approvals: 2011 – 2022
Figure 9 Rare Diseases Clinical Activity by Indication
Figure 10 Rare Diseases Clinical Activity by Indication
Figure 11 Rare versus Prevalent Diseases Clinical Trials by Phase
Figure 12 Rare Diseases Market by Region, 2023-2033 (US$ bn, AGR %): “V” Shaped Recovery
Figure 13 Rare Diseases Market by Region, 2023-2033 (US$ bn, AGR %): “U” Shaped Recovery
Figure 14 Rare Diseases Market by Region, 2023-2033 (US$ bn, AGR %): “W” Shaped Recovery
Figure 15 Rare Diseases Market by Region, 2023-2033 (US$ bn, AGR %): “L” Shaped Recovery
Figure 16 Global Rare Disease Market: Porter’s Five Forces Analysis
Figure 17 Rare Diseases Market Attractiveness Index by Diseases
Figure 18 Rare Diseases Market Forecast by Diseases, 2023-2033 (US$ billion)
Figure 19 Rare Diseases Market Share Forecast by Diseases, 2023, 2028, 2033 (%)
Figure 20 Cancer Market Forecast by Region, 2023-2033 (US$ billion)
Figure 21 Cancer Market Share Forecast by Region, 2023 & 2033 (%)
Figure 22 Metabolic Diseases Market Forecast by Region, 2023-2033 (US$ billion)
Figure 23 Metabolic Diseases Market Share Forecast by Region, 2023 & 2033 (%)
Figure 24 Neurological Conditions Market Forecast by Region, 2023-2033 (US$ billion)
Figure 25 Neurological Conditions Market Share Forecast by Region, 2023 & 2033 (%)
Figure 26 Hematologic Disorders Market Forecast by Region, 2023-2033 (US$ billion)
Figure 27 Hematologic Disorders Market Share Forecast by Region, 2023 & 2033 (%)
Figure 28 Infectious Diseases Market Forecast by Region, 2023-2033 (US$ billion)
Figure 29 Infectious Diseases Market Share Forecast by Region, 2023 & 2033 (%)
Figure 30 Musculoskeletal Disorders Market Forecast by Region, 2023-2033 (US$ billion)
Figure 31 Musculoskeletal Disorders Market Share Forecast by Region, 2023 & 2033 (%)
Figure 32 Cardiovascular Disorders Market Forecast by Region, 2023-2033 (US$ billion)
Figure 33 Cardiovascular Disorders Market Share Forecast by Region, 2023 & 2033 (%)
Figure 34 Others Market Forecast by Region, 2023-2033 (US$ billion)
Figure 35 Others Market Share Forecast by Region, 2023 & 2033 (%)
Figure 36 Rare Diseases Market Attractiveness Index by Diseases
Figure 37 Rare Diseases Market Forecast by Type, 2023-2033 (US$ billion)
Figure 38 Rare Diseases Market Share Forecast by Type, 2023, 2028, 2033 (%)
Figure 39 Non-biologics Market Forecast by Region, 2023-2033 (US$ billion)
Figure 40 Non-biologics Market Share Forecast by Region, 2023 & 2033 (%)
Figure 41 Biologics Market Forecast by Region, 2023-2033 (US$ billion)
Figure 42 Biologics Market Share Forecast by Region, 2023 & 2033 (%)
Figure 43 Rare Diseases Market Attractiveness Index by End-users
Figure 44 Rare Diseases Market Forecast by End-users, 2023-2033 (US$ billion)
Figure 45 Rare Diseases Market Share Forecast by End-users, 2023, 2028, 2033 (%)
Figure 46 Specialty Pharmacies Market Forecast by Region, 2023-2033 (US$ billion)
Figure 47 Specialty Pharmacies Market Share Forecast by Region, 2023 & 2033 (%)
Figure 48 Hospital Pharmacies Market Forecast by Region, 2023-2033 (US$ billion)
Figure 49 Hospital Pharmacies Market Share Forecast by Region, 2023 & 2033 (%)
Figure 50 Retail Pharmacies Market Forecast by Region, 2023-2033 (US$ billion)
Figure 51 Retail Pharmacies Market Share Forecast by Region, 2023 & 2033 (%)
Figure 52 Rare Diseases Market Attractiveness Index by Age
Figure 53 Rare Diseases Market Forecast by Age, 2023-2033 (US$ billion)
Figure 54 Rare Diseases Market Share Forecast by Age, 2023, 2028, 2033 (%)
Figure 55 Adult Market Forecast by Region, 2023-2033 (US$ billion)
Figure 56 Adult Market Share Forecast by Region, 2023 & 2033 (%)
Figure 57 Pediatric Market Forecast by Region, 2023-2033 (US$ billion)
Figure 58 Pediatric Market Share Forecast by Region, 2023 & 2033 (%)
Figure 59 Rare Diseases Market Forecast by Region 2023, 2028, 2033 (Revenue, CAGR%)
Figure 60 Rare Diseases Market Share Forecast by Region 2023, 2028, 2033 (%)
Figure 61 Rare Diseases Market by Region, 2023-2033 (US$ bn)
Figure 62 North America Rare Diseases Market Attractiveness Index
Figure 63 North America Rare Diseases Market by Region, 2023, 2028 & 2033 (US$ billion)
Figure 64 North America Rare Diseases Market Forecast by Country, 2023-2033 (US$ billion)
Figure 65 North America Rare Diseases Market Share Forecast by Country, 2023 & 2033 (%)
Figure 66 North America Rare Diseases Market Forecast by Diseases, 2023-2033 (US$ billion)
Figure 67 North America Rare Diseases Market Share Forecast by Diseases, 2023 & 2033 (%)
Figure 68 North America Rare Diseases Market Forecast by Type, 2023-2033 (US$ billion)
Figure 69 North America Rare Diseases Market Share Forecast by Type, 2023 & 2033 (%)
Figure 70 North America Rare Diseases Market Forecast by End-users, 2023-2033 (US$ billion)
Figure 71 North America Rare Diseases Market Share Forecast by End-users, 2023 & 2033 (%)
Figure 72 North America Rare Diseases Market Forecast by Age, 2023-2033 (US$ billion)
Figure 73 North America Rare Diseases Market Share Forecast by Age, 2023 & 2033 (%)
Figure 74 U.S. Rare Diseases Market Forecast, 2023-2033 (US$ billion, AGR %)
Figure 75 Canada Rare Diseases Market Forecast, 2023-2033 (US$ billion, AGR %)
Figure 76 Europe Rare Diseases Market Attractiveness Index
Figure 77 Europe Rare Diseases Market by Region, 2023, 2028 & 2033 (US$ billion)
Figure 78 Europe Rare Diseases Market Forecast by Country, 2023-2033 (US$ billion)
Figure 79 Europe Rare Diseases Market Share Forecast by Country, 2023 & 2033 (%)
Figure 80 Europe Rare Diseases Market Forecast by Diseases, 2023-2033 (US$ billion)
Figure 81 Europe Rare Diseases Market Share Forecast by Diseases, 2023 & 2033 (%)
Figure 82 Europe Rare Diseases Market Forecast by Type, 2023-2033 (US$ billion)
Figure 83 Europe Rare Diseases Market Share Forecast by Type, 2023 & 2033 (%)
Figure 84 Europe Rare Diseases Market Forecast by End-users, 2023-2033 (US$ billion)
Figure 85 Europe Rare Diseases Market Share Forecast by End-users, 2023 & 2033 (%)
Figure 86 Europe Rare Diseases Market Forecast by Age, 2023-2033 (US$ billion)
Figure 87 Europe Rare Diseases Market Share Forecast by Age, 2023 & 2033 (%)
Figure 88 Germany Rare Diseases Market Forecast, 2023-2033 (US$ billion, AGR %)
Figure 89 UK Rare Diseases Market Forecast, 2023-2033 (US$ billion, AGR %)
Figure 90 France Rare Diseases Market Forecast, 2023-2033 (US$ billion, AGR %)
Figure 91 Italy Rare Diseases Market Forecast, 2023-2033 (US$ billion, AGR %)
Figure 92 Spain Rare Diseases Market Forecast, 2023-2033 (US$ billion, AGR %)
Figure 93 Russia Rare Diseases Market Forecast, 2023-2033 (US$ billion, AGR %)
Figure 94 Rest of Europe Rare Diseases Market Forecast, 2023-2033 (US$ billion, AGR %)
Figure 95 Asia Pacific Rare Diseases Market Attractiveness Index
Figure 96 Asia Pacific Rare Diseases Market by Region, 2023, 2028 & 2033 (US$ billion)
Figure 97 Asia Pacific Rare Diseases Market Forecast by Country, 2023-2033 (US$ billion)
Figure 98 Asia Pacific Rare Diseases Market Share Forecast by Country, 2023 & 2033 (%)
Figure 99 Asia Pacific Rare Diseases Market Forecast by Diseases, 2023-2033 (US$ billion)
Figure 100 Asia Pacific Rare Diseases Market Share Forecast by Diseases, 2023 & 2033 (%)
Figure 101 Asia Pacific Rare Diseases Market Forecast by Type, 2023-2033 (US$ billion)
Figure 102 Asia Pacific Rare Diseases Market Share Forecast by Type, 2023 & 2033 (%)
Figure 103 Asia Pacific Rare Diseases Market Forecast by End-users, 2023-2033 (US$ billion)
Figure 104 Asia Pacific Rare Diseases Market Share Forecast by End-users, 2023 & 2033 (%)
Figure 105 Asia Pacific Rare Diseases Market Forecast by Age, 2023-2033 (US$ billion)
Figure 106 Asia Pacific Rare Diseases Market Share Forecast by Age, 2023 & 2033 (%)
Figure 107 Japan Rare Diseases Market Forecast, 2023-2033 (US$ billion, AGR %)
Figure 108 China Rare Diseases Market Forecast, 2023-2033 (US$ billion, AGR %)
Figure 109 India Rare Diseases Market Forecast, 2023-2033 (US$ billion, AGR %)
Figure 110 Australia Rare Diseases Market Forecast, 2023-2033 (US$ billion, AGR %)
Figure 111 South Korea Rare Diseases Market Forecast, 2023-2033 (US$ billion, AGR %)
Figure 112 Rest of Asia Pacific Rare Diseases Market Forecast, 2023-2033 (US$ billion, AGR %)
Figure 113 Latin America Rare Diseases Market Attractiveness Index
Figure 114 Latin America Rare Diseases Market by Region, 2023, 2028 & 2033 (US$ billion)
Figure 115 Latin America Rare Diseases Market Forecast by Country, 2023-2033 (US$ billion)
Figure 116 Latin America Rare Diseases Market Share Forecast by Country, 2023 & 2033 (%)
Figure 117 Latin America Rare Diseases Market Forecast by Diseases, 2023-2033 (US$ billion)
Figure 118 Latin America Rare Diseases Market Share Forecast by Diseases, 2023 & 2033 (%)
Figure 119 Latin America Rare Diseases Market Forecast by Type, 2023-2033 (US$ billion)
Figure 120 Latin America Rare Diseases Market Share Forecast by Type, 2023 & 2033 (%)
Figure 121 Latin America Rare Diseases Market Forecast by End-users, 2023-2033 (US$ billion)
Figure 122 Latin America Rare Diseases Market Share Forecast by End-users, 2023 & 2033 (%)
Figure 123 Latin America Rare Diseases Market Forecast by Age, 2023-2033 (US$ billion)
Figure 124 Latin America Rare Diseases Market Share Forecast by Age, 2023 & 2033 (%)
Figure 125 Brazil Rare Diseases Market Forecast, 2023-2033 (US$ billion, AGR %)
Figure 126 Mexico Rare Diseases Market Forecast, 2023-2033 (US$ billion, AGR %)
Figure 127 Rest of Latin America Rare Diseases Market Forecast, 2023-2033 (US$ billion, AGR %)
Figure 128 MEA Rare Diseases Market Attractiveness Index
Figure 129 MEA Rare Diseases Market by Region, 2023, 2028 & 2033 (US$ billion)
Figure 130 MEA Rare Diseases Market Forecast by Country, 2023-2033 (US$ billion)
Figure 131 MEA Rare Diseases Market Share Forecast by Country, 2023 & 2033 (%)
Figure 132 MEA Rare Diseases Market Forecast by Diseases, 2023-2033 (US$ billion)
Figure 133 MEA Rare Diseases Market Share Forecast by Diseases, 2023 & 2033 (%)
Figure 134 MEA Rare Diseases Market Forecast by Type, 2023-2033 (US$ billion)
Figure 135 MEA Rare Diseases Market Share Forecast by Type, 2023 & 2033 (%)
Figure 136 MEA Rare Diseases Market Forecast by End-users, 2023-2033 (US$ billion)
Figure 137 MEA Rare Diseases Market Share Forecast by End-users, 2023 & 2033 (%)
Figure 138 MEA Rare Diseases Market Forecast by Age, 2023-2033 (US$ billion)
Figure 139 MEA Rare Diseases Market Share Forecast by Age, 2023 & 2033 (%)
Figure 140 GCC Rare Diseases Market Forecast, 2023-2033 (US$ billion, AGR %)
Figure 141 South Africa Rare Diseases Market Forecast, 2023-2033 (US$ billion, AGR %)
Figure 142 Rest of MEA Rare Diseases Market Forecast, 2023-2033 (US$ billion, AGR %)
Figure 143 AbbVie Inc.: Net Revenue, 2015-2022 (US$ million, AGR%)
Figure 144 AbbVie Inc.: Regional Market Shares (%), 2021
Figure 145 AbbVie Inc.: Gross Profit, 2015-2022 (US$ million, AGR%)
Figure 146 AbbVie Inc.: R&D, 2015-2022 (US$ million, AGR%)
Figure 147 Amgen Inc.: Net Revenue, 2015-2022 (US$ million, AGR%)
Figure 148 Amgen Inc.: Regional Market Shares (%), 2022
Figure 149 Amgen Inc.: Gross Profit, 2015-2022 (US$ million, AGR%)
Figure 150 Amgen Inc.: R&D, 2015-2022 (US$ million, AGR%)
Figure 151 Biogen Inc.: Net Revenue, 2015-2021 (US$ million, AGR%)
Figure 152 Biogen Inc.: Gross Profit, 2015-2021 (US$ million, AGR%)
Figure 153 Biogen Inc.: R&D, 2015-2021 (US$ million, AGR%)
Figure 154 F. Hoffmann-La Roche Ltd.: Net Revenue, 2015-2021 (US$ million, AGR%)
Figure 155 F. Hoffmann-La Roche Ltd.: Gross Profit, 2015-2021 (US$ million, AGR%)
Figure 156 F. Hoffmann-La Roche Ltd.: R&D, 2015-2021 (US$ million, AGR%)
Figure 157 Johnson & Johnson Services, Inc.: Net Revenue, 2015-2022 (US$ million, AGR%)
Figure 158 Johnson & Johnson Services, Inc.: Regional Market Shares (%), 2021
Figure 159 Johnson & Johnson Services, Inc.: Gross Profit, 2015-2022 (US$ million, AGR%)
Figure 160 Johnson & Johnson Services, Inc.: R&D, 2015-2022 (US$ million, AGR%)
Figure 161 Merck & Co Inc.: Net Revenue, 2015-2022 (US$ million, AGR%)
Figure 162 Merck & Co Inc.: Regional Market Shares (%), 2021
Figure 163 Merck & Co Inc.: Gross Profit, 2015-2022 (US$ million, AGR%)
Figure 164 Merck & Co Inc.: R&D, 2015-2022 (US$ million, AGR%)
Figure 165 Novartis AG: Net Revenue, 2015-2022 (US$ million, AGR%)
Figure 166 Novartis AG: Regional Market Shares (%), 2021
Figure 167 Novartis AG: Gross Profit, 2015-2022 (US$ million, AGR%)
Figure 168 Novartis AG: R&D, 2015-2022 (US$ million, AGR%)
Figure 169 Pfizer Inc.: Net Revenue, 2015-2022 (US$ million, AGR%)
Figure 170 Pfizer Inc.: Regional Market Shares (%), 2021
Figure 171 Pfizer Inc.: Gross Profit, 2015-2022 (US$ million, AGR%)
Figure 172 Pfizer Inc.: R&D, 2015-2022 (US$ million, AGR%)
Figure 173 Sanofi S.A.: Net Revenue, 2015-2022 (US$ million, AGR%)
Figure 174 Sanofi S.A.: Regional Market Shares (%), 2021
Figure 175 Sanofi S.A.: Gross Profit, 2015-2022 (US$ million, AGR%)
Figure 176 Sanofi S.A.: R&D, 2015-2022 (US$ million, AGR%)
Figure 177 Takeda Pharmaceuticals: Net Revenue, 2015-2022 (US$ million, AGR%)
Figure 178 Takeda Pharmaceuticals: Gross Profit, 2015-2022 (US$ million, AGR%)
Figure 179 Takeda Pharmaceuticals: R&D, 2015-2022 (US$ million, AGR%)
Figure 180 Teva Pharmaceuticals: Net Revenue, 2015-2021 (US$ million, AGR%)
Figure 181 Teva Pharmaceuticals: Regional Market Shares (%), 2021
Figure 182 Teva Pharmaceuticals: Gross Profit, 2015-2021 (US$ million, AGR%)
Figure 183 Teva Pharmaceuticals: R&D, 2015-2021 (US$ million, AGR%)
Figure 184 Bristol-Myers Squibb Company: Net Revenue, 2015-2022 (US$ million, AGR%)
Figure 185 Bristol-Myers Squibb Company: Gross Profit, 2015-2022 (US$ million, AGR%)
Figure 186 Bristol-Myers Squibb Company: R&D, 2015-2022 (US$ million, AGR%)
ページTOPに戻る
Visiongain社のヘルスケアと医薬・化学品分野での最新刊レポート
本レポートと同じKEY WORD()の最新刊レポート
- 本レポートと同じKEY WORDの最新刊レポートはありません。
よくあるご質問
Visiongain社はどのような調査会社ですか?
英国の調査会社ヴィジョンゲイン社(Visiongain)は、通信とエネルギーのほか、自動車や化学・医薬品、金属など、広範な市場を対象に調査を行っています。自動車市場については、市場全般に関する調査のほ... もっと見る
調査レポートの納品までの日数はどの程度ですか?
在庫のあるものは速納となりますが、平均的には 3-4日と見て下さい。
但し、一部の調査レポートでは、発注を受けた段階で内容更新をして納品をする場合もあります。
発注をする前のお問合せをお願いします。
注文の手続きはどのようになっていますか?
1)お客様からの御問い合わせをいただきます。
2)見積書やサンプルの提示をいたします。
3)お客様指定、もしくは弊社の発注書をメール添付にて発送してください。
4)データリソース社からレポート発行元の調査会社へ納品手配します。
5) 調査会社からお客様へ納品されます。最近は、pdfにてのメール納品が大半です。
お支払方法の方法はどのようになっていますか?
納品と同時にデータリソース社よりお客様へ請求書(必要に応じて納品書も)を発送いたします。
お客様よりデータリソース社へ(通常は円払い)の御振り込みをお願いします。
請求書は、納品日の日付で発行しますので、翌月最終営業日までの当社指定口座への振込みをお願いします。振込み手数料は御社負担にてお願いします。
お客様の御支払い条件が60日以上の場合は御相談ください。
尚、初めてのお取引先や個人の場合、前払いをお願いすることもあります。ご了承のほど、お願いします。
データリソース社はどのような会社ですか?
当社は、世界各国の主要調査会社・レポート出版社と提携し、世界各国の市場調査レポートや技術動向レポートなどを日本国内の企業・公官庁及び教育研究機関に提供しております。
世界各国の「市場・技術・法規制などの」実情を調査・収集される時には、データリソース社にご相談ください。
お客様の御要望にあったデータや情報を抽出する為のレポート紹介や調査のアドバイスも致します。
|
|

