バイオディフェンス市場レポート:2023-2033
Biodefence Market Report 2023-2033
レポート詳細
バイオディフェンス市場レポート 2023-2033 :本レポートは、新たな収益の柱を目指すリーディングカンパニーが、業界とその背景にあるダイナミクスをより深く理解する上で、非常に有益な... もっと見る
※上記価格は部署ライセンス(Departmental licence)価格です。
その他の価格についてはデータリソースまでお問合せください。
日本語のページは自動翻訳を利用し作成しています。
実際のレポートは英文のみでご納品いたします。

|

|
サマリー
レポート詳細
バイオディフェンス市場レポート 2023-2033:本レポートは、新たな収益の柱を目指すリーディングカンパニーが、業界とその背景にあるダイナミクスをより深く理解する上で、非常に有益なものとなるでしょう。また、異業種への進出や新地域での既存事業の拡大を目指す企業にとっても有用なレポートです。
先進国での研究開発投資の増加
研究開発投資の拡大により、製薬会社やバイオ製薬会社は高品質で技術的に高度な生物脅威検出装置を製造することが可能になり、業界の成長に大きな影響を与えるものと思われます。さらに、欧州政府は、炭疽菌、天然痘、ボツリヌス菌など、さまざまな病気に対するワクチンを大量に製造し、感染症対策や風土病の蔓延を防止するための研究開発活動も支援しています。バイオテロ攻撃は死者を出し、経済を弱体化させる可能性があるため、政府は様々な製薬会社やバイオ製薬会社に資金を提供しており、近い将来、業界の成長を後押しすることになるでしょう。
バイオテロ攻撃に関する意識の高まりが産業の成長を促進する
先進国および低開発国でのバイオテロ攻撃に関する意識の高まりは、予測期間中のバイオディフェンス市場の成長を著しく促進するでしょう。インターネットの出現とソーシャルメディアの普及により、世界のどの地域でも生物兵器に関するニュースが世界中に広がる可能性があります。これは、遠く離れた人々に不安を与え、貿易や旅行に大きな影響を与える可能性があります。日本やインドなどの発展途上国の政府は、バイオテロ攻撃に対する国民の意識を高めるために、国民意識向上キャンペーンを計画しています。さまざまな風土病に対抗するために政府が実施するこうした予防措置は、当面の間、業界の成長を後押しすることになるでしょう。
低開発地域における低い政府資金が市場成長の障害となる可能性
低開発地域における政府の最小限の介入と低いR&D資金が、予測期間中のバイオディフェンス市場の成長を阻害すると思われます。さらに、メキシコやブラジルなどの国では、経済発展が不十分なため、政府や規制当局が生物脅威検出装置の利用を促進するための多額の投資を行うことができません。発展途上地域では、技術的に高度な生物脅威検出デバイスが利用可能であることについての認識が不足しているのです。さらに、低開発経済圏では、生体防御装置とワクチンに関する規制の枠組みが確立されていません。バイオディフェンス産業で事業を展開する主要企業は、貿易政策の変化により、これらの国への参入が困難であることを認識しています。その結果、バイオテロと戦うために使用されるツールや予防接種の流通は、新興地域において低く、バイオディフェンス市場の成長を妨げる可能性があります。
マーケットリサーチレポートを購入する前に、どのような質問をすべきでしょうか?
- バイオディフェンスマーケットはどのように進化しているか?
- バイオディフェンス市場の推進要因と抑制要因は何か?
- バイオディフェンスの各サブマーケットは予測期間中にどのように成長し、2033年にはどの程度の収益を占めるようになるのか?
- 2023年から2033年にかけて、バイオディフェンスの各サブマーケットの市場シェアはどのように推移するのでしょうか?
- 2023年から2033年にかけて、市場全体の主な牽引役となるのは何か?
- 主要なバイオディフェンス市場はマクロ経済のダイナミクスに概ね追随するのか、それとも個々の国内市場が他を凌駕するのか?
- 2033年までに各国市場のシェアはどのように変化し、どの地域が2033年の市場をリードするのか?
- 主要プレイヤーは誰か、また予測期間中の見通しは?
- これらの主要企業のバイオディフェンス開発プロジェクトは何か?
- 2023年から2033年の間に、業界はどのように進化するのか?現在および今後10年間に行われるバイオディフェンス開発プロジェクトにはどのような意味があるのでしょうか?
- バイオディフェンス市場の規模をさらに拡大するために、製品の商業化の必要性が高まっているのか?
- バイオディフェンス市場の方向性と、市場の最前線に立つためにはどうすればよいか?
- 新製品やサービスラインに対する最適な投資オプションは何か?
- 企業を新たな成長軌道に乗せ、C-suiteを獲得するための重要な展望とは?
このことが、現在および今後10年間のバイオディフェンス市場にどのような影響を与えるかを知る必要があります。
- 本レポートは197ページにわたり、112の表と107のグラフを掲載しています。
- このレポートでは、業界における主要な収益性の高い分野をハイライトしているため、今すぐターゲットを絞ることができます。
- 世界、地域、国別の売上高と成長率を詳細に分析しています。
- 競合他社が成功した主なトレンド、変化、収益予測をハイライトしています。
本レポートは次のことを教えてくれます。バイオディフェンス市場が今後10年間にどのように発展していくのか、またCOVID-19の景気後退や景気回復の変動に伴ってどのように変化していくのかをお伝えします。この市場は、過去10年間のどの時点よりも、今がより重要なのです。
2033年までの予測やその他の分析により、商業的な展望が見えてきた
- 2033年までの収益予測に加え、直近の実績、成長率、市場シェアもご覧いただけます。
- ビジネスの展望や展開など、独自の分析もご覧いただけます。
- 定性的分析(市場力学、促進要因、機会、阻害要因、課題など)、コスト構造、バイオディフェンスの価格上昇の影響、最近の開発状況をご覧いただけます。
本レポートでは、COVID-19が業界と貴社にどのような影響を与えるかについて、データ分析と貴重な洞察を掲載しています。本レポートでは、COVID-19の4つの回収パターンとその影響、すなわち「V」、「L」、「W」、「U」について論じています。
報告書の対象セグメント
製品別
・ ワクチン
- 炭疽菌
- 小型ポックス
- ボツリヌス中毒
- その他
・ 生物脅威検出装置
- アッセイおよび試薬
- 検出器
- 識別装置
- サンプラー
世界市場全体とセグメントの収益予測に加え、5つの地域と16の主要国市場の収益予測も掲載しています。
北米
- アメリカ
- カナダ
欧州
- ドイツ
- 英国
- フランス
- スペイン
- イタリア
- その他の地域
アジア太平洋地域
- 中国
- 日本
- インド
- オーストラリア
- 韓国
- その他のアジア太平洋地域
ラテンアメリカ
- ブラジル
- メキシコ
- その他のラテンアメリカ地域
MEA
- GCC
- 南アフリカ
- その他のMEA地域
バイオディフェンス市場の主要企業のプロファイルと2023年から2033年まで、これらの企業の事業のこのセグメントに焦点を当てたものも含まれています。
主要企業と市場成長の可能性
・ Alexeter Technologies, LLC,
・ Altimmune
・ Achaogen, Inc.
・ Alnylam Pharmaceuticals
・ ANP Technology
・ Bavarian Nordic
・ BBI Detection
・ Biofire Defense (bioMerieux SA)
・ Biosearch Technologies
・ Bruker
・ Dynport Vaccine Company
・ Electronic Sensor Technology Inc.
・ Elusys Therapeutics
・ Emergent BioSolutions Inc.
・ Ichor Medical
・ NanoLogix
・ New Horizons Diagnostic Corporation
・ PositiveID Corporation
・ Research International
・ SIGA Technologies, Inc.
・ Statera Biopharma (Cleveland Biolabs)
・ Smith’s Detection
・ Synexis Systems
バイオディフェンス市場の世界全体の収益、2023年から2033年まで金額ベースで、2023年に159億2200万米ドルを突破すると、我々の仕事は計算されます。2033年まで収益が大きく伸びると予測しています。このレポートでは、最も大きな可能性を秘めた企業を特定しています。彼らの能力、進歩、商業的展望を知ることで、一歩先を行くことができます。
バイオディフェンス市場、2023年から2033年までのレポートはどのように役立つのでしょうか?
要約すると、197ページのレポートでは、以下のような知識を得ることができます。
- バイオディフェンス市場の2023年から2033年までの収益予測、製品のタイプ別予測、世界と地域レベルでの各予測 - 産業の展望を発見し、投資と収益の最も有利な場所を見つけることができます。
- 5地域と16主要国市場の2033年までの収益予測 - 北米、欧州、アジア太平洋、ラテンアメリカ、中東・アフリカのバイオディフェンス市場、2023年から2033年の市場予測をご覧いただけます。また、米国、カナダ、メキシコ、ブラジル、ドイツ、フランス、英国、イタリア、中国、インド、日本、オーストラリアなどの主要経済圏の市場も予測されています。
- 既存企業や市場参入を目指す企業の展望 - 生物防御市場に関わる主要企業の企業プロファイルを含む、2023年から2033年までの展望。
定量的・定性的な分析と独自の予測をご覧いただけます。私たちのレポートだけが持つ情報を入手し、貴重なビジネスインテリジェンスを得ることができます。
他にはない情報
私たちの新しいレポートがあれば、知識の遅れを取り戻し、チャンスを逃す可能性が低くなります。私たちの研究が貴社の調査、分析、意思決定にどのように役立つかをご覧ください。Visiongainの研究は、バイオディフェンス市場、2023年から2033年、市場をリードする企業のための商業分析を必要とするすべての人のためのものです。データ、トレンド、予測をご覧いただけます。
ページTOPに戻る
目次
目次
1.レポートの概要
1.1 研究の目的
1.2 バイオディフェンス市場の紹介
1.3 本レポートが提供するもの
1.4 本レポートを読むべき理由
1.5 本分析報告書が回答する主な質問事項
1.6 本レポートは誰のためのものか?
1.7 方法論
1.7.1 市場の定義
1.7.2 市場評価・予測手法
1.7.3 データの検証
1.7.3.1 一次調査
1.7.3.2 セカンダリーリサーチ
1.8 よくある質問(FAQ)
1.9 関連するVisiongainのレポート
1.10 Visiongainについて
2 エグゼクティブサマリー
3 市場の概要
3.1 主要な調査結果
3.2 マーケットダイナミクス
3.2.1 市場の推進要因
3.2.1.1 政府によるR&D投資の増加
3.2.1.2 新興国における政府の積極的な取り組み
3.2.1.3 先進国でのバイオテクノロジー分野の技術開発
3.2.2 市場阻害要因
3.2.2.1 低開発地域におけるR&D資金の少なさ
3.2.3 市場機会
3.2.3.1 生物脅威物質リストの増加
3.2.3.2 先端バイオテクノロジー製品の開発
3.3 COVID-19影響度分析
3.4 ポーターのファイブフォース分析
3.4.1 供給者のバーゲニングパワー
3.4.2 バイヤーのバーゲニングパワー
3.4.3 競争相手との競合
3.4.4 代替品による脅威
3.4.5 新規参入者の脅威
3.5 PEST分析
4 バイオディフェンスの製品別市場分析
4.1 主要な調査結果
4.2 製品セグメント市場魅力度指数
4.3 バイオディフェンスの製品別市場規模推定・予測
4.4 ワクチン
4.4.1 炭疽菌
4.4.1.1 地域別市場規模、2023年~2033年(US$ Mn)
4.4.1.2 地域別市場シェア、2023年&2033年(%)
4.4.2 天然痘
4.4.2.1 地域別市場規模、2023年~2033年 (US$ Mn)
4.4.2.2 地域別市場シェア、2023年&2033年(%)
4.4.3 ボツリヌス中毒
4.4.3.1 地域別市場規模、2023年~2033年 (US$ Mn)
4.4.3.2 地域別市場シェア、2023年&2033年(%)
4.4.4 その他
4.4.4.1 地域別市場規模、2023年~2033年 (US$ Mn)
4.4.4.2 地域別市場シェア、2023年&2033年(%)
4.5 生物脅威検出装置
4.5.1 アッセイと試薬
4.5.1.1 地域別市場規模、2023年~2033年 (US$ Mn)
4.5.1.2 地域別市場シェア、2023年&2033年(%)
4.5.2 検出器
4.5.2.1 地域別市場規模、2023年~2033年 (US$ Mn)
4.5.2.2 地域別市場シェア、2023年&2033年 (%)
4.5.3 識別器
4.5.3.1 地域別市場規模、2023年~2033年 (US$ Mn)
4.5.3.2 地域別市場シェア、2023年&2033年(%)
4.5.4 サンプラー
4.5.4.1 地域別市場規模、2023年~2033年 (US$ Mn)
4.5.4.2 地域別市場シェア、2023年&2033年(%)
5 バイオディフェンス市場分析:地域別
5.1 主な調査結果
5.2 地域別セグメント市場魅力度指数
5.3 生体防御の市場規模推定と予測
6 北米のバイオディフェンス市場分析
6.1 主な調査結果
6.2 北米バイオディフェンス市場の魅力度指数
6.3 北米バイオディフェンス国別市場:2023年、2028年&2033年(US$ Mn)
6.4 北米バイオディフェンス市場の国別市場規模予測・予想
6.5 北米バイオディフェンス市場 製品別市場規模予測・予測
6.6 米国バイオディフェンス市場分析
6.7 カナダのバイオディフェンス市場分析
7 欧州のバイオディフェンス市場分析
7.1 主な調査結果
7.2 欧州バイオディフェンス市場の魅力度指数
7.3 欧州バイオディフェンス国別市場 2023年、2028年&2033年 (US$ Mn)
7.4 欧州バイオディフェンス市場 国別市場規模予測・予測
7.5 欧州バイオディフェンス市場 製品別市場規模予測・予測
7.6 ドイツのバイオディフェンス市場分析
7.7 フランスバイオディフェンス市場分析
7.8 イギリスのバイオディフェンス市場分析
7.9 イタリアバイオディフェンス市場分析
7.10 スペインバイオディフェンス市場分析
7.11 ロシアバイオディフェンス市場分析
7.12 その他の欧州のバイオディフェンス市場分析
8 アジア太平洋地域のバイオディフェンス市場分析
8.1 主な調査結果
8.2 アジア太平洋地域のバイオディフェンス市場の魅力度指数
8.3 アジア太平洋地域のバイオディフェンス市場の国別推移、2023年、2028年&2033年(US$ Mn)
8.4 アジア太平洋地域のバイオディフェンス市場の国別市場規模予測・予想
8.5 アジア太平洋地域のバイオディフェンス市場の製品別市場規模予測・予測
8.6 日本バイオディフェンス市場分析
8.7 中国バイオディフェンス市場分析
8.8 インドバイオディフェンス市場分析
8.9 オーストラリアバイオディフェンス市場分析
8.10 韓国バイオディフェンス市場分析
8.11 その他のアジア太平洋地域のバイオディフェンス市場分析
9 ラテンアメリカのバイオディフェンス市場分析
9.1 主な調査結果
9.2 ラテンアメリカのバイオディフェンス市場の魅力度指数
9.3 ラテンアメリカのバイオディフェンス市場の国別推移、2023年、2028年&2033年(US$ Mn)
9.4 ラテンアメリカのバイオディフェンス市場の国別市場規模予測・予想
9.5 ラテンアメリカのバイオディフェンス市場 製品別市場規模予測・予測
9.6 ブラジルのバイオディフェンス市場分析
9.7 メキシコのバイオディフェンス市場分析
9.8 その他のラテンアメリカのバイオディフェンス市場分析
10 MEAのバイオディフェンス市場分析
10.1 主な調査結果
10.2 MEAバイオディフェンス市場の魅力度指数
10.3 MEAバイオディフェンス市場の国別推移、2023年、2028年&2033年(US$ Mn)
10.4 MEAバイオディフェンス市場の国別市場規模予測・予想
10.5 MEAバイオディフェンス市場の製品別市場規模予測・予想
10.6 GCCバイオディフェンス市場分析
10.7 南アフリカのバイオディフェンス市場分析
10.8 その他のMEAのバイオディフェンス市場の分析
11 主要企業のプロフィール
11.1 競合他社の状況、2021年
11.1.1 BioFire Defense
11.1.2 Bruker Corporation
11.1.3 Emergent BioSolutions
11.1.4 Smiths detection
11.2 Alexeter Technologies, LLC,
11.2.1 企業スナップショット
11.2.2 会社概要
11.2.3 製品ベンチマーク
11.3 Altimmune
11.3.1 企業スナップショット
11.3.2 会社概要
11.3.3 財務分析
11.3.3.1 純収益、2017-2021年
11.3.3.2 R&D、2017-2021年
11.3.4 製品ベンチマーク
11.4 ANP Technology
11.4.1 企業スナップショット
11.4.2 会社概要
11.4.3 ベンチマーキング
11.5 Bavarian Nordic
11.5.1 企業スナップショット
11.5.2 会社概要
11.5.3 財務分析
11.5.3.1 純収益、2017-2021年
11.5.3.2 R&D、2017年-2021年
11.5.3.3 地域別市場シェア、2021年
11.5.4 製品ベンチマーク
11.5.5 戦略的な展望
11.6 Biofire Defense (bioMerieux SA)
11.6.1 企業スナップショット
11.6.2 会社概要
11.6.3 財務分析
11.6.3.1 純収益、2017-2021年
11.6.3.2 R&D、2017年-2021年
11.6.3.3 地域別市場シェア、2021年
11.6.4 製品ベンチマーク
11.6.5 戦略的な展望
11.7 Biosearch Technologies
11.7.1 企業スナップショット
11.7.2 会社概要
11.7.3 財務分析
11.7.3.1 純収益、2017-2021年
11.7.3.2 地域別市場シェア、2021年
11.7.4 製品ベンチマーク
11.8 Bruker
11.8.1 企業スナップショット
11.8.2 会社概要
11.8.3 財務分析
11.8.3.1 純収益、2017-2021年
11.8.3.2 R&D、2017年-2021年
11.8.3.3 地域別市場シェア、2021年
11.8.4 製品ベンチマーク
11.9 Electronic Sensor Technology Inc.
11.9.1 企業スナップショット
11.9.2 会社概要
11.9.3 ベンチマーキング
11.10 Elusys Therapeutics
11.10.1 企業スナップショット
11.10.2 会社概要
11.10.3 ベンチマーキング
11.10.4 戦略的な展望
11.11 Emergent BioSolutions Inc.
11.11.1 企業スナップショット
11.11.2 会社概要
11.11.3 財務分析
11.11.3.1 純収益、2017-2021年
11.11.3.2 R&D、2017年-2021年
11.11.4 製品ベンチマーク
11.11.5 戦略的な展望
11.12 Ichor Medical
11.12.1 企業スナップショット
11.12.2 会社概要
11.12.3 ベンチマーキング
11.13 NanoLogix
11.13.1 企業スナップショット
11.13.2 会社概要
11.13.3 製品ベンチマーク
11.14 New Horizons Diagnostic Corporation
11.14.1 企業スナップショット
11.14.2 会社概要
11.14.3 ベンチマーキング
11.14.4 戦略的展望
11.15 PositiveID Corporation
11.15.1 企業スナップショット
11.15.2 会社概要
11.15.3 ベンチマーキング
11.16 SIGA Technologies, Inc
11.16.1 企業スナップショット
11.16.2 会社概要
11.16.3 財務分析
11.16.3.1 純収益、2017-2021年
11.16.3.2 R&D、2017年~2021年
11.16.4 製品ベンチマーク
11.16.5 戦略的な展望
11.17 Alnylam Pharmaceuticals
11.17.1 企業スナップショット
11.17.2 会社概要
11.17.3 財務分析
11.17.3.1 純収益、2017-2021年
11.17.3.2 R&D、2017年-2021年
11.17.4 製品ベンチマーク
11.17.5 戦略的な展望
11.18 BBI Detection
11.18.1 企業スナップショット
11.18.2 会社概要
11.18.3 製品ベンチマーク
11.19 Statera Biopharma
11.19.1 企業スナップショット
11.19.2 会社概要
11.19.3 財務分析
11.19.3.1 純収益、2017-2021年
11.19.3.2 R&D、2017年-2021年
11.19.4 製品ベンチマーク
11.20 Dynport Vaccine Company
11.20.1 企業スナップショット
11.20.2 会社概要
11.20.3 ベンチマーキング
11.21 Research International
11.21.1 企業スナップショット
11.21.2 会社概要
11.21.3 ベンチマーキング
11.22 Smith’s Detection
11.22.1 企業スナップショット
11.22.2 会社概要
11.22.3 製品ベンチマーク
11.22.4 戦略的な展望
11.23 Synexis Systems
11.23.1 企業スナップショット
11.23.2 会社概要
11.23.3 ベンチマーキング
11.23.4 戦略的展望
12 結論と提言
12.1 ヴィジョンゲインからの結論
12.2 市場関係者への提言
表の一覧
Table 1 Biodefence Market Snapshot, 2023 & 2033 (US$ million, CAGR %)
Table 2 Biodefence Market by Region, 2023-2033 (US$ Mn, AGR (%), CAGR (%)): “V” Shaped Recovery Scenario
Table 3 Biodefence Market by Region, 2023-2033 (US$ Mn, AGR (%), CAGR (%)): “U” Shaped Recovery Scenario
Table 4 Biodefence Market by Region, 2023-2033 (US$ Mn, AGR (%), CAGR (%)): “W” Shaped Recovery Scenario
Table 5 Biodefence Market by Region, 2023-2033 (US$ Mn, AGR (%), CAGR (%)): “L” Shaped Recovery Scenario
Table 6 Biodefence Devices Market by Product, 2023-2033 (US$ Mn, AGR (%), CAGR (%))
Table 7 Biodefence Devices Market by Vaccines, 2023-2033 (US$ Mn, AGR (%), CAGR (%))
Table 8 Biodefence Devices Market by Biothreat Detection Devices, 2023-2033 (US$ Mn, AGR (%), CAGR (%))
Table 9 Biodefence Market Forecast by Product, 2023-2033 (US$ million)
Table 10 Anthrax Market Forecast by Region, 2023-2033 (US$ Mn, AGR%, CAGR%)
Table 11 Small Pox Market Forecast by Region, 2023-2033 (US$ Mn, AGR%, CAGR%)
Table 12 Botulism Market Forecast by Region, 2023-2033 (US$ Mn, AGR%, CAGR%)
Table 13 Others Market Forecast by Region, 2023-2033 (US$ Mn, AGR%, CAGR%)
Table 14 Assays and reagents Market Forecast by Region, 2023-2033 (US$ Mn, AGR%, CAGR%)
Table 15 Detectors Market Forecast by Region, 2023-2033 (US$ Mn, AGR%, CAGR%)
Table 16 Identifiers Market Forecast by Region, 2023-2033 (US$ Mn, AGR%, CAGR%)
Table 17 Samplers Market Forecast by Region, 2023-2033 (US$ Mn, AGR%, CAGR%)
Table 18 Biodefence Market Forecast by Region, 2023-2033 (US$ Mn, AGR %, CAGR %)
Table 19 North America Biodefence Market Forecast by Country
Table 20 North America Biodefence Devices Market by Product, 2023-2033 (US$ Mn, AGR (%), CAGR (%))
Table 21 North America Biodefence Devices Market by Vaccines, 2023-2033 (US$ Mn, AGR (%), CAGR (%))
Table 22 North America Biodefence Devices Market by Biothreat detection devices, 2023-2033 (US$ Mn, AGR (%), CAGR (%))
Table 23 U.S. Biodefence Market Forecast, 2023-2033 (US$ Mn, AGR %, CAGR %)
Table 24 Canada Biodefence Market Forecast, 2023-2033 (US$ Mn, AGR %, CAGR %)
Table 25 Europe Biodefence Market Forecast by Country, 2023-2033 (US$ Mn, AGR%, CAGR%)
Table 26 Europe Biodefence Devices Market by Product, 2023-2033 (US$ Mn, AGR (%), CAGR (%))
Table 27 Europe Biodefence Devices Market by Vaccines, 2023-2033 (US$ Mn, AGR (%), CAGR (%))
Table 28 Europe Biodefence Devices Market by Biothreat Detection Devices, 2023-2033 (US$ Mn, AGR (%), CAGR (%))
Table 29 Germany Biodefence Market Forecast, 2023-2033 (US$ Mn, AGR %, CAGR %)
Table 30 France Biodefence Market Forecast, 2023-2033 (US$ Mn, AGR %, CAGR %)
Table 31 UK Biodefence Market Forecast, 2023-2033 (US$ Mn, AGR %, CAGR %)
Table 32 Italy Biodefence Market Forecast, 2023-2033 (US$ Mn, AGR %, CAGR %)
Table 33 Spain Biodefence Market Forecast, 2023-2033 (US$ Mn, AGR %, CAGR %)
Table 34 Russia Biodefence Market Forecast, 2023-2033 (US$ Mn, AGR %, CAGR %)
Table 35 Rest of Europe Biodefence Market Forecast, 2023-2033 (US$ Mn, AGR %, CAGR %)
Table 36 Asia Pacific Biodefence Market Forecast by Country 2023-2033 (US$ Mn, AGR%, CAGR%)
Table 37 Asia Pacific Biodefence Devices Market by Product, 2023-2033 (US$ Mn, AGR (%), CAGR (%))
Table 38 Asia Pacific Biodefence Devices Market by Product, 2023-2033 (US$ Mn, AGR (%), CAGR (%))
Table 39 Asia Pacific Biodefence Devices Market by Biothreat Detection Devices, 2023-2033 (US$ Mn, AGR (%), CAGR(%))
Table 40 Japan Biodefence Market Forecast, 2023-2033 (US$ Mn, AGR %, CAGR %)
Table 41 China Biodefence Market Forecast, 2023-2033 (US$ Mn, AGR %, CAGR %)
Table 42 India Biodefence Market Forecast, 2023-2033 (US$ Mn, AGR %, CAGR %)
Table 43 Australia Biodefence Market Forecast, 2023-2033 (US$ Mn, AGR %, CAGR %)
Table 44 South Korea Biodefence Market Forecast, 2023-2033 (US$ Mn, AGR %, CAGR %)
Table 45 Rest of Asia Pacific Biodefence Market Forecast, 2023-2033 (US$ Mn, AGR %, CAGR %)
Table 46 Latin America Biodefence forecast by Country 2023-2033 (US$ Mn, AGR%, CAGR%)
Table 47 Latin America Biodefence Devices Market by Product, 2023-2033 (US$ Mn, AGR (%), CAGR (%))
Table 48 Latin America Biodefence Devices Market by Product, 2023-2033 (US$ Mn, AGR (%), CAGR (%))
Table 49 Latin America Biodefence Devices Market by Biothreat Detection Devices, 2023-2033 (US$ Mn, AGR (%), CAGR (%))
Table 50 Brazil Biodefence Market Forecast, 2023-2033 (US$ Mn, AGR %, CAGR %)
Table 51 Mexico Biodefence Market Forecast, 2023-2033 (US$ Mn, AGR %, CAGR %)
Table 52 Rest of Latin America Biodefence Market Forecast, 2023-2033 (US$ Mn, AGR %, CAGR %)
Table 53 MEA Biodefence forecast by Country 2023-2033 (US$ Mn, AGR%, CAGR%)
Table 54 MEA Biodefence Devices Market by Product, 2023-2033 (US$ Mn, AGR (%), CAGR (%))
Table 55 MEA Biodefence Devices Market by Product, 2023-2033 (US$ Mn, AGR (%), CAGR (%))
Table 56 MEA Biodefence Devices Market by Biothreat Detection Devices, 2023-2033 (US$ Mn, AGR (%), CAGR (%))
Table 57 GCC Biodefence Market Forecast, 2023-2033 (US$ Mn, AGR %, CAGR %)
Table 58 South Africa Biodefence Market Forecast, 2023-2033 (US$ Mn, AGR %, CAGR %)
Table 59 Rest of MEA Biodefence Market Forecast, 2023-2033 (US$ Mn, AGR %, CAGR %)
Table 60 Alexeter Technologies, LLC: Key Details, (CEO, HQ, Revenue, Founded, No. of Employees, Company Type, Website, Business Segment)
Table 61 Alexeter Technologies, LLC: Product Benchmarking
Table 62 Altimmune: Key Details, (CEO, HQ, Revenue, Founded, No. of Employees, Company Type, Website, Business Segment)
Table 63 Altimmune: Product Benchmarking
Table 64 ANP Technology: Key Details, (CEO, HQ, Revenue, Founded, No. of Employees, Company Type, Website, Business Segment)
Table 65 ANP Technology: Product Benchmarking
Table 66 Bavarian Nordic: Key Details, (CEO, HQ, Revenue, Founded, No. of Employees, Company Type, Website, Business Segment)
Table 67 Bavarian Nordic: Product Benchmarking
Table 68 Bavarian Nordic: Strategic Outlook
Table 69 Biofire Defense (bioMerieux SA): Key Details, (CEO, HQ, Revenue, Founded, No. of Employees, Company Type, Website, Business Segment)
Table 70 Biofire Defense (bioMerieux SA): Product Benchmarking
Table 71 Biofire Defense (bioMerieux SA.: Strategic Outlook
Table 72 Biosearch Technologies : Key Details, (CEO, HQ, Revenue, Founded, No. of Employees, Company Type, Website, Business Segment)
Table 73 Biosearch Technologies: Product Benchmarking
Table 74 Bruker: Key Details, (CEO, HQ, Revenue, Founded, No. of Employees, Company Type, Website, Business Segment)
Table 75 Bruker: Product Benchmarking
Table 76 Electronic Sensor Technology Inc.: Key Details, (CEO, HQ, Revenue, Founded, No. of Employees, Company Type, Website, Business Segment)
Table 77 Electronic Sensor Technology Inc .: Product Benchmarking
Table 78 Elusys Therapeutics: Key Details, (CEO, HQ, Revenue, Founded, No. of Employees, Company Type, Website, Business Segment)
Table 79 Elusys Therapeutics .: Product Benchmarking
Table 80 Elusys Therapeutics : Strategic Outlook
Table 81 Emergent BioSolutions Inc.: (CEO, HQ, Revenue, Founded, No. of Employees, Company Type, Website, Business Segment)
Table 82 Emergent BioSolutions Inc.: Product Benchmarking
Table 83 Emergent BioSolutions Inc.: Strategic Outlook
Table 84 Ichor Medical: Key Details, (CEO, HQ, Revenue, Founded, No. of Employees, Company Type, Website, Business Segment)
Table 85 Ichor Medical: Product Benchmarking
Table 86 NanoLogix: Key Details, (CEO, HQ, Revenue, Founded, No. of Employees, Company Type, Website, Business Segment)
Table 87 NanoLogix: Product Benchmarking
Table 88 New Horizons Diagnostic Corporation: Key Details, (CEO, HQ, Revenue, Founded, No. of Employees, Company Type, Website, Business Segment)
Table 89 New Horizons Diagnostic Corporation: Product Benchmarking
Table 90 New Horizons Diagnostic Corporation: Strategic Outlook
Table 91 PositiveID Corporation: Key Details, (CEO, HQ, Revenue, Founded, No. of Employees, Company Type, Website, Business Segment)
Table 92 PositiveID Corporation .: Product Benchmarking
Table 93 SIGA Technologies, Inc: Key Details, (CEO, HQ, Revenue, Founded, No. of Employees, Company Type, Website, Business Segment)
Table 94 SIGA Technologies, Inc.: Product Benchmarking
Table 95 SIGA Technologies, Inc: Strategic Outlook
Table 96 Alnylam Pharmaceuticals: Key Details, (CEO, HQ, Revenue, Founded, No. of Employees, Company Type, Website, Business Segment)
Table 97 Alnylam Pharmaceuticals: Product Benchmarking
Table 98 Alnylam Pharmaceuticals: Strategic Outlook
Table 99 BBI Detection: Key Details, (CEO, HQ, Founded, No. of Employees, Business Segment)
Table 100 BBI Detection: Product Benchmarking
Table 101 Statera Biopharma: Key Details, (CEO, HQ, Revenue, Founded, No. of Employees, Company Type, Website, Business Segment)
Table 102 Statera Biopharma: Product Benchmarking
Table 103 Dynport Vaccine Company: Key Details, (CEO, HQ, Revenue, Founded, No. of Employees, Company Type, Website, Business Segment)
Table 104 Dynport Vaccine Company: Product Benchmarking
Table 105 Research International: Key Details, (CEO, HQ, Founded, No. of Employees, Company Type, Website, Business Segment)
Table 106 Research International: Product Benchmarking
Table 107 Smith’s Detection: Key Details, (CEO, HQ, Revenue, Founded, No. of Employees, Company Type, Website, Business Segment)
Table 108 Smith’s Detection : Product Benchmarking
Table 109 Smith’s Detection: Strategic Outlook
Table 110 Synexis Systems: Key Details, (CEO, HQ, Revenue, Founded, No. of Employees, Company Type, Website, Business Segment)
Table 111 Synexis Systems: Product Benchmarking
Table 112 Synexis Systems: Strategic Outlook
図の一覧
Figure 1 Biodefence Market Segmentation
Figure 2 Biodefence Market by Product: Market Attractiveness Index
Figure 3 Biodefence Market by Vaccines: Market Attractiveness Index
Figure 4 Biodefence Market by Product: Market Attractiveness Index
Figure 5 Biodefence Market Attractiveness Index by Region
Figure 6 Biodefence Market: Market Dynamics
Figure 7 Biodefence Market by Region, 2023-2033 (US$ Mn, AGR (%), CAGR (%)): “V” Shaped Recovery
Figure 8 Biodefence Market by Region, 2023-2033 (US$ Mn, AGR (%), CAGR (%)): “U” Shaped Recovery
Figure 9 Biodefence Market by Region, 2023-2033 (US$ Mn, AGR (%), CAGR (%)): “W” Shaped Recovery
Figure 10 Biodefence Market by Region, 2023-2033 (US$ Mn, AGR (%), CAGR (%)): “L” Shaped Recovery
Figure 11 Biodefence Market: Porter’s Five Forces Analysis
Figure 12 Biodefence Market: PEST Analysis
Figure 13 Biodefence Market by Product: Market Attractiveness Index
Figure 14 Biodefence Market by Vaccines: Market Attractiveness Index
Figure 15 Biodefence Market by Product: Market Attractiveness Index
Figure 16 Biodefence Market Share Forecast by Product, 2023-2033 (%)
Figure 17 Anthrax Market Forecast by Region, 2023-2033 (US$ million)
Figure 18 Anthrax Market Share Forecast by Region, 2023 & 2033 (%)
Figure 19 Small Pox Market Forecast by Region, 2023-2033 (US$ million)
Figure 20 Small Pox Market Share Forecast by Region, 2023 & 2033 (%)
Figure 21 Botulism Market Forecast by Region, 2023-2033 (US$ million)
Figure 22 Botulism Market Share Forecast by Region, 2023 & 2033 (%)
Figure 23 Others Market Forecast by Region, 2023-2033 (US$ million)
Figure 24 Others Market Share Forecast by Region, 2023 & 2033 (%)
Figure 25 Assays and reagents Market Forecast by Region, 2023-2033 (US$ million)
Figure 26 Assays and reagents Market Share Forecast by Region, 2023 & 2033 (%)
Figure 27 Detectors Market Forecast by Region, 2023-2033 (US$ million)
Figure 28 Detectors Market Share Forecast by Region, 2023 & 2033 (%)
Figure 29 Identifiers Market Forecast by Region, 2023-2033 (US$ million)
Figure 30 Identifiers Market Share Forecast by Region, 2023 & 2033 (%)
Figure 31 Samplers Market Forecast by Region, 2023-2033 (US$ million)
Figure 32 Samplers Market Share Forecast by Region, 2023 & 2033 (%)
Figure 33 Biodefence Market by Region: Market Attractiveness Index
Figure 34 Biodefence Market by Region, 2023-2033 (US$ Mn)
Figure 35 Biodefence Market Share Forecast by Region 2023, 2033(%)
Figure 36 North America Biodefence Market Attractiveness Index
Figure 37 North America Biodefence Market by Region, 2023, 2028 & 2033 (US$ million)
Figure 38 North America Biodefence Market Forecast by Country, 2023-2033 (US$ million)
Figure 39 North America Biodefence Market Share Forecast by Country, 2023 & 2033 (%)
Figure 40 North America Biodefence Market Forecast by Product, 2023-2033 (US$ million)
Figure 41 North America Biodefence Market Share Forecast by Product, 2023 & 2033 (%)
Figure 42 U.S. Biodefence Market Forecast, 2023-2033 (US$ million, AGR %)
Figure 43 Canada Biodefence Market Forecast, 2023-2033 (US$ million, AGR %)
Figure 44 Europe Biodefence Market Attractiveness Index
Figure 45 Europe Biodefence Market by Region, 2023, 2028 & 2033 (US$ million)
Figure 46 Europe Biodefence Market Forecast by Country, 2023-2033 (US$ million)
Figure 47 Europe Biodefence Market Share Forecast by Country, 2023 & 2033 (%)
Figure 48 Europe Biodefence Market Forecast by Product, 2023-2033 (US$ million)
Figure 49 Europe Biodefence Market Share Forecast by Product, 2023 & 2033 (%)
Figure 50 Germany Biodefence Market Forecast, 2023-2033 (US$ million, AGR %)
Figure 51 France Biodefence Market Forecast, 2023-2033 (US$ million, AGR %)
Figure 52 UK Biodefence Market Forecast, 2023-2033 (US$ million, AGR %)
Figure 53 Italy Biodefence Market Forecast, 2023-2033 (US$ million, AGR %)
Figure 54 Spain Biodefence Market Forecast, 2023-2033 (US$ million, AGR %)
Figure 55 Russia Biodefence Market Forecast, 2023-2033 (US$ million, AGR %)
Figure 56 Rest of Europe Biodefence Market Forecast, 2023-2033 (US$ million, AGR %)
Figure 57 Asia Pacific Biodefence Market Attractiveness Index
Figure 58 Asia Pacific Biodefence Market by Region, 2023, 2028 & 2033 (US$ million)
Figure 59 Asia Pacific Biodefence Market Forecast, 2023-2033 (US$ million, AGR %)
Figure 60 Asia Pacific Biodefence Market Share Forecast by Country, 2023 & 2033 (%)
Figure 61 Asia Pacific Biodefence Market Forecast by Product, 2023-2033 (US$ million, AGR %)
Figure 62 Asia Pacific Biodefence Market Share Forecast by Product, 2023 & 2033 (%)
Figure 63 Japan Biodefence Market Forecast, 2023-2033 (US$ million, AGR %)
Figure 64 China Biodefence Market Forecast, 2023-2033 (US$ million, AGR %)
Figure 65 India Biodefence Market Forecast, 2023-2033 (US$ million, AGR %)
Figure 66 Australia Biodefence Market Forecast, 2023-2033 (US$ million, AGR %)
Figure 67 South Korea Biodefence Market Forecast, 2023-2033 (US$ million, AGR %)
Figure 68 Rest of Asia Pacific Biodefence Market Forecast, 2023-2033 (US$ million, AGR %)
Figure 69 Latin America Biodefence Market Attractiveness Index
Figure 70 Latin America Biodefence Market by Country, 2023, 2028 & 2033 (US$ million)
Figure 71 Latin America Biodefence Market Forecast by Country, 2023-2033 (US$ million)
Figure 72 Latin America Biodefence Market Share Forecast by Country, 2023 & 2033 (%)
Figure 73 Latin America Biodefence Market Forecast by Product, 2023-2033 (US$ million)
Figure 74 Latin America Biodefence Market Share Forecast by Product, 2023 & 2033 (%)
Figure 75 Brazil Biodefence Market Forecast, 2023-2033 (US$ million, AGR %)
Figure 76 Mexico Biodefence Market Forecast, 2023-2033 (US$ million, AGR %)
Figure 77 Rest of Latin America Biodefence Market Forecast, 2023-2033 (US$ million, AGR %)
Figure 78 MEA Biodefence Market Attractiveness Index
Figure 79 MEA Biodefence Market by Country, 2023, 2028 & 2033 (US$ million)
Figure 80 MEA Biodefence Market Forecast by Country, 2023-2033 (US$ million)
Figure 81 MEA Biodefence Market Share Forecast by Country, 2023 & 2033 (%)
Figure 82 MEA Biodefence Market Forecast by Product, 2023-2033 (US$ million)
Figure 83 MEA Biodefence Market Share Forecast by Product, 2023 & 2033 (%)
Figure 84 GCC Biodefence Market Forecast, 2023-2033 (US$ million, AGR %)
Figure 85 South Africa Biodefence Market Forecast, 2023-2033 (US$ million, AGR %)
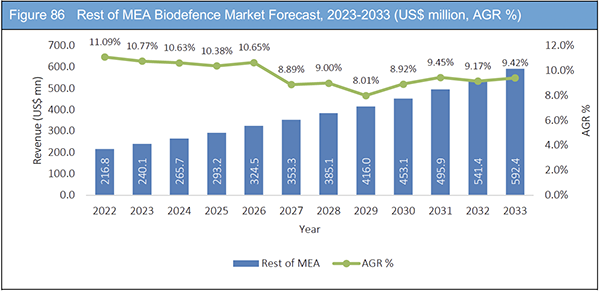
Figure 86 Rest of MEA Biodefence Market Forecast, 2023-2033 (US$ million, AGR %)
Figure 87 Altimmune: Net Revenue, 2017-2021 (US$ million, AGR%)
Figure 88 Altimmune: R&D, 2017-2021 (US$ million, AGR%)
Figure 89 Bavarian Nordic: Net Revenue, 2017-2021 (US$ million, AGR%)
Figure 90 Bavarian Nordic: R&D, 2017-2021 (US$ million, AGR%)
Figure 91 Bavarian Nordic: Regional Market Shares, 2021
Figure 92 Biofire Defense (bioMerieux SA): Net Revenue, 2017-2021 (US$ million, AGR%)
Figure 93 Biofire Defense (bioMerieux SA): R&D, 2017-2021 (US$ million, AGR%)
Figure 94 Biofire Defense (bioMerieux SA): Regional Market Shares, 2021
Figure 95 Biosearch Technologies: Net Revenue, 2017-2021 (US$ million, AGR%)
Figure 96 Biosearch Technologies.: Regional Market Shares, 2021
Figure 97 Bruker: Net Revenue, 2017-2021 (US$ million, AGR%)
Figure 98 Bruker: R&D, 2017-2021 (US$ million, AGR%)
Figure 99 Bruker: Regional Market Shares, 2021
Figure 100 Emergent BioSolutions Inc.: Net Revenue, 2017-2021 (US$ million, AGR%)
Figure 101 Emergent BioSolutions Inc.: R&D, 2017-2021 (US$ million, AGR%)
Figure 102 SIGA Technologies, Inc.: Net Revenue, 2017-2021 (US$ million, AGR%)
Figure 103 SIGA Technologies, Inc.: R&D, 2017-2021 (US$ million, AGR%)
Figure 104 Alnylam Pharmaceuticals: Net Revenue, 2017-2021 (US$ million, AGR%)
Figure 105 Alnylam Pharmaceuticals: R&D, 2017-2021 (US$ million, AGR%)
Figure 106 Statera Biopharma: Net Revenue, 2017-2021 (US$ million, AGR%)
Figure 107 Statera Biopharma : R&D, 2017-2021 (US$ million, AGR%)
ページTOPに戻る
Summary
Report Details
The Biodefence Market Report 2023-2033: This report will prove invaluable to leading firms striving for new revenue pockets if they wish to better understand the industry and its underlying dynamics. It will be useful for companies that would like to expand into different industries or to expand their existing operations in a new region.
Increasing R&D Investments in Developed Countries
Growing R&D investments enable pharmaceutical and biopharmaceutical companies to manufacture superior quality and technologically advanced bio-threat detection devices that should significantly impact the industry growth. Furthermore, European government also supports the R&D activities to manufacture vaccines against various diseases such as anthrax, small pox and botulism in large batches to fight infections and prevent the spread of endemic diseases. Bioterrorism attacks lead to deaths and may weaken the economy hence, government funds various pharmaceutical as well as biopharmaceutical companies that will elevate the industry growth in foreseeable future.
Increasing Awareness Regarding Bioterrorism Attacks to Propel Industry Growth
Increasing awareness regarding bioterrorism attacks in developed as well as underdeveloped economies will significantly fuel the biodefence market growth over the forecast period. Owing to the advent of internet and growing adoption of social media, news about the biological warfare in any part of the world can spread across the globe. It can cause anxiety to people located faraway and can greatly impact trade and travel. Governments in the developing countries such as Japan and India plan public awareness campaigns to raise public awareness about bioterrorism attacks. Such preventive measures undertaken by the government to combat various endemic diseases will boost industry growth in the foreseeable future.
Low Government Funding in Underdeveloped Regions Likely to Challenge Market Growth
Minimal government intervention and low R&D funding in underdeveloped regions will impede the biodefence market growth over the forecast period. Furthermore, due to poor economic development, governments and regulatory authorities in countries such as Mexico and Brazil are unable to make significant investments to promote the use of biothreat detection devices. There is a lack of awareness in developing regions about the availability of technologically advanced biothreat detection devices. Additionally, there is no established regulatory framework for biodefence devices and vaccines in underdeveloped economies. Key players that operate in the biodefence industry find it difficult to enter these countries due to changing trade policies. As a result, the distribution of tools and vaccinations used to combat bioterrorism is low in emerging regions which may hamper the Biodefence market growth.
What Questions Should You Ask before Buying a Market Research Report?
• How is the Biodefence Market evolving?
• What is driving and restraining the Biodefence Market?
• How will each Biodefence submarket grow over the forecast period and how much revenue will these submarkets account for in 2033?
• How will the market shares for each Biodefence submarket develop from 2023 to 2033?
• What will be the main driver for the overall market from 2023 to 2033?
• Will leading Biodefence Markets broadly follow the macroeconomic dynamics, or will individual national markets outperform others?
• How will the market shares of the national markets change by 2033 and which geographical region will lead the market in 2033?
• Who are the leading players and what are their prospects over the forecast period?
• What are the Biodefence development projects for these leading companies?
• How will the industry evolve during the period between 2023 and 2033? What are the implications of Biodefence development projects taking place now and over the next 10 years?
• Is there a greater need for product commercialisation to further scale the Biodefence Market?
• Where is the Biodefence Market heading and how can you ensure you are at the forefront of the market?
• What are the best investment options for new product and service lines?
• What are the key prospects for moving companies into a new growth path and C-suite?
You need to discover how this will impact the Biodefence Market today, and over the next 10 years:
• Our 197-page report provides 112 tables and 107 charts/graphs exclusively to you.
• The report highlights key lucrative areas in the industry so you can target them – NOW.
• It contains in-depth analysis of global, regional and national sales and growth.
• It highlights for you the key successful trends, changes and revenue projections made by your competitors.
This report tells you TODAY how the Biodefence Market will develop in the next 10 years, and in line with the variations in COVID-19 economic recession and bounce. This market is more critical now than at any point over the last 10 years.
Forecasts to 2033 and other analyses reveal commercial prospects
• In addition to revenue forecasting to 2033, our new study provides you with recent results, growth rates, and market shares.
• You will find original analyses, with business outlooks and developments.
• Discover qualitative analyses (including market dynamics, drivers, opportunities, restraints and challenges), cost structure, impact of rising prices of bio-threat detection devices and recent developments.
This report includes data analysis and invaluable insight into how COVID-19 will affect the industry and your company. Four COVID-19 recovery patterns and their impact, namely, “V”, “L”, “W” and “U” are discussed in this report.
Segments Covered in the Report
By Product
• Vaccines
– Anthrax
– Small Pox
– Botulism
– Others
• Biothreat detection devices
– Assays and reagents
– Detectors
– Identifiers
– Samplers
In addition to the revenue predictions for the overall world market and segments, you will also find revenue forecasts for five regional and 16 leading national markets:
North America
• U.S.
• Canada
Europe
• Germany
• UK
• France
• Spain
• Italy
• Rest of Europe
Asia Pacific
• China
• Japan
• India
• Australia
• South Korea
• Rest of Asia Pacific
Latin America
• Brazil
• Mexico
• Rest of Latin America
MEA
• GCC
• South Africa
• Rest of MEA
The report also includes profiles and for some of the leading companies in the Biodefence Market, 2023 to 2033, with a focus on this segment of these companies’ operations.
Leading companies and the potential for market growth
• Alexeter Technologies, LLC,
• Altimmune
• Achaogen, Inc.
• Alnylam Pharmaceuticals
• ANP Technology
• Bavarian Nordic
• BBI Detection
• Biofire Defense (bioMerieux SA)
• Biosearch Technologies
• Bruker
• Dynport Vaccine Company
• Electronic Sensor Technology Inc.
• Elusys Therapeutics
• Emergent BioSolutions Inc.
• Ichor Medical
• NanoLogix
• New Horizons Diagnostic Corporation
• PositiveID Corporation
• Research International
• SIGA Technologies, Inc.
• Statera Biopharma (Cleveland Biolabs)
• Smith’s Detection
• Synexis Systems
Overall world revenue for Biodefence Market, 2023 to 2033 in terms of value the market will surpass US$15,922 million in 2023, our work calculates. We predict strong revenue growth through to 2033. Our work identifies which organizations hold the greatest potential. Discover their capabilities, progress, and commercial prospects, helping you stay ahead.
How will the Biodefence Market, 2023 to 2033 report help you?
In summary, our 197-page report provides you with the following knowledge:
• Revenue forecasts to 2033 for Biodefence Market, 2023 to 2033 Market, with forecasts for Type of Product, each forecast at a global and regional level – discover the industry’s prospects, finding the most lucrative places for investments and revenues.
• Revenue forecasts to 2033 for five regional and 16 key national markets – See forecasts for the Biodefence Market, 2023 to 2033 market in North America, Europe, Asia-Pacific and Latin America and Middle East and Africa. Also forecasted is the market in the US, Canada, Mexico, Brazil, Germany, France, UK, Italy, China, India, Japan, and Australia among other prominent economies.
• Prospects for established firms and those seeking to enter the market – including company profiles of the major companies involved in the Biodefence Market, 2023 to 2033.
Find quantitative and qualitative analyses with independent predictions. Receive information that only our report contains, staying informed with invaluable business intelligence.
Information found nowhere else
With our new report, you are less likely to fall behind in knowledge or miss out on opportunities. See how our work could benefit your research, analyses, and decisions. Visiongain’s study is for everybody needing commercial analyses for the Biodefence Market, 2023 to 2033, market-leading companies. You will find data, trends and predictions.
ページTOPに戻る
Table of Contents
Table of Contents
1. Report Overview
1.1 Objectives of the Study
1.2 Introduction to Biodefence Market
1.3 What This Report Delivers
1.4 Why You Should Read This Report
1.5 Key Questions Answered by This Analytical Report
1.6 Who is This Report for?
1.7 Methodology
1.7.1 Market Definitions
1.7.2 Market Evaluation & Forecasting Methodology
1.7.3 Data Validation
1.7.3.1 Primary Research
1.7.3.2 Secondary Research
1.8 Frequently Asked Questions (FAQs)
1.9 Associated Visiongain Reports
1.10 About Visiongain
2 Executive Summary
3 Market Overview
3.1 Key Findings
3.2 Market Dynamics
3.2.1 Market Driving Factors
3.2.1.1 Increasing R&D investments by the government
3.2.1.2 Favourable government initiatives in emerging economies
3.2.1.3 Technological developments in biotechnology sector in the developed countries
3.2.2 Market Restraining Factors
3.2.2.1 Low R&D funding in underdeveloped regions
3.2.3 Market Opportunities
3.2.3.1 Increasing list of bio-threat agents
3.2.3.2 Development of advanced biotechnology products
3.3 COVID-19 Impact Analysis
3.4 Porter’s Five Forces Analysis
3.4.1 Bargaining Power of Suppliers
3.4.2 Bargaining Power of Buyers
3.4.3 Competitive Rivalry
3.4.4 Threat from Substitutes
3.4.5 Threat of New Entrants
3.5 PEST Analysis
4 Biodefence Market Analysis by Product
4.1 Key Findings
4.2 Product Segment: Market Attractiveness Index
4.3 Biodefence Market Size Estimation and Forecast by Product
4.4 Vaccines
4.4.1 Anthrax
4.4.1.1 Market Size by Region, 2023-2033 (US$ Mn)
4.4.1.2 Market Share by Region, 2023 & 2033 (%)
4.4.2 Small Pox
4.4.2.1 Market Size by Region, 2023-2033 (US$ Mn)
4.4.2.2 Market Share by Region, 2023 & 2033 (%)
4.4.3 Botulism
4.4.3.1 Market Size by Region, 2023-2033 (US$ Mn)
4.4.3.2 Market Share by Region, 2023 & 2033 (%)
4.4.4 Others
4.4.4.1 Market Size by Region, 2023-2033 (US$ Mn)
4.4.4.2 Market Share by Region, 2023 & 2033 (%)
4.5 Biothreat detection devices
4.5.1 Assays and reagents
4.5.1.1 Market Size by Region, 2023-2033 (US$ Mn)
4.5.1.2 Market Share by Region, 2023 & 2033 (%)
4.5.2 Detectors
4.5.2.1 Market Size by Region, 2023-2033 (US$ Mn)
4.5.2.2 Market Share by Region, 2023 & 2033 (%)
4.5.3 Identifiers
4.5.3.1 Market Size by Region, 2023-2033 (US$ Mn)
4.5.3.2 Market Share by Region, 2023 & 2033 (%)
4.5.4 Samplers
4.5.4.1 Market Size by Region, 2023-2033 (US$ Mn)
4.5.4.2 Market Share by Region, 2023 & 2033 (%)
5 Biodefence Market Analysis by Region
5.1 Key Findings
5.2 Regional Segment: Market Attractiveness Index
5.3 Biodefence Market Size Estimation and Forecast
6 North America Biodefence Market Analysis
6.1 Key Findings
6.2 North America Biodefence Market Attractiveness Index
6.3 North America Biodefence Market by Country, 2023, 2028 & 2033 (US$ Mn)
6.4 North America Biodefence Market Size Estimation and Forecast by Country
6.5 North America Biodefence Market Size Estimation and Forecast by Product
6.6 U.S. Biodefence Market Analysis
6.7 Canada Biodefence Market Analysis
7 Europe Biodefence Market Analysis
7.1 Key Findings
7.2 Europe Biodefence Market Attractiveness Index
7.3 Europe Biodefence Market by Country, 2023, 2028 & 2033 (US$ Mn)
7.4 Europe Biodefence Market Size Estimation and Forecast by Country
7.5 Europe Biodefence Market Size Estimation and Forecast by Product
7.6 Germany Biodefence Market Analysis
7.7 France Biodefence Market Analysis
7.8 UK Biodefence Market Analysis
7.9 Italy Biodefence Market Analysis
7.10 Spain Biodefence Market Analysis
7.11 Russia Biodefence Market Analysis
7.12 Rest of Europe Biodefence Market Analysis
8 Asia Pacific Biodefence Market Analysis
8.1 Key Findings
8.2 Asia Pacific Biodefence Market Attractiveness Index
8.3 Asia Pacific Biodefence Market by Country, 2023, 2028 & 2033 (US$ Mn)
8.4 Asia Pacific Biodefence Market Size Estimation and Forecast by Country
8.5 Asia Pacific Biodefence Market Size Estimation and Forecast by Product
8.6 Japan Biodefence Market Analysis
8.7 China Biodefence Market Analysis
8.8 India Biodefence Market Analysis
8.9 Australia Biodefence Market Analysis
8.10 South Korea Biodefence Market Analysis
8.11 Rest of Asia Pacific Biodefence Market Analysis
9 Latin America Biodefence Market Analysis
9.1 Key Findings
9.2 Latin America Biodefence Market Attractiveness Index
9.3 Latin America Biodefence Market by Country, 2023, 2028 & 2033 (US$ Mn)
9.4 Latin America Biodefence Market Size Estimation and Forecast by Country
9.5 Latin America Biodefence Market Size Estimation and Forecast by Product
9.6 Brazil Biodefence Market Analysis
9.7 Mexico Biodefence Market Analysis
9.8 Rest of Latin America Biodefence Market Analysis
10 MEA Biodefence Market Analysis
10.1 Key Findings
10.2 MEA Biodefence Market Attractiveness Index
10.3 MEA Biodefence Market by Country, 2023, 2028 & 2033 (US$ Mn)
10.4 MEA Biodefence Market Size Estimation and Forecast by Country
10.5 MEA Biodefence Market Size Estimation and Forecast by Product
10.6 GCC Biodefence Market Analysis
10.7 South Africa Biodefence Market Analysis
10.8 Rest of MEA Biodefence Market Analysis
11 Company Profiles
11.1 Competitive Landscape, 2021
11.1.1 BioFire Defense
11.1.2 Bruker Corporation
11.1.3 Emergent BioSolutions
11.1.4 Smiths detection
11.2 Alexeter Technologies, LLC,
11.2.1 Company Snapshot
11.2.2 Company Overview
11.2.3 Product Benchmarking
11.3 Altimmune
11.3.1 Company Snapshot
11.3.2 Company Overview
11.3.3 Financial Analysis
11.3.3.1 Net Revenue, 2017-2021
11.3.3.2 R&D, 2017-2021
11.3.4 Product Benchmarking
11.4 ANP Technology
11.4.1 Company Snapshot
11.4.2 Company Overview
11.4.3 Product Benchmarking
11.5 Bavarian Nordic
11.5.1 Company Snapshot
11.5.2 Company Overview
11.5.3 Financial Analysis
11.5.3.1 Net Revenue, 2017-2021
11.5.3.2 R&D, 2017-2021
11.5.3.3 Regional Market Shares, 2021
11.5.4 Product Benchmarking
11.5.5 Strategic Outlook
11.6 Biofire Defense (bioMerieux SA)
11.6.1 Company Snapshot
11.6.2 Company Overview
11.6.3 Financial Analysis
11.6.3.1 Net Revenue, 2017-2021
11.6.3.2 R&D, 2017-2021
11.6.3.3 Regional Market Shares, 2021
11.6.4 Product Benchmarking
11.6.5 Strategic Outlook
11.7 Biosearch Technologies
11.7.1 Company Snapshot
11.7.2 Company Overview
11.7.3 Financial Analysis
11.7.3.1 Net Revenue, 2017-2021
11.7.3.2 Regional Market Shares, 2021
11.7.4 Product Benchmarking
11.8 Bruker
11.8.1 Company Snapshot
11.8.2 Company Overview
11.8.3 Financial Analysis
11.8.3.1 Net Revenue, 2017-2021
11.8.3.2 R&D, 2017-2021
11.8.3.3 Regional Market Shares, 2021
11.8.4 Product Benchmarking
11.9 Electronic Sensor Technology Inc.
11.9.1 Company Snapshot
11.9.2 Company Overview
11.9.3 Product Benchmarking
11.10 Elusys Therapeutics
11.10.1 Company Snapshot
11.10.2 Company Overview
11.10.3 Product Benchmarking
11.10.4 Strategic Outlook
11.11 Emergent BioSolutions Inc.
11.11.1 Company Snapshot
11.11.2 Company Overview
11.11.3 Financial Analysis
11.11.3.1 Net Revenue, 2017-2021
11.11.3.2 R&D, 2017-2021
11.11.4 Product Benchmarking
11.11.5 Strategic Outlook
11.12 Ichor Medical
11.12.1 Company Snapshot
11.12.2 Company Overview
11.12.3 Product Benchmarking
11.13 NanoLogix
11.13.1 Company Snapshot
11.13.2 Company Overview
11.13.3 Product Benchmarking
11.14 New Horizons Diagnostic Corporation
11.14.1 Company Snapshot
11.14.2 Company Overview
11.14.3 Product Benchmarking
11.14.4 Strategic Outlook
11.15 PositiveID Corporation
11.15.1 Company Snapshot
11.15.2 Company Overview
11.15.3 Product Benchmarking
11.16 SIGA Technologies, Inc
11.16.1 Company Snapshot
11.16.2 Company Overview
11.16.3 Financial Analysis
11.16.3.1 Net Revenue, 2017-2021
11.16.3.2 R&D, 2017-2021
11.16.4 Product Benchmarking
11.16.5 Strategic Outlook
11.17 Alnylam Pharmaceuticals
11.17.1 Company Snapshot
11.17.2 Company Overview
11.17.3 Financial Analysis
11.17.3.1 Net Revenue, 2017-2021
11.17.3.2 R&D, 2017-2021
11.17.4 Product Benchmarking
11.17.5 Strategic Outlook
11.18 BBI Detection
11.18.1 Company Snapshot
11.18.2 Company Overview
11.18.3 Product Benchmarking
11.19 Statera Biopharma
11.19.1 Company Snapshot
11.19.2 Company Overview
11.19.3 Financial Analysis
11.19.3.1 Net Revenue, 2017-2021
11.19.3.2 R&D, 2017-2021
11.19.4 Product Benchmarking
11.20 Dynport Vaccine Company
11.20.1 Company Snapshot
11.20.2 Company Overview
11.20.3 Product Benchmarking
11.21 Research International
11.21.1 Company Snapshot
11.21.2 Company Overview
11.21.3 Product Benchmarking
11.22 Smith’s Detection
11.22.1 Company Snapshot
11.22.2 Company Overview
11.22.3 Product Benchmarking
11.22.4 Strategic Outlook
11.23 Synexis Systems
11.23.1 Company Snapshot
11.23.2 Company Overview
11.23.3 Product Benchmarking
11.23.4 Strategic Outlook
12 Conclusion and Recommendations
12.1 Concluding Remarks from Visiongain
12.2 Recommendations for Market Players
List of Tables
Table 1 Biodefence Market Snapshot, 2023 & 2033 (US$ million, CAGR %)
Table 2 Biodefence Market by Region, 2023-2033 (US$ Mn, AGR (%), CAGR (%)): “V” Shaped Recovery Scenario
Table 3 Biodefence Market by Region, 2023-2033 (US$ Mn, AGR (%), CAGR (%)): “U” Shaped Recovery Scenario
Table 4 Biodefence Market by Region, 2023-2033 (US$ Mn, AGR (%), CAGR (%)): “W” Shaped Recovery Scenario
Table 5 Biodefence Market by Region, 2023-2033 (US$ Mn, AGR (%), CAGR (%)): “L” Shaped Recovery Scenario
Table 6 Biodefence Devices Market by Product, 2023-2033 (US$ Mn, AGR (%), CAGR (%))
Table 7 Biodefence Devices Market by Vaccines, 2023-2033 (US$ Mn, AGR (%), CAGR (%))
Table 8 Biodefence Devices Market by Biothreat Detection Devices, 2023-2033 (US$ Mn, AGR (%), CAGR (%))
Table 9 Biodefence Market Forecast by Product, 2023-2033 (US$ million)
Table 10 Anthrax Market Forecast by Region, 2023-2033 (US$ Mn, AGR%, CAGR%)
Table 11 Small Pox Market Forecast by Region, 2023-2033 (US$ Mn, AGR%, CAGR%)
Table 12 Botulism Market Forecast by Region, 2023-2033 (US$ Mn, AGR%, CAGR%)
Table 13 Others Market Forecast by Region, 2023-2033 (US$ Mn, AGR%, CAGR%)
Table 14 Assays and reagents Market Forecast by Region, 2023-2033 (US$ Mn, AGR%, CAGR%)
Table 15 Detectors Market Forecast by Region, 2023-2033 (US$ Mn, AGR%, CAGR%)
Table 16 Identifiers Market Forecast by Region, 2023-2033 (US$ Mn, AGR%, CAGR%)
Table 17 Samplers Market Forecast by Region, 2023-2033 (US$ Mn, AGR%, CAGR%)
Table 18 Biodefence Market Forecast by Region, 2023-2033 (US$ Mn, AGR %, CAGR %)
Table 19 North America Biodefence Market Forecast by Country
Table 20 North America Biodefence Devices Market by Product, 2023-2033 (US$ Mn, AGR (%), CAGR (%))
Table 21 North America Biodefence Devices Market by Vaccines, 2023-2033 (US$ Mn, AGR (%), CAGR (%))
Table 22 North America Biodefence Devices Market by Biothreat detection devices, 2023-2033 (US$ Mn, AGR (%), CAGR (%))
Table 23 U.S. Biodefence Market Forecast, 2023-2033 (US$ Mn, AGR %, CAGR %)
Table 24 Canada Biodefence Market Forecast, 2023-2033 (US$ Mn, AGR %, CAGR %)
Table 25 Europe Biodefence Market Forecast by Country, 2023-2033 (US$ Mn, AGR%, CAGR%)
Table 26 Europe Biodefence Devices Market by Product, 2023-2033 (US$ Mn, AGR (%), CAGR (%))
Table 27 Europe Biodefence Devices Market by Vaccines, 2023-2033 (US$ Mn, AGR (%), CAGR (%))
Table 28 Europe Biodefence Devices Market by Biothreat Detection Devices, 2023-2033 (US$ Mn, AGR (%), CAGR (%))
Table 29 Germany Biodefence Market Forecast, 2023-2033 (US$ Mn, AGR %, CAGR %)
Table 30 France Biodefence Market Forecast, 2023-2033 (US$ Mn, AGR %, CAGR %)
Table 31 UK Biodefence Market Forecast, 2023-2033 (US$ Mn, AGR %, CAGR %)
Table 32 Italy Biodefence Market Forecast, 2023-2033 (US$ Mn, AGR %, CAGR %)
Table 33 Spain Biodefence Market Forecast, 2023-2033 (US$ Mn, AGR %, CAGR %)
Table 34 Russia Biodefence Market Forecast, 2023-2033 (US$ Mn, AGR %, CAGR %)
Table 35 Rest of Europe Biodefence Market Forecast, 2023-2033 (US$ Mn, AGR %, CAGR %)
Table 36 Asia Pacific Biodefence Market Forecast by Country 2023-2033 (US$ Mn, AGR%, CAGR%)
Table 37 Asia Pacific Biodefence Devices Market by Product, 2023-2033 (US$ Mn, AGR (%), CAGR (%))
Table 38 Asia Pacific Biodefence Devices Market by Product, 2023-2033 (US$ Mn, AGR (%), CAGR (%))
Table 39 Asia Pacific Biodefence Devices Market by Biothreat Detection Devices, 2023-2033 (US$ Mn, AGR (%), CAGR(%))
Table 40 Japan Biodefence Market Forecast, 2023-2033 (US$ Mn, AGR %, CAGR %)
Table 41 China Biodefence Market Forecast, 2023-2033 (US$ Mn, AGR %, CAGR %)
Table 42 India Biodefence Market Forecast, 2023-2033 (US$ Mn, AGR %, CAGR %)
Table 43 Australia Biodefence Market Forecast, 2023-2033 (US$ Mn, AGR %, CAGR %)
Table 44 South Korea Biodefence Market Forecast, 2023-2033 (US$ Mn, AGR %, CAGR %)
Table 45 Rest of Asia Pacific Biodefence Market Forecast, 2023-2033 (US$ Mn, AGR %, CAGR %)
Table 46 Latin America Biodefence forecast by Country 2023-2033 (US$ Mn, AGR%, CAGR%)
Table 47 Latin America Biodefence Devices Market by Product, 2023-2033 (US$ Mn, AGR (%), CAGR (%))
Table 48 Latin America Biodefence Devices Market by Product, 2023-2033 (US$ Mn, AGR (%), CAGR (%))
Table 49 Latin America Biodefence Devices Market by Biothreat Detection Devices, 2023-2033 (US$ Mn, AGR (%), CAGR (%))
Table 50 Brazil Biodefence Market Forecast, 2023-2033 (US$ Mn, AGR %, CAGR %)
Table 51 Mexico Biodefence Market Forecast, 2023-2033 (US$ Mn, AGR %, CAGR %)
Table 52 Rest of Latin America Biodefence Market Forecast, 2023-2033 (US$ Mn, AGR %, CAGR %)
Table 53 MEA Biodefence forecast by Country 2023-2033 (US$ Mn, AGR%, CAGR%)
Table 54 MEA Biodefence Devices Market by Product, 2023-2033 (US$ Mn, AGR (%), CAGR (%))
Table 55 MEA Biodefence Devices Market by Product, 2023-2033 (US$ Mn, AGR (%), CAGR (%))
Table 56 MEA Biodefence Devices Market by Biothreat Detection Devices, 2023-2033 (US$ Mn, AGR (%), CAGR (%))
Table 57 GCC Biodefence Market Forecast, 2023-2033 (US$ Mn, AGR %, CAGR %)
Table 58 South Africa Biodefence Market Forecast, 2023-2033 (US$ Mn, AGR %, CAGR %)
Table 59 Rest of MEA Biodefence Market Forecast, 2023-2033 (US$ Mn, AGR %, CAGR %)
Table 60 Alexeter Technologies, LLC: Key Details, (CEO, HQ, Revenue, Founded, No. of Employees, Company Type, Website, Business Segment)
Table 61 Alexeter Technologies, LLC: Product Benchmarking
Table 62 Altimmune: Key Details, (CEO, HQ, Revenue, Founded, No. of Employees, Company Type, Website, Business Segment)
Table 63 Altimmune: Product Benchmarking
Table 64 ANP Technology: Key Details, (CEO, HQ, Revenue, Founded, No. of Employees, Company Type, Website, Business Segment)
Table 65 ANP Technology: Product Benchmarking
Table 66 Bavarian Nordic: Key Details, (CEO, HQ, Revenue, Founded, No. of Employees, Company Type, Website, Business Segment)
Table 67 Bavarian Nordic: Product Benchmarking
Table 68 Bavarian Nordic: Strategic Outlook
Table 69 Biofire Defense (bioMerieux SA): Key Details, (CEO, HQ, Revenue, Founded, No. of Employees, Company Type, Website, Business Segment)
Table 70 Biofire Defense (bioMerieux SA): Product Benchmarking
Table 71 Biofire Defense (bioMerieux SA.: Strategic Outlook
Table 72 Biosearch Technologies : Key Details, (CEO, HQ, Revenue, Founded, No. of Employees, Company Type, Website, Business Segment)
Table 73 Biosearch Technologies: Product Benchmarking
Table 74 Bruker: Key Details, (CEO, HQ, Revenue, Founded, No. of Employees, Company Type, Website, Business Segment)
Table 75 Bruker: Product Benchmarking
Table 76 Electronic Sensor Technology Inc.: Key Details, (CEO, HQ, Revenue, Founded, No. of Employees, Company Type, Website, Business Segment)
Table 77 Electronic Sensor Technology Inc .: Product Benchmarking
Table 78 Elusys Therapeutics: Key Details, (CEO, HQ, Revenue, Founded, No. of Employees, Company Type, Website, Business Segment)
Table 79 Elusys Therapeutics .: Product Benchmarking
Table 80 Elusys Therapeutics : Strategic Outlook
Table 81 Emergent BioSolutions Inc.: (CEO, HQ, Revenue, Founded, No. of Employees, Company Type, Website, Business Segment)
Table 82 Emergent BioSolutions Inc.: Product Benchmarking
Table 83 Emergent BioSolutions Inc.: Strategic Outlook
Table 84 Ichor Medical: Key Details, (CEO, HQ, Revenue, Founded, No. of Employees, Company Type, Website, Business Segment)
Table 85 Ichor Medical: Product Benchmarking
Table 86 NanoLogix: Key Details, (CEO, HQ, Revenue, Founded, No. of Employees, Company Type, Website, Business Segment)
Table 87 NanoLogix: Product Benchmarking
Table 88 New Horizons Diagnostic Corporation: Key Details, (CEO, HQ, Revenue, Founded, No. of Employees, Company Type, Website, Business Segment)
Table 89 New Horizons Diagnostic Corporation: Product Benchmarking
Table 90 New Horizons Diagnostic Corporation: Strategic Outlook
Table 91 PositiveID Corporation: Key Details, (CEO, HQ, Revenue, Founded, No. of Employees, Company Type, Website, Business Segment)
Table 92 PositiveID Corporation .: Product Benchmarking
Table 93 SIGA Technologies, Inc: Key Details, (CEO, HQ, Revenue, Founded, No. of Employees, Company Type, Website, Business Segment)
Table 94 SIGA Technologies, Inc.: Product Benchmarking
Table 95 SIGA Technologies, Inc: Strategic Outlook
Table 96 Alnylam Pharmaceuticals: Key Details, (CEO, HQ, Revenue, Founded, No. of Employees, Company Type, Website, Business Segment)
Table 97 Alnylam Pharmaceuticals: Product Benchmarking
Table 98 Alnylam Pharmaceuticals: Strategic Outlook
Table 99 BBI Detection: Key Details, (CEO, HQ, Founded, No. of Employees, Business Segment)
Table 100 BBI Detection: Product Benchmarking
Table 101 Statera Biopharma: Key Details, (CEO, HQ, Revenue, Founded, No. of Employees, Company Type, Website, Business Segment)
Table 102 Statera Biopharma: Product Benchmarking
Table 103 Dynport Vaccine Company: Key Details, (CEO, HQ, Revenue, Founded, No. of Employees, Company Type, Website, Business Segment)
Table 104 Dynport Vaccine Company: Product Benchmarking
Table 105 Research International: Key Details, (CEO, HQ, Founded, No. of Employees, Company Type, Website, Business Segment)
Table 106 Research International: Product Benchmarking
Table 107 Smith’s Detection: Key Details, (CEO, HQ, Revenue, Founded, No. of Employees, Company Type, Website, Business Segment)
Table 108 Smith’s Detection : Product Benchmarking
Table 109 Smith’s Detection: Strategic Outlook
Table 110 Synexis Systems: Key Details, (CEO, HQ, Revenue, Founded, No. of Employees, Company Type, Website, Business Segment)
Table 111 Synexis Systems: Product Benchmarking
Table 112 Synexis Systems: Strategic Outlook
List of Figures
Figure 1 Biodefence Market Segmentation
Figure 2 Biodefence Market by Product: Market Attractiveness Index
Figure 3 Biodefence Market by Vaccines: Market Attractiveness Index
Figure 4 Biodefence Market by Product: Market Attractiveness Index
Figure 5 Biodefence Market Attractiveness Index by Region
Figure 6 Biodefence Market: Market Dynamics
Figure 7 Biodefence Market by Region, 2023-2033 (US$ Mn, AGR (%), CAGR (%)): “V” Shaped Recovery
Figure 8 Biodefence Market by Region, 2023-2033 (US$ Mn, AGR (%), CAGR (%)): “U” Shaped Recovery
Figure 9 Biodefence Market by Region, 2023-2033 (US$ Mn, AGR (%), CAGR (%)): “W” Shaped Recovery
Figure 10 Biodefence Market by Region, 2023-2033 (US$ Mn, AGR (%), CAGR (%)): “L” Shaped Recovery
Figure 11 Biodefence Market: Porter’s Five Forces Analysis
Figure 12 Biodefence Market: PEST Analysis
Figure 13 Biodefence Market by Product: Market Attractiveness Index
Figure 14 Biodefence Market by Vaccines: Market Attractiveness Index
Figure 15 Biodefence Market by Product: Market Attractiveness Index
Figure 16 Biodefence Market Share Forecast by Product, 2023-2033 (%)
Figure 17 Anthrax Market Forecast by Region, 2023-2033 (US$ million)
Figure 18 Anthrax Market Share Forecast by Region, 2023 & 2033 (%)
Figure 19 Small Pox Market Forecast by Region, 2023-2033 (US$ million)
Figure 20 Small Pox Market Share Forecast by Region, 2023 & 2033 (%)
Figure 21 Botulism Market Forecast by Region, 2023-2033 (US$ million)
Figure 22 Botulism Market Share Forecast by Region, 2023 & 2033 (%)
Figure 23 Others Market Forecast by Region, 2023-2033 (US$ million)
Figure 24 Others Market Share Forecast by Region, 2023 & 2033 (%)
Figure 25 Assays and reagents Market Forecast by Region, 2023-2033 (US$ million)
Figure 26 Assays and reagents Market Share Forecast by Region, 2023 & 2033 (%)
Figure 27 Detectors Market Forecast by Region, 2023-2033 (US$ million)
Figure 28 Detectors Market Share Forecast by Region, 2023 & 2033 (%)
Figure 29 Identifiers Market Forecast by Region, 2023-2033 (US$ million)
Figure 30 Identifiers Market Share Forecast by Region, 2023 & 2033 (%)
Figure 31 Samplers Market Forecast by Region, 2023-2033 (US$ million)
Figure 32 Samplers Market Share Forecast by Region, 2023 & 2033 (%)
Figure 33 Biodefence Market by Region: Market Attractiveness Index
Figure 34 Biodefence Market by Region, 2023-2033 (US$ Mn)
Figure 35 Biodefence Market Share Forecast by Region 2023, 2033(%)
Figure 36 North America Biodefence Market Attractiveness Index
Figure 37 North America Biodefence Market by Region, 2023, 2028 & 2033 (US$ million)
Figure 38 North America Biodefence Market Forecast by Country, 2023-2033 (US$ million)
Figure 39 North America Biodefence Market Share Forecast by Country, 2023 & 2033 (%)
Figure 40 North America Biodefence Market Forecast by Product, 2023-2033 (US$ million)
Figure 41 North America Biodefence Market Share Forecast by Product, 2023 & 2033 (%)
Figure 42 U.S. Biodefence Market Forecast, 2023-2033 (US$ million, AGR %)
Figure 43 Canada Biodefence Market Forecast, 2023-2033 (US$ million, AGR %)
Figure 44 Europe Biodefence Market Attractiveness Index
Figure 45 Europe Biodefence Market by Region, 2023, 2028 & 2033 (US$ million)
Figure 46 Europe Biodefence Market Forecast by Country, 2023-2033 (US$ million)
Figure 47 Europe Biodefence Market Share Forecast by Country, 2023 & 2033 (%)
Figure 48 Europe Biodefence Market Forecast by Product, 2023-2033 (US$ million)
Figure 49 Europe Biodefence Market Share Forecast by Product, 2023 & 2033 (%)
Figure 50 Germany Biodefence Market Forecast, 2023-2033 (US$ million, AGR %)
Figure 51 France Biodefence Market Forecast, 2023-2033 (US$ million, AGR %)
Figure 52 UK Biodefence Market Forecast, 2023-2033 (US$ million, AGR %)
Figure 53 Italy Biodefence Market Forecast, 2023-2033 (US$ million, AGR %)
Figure 54 Spain Biodefence Market Forecast, 2023-2033 (US$ million, AGR %)
Figure 55 Russia Biodefence Market Forecast, 2023-2033 (US$ million, AGR %)
Figure 56 Rest of Europe Biodefence Market Forecast, 2023-2033 (US$ million, AGR %)
Figure 57 Asia Pacific Biodefence Market Attractiveness Index
Figure 58 Asia Pacific Biodefence Market by Region, 2023, 2028 & 2033 (US$ million)
Figure 59 Asia Pacific Biodefence Market Forecast, 2023-2033 (US$ million, AGR %)
Figure 60 Asia Pacific Biodefence Market Share Forecast by Country, 2023 & 2033 (%)
Figure 61 Asia Pacific Biodefence Market Forecast by Product, 2023-2033 (US$ million, AGR %)
Figure 62 Asia Pacific Biodefence Market Share Forecast by Product, 2023 & 2033 (%)
Figure 63 Japan Biodefence Market Forecast, 2023-2033 (US$ million, AGR %)
Figure 64 China Biodefence Market Forecast, 2023-2033 (US$ million, AGR %)
Figure 65 India Biodefence Market Forecast, 2023-2033 (US$ million, AGR %)
Figure 66 Australia Biodefence Market Forecast, 2023-2033 (US$ million, AGR %)
Figure 67 South Korea Biodefence Market Forecast, 2023-2033 (US$ million, AGR %)
Figure 68 Rest of Asia Pacific Biodefence Market Forecast, 2023-2033 (US$ million, AGR %)
Figure 69 Latin America Biodefence Market Attractiveness Index
Figure 70 Latin America Biodefence Market by Country, 2023, 2028 & 2033 (US$ million)
Figure 71 Latin America Biodefence Market Forecast by Country, 2023-2033 (US$ million)
Figure 72 Latin America Biodefence Market Share Forecast by Country, 2023 & 2033 (%)
Figure 73 Latin America Biodefence Market Forecast by Product, 2023-2033 (US$ million)
Figure 74 Latin America Biodefence Market Share Forecast by Product, 2023 & 2033 (%)
Figure 75 Brazil Biodefence Market Forecast, 2023-2033 (US$ million, AGR %)
Figure 76 Mexico Biodefence Market Forecast, 2023-2033 (US$ million, AGR %)
Figure 77 Rest of Latin America Biodefence Market Forecast, 2023-2033 (US$ million, AGR %)
Figure 78 MEA Biodefence Market Attractiveness Index
Figure 79 MEA Biodefence Market by Country, 2023, 2028 & 2033 (US$ million)
Figure 80 MEA Biodefence Market Forecast by Country, 2023-2033 (US$ million)
Figure 81 MEA Biodefence Market Share Forecast by Country, 2023 & 2033 (%)
Figure 82 MEA Biodefence Market Forecast by Product, 2023-2033 (US$ million)
Figure 83 MEA Biodefence Market Share Forecast by Product, 2023 & 2033 (%)
Figure 84 GCC Biodefence Market Forecast, 2023-2033 (US$ million, AGR %)
Figure 85 South Africa Biodefence Market Forecast, 2023-2033 (US$ million, AGR %)
Figure 86 Rest of MEA Biodefence Market Forecast, 2023-2033 (US$ million, AGR %)
Figure 87 Altimmune: Net Revenue, 2017-2021 (US$ million, AGR%)
Figure 88 Altimmune: R&D, 2017-2021 (US$ million, AGR%)
Figure 89 Bavarian Nordic: Net Revenue, 2017-2021 (US$ million, AGR%)
Figure 90 Bavarian Nordic: R&D, 2017-2021 (US$ million, AGR%)
Figure 91 Bavarian Nordic: Regional Market Shares, 2021
Figure 92 Biofire Defense (bioMerieux SA): Net Revenue, 2017-2021 (US$ million, AGR%)
Figure 93 Biofire Defense (bioMerieux SA): R&D, 2017-2021 (US$ million, AGR%)
Figure 94 Biofire Defense (bioMerieux SA): Regional Market Shares, 2021
Figure 95 Biosearch Technologies: Net Revenue, 2017-2021 (US$ million, AGR%)
Figure 96 Biosearch Technologies.: Regional Market Shares, 2021
Figure 97 Bruker: Net Revenue, 2017-2021 (US$ million, AGR%)
Figure 98 Bruker: R&D, 2017-2021 (US$ million, AGR%)
Figure 99 Bruker: Regional Market Shares, 2021
Figure 100 Emergent BioSolutions Inc.: Net Revenue, 2017-2021 (US$ million, AGR%)
Figure 101 Emergent BioSolutions Inc.: R&D, 2017-2021 (US$ million, AGR%)
Figure 102 SIGA Technologies, Inc.: Net Revenue, 2017-2021 (US$ million, AGR%)
Figure 103 SIGA Technologies, Inc.: R&D, 2017-2021 (US$ million, AGR%)
Figure 104 Alnylam Pharmaceuticals: Net Revenue, 2017-2021 (US$ million, AGR%)
Figure 105 Alnylam Pharmaceuticals: R&D, 2017-2021 (US$ million, AGR%)
Figure 106 Statera Biopharma: Net Revenue, 2017-2021 (US$ million, AGR%)
Figure 107 Statera Biopharma : R&D, 2017-2021 (US$ million, AGR%)
ページTOPに戻る
- 細胞分析市場の規模、シェアおよび動向分析レポート:製品・サービス別(試薬・消耗品、機器)、手法別(フローサイトメトリー、細胞マイクロアレイ)、プロセス別、用途別、地域別、およびセグメント別予測(2026年~2033年)
- 密閉型バイオプロセス市場規模、シェアおよび動向分析レポート:製品別(バイオリアクター、発酵槽、撹拌システム)、用途別(ワクチン製造、細胞・遺伝子治療)、最終用途別(製薬・バイオテクノロジー企業)、地域別、およびセグメント別予測(2026年~2033年)
- 免疫ゲノミクス市場規模、シェアおよび動向分析レポート:タイプ別(機器、消耗品、ソフトウェア)、技術別(ポリメラーゼ連鎖反応、マイクロアレイ)、用途別(臨床用途、研究用途)、エンドユーザー別、地域別、およびセグメント別予測(2026年~2033年)
- 凍結乾燥装置およびサービス市場規模、シェア、動向分析レポート:提供形態別(装置、サービス)、事業規模別(実験室規模、パイロット規模)、用途別(診断・研究、食品産業)、地域別、およびセグメント別予測(2026年~2033年)
- 合成遺伝子回路市場規模、シェアおよび動向分析レポート:製品別(トグルスイッチ回路、発振器)、用途別(研究、治療)、最終用途別(学術・研究機関、バイオテクノロジー・製薬企業)、地域別、およびセグメント別予測(2026年~2033年)
- ウイルスベクターおよびプラスミドDNA製造市場の規模、シェア、動向分析レポート:ベクタータイプ別(レンチウイルス、アデノウイルス、レトロウイルス)、ワークフロー別、用途別(遺伝子治療、細胞治療、ワクチン学)、最終用途別、疾患別(がん、遺伝性疾患)、地域別、およびセグメント別予測(2026年~2033年)
- 血小板濃縮血漿(PRP)市場規模、シェアおよび動向分析レポート:タイプ別(純粋PRP、白血球濃縮PRP)、用途別(整形外科、スポーツ医学、美容外科、皮膚科、眼科手術)、エンドユーザー別、地域別、およびセグメント別予測(2026年~2033年)
- 細胞培養培地および細胞株市場の規模、シェア、動向分析レポート:製品別(従来型細胞株、従来型培地)、用途別(バイオ医薬品製造、診断、研究・学術機関)、最終用途別、地域別、およびセグメント別予測(2026年~2033年)
- 製品別(消耗品(キット・試薬)、機器、ソフトウェア)、技術別(PCR、キャピラリー電気泳動、NGS、マイクロアレイ、迅速DNA分析)、用途別(法医学、親子鑑定)、エンドユーザー別の人類識別市場 ― 2031年までの世界予測
- Next-Generation Sequencing Market by Product Type (Consumables, Platforms, Bioinformatics), Technology (SBS, Nanopore), Workflow (Sequencing, Data Analysis), Services, Application (Drug Discovery, Diagnostic, Agriculture) - Global Forecast to 2030
本レポートと同じKEY WORD()の最新刊レポート
- 本レポートと同じKEY WORDの最新刊レポートはありません。
よくあるご質問
Visiongain社はどのような調査会社ですか?
英国の調査会社ヴィジョンゲイン社(Visiongain)は、通信とエネルギーのほか、自動車や化学・医薬品、金属など、広範な市場を対象に調査を行っています。自動車市場については、市場全般に関する調査のほ... もっと見る
調査レポートの納品までの日数はどの程度ですか?
在庫のあるものは速納となりますが、平均的には 3-4日と見て下さい。
但し、一部の調査レポートでは、発注を受けた段階で内容更新をして納品をする場合もあります。
発注をする前のお問合せをお願いします。
注文の手続きはどのようになっていますか?
1)お客様からの御問い合わせをいただきます。
2)見積書やサンプルの提示をいたします。
3)お客様指定、もしくは弊社の発注書をメール添付にて発送してください。
4)データリソース社からレポート発行元の調査会社へ納品手配します。
5) 調査会社からお客様へ納品されます。最近は、pdfにてのメール納品が大半です。
お支払方法の方法はどのようになっていますか?
納品と同時にデータリソース社よりお客様へ請求書(必要に応じて納品書も)を発送いたします。
お客様よりデータリソース社へ(通常は円払い)の御振り込みをお願いします。
請求書は、納品日の日付で発行しますので、翌月最終営業日までの当社指定口座への振込みをお願いします。振込み手数料は御社負担にてお願いします。
お客様の御支払い条件が60日以上の場合は御相談ください。
尚、初めてのお取引先や個人の場合、前払いをお願いすることもあります。ご了承のほど、お願いします。
データリソース社はどのような会社ですか?
当社は、世界各国の主要調査会社・レポート出版社と提携し、世界各国の市場調査レポートや技術動向レポートなどを日本国内の企業・公官庁及び教育研究機関に提供しております。
世界各国の「市場・技術・法規制などの」実情を調査・収集される時には、データリソース社にご相談ください。
お客様の御要望にあったデータや情報を抽出する為のレポート紹介や調査のアドバイスも致します。
|
|


