ウェアラブル脳内装置市場レポート:2023-2033
Wearable Brain Devices Market Report 2023-2033
レポート詳細
ウェアラブル脳内装置市場レポート 2023-2033 :本レポートは、新たな収益ポケットを目指す大手企業が、業界とその根底にあるダイナミクスをより良く理解するために、非常に貴重なもの... もっと見る
※上記価格は部署ライセンス(Departmental licence)価格です。
その他の価格についてはデータリソースまでお問合せください。
日本語のページは自動翻訳を利用し作成しています。
実際のレポートは英文のみでご納品いたします。

|

|
サマリー
レポート詳細
ウェアラブル脳内装置市場レポート 2023-2033:本レポートは、新たな収益ポケットを目指す大手企業が、業界とその根底にあるダイナミクスをより良く理解するために、非常に貴重なものとなるでしょう。異業種への進出や既存事業の新地域での展開を希望する企業にとっても有益なレポートです。
神経疾患を発症する人の増加に伴い、市場拡大が見込まれる
てんかん、パーキンソン病、アルツハイマー病などの神経疾患を発症する人が増えるにつれ、市場の拡大が予想されます。また、日本、インド、中国を中心としたアジア太平洋地域の高齢者人口の急増や、技術の進歩も市場拡大を支える重要な要因となっています。脳を研究し、多くの脳疾患や疾病の治療を支援する能力は、現代のポータブル技術の飛躍的進歩によって可能となりました。
脳機能障害や神経疾患の治療費は、医療資源に対する需要と同様に、時間とともに着実に増加することが予測されています。最近の脳画像技術の進歩により、脳とその機能を詳細に見ることができるようになりました。例えば、近赤外機能分光法は、ヘモグロビンの光吸収パターンの変化を利用して、脳内のヘモグロビン濃度を推定する非侵襲的なイメージング手法です。神経疾患の頻発、テクノロジーの発展、ストレスの増加、ライフスタイルの変化などにより、このような機器の市場が拡大していることは事実です。
マーケットリサーチレポートを購入する前に、どのような質問をすべきでしょうか?
- ウェアラブル脳内装置市場はどのように進化しているのか?
- ウェアラブル脳内装置市場の推進要因と抑制要因は何か?
- ウェアラブル脳内装置サブマーケットの各セグメントは予測期間中にどのように成長し、2033年にこれらのサブマーケットが占める売上はどの程度になるのか?
- 2023年から2033年にかけて、ウェアラブル脳内装置の各サブマーケットの市場シェアはどのように推移するのでしょうか?
- 2023年から2033年にかけて、市場全体の主なドライバーは何になるのか?
- ウェアラブル脳内装置の主要市場はマクロ経済のダイナミクスに概ね追随するのか、それとも個々の国内市場が他を凌駕するのか?
- 2033年までに各国市場のシェアはどのように変化し、どの地域が2033年の市場をリードするのでしょうか?
- 主要プレイヤーは誰か、また予測期間中の見込みは?
- これらの主要企業のウェアラブル脳内装置プロジェクトはどのようなものですか?
- 2023年から2033年の間に、業界はどのように進化していくのでしょうか?現在および今後10年間に行われるウェアラブル脳内装置のプロジェクトにはどのような意味があるのでしょうか?
- ウェアラブル脳内装置市場をさらに拡大するために、製品の商業化の必要性は高いか?
- ウェアラブル脳内装置市場の方向性と、市場の最前線に立つためにはどうすればよいか?
- 新製品やサービスラインに対する最適な投資オプションは何か?
- 企業を新たな成長軌道に乗せ、C-suiteに移行させるための重要な展望とは?
このことが、現在、そして今後10年間のウェアラブル脳内装置市場にどのような影響を与えるかを知る必要があります。
- 本レポートは308ページにわたり、144の表と183のグラフを掲載しています。
- このレポートでは、業界における主要な収益性の高い分野をハイライトしているため、今すぐターゲットを絞ることができます。
- 世界、地域、国別の売上高と成長率を詳細に分析しています。
- 競合他社が成功した主なトレンド、変化、収益予測をハイライトしています。
本レポートは、ウェアラブル脳内装置市場が今後10年間にどのように発展し、COVID-19の景気後退と回復の変動に沿うものであるかを今日あなたに教えます。この市場は、過去10年間のどの時点よりも今が重要です。
2033年までの予測やその他の分析により、商業的な展望が見えてきた
- 2033年までの収益予測に加え、直近の実績、成長率、市場シェアもご覧いただけます。
- ビジネスの展望や展開など、独自の分析もご覧いただけます。
- 定性的分析(市場力学、促進要因、機会、阻害要因、課題など)、コスト構造、ウェアラブル脳内装置価格上昇の影響、最近の動向などをご覧いただけます。
本レポートでは、COVID-19が業界と貴社にどのような影響を与えるかについて、データ分析と貴重な洞察を掲載しています。本レポートでは、COVID-19の4つの回収パターンとその影響、すなわち「V」、「L」、「W」、「U」について論じています。
報告書の対象セグメント
製品タイプ別市場セグメント
- 従来型デバイス
- インプラントデバイス
技術別市場セグメント
- 迷走神経刺激(VNS)
- 応答性神経刺激
- 脳深部刺激
チャネルタイプ別市場セグメント
- 32チャンネルタイプ
- 12チャンネルタイプ
- 14チャンネルタイプ
- マルチチャンネル
エンドユーザー別市場セグメント
- 病院・クリニック
- 神経センター
- 在宅医療
- 集中治療室
- その他のエンドユーザー
医療環境別の市場セグメント
- てんかん
- 睡眠障害
- パーキンソン病
- 外傷性脳損傷(TBI)
- アルツハイマー病
- その他の医療環境
世界市場全体とセグメントの収益予測に加え、4地域と主要20カ国市場の収益予測も掲載しています。
北米
- アメリカ
- カナダ
欧州
- ドイツ
- スペイン
- イギリス
- フランス
- イタリア
- その他の地域
アジア太平洋地域
- 中国
- 日本
- インド
- オーストラリア
- 韓国
- その他のアジア太平洋地域
中東・アフリカ
- GCC
- 南アフリカ
- その他の中東・アフリカ地域
ラテンアメリカ
- ブラジル
- メキシコ
-その他のラテンアメリカ地域
ウェアラブル脳内装置市場の2023年から2033年にかけての主要企業のプロファイルと、これらの企業のこのセグメントに焦点をあてた情報も掲載しています。
主要企業と市場成長の可能性
・ Advanced Brain Monitoring
・ Cadwell Industries
・ Compumedics, Ltd.
・ Edwards Lifesciences Corporation
・ GE Healthcare
・ Koninklijke Philips N.V.( Philips Healthcare)
・ Masimo Corporation
・ Medtronic plc
・ Nihon Kohden Corporation
・ Siemens Healthineers
ウェアラブル脳内装置市場の世界全体の収益、2023年から2033年までの金額ベースで、2023年に3億360万米ドルを突破すると、我々の仕事は計算されます。また、2033年までの間に収益が大きく伸びると予測しています。本調査では、最も大きな可能性を秘めた企業を特定しています。彼らの能力、進歩、商業的展望を発見することで、一歩先を行くことができます。
ウェアラブル脳内装置市場、2023年から2033年までのレポートはどのように役立つのでしょうか?
300ページを超えるレポートでは、要約すると以下のような知識を得ることができます。
- ウェアラブル脳内装置市場の2023年から2033年までの収益予測、製品タイプ、技術、チャネルタイプ、エンドユーザー、医療環境、企業規模の各予測を世界および地域レベルで掲載 - 業界の展望を見出し、投資と収益に最も有利な場所を見つけることができます。
- 4つの地域と20の主要国市場の2033年までの収益予測 - ウェアラブル脳内装置市場、2023年から2033年までの北米、ヨーロッパ、アジア太平洋とラテンアメリカ、中東とアフリカの市場の予測をご覧ください。また、米国、カナダ、メキシコ、ブラジル、ドイツ、フランス、イギリス、イタリア、中国、インド、日本、オーストラリアなどの主要経済圏の市場も予測されています。
- 既存企業や市場参入を目指す企業の展望 - ウェアラブル脳内装置市場に関わる主要企業10社の企業プロファイルを含む、2023年から2033年までの展望を掲載しています。
定量的・定性的な分析と独自の予測をご覧いただけます。私たちのレポートだけが持つ情報を入手し、貴重なビジネスインテリジェンスを得ることができます。
他にはない情報
私たちの新しいレポートがあれば、知識の遅れを取り戻し、チャンスを逃す可能性が低くなります。私たちの研究が貴社の調査、分析、意思決定にどのように役立つかをご覧ください。Visiongainの研究は、ウェアラブル脳内装置市場、2023年から2033年、市場をリードする企業のための商業分析を必要とするすべての人のためのものです。データ、トレンド、予測を見つけることができます。
ページTOPに戻る
目次
目次
1 レポートの概要
1.1 研究の目的
1.2 ウェアラブル脳内装置市場の紹介
1.3 本レポートが提供するもの
1.4 本レポートを読むべき理由
1.5 本分析レポートが回答する主な質問には以下が含まれます。
1.6 本レポートは誰のためのものなのか?
1.7 調査方法論
1.7.1 市場の定義
1.7.2 市場評価・予測手法
1.7.3 データの検証
1.8 よくある質問と回答(FAQ)
1.9 関連するVisiongainのレポート
1.10 Visiongainについて
2 エグゼクティブサマリー
3 プレミアムインサイト
3.1 地域別スナップショット。ウェアラブル脳内装置の世界市場
3.2 製品タイプ別セグメント市場魅力度指数
3.3 チャネルタイプ別セグメント市場魅力度指標
3.4 エンドユーザ別セグメント市場魅力度指標
3.5 医療環境別セグメント市場魅力度指標
4 市場の概要
4.1 主要な調査結果
4.2 マーケットダイナミクス
4.2.1 市場の推進要因
4.2.2 市場の抑制要因
4.2.3 市場機会
4.3 COVID-19影響度分析
4.4 ポーターのファイブフォース分析
4.4.1 バイヤーパワー
4.4.2 供給者パワー
4.4.3 競争相手との競合
4.4.4 代替品による脅威
4.4.5 新規参入者の脅威
4.5 環境要因分析
4.5.1 政治的要因
4.5.2 経済的要因
4.5.3 社会的要因
4.5.4 技術的要因
4.5.5 法的要因
4.5.6 環境要因
5 世界のウェアラブル脳内装置市場分析:製品タイプ別
5.1 主要な調査結果
5.2 世界市場の展望
5.3 ウェアラブル脳内装置の製品別世界市場魅力度指数
5.4 地域別市場規模の推計と予測
6 世界のウェアラブル脳内装置市場分析:技術別
6.1 主要な調査結果
6.2 世界市場の展望
6.3 ウェアラブル脳内装置の技術別世界市場魅力度指数
6.4 地域別市場規模の推定と予測
6.5 迷走神経刺激(VNS)に基づく技術
7 世界のウェアラブル脳内装置市場分析:チャネルタイプ別
7.1 主要な調査結果
7.2 世界の市場展望
7.3 ウェアラブル脳内装置のチャネルタイプ別世界市場魅力度指数
8 世界のウェアラブル脳内装置市場分析:エンドユーザー別
8.1 主要な調査結果
8.2 世界の市場展望
8.3 ウェアラブル脳内装置のエンドユーザー別世界市場魅力度指数
9 世界のウェアラブル脳内装置市場分析:医療環境別
9.1 9.1 主な調査結果
9.2 世界の市場展望
9.3 ウェアラブル脳内装置の世界市場魅力度指数:医療環境タイプ別
10 北米のウェアラブル脳内装置市場分析
10.1 主な調査結果
10.2 概要
10.3 北米のウェアラブル脳内装置市場魅力度指数
10.4 北米のウェアラブル脳内装置技術の市場規模推移と予測:金額別
10.5 北米のウェアラブル脳内装置の国別市場規模予測・予想
10.6 北米のウェアラブル脳内装置の製品タイプ別市場規模予測・予想
10.7 北米のウェアラブル脳内装置の技術別市場規模予測・予想
10.8 北米のウェアラブル脳内装置の市場規模予測・チャネルタイプ別予測
10.9 北米のウェアラブル脳内装置のエンドユーザー別市場規模予測・予想
10.10 北米のウェアラブル脳内デバイスの医療環境別市場規模予測・予測
10.11 アメリカ市場分析
10.12 カナダの市場分析
11 欧州のウェアラブル脳内装置市場分析
11.1 主な調査結果
11.2 概要
11.3 欧州のウェアラブル脳内装置市場魅力度指数
11.4 欧州のウェアラブル脳内装置の市場規模推移と予測:金額別
11.5 欧州のウェアラブル脳内装置の国別市場規模・予測
11.6 欧州のウェアラブル脳内装置の製品タイプ別市場規模・予測
11.7 欧州のウェアラブル脳内装置の市場規模・技術別予測
11.8 欧州のウェアラブル脳内装置の市場規模・チャネルタイプ別予測
11.9 欧州のウェアラブル脳内装置の市場規模・エンドユーザー別予測
11.10 欧州のウェアラブル脳内装置の市場規模・予測:医療環境別
11.11 ドイツの市場分析
11.12 フランスの市場分析
11.13 イギリスの市場分析
11.14 イタリアの市場分析
11.15 スペインの市場分析
11.16 その他の欧州のウェアラブル脳内装置市場分析
12 アジア太平洋地域のウェアラブル脳内装置市場分析
12.1 主な調査結果
12.2 概要
12.3 アジア太平洋地域のウェアラブル脳内装置市場の魅力度指数
12.4 アジア太平洋地域のウェアラブル脳内装置の市場規模推移と予測:金額別
12.5 アジア太平洋地域のウェアラブル脳内装置の国別市場規模・予測
12.6 アジア太平洋地域のウェアラブル脳内装置の製品タイプ別市場規模・予測
12.7 アジア太平洋地域のウェアラブル脳内装置の市場規模・技術別予測
12.8 アジア太平洋地域のウェアラブル脳内装置の市場規模・チャネルタイプ別予測
12.9 アジア太平洋地域のウェアラブル脳内装置の市場規模及びエンドユーザー別予測
12.10 アジア太平洋地域のウェアラブル脳内装置の市場規模推移と予測:医療環境別
12.11 中国市場の分析
12.12 インド市場の分析
12.12.1 インドではインドブランドが引き続きウェアラブル業界を支配している
12.13 日本市場の分析
12.14 韓国市場の分析
12.15 オーストラリアの市場分析
12.16 その他のアジア太平洋地域の市場分析
13 中東・アフリカのウェアラブル脳内装置市場分析
13.1 主な調査結果
13.2 概要
13.3 中東・アフリカのウェアラブル脳内装置市場の魅力度指数
13.4 中東・アフリカのウェアラブル脳内装置市場規模推移と予測:金額別
13.5 中東・アフリカのウェアラブル脳内装置の国別市場規模推移と予測
13.6 中東・アフリカのウェアラブル脳内装置の製品タイプ別市場規模・予測
13.7 中東・アフリカのウェアラブル脳内装置の市場規模推移と技術別予測
13.8 中東・アフリカのウェアラブル脳内装置の市場規模推移とチャネルタイプ別予測
13.9 中東・アフリカのウェアラブル脳内装置の市場規模推移とエンドユーザー別予測
13.10 中東・アフリカのウェアラブル脳内装置技術の市場規模推移と予測:医療環境別
13.11 GCCの市場分析
13.12 南アフリカの市場分析
14 ラテンアメリカのウェアラブル脳内装置市場分析
14.1 主な調査結果
14.2 概要
14.3 ラテンアメリカのウェアラブル脳内デバイス市場の魅力度指数
14.4 ラテンアメリカのウェアラブル脳内装置の市場規模推移と予測:金額別
14.5 ラテンアメリカのウェアラブル脳内装置の国別市場規模・予測
14.6 ラテンアメリカのウェアラブル脳内装置の製品タイプ別市場規模・予測
14.7 ラテンアメリカのウェアラブル脳内装置の市場規模・技術別予測
14.8 ラテンアメリカのウェアラブル脳内装置の市場規模・チャネルタイプ別予測
14.9 ラテンアメリカのウェアラブル脳内装置の市場規模・エンドユーザー別予測
14.10 ラテンアメリカのウウェアラブル脳内装置の市場規模推移と予測:医療環境別
14.11 ブラジル市場の分析
14.12 メキシコの市場分析
14.13 ラテンアメリカのその他の地域の市場分析
15 競合他社の状況
15.1 主要事業戦略分析-買収
15.2 主要事業戦略分析-新製品上市
15.3 主要事業戦略分析-契約
15.4 主要事業戦略分析-パートナーシップ
15.5 主要事業戦略分析-協業
15.6 主要な事業戦略分析-拡大
16 主要企業のプロフィール
16.1 Nihon Kohden Corporation
16.1.1 会社概要
16.1.2 会社概要
16.1.3 製品ベンチマーク
16.1.4 戦略的展望
16.2 Koninklijke Philips N.V.(Philips Healthcare)
16.2.1 会社概要
16.2.2 会社概要
16.2.3 財務分析
16.2.4 財務分析
16.2.5 戦略的な展望
16.3 GE Healthcare
16.3.1 企業スナップショット
16.3.2 会社概要
16.3.3 財務分析
16.3.4 製品ベンチマーク
16.3.5 戦略的展望
16.4 Siemens Healthineers
16.4.1 企業スナップショット
16.4.2 会社概要
16.4.3 製品ベンチマーク
16.4.4 戦略的展望
16.5 Compumedics, Ltd.
16.5.1 企業スナップショット
16.5.2 会社概要
16.5.3 ベンチマーキング
16.5.4 戦略的展望
16.6 Medtronic plc
16.6.1 企業スナップショット
16.6.2 会社概要
16.6.3 財務分析
16.6.4 製品ベンチマーク
16.6.5 戦略的展望
16.7 Edwards Lifesciences Corporation
16.7.1 企業スナップショット
16.7.2 会社概要
16.7.3 財務分析
16.7.4 製品ベンチマーク
16.7.5 戦略的展望
16.8 Advanced Brain Monitoring
16.8.1 企業スナップショット
16.8.2 会社概要
16.8.3 製品ベンチマーク
16.9 Masimo Corporation
16.9.1 企業スナップショット
16.9.2 会社概要
16.9.3 財務分析
16.9.4 製品ベンチマーク
16.9.5 戦略的展望
16.10 Cadwell Industries
16.10.1 企業スナップショット
16.10.2 会社概要
16.10.3 ベンチマーキング
16.10.4 戦略的展望
17 結論と提言
17.1 ヴィジョンゲインからの結論
17.2 市場関係者への提言
表の一覧
Table 1 Global Wearable Brain Devices Market Snapshot, 2023 & 2033 (US$ million, CAGR %)
Table 2 Global Wearable Brain Devices Market Forecast, 2023-2033 (US$ Mn, AGR (%), CAGR (%)) (V-Shaped Recovery Scenario)
Table 3 Global Wearable Brain Devices Market by Region, 2023-2033 (US$ Mn, AGR (%), CAGR (%)) (V-Shaped Recovery Scenario)
Table 4 Global Wearable Brain Devices Market Forecast, 2023-2033 (US$ Mn, AGR (%), CAGR (%)) (U-Shaped Recovery Scenario)
Table 5 Global Wearable Brain Devices Market by Region, 2023-2033 (US$ Mn, AGR (%), CAGR (%)) (U-Shaped Recovery Scenario)
Table 6 Global Wearable Brain Devices Market Forecast, 2023-2033 (US$ Mn, AGR (%), CAGR (%)) (W-Shaped Recovery Scenario)
Table 7 Global Wearable Brain Devices Market by Region, 2023-2033 (US$ Mn, AGR (%), CAGR (%)) (W-Shaped Recovery Scenario)
Table 8 Global Wearable Brain Devices Market Forecast, 2023-2033 (US$ Mn, AGR (%), CAGR (%)) (L-Shaped Recovery Scenario)
Table 9 Global Wearable Brain Devices Market by Region, 2023-2033 (US$ Mn, AGR (%), CAGR (%)) (L-Shaped Recovery Scenario)
Table 10 Global Wearable Brain Devices Market by Product Type, 2023-2033 (US$ Mn, AGR (%), CAGR (%))
Table 11 Global Conventional Devices Market Forecast, 2023-2033 (US$ Mn, AGR (%), CAGR (%))
Table 12 Global Conventional Devices Market by Region, 2023-2033 (US$ Mn, AGR (%), CAGR (%))
Table 13 Global Implantable Devices Market Forecast, 2023-2033 (US$ Mn, AGR (%), CAGR (%))
Table 14 Global Implantable Devices Market by Region, 2023-2033 (US$ Mn, AGR (%), CAGR (%))
Table 15 Global Wearable Brain Devices Market by Technology, 2023-2033 (US$ Mn, AGR (%), CAGR (%))
Table 16 Global Vagus Nerve Stimulation (VNS) Market Forecast, 2023-2033 (US$ Mn, AGR (%), CAGR (%))
Table 17 Global Vagus Nerve Stimulation (VNS) Market by Region, 2023-2033 (US$ Mn, AGR (%), CAGR (%))
Table 18 Global Responsive Neurostimulation Market Forecast, 2023-2033 (US$ Mn, AGR (%), CAGR (%))
Table 19 Global Responsive Neurostimulation Market by Region, 2023-2033 (US$ Mn, AGR (%), CAGR (%))
Table 20 Global Deep Brain Stimulation Market Forecast, 2023-2033 (US$ Mn, AGR (%), CAGR (%))
Table 21 Global Deep Brain Stimulation Market by Region, 2023-2033 (US$ Mn, AGR (%), CAGR (%))
Table 22 Global Wearable Brain Devices Market by Channel Type, 2023-2033 (US$ Mn, AGR (%), CAGR (%))
Table 23 Global 32-Channel Type Market Forecast, 2023-2033 (US$ Mn, AGR (%), CAGR (%))
Table 24 Global 32-Channel Type Market by Region, 2023-2033 (US$ Mn, AGR (%), CAGR (%))
Table 25 Global 12-Channel Type Market Forecast, 2023-2033 (US$ Mn, AGR (%), CAGR (%))
Table 26 Global 12-Channel Type Market by Region, 2023-2033 (US$ Mn, AGR (%), CAGR (%))
Table 27 Global 14-Channel Type Market Forecast, 2023-2033 (US$ Mn, AGR (%), CAGR (%))
Table 28 Global 14-Channel Type Market by Region, 2023-2033 (US$ Mn, AGR (%), CAGR (%))
Table 29 Global Multi-channels Market Forecast, 2023-2033 (US$ Mn, AGR (%), CAGR (%))
Table 30 Global Multi-channels Market by Region, 2023-2033 (US$ Mn, AGR (%), CAGR (%))
Table 31 Global Wearable Brain Devices Market by End-user, 2023-2033 (US$ Mn, AGR (%), CAGR (%))
Table 32 Global Hospitals & Clinics Market Forecast, 2023-2033 (US$ Mn, AGR (%), CAGR (%))
Table 33 Global Hospitals & Clinics Market by Region, 2023-2033 (US$ Mn, AGR (%), CAGR (%))
Table 34 Global Neurology Centers Market Forecast, 2023-2033 (US$ Mn, AGR (%), CAGR (%))
Table 35 Global Neurology Centers Market by Region, 2023-2033 (US$ Mn, AGR (%), CAGR (%))
Table 36 Global Homecare Settings Market Forecast, 2023-2033 (US$ Mn, AGR (%), CAGR (%))
Table 37 Global Homecare Settings Market by Region, 2023-2033 (US$ Mn, AGR (%), CAGR (%))
Table 38 Global Intensive Care Units Market Forecast, 2023-2033 (US$ Mn, AGR (%), CAGR (%))
Table 39 Global Intensive Care Units Market by Region, 2023-2033 (US$ Mn, AGR (%), CAGR (%))
Table 40 Global Other End-user Market Forecast, 2023-2033 (US$ Mn, AGR (%), CAGR (%))
Table 41 Global Other End-user Market by Region, 2023-2033 (US$ Mn, AGR (%), CAGR (%))
Table 42 Global Wearable Brain Devices Market by Medical Setting, 2023-2033 (US$ Mn, AGR (%), CAGR (%))
Table 43 Global Epilepsy Market Forecast, 2023-2033 (US$ Mn, AGR (%), CAGR (%))
Table 44 Global Epilepsy Market by Region, 2023-2033 (US$ Mn, AGR (%), CAGR (%))
Table 45 Global Sleep Disorders Market Forecast, 2023-2033 (US$ Mn, AGR (%), CAGR (%))
Table 46 Global Sleep Disorders Market by Region, 2023-2033 (US$ Mn, AGR (%), CAGR (%))
Table 47 Global Parkinson’s Disease Market Forecast, 2023-2033 (US$ Mn, AGR (%), CAGR (%))
Table 48 Global Parkinson’s Disease Market by Region, 2023-2033 (US$ Mn, AGR (%), CAGR (%))
Table 49 Global Traumatic Brain Injury (TBI) Market Forecast, 2023-2033 (US$ Mn, AGR (%), CAGR (%))
Table 50 Global Traumatic Brain Injury (TBI) Market by Region, 2023-2033 (US$ Mn, AGR (%), CAGR (%))
Table 51 Global Alzheimer Market Forecast, 2023-2033 (US$ Mn, AGR (%), CAGR (%))
Table 52 Global Alzheimer Market by Region, 2023-2033 (US$ Mn, AGR (%), CAGR (%))
Table 53 Global Other Medical Setting Market Forecast, 2023-2033 (US$ Mn, AGR (%), CAGR (%))
Table 54 Global Other Medical Setting Market by Region, 2023-2033 (US$ Mn, AGR (%), CAGR (%))
Table 55 North America Wearable Brain Devices Market by Value, 2023-2033 (US$ Mn, AGR (%), CAGR (%))
Table 56 North America Wearable Brain Devices Market by Country, 2023-2033 (US$ Mn, AGR (%), CAGR (%))
Table 57 North America Wearable Brain Devices Market by Product Type, 2023-2033 (US$ Mn, AGR (%), CAGR (%))
Table 58 North America Wearable Brain Devices Market by Technology, 2023-2033 (US$ Mn, AGR (%), CAGR (%))
Table 59 North America Wearable Brain Devices Market by Channel Type, 2023-2033 (US$ Mn, AGR (%), CAGR (%))
Table 60 North America Wearable Brain Devices Market by End-user, 2023-2033 (US$ Mn, AGR (%), CAGR (%))
Table 61 North America Wearable Brain Devices Market by Medical Setting, 2023-2033 (US$ Mn, AGR (%), CAGR (%))
Table 62 US Wearable Brain Devices Market by Value, 2023-2033 (US$ Mn, AGR (%), CAGR (%))
Table 63 Canada Wearable Brain Devices Market by Value, 2023-2033 (US$ Mn, AGR (%), CAGR (%))
Table 64 Europe Wearable Brain Devices Market by Value, 2023-2033 (US$ Mn, AGR (%), CAGR (%))
Table 65 Europe Wearable Brain Devices Market by Country, 2023-2033 (US$ Mn, AGR (%), CAGR (%))
Table 66 Europe Wearable Brain Devices Market by Product Type, 2023-2033 (US$ Mn, AGR (%), CAGR (%))
Table 67 Europe Wearable Brain Devices Market by Technology, 2023-2033 (US$ Mn, AGR (%), CAGR (%))
Table 68 Europe Wearable Brain Devices Market by Channel Type, 2023-2033 (US$ Mn, AGR (%), CAGR (%))
Table 69 Europe Wearable Brain Devices Market by End-user, 2023-2033 (US$ Mn, AGR (%), CAGR (%))
Table 70 Europe Wearable Brain Devices Market by Medical Setting, 2023-2033 (US$ Mn, AGR (%), CAGR (%))
Table 71 Germany Wearable Brain Devices Market by Value, 2023-2033 (US$ Mn, AGR (%), CAGR (%))
Table 72 France Wearable Brain Devices Market by Value, 2023-2033 (US$ Mn, AGR (%), CAGR(%))
Table 73 UK Wearable Brain Devices Market by Value, 2023-2033 (US$ Mn, AGR (%), CAGR (%))
Table 74 Italy Wearable Brain Devices Market by Value, 2023-2033 (US$ Mn, AGR (%), CAGR (%))
Table 75 Spain Wearable Brain Devices Market by Value, 2023-2033 (US$ Mn, AGR (%), CAGR (%))
Table 76 Rest of Europe Wearable Brain Devices Market by Value, 2023-2033 (US$ Mn, AGR (%), CAGR (%))
Table 77 Asia-Pacific Wearable Brain Devices Market by Value, 2023-2033 (US$ Mn, AGR (%), CAGR (%))
Table 78 Asia-Pacific Wearable Brain Devices Market by Country, 2023-2033 (US$ Mn, AGR (%), CAGR (%))
Table 79 Asia-Pacific Wearable Brain Devices Market by Product Type, 2023-2033 (US$ Mn, AGR (%), CAGR (%))
Table 80 Asia-Pacific Wearable Brain Devices Market by Technology, 2023-2033 (US$ Mn, AGR (%), CAGR (%))
Table 81 Asia-Pacific Wearable Brain Devices Market by Channel Type, 2023-2033 (US$ Mn, AGR (%), CAGR (%))
Table 82 Asia-Pacific Wearable Brain Devices Market by End-user, 2023-2033 (US$ Mn, AGR (%), CAGR (%))
Table 83 Asia-Pacific Wearable Brain Devices Market by Medical Setting, 2023-2033 (US$ Mn, AGR (%), CAGR (%))
Table 84 China Wearable Brain Devices Market by Value, 2023-2033 (US$ Mn, AGR (%), CAGR (%))
Table 85 India Wearable Brain Devices Market by Value, 2023-2033 (US$ Mn, AGR (%), CAGR (%))
Table 86 Japan Wearable Brain Devices Market by Value, 2023-2033 (US$ Mn, AGR (%), CAGR (%))
Table 87 South Korea Wearable Brain Devices Market by Value, 2023-2033 (US$ Mn, AGR (%), CAGR (%))
Table 88 Australia Wearable Brain Devices Market by Value, 2023-2033 (US$ Mn, AGR (%), CAGR (%))
Table 89 Rest of Asia-Pacific Wearable Brain Devices Market by Value, 2023-2033 (US$ Mn, AGR (%), CAGR (%))
Table 90 Middle East & Africa Wearable Brain Devices Market by Value, 2023-2033 (US$ Mn, AGR (%), CAGR (%))
Table 91 Middle East & Africa Wearable Brain Devices Market by Country, 2023-2033 (US$ Mn, AGR (%), CAGR (%))
Table 92 Middle East & Africa Wearable Brain Devices Market by Product Type, 2023-2033 (US$ Mn, AGR (%), CAGR (%))
Table 93 Middle East & Africa Wearable Brain Devices Market by Technology, 2023-2033 (US$ Mn, AGR (%), CAGR (%))
Table 94 Middle East & Africa Wearable Brain Devices Market by Channel Type, 2023-2033 (US$ Mn, AGR (%), CAGR (%))
Table 95 Middle East & Africa Wearable Brain Devices Market by End-user, 2023-2033 (US$ Mn, AGR (%), CAGR (%))
Table 96 Middle East & Africa Wearable Brain Devices Market by Medical Setting, 2023-2033 (US$ Mn, AGR (%), CAGR (%))
Table 97 GCC Wearable Brain Devices Market by Value, 2023-2033 (US$ Mn, AGR (%), CAGR (%))
Table 98 South Africa Wearable Brain Devices Market by Value, 2023-2033 (US$ Mn, AGR (%), CAGR (%))
Table 99 Latin America Wearable Brain Devices Market by Value, 2023-2033 (US$ Mn, AGR (%), CAGR (%))
Table 100 Latin America Wearable Brain Devices Market by Country, 2023-2033 (US$ Mn, AGR (%), CAGR (%))
Table 101 Latin America Wearable Brain Devices Market by Product Type, 2023-2033 (US$ Mn, AGR (%), CAGR (%))
Table 102 Latin America Wearable Brain Devices Market by Technology, 2023-2033 (US$ Mn, AGR (%), CAGR (%))
Table 103 Latin America Wearable Brain Devices Market by Channel Type, 2023-2033 (US$ Mn, AGR (%), CAGR (%))
Table 104 Latin America Wearable Brain Devices Market by End-user, 2023-2033 (US$ Mn, AGR (%), CAGR (%))
Table 105 Latin America Wearable Brain Devices Market by Medical Setting, 2023-2033 (US$ Mn, AGR (%), CAGR (%))
Table 106 Brazil Wearable Brain Devices Market by Value, 2023-2033 (US$ Mn, AGR (%), CAGR (%))
Table 107 Mexico Wearable Brain Devices Market by Value, 2023-2033 (US$ Mn, AGR (%), CAGR (%))
Table 108 Rest of Latin America Wearable Brain Devices Market by Value, 2023-2033 (US$ Mn, AGR (%), CAGR (%))
Table 109 Key Business Strategies Adopted by Key Players in Global Wearable Brain Devices Market
Table 110 Key Business Strategies Adopted by Key Players in Global Wearable Brain Devices Market
Table 111 Key Business Strategies Adopted by Key Players in Global Wearable Brain Devices Market
Table 112 Key Business Strategies Adopted by Key Players in Global Wearable Brain Devices Market
Table 113 Key Business Strategies Adopted by Key Players in Global Wearable Brain Devices Market
Table 114 Key Business Strategies Adopted by Key Players in Global Wearable Brain Devices Market
Table 115 Nihon Kohden Corporation: Key Details, (CEO, HQ, Revenue, Founded, No. of Employees, Company Type, Website, Business Segment)
Table 116 Nihon Kohden Corporation: Product Benchmarking
Table 117 Nihon Kohden Corporation: Strategic Outlook
Table 118 Koninklijke Philips N.V. (Philips healthcare): Key Details, (CEO, HQ, Revenue, Founded, No. of Employees, Company Type, Website, Business Segment)
Table 119 Koninklijke Philips N.V. (Philips healthcare): Product Benchmarking
Table 120 Koninklijke Philips N.V. (Philips healthcare): Strategic Outlook
Table 121 GE Healthcare: Key Details, (CEO, HQ, Revenue, Founded, No. of Employees, Company Type, Website, Business Segment)
Table 122 GE Healthcare: Product Benchmarking
Table 123 GE Healthcare: Strategic Outlook
Table 124 Siemens Healthineers: Key Details, (CEO, HQ, Revenue, Founded, No. of Employees, Company Type, Website, Business Segment)
Table 125 Siemens Healthineers: Product Benchmarking
Table 126 Siemens Healthineers: Strategic Outlook
Table 127 Compumedics Limited: Key Details, (CEO, HQ, Revenue, Founded, No. of Employees, Company Type, Website, Business Segment)
Table 128 Compumedics Limited: Product Benchmarking
Table 129 Compumedics Limited: Strategic Outlook
Table 130 Medtronic: Key Details, (CEO, HQ, Revenue, Founded, No. of Employees, Company Type, Website, Business Segment)
Table 131 Medtronic: Product Benchmarking
Table 132 Medtronic: Strategic Outlook
Table 133 Edwards Lifesciences Corporation: Key Details, (CEO, HQ, Revenue, Founded, No. of Employees, Company Type, Website, Business Segment)
Table 134 Edwards Lifesciences Corporation: Product Benchmarking
Table 135 Edwards Lifesciences Corporation: Strategic Outlook
Table 136 Advanced Brain Monitoring: Key Details, (CEO, HQ, Revenue, Founded, No. of Employees, Company Type, Website, Business Segment)
Table 137 Advanced Brain Monitoring: Product Benchmarking
Table 138 Masimo Corporation: Key Details, (CEO, HQ, Revenue, Founded, No. of Employees, Company Type, Website, Business Segment)
Table 139 Masimo Corporation: Product Benchmarking
Table 140 Masimo Corporation: Strategic Outlook
Table 141 Cadwell Industries: Key Details, (CEO, HQ, Revenue, Founded, No. of Employees, Company Type, Website, Business Segment)
Table 142 Cadwell Industries: Product Benchmarking
Table 143 Cadwell Industries: Strategic Outlook
図の一覧
Figure 1 Global Wearable Brain Devices Market Segmentation
Figure 2 Breakdown of Primary Interviews: By Company Type, Designation, & Region
Global Wearable Brain Devices Market Forecast by Region: Market Attractiveness Index
Global Wearable Brain Devices Market by Product Type Segment: Market Attractiveness Index
Global Wearable Brain Devices Market by Channel Type Segment: Market Attractiveness Index
Global Wearable Brain Devices Market by End-User Segment: Market Attractiveness Index
Global Wearable Brain Devices Market by Medical Setting Segment: Market Attractiveness Index
Figure 3 Global Wearable Brain Devices Market: Market Dynamics
Figure 4 Global COVID Impact Analysis: Wearable Brain Devices Market Recovery Scenarios
Figure 5 Global Wearable Brain Devices Market Forecast, 2023-2033 (US$ Mn, AGR (%)) (V-Shaped Recovery Scenario)
Figure 6 Global Wearable Brain Devices Market by Region, 2023-2033 (US$ Mn, AGR (%)) (V-Shaped Recovery Scenario)
Figure 7 Global Wearable Brain Devices Market Forecast, 2023-2033 (US$ Mn, AGR (%)) (U-Shaped Recovery Scenario)
Figure 8 Global Wearable Brain Devices Market by Region, 2023-2033 (US$ Mn, AGR (%)) (U-Shaped Recovery Scenario)
Figure 9 Global Wearable Brain Devices Market Forecast, 2023-2033 (US$ Mn, AGR (%)) (W-Shaped Recovery Scenario)
Figure 10 Global Wearable Brain Devices Market by Region, 2023-2033 (US$ Mn, AGR (%)) (W-Shaped Recovery Scenario)
Figure 11 Global Wearable Brain Devices Market Forecast, 2023-2033 (US$ Mn, AGR (%)) (L-Shaped Recovery Scenario)
Figure 12 Global Wearable Brain Devices Market by Region, 2023-2033 (US$ Mn, AGR (%)) (L-Shaped Recovery Scenario)
Figure 13 Global Wearable Brain Devices Market: Porter’s Five Forces Analysis
Figure 14 Global Wearable Brain Devices Market: PESTLE Analysis
Figure 15 Global Wearable Brain Devices Market by Product Market Attractiveness Index
Figure 16 Global Wearable Brain Devices Market Share by Product 2023 & 2033 (%)
Figure 17 Global Wearable Brain Devices Market by Product Type, 2023-2033 (US$ Mn, AGR (%))
Figure 18 Global Conventional Devices Market Forecast, 2023-2033 (US$ Mn, AGR (%))
Figure 19 Global Conventional Devices Market by Region, 2023-2033 (US$ Mn, AGR (%))
Figure 20 Global Implantable Devices Market Forecast, 2023-2033 (US$ Mn, AGR (%))
Figure 21 Global Implantable Devices Market by Region, 2023-2033 (US$ Mn, AGR (%))
Figure 22 Global Wearable Brain Devices Market by Technology Market Attractiveness Index
Figure 23 Global Wearable Brain Devices Market Share by Technology 2023 & 2033 (%)
Figure 24 Global Wearable Brain Devices Market by Technology, 2023-2033 (US$ Mn, AGR (%))
Figure 25 Global Vagus Nerve Stimulation (VNS) Market Forecast, 2023-2033 (US$ Mn, AGR (%))
Figure 26 Global Vagus Nerve Stimulation (VNS) Market by Region, 2023-2033 (US$ Mn, AGR (%))
Figure 27 Global Responsive Neurostimulation Market Forecast, 2023-2033 (US$ Mn, AGR (%))
Figure 28 Global Responsive Neurostimulation Market by Region, 2023-2033 (US$ Mn, AGR (%))
Figure 29 Global Deep Brain Stimulation Market Forecast, 2023-2033 (US$ Mn, AGR (%))
Figure 30 Global Deep Brain Stimulation Market by Region, 2023-2033 (US$ Mn, AGR (%))
Figure 31 Global Wearable Brain Devices Market by Channel Type Market Attractiveness Index
Figure 32 Global Wearable Brain Devices Market Share Forecast by Channel Type 2023 & 2033 (%)
Figure 33 Global Wearable Brain Devices Market by Channel Type, 2023-2033 (US$ Mn, AGR (%))
Figure 34 Global 32-Channel Type Market Forecast, 2023-2033 (US$ Mn, AGR (%))
Figure 35 Global 32-Channel Type Market by Region, 2023-2033 (US$ Mn, AGR (%))
Figure 36 Global 12-Channel Type Market Forecast, 2023-2033 (US$ Mn, AGR (%))
Figure 37 Global 12-Channel Type Market by Region, 2023-2033 (US$ Mn, AGR (%))
Figure 38 Global 14-Channel Type Market Forecast, 2023-2033 (US$ Mn, AGR (%))
Figure 39 Global 14-Channel Type Market by Region, 2023-2033 (US$ Mn, AGR (%))
Figure 40 Global Multi-channels Market Forecast, 2023-2033 (US$ Mn, AGR (%))
Figure 41 Global Multi-channels Market by Region, 2023-2033 (US$ Mn, AGR (%))
Figure 42 Global Wearable Brain Devices Market by End-User Market Attractiveness Index
Figure 43 Global Wearable Brain Devices Market Share Forecast by End-User 2023 & 2033 (%)
Figure 44 Global Wearable Brain Devices Market by End-user, 2023-2033 (US$ Mn, AGR (%))
Figure 45 Global Hospitals & Clinics Market Forecast, 2023-2033 (US$ Mn, AGR (%))
Figure 46 Global Hospitals & Clinics Market by Region, 2023-2033 (US$ Mn, AGR (%))
Figure 47 Global Neurology Centers Market Forecast, 2023-2033 (US$ Mn, AGR (%))
Figure 48 Global Neurology Centers Market by Region, 2023-2033 (US$ Mn, AGR (%))
Figure 49 Global Homecare Settings Market Forecast, 2023-2033 (US$ Mn, AGR (%))
Figure 50 Global Homecare Settings Market by Region, 2023-2033 (US$ Mn, AGR (%))
Figure 51 Global Intensive Care Units Market Forecast, 2023-2033 (US$ Mn, AGR (%))
Figure 52 Global Intensive Care Units Market by Region, 2023-2033 (US$ Mn, AGR (%))
Figure 53 Global Other End-user Market Forecast, 2023-2033 (US$ Mn, AGR (%))
Figure 54 Global Other End-user Market by Region, 2023-2033 (US$ Mn, AGR (%))
Figure 55 Global Wearable Brain Devices Market by Medical Setting Market Attractiveness Index
Figure 56 Global Wearable Brain Devices Market Share Forecast by Medical Setting 2023 & 2033 (%)
Figure 57 Global Wearable Brain Devices Market by Medical Setting, 2023-2033 (US$ Mn, AGR (%))
Figure 58 Global Epilepsy Market Forecast, 2023-2033 (US$ Mn, AGR (%))
Figure 59 Global Epilepsy Market by Region, 2023-2033 (US$ Mn, AGR (%))
Figure 60 Global Sleep Disorders Market Forecast, 2023-2033 (US$ Mn, AGR (%))
Figure 61 Global Sleep Disorders Market by Region, 2023-2033 (US$ Mn, AGR (%))
Figure 62 Global Parkinson’s Disease Market Forecast, 2023-2033 (US$ Mn, AGR (%))
Figure 63 Global Parkinson’s Disease Market by Region, 2023-2033 (US$ Mn, AGR (%))
Figure 64 Global Traumatic Brain Injury (TBI) Market Forecast, 2023-2033 (US$ Mn, AGR (%))
Figure 65 Global Traumatic Brain Injury (TBI) Market by Region, 2023-2033 (US$ Mn, AGR (%))
Figure 66 Global Alzheimer Market Forecast, 2023-2033 (US$ Mn, AGR (%))
Figure 67 Alzheimer Market by Region, 2023-2033 (US$ Mn, AGR (%))
Figure 68 Global Other Medical Setting Market Forecast, 2023-2033 (US$ Mn, AGR (%))
Figure 69 Global Other Medical Setting Market by Region, 2023-2033 (US$ Mn, AGR (%))
Figure 70 North America Wearable Brain Devices Market Attractiveness Index
Figure 71 North America Wearable Brain Devices Market by Value, 2023-2033 (US$ Mn, AGR (%))
Figure 72 North America Wearable Brain Devices Market by Country, 2023-2033 (US$ Mn, AGR (%))
Figure 73 North America Wearable Brain Devices Technologies Market Share Forecast by Country 2023, 2033 (%)
Figure 74 North America Wearable Brain Devices Market by Product Type, 2023-2033 (US$ Mn, AGR (%))
Figure 75 North America Wearable Brain Devices Technologies Market Share Forecast by Product Type 2023, 2033 (%)
Figure 76 North America Wearable Brain Devices Market by Technology, 2023-2033 (US$ Mn, AGR (%))
Figure 77 North America Wearable Brain Devices Technologies Market Share Forecast by Technology 2023, 2033 (%)
Figure 78 North America Wearable Brain Devices Market by Channel Type, 2023-2033 (US$ Mn, AGR (%))
Figure 79 North America Wearable Brain Devices Technologies Market Share Forecast by Channel Type 2023, 2033 (%)
Figure 80 North America Wearable Brain Devices Market by End-user, 2023-2033 (US$ Mn, AGR (%))
Figure 81 North America Wearable Brain Devices Technologies Market Share Forecast by End-User 2023, 2033 (%)
Figure 82 North America Wearable Brain Devices Market by Medical Setting, 2023-2033 (US$ Mn, AGR (%))
Figure 83 North America Wearable Brain Devices Technologies Market Share Forecast by Medical Setting 2023, 2033 (%)
Figure 84 US Wearable Brain Devices Market by Value, 2023-2033 (US$ Mn, AGR (%))
Figure 85 Canada Wearable Brain Devices Market by Value, 2023-2033 (US$ Mn, AGR (%))
Figure 86 Europe Wearable Brain Devices Market Attractiveness Index
Figure 87 Europe Wearable Brain Devices Market by Value, 2023-2033 (US$ Mn, AGR (%))
Figure 88 Europe Wearable Brain Devices Market by Country, 2023-2033 (US$ Mn, AGR (%))
Figure 89 Europe Wearable Brain Devices Technologies Market Share Forecast by Country 2023, 2033 (%)
Figure 90 Europe Wearable Brain Devices Market by Product Type, 2023-2033 (US$ Mn, AGR (%))
Figure 91 Europe Wearable Brain Devices Technologies Market Share Forecast by Product Type 2023, 2033 (%)
Figure 92 Europe Wearable Brain Devices Market by Technology, 2023-2033 (US$ Mn, AGR (%))
Figure 93 Europe Wearable Brain Devices Technologies Market Share Forecast by Technology 2023, 2033 (%)
Figure 94 Europe Wearable Brain Devices Market by Channel Type, 2023-2033 (US$ Mn, AGR (%))
Figure 95 Europe Wearable Brain Devices Technologies Market Share Forecast by Channel Type 2023, 2033 (%)
Figure 96 Europe Wearable Brain Devices Market by End-user, 2023-2033 (US$ Mn, AGR (%))
Figure 97 Europe Wearable Brain Devices Technologies Market Share Forecast by End-User 2023, 2033 (%)
Figure 98 Europe Wearable Brain Devices Market by Medical Setting, 2023-2033 (US$ Mn, AGR (%))
Figure 99 Europe Wearable Brain Devices Technologies Market Share Forecast by Medical Setting 2023, 2033 (%)
Figure 100 Germany Wearable Brain Devices Market by Value, 2023-2033 (US$ Mn, AGR (%))
Figure 101 France Wearable Brain Devices Market by Value, 2023-2033 (US$ Mn, AGR (%))
Figure 102 UK Wearable Brain Devices Market by Value, 2023-2033 (US$ Mn, AGR (%))
Figure 103 Italy Wearable Brain Devices Market by Value, 2023-2033 (US$ Mn, AGR (%))
Figure 104 Spain Wearable Brain Devices Market by Value, 2023-2033 (US$ Mn, AGR (%))
Figure 105 Rest of Europe Wearable Brain Devices Market by Value, 2023-2033 (US$ Mn, AGR (%))
Figure 106 Asia-Pacific Wearable Brain Devices Market Attractiveness Index
Figure 107 Asia-Pacific Wearable Brain Devices Market by Value, 2023-2033 (US$ Mn, AGR (%))
Figure 108 Asia-Pacific Wearable Brain Devices Market by Country, 2023-2033 (US$ Mn, AGR (%))
Figure 109 Asia-Pacific Wearable Brain Devices Technologies Market Share Forecast by Country 2023, 2033 (%)
Figure 110 Asia-Pacific Wearable Brain Devices Market by Product Type, 2023-2033 (US$ Mn, AGR (%))
Figure 111 Asia-Pacific Wearable Brain Devices Technologies Market Share Forecast by Product Type 2023, 2033 (%)
Figure 112 Asia-Pacific Wearable Brain Devices Market by Technology, 2023-2033 (US$ Mn, AGR (%))
Figure 113 Asia-Pacific Wearable Brain Devices Technologies Market Share Forecast by Technology 2023, 2033 (%)
Figure 114 Asia-Pacific Wearable Brain Devices Market by Channel Type, 2023-2033 (US$ Mn, AGR (%))
Figure 115 Asia-Pacific Wearable Brain Devices Technologies Market Share Forecast by Channel Type 2023, 2033 (%)
Figure 116 Asia-Pacific Wearable Brain Devices Market by End-user, 2023-2033 (US$ Mn, AGR (%))
Figure 117 Asia-Pacific Wearable Brain Devices Technologies Market Share Forecast by End-User 2023, 2033 (%)
Figure 118 Asia-Pacific Wearable Brain Devices Market by Medical Setting, 2023-2033 (US$ Mn, AGR (%))
Figure 119 Asia-Pacific Wearable Brain Devices Technologies Market Share Forecast by Medical Setting 2023, 2033 (%)
Figure 120 China Wearable Brain Devices Market by Value, 2023-2033 (US$ Mn, AGR (%))
Figure 121 India Wearable Brain Devices Market by Value, 2023-2033 (US$ Mn, AGR (%))
Figure 122 Japan Wearable Brain Devices Market by Value, 2023-2033 (US$ Mn, AGR (%))
Figure 123 South Korea Wearable Brain Devices Market by Value, 2023-2033 (US$ Mn, AGR (%))
Figure 124 Australia Wearable Brain Devices Market by Value, 2023-2033 (US$ Mn, AGR (%))
Figure 125 Rest of Asia-Pacific Wearable Brain Devices Market by Value, 2023-2033 (US$ Mn, AGR (%))
Figure 126 Middle-East & Africa Wearable Brain Devices Market Attractiveness Index
Figure 127 Middle East & Africa Wearable Brain Devices Market by Value, 2023-2033 (US$ Mn, AGR (%))
Figure 128 Middle East & Africa Wearable Brain Devices Market by Country, 2023-2033 (US$ Mn, AGR (%))
Figure 129 Middle East & Africa Wearable Brain Devices Technologies Market Share Forecast by Country 2023, 2033 (%)
Figure 130 Middle East & Africa Wearable Brain Devices Market by Product Type, 2023-2033 (US$ Mn, AGR (%))
Figure 131 Middle East & Africa Wearable Brain Devices Technologies Market Share Forecast by Product Type 2023, 2033 (%)
Figure 132 Middle East & Africa Wearable Brain Devices Market by Technology, 2023-2033 (US$ Mn, AGR (%))
Figure 133 Middle East & Africa Wearable Brain Devices Technologies Market Share Forecast by Technology 2023, 2033 (%)
Figure 134 Middle East & Africa Wearable Brain Devices Market by Channel Type, 2023-2033 (US$ Mn, AGR (%))
Figure 135 Middle East & Africa Wearable Brain Devices Technologies Market Share Forecast by Channel Type 2023, 2033 (%)
Figure 136 Middle East & Africa Wearable Brain Devices Market by End-user, 2023-2033 (US$ Mn, AGR (%))
Figure 137 Middle East & Africa Wearable Brain Devices Technologies Market Share Forecast by End-User 2023, 2033 (%)
Figure 138 Middle East & Africa Wearable Brain Devices Market by Medical Setting, 2023-2033 (US$ Mn, AGR (%))
Figure 139 Middle East & Africa Wearable Brain Devices Technologies Market Share Forecast by Medical Setting 2023, 2033 (%)
Figure 140 GCC Wearable Brain Devices Market by Value, 2023-2033 (US$ Mn, AGR (%))
Figure 141 South Africa Wearable Brain Devices Market by Value, 2023-2033 (US$ Mn, AGR (%))
Figure 142 Latin America Wearable Brain Devices Market Attractiveness Index
Figure 143 Latin America Wearable Brain Devices Market by Value, 2023-2033 (US$ Mn, AGR (%))
Figure 144 Latin America Wearable Brain Devices Market by Country, 2023-2033 (US$ Mn, AGR (%))
Figure 145 Latin America Wearable Brain Devices Technologies Market Share Forecast by Country 2023, 2033 (%)
Figure 146 Latin America Wearable Brain Devices Market by Product Type, 2023-2033 (US$ Mn, AGR (%))
Figure 147 Latin America Wearable Brain Devices Technologies Market Share Forecast by Product Type 2023, 2033 (%)
Figure 148 Latin America Wearable Brain Devices Market by Technology, 2023-2033 (US$ Mn, AGR (%))
Figure 149 Latin America Wearable Brain Devices Technologies Market Share Forecast by Technology 2023, 2033 (%)
Figure 150 Latin America Wearable Brain Devices Market by Channel Type, 2023-2033 (US$ Mn, AGR (%))
Figure 151 Latin America Wearable Brain Devices Technologies Market Share Forecast by Channel Type 2023, 2033 (%)
Figure 152 Latin America Wearable Brain Devices Market by End-user, 2023-2033 (US$ Mn, AGR (%))
Figure 153 Latin America Wearable Brain Devices Technologies Market Share Forecast by End-User2023, 2033 (%)
Figure 154 Latin America Wearable Brain Devices Market by Medical Setting, 2023-2033 (US$ Mn, AGR (%))
Figure 155 Latin America Wearable Brain Devices Technologies Market Share Forecast by Medical Setting 2023, 2033 (%)
Figure 156 Brazil Wearable Brain Devices Market by Value, 2023-2033 (US$ Mn, AGR (%))
Figure 157 Mexico Wearable Brain Devices Market by Value, 2023-2033 (US$ Mn, AGR (%))
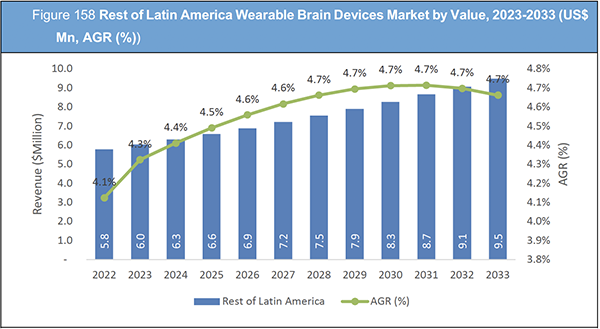
Figure 158 Rest of Latin America Wearable Brain Devices Market by Value, 2023-2033 (US$ Mn, AGR (%))
Figure 159 Koninklijke Philips N.V. (Philips healthcare): Net Revenue, 2017-2021 (US$ million, AGR%)
Figure 160 Koninklijke Philips N.V. (Philips healthcare): Gross Profit, 2017-2021 (US$ million, AGR%)
Figure 161 Koninklijke Philips N.V. (Philips healthcare): Operational Income, 2017-2021 (US$ million, AGR%)
Figure 162 Koninklijke Philips N.V. (Philips healthcare): EBITDA, 2017-2021 (US$ million, AGR%)
Figure 163 Nihon Kohden Corporation: Net Revenue, 2017-2021 (US$ million, AGR%)
Figure 164 Nihon Kohden Corporation: Gross Profit, 2017-2021 (US$ million, AGR%)
Figure 165 Nihon Kohden Corporation: Operational Income, 2017-2021 (US$ million, AGR%)
Figure 166 Nihon Kohden Corporation: EBITDA, 2017-2021 (US$ million, AGR%)
Figure 167 GE Healthcare: Net Revenue, 2017-2021 (US$ million, AGR%)
Figure 168 GE Healthcare: Gross Profit, 2017-2021 (US$ million, AGR%)
Figure 169 GE Healthcare: Operational Income, 2017-2021 (US$ million, AGR%)
Figure 170 GE Healthcare: EBITDA, 2017-2021 (US$ million, AGR%)
Figure 171 Medtronic: Net Revenue, 2017-2021 (US$ million, AGR%)
Figure 172 Medtronic: Gross Profit, 2017-2021 (US$ million, AGR%)
Figure 173 Medtronic: Operational Income, 2017-2021 (US$ million, AGR%)
Figure 174 Medtronic: EBITDA, 2017-2021 (US$ million, AGR%)
Figure 175 Edwards Lifesciences Corporation: Net Revenue, 2017-2021 (US$ million, AGR%)
Figure 176 Edwards Lifesciences Corporation: Gross Profit, 2017-2021 (US$ million, AGR%)
Figure 177 Edwards Lifesciences Corporation: Operational Income, 2017-2021 (US$ million, AGR%)
Figure 178 Edwards Lifesciences Corporation: EBITDA, 2017-2021 (US$ million, AGR%)
Figure 179 Masimo Corporation: Net Revenue, 2017-2021 (US$ million, AGR%)
Figure 180 Masimo Corporation: Gross Profit, 2017-2021 (US$ million, AGR%)
Figure 181 Masimo Corporation: Operational Income, 2017-2021 (US$ million, AGR%)
Figure 182 Masimo Corporation: EBITDA, 2017-2021 (US$ million, AGR%)
ページTOPに戻る
Summary
Report Details
The Wearable Brain Devices Market Report 2023-2033: This report will prove invaluable to leading firms striving for new revenue pockets if they wish to better understand the industry and its underlying dynamics. It will be useful for companies that would like to expand into different industries or to expand their existing operations in a new region.
Market Is Expected to Rise as More People Develop Neurological Conditions
The market is expected to rise as more people develop neurological conditions such epilepsy, Parkinson’s disease, and Alzheimer’s disease. Other important drivers supporting the market’s expansion are the Asia Pacific region’s rapidly expanding elderly population, particularly in nations like Japan, India, and China, as well as speedy technology advancements. The ability to research the brain and assist in the treatment of many brain ailments and diseases has been made possible by contemporary technical breakthroughs in portable technologies.
The cost of brain dysfunction and neurological diseases is predicted to rise steadily over time, as is the demand for medical resources. Thanks to recent advancements in brain imaging technology, the brain and its functions may now be seen in high detail. For instance, near-infrared functional spectroscopy is a non-invasive imaging method that makes use of variations in haemoglobin light absorption patterns to estimate the relative concentration of haemoglobin in the brain. A rising market for such devices is a fact due to the frequency of neurological illnesses, the development of technology, concurrent increases in stress, and changes in lifestyle.
What Questions Should You Ask before Buying a Market Research Report?
• How is the wearable brain devices market evolving?
• What is driving and restraining the wearable brain devices market?
• How will each wearable brain devices submarket segment grow over the forecast period and how much revenue will these submarkets account for in 2033?
• How will the market shares for each wearable brain devices submarket develop from 2023 to 2033?
• What will be the main driver for the overall market from 2023 to 2033?
• Will leading wearable brain devices markets broadly follow the macroeconomic dynamics, or will individual national markets outperform others?
• How will the market shares of the national markets change by 2033 and which geographical region will lead the market in 2033?
• Who are the leading players and what are their prospects over the forecast period?
• What are the wearable brain devices projects for these leading companies?
• How will the industry evolve during the period between 2023 and 2033? What are the implications of wearable brain devices projects taking place now and over the next 10 years?
• Is there a greater need for product commercialisation to further scale the wearable brain devices market?
• Where is the wearable brain devices market heading and how can you ensure you are at the forefront of the market?
• What are the best investment options for new product and service lines?
• What are the key prospects for moving companies into a new growth path and C-suite?
You need to discover how this will impact the wearable brain devices market today, and over the next 10 years:
• Our 308-page report provides 144 tables and 183 charts/graphs exclusively to you.
• The report highlights key lucrative areas in the industry so you can target them – NOW.
• It contains in-depth analysis of global, regional and national sales and growth.
• It highlights for you the key successful trends, changes and revenue projections made by your competitors.
This report tells you TODAY how the wearable brain devices market will develop in the next 10 years, and in line with the variations in COVID-19 economic recession and bounce. This market is more critical now than at any point over the last 10 years.
Forecasts to 2033 and other analyses reveal commercial prospects
• In addition to revenue forecasting to 2033, our new study provides you with recent results, growth rates, and market shares.
• You will find original analyses, with business outlooks and developments.
• Discover qualitative analyses (including market dynamics, drivers, opportunities, restraints and challenges), cost structure, impact of rising wearable brain devices prices and recent developments.
This report includes data analysis and invaluable insight into how COVID-19 will affect the industry and your company. Four COVID-19 recovery patterns and their impact, namely, “V”, “L”, “W” and “U” are discussed in this report.
Segments Covered in the Report
Market Segment by Product Type
• Conventional Devices
• Implantable Devices
Market Segment by Technology
• Vagus Nerve Stimulation (VNS)
• Responsive Neurostimulation
• Deep Brain Stimulation
Market Segment by Channel Type
• 32-Channel Type
• 12-Channel Type
• 14-Channel Type
• Multi-channels
Market Segment by End-user
• Hospitals & Clinics
• Neurology Centers
• Homecare Settings
• Intensive Care Units
• Other End-user
Market Segment by Medical Setting
• Epilepsy
• Sleep Disorders
• Parkinson’s Disease
• Traumatic Brain Injury (TBI)
• Alzheimer
• Other Medical Setting
In addition to the revenue predictions for the overall world market and segments, you will also find revenue forecasts for four regional and 20 leading national markets:
North America
• U.S.
• Canada
Europe
• Germany
• Spain
• United Kingdom
• France
• Italy
• Rest of Europe
Asia Pacific
• China
• Japan
• India
• Australia
• South Korea
• Rest of Asia Pacific
Middle East & Africa
• GCC
• South Africa
• Rest of Middle East & Africa
Latin America
• Brazil
• Mexico
• Rest of Latin America
The report also includes profiles and for some of the leading companies in the Wearable Brain Devices Market, 2023 to 2033, with a focus on this segment of these companies’ operations.
Leading companies and the potential for market growth
• Advanced Brain Monitoring
• Cadwell Industries
• Compumedics, Ltd.
• Edwards Lifesciences Corporation
• GE Healthcare
• Koninklijke Philips N.V.( Philips Healthcare)
• Masimo Corporation
• Medtronic plc
• Nihon Kohden Corporation
• Siemens Healthineers
Overall world revenue for Wearable Brain Devices Market, 2023 to 2033 in terms of value the market will surpass US$303.6 million in 2023, our work calculates. We predict strong revenue growth through to 2033. Our work identifies which organizations hold the greatest potential. Discover their capabilities, progress, and commercial prospects, helping you stay ahead.
How will the Wearable Brain Devices Market, 2023 to 2033 report help you?
In summary, our 300+ page report provides you with the following knowledge:
• Revenue forecasts to 2033 for Wearable Brain Devices Market, 2023 to 2033 Market, with forecasts for product type, technology, channel type, end-user, medical setting and company size, each forecast at a global and regional level – discover the industry’s prospects, finding the most lucrative places for investments and revenues.
• Revenue forecasts to 2033 for four regional and 20 key national markets – See forecasts for the Wearable Brain Devices Market, 2023 to 2033 market in North America, Europe, Asia-Pacific and Latin America, and Middle East & Africa. Also forecasted is the market in the US, Canada, Mexico, Brazil, Germany, France, UK, Italy, China, India, Japan, and Australia among other prominent economies.
• Prospects for established firms and those seeking to enter the market – including company profiles for 10 of the major companies involved in the Wearable Brain Devices Market, 2023 to 2033.
Find quantitative and qualitative analyses with independent predictions. Receive information that only our report contains, staying informed with invaluable business intelligence.
Information found nowhere else
With our new report, you are less likely to fall behind in knowledge or miss out on opportunities. See how our work could benefit your research, analyses, and decisions. Visiongain’s study is for everybody needing commercial analyses for the Wearable Brain Devices Market, 2023 to 2033, market-leading companies. You will find data, trends and predictions.
ページTOPに戻る
Table of Contents
Table of Contents
1 Report Overview
1.1 Objectives of the Study
1.2 Introduction to Wearable Brain Devices Market
1.3 What This Report Delivers
1.4 Why You Should Read This Report
1.5 Key Questions Answered by this Analytical Report Include:
1.6 Who is This Report For?
1.7 Research Methodology
1.7.1 Market Definitions
1.7.2 Market Evaluation & Forecasting Methodology
1.7.3 Data Validation
1.8 Frequently Asked Questions (FAQs)
1.9 Associated Visiongain Reports
1.10 About Visiongain
2 Executive Summary
3 Premium Insights
3.1 Geographical Snapshot: Global Wearable Brain Devices Market
3.2 Product Type Segment: Market Attractiveness Index
3.3 Channel Type Segment: Market Attractiveness Index
3.4 End-users Segment: Market Attractiveness Index
3.5 Medical Setting Segment: Market Attractiveness Index
4 Market Overview
4.1 Key Findings
4.2 Market Dynamics
4.2.1 Market Driving Factors
4.2.2 Market Restraining Factors
4.2.3 Market Opportunities
4.3 COVID-19 Impact Analysis
4.4 Porter’s Five Forces Analysis
4.4.1 Buyer Power
4.4.2 Supplier Power
4.4.3 Competitive Rivalry
4.4.4 Threat from Substitutes
4.4.5 Threat of New Entrants
4.5 PESTLE Analysis
4.5.1 Political Factors
4.5.2 Economic Factors
4.5.3 Social Factors
4.5.4 Technological Factors
4.5.5 Legal Factors
4.5.6 Environmental Factors
5 Global Wearable Brain Devices Market Analysis by Product Type
5.1 Key Findings
5.2 Global Market Outlook
5.3 Global Wearable Brain Devices by Product Market Attractiveness Index
5.4 Regional Market Size Estimation and Forecast
6 Global Wearable Brain Devices Market Analysis by Technology
6.1 Key Findings
6.2 Global Market Outlook
6.3 Global Wearable Brain Devices by Technology Market Attractiveness Index
6.4 Regional Market Size Estimation and Forecast
6.5 Technology based on Vagus Nerve Stimulation (VNS)
7 Global Wearable Brain Devices Market Analysis by Channel Type
7.1 Key Findings
7.2 Global Market Outlook
7.3 Global Wearable Brain Devices by Channel Type Market Attractiveness Index
8 Global Wearable Brain Devices Market Analysis by End-User
8.1 Key Findings
8.2 Global Market Outlook
8.3 Global Wearable Brain Devices by End-User Market Attractiveness Index
9 Global Wearable Brain Devices Market Analysis by Medical Setting
9.1 9.1 Key Findings
9.2 Global Market Outlook
9.3 Global Wearable Brain Devices by Medical Setting Type Market Attractiveness Index
10 North America Wearable Brain Devices Market Analysis
10.1 Key Findings
10.2 Overview
10.3 North America Wearable Brain Devices Market Attractiveness Index
10.4 North America Wearable Brain Devices Technologies Market Size and Forecast by Value
10.5 North America Wearable Brain Devices Market Size Estimation and Forecast by Country
10.6 North America Wearable Brain Devices Market Size Estimation and Forecast by Product Type
10.7 North America Wearable Brain Devices Market Size Estimation and Forecast by Technology
10.8 North America Wearable Brain Devices Market Size Estimation and Forecast by Channel Type
10.9 North America Wearable Brain Devices Market Size Estimation and Forecast by End-User
10.10 North America Wearable Brain Devices Market Size Estimation and Forecast by Medical Settings
10.11 US Market Analysis
10.12 Canada Market Analysis
11 Europe Wearable Brain Devices Market Analysis
11.1 Key Findings
11.2 Overview
11.3 Europe Wearable Brain Devices Market Attractiveness Index
11.4 Europe Wearable Brain Devices Technologies Market Size and Forecast by Value
11.5 Europe Wearable Brain Devices Technologies Market Size and Forecast by Country
11.6 Europe Wearable Brain Devices Technologies Market Size and Forecast by Product Type
11.7 Europe Wearable Brain Devices Technologies Market Size and Forecast by Technology
11.8 Europe Wearable Brain Devices Technologies Market Size and Forecast by Channel Type
11.9 Europe Wearable Brain Devices Technologies Market Size and Forecast by End-User
11.10 Europe Wearable Brain Devices Technologies Market Size and Forecast by Medical Setting
11.11 Germany Market Analysis
11.12 France Market Analysis
11.13 UK Market Analysis
11.14 Italy Market Analysis
11.15 Spain Market Analysis
11.16 Rest of Europe Wearable Brain Devices Market Analysis
12 Asia-Pacific Wearable Brain Devices Market Analysis
12.1 Key Finding
12.2 Overview
12.3 Asia-Pacific Wearable Brain Devices Market Attractiveness Index
12.4 Asia-Pacific Wearable Brain Devices Technologies Market Size and Forecast by Value
12.5 Asia-Pacific Wearable Brain Devices Technologies Market Size and Forecast by Country
12.6 Asia-Pacific Wearable Brain Devices Technologies Market Size and Forecast by Product Type
12.7 Asia-Pacific Wearable Brain Devices Technologies Market Size and Forecast by Technology
12.8 Asia-Pacific Wearable Brain Devices Technologies Market Size and Forecast by Channel Type
12.9 Asia-Pacific Wearable Brain Devices Technologies Market Size and Forecast by End-User
12.10 Asia-Pacific Wearable Brain Devices Technologies Market Size and Forecast by Medical Setting
12.11 China Market Analysis
12.12 India Market Analysis
12.12.1 Indian brands continue to rule the wearable industry in India.
12.13 Japan Market Analysis
12.14 South Korea Market Analysis
12.15 Australia Market Analysis
12.16 Rest of Asia-Pacific Market Analysis
13 Middle-East & Africa Wearable Brain Devices Market Analysis
13.1 Key Finding
13.2 Overview
13.3 Middle-East & Africa Wearable Brain Devices Market Attractiveness Index
13.4 Middle-East & Africa Wearable Brain Devices Technologies Market Size and Forecast by Value
13.5 Middle-East & Africa Wearable Brain Devices Technologies Market Size and Forecast by Country
13.6 Middle-East & Africa Wearable Brain Devices Technologies Market Size and Forecast by Product Type
13.7 Middle-East & Africa Wearable Brain Devices Technologies Market Size and Forecast by Technology
13.8 Middle-East & Africa Wearable Brain Devices Technologies Market Size and Forecast by Channel Type
13.9 Middle-East & Africa Wearable Brain Devices Technologies Market Size and Forecast by End-User
13.10 Middle-East & Africa Wearable Brain Devices Technologies Market Size and Forecast by Medical Setting
13.11 GCC Market Analysis
13.12 South Africa Market Analysis
14 Latin America Wearable Brain Devices Market Analysis
14.1 Key Findings
14.2 Overview
14.3 Latin America Wearable Brain Devices Market Attractiveness Index
14.4 Latin America Wearable Brain Devices Technologies Market Size and Forecast by Value
14.5 Latin America Wearable Brain Devices Technologies Market Size and Forecast by Country
14.6 Latin America Wearable Brain Devices Technologies Market Size and Forecast by Product Type
14.7 Latin America Wearable Brain Devices Technologies Market Size and Forecast by Technology
14.8 Latin America Wearable Brain Devices Technologies Market Size and Forecast by Channel Type
14.9 Latin America Wearable Brain Devices Technologies Market Size and Forecast by End-User
14.10 Latin America Wearable Brain Devices Technologies Market Size and Forecast by Medical Setting
14.11 Brazil Market Analysis
14.12 Mexico Market Analysis
14.13 Rest of Latin America Market Analysis
15 Competitive Landscape
15.1 Key Business Strategy Analysis- Acquisition
15.2 Key Business Strategy Analysis- New Product Launch
15.3 Key Business Strategy Analysis- Agreement
15.4 Key Business Strategy Analysis- Partnership
15.5 Key Business Strategy Analysis- Collaboration
15.6 Key Business Strategy Analysis- Expansion
16 Company Profiles
16.1 Nihon Kohden Corporation
16.1.1 Company Snapshot
16.1.2 Company Overview
16.1.3 Product Benchmarking
16.1.4 Strategic Outlook
16.2 Koninklijke Philips N.V.( Philips Healthcare)
16.2.1 Company Snapshot
16.2.2 Company Overview
16.2.3 Financial Analysis
16.2.4 Financial Analysis
16.2.5 Strategic Outlook
16.3 GE Healthcare
16.3.1 Company Snapshot
16.3.2 Company Overview
16.3.3 Financial Analysis
16.3.4 Product Benchmarking
16.3.5 Strategic Outlook
16.4 Siemens Healthineers
16.4.1 Company Snapshot
16.4.2 Company Overview
16.4.3 Product Benchmarking
16.4.4 Strategic Outlook
16.5 Compumedics, Ltd.
16.5.1 Company Snapshot
16.5.2 Company Overview
16.5.3 Product Benchmarking
16.5.4 Strategic Outlook
16.6 Medtronic plc
16.6.1 Company Snapshot
16.6.2 Company Overview
16.6.3 Financial Analysis
16.6.4 Product Benchmarking
16.6.5 Strategic Outlook
16.7 Edwards Lifesciences Corporation
16.7.1 Company Snapshot
16.7.2 Company Overview
16.7.3 Financial Analysis
16.7.4 Product Benchmarking
16.7.5 Strategic Outlook
16.8 Advanced Brain Monitoring
16.8.1 Company Snapshot
16.8.2 Company Overview
16.8.3 Product Benchmarking
16.9 Masimo Corporation
16.9.1 Company Snapshot
16.9.2 Company Overview
16.9.3 Financial Analysis
16.9.4 Product Benchmarking
16.9.5 Strategic Outlook
16.10 Cadwell Industries
16.10.1 Company Snapshot
16.10.2 Company Overview
16.10.3 Product Benchmarking
16.10.4 Strategic Outlook
17 Conclusion and Recommendations
17.1 Concluding Remarks from Visiongain
17.2 Recommendations for Market Players
List of Tables
Table 1 Global Wearable Brain Devices Market Snapshot, 2023 & 2033 (US$ million, CAGR %)
Table 2 Global Wearable Brain Devices Market Forecast, 2023-2033 (US$ Mn, AGR (%), CAGR (%)) (V-Shaped Recovery Scenario)
Table 3 Global Wearable Brain Devices Market by Region, 2023-2033 (US$ Mn, AGR (%), CAGR (%)) (V-Shaped Recovery Scenario)
Table 4 Global Wearable Brain Devices Market Forecast, 2023-2033 (US$ Mn, AGR (%), CAGR (%)) (U-Shaped Recovery Scenario)
Table 5 Global Wearable Brain Devices Market by Region, 2023-2033 (US$ Mn, AGR (%), CAGR (%)) (U-Shaped Recovery Scenario)
Table 6 Global Wearable Brain Devices Market Forecast, 2023-2033 (US$ Mn, AGR (%), CAGR (%)) (W-Shaped Recovery Scenario)
Table 7 Global Wearable Brain Devices Market by Region, 2023-2033 (US$ Mn, AGR (%), CAGR (%)) (W-Shaped Recovery Scenario)
Table 8 Global Wearable Brain Devices Market Forecast, 2023-2033 (US$ Mn, AGR (%), CAGR (%)) (L-Shaped Recovery Scenario)
Table 9 Global Wearable Brain Devices Market by Region, 2023-2033 (US$ Mn, AGR (%), CAGR (%)) (L-Shaped Recovery Scenario)
Table 10 Global Wearable Brain Devices Market by Product Type, 2023-2033 (US$ Mn, AGR (%), CAGR (%))
Table 11 Global Conventional Devices Market Forecast, 2023-2033 (US$ Mn, AGR (%), CAGR (%))
Table 12 Global Conventional Devices Market by Region, 2023-2033 (US$ Mn, AGR (%), CAGR (%))
Table 13 Global Implantable Devices Market Forecast, 2023-2033 (US$ Mn, AGR (%), CAGR (%))
Table 14 Global Implantable Devices Market by Region, 2023-2033 (US$ Mn, AGR (%), CAGR (%))
Table 15 Global Wearable Brain Devices Market by Technology, 2023-2033 (US$ Mn, AGR (%), CAGR (%))
Table 16 Global Vagus Nerve Stimulation (VNS) Market Forecast, 2023-2033 (US$ Mn, AGR (%), CAGR (%))
Table 17 Global Vagus Nerve Stimulation (VNS) Market by Region, 2023-2033 (US$ Mn, AGR (%), CAGR (%))
Table 18 Global Responsive Neurostimulation Market Forecast, 2023-2033 (US$ Mn, AGR (%), CAGR (%))
Table 19 Global Responsive Neurostimulation Market by Region, 2023-2033 (US$ Mn, AGR (%), CAGR (%))
Table 20 Global Deep Brain Stimulation Market Forecast, 2023-2033 (US$ Mn, AGR (%), CAGR (%))
Table 21 Global Deep Brain Stimulation Market by Region, 2023-2033 (US$ Mn, AGR (%), CAGR (%))
Table 22 Global Wearable Brain Devices Market by Channel Type, 2023-2033 (US$ Mn, AGR (%), CAGR (%))
Table 23 Global 32-Channel Type Market Forecast, 2023-2033 (US$ Mn, AGR (%), CAGR (%))
Table 24 Global 32-Channel Type Market by Region, 2023-2033 (US$ Mn, AGR (%), CAGR (%))
Table 25 Global 12-Channel Type Market Forecast, 2023-2033 (US$ Mn, AGR (%), CAGR (%))
Table 26 Global 12-Channel Type Market by Region, 2023-2033 (US$ Mn, AGR (%), CAGR (%))
Table 27 Global 14-Channel Type Market Forecast, 2023-2033 (US$ Mn, AGR (%), CAGR (%))
Table 28 Global 14-Channel Type Market by Region, 2023-2033 (US$ Mn, AGR (%), CAGR (%))
Table 29 Global Multi-channels Market Forecast, 2023-2033 (US$ Mn, AGR (%), CAGR (%))
Table 30 Global Multi-channels Market by Region, 2023-2033 (US$ Mn, AGR (%), CAGR (%))
Table 31 Global Wearable Brain Devices Market by End-user, 2023-2033 (US$ Mn, AGR (%), CAGR (%))
Table 32 Global Hospitals & Clinics Market Forecast, 2023-2033 (US$ Mn, AGR (%), CAGR (%))
Table 33 Global Hospitals & Clinics Market by Region, 2023-2033 (US$ Mn, AGR (%), CAGR (%))
Table 34 Global Neurology Centers Market Forecast, 2023-2033 (US$ Mn, AGR (%), CAGR (%))
Table 35 Global Neurology Centers Market by Region, 2023-2033 (US$ Mn, AGR (%), CAGR (%))
Table 36 Global Homecare Settings Market Forecast, 2023-2033 (US$ Mn, AGR (%), CAGR (%))
Table 37 Global Homecare Settings Market by Region, 2023-2033 (US$ Mn, AGR (%), CAGR (%))
Table 38 Global Intensive Care Units Market Forecast, 2023-2033 (US$ Mn, AGR (%), CAGR (%))
Table 39 Global Intensive Care Units Market by Region, 2023-2033 (US$ Mn, AGR (%), CAGR (%))
Table 40 Global Other End-user Market Forecast, 2023-2033 (US$ Mn, AGR (%), CAGR (%))
Table 41 Global Other End-user Market by Region, 2023-2033 (US$ Mn, AGR (%), CAGR (%))
Table 42 Global Wearable Brain Devices Market by Medical Setting, 2023-2033 (US$ Mn, AGR (%), CAGR (%))
Table 43 Global Epilepsy Market Forecast, 2023-2033 (US$ Mn, AGR (%), CAGR (%))
Table 44 Global Epilepsy Market by Region, 2023-2033 (US$ Mn, AGR (%), CAGR (%))
Table 45 Global Sleep Disorders Market Forecast, 2023-2033 (US$ Mn, AGR (%), CAGR (%))
Table 46 Global Sleep Disorders Market by Region, 2023-2033 (US$ Mn, AGR (%), CAGR (%))
Table 47 Global Parkinson’s Disease Market Forecast, 2023-2033 (US$ Mn, AGR (%), CAGR (%))
Table 48 Global Parkinson’s Disease Market by Region, 2023-2033 (US$ Mn, AGR (%), CAGR (%))
Table 49 Global Traumatic Brain Injury (TBI) Market Forecast, 2023-2033 (US$ Mn, AGR (%), CAGR (%))
Table 50 Global Traumatic Brain Injury (TBI) Market by Region, 2023-2033 (US$ Mn, AGR (%), CAGR (%))
Table 51 Global Alzheimer Market Forecast, 2023-2033 (US$ Mn, AGR (%), CAGR (%))
Table 52 Global Alzheimer Market by Region, 2023-2033 (US$ Mn, AGR (%), CAGR (%))
Table 53 Global Other Medical Setting Market Forecast, 2023-2033 (US$ Mn, AGR (%), CAGR (%))
Table 54 Global Other Medical Setting Market by Region, 2023-2033 (US$ Mn, AGR (%), CAGR (%))
Table 55 North America Wearable Brain Devices Market by Value, 2023-2033 (US$ Mn, AGR (%), CAGR (%))
Table 56 North America Wearable Brain Devices Market by Country, 2023-2033 (US$ Mn, AGR (%), CAGR (%))
Table 57 North America Wearable Brain Devices Market by Product Type, 2023-2033 (US$ Mn, AGR (%), CAGR (%))
Table 58 North America Wearable Brain Devices Market by Technology, 2023-2033 (US$ Mn, AGR (%), CAGR (%))
Table 59 North America Wearable Brain Devices Market by Channel Type, 2023-2033 (US$ Mn, AGR (%), CAGR (%))
Table 60 North America Wearable Brain Devices Market by End-user, 2023-2033 (US$ Mn, AGR (%), CAGR (%))
Table 61 North America Wearable Brain Devices Market by Medical Setting, 2023-2033 (US$ Mn, AGR (%), CAGR (%))
Table 62 US Wearable Brain Devices Market by Value, 2023-2033 (US$ Mn, AGR (%), CAGR (%))
Table 63 Canada Wearable Brain Devices Market by Value, 2023-2033 (US$ Mn, AGR (%), CAGR (%))
Table 64 Europe Wearable Brain Devices Market by Value, 2023-2033 (US$ Mn, AGR (%), CAGR (%))
Table 65 Europe Wearable Brain Devices Market by Country, 2023-2033 (US$ Mn, AGR (%), CAGR (%))
Table 66 Europe Wearable Brain Devices Market by Product Type, 2023-2033 (US$ Mn, AGR (%), CAGR (%))
Table 67 Europe Wearable Brain Devices Market by Technology, 2023-2033 (US$ Mn, AGR (%), CAGR (%))
Table 68 Europe Wearable Brain Devices Market by Channel Type, 2023-2033 (US$ Mn, AGR (%), CAGR (%))
Table 69 Europe Wearable Brain Devices Market by End-user, 2023-2033 (US$ Mn, AGR (%), CAGR (%))
Table 70 Europe Wearable Brain Devices Market by Medical Setting, 2023-2033 (US$ Mn, AGR (%), CAGR (%))
Table 71 Germany Wearable Brain Devices Market by Value, 2023-2033 (US$ Mn, AGR (%), CAGR (%))
Table 72 France Wearable Brain Devices Market by Value, 2023-2033 (US$ Mn, AGR (%), CAGR(%))
Table 73 UK Wearable Brain Devices Market by Value, 2023-2033 (US$ Mn, AGR (%), CAGR (%))
Table 74 Italy Wearable Brain Devices Market by Value, 2023-2033 (US$ Mn, AGR (%), CAGR (%))
Table 75 Spain Wearable Brain Devices Market by Value, 2023-2033 (US$ Mn, AGR (%), CAGR (%))
Table 76 Rest of Europe Wearable Brain Devices Market by Value, 2023-2033 (US$ Mn, AGR (%), CAGR (%))
Table 77 Asia-Pacific Wearable Brain Devices Market by Value, 2023-2033 (US$ Mn, AGR (%), CAGR (%))
Table 78 Asia-Pacific Wearable Brain Devices Market by Country, 2023-2033 (US$ Mn, AGR (%), CAGR (%))
Table 79 Asia-Pacific Wearable Brain Devices Market by Product Type, 2023-2033 (US$ Mn, AGR (%), CAGR (%))
Table 80 Asia-Pacific Wearable Brain Devices Market by Technology, 2023-2033 (US$ Mn, AGR (%), CAGR (%))
Table 81 Asia-Pacific Wearable Brain Devices Market by Channel Type, 2023-2033 (US$ Mn, AGR (%), CAGR (%))
Table 82 Asia-Pacific Wearable Brain Devices Market by End-user, 2023-2033 (US$ Mn, AGR (%), CAGR (%))
Table 83 Asia-Pacific Wearable Brain Devices Market by Medical Setting, 2023-2033 (US$ Mn, AGR (%), CAGR (%))
Table 84 China Wearable Brain Devices Market by Value, 2023-2033 (US$ Mn, AGR (%), CAGR (%))
Table 85 India Wearable Brain Devices Market by Value, 2023-2033 (US$ Mn, AGR (%), CAGR (%))
Table 86 Japan Wearable Brain Devices Market by Value, 2023-2033 (US$ Mn, AGR (%), CAGR (%))
Table 87 South Korea Wearable Brain Devices Market by Value, 2023-2033 (US$ Mn, AGR (%), CAGR (%))
Table 88 Australia Wearable Brain Devices Market by Value, 2023-2033 (US$ Mn, AGR (%), CAGR (%))
Table 89 Rest of Asia-Pacific Wearable Brain Devices Market by Value, 2023-2033 (US$ Mn, AGR (%), CAGR (%))
Table 90 Middle East & Africa Wearable Brain Devices Market by Value, 2023-2033 (US$ Mn, AGR (%), CAGR (%))
Table 91 Middle East & Africa Wearable Brain Devices Market by Country, 2023-2033 (US$ Mn, AGR (%), CAGR (%))
Table 92 Middle East & Africa Wearable Brain Devices Market by Product Type, 2023-2033 (US$ Mn, AGR (%), CAGR (%))
Table 93 Middle East & Africa Wearable Brain Devices Market by Technology, 2023-2033 (US$ Mn, AGR (%), CAGR (%))
Table 94 Middle East & Africa Wearable Brain Devices Market by Channel Type, 2023-2033 (US$ Mn, AGR (%), CAGR (%))
Table 95 Middle East & Africa Wearable Brain Devices Market by End-user, 2023-2033 (US$ Mn, AGR (%), CAGR (%))
Table 96 Middle East & Africa Wearable Brain Devices Market by Medical Setting, 2023-2033 (US$ Mn, AGR (%), CAGR (%))
Table 97 GCC Wearable Brain Devices Market by Value, 2023-2033 (US$ Mn, AGR (%), CAGR (%))
Table 98 South Africa Wearable Brain Devices Market by Value, 2023-2033 (US$ Mn, AGR (%), CAGR (%))
Table 99 Latin America Wearable Brain Devices Market by Value, 2023-2033 (US$ Mn, AGR (%), CAGR (%))
Table 100 Latin America Wearable Brain Devices Market by Country, 2023-2033 (US$ Mn, AGR (%), CAGR (%))
Table 101 Latin America Wearable Brain Devices Market by Product Type, 2023-2033 (US$ Mn, AGR (%), CAGR (%))
Table 102 Latin America Wearable Brain Devices Market by Technology, 2023-2033 (US$ Mn, AGR (%), CAGR (%))
Table 103 Latin America Wearable Brain Devices Market by Channel Type, 2023-2033 (US$ Mn, AGR (%), CAGR (%))
Table 104 Latin America Wearable Brain Devices Market by End-user, 2023-2033 (US$ Mn, AGR (%), CAGR (%))
Table 105 Latin America Wearable Brain Devices Market by Medical Setting, 2023-2033 (US$ Mn, AGR (%), CAGR (%))
Table 106 Brazil Wearable Brain Devices Market by Value, 2023-2033 (US$ Mn, AGR (%), CAGR (%))
Table 107 Mexico Wearable Brain Devices Market by Value, 2023-2033 (US$ Mn, AGR (%), CAGR (%))
Table 108 Rest of Latin America Wearable Brain Devices Market by Value, 2023-2033 (US$ Mn, AGR (%), CAGR (%))
Table 109 Key Business Strategies Adopted by Key Players in Global Wearable Brain Devices Market
Table 110 Key Business Strategies Adopted by Key Players in Global Wearable Brain Devices Market
Table 111 Key Business Strategies Adopted by Key Players in Global Wearable Brain Devices Market
Table 112 Key Business Strategies Adopted by Key Players in Global Wearable Brain Devices Market
Table 113 Key Business Strategies Adopted by Key Players in Global Wearable Brain Devices Market
Table 114 Key Business Strategies Adopted by Key Players in Global Wearable Brain Devices Market
Table 115 Nihon Kohden Corporation: Key Details, (CEO, HQ, Revenue, Founded, No. of Employees, Company Type, Website, Business Segment)
Table 116 Nihon Kohden Corporation: Product Benchmarking
Table 117 Nihon Kohden Corporation: Strategic Outlook
Table 118 Koninklijke Philips N.V. (Philips healthcare): Key Details, (CEO, HQ, Revenue, Founded, No. of Employees, Company Type, Website, Business Segment)
Table 119 Koninklijke Philips N.V. (Philips healthcare): Product Benchmarking
Table 120 Koninklijke Philips N.V. (Philips healthcare): Strategic Outlook
Table 121 GE Healthcare: Key Details, (CEO, HQ, Revenue, Founded, No. of Employees, Company Type, Website, Business Segment)
Table 122 GE Healthcare: Product Benchmarking
Table 123 GE Healthcare: Strategic Outlook
Table 124 Siemens Healthineers: Key Details, (CEO, HQ, Revenue, Founded, No. of Employees, Company Type, Website, Business Segment)
Table 125 Siemens Healthineers: Product Benchmarking
Table 126 Siemens Healthineers: Strategic Outlook
Table 127 Compumedics Limited: Key Details, (CEO, HQ, Revenue, Founded, No. of Employees, Company Type, Website, Business Segment)
Table 128 Compumedics Limited: Product Benchmarking
Table 129 Compumedics Limited: Strategic Outlook
Table 130 Medtronic: Key Details, (CEO, HQ, Revenue, Founded, No. of Employees, Company Type, Website, Business Segment)
Table 131 Medtronic: Product Benchmarking
Table 132 Medtronic: Strategic Outlook
Table 133 Edwards Lifesciences Corporation: Key Details, (CEO, HQ, Revenue, Founded, No. of Employees, Company Type, Website, Business Segment)
Table 134 Edwards Lifesciences Corporation: Product Benchmarking
Table 135 Edwards Lifesciences Corporation: Strategic Outlook
Table 136 Advanced Brain Monitoring: Key Details, (CEO, HQ, Revenue, Founded, No. of Employees, Company Type, Website, Business Segment)
Table 137 Advanced Brain Monitoring: Product Benchmarking
Table 138 Masimo Corporation: Key Details, (CEO, HQ, Revenue, Founded, No. of Employees, Company Type, Website, Business Segment)
Table 139 Masimo Corporation: Product Benchmarking
Table 140 Masimo Corporation: Strategic Outlook
Table 141 Cadwell Industries: Key Details, (CEO, HQ, Revenue, Founded, No. of Employees, Company Type, Website, Business Segment)
Table 142 Cadwell Industries: Product Benchmarking
Table 143 Cadwell Industries: Strategic Outlook
List of Figures
Figure 1 Global Wearable Brain Devices Market Segmentation
Figure 2 Breakdown of Primary Interviews: By Company Type, Designation, & Region
Global Wearable Brain Devices Market Forecast by Region: Market Attractiveness Index
Global Wearable Brain Devices Market by Product Type Segment: Market Attractiveness Index
Global Wearable Brain Devices Market by Channel Type Segment: Market Attractiveness Index
Global Wearable Brain Devices Market by End-User Segment: Market Attractiveness Index
Global Wearable Brain Devices Market by Medical Setting Segment: Market Attractiveness Index
Figure 3 Global Wearable Brain Devices Market: Market Dynamics
Figure 4 Global COVID Impact Analysis: Wearable Brain Devices Market Recovery Scenarios
Figure 5 Global Wearable Brain Devices Market Forecast, 2023-2033 (US$ Mn, AGR (%)) (V-Shaped Recovery Scenario)
Figure 6 Global Wearable Brain Devices Market by Region, 2023-2033 (US$ Mn, AGR (%)) (V-Shaped Recovery Scenario)
Figure 7 Global Wearable Brain Devices Market Forecast, 2023-2033 (US$ Mn, AGR (%)) (U-Shaped Recovery Scenario)
Figure 8 Global Wearable Brain Devices Market by Region, 2023-2033 (US$ Mn, AGR (%)) (U-Shaped Recovery Scenario)
Figure 9 Global Wearable Brain Devices Market Forecast, 2023-2033 (US$ Mn, AGR (%)) (W-Shaped Recovery Scenario)
Figure 10 Global Wearable Brain Devices Market by Region, 2023-2033 (US$ Mn, AGR (%)) (W-Shaped Recovery Scenario)
Figure 11 Global Wearable Brain Devices Market Forecast, 2023-2033 (US$ Mn, AGR (%)) (L-Shaped Recovery Scenario)
Figure 12 Global Wearable Brain Devices Market by Region, 2023-2033 (US$ Mn, AGR (%)) (L-Shaped Recovery Scenario)
Figure 13 Global Wearable Brain Devices Market: Porter’s Five Forces Analysis
Figure 14 Global Wearable Brain Devices Market: PESTLE Analysis
Figure 15 Global Wearable Brain Devices Market by Product Market Attractiveness Index
Figure 16 Global Wearable Brain Devices Market Share by Product 2023 & 2033 (%)
Figure 17 Global Wearable Brain Devices Market by Product Type, 2023-2033 (US$ Mn, AGR (%))
Figure 18 Global Conventional Devices Market Forecast, 2023-2033 (US$ Mn, AGR (%))
Figure 19 Global Conventional Devices Market by Region, 2023-2033 (US$ Mn, AGR (%))
Figure 20 Global Implantable Devices Market Forecast, 2023-2033 (US$ Mn, AGR (%))
Figure 21 Global Implantable Devices Market by Region, 2023-2033 (US$ Mn, AGR (%))
Figure 22 Global Wearable Brain Devices Market by Technology Market Attractiveness Index
Figure 23 Global Wearable Brain Devices Market Share by Technology 2023 & 2033 (%)
Figure 24 Global Wearable Brain Devices Market by Technology, 2023-2033 (US$ Mn, AGR (%))
Figure 25 Global Vagus Nerve Stimulation (VNS) Market Forecast, 2023-2033 (US$ Mn, AGR (%))
Figure 26 Global Vagus Nerve Stimulation (VNS) Market by Region, 2023-2033 (US$ Mn, AGR (%))
Figure 27 Global Responsive Neurostimulation Market Forecast, 2023-2033 (US$ Mn, AGR (%))
Figure 28 Global Responsive Neurostimulation Market by Region, 2023-2033 (US$ Mn, AGR (%))
Figure 29 Global Deep Brain Stimulation Market Forecast, 2023-2033 (US$ Mn, AGR (%))
Figure 30 Global Deep Brain Stimulation Market by Region, 2023-2033 (US$ Mn, AGR (%))
Figure 31 Global Wearable Brain Devices Market by Channel Type Market Attractiveness Index
Figure 32 Global Wearable Brain Devices Market Share Forecast by Channel Type 2023 & 2033 (%)
Figure 33 Global Wearable Brain Devices Market by Channel Type, 2023-2033 (US$ Mn, AGR (%))
Figure 34 Global 32-Channel Type Market Forecast, 2023-2033 (US$ Mn, AGR (%))
Figure 35 Global 32-Channel Type Market by Region, 2023-2033 (US$ Mn, AGR (%))
Figure 36 Global 12-Channel Type Market Forecast, 2023-2033 (US$ Mn, AGR (%))
Figure 37 Global 12-Channel Type Market by Region, 2023-2033 (US$ Mn, AGR (%))
Figure 38 Global 14-Channel Type Market Forecast, 2023-2033 (US$ Mn, AGR (%))
Figure 39 Global 14-Channel Type Market by Region, 2023-2033 (US$ Mn, AGR (%))
Figure 40 Global Multi-channels Market Forecast, 2023-2033 (US$ Mn, AGR (%))
Figure 41 Global Multi-channels Market by Region, 2023-2033 (US$ Mn, AGR (%))
Figure 42 Global Wearable Brain Devices Market by End-User Market Attractiveness Index
Figure 43 Global Wearable Brain Devices Market Share Forecast by End-User 2023 & 2033 (%)
Figure 44 Global Wearable Brain Devices Market by End-user, 2023-2033 (US$ Mn, AGR (%))
Figure 45 Global Hospitals & Clinics Market Forecast, 2023-2033 (US$ Mn, AGR (%))
Figure 46 Global Hospitals & Clinics Market by Region, 2023-2033 (US$ Mn, AGR (%))
Figure 47 Global Neurology Centers Market Forecast, 2023-2033 (US$ Mn, AGR (%))
Figure 48 Global Neurology Centers Market by Region, 2023-2033 (US$ Mn, AGR (%))
Figure 49 Global Homecare Settings Market Forecast, 2023-2033 (US$ Mn, AGR (%))
Figure 50 Global Homecare Settings Market by Region, 2023-2033 (US$ Mn, AGR (%))
Figure 51 Global Intensive Care Units Market Forecast, 2023-2033 (US$ Mn, AGR (%))
Figure 52 Global Intensive Care Units Market by Region, 2023-2033 (US$ Mn, AGR (%))
Figure 53 Global Other End-user Market Forecast, 2023-2033 (US$ Mn, AGR (%))
Figure 54 Global Other End-user Market by Region, 2023-2033 (US$ Mn, AGR (%))
Figure 55 Global Wearable Brain Devices Market by Medical Setting Market Attractiveness Index
Figure 56 Global Wearable Brain Devices Market Share Forecast by Medical Setting 2023 & 2033 (%)
Figure 57 Global Wearable Brain Devices Market by Medical Setting, 2023-2033 (US$ Mn, AGR (%))
Figure 58 Global Epilepsy Market Forecast, 2023-2033 (US$ Mn, AGR (%))
Figure 59 Global Epilepsy Market by Region, 2023-2033 (US$ Mn, AGR (%))
Figure 60 Global Sleep Disorders Market Forecast, 2023-2033 (US$ Mn, AGR (%))
Figure 61 Global Sleep Disorders Market by Region, 2023-2033 (US$ Mn, AGR (%))
Figure 62 Global Parkinson’s Disease Market Forecast, 2023-2033 (US$ Mn, AGR (%))
Figure 63 Global Parkinson’s Disease Market by Region, 2023-2033 (US$ Mn, AGR (%))
Figure 64 Global Traumatic Brain Injury (TBI) Market Forecast, 2023-2033 (US$ Mn, AGR (%))
Figure 65 Global Traumatic Brain Injury (TBI) Market by Region, 2023-2033 (US$ Mn, AGR (%))
Figure 66 Global Alzheimer Market Forecast, 2023-2033 (US$ Mn, AGR (%))
Figure 67 Alzheimer Market by Region, 2023-2033 (US$ Mn, AGR (%))
Figure 68 Global Other Medical Setting Market Forecast, 2023-2033 (US$ Mn, AGR (%))
Figure 69 Global Other Medical Setting Market by Region, 2023-2033 (US$ Mn, AGR (%))
Figure 70 North America Wearable Brain Devices Market Attractiveness Index
Figure 71 North America Wearable Brain Devices Market by Value, 2023-2033 (US$ Mn, AGR (%))
Figure 72 North America Wearable Brain Devices Market by Country, 2023-2033 (US$ Mn, AGR (%))
Figure 73 North America Wearable Brain Devices Technologies Market Share Forecast by Country 2023, 2033 (%)
Figure 74 North America Wearable Brain Devices Market by Product Type, 2023-2033 (US$ Mn, AGR (%))
Figure 75 North America Wearable Brain Devices Technologies Market Share Forecast by Product Type 2023, 2033 (%)
Figure 76 North America Wearable Brain Devices Market by Technology, 2023-2033 (US$ Mn, AGR (%))
Figure 77 North America Wearable Brain Devices Technologies Market Share Forecast by Technology 2023, 2033 (%)
Figure 78 North America Wearable Brain Devices Market by Channel Type, 2023-2033 (US$ Mn, AGR (%))
Figure 79 North America Wearable Brain Devices Technologies Market Share Forecast by Channel Type 2023, 2033 (%)
Figure 80 North America Wearable Brain Devices Market by End-user, 2023-2033 (US$ Mn, AGR (%))
Figure 81 North America Wearable Brain Devices Technologies Market Share Forecast by End-User 2023, 2033 (%)
Figure 82 North America Wearable Brain Devices Market by Medical Setting, 2023-2033 (US$ Mn, AGR (%))
Figure 83 North America Wearable Brain Devices Technologies Market Share Forecast by Medical Setting 2023, 2033 (%)
Figure 84 US Wearable Brain Devices Market by Value, 2023-2033 (US$ Mn, AGR (%))
Figure 85 Canada Wearable Brain Devices Market by Value, 2023-2033 (US$ Mn, AGR (%))
Figure 86 Europe Wearable Brain Devices Market Attractiveness Index
Figure 87 Europe Wearable Brain Devices Market by Value, 2023-2033 (US$ Mn, AGR (%))
Figure 88 Europe Wearable Brain Devices Market by Country, 2023-2033 (US$ Mn, AGR (%))
Figure 89 Europe Wearable Brain Devices Technologies Market Share Forecast by Country 2023, 2033 (%)
Figure 90 Europe Wearable Brain Devices Market by Product Type, 2023-2033 (US$ Mn, AGR (%))
Figure 91 Europe Wearable Brain Devices Technologies Market Share Forecast by Product Type 2023, 2033 (%)
Figure 92 Europe Wearable Brain Devices Market by Technology, 2023-2033 (US$ Mn, AGR (%))
Figure 93 Europe Wearable Brain Devices Technologies Market Share Forecast by Technology 2023, 2033 (%)
Figure 94 Europe Wearable Brain Devices Market by Channel Type, 2023-2033 (US$ Mn, AGR (%))
Figure 95 Europe Wearable Brain Devices Technologies Market Share Forecast by Channel Type 2023, 2033 (%)
Figure 96 Europe Wearable Brain Devices Market by End-user, 2023-2033 (US$ Mn, AGR (%))
Figure 97 Europe Wearable Brain Devices Technologies Market Share Forecast by End-User 2023, 2033 (%)
Figure 98 Europe Wearable Brain Devices Market by Medical Setting, 2023-2033 (US$ Mn, AGR (%))
Figure 99 Europe Wearable Brain Devices Technologies Market Share Forecast by Medical Setting 2023, 2033 (%)
Figure 100 Germany Wearable Brain Devices Market by Value, 2023-2033 (US$ Mn, AGR (%))
Figure 101 France Wearable Brain Devices Market by Value, 2023-2033 (US$ Mn, AGR (%))
Figure 102 UK Wearable Brain Devices Market by Value, 2023-2033 (US$ Mn, AGR (%))
Figure 103 Italy Wearable Brain Devices Market by Value, 2023-2033 (US$ Mn, AGR (%))
Figure 104 Spain Wearable Brain Devices Market by Value, 2023-2033 (US$ Mn, AGR (%))
Figure 105 Rest of Europe Wearable Brain Devices Market by Value, 2023-2033 (US$ Mn, AGR (%))
Figure 106 Asia-Pacific Wearable Brain Devices Market Attractiveness Index
Figure 107 Asia-Pacific Wearable Brain Devices Market by Value, 2023-2033 (US$ Mn, AGR (%))
Figure 108 Asia-Pacific Wearable Brain Devices Market by Country, 2023-2033 (US$ Mn, AGR (%))
Figure 109 Asia-Pacific Wearable Brain Devices Technologies Market Share Forecast by Country 2023, 2033 (%)
Figure 110 Asia-Pacific Wearable Brain Devices Market by Product Type, 2023-2033 (US$ Mn, AGR (%))
Figure 111 Asia-Pacific Wearable Brain Devices Technologies Market Share Forecast by Product Type 2023, 2033 (%)
Figure 112 Asia-Pacific Wearable Brain Devices Market by Technology, 2023-2033 (US$ Mn, AGR (%))
Figure 113 Asia-Pacific Wearable Brain Devices Technologies Market Share Forecast by Technology 2023, 2033 (%)
Figure 114 Asia-Pacific Wearable Brain Devices Market by Channel Type, 2023-2033 (US$ Mn, AGR (%))
Figure 115 Asia-Pacific Wearable Brain Devices Technologies Market Share Forecast by Channel Type 2023, 2033 (%)
Figure 116 Asia-Pacific Wearable Brain Devices Market by End-user, 2023-2033 (US$ Mn, AGR (%))
Figure 117 Asia-Pacific Wearable Brain Devices Technologies Market Share Forecast by End-User 2023, 2033 (%)
Figure 118 Asia-Pacific Wearable Brain Devices Market by Medical Setting, 2023-2033 (US$ Mn, AGR (%))
Figure 119 Asia-Pacific Wearable Brain Devices Technologies Market Share Forecast by Medical Setting 2023, 2033 (%)
Figure 120 China Wearable Brain Devices Market by Value, 2023-2033 (US$ Mn, AGR (%))
Figure 121 India Wearable Brain Devices Market by Value, 2023-2033 (US$ Mn, AGR (%))
Figure 122 Japan Wearable Brain Devices Market by Value, 2023-2033 (US$ Mn, AGR (%))
Figure 123 South Korea Wearable Brain Devices Market by Value, 2023-2033 (US$ Mn, AGR (%))
Figure 124 Australia Wearable Brain Devices Market by Value, 2023-2033 (US$ Mn, AGR (%))
Figure 125 Rest of Asia-Pacific Wearable Brain Devices Market by Value, 2023-2033 (US$ Mn, AGR (%))
Figure 126 Middle-East & Africa Wearable Brain Devices Market Attractiveness Index
Figure 127 Middle East & Africa Wearable Brain Devices Market by Value, 2023-2033 (US$ Mn, AGR (%))
Figure 128 Middle East & Africa Wearable Brain Devices Market by Country, 2023-2033 (US$ Mn, AGR (%))
Figure 129 Middle East & Africa Wearable Brain Devices Technologies Market Share Forecast by Country 2023, 2033 (%)
Figure 130 Middle East & Africa Wearable Brain Devices Market by Product Type, 2023-2033 (US$ Mn, AGR (%))
Figure 131 Middle East & Africa Wearable Brain Devices Technologies Market Share Forecast by Product Type 2023, 2033 (%)
Figure 132 Middle East & Africa Wearable Brain Devices Market by Technology, 2023-2033 (US$ Mn, AGR (%))
Figure 133 Middle East & Africa Wearable Brain Devices Technologies Market Share Forecast by Technology 2023, 2033 (%)
Figure 134 Middle East & Africa Wearable Brain Devices Market by Channel Type, 2023-2033 (US$ Mn, AGR (%))
Figure 135 Middle East & Africa Wearable Brain Devices Technologies Market Share Forecast by Channel Type 2023, 2033 (%)
Figure 136 Middle East & Africa Wearable Brain Devices Market by End-user, 2023-2033 (US$ Mn, AGR (%))
Figure 137 Middle East & Africa Wearable Brain Devices Technologies Market Share Forecast by End-User 2023, 2033 (%)
Figure 138 Middle East & Africa Wearable Brain Devices Market by Medical Setting, 2023-2033 (US$ Mn, AGR (%))
Figure 139 Middle East & Africa Wearable Brain Devices Technologies Market Share Forecast by Medical Setting 2023, 2033 (%)
Figure 140 GCC Wearable Brain Devices Market by Value, 2023-2033 (US$ Mn, AGR (%))
Figure 141 South Africa Wearable Brain Devices Market by Value, 2023-2033 (US$ Mn, AGR (%))
Figure 142 Latin America Wearable Brain Devices Market Attractiveness Index
Figure 143 Latin America Wearable Brain Devices Market by Value, 2023-2033 (US$ Mn, AGR (%))
Figure 144 Latin America Wearable Brain Devices Market by Country, 2023-2033 (US$ Mn, AGR (%))
Figure 145 Latin America Wearable Brain Devices Technologies Market Share Forecast by Country 2023, 2033 (%)
Figure 146 Latin America Wearable Brain Devices Market by Product Type, 2023-2033 (US$ Mn, AGR (%))
Figure 147 Latin America Wearable Brain Devices Technologies Market Share Forecast by Product Type 2023, 2033 (%)
Figure 148 Latin America Wearable Brain Devices Market by Technology, 2023-2033 (US$ Mn, AGR (%))
Figure 149 Latin America Wearable Brain Devices Technologies Market Share Forecast by Technology 2023, 2033 (%)
Figure 150 Latin America Wearable Brain Devices Market by Channel Type, 2023-2033 (US$ Mn, AGR (%))
Figure 151 Latin America Wearable Brain Devices Technologies Market Share Forecast by Channel Type 2023, 2033 (%)
Figure 152 Latin America Wearable Brain Devices Market by End-user, 2023-2033 (US$ Mn, AGR (%))
Figure 153 Latin America Wearable Brain Devices Technologies Market Share Forecast by End-User2023, 2033 (%)
Figure 154 Latin America Wearable Brain Devices Market by Medical Setting, 2023-2033 (US$ Mn, AGR (%))
Figure 155 Latin America Wearable Brain Devices Technologies Market Share Forecast by Medical Setting 2023, 2033 (%)
Figure 156 Brazil Wearable Brain Devices Market by Value, 2023-2033 (US$ Mn, AGR (%))
Figure 157 Mexico Wearable Brain Devices Market by Value, 2023-2033 (US$ Mn, AGR (%))
Figure 158 Rest of Latin America Wearable Brain Devices Market by Value, 2023-2033 (US$ Mn, AGR (%))
Figure 159 Koninklijke Philips N.V. (Philips healthcare): Net Revenue, 2017-2021 (US$ million, AGR%)
Figure 160 Koninklijke Philips N.V. (Philips healthcare): Gross Profit, 2017-2021 (US$ million, AGR%)
Figure 161 Koninklijke Philips N.V. (Philips healthcare): Operational Income, 2017-2021 (US$ million, AGR%)
Figure 162 Koninklijke Philips N.V. (Philips healthcare): EBITDA, 2017-2021 (US$ million, AGR%)
Figure 163 Nihon Kohden Corporation: Net Revenue, 2017-2021 (US$ million, AGR%)
Figure 164 Nihon Kohden Corporation: Gross Profit, 2017-2021 (US$ million, AGR%)
Figure 165 Nihon Kohden Corporation: Operational Income, 2017-2021 (US$ million, AGR%)
Figure 166 Nihon Kohden Corporation: EBITDA, 2017-2021 (US$ million, AGR%)
Figure 167 GE Healthcare: Net Revenue, 2017-2021 (US$ million, AGR%)
Figure 168 GE Healthcare: Gross Profit, 2017-2021 (US$ million, AGR%)
Figure 169 GE Healthcare: Operational Income, 2017-2021 (US$ million, AGR%)
Figure 170 GE Healthcare: EBITDA, 2017-2021 (US$ million, AGR%)
Figure 171 Medtronic: Net Revenue, 2017-2021 (US$ million, AGR%)
Figure 172 Medtronic: Gross Profit, 2017-2021 (US$ million, AGR%)
Figure 173 Medtronic: Operational Income, 2017-2021 (US$ million, AGR%)
Figure 174 Medtronic: EBITDA, 2017-2021 (US$ million, AGR%)
Figure 175 Edwards Lifesciences Corporation: Net Revenue, 2017-2021 (US$ million, AGR%)
Figure 176 Edwards Lifesciences Corporation: Gross Profit, 2017-2021 (US$ million, AGR%)
Figure 177 Edwards Lifesciences Corporation: Operational Income, 2017-2021 (US$ million, AGR%)
Figure 178 Edwards Lifesciences Corporation: EBITDA, 2017-2021 (US$ million, AGR%)
Figure 179 Masimo Corporation: Net Revenue, 2017-2021 (US$ million, AGR%)
Figure 180 Masimo Corporation: Gross Profit, 2017-2021 (US$ million, AGR%)
Figure 181 Masimo Corporation: Operational Income, 2017-2021 (US$ million, AGR%)
Figure 182 Masimo Corporation: EBITDA, 2017-2021 (US$ million, AGR%)
ページTOPに戻る
関連レポート(キーワード「ウェアラブル」)
よくあるご質問
Visiongain社はどのような調査会社ですか?
英国の調査会社ヴィジョンゲイン社(Visiongain)は、通信とエネルギーのほか、自動車や化学・医薬品、金属など、広範な市場を対象に調査を行っています。自動車市場については、市場全般に関する調査のほ... もっと見る
調査レポートの納品までの日数はどの程度ですか?
在庫のあるものは速納となりますが、平均的には 3-4日と見て下さい。
但し、一部の調査レポートでは、発注を受けた段階で内容更新をして納品をする場合もあります。
発注をする前のお問合せをお願いします。
注文の手続きはどのようになっていますか?
1)お客様からの御問い合わせをいただきます。
2)見積書やサンプルの提示をいたします。
3)お客様指定、もしくは弊社の発注書をメール添付にて発送してください。
4)データリソース社からレポート発行元の調査会社へ納品手配します。
5) 調査会社からお客様へ納品されます。最近は、pdfにてのメール納品が大半です。
お支払方法の方法はどのようになっていますか?
納品と同時にデータリソース社よりお客様へ請求書(必要に応じて納品書も)を発送いたします。
お客様よりデータリソース社へ(通常は円払い)の御振り込みをお願いします。
請求書は、納品日の日付で発行しますので、翌月最終営業日までの当社指定口座への振込みをお願いします。振込み手数料は御社負担にてお願いします。
お客様の御支払い条件が60日以上の場合は御相談ください。
尚、初めてのお取引先や個人の場合、前払いをお願いすることもあります。ご了承のほど、お願いします。
データリソース社はどのような会社ですか?
当社は、世界各国の主要調査会社・レポート出版社と提携し、世界各国の市場調査レポートや技術動向レポートなどを日本国内の企業・公官庁及び教育研究機関に提供しております。
世界各国の「市場・技術・法規制などの」実情を調査・収集される時には、データリソース社にご相談ください。
お客様の御要望にあったデータや情報を抽出する為のレポート紹介や調査のアドバイスも致します。
|
|


