オフショア石油・ガス廃止措置市場レポート:2023-2033
Offshore Oil & Gas Decommissioning Market Report 2023-2033
レポート詳細
オフショア石油・ガス廃止措置市場レポート 2023-2033 :本レポートは、新たな収益の柱を目指すリーディングカンパニーが、業界とその背景にあるダイナミクスをより深く理解する上で、非... もっと見る
※上記価格は部署ライセンス(Departmental licence)価格です。
その他の価格についてはデータリソースまでお問合せください。
日本語のページは自動翻訳を利用し作成しています。
実際のレポートは英文のみでご納品いたします。

|

|
サマリー
レポート詳細
オフショア石油・ガス廃止措置市場レポート 2023-2033:本レポートは、新たな収益の柱を目指すリーディングカンパニーが、業界とその背景にあるダイナミクスをより深く理解する上で、非常に有益なものとなるでしょう。また、異業種への進出や新地域での既存事業の拡大を目指す企業にとっても有用なレポートです。
老朽化した石油・ガスインフラの管理・廃止は絶好の機会である
石油・ガス産業で使用されるオフショア構造物には、生産プラットフォーム、掘削装置、浮体式生産・貯蔵・積出装置(FPSO)、浮体式貯蔵装置(FSU)などがあります。石油・ガス産業において、掘削装置や海洋構造物の位置を決定する炭化水素鉱床の地理的位置は、重要な考慮事項である。炭化水素鉱床は非常に多様で、しばしば技術的に困難な場所に存在するため、資源開発のための技術的解決策がある程度調整されることは多かれ少なかれ避けられず、あらゆる海洋構造物の設計はほとんどの場合、ある意味でその場所に特有のものとなっているのであす。
老朽化した石油・ガス設備の管理と廃止措置は、環境への配慮と経済的現実のバランスがどのようにとれているか、また、社会が管理の決定を支える適切な科学的データを入手できるかどうかを調査する絶好の機会です。最良の結果を得るためには、廃止措置の期間、方法、モニタリングに関する決定は、適切な環境データによって支援されなければなりません。主な課題は、情報に基づいた意思決定を行うために、北海全域の適切な空間・時間スケールで必要なデータを収集し、照合し、解釈することである。北海は、ベルギー、デンマーク、フランス、ドイツ、オランダ、ノルウェー、およびイギリスが共有する資源です。これらの国は北海の一部を領海に含んでおり、他のEU加盟国もその資源に対する権利を主張しています。
マーケットリサーチレポートを購入する前に、どのような質問をすべきでしょうか?
- オフショア石油・ガス廃止措置市場はどのように進化しているのか?
- オフショア石油・ガス廃止措置市場の推進要因と抑制要因は何か?
- 各オフショア石油・ガス廃止措置サブマーケットセグメントは予測期間中にどのように成長し、2033年にこれらのサブマーケットが占める収益はどの程度になるのでしょうか?
- 2023年から2033年にかけて、各オフショア石油・ガス廃止措置サブマーケットの市場シェアはどのように推移するのでしょうか?
- 2023年から2033年にかけて、市場全体の主な推進力は何でしょうか?
- 主要なオフショア石油・ガス廃止措置市場はマクロ経済力学に広く追随するのか、それとも個々の国内市場が他を凌駕するのか?
- 2033年までに各国市場のシェアはどのように変化し、どの地域が2033年に市場をリードするのか?
- 主要プレイヤーは誰か、また予測期間中の見通しは?
- これらの主要企業のオフショア石油・ガス廃止措置プロジェクトはどのようなものですか?
- 2023年から2033年の間に、業界はどのように進化するのでしょうか?現在および今後10年間に実施されるオフショア石油・ガス廃止措置プロジェクトはどのような意味を持つのでしょうか?
- オフショア石油・ガス廃止措置市場をさらに拡大するために、製品の商業化の必要性は大きいですか?
- オフショア石油・ガス廃止措置市場はどこに向かい、どのように市場の最前線にいることを確実にすることができますか?
- 新製品やサービスラインに対する最適な投資オプションは何か?
- 企業を新たな成長軌道に乗せ、C-suiteに移行させるための重要な展望は何か?
このことが、現在、そして今後10年間のオフショア石油・ガス廃止措置市場にどのような影響を及ぼすかを知る必要があります。
- 390ページにわたる本レポートでは、165の表と204のグラフを独占的に提供します。
- このレポートでは、業界における主要な収益性の高い分野に焦点を当て、お客様が今すぐターゲットにできるような内容になっています。
- 世界、地域、国別の売上高と成長率を詳細に分析しています。
- 競合他社が成功した主なトレンド、変化、収益予測をハイライトしています。
本レポートは、今後10年間のオフショア石油・ガス廃止措置市場が、景気後退と回復の変動に合わせてどのように発展していくかをお伝えするものです。この市場は、過去10年間のどの時点よりも、今がより重要である。
2033年までの予測やその他の分析により、商業的な展望が見えてきた
- 2033年までの収益予測に加え、直近の実績、成長率、市場シェアもご覧いただけます。
- ビジネスの展望や展開など、独自の分析もご覧いただけます。
- 定性的分析(市場力学、促進要因、機会、阻害要因、課題など)、コスト構造、オフショア石油・ガス廃止措置価格上昇の影響、最近の動向などをご覧いただけます。
本レポートでは、COVID-19が業界と貴社にどのような影響を与えるかについて、データ分析と貴重な洞察を掲載しています。本レポートでは、COVID-19の4つの回収パターンとその影響、すなわち「V」、「L」、「W」、「U」について論じています。
報告書の対象セグメント
除去タイプ別市場区分
- 放置型
- 部分除去
- 転倒させたまま
- 完全除去
技術別市場セグメント
- 坑井の閉塞と廃坑
- パイプラインのデコミッショニング
- プラットフォームのデコミッショニング
- アンビリカルのデコミッショニング
- 海底構造物の廃止措置
技術別市場セグメント
- ジャックサイド&トップサイド撤去
- 坑井作業船とシステム
- 切断・分離
- 重量物運搬技術
サービス別市場セグメント
- プロジェクトマネジメント&コンプライアンス
- デリックバージの移動と撤収
- 資材廃棄
- サイトクリアランス
- 導体・電力ケーブルの撤去
構造別市場セグメント
- 固定式プラットフォーム
- コンプライアントタワー(CT)
- ケーソン
- 移動式海洋生産設備(MOPU)
- ウェルプロテクター(WP)
- サブシーテンプレート(SSTMP)
世界市場全体とセグメントの収益予測に加え、4地域と主要20カ国市場の収益予測も掲載しています。
北米
- アメリカ
- カナダ
欧州
- 英国
- ノルウェー
- オランダ
- ロシア
- イタリア
- その他の欧州
アジア太平洋地域
- 中国
- インドネシア
- マレーシア
- オーストラリア
- ベトナム
- その他のアジア太平洋地域
中東・アフリカ
- GCC
- 南アフリカ
- その他の中東・アフリカ地域
中南米
- ブラジル
- メキシコ
- その他のラテンアメリカの地域
この調査レポートは、オフショア石油・ガス廃止措置市場の2023年から2033年にかけての主要企業のプロファイルと、これらの企業の事業のこのセグメントに焦点を当てた内容も含んでいます。
主要企業と市場成長の可能性
・ AF Gruppen ASA
・ Aker Solutions ASA
・ Baker Hughes Company
・ Bureau Veritas SA
・ Claxton Engineering
・ DeepOcean Group
・ DNV GL
・ Halliburton Company
・ Heerema Marine Contractors
・ John Wood Group Plc
・ Occidental Petroleum Corporation
・ Oceaneering International, Inc.
・ Petrofac Limited
・ Ramboll
・ Saipem S.p.A.
・ Schlumderger N.V.
・ Subsea 7 SA
・ TechnipFMC Plc
・ Weatherford International Plc.
オフショア石油・ガス廃止措置市場の世界全体の収益、2023年から2033年まで、金額ベースで2023年に10,853百万米ドルを超えると、我々の仕事は計算しています。また、2033年までの間に収益が大きく伸びると予測しています。このレポートでは、最も大きな可能性を秘めた企業を特定しています。彼らの能力、進歩、商業的展望を知ることで、一歩先を行くことができます。
オフショア石油・ガス廃止措置市場、2023年から2033年までのレポートはどのように役立つのでしょうか?
390ページに及ぶレポートでは、要約して以下のような知識を得ることができます。
- オフショア石油・ガス廃止措置市場の2023年から2033年までの収益予測除去タイプ、技術、サービス、構造、企業規模の各予測を世界と地域レベルで掲載 - 投資と収益に最も有利な場所を見つけ、業界の展望を発見してください。
- 4つの地域と20の主要国市場の2033年までの収益予測 - 北米、欧州、アジア太平洋、中南米、中東・アフリカのオフショア石油・ガス廃止措置市場、2023年から2033年の市場予測をご覧いただけます。また、米国、カナダ、メキシコ、ブラジル、ロシア、フランス、英国、ノルウェー、オランダ、中国、インドネシア、マレーシア、ベトナムなどの主要経済圏の市場も予測されています。
- 既存企業や市場参入を目指す企業の展望 - オフショア石油・ガス廃止措置市場に関与する主要企業19社の企業プロファイルを含む、2023年から2033年までの展望を掲載しています。
定量的・定性的な分析と独自の予測をご覧いただけます。私たちのレポートだけが持つ情報を入手し、貴重なビジネスインテリジェンスを得ることができます。
他にはない情報
私たちの新しいレポートがあれば、知識の遅れを取り戻し、チャンスを逃す可能性が低くなります。私たちの研究が貴社の調査、分析、意思決定にどのように役立つかをご覧ください。Visiongainの研究は、オフショア石油・ガス廃止措置市場、2023年から2033年、市場をリードする企業のための商業分析を必要とするすべての人のためのものです。データ、トレンド、予測を見つけることができます。
ページTOPに戻る
目次
目次
1.レポートの概要
1.1 調査の目的
1.2 オフショア石油・ガス廃止措置市場の紹介
1.3 本レポートの特徴
1.4 本レポートを読むべき理由
1.5 本分析報告書が回答する主な質問には以下が含まれる。
1.6 本レポートは誰のためのものなのか?
1.7 調査方法論
1.7.1 市場の定義
1.7.2 市場評価・予測手法
1.7.3 データの検証
1.8 よくある質問と回答(FAQ)
1.9 関連するVisiongainのレポート
1.10 Visiongainについて
2 エグゼクティブサマリー
3 プレミアムインサイト
3.1 主な調査結果
3.2 3.1 世界のオフショア石油・ガス廃止措置の地域別市場
3.3 撤去タイプセグメント:市場魅力度指数
3.4 技術セグメント:市場魅力度指数
3.5 技術セグメント:市場魅力度指標
3.6 サービスセグメントサービスセグメント:市場魅力度指標
3.7 構造セグメント構造分野:市場魅力度指標
4 オフショア石油・ガス廃止措置の業界構造
4.1 概要
4.2 デコミッショニング
4.3 投資
4.4 規制の枠組み
4.5 デコミッショニングプロセス
4.5.1 作業前の活動
4.5.2 デコミッショニング計画
4.5.3 デコミッショニングエンジニアリング
4.5.4 許可取得
4.5.5 入札
4.5.6 作業前の打ち合わせ
4.6 非爆発的な方法
4.6.1 ダイヤモンドワイヤー切断装置
4.6.2 ギロチンソー
4.6.3 研磨カッター
4.6.4 パワーシャー
4.6.5 ロータリーメカニカルカッター
4.6.6 カーボンタングステンビーズワイヤーカッター
4.7 オフショア井戸掘削
4.7.1 スパッディング
4.7.2 BOPスタックのセットアップ
4.7.3 掘削
4.8 海洋掘削プロセス
4.9 採掘プロセス
4.10 バリューチェーン
4.10.1 入札とコンセッション
4.10.2 探鉱
4.10.3 生産
4.10.4 鉱区の放棄
5 廃止措置コスト分析
5.1 プラットフォームの準備と海洋生物の除去
5.2 坑井の閉塞と廃坑
5.3 動員および動員解除
5.4 プラットフォームと構造物の撤去
5.5 パイプラインと電力ケーブル
5.6 輸送と廃棄
5.7 サイトクリアランス
5.8 シェルマウンドの除去
5.9 サンゴ礁の強化
5.10 天候要因
6 市場のダイナミクス
6.1.1 市場の推進要因
6.1.2 市場の抑制要因
6.1.3 市場の好機
6.1.4 世界市場における課題
6.2 ポーターのファイブフォース分析
6.2.1 バイヤーのバーゲニングパワー
6.2.2 サプライヤーのバーゲニングパワー
6.2.3 新規参入の脅威
6.2.4 製品代替の脅威
6.2.5 競合他社の競争力
6.3 環境要因分析
6.3.1 政治的要因
6.3.2 経済的要因
6.3.3 社会的要因
6.3.4 技術的要因
6.3.5 環境要因
6.4 オフショア廃止措置市場のSWOT分析
6.4.1 市場の強み
6.4.2 市場の弱点
6.4.3 市場における機会
6.4.4 市場における脅威
7 世界の海洋石油・ガス廃止措置市場分析:撤去タイプ別
7.1 主な調査結果
7.2 除去タイプ別の世界のオフショア石油・ガス廃止措置市場の魅力度指数
7.2.1 除去タイプ別世界のオフショア石油・ガス廃止措置市場魅力度指数
7.2.2 除去タイプ別世界のオフショア石油・ガス廃止措置市場規模の推定と予測
7.3 定置撤去
7.3.1 場所貸し撤去の世界市場規模予測、2023-2033年 (US$ Mn)
出典Visiongain Reports Ltd.、2023年
7.3.2 場所取りの世界市場規模予測、地域別、2023-2033年 (US$ Mn)
7.4 部分除去
7.4.1 部分除去の世界市場規模予測、2023-2033年 (US$ Mn)
7.4.2 部分除去の世界市場規模予測、地域別、2023年-2033年 (US$ Mn)
7.5 定位置での転倒除去
7.5.1 場所打ち除去の世界市場規模予測、2023年~2033年 (US$ Mn)
7.6 場所打ち除去の世界市場規模予測、地域別、2023-2033年 (US$ Mn)
7.7 完全除去
7.7.1 完全除去の世界市場規模予測、2023-2033年 (US$ Mn)
7.7.2 完全除去の世界市場規模予測、地域別、2023年-2033年 (US$ Mn)
8 世界のオフショア石油・ガス廃止措置市場分析:技術別
8.1 主要な調査結果
8.2 世界のオフショア石油・ガス廃止措置市場技術別の魅力度指標
8.2.1 世界のオフショア石油・ガス廃止措置市場の技術別魅力度指数
8.2.2 世界のオフショア石油・ガス廃止措置市場規模の技術別の推定と予測
8.3 坑井の圧入と廃坑
8.3.1 坑井塞ぎと廃坑の世界市場規模予測、2023-2033 (US$ Mn)
8.3.2 坑井塞ぎと廃坑の世界市場規模予測、地域別、2023年~2033年(US$ Mn)
8.4 パイプライン廃止措置
8.4.1 パイプライン廃止措置の世界市場規模予測、2023-2033年 (US$ Mn)
8.4.2 パイプライン廃止措置の世界市場規模予測、地域別、2023-2033年 (US$ Mn)
8.5 プラットフォーム廃止措置
8.5.1 プラットフォーム廃止措置の世界市場規模予測、2023-2033年 (US$ Mn)
8.6 プラットフォーム廃止措置の世界市場規模予測、地域別、2023-2033年 (US$ Mn)
8.7 アンビリカル廃止措置
8.7.1 アンビリカル廃止措置の世界市場規模予測、2023年~2033年 (US$ Mn)
8.7.2 アンビリカル廃止措置の世界地域別市場予測、2023-2033 (US$ Mn)
8.8 海底構造物廃止措置
8.8.1 海底構造物廃止措置の世界市場規模予測、2023年~2033年(US$ Mn)
8.8.2 海底構造物廃止措置の世界市場規模予測、地域別、2023年~2033年(US$ Mn)
9 世界のオフショア石油・ガス廃止措置市場分析:技術別
9.1 主要な調査結果
9.2 世界のオフショア石油・ガス廃止措置市場の技術別魅力度指数
9.2.1 世界のオフショア石油・ガス廃止措置の技術別市場魅力度指数
9.2.2 世界のオフショア石油・ガス廃止措置の技術別市場規模の推定と予測
9.3 ジャックサイド&トップサイド撤去
9.3.1 世界のジャッキサイド&トップサイド撤去市場規模予測、2023-2033 (US$ Mn)
9.3.2 ジャックサイド&トップサイドリムーバルの世界市場規模予測、地域別、2023年〜2033年(US$ Mn)
9.4 坑井作業船とシステム
9.4.1 坑井作業船とシステムの世界市場規模予測、2023-2033年 (US$ Mn)
9.4.2 坑井作業船とシステムの世界市場規模予測、地域別、2023-2033 (US$ Mn)
9.5 切断・切断
9.5.1 カッティング&セベリングの世界市場規模予測、2023年~2033年 (US$ Mn)
9.6 切断・切断の世界市場地域別予測、2023年~2033年(US$ Mn)
9.7 ヘビーリフト技術
9.8 ヘビーリフト技術の世界市場規模予測、2023年~2033年(US$ Mn)
9.8.1 重いリフト技術の世界市場規模予測、地域別、2023年~2033年(US$ Mn)
10 世界のオフショア石油・ガス廃止措置市場分析:サービス別
10.1 主要な調査結果
10.2 世界のオフショア石油・ガス廃止措置市場のサービス別魅力度指数
10.2.1 世界のオフショア石油・ガス廃止措置のサービス別市場魅力度指数
10.2.2 世界のオフショア石油・ガス廃止措置のサービス別市場規模の推定と予測
10.3 プロジェクトマネジメント&コンプライアンス
10.3.1 プロジェクト管理&コンプライアンス撤去の世界市場規模予測、2023-2033 (US$ Mn)
10.3.2 プロジェクトマネジメント&コンプライアンスの世界市場規模予測(地域別)、2023-2033年(US$ Mn
10.4 デリックバージの動員・撤収
10.4.1 デリックバージの動員・動員解除の世界市場規模予測、2023-2033年 (US$ Mn)
10.4.2 デリックバージの動員・動員解除の世界市場地域別予測、2023年~2033年(US$ Mn)
10.5 材料廃棄
10.5.1 材料廃棄の世界市場規模予測、2023年〜2033年(US$ Mn)
10.6 材料廃棄の世界市場規模予測、地域別、2023年〜2033年(US$ Mn)
10.7 サイトクリアランス
10.8 サイトクリアランスの世界市場規模予測、2023-2033年 (US$ Mn)
10.8.1 サイトクリアランスの世界市場規模予測、地域別(2023-2033年)(US$ Mn
10.9 導線・電力ケーブル撤去
10.10 導線・電力ケーブル除去の世界市場規模予測、2023年~2033年 (US$ Mn)
10.10.1 導線・電力ケーブル撤去の世界地域別市場予測、2023-2033年 (US$ Mn)
11 世界のオフショア石油・ガス廃止措置市場分析:構造別
11.1 主な調査結果
11.2 世界のオフショア石油・ガス廃止措置の構造別市場魅力度指数
11.2.1 世界のオフショア石油・ガス廃止措置の構造別市場魅力度指数
11.2.2 世界のオフショア石油・ガス廃止措置構造別市場規模推定・予測
11.3 固定式プラットフォーム
11.3.1 固定式プラットフォーム撤去の世界市場規模推計予測、2023-2033 (US$ Mn)
11.3.2 固定式プラットフォーム世界市場規模予測、地域別、2023-2033年 (US$ Mn)
11.4 コンプライアントタワー(CT)
11.4.1 コンプライアントタワー(CT)の世界市場規模予測、2023年~2033年 (US$ Mn)
11.4.2 コンプライアントタワー(CT)の世界市場規模予測、地域別、2023年~2033年(US$ Mn)
11.5 ケーソン
11.5.1 ケーソンの世界市場規模予測、2023年~2033年 (US$ Mn)
11.6 ケーソンの世界市場地域別予測、2023年~2033年 (US$ Mn)
11.7 移動式海洋生産装置(MOPU)
11.8 移動式海洋生産装置(MOPU)の世界市場規模予測、2023年~2033年(US$ Mn)
11.8.1 移動式海洋生産装置(MOPU)の世界市場規模予測、地域別、2023年~2033年(US$ Mn)
11.9 坑井保護装置(WP)
11.10 ウェルプロテクター(WP)の世界市場規模予測、2023年~2033年(US$ Mn)
11.10.1 井戸用プロテクター(WP)の世界市場規模予測、2023年~2033年(US$ Mn)
11.11 サブシーテンプレート(SSTMP)
11.12 サブシーテンプレート(SSTMP)の世界市場規模予測、2023年~2033年(US$ Mn)
11.12.1 サブシーテンプレート(SSTMP)の世界市場規模予測、地域別、2023年~2033年(US$ Mn)
12 世界のオフショア石油・ガス廃止措置市場分析:地域別
12.1 主な調査結果
12.2 地域別市場規模の推定と予測
12.3 COVID-19の影響度分析。回復シナリオ(V, U, W, L)
13 北米のオフショア石油・ガス廃止措置市場分析
13.1 主要な調査結果
13.1.1 北米オフショア石油・ガス廃止措置市場の魅力度指数
13.1.2 北米オフショア石油・ガス廃止措置の地域別市場シェア、2023年~2033年
13.2 北米オフショア石油・ガス廃止措置の国別市場規模予測・予想
13.3 北米オフショア石油・ガス廃止措置の除去タイプ別市場規模予測・予想
13.4 北米オフショア石油・ガス廃止措置の技術別市場規模予測・予想
10.5 北米オフショア石油・ガス廃止措置の技術別市場規模予測・予想
10.6 北米オフショア石油・ガス廃止措置のサービス別市場規模予測・予想
10.7 北米オフショア石油・ガス廃止措置の構造別市場規模予測・予想
13.5 米国市場分析
13.6 カナダの市場分析
14 欧州のオフショア石油・ガス廃止措置市場分析
14.1 主要な調査結果
14.1.1 欧州オフショア石油・ガス廃止措置市場の魅力度指数
14.1.2 欧州オフショア石油・ガス廃止措置の地域別市場シェア、2023年~2033年
14.2 欧州オフショア石油・ガス廃止措置の国別市場規模予測・予想
14.3 欧州オフショア石油・ガス廃止措置の除去タイプ別市場規模予測・予測
14.4 欧州オフショア石油・ガス廃止措置の技術別市場規模予測・予想
11.5 欧州オフショア石油・ガス廃止措置の技術別市場規模予測・予想
11.6 欧州オフショア石油・ガス廃止措置のサービス別市場規模予測・予想
11.7 欧州オフショア石油・ガス廃止措置の構造別市場規模予測・予想
11.8 イギリスの市場分析
11.9 ノルウェーの市場分析
14.10 オランダの市場分析
14.11 ロシア市場の分析
14.12 イタリアの市場分析
14.13 その他の欧州の市場分析
15 アジア太平洋地域のオフショア石油・ガス廃止措置市場分析
15.1 主要な調査結果
15.1.1 アジア太平洋地域のオフショア石油・ガス廃止措置市場の魅力度指数
15.1.2 アジア太平洋地域のオフショア石油・ガス廃止措置の地域別市場シェア、2023年~2033年
15.2 アジア太平洋地域のオフショア石油・ガス廃止措置の国別市場規模の推定と予測
15.3 アジア太平洋地域のオフショア石油・ガス廃止措置の除去タイプ別市場規模の推定と予測
15.4 アジア太平洋地域のオフショア石油・ガス廃止措置の技術別市場規模予測・予想
12.5 アジア太平洋地域のオフショア石油・ガス廃止措置の技術別市場規模の推定と予測
12.6 アジア太平洋地域のオフショア石油・ガス廃止措置のサービス別市場規模予測・予想
12.7 アジア太平洋地域のオフショア石油・ガス廃止措置の構造別市場規模の推計と予測
12.8 中国市場の分析
12.9 インドネシアの市場分析
15.10 マレーシアの市場分析
15.11 オーストラリアの市場分析
15.12 ベトナムの市場分析
15.13 その他のアジア太平洋地域の市場分析
16 中東・アフリカのオフショア石油・ガス廃止措置市場分析
16.1 主要な調査結果
16.1.1 中東・アフリカのオフショア石油・ガス廃止措置市場の魅力指数
16.1.2 中東・アフリカのオフショア石油・ガス廃止措置の地域別市場シェア、2023年&2033年
16.2 中東・アフリカのオフショア石油・ガス廃止措置の国別市場規模推計・予測
16.3 中東・アフリカのオフショア石油・ガス廃止措置の除去タイプ別市場規模予測・予想
16.4 中東・アフリカのオフショア石油・ガス廃止措置の技術別市場規模予測・予想
12.5 中東・アフリカのオフショア石油・ガス廃止措置の技術別市場規模予測・予想
12.6 中東・アフリカのオフショア石油・ガス廃止措置のサービス別市場規模予測・予想
12.7 中東・アフリカのオフショア石油・ガス廃止措置の構造別市場規模予測・予想
12.8 GCCの市場分析
12.9 南アフリカの市場分析
12.9 その他の中東・アフリカ地域の市場分析
17 ラテンアメリカのオフショア石油・ガス廃止措置市場分析
17.1 主要な調査結果
17.1.1 ラテンアメリカのオフショア石油・ガス廃止措置市場の魅力度指数
17.1.2 ラテンアメリカのオフショア石油・ガス廃止措置の地域別市場シェア、2023年~2033年
17.2 ラテンアメリカのオフショア石油・ガス廃止措置の国別市場規模予測・予想
17.3 ラテンアメリカのオフショア石油・ガス廃止措置市場の除去タイプ別市場規模予測・予想
17.4 ラテンアメリカのオフショア石油・ガス廃止措置の技術別市場規模予測・予想
17.5 ラテンアメリカのオフショア石油・ガス廃止措置の技術別市場規模予測・予想
17.6 ラテンアメリカのオフショア石油・ガス廃止措置市場のサービス別市場規模予測・予想
17.7 ラテンアメリカのオフショア石油・ガス廃止措置市場の構造別市場規模予測・予想
17.8 ブラジルの市場分析
17.9 メキシコの市場分析
17.9 その他のラテンアメリカの市場分析
18 主要企業のプロフィール
18.1 ハリバートン社
18.1.1 会社概要
18.1.2 会社概要
18.1.3 財務分析
18.1.4 製品ベンチマーク
18.1.5 戦略的な展望
18.2 ペトロファック社
18.2.1 会社概要
18.2.2 会社概要
18.2.3 財務分析
18.2.4 製品ベンチマーク
18.2.5 戦略的展望
18.3 Weatherford International Plc.
18.3.1 企業スナップショット
18.3.2 会社概要
18.3.3 財務分析
18.3.4 製品ベンチマーク
18.3.5 戦略的な展望
18.4 シュルンデルガーN.V.
18.4.1 企業スナップショット
18.4.2 会社概要
18.4.3 財務分析
18.4.4 製品ベンチマーク
18.4.5 戦略的な展望
18.5 サブシー7 SA
18.5.1 企業スナップショット
18.5.2 会社概要
18.5.3 財務分析
18.5.4 製品ベンチマーク
18.5.5 戦略的な展望
18.6 テクニップエフエムシー・ピーエルシー
18.6.1 会社概要
18.6.2 会社概要
18.6.3 財務分析
18.6.4 製品ベンチマーク
18.6.5 戦略的展望
18.7 ジョンウッドグループPLC
18.7.1 会社概要
18.7.2 会社概要
18.7.3 ベンチマーキング
18.7.4 戦略的展望
18.8 ランボルギーニ
18.8.1 企業スナップショット
18.8.2 会社概要
18.8.3 製品ベンチマーク
18.8.4 戦略的展望
18.9 オセアニア・インターナショナル
18.9.1 企業スナップショット
18.9.2 会社概要
18.9.3 財務分析
18.9.4 製品ベンチマーク
18.9.5 戦略的な展望
18.10 ベーカーヒューズ社
18.10.1 会社概要
18.10.2 会社概要
18.10.3 財務分析
18.10.4 製品ベンチマーク
18.10.5 戦略的展望
18.11 アーカー・ソリューションズASA
18.11.1 企業スナップショット
18.11.2 会社概要
18.11.3 製品ベンチマーク
18.11.4 戦略的展望
18.12 DNV GL
18.12.1 企業スナップショット
18.12.2 会社概要
18.12.3 製品ベンチマーク
18.12.4 戦略的展望
18.13 オクシデンタル・ペトロリウム・コーポレーション
18.13.1 企業スナップショット
18.13.2 会社概要
18.13.3 財務分析
18.13.4 製品ベンチマーク
18.13.5 戦略的展望
18.14 サイペム S.p.A.
18.14.1 企業スナップショット
18.14.2 会社概要
18.14.3 財務分析
18.14.4 製品ベンチマーク
18.14.5 戦略的な展望
18.15 ヒーレマ・マリン・コントラクターズ
18.15.1 企業スナップショット
18.15.2 会社概要
18.15.3 製品ベンチマーク
18.15.4 戦略的展望
18.16 クラクストン・エンジニアリング
18.16.1 企業スナップショット
18.16.2 会社概要
18.16.3 ベンチマーキング
18.16.4 戦略的展望
18.17 ディープオーシャン・グループ
18.17.1 企業スナップショット
18.17.2 会社概要
18.17.3 製品ベンチマーク
18.17.4 戦略的展望
18.18 AF Gruppen ASA
18.18.1 企業スナップショット
18.18.2 会社概要
18.18.3 製品ベンチマーク
18.18.4 戦略的展望
18.19 ビューローベリタスSA
18.19.1 企業スナップショット
18.19.2 会社概要
18.19.3 製品ベンチマーク
18.19.4 戦略的展望
19 結論と提言
19.1 ヴィジョンゲインからの結論
19.2 市場関係者への提言
19.2.1 オフショア産業は国民意識向上キャンペーンを必要とする
19.2.2 比較コスト見積もり
19.2.3 安全管理スイート
表の一覧
Table 1 Global Offshore Oil & Gas Decommissioning Market Snapshot, 2023 & 2033 (US$billion, CAGR %)
Table 2 Global Offshore Oil & Gas Decommissioning Market by Removal Type, 2023-2033 (US$ Mn, AGR (%), CAGR (%))
Table 3 Global Leave in Place Removal Market Forecast, 2023-2033 (US$ Mn, AGR (%), CAGR (%))
Table 4 Global Leave in Place Removal Market by Region, 2023-2033 (US$ Mn, AGR (%), CAGR (%))
Table 5 Global Partial Removal Market Forecast, 2023-2033 (US$ Mn, AGR (%), CAGR (%))
Table 6 Global Partial Removal Market by Region, 2023-2033 (US$ Mn, AGR (%), CAGR (%))
Table 7 Global Toppled in Place Removal Market Forecast, 2023-2033 (US$ Mn, AGR (%), CAGR (%))
Table 8 Global Toppled in Place Removal Market by Region, 2023-2033 (US$ Mn, AGR (%), CAGR (%))
Table 9 Global Complete Removal Market Forecast, 2023-2033 (US$ Mn, AGR (%), CAGR (%))
Table 10 Global Complete Removal Market by Region, 2023-2033 (US$ Mn, AGR (%), CAGR (%))
Table 11 Global Offshore Oil & Gas Decommissioning Market by Techniques, 2023-2033 (US$ Mn, AGR (%), CAGR (%))
Table 12 Global Well Plugging and Abandonment Market Forecast, 2023-2033 (US$ Mn, AGR (%), CAGR (%))
Table 13 Global Well Plugging and Abandonment Market by Region, 2023-2033 (US$ Mn, AGR (%), CAGR (%))
Table 14 Global Pipeline Decommissioning Market Forecast, 2023-2033 (US$ Mn, AGR (%), CAGR (%))
Table 15 Global Pipeline Decommissioning Market by Region, 2023-2033 (US$ Mn, AGR (%), CAGR (%))
Table 16 Global Platform Decommissioning Market Forecast, 2023-2033 (US$ Mn, AGR (%), CAGR (%))
Table 17 Global Platform Decommissioning Market by Region, 2023-2033 (US$ Mn, AGR (%), CAGR (%))
Table 18 Global Umbilical Decommissioning Market Forecast, 2023-2033 (US$ Mn, AGR (%), CAGR (%))
Table 19 Global Umbilical Decommissioning Market by Region, 2023-2033 (US$ Mn, AGR (%), CAGR (%))
Table 20 Global Subsea Structure Decommissioning Market Forecast, 2023-2033 (US$ Mn, AGR (%), CAGR (%))
Table 21 Global Subsea Structure Decommissioning Market by Region, 2023-2033 (US$ Mn, AGR (%), CAGR (%))
Table 22 Global Offshore Oil & Gas Decommissioning Market by Technology, 2023-2033 (US$ Mn, AGR (%), CAGR (%))
Table 23 Global Jack side & Topside Removal Market Forecast, 2023-2033 (US$ Mn, AGR (%), CAGR (%))
Table 24 Global Jack side & Topside Removal Market by Region, 2023-2033 (US$ Mn, AGR (%), CAGR (%))
Table 25 Global Well Intervention Vessels and Systems Market Forecast, 2023-2033 (US$ Mn, AGR (%), CAGR (%))
Table 26 Global Well Intervention Vessels and Systems Market by Region, 2023-2033 (US$ Mn, AGR (%), CAGR (%))
Table 27 Global Cutting and Severing Market Forecast, 2023-2033 (US$ Mn, AGR (%), CAGR (%))
Table 28 Global Cutting and Severing Market by Region, 2023-2033 (US$ Mn, AGR (%), CAGR (%))
Table 29 Global Heavy Lift Technologies Market Forecast, 2023-2033 (US$ Mn, AGR (%), CAGR (%))
Table 30 Global Heavy Lift Technologies Market by Region, 2023-2033 (US$ Mn, AGR (%), CAGR (%))
Table 31 Global Offshore Oil & Gas Decommissioning Market by Services, 2023-2033 (US$ Mn, AGR (%), CAGR (%))
Table 32 Global Project management & Compliance Market Forecast, 2023-2033 (US$ Mn, AGR (%), CAGR (%))
Table 33 Global Project management & Compliance Market by Region, 2023-2033 (US$ Mn, AGR (%), CAGR (%))
Table 34 Global Mobilization & Demobilization of Derrick Barges Market Forecast, 2023-2033 (US$ Mn, AGR (%), CAGR (%))
Table 35 Global Mobilization & Demobilization of Derrick Barges Market by Region, 2023-2033 (US$ Mn, AGR (%), CAGR (%))
Table 36 Global Materials Disposal Market Forecast, 2023-2033 (US$ Mn, AGR (%), CAGR (%))
Table 37 Global Materials Disposal Market by Region, 2023-2033 (US$ Mn, AGR (%), CAGR (%))
Table 38 Global Site Clearance Market Forecast, 2023-2033 (US$ Mn, AGR (%), CAGR (%))
Table 39 Global Site Clearance Market by Region, 2023-2033 (US$ Mn, AGR (%), CAGR (%))
Table 40 Global Conductor & Power Cable Removal Market Forecast, 2023-2033 (US$ Mn, AGR (%), CAGR (%))
Table 41 Global Conductor & Power Cable Removal Market by Region, 2023-2033 (US$ Mn, AGR (%), CAGR (%))
Table 42 Global Offshore Oil & Gas Decommissioning Market by Structure, 2023-2033 (US$ Mn, AGR (%), CAGR (%))
Table 43 Global Fixed Platforms Market Forecast, 2023-2033 (US$ Mn, AGR (%), CAGR (%))
Table 44 Global Fixed Platforms Market by Region, 2023-2033 (US$ Mn, AGR (%), CAGR (%))
Table 45 Global Compliant Towers (CT) Market Forecast, 2023-2033 (US$ Mn, AGR (%), CAGR (%))
Table 46 Global Compliant Towers (CT) Market by Region, 2023-2033 (US$ Mn, AGR (%), CAGR (%))
Table 47 Global Caissons Market Forecast, 2023-2033 (US$ Mn, AGR (%), CAGR (%))
Table 48 Global Caissons Market by Region, 2023-2033 (US$ Mn, AGR (%), CAGR (%))
Table 49 Global Mobile Offshore Production Units (MOPU) Market Forecast, 2023-2033 (US$ Mn, AGR (%), CAGR (%))
Table 50 Global Mobile Offshore Production Units (MOPU) Market by Region, 2023-2033 (US$ Mn, AGR (%), CAGR (%))
Table 51 Global Well Protectors (WP) Market Forecast, 2023-2033 (US$ Mn, AGR (%), CAGR (%))
Table 52 Global Well Protectors (WP) Market by Region, 2023-2033 (US$ Mn, AGR (%), CAGR (%))
Table 53 Global Subsea Templates (SSTMP) Market Forecast, 2023-2033 (US$ Mn, AGR (%), CAGR (%))
Table 54 Global Subsea Templates (SSTMP) Market by Region, 2023-2033 (US$ Mn, AGR (%), CAGR (%))
Table 55 Global Offshore Oil & Gas Decommissioning Market by Region, 2023-2033 (US$ Mn, AGR (%), CAGR (%))
Table 56 Global Offshore Oil & Gas Decommissioning Market by Region, 2023-2033 (US$ Mn, AGR (%), CAGR (%)) (V-Shaped Recovery Scenario)
Table 57 Global Offshore Oil & Gas Decommissioning Market by Region, 2023-2033 (US$ Mn, AGR (%), CAGR (%)) (U-Shaped Recovery Scenario)
Table 58 Global Offshore Oil & Gas Decommissioning Market by Region, 2023-2033 (US$ Mn, AGR (%), CAGR (%)) (W-Shaped Recovery Scenario)
Table 59 Global Offshore Oil & Gas Decommissioning Market by Region, 2023-2033 (US$ Mn, AGR (%), CAGR (%)) (L-Shaped Recovery Scenario)
Table 60 North America Offshore Oil & Gas Decommissioning Market by Country, 2023-2033 (US$ Mn, AGR (%), CAGR (%))
Table 61 North America Offshore Oil & Gas Decommissioning Market by Removal Type, 2023-2033 (US$ Mn, AGR (%), CAGR (%))
Table 62 North America Offshore Oil & Gas Decommissioning Market by Techniques, 2023-2033 (US$ Mn, AGR (%), CAGR (%))
Table 63 North America Offshore Oil & Gas Decommissioning Market by Technology, 2023-2033 (US$ Mn, AGR (%), CAGR (%))
Table 64 North America Offshore Oil & Gas Decommissioning Market by Services, 2023-2033 (US$ Mn, AGR (%), CAGR (%))
Table 65 North America Offshore Oil & Gas Decommissioning Market by Structure, 2023-2033 (US$ Mn, AGR (%), CAGR (%))
Table 66 US Offshore Oil & Gas Decommissioning Market by Value, 2023-2033 (US$ Mn, AGR (%), CAGR (%))
Table 67 Canada Offshore Oil & Gas Decommissioning Market by Value, 2023-2033 (US$ Mn, AGR (%), CAGR (%))
Table 68 Europe Offshore Oil & Gas Decommissioning Market by Country, 2023-2033 (US$ Mn, AGR (%), CAGR (%))
Table 69 Europe Offshore Oil & Gas Decommissioning Market by Removal Type, 2023-2033 (US$ Mn, AGR (%), CAGR (%))
Table 70 Europe Offshore Oil & Gas Decommissioning Market by Techniques, 2023-2033 (US$ Mn, AGR (%), CAGR (%))
Table 71 Europe Offshore Oil & Gas Decommissioning Market by Technology, 2023-2033 (US$ Mn, AGR (%), CAGR (%))
Table 72 Europe Offshore Oil & Gas Decommissioning Market by Services, 2023-2033 (US$ Mn, AGR (%), CAGR (%))
Table 73 Europe Offshore Oil & Gas Decommissioning Market by Structure, 2023-2033 (US$ Mn, AGR (%), CAGR (%))
Table 74 UK Offshore Oil & Gas Decommissioning Market by Value, 2023-2033 (US$ Mn, AGR (%), CAGR (%))
Table 75 Norway Offshore Oil & Gas Decommissioning Market by Value, 2023-2033 (US$ Mn, AGR (%), CAGR (%))
Table 76 Netherlands Offshore Oil & Gas Decommissioning Market by Value, 2023-2033 (US$ Mn, AGR (%), CAGR (%))
Table 77 Russia Offshore Oil & Gas Decommissioning Market by Value, 2023-2033 (US$ Mn, AGR (%), CAGR (%))
Table 78 Italy Offshore Oil & Gas Decommissioning Market by Value, 2023-2033 (US$ Mn, AGR (%), CAGR (%))
Table 79 Rest of Europe Offshore Oil & Gas Decommissioning Market by Value, 2023-2033 (US$ Mn, AGR (%), CAGR (%))
Table 80 Asia-Pacific Offshore Oil & Gas Decommissioning Market by Country, 2023-2033 (US$ Mn, AGR (%), CAGR (%))
Table 81 Asia-Pacific Offshore Oil & Gas Decommissioning Market by Removal Type, 2023-2033 (US$ Mn, AGR (%), CAGR (%))
Table 82 Asia-Pacific Offshore Oil & Gas Decommissioning Market by Techniques, 2023-2033 (US$ Mn, AGR (%), CAGR (%))
Table 83 Asia-Pacific Offshore Oil & Gas Decommissioning Market by Technology, 2023-2033 (US$ Mn, AGR (%), CAGR (%))
Table 84 Asia-Pacific Offshore Oil & Gas Decommissioning Market by Services, 2023-2033 (US$ Mn, AGR (%), CAGR (%))
Table 85 Asia-Pacific Offshore Oil & Gas Decommissioning Market by Structure, 2023-2033 (US$ Mn, AGR (%), CAGR (%))
Table 86 China Offshore Oil & Gas Decommissioning Market by Value, 2023-2033 (US$ Mn, AGR (%), CAGR (%))
Table 87 Indonesia Offshore Oil & Gas Decommissioning Market by Value, 2023-2033 (US$ Mn, AGR (%), CAGR (%))
Table 88 Malaysia Offshore Oil & Gas Decommissioning Market by Value, 2023-2033 (US$ Mn, AGR (%), CAGR (%))
Table 89 Australia Offshore Oil & Gas Decommissioning Market by Value, 2023-2033 (US$ Mn, AGR (%), CAGR (%))
Table 90 Vietnam Offshore Oil & Gas Decommissioning Market by Value, 2023-2033 (US$ Mn, AGR (%), CAGR (%))
Table 91 Rest of Asia-Pacific Offshore Oil & Gas Decommissioning Market by Value, 2023-2033 (US$ Mn, AGR (%), CAGR (%))
Table 92 Middle East & Africa Offshore Oil & Gas Decommissioning Market by Country, 2023-2033 (US$ Mn, AGR (%), CAGR (%))
Table 93 Middle East & Africa Offshore Oil & Gas Decommissioning Market by Removal Type, 2023-2033 (US$ Mn, AGR (%), CAGR (%))
Table 94 Middle East & Africa Offshore Oil & Gas Decommissioning Market by Techniques, 2023-2033 (US$ Mn, AGR (%), CAGR (%))
Table 95 Middle East & Africa Offshore Oil & Gas Decommissioning Market by Technology, 2023-2033 (US$ Mn, AGR (%), CAGR (%))
Table 96 Middle East & Africa Offshore Oil & Gas Decommissioning Market by Services, 2023-2033 (US$ Mn, AGR (%), CAGR (%))
Table 97 Middle East & Africa Offshore Oil & Gas Decommissioning Market by Structure, 2023-2033 (US$ Mn, AGR (%), CAGR (%))
Table 98 GCC Offshore Oil & Gas Decommissioning Market by Value, 2023-2033 (US$ Mn, AGR (%), CAGR (%))
Table 99 South Africa Offshore Oil & Gas Decommissioning Market by Value, 2023-2033 (US$ Mn, AGR (%), CAGR (%))
Table 100 Rest of Middle East & Africa Offshore Oil & Gas Decommissioning Market by Value, 2023-2033 (US$ Mn, AGR (%), CAGR (%))
Table 101 Latin America Offshore Oil & Gas Decommissioning Market by Country, 2023-2033 (US$ Mn, AGR (%), CAGR (%))
Table 102 Latin America Offshore Oil & Gas Decommissioning Market by Removal Type, 2023-2033 (US$ Mn, AGR (%), CAGR (%))
Table 103 Latin America Offshore Oil & Gas Decommissioning Market by Techniques, 2023-2033 (US$ Mn, AGR (%), CAGR (%))
Table 104 Latin America Offshore Oil & Gas Decommissioning Market by Technology, 2023-2033 (US$ Mn, AGR (%), CAGR (%))
Table 105 Latin America Offshore Oil & Gas Decommissioning Market by Services, 2023-2033 (US$ Mn, AGR (%), CAGR (%))
Table 106 Latin America Offshore Oil & Gas Decommissioning Market by Structure, 2023-2033 (US$ Mn, AGR (%), CAGR (%))
Table 107 Brazil Offshore Oil & Gas Decommissioning Market by Value, 2023-2033 (US$ Mn, AGR (%), CAGR (%))
Table 108 Mexico Offshore Oil & Gas Decommissioning Market by Value, 2023-2033 (US$ Mn, AGR (%), CAGR (%))
Table 109 Rest of Latin America Offshore Oil & Gas Decommissioning Market by Value, 2023-2033 (US$ Mn, AGR (%), CAGR (%))
Table 110 Halliburton Company: Key Details, (CEO, HQ, Revenue, Founded, No. of Employees, Company Type, Website, Business Segment)
Table 111 Halliburton Company: Product Benchmarking
Table 112 Halliburton Company: Strategic Outlook
Table 113 Petrofac: Key Details, (CEO, HQ, Revenue, Founded, No. of Employees, Company Type, Website, Business Segment)
Table 114 Petrofac: Product Benchmarking
Table 115 Petrofac: Strategic Outlook
Table 116 Weatherford International Plc: Key Details, (CEO, HQ, Revenue, Founded, No. of Employees, Company Type, Website, Business Segment)
Table 117 Weatherford International Plc: Product Benchmarking
Table 118 Weatherford International Plc: Strategic Outlook
Table 119 Schlumderger N.V: Key Details, (CEO, HQ, Revenue, Founded, No. of Employees, Company Type, Website, Business Segment)
Table 120 Schlumderger N.V: Product Benchmarking
Table 121 Schlumderger N.V: Strategic Outlook
Table 122 Subsea 7 SA: Key Details, (CEO, HQ, Revenue, Founded, No. of Employees, Company Type, Website, Business Segment)
Table 123 Subsea 7 SA: Product Benchmarking
Table 124 Subsea 7 SA: Strategic Outlook
Table 125 TechnipFMC Plc: Key Details, (CEO, HQ, Revenue, Founded, No. of Employees, Company Type, Website, Business Segment)
Table 126 TechnipFMC Plc: Product Benchmarking
Table 127 TechnipFMC Plc: Strategic Outlook
Table 128 John Wood Group PLC: Key Details, (CEO, HQ, Revenue, Founded, No. of Employees, Company Type, Website, Business Segment)
Table 129 John Wood Group PLC: Product Benchmarking
Table 130 John Wood Group PLC: Strategic Outlook
Table 131 Ramboll: Key Details, (CEO, HQ, Revenue, Founded, No. of Employees, Company Type, Website, Business Segment)
Table 132 Ramboll: Product Benchmarking
Table 133 Ramboll: Strategic Outlook
Table 134 Oceaneering International, Inc: Key Details, (CEO, HQ, Revenue, Founded, No. of Employees, Company Type, Website, Business Segment)
Table 135 Oceaneering International, Inc: Product Benchmarking
Table 136 Oceaneering International, Inc: Strategic Outlook
Table 137 Baker Hughes Company: Key Details, (CEO, HQ, Revenue, Founded, No. of Employees, Company Type, Website, Business Segment)
Table 138 Baker Hughes Company: Product Benchmarking
Table 139 Baker Hughes Company: Strategic Outlook
Table 140 Aker Solutions ASA: Key Details, (CEO, HQ, Revenue, Founded, No. of Employees, Company Type, Website, Business Segment)
Table 141 Aker Solutions ASA: Product Benchmarking
Table 142 Aker Solutions ASA: Strategic Outlook
Table 143 DNV GL: Key Details, (CEO, HQ, Revenue, Founded, No. of Employees, Company Type, Website, Business Segment)
Table 144 DNV GL: Product Benchmarking
Table 145 DNV GL: Strategic Outlook
Table 146 Occidental Petroleum Corporation: Key Details, (CEO, HQ, Revenue, Founded, No. of Employees, Company Type, Website, Business Segment)
Table 147 Occidental Petroleum Corporation: Product Benchmarking
Table 148 Occidental Petroleum Corporation: Strategic Outlook
Table 149 Saipem S.p.A.: Key Details, (CEO, HQ, Revenue, Founded, No. of Employees, Company Type, Website, Business Segment)
Table 150 Saipem S.p.A.: Product Benchmarking
Table 151 Saipem S.p.A.: Strategic Outlook
Table 152 Heerema Marine Contractors: Key Details, (CEO, HQ, Revenue, Founded, No. of Employees, Company Type, Website, Business Segment)
Table 153 Heerema Marine Contractors: Strategic Outlook
Table 154 Claxton Engineering: Key Details, (CEO, HQ, Revenue, Founded, No. of Employees, Company Type, Website, Business Segment)
Table 155 Claxton Engineering: Product Benchmarking
Table 156 Claxton Engineering: Strategic Outlook
Table 157 DeepOcean Group: Key Details, (CEO, HQ, Revenue, Founded, No. of Employees, Company Type, Website, Business Segment)
Table 158 DeepOcean Group: Product Benchmarking
Table 159 DeepOcean Group: Strategic Outlook
Table 160 AF Gruppen ASA: Key Details, (CEO, HQ, Revenue, Founded, No. of Employees, Company Type, Website, Business Segment)
Table 161 AF Gruppen ASA: Product Benchmarking
Table 162 AF Gruppen ASA: Strategic Outlook
Table 163 Bureau Veritas SA: Key Details, (CEO, HQ, Revenue, Founded, No. of Employees, Company Type, Website, Business Segment)
Table 164 Bureau Veritas SA: Product Benchmarking
Table 165 Bureau Veritas SA: Strategic Outlook
図の一覧
Figure 1 Global Offshore Oil & Gas Decommissioning Market Segmentation
Figure 2 Breakdown of Primary Interviews: By Company Type, Designation, & Region
Figure 3 Global Offshore Oil & Gas Decommissioning Market Forecast by Region: Market Attractiveness Index
Figure 4 Global Offshore Oil & Gas Decommissioning Market by Removal Type: Market Attractiveness Index
Figure 5 Global Offshore Oil & Gas Decommissioning Market by Technology: Market Attractiveness Index
Figure 6 Global Offshore Oil & Gas Decommissioning Market by Techniques: Market Attractiveness Index
Figure 7 Global Offshore Oil & Gas Decommissioning Market by Services: Market Attractiveness Index
Figure 8 Global Offshore Oil & Gas Decommissioning Market by Structure: Market Attractiveness Index
Figure 9 Cost Incurred While Offshore Decommissioning
Figure 10 Global Offshore Oil & Gas Decommissioning Market: Market Dynamics
Figure 11 Global Offshore Oil & Gas Decommissioning Market: Porter’s Five Forces Analysis
Figure 12 Global Offshore Oil & Gas Decommissioning Market: PESTLE Analysis
Figure 14 Global Offshore Oil & Gas Decommissioning Market Forecast by Removal Type 2023, 2033 (Revenue, CAGR%)
Figure 15 Global Offshore Oil & Gas Decommissioning Market Forecast by Removal Type Type,2023, 2033 (Revenue, CAGR%)
Figure 16 Global Offshore Oil & Gas Decommissioning Market by Removal Type, 2023-2033 (US$ Mn, AGR (%))
Figure 17 Global Leave in Place Removal Market Forecast, 2023-2033 (US$ Mn, AGR (%))
Figure 18 Global Leave in Place Removal Market by Region, 2023-2033 (US$ Mn, AGR (%))
Figure 19 Global Partial Removal Market Forecast, 2023-2033 (US$ Mn, AGR (%))
Figure 20 Global Partial Removal Market by Region, 2023-2033 (US$ Mn, AGR (%))
Figure 21 Global Toppled in Place Removal Market Forecast, 2023-2033 (US$ Mn, AGR (%))
Figure 22 Global Toppled in Place Removal Market by Region, 2023-2033 (US$ Mn, AGR (%))
Figure 23 Global Complete Removal Market Forecast, 2023-2033 (US$ Mn, AGR (%))
Figure 24 Global Complete Removal Market by Region, 2023-2033 (US$ Mn, AGR (%))
Figure 25 Global Offshore Oil & Gas Decommissioning Market Forecast by Techniques 2023, 2033 (Revenue, CAGR%)
Figure 26 Global Offshore Oil & Gas Decommissioning Market Forecast by Techniques Type,2023, 2033 (Revenue, CAGR%)
Figure 27 Global Offshore Oil & Gas Decommissioning Market by Techniques, 2023-2033 (US$ Mn, AGR (%))
Figure 28 Global Well Plugging and Abandonment Market Forecast, 2023-2033 (US$ Mn, AGR (%))
Figure 29 Global Well Plugging and Abandonment Market by Region, 2023-2033 (US$ Mn, AGR (%))
Figure 30 Global Pipeline Decommissioning Market Forecast, 2023-2033 (US$ Mn, AGR (%))
Figure 31 Global Pipeline Decommissioning Market by Region, 2023-2033 (US$ Mn, AGR (%))
Figure 32 Global Platform Decommissioning Market Forecast, 2023-2033 (US$ Mn, AGR (%))
Figure 33 Global Platform Decommissioning Market by Region, 2023-2033 (US$ Mn, AGR (%))
Figure 34 Global Umbilical Decommissioning Market Forecast, 2023-2033 (US$ Mn, AGR (%))
Figure 35 Global Umbilical Decommissioning Market by Region, 2023-2033 (US$ Mn, AGR (%))
Figure 36 Global Subsea Structure Decommissioning Market Forecast, 2023-2033 (US$ Mn, AGR (%))
Figure 37 Global Subsea Structure Decommissioning Market by Region, 2023-2033 (US$ Mn, AGR (%))
Figure 38 Global Offshore Oil & Gas Decommissioning Market Forecast by Technology 2023, 2033 (Revenue, CAGR%)
Figure 39 Global Offshore Oil & Gas Decommissioning Market Forecast by Technology Type,2023, 2033 (Revenue, CAGR%)
Figure 40 Global Offshore Oil & Gas Decommissioning Market by Technology, 2023-2033 (US$ Mn, AGR (%))
Figure 41 Global Jack side & Topside Removal Market Forecast, 2023-2033 (US$ Mn, AGR (%))
Figure 42 Global Jack side & Topside Removal Market by Region, 2023-2033 (US$ Mn, AGR (%))
Figure 43 Global Well Intervention Vessels and Systems Market Forecast, 2023-2033 (US$ Mn, AGR (%))
Figure 44 Global Well Intervention Vessels and Systems Market by Region, 2023-2033 (US$ Mn, AGR (%))
Figure 45 Global Cutting and Severing Market Forecast, 2023-2033 (US$ Mn, AGR (%))
Figure 46 Global Cutting and Severing Market by Region, 2023-2033 (US$ Mn, AGR (%))
Figure 47 Global Heavy Lift Technologies Market Forecast, 2023-2033 (US$ Mn, AGR (%))
Figure 48 Global Heavy Lift Technologies Market by Region, 2023-2033 (US$ Mn, AGR (%))
Figure 49 Global Offshore Oil & Gas Decommissioning Market Forecast by Services 2023, 2033 (Revenue, CAGR%)
Figure 50 Global Offshore Oil & Gas Decommissioning Market Forecast by Services Type,2023, 2033 (Revenue, CAGR%)
Figure 51 Global Offshore Oil & Gas Decommissioning Market by Services, 2023-2033 (US$ Mn, AGR (%))
Figure 52 Global Project management & Compliance Market Forecast, 2023-2033 (US$ Mn, AGR (%))
Figure 53 Global Project management & Compliance Market by Region, 2023-2033 (US$ Mn, AGR (%))
Figure 54 Global Mobilization & Demobilization of Derrick Barges Market Forecast, 2023-2033 (US$ Mn, AGR (%))
Figure 55 Global Mobilization & Demobilization of Derrick Barges Market by Region, 2023-2033 (US$ Mn, AGR (%))
Figure 56 Global Materials Disposal Market Forecast, 2023-2033 (US$ Mn, AGR (%))
Figure 57 Global Materials Disposal Market by Region, 2023-2033 (US$ Mn, AGR (%))
Figure 58 Global Site Clearance Market Forecast, 2023-2033 (US$ Mn, AGR (%))
Figure 59 Global Site Clearance Market by Region, 2023-2033 (US$ Mn, AGR (%))
Figure 60 Global Conductor & Power Cable Removal Market Forecast, 2023-2033 (US$ Mn, AGR (%))
Figure 61 Global Conductor & Power Cable Removal Market by Region, 2023-2033 (US$ Mn, AGR (%))
Figure 62 Global Offshore Oil & Gas Decommissioning Market Forecast by Structure,2023, 2033 (Revenue, CAGR%)
Figure 63 Global Offshore Oil & Gas Decommissioning Market Forecast by Structure Type,2023, 2033 (Revenue, CAGR%)
Figure 64 Global Offshore Oil & Gas Decommissioning Market by Structure, 2023-2033 (US$ Mn, AGR (%))
Figure 65 Global Fixed Platforms Market Forecast, 2023-2033 (US$ Mn, AGR (%))
Figure 66 Global Fixed Platforms Market by Region, 2023-2033 (US$ Mn, AGR (%))
Figure 67 Global Compliant Towers (CT) Market Forecast, 2023-2033 (US$ Mn, AGR (%))
Figure 68 Global Compliant Towers (CT) Market by Region, 2023-2033 (US$ Mn, AGR (%))
Figure 69 Global Caissons Market Forecast, 2023-2033 (US$ Mn, AGR (%))
Figure 70 Global Caissons Market by Region, 2023-2033 (US$ Mn, AGR (%))
Figure 71 Global Mobile Offshore Production Units (MOPU) Market Forecast, 2023-2033 (US$ Mn, AGR (%))
Figure 72 Global Mobile Offshore Production Units (MOPU) Market by Region, 2023-2033 (US$ Mn, AGR (%))
Figure 73 Global Well Protectors (WP) Market Forecast, 2023-2033 (US$ Mn, AGR (%))
Figure 74 Global Well Protectors (WP) Market by Region, 2023-2033 (US$ Mn, AGR (%))
Figure 75 Global Subsea Templates (SSTMP) Market Forecast, 2023-2033 (US$ Mn, AGR (%))
Figure 76 Global Subsea Templates (SSTMP) Market by Region, 2023-2033 (US$ Mn, AGR (%))
Figure 77 Global Offshore Oil & Gas Decommissioning Market by Region, 2023-2033 (US$ Mn, AGR (%))
Figure 78 Global Offshore Oil & Gas Decommissioning Market by Region, 2023-2033 (US$ Mn, AGR (%)) (V-Shaped Recovery Scenario)
Figure 79 Global Offshore Oil & Gas Decommissioning Market by Region, 2023-2033 (US$ Mn, AGR (%)) (U-Shaped Recovery Scenario)
Figure 80 Global Offshore Oil & Gas Decommissioning Market by Region, 2023-2033 (US$ Mn, AGR (%)) (W-Shaped Recovery Scenario)
Figure 81 Global Offshore Oil & Gas Decommissioning Market by Region, 2023-2033 (US$ Mn, AGR (%)) (L-Shaped Recovery Scenario)
Figure 82 North America Offshore Oil & Gas Decommissioning Market Attractiveness Index
Figure 83 North America Offshore Oil & Gas Decommissioning Market Share Forecast 2023, 2033 (%)
Figure 84 North America Offshore Oil & Gas Decommissioning Market by Country, 2023-2033 (US$ Mn, AGR (%))
Figure 85 North America Offshore Oil & Gas Decommissioning Market by Removal Type, 2023-2033 (US$ Mn, AGR (%))
Figure 86 North America Offshore Oil & Gas Decommissioning Market Share Forecast by Removal Type, 2023 & 2033 (%)
Figure 87 North America Offshore Oil & Gas Decommissioning Market by Techniques, 2023-2033 (US$ Mn, AGR (%))
Figure 88 North America Offshore Oil & Gas Decommissioning Market Share Forecast by Techniques, 2023 & 2033 (%)
Figure 89 North America Offshore Oil & Gas Decommissioning Market by Technology, 2023-2033 (US$ Mn, AGR (%))
Figure 90 North America Offshore Oil & Gas Decommissioning Market Share Forecast Technology, 2023 & 2033 (%)
Figure 91 North America Offshore Oil & Gas Decommissioning Market by Services, 2023-2033 (US$ Mn, AGR (%))
Figure 92 North America Offshore Oil & Gas Decommissioning Market Share Forecast Service, 2023 & 2033 (%)
Figure 93 North America Offshore Oil & Gas Decommissioning Market by Structure, 2023-2033 (US$ Mn, AGR (%))
Figure 94 North America Offshore Oil & Gas Decommissioning Market Share Forecast Structure, 2023 & 2033 (%)
Figure 95 US Offshore Oil & Gas Decommissioning Market by Value, 2023-2033 (US$ Mn, AGR (%))
Figure 96 Canada Offshore Oil & Gas Decommissioning Market by Value, 2023-2033 (US$ Mn, AGR (%))
Figure 97 Europe Offshore Oil & Gas Decommissioning Market Attractiveness Index
Figure 98 Europe Offshore Oil & Gas Decommissioning Market Share Forecast 2023, 2033 (%)
Figure 99 Europe Offshore Oil & Gas Decommissioning Market by Country, 2023-2033 (US$ Mn, AGR (%))
Figure 100 Europe Offshore Oil & Gas Decommissioning Market by Removal Type, 2023-2033 (US$ Mn, AGR (%))
Figure 101 Europe Offshore Oil & Gas Decommissioning Market Share Forecast by Removal Type, 2023 & 2033 (%)
Figure 102 Europe Offshore Oil & Gas Decommissioning Market by Techniques, 2023-2033 (US$ Mn, AGR (%))
Figure 103 Europe Offshore Oil & Gas Decommissioning Market Share Forecast by Techniques, 2023 & 2033 (%)
Figure 104 Europe Offshore Oil & Gas Decommissioning Market by Technology, 2023-2033 (US$ Mn, AGR (%))
Figure 105 Europe Offshore Oil & Gas Decommissioning Market Share Forecast Technology, 2023 & 2033 (%)
Figure 106 Europe Offshore Oil & Gas Decommissioning Market by Services, 2023-2033 (US$ Mn, AGR (%))
Figure 107 Europe Offshore Oil & Gas Decommissioning Market Share Forecast Service, 2023 & 2033 (%)
Figure 108 Europe Offshore Oil & Gas Decommissioning Market by Structure, 2023-2033 (US$ Mn, AGR (%))
Figure 109 Europe Offshore Oil & Gas Decommissioning Market Share Forecast Structure, 2023 & 2033 (%)
Figure 110 UK Offshore Oil & Gas Decommissioning Market by Value, 2023-2033 (US$ Mn, AGR (%))
Figure 111 Norway Offshore Oil & Gas Decommissioning Market by Value, 2023-2033 (US$ Mn, AGR (%))
Figure 112 Netherlands Offshore Oil & Gas Decommissioning Market by Value, 2023-2033 (US$ Mn, AGR (%))
Figure 113 Russia Offshore Oil & Gas Decommissioning Market by Value, 2023-2033 (US$ Mn, AGR (%))
Figure 114 Italy Offshore Oil & Gas Decommissioning Market by Value, 2023-2033 (US$ Mn, AGR (%))
Figure 115 Rest of Europe Offshore Oil & Gas Decommissioning Market by Value, 2023-2033 (US$ Mn, AGR (%))
Figure 116 Asia-Pacific Offshore Oil & Gas Decommissioning Market Attractiveness Index
Figure 117 Asia-Pacific Offshore Oil & Gas Decommissioning Market Share Forecast 2023, 2033 (%)
Figure 118 Asia-Pacific Offshore Oil & Gas Decommissioning Market by Country, 2023-2033 (US$ Mn, AGR (%))
Figure 119 Asia-Pacific Offshore Oil & Gas Decommissioning Market by Removal Type, 2023-2033 (US$ Mn, AGR (%))
Figure 120 Asia-Pacific Offshore Oil & Gas Decommissioning Market Share Forecast by Removal Type, 2023 & 2033 (%)
Figure 121 Asia-Pacific Offshore Oil & Gas Decommissioning Market by Techniques, 2023-2033 (US$ Mn, AGR (%))
Figure 122 Asia-Pacific Offshore Oil & Gas Decommissioning Market Share Forecast by Techniques, 2023 & 2033 (%)
Figure 123 Asia-Pacific Offshore Oil & Gas Decommissioning Market by Technology, 2023-2033 (US$ Mn, AGR (%))
Figure 124 Asia-Pacific Offshore Oil & Gas Decommissioning Market Share Forecast Technology, 2023 & 2033 (%)
Figure 125 Asia-Pacific Offshore Oil & Gas Decommissioning Market by Services, 2023-2033 (US$ Mn, AGR (%))
Figure 126 Asia-Pacific Offshore Oil & Gas Decommissioning Market Share Forecast Service, 2023 & 2033 (%)
Figure 127 Asia-Pacific Offshore Oil & Gas Decommissioning Market by Structure, 2023-2033 (US$ Mn, AGR (%))
Figure 128 Asia-Pacific Offshore Oil & Gas Decommissioning Market Share Forecast Structure, 2023 & 2033 (%)
Figure 129 China Offshore Oil & Gas Decommissioning Market by Value, 2023-2033 (US$ Mn, AGR (%))
Figure 130 Indonesia Offshore Oil & Gas Decommissioning Market by Value, 2023-2033 (US$ Mn, AGR (%))
Figure 131 Malaysia Offshore Oil & Gas Decommissioning Market by Value, 2023-2033 (US$ Mn, AGR (%))
Figure 132 Australia Offshore Oil & Gas Decommissioning Market by Value, 2023-2033 (US$ Mn, AGR (%))
Figure 133 Vietnam Offshore Oil & Gas Decommissioning Market by Value, 2023-2033 (US$ Mn, AGR (%))
Figure 134 Rest of Asia-Pacific Offshore Oil & Gas Decommissioning Market by Value, 2023-2033 (US$ Mn, AGR (%))
Figure 135 Middle East & Africa Offshore Oil & Gas Decommissioning Market Attractiveness Index
Figure 136 Middle East & Africa Offshore Oil & Gas Decommissioning Market Share Forecast 2023, 2033 (%)
Figure 137 Middle East & Africa Offshore Oil & Gas Decommissioning Market by Country, 2023-2033 (US$ Mn, AGR (%))
Figure 138 Middle East & Africa Offshore Oil & Gas Decommissioning Market by Removal Type, 2023-2033 (US$ Mn, AGR (%))
Figure 139 Middle East & Africa Offshore Oil & Gas Decommissioning Market Share Forecast by Removal Type, 2023 & 2033 (%)
Figure 140 Middle East & Africa Offshore Oil & Gas Decommissioning Market by Techniques, 2023-2033 (US$ Mn, AGR (%))
Figure 141 Middle East & Africa Offshore Oil & Gas Decommissioning Market Share Forecast by Techniques, 2023 & 2033 (%)
Figure 142 Middle East & Africa Offshore Oil & Gas Decommissioning Market by Technology, 2023-2033 (US$ Mn, AGR (%))
Figure 143 Middle East & Africa Offshore Oil & Gas Decommissioning Market Share Forecast Technology, 2023 & 2033 (%)
Figure 144 Middle East & Africa Offshore Oil & Gas Decommissioning Market by Services, 2023-2033 (US$ Mn, AGR (%))
Figure 145 Middle East & Africa Offshore Oil & Gas Decommissioning Market Share Forecast Service, 2023 & 2033 (%)
Figure 146 Middle East & Africa Offshore Oil & Gas Decommissioning Market by Structure, 2023-2033 (US$ Mn, AGR (%))
Figure 147 Middle East & Africa Offshore Oil & Gas Decommissioning Market Share Forecast Structure, 2023 & 2033 (%)
Figure 148 GCC Offshore Oil & Gas Decommissioning Market by Value, 2023-2033 (US$ Mn, AGR (%))
Figure 149 South Africa Offshore Oil & Gas Decommissioning Market by Value, 2023-2033 (US$ Mn, AGR (%))
Figure 150 Rest of Middle East & Africa Offshore Oil & Gas Decommissioning Market by Value, 2023-2033 (US$ Mn, AGR (%))
Figure 151 Latin America Offshore Oil & Gas Decommissioning Market Attractiveness Index
Figure 152 Latin America Offshore Oil & Gas Decommissioning Market Share Forecast 2023, 2033 (%)
Figure 153 Latin America Offshore Oil & Gas Decommissioning Market by Country, 2023-2033 (US$ Mn, AGR (%))
Figure 154 Latin America Offshore Oil & Gas Decommissioning Market by Removal Type, 2023-2033 (US$ Mn, AGR (%))
Figure 155 Latin America Offshore Oil & Gas Decommissioning Market Share Forecast by Removal Type, 2023 & 2033 (%)
Figure 156 Latin America Offshore Oil & Gas Decommissioning Market by Techniques, 2023-2033 (US$ Mn, AGR (%))
Figure 157 Latin America Offshore Oil & Gas Decommissioning Market Share Forecast by Techniques, 2023 & 2033 (%)
Figure 158 Latin America Offshore Oil & Gas Decommissioning Market by Technology, 2023-2033 (US$ Mn, AGR (%))
Figure 159 Latin America Offshore Oil & Gas Decommissioning Market Share Forecast Technology, 2023 & 2033 (%)
Figure 160 Latin America Offshore Oil & Gas Decommissioning Market by Services, 2023-2033 (US$ Mn, AGR (%))
Figure 161 Latin America Offshore Oil & Gas Decommissioning Market Share Forecast Service, 2023 & 2033 (%)
Figure 162 Latin America Offshore Oil & Gas Decommissioning Market by Structure, 2023-2033 (US$ Mn, AGR (%))
Figure 163 Latin America Offshore Oil & Gas Decommissioning Market Share Forecast Structure, 2023 & 2033 (%)
Figure 164 Brazil Offshore Oil & Gas Decommissioning Market by Value, 2023-2033 (US$ Mn, AGR (%))
Figure 165 Mexico Offshore Oil & Gas Decommissioning Market by Value, 2023-2033 (US$ Mn, AGR (%))
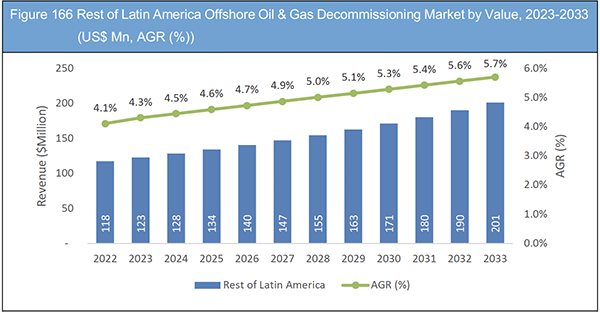
Figure 166 Rest of Latin America Offshore Oil & Gas Decommissioning Market by Value, 2023-2033 (US$ Mn, AGR (%))
Figure 167 Halliburton Company: Net Revenue, 2017-2021 (US$ million, AGR%)
Figure 168 Halliburton Company: Gross Profit, 2017-2021 (US$ million, AGR%)
Figure 169 Halliburton Company: Operational Income, 2017-2021 (US$ million, AGR%)
Figure 170 Halliburton Company: EBITDA, 2017-2021 (US$ million, AGR%)
Figure 171 Petrofac: Net Revenue, 2017-2021 (US$ million, AGR%)
Figure 172 Petrofac: Gross Profit, 2017-2021 (US$ million, AGR%)
Figure 173 Petrofac: Operational Income, 2017-2021 (US$ million, AGR%)
Figure 174 Petrofac: EBITDA, 2017-2021 (US$ million, AGR%)
Figure 175 Weatherford International Plc: Net Revenue, 2017-2021 (US$ million, AGR%)
Figure 176 Weatherford International Plc: Gross Profit, 2017-2021 (US$ million, AGR%)
Figure 177 Weatherford International Plc: Operational Income, 2017-2021 (US$ million, AGR%)
Figure 178 Weatherford International Plc: EBITDA, 2017-2021 (US$ million, AGR%)
Figure 179 Schlumderger N.V: Net Revenue, 2017-2021 (US$ million, AGR%)
Figure 180 Schlumderger N.V: Gross Profit, 2017-2021 (US$ million, AGR%)
Figure 181 Schlumderger N.V: Operational Income, 2017-2021 (US$ million, AGR%)
Figure 182 Schlumderger N.V: EBITDA, 2017-2021 (US$ million, AGR%)
Figure 183 Subsea 7 SA: Net Revenue, 2017-2021 (US$ million, AGR%)
Figure 184 Subsea 7 SA: Gross Profit, 2017-2021 (US$ million, AGR%)
Figure 185 Subsea 7 SA: Operational Income, 2017-2021 (US$ million, AGR%)
Figure 186 Subsea 7 SA: EBITDA, 2017-2021 (US$ million, AGR%)
Figure 187 TechnipFMC Plc: Net Revenue, 2017-2021 (US$ million, AGR%)
Figure 188 TechnipFMC Plc: Gross Profit, 2017-2021 (US$ million, AGR%)
Figure 189 TechnipFMC Plc: Operational Income, 2017-2021 (US$ million, AGR%)
Figure 190 TechnipFMC Plc: EBITDA, 2017-2021 (US$ million, AGR%)
Figure 191 Oceaneering International, Inc: Net Revenue, 2017-2021 (US$ million, AGR%)
Figure 192 Oceaneering International, Inc: Gross Profit, 2017-2021 (US$ million, AGR%)
Figure 193 Oceaneering International, Inc: Operational Income, 2017-2021 (US$ million, AGR%)
Figure 194 Oceaneering International, Inc: EBITDA, 2017-2021 (US$ million, AGR%)
Figure 195 Baker Hughes Company: Net Revenue, 2017-2021 (US$ million, AGR%)
Figure 196 Baker Hughes Company: Gross Profit, 2017-2021 (US$ million, AGR%)
Figure 197 Baker Hughes Company: Operational Income, 2017-2021 (US$ million, AGR%)
Figure 198 Baker Hughes Company: EBITDA, 2017-2021 (US$ million, AGR%)
Figure 199 Occidental Petroleum Corporation: Net Revenue, 2017-2021 (US$ million, AGR%)
Figure 200 Occidental Petroleum Corporation: Gross Profit, 2017-2021 (US$ million, AGR%)
Figure 201 Occidental Petroleum Corporation: Operational Income, 2017-2021 (US$ million, AGR%)
Figure 202 Occidental Petroleum Corporation: EBITDA, 2017-2021 (US$ million, AGR%)
Figure 203 Saipem S.p.A.: Net Revenue, 2017-2021 (US$ million, AGR%)
Figure 204 Saipem S.p.A.: Gross Profit, 2017-2021 (US$ million, AGR%)
Figure 205 Saipem S.p.A.: Operational Income, 2017-2021 (US$ million, AGR%)
Figure 206 Saipem S.p.A.: EBITDA, 2017-2021 (US$ million, AGR%)
ページTOPに戻る
Summary
Report Details
The Offshore Oil & Gas Decommissioning Market Report 2023-2033: This report will prove invaluable to leading firms striving for new revenue pockets if they wish to better understand the industry and its underlying dynamics. It will be useful for companies that would like to expand into different industries or to expand their existing operations in a new region.
The Management and Decommissioning of Obsolete Oil & Gas Infrastructure Is an Excellent Opportunity
Offshore structures used in the oil and gas industry include production platforms, drilling rigs, floating production, storage, and offloading units (FPSO), floating storage units (FSU), and others. The geographic location of hydrocarbon deposits, which dictates the position of drilling rigs and offshore structures, is an important consideration in the oil and gas industry. Because hydrocarbon deposits are found in highly diverse and often technically challenging locations, it is more or less inevitable that technical solutions to develop resources are tailored to some extent, and the design of any offshore structure is almost always, in some ways, unique to the location.
The management and decommissioning of obsolete oil and gas infrastructure is an excellent opportunity to investigate how environmental concerns are balanced against economic realities, and whether society has access to adequate scientific data to support management decisions. To achieve the best results, decisions on the timescale, methodology, and monitoring of decommissioning must be supported by sound environmental data. The main challenge is to collect, collate, and interpret the necessary data at appropriate spatial and temporal scales across the North Sea in order to make informed decisions. The North Sea is a resource shared by Belgium, Denmark, France, Germany, the Netherlands, Norway, and the United Kingdom. These states include a portion of the North Sea in their territorial waters, and other EU Member States have claims to its resources.
What Questions Should You Ask before Buying a Market Research Report?
• How is the offshore oil & gas decommissioning market evolving?
• What is driving and restraining the offshore oil & gas decommissioning market?
• How will each offshore oil & gas decommissioning submarket segment grow over the forecast period and how much revenue will these submarkets account for in 2033?
• How will the market shares for each offshore oil & gas decommissioning submarket develop from 2023 to 2033?
• What will be the main driver for the overall market from 2023 to 2033?
• Will leading offshore oil & gas decommissioning markets broadly follow the macroeconomic dynamics, or will individual national markets outperform others?
• How will the market shares of the national markets change by 2033 and which geographical region will lead the market in 2033?
• Who are the leading players and what are their prospects over the forecast period?
• What are the offshore oil & gas decommissioning projects for these leading companies?
• How will the industry evolve during the period between 2023 and 2033? What are the implications of offshore oil & gas decommissioning projects taking place now and over the next 10 years?
• Is there a greater need for product commercialisation to further scale the offshore oil & gas decommissioning market?
• Where is the offshore oil & gas decommissioning market heading and how can you ensure you are at the forefront of the market?
• What are the best investment options for new product and service lines?
• What are the key prospects for moving companies into a new growth path and C-suite?
You need to discover how this will impact the offshore oil & gas decommissioning market today, and over the next 10 years:
• Our 390-page report provides 165 tables and 204 charts/graphs exclusively to you.
• The report highlights key lucrative areas in the industry so you can target them – NOW.
• It contains in-depth analysis of global, regional and national sales and growth.
• It highlights for you the key successful trends, changes and revenue projections made by your competitors.
This report tells you TODAY how the offshore oil & gas decommissioning market will develop in the next 10 years, and in line with the variations in COVID-19 economic recession and bounce. This market is more critical now than at any point over the last 10 years.
Forecasts to 2033 and other analyses reveal commercial prospects
• In addition to revenue forecasting to 2033, our new study provides you with recent results, growth rates, and market shares.
• You will find original analyses, with business outlooks and developments.
• Discover qualitative analyses (including market dynamics, drivers, opportunities, restraints and challenges), cost structure, impact of rising offshore oil & gas decommissioning prices and recent developments.
This report includes data analysis and invaluable insight into how COVID-19 will affect the industry and your company. Four COVID-19 recovery patterns and their impact, namely, “V”, “L”, “W” and “U” are discussed in this report.
Segments Covered in the Report
Market Segment by Removal Type
• Leave in Place
• Partial Removal
• Toppled in Place
• Complete Removal
Market Segment by Techniques
• Well Plugging and Abandonment
• Pipeline Decommissioning
• Platform Decommissioning
• Umbilical Decommissioning
• Subsea Structure Decommissioning
Market Segment by Technology
• Jackside & Topside Removal
• Well Intervention Vessels and Systems
• Cutting and Severing
• Heavy Lift Technologies
Market Segment by Services
• Project management & Compliance
• Mobilization & Demobilization of Derrick Barges
• Materials Disposal
• Site Clearance
• Conductor & Power Cable Removal
Market Segment by Structure
• Fixed Platforms
• Compliant Towers (CT)
• Caissons
• Mobile Offshore Production Units (MOPU)
• Well Protectors (WP)
• Subsea Templates (SSTMP)
In addition to the revenue predictions for the overall world market and segments, you will also find revenue forecasts for four regional and 20 leading national markets:
North America
• U.S.
• Canada
Europe
• UK
• Norway
• Netherlands
• Russia
• Italy
• Rest of Europe
Asia Pacific
• China
• Indonesia
• Malaysia
• Australia
• Vietnam
• Rest of Asia-Pacific
Middle East & Africa
• GCC
• South Africa
• Rest of Middle East & Africa
Latin America
• Brazil
• Mexico
• Rest of Latin America
The report also includes profiles and for some of the leading companies in the Offshore Oil & Gas Decommissioning Market, 2023 to 2033, with a focus on this segment of these companies’ operations.
Leading companies and the potential for market growth
• AF Gruppen ASA
• Aker Solutions ASA
• Baker Hughes Company
• Bureau Veritas SA
• Claxton Engineering
• DeepOcean Group
• DNV GL
• Halliburton Company
• Heerema Marine Contractors
• John Wood Group Plc
• Occidental Petroleum Corporation
• Oceaneering International, Inc.
• Petrofac Limited
• Ramboll
• Saipem S.p.A.
• Schlumderger N.V.
• Subsea 7 SA
• TechnipFMC Plc
• Weatherford International Plc.
Overall world revenue for Offshore Oil & Gas Decommissioning Market, 2023 to 2033 in terms of value the market will surpass US$10,853 million in 2023, our work calculates. We predict strong revenue growth through to 2033. Our work identifies which organizations hold the greatest potential. Discover their capabilities, progress, and commercial prospects, helping you stay ahead.
How will the Offshore Oil & Gas Decommissioning Market, 2023 to 2033 report help you?
In summary, our 390-page report provides you with the following knowledge:
• Revenue forecasts to 2033 for Offshore Oil & Gas Decommissioning Market, 2023 to 2033 Market, with forecasts for removal type, techniques, technology, services, structure, and company size, each forecast at a global and regional level – discover the industry’s prospects, finding the most lucrative places for investments and revenues.
• Revenue forecasts to 2033 for four regional and 20 key national markets – See forecasts for the Offshore Oil & Gas Decommissioning Market, 2023 to 2033 market in North America, Europe, Asia-Pacific, Latin America and Middle East & Africa. Also forecasted is the market in the US, Canada, Mexico, Brazil, Russia, France, UK, Norway, Netherlands, China, Indonesia, Malaysia, and Vietnam among other prominent economies.
• Prospects for established firms and those seeking to enter the market – including company profiles for 19 of the major companies involved in the Offshore Oil & Gas Decommissioning Market, 2023 to 2033.
Find quantitative and qualitative analyses with independent predictions. Receive information that only our report contains, staying informed with invaluable business intelligence.
Information found nowhere else
With our new report, you are less likely to fall behind in knowledge or miss out on opportunities. See how our work could benefit your research, analyses, and decisions. Visiongain’s study is for everybody needing commercial analyses for the Offshore Oil & Gas Decommissioning Market, 2023 to 2033, market-leading companies. You will find data, trends and predictions.
ページTOPに戻る
Table of Contents
Table of Contents
1. Report Overview
1.1 Objectives of the Study
1.2 Introduction to Offshore Oil & Gas Decommissioning Market
1.3 What This Report Delivers
1.4 Why You Should Read This Report
1.5 Key Questions Answered by this Analytical Report Include:
1.6 Who is This Report For?
1.7 Research Methodology
1.7.1 Market Definitions
1.7.2 Market Evaluation & Forecasting Methodology
1.7.3 Data Validation
1.8 Frequently Asked Questions (FAQs)
1.9 Associated Visiongain Reports
1.10 About Visiongain
2 Executive Summary
3 Premium Insights
3.1 Key Findings
3.2 3.1 Global Offshore Oil & Gas Decommissioning Market by Region
3.3 Removal Type Segment: Market Attractiveness Index
3.4 Technology Segment: Market Attractiveness Index
3.5 Techniques Segment: Market Attractiveness Index
3.6 Services Segment: Market Attractiveness Index
3.7 Structure Segment: Market Attractiveness Index
4 Offshore Oil & Gas Decommissioning Industry Structure
4.1 Introduction
4.2 Decommissioning
4.3 Investments
4.4 Regulatory Framework
4.5 The Decommissioning Process
4.5.1 Activities Before Jobs
4.5.2 Decommissioning Planning
4.5.3 Decommissioning Engineering
4.5.4 Permitting
4.5.5 Bidding
4.5.6 Pre-job Meetings
4.6 Non-Explosive Methods
4.6.1 Diamond Wire Cutting System
4.6.2 Guillotine Saw
4.6.3 Abrasive Cutter
4.6.4 Power Shear
4.6.5 Rotary Mechanical Cutter
4.6.6 Carbon Tungsten Beaded Wire Cutter
4.7 Offshore Well Drilling
4.7.1 Spudding
4.7.2 Setting up the BOP Stack
4.7.3 Drilling
4.8 Offshore drilling process
4.9 Extraction Process
4.10 Value chain
4.10.1 Tender and Concession
4.10.2 Exploration
4.10.3 Production
4.10.4 Field Abandoning
5 Decommissioning Costing Analysis
5.1 Platform Preparation and Marine Growth Removal
5.2 Well Plugging and Abandonment
5.3 Mobilization and Demobilization
5.4 Platform and Structural Removal
5.5 Pipeline and power cables
5.6 Transportation and disposal
5.7 Site clearance
5.8 Shell mound removal
5.9 Reef enhancement
5.10 Weather contingency factor
6 Market Dynamics
6.1.1 Market Driving Factors
6.1.2 Market Restraining Factors
6.1.3 Market Opportunities
6.1.4 Challenges in the Global Market
6.2 Porter’s Five Forces Analysis
6.2.1 Bargaining Power of Buyers
6.2.2 Bargaining Power of Suppliers
6.2.3 Threat of New Entrants
6.2.4 Threat of Product Substitute
6.2.5 Competitive Rivalry
6.3 PESTLE Analysis
6.3.1 Political Factors
6.3.2 Economic Factors
6.3.3 Social Factors
6.3.4 Technology Factors
6.3.5 Environmental Factors
6.4 SWOT Analysis of Offshore Decommissioning Market
6.4.1 Strengths of the Market
6.4.2 Weaknesses of the Market
6.4.3 Opportunities in the Market
6.4.4 Threats in the Market
7 Global Offshore Oil & Gas Decommissioning Market Analysis by Removal Type
7.1 Key Findings
7.2 Global Offshore Oil & Gas Decommissioning Market Attractiveness Index by Removal Type
7.2.1 Global Offshore Oil & Gas Decommissioning Market Attractiveness Index by Removal Type
7.2.2 Global Offshore Oil & Gas Decommissioning Market Size Estimation and Forecast by Removal Type
7.3 Leave in Place Removal
7.3.1 Global Leave in Place Removal Market Size Estimation Forecast, 2023-2033 (US$ Mn)
Source: Visiongain Reports Ltd., 2023
7.3.2 Global Leave in Place Removal Market Size Estimation Forecast by Region, 2023-2033 (US$ Mn)
7.4 Partial Removal
7.4.1 Global Partial Removal Market Size Estimation Forecast, 2023-2033 (US$ Mn)
7.4.2 Global Partial Removal Market Forecast by Region, 2023-2033 (US$ Mn)
7.5 Toppled in Place Removal
7.5.1 Global Toppled in Place Removal Market Size Estimation Forecast, 2023-2033 (US$ Mn)
7.6 Global Toppled in Place Removal Market Forecast by Region, 2023-2033 (US$ Mn)
7.7 Complete Removal
7.7.1 Global Complete Removal Market Size Estimation Forecast, 2023-2033 (US$ Mn)
7.7.2 Global Complete Removal Market Forecast by Region, 2023-2033 (US$ Mn)
8 Global Offshore Oil & Gas Decommissioning Market Analysis by Techniques
8.1 Key Findings
8.2 Global Offshore Oil & Gas Decommissioning Market Attractiveness Index by Techniques
8.2.1 Global Offshore Oil & Gas Decommissioning Market Attractiveness Index by Techniques
8.2.2 Global Offshore Oil & Gas Decommissioning Market Size Estimation and Forecast by Techniques
8.3 Well Plugging and Abandonment
8.3.1 Global Well Plugging and Abandonment Market Size Estimation Forecast, 2023-2033 (US$ Mn)
8.3.2 Global Well Plugging and Abandonment Market Size Estimation Forecast by Region, 2023-2033 (US$ Mn)
8.4 Pipeline Decommissioning
8.4.1 Global Pipeline Decommissioning Market Size Estimation Forecast, 2023-2033 (US$ Mn)
8.4.2 Global Pipeline Decommissioning Market Forecast by Region, 2023-2033 (US$ Mn)
8.5 Platform Decommissioning
8.5.1 Global Platform Decommissioning Market Size Estimation Forecast, 2023-2033 (US$ Mn)
8.6 Global Platform Decommissioning Market Forecast by Region, 2023-2033 (US$ Mn)
8.7 Umbilical Decommissioning
8.7.1 Global Umbilical Decommissioning Market Size Estimation Forecast, 2023-2033 (US$ Mn)
8.7.2 Global Umbilical Decommissioning Market Forecast by Region, 2023-2033 (US$ Mn)
8.8 Subsea Structure Decommissioning
8.8.1 Global Subsea Structure Decommissioning Market Size Estimation Forecast, 2023-2033 (US$ Mn)
8.8.2 Global Subsea Structure Decommissioning Market Forecast by Region, 2023-2033 (US$ Mn)
9 Global Offshore Oil & Gas Decommissioning Market Analysis by Technology
9.1 Key Findings
9.2 Global Offshore Oil & Gas Decommissioning Market Attractiveness Index by Technology
9.2.1 Global Offshore Oil & Gas Decommissioning Market Attractiveness Index by Technology
9.2.2 Global Offshore Oil & Gas Decommissioning Market Size Estimation and Forecast by Technology
9.3 Jack side & Topside Removal
9.3.1 Global Jack side & Topside Removal Market Size Estimation Forecast, 2023-2033 (US$ Mn)
9.3.2 Global Jack side & Topside Removal Market Size Estimation Forecast by Region, 2023-2033 (US$ Mn)
9.4 Well Intervention Vessels and Systems
9.4.1 Global Well Intervention Vessels and Systems Market Size Estimation Forecast, 2023-2033 (US$ Mn)
9.4.2 Global Well Intervention Vessels and Systems Market Forecast by Region, 2023-2033 (US$ Mn)
9.5 Cutting and Severing
9.5.1 Global Cutting and Severing Market Size Estimation Forecast, 2023-2033 (US$ Mn)
9.6 Global Cutting and Severing Market Forecast by Region, 2023-2033 (US$ Mn)
9.7 Heavy Lift Technologies
9.8 Global Heavy Lift Technology Market Size Estimation Forecast, 2023-2033 (US$ Mn)
9.8.1 Global Heavy Lift Technologies Market Forecast by Region, 2023-2033 (US$ Mn)
10 Global Offshore Oil & Gas Decommissioning Market Analysis by Services
10.1 Key Findings
10.2 Global Offshore Oil & Gas Decommissioning Market Attractiveness Index by Services
10.2.1 Global Offshore Oil & Gas Decommissioning Market Attractiveness Index by Services
10.2.2 Global Offshore Oil & Gas Decommissioning Market Size Estimation and Forecast by Services
10.3 Project management & Compliance
10.3.1 Global Project management & Compliance Removal Market Size Estimation Forecast, 2023-2033 (US$ Mn)
10.3.2 Global Project management & Compliance Market Size Estimation Forecast by Region, 2023-2033 (US$ Mn)
10.4 Mobilization & Demobilization of Derrick Barges
10.4.1 Global Mobilization & Demobilization of Derrick Barges Market Size Estimation Forecast, 2023-2033 (US$ Mn)
10.4.2 Global Mobilization & Demobilization of Derrick Barges Market Forecast by Region, 2023-2033 (US$ Mn)
10.5 Materials Disposal
10.5.1 Global Materials Disposal Market Size Estimation Forecast, 2023-2033 (US$ Mn)
10.6 Global Materials Disposal Market Forecast by Region, 2023-2033 (US$ Mn)
10.7 Site Clearance
10.8 Global Site Clearance Market Size Estimation Forecast, 2023-2033 (US$ Mn)
10.8.1 Global Site Clearance Market Forecast by Region, 2023-2033 (US$ Mn)
10.9 Conductor & Power Cable Removal
10.10 Global Conductor & Power Cable Removal Market Size Estimation Forecast, 2023-2033 (US$ Mn)
10.10.1 Global Conductor & Power Cable Removal Market Forecast by Region, 2023-2033 (US$ Mn)
11 Global Offshore Oil & Gas Decommissioning Market Analysis by Structure
11.1 Key Findings
11.2 Global Offshore Oil & Gas Decommissioning Market Attractiveness Index by Structure
11.2.1 Global Offshore Oil & Gas Decommissioning Market Attractiveness Index by Structure
11.2.2 Global Offshore Oil & Gas Decommissioning Market Size Estimation and Forecast by Structure
11.3 Fixed Platforms
11.3.1 Global Fixed Platforms Removal Market Size Estimation Forecast, 2023-2033 (US$ Mn)
11.3.2 Global Fixed Platforms Market Size Estimation Forecast by Region, 2023-2033 (US$ Mn)
11.4 Compliant Towers (CT)
11.4.1 Global Compliant Towers (CT) Market Size Estimation Forecast, 2023-2033 (US$ Mn)
11.4.2 Global Compliant Towers (CT) Market Forecast by Region, 2023-2033 (US$ Mn)
11.5 Caissons
11.5.1 Global Caissons Market Size Estimation Forecast, 2023-2033 (US$ Mn)
11.6 Global Caissons Market Forecast by Region, 2023-2033 (US$ Mn)
11.7 Mobile Offshore Production Units (MOPU)
11.8 Global Mobile Offshore Production Units (MOPU) Market Size Estimation Forecast, 2023-2033 (US$ Mn)
11.8.1 Global Mobile Offshore Production Units (MOPU) Market Forecast by Region, 2023-2033 (US$ Mn)
11.9 Well Protectors (WP)
11.10 Global Well Protectors (WP)Market Size Estimation Forecast, 2023-2033 (US$ Mn)
11.10.1 Global Well Protectors (WP) Market Forecast by Region, 2023-2033 (US$ Mn)
11.11 Subsea Templates (SSTMP)
11.12 Global Subsea Templates (SSTMP) Market Size Estimation Forecast, 2023-2033 (US$ Mn)
11.12.1 Global Subsea Templates (SSTMP) Market Forecast by Region, 2023-2033 (US$ Mn)
12 Global Offshore Oil & Gas Decommissioning Market Analysis by Region
12.1 Key Findings
12.2 Regional Market Size Estimation and Forecast
12.3 COVID-19 Impact Analysis: Recovery Scenarios (V, U, W, L)
13 North America Offshore Oil & Gas Decommissioning Market Analysis
13.1 Key Findings
13.1.1 North America Offshore Oil & Gas Decommissioning Market Attractiveness Index
13.1.2 North America Offshore Oil & Gas Decommissioning Market Share by Region, 2023 & 2033
13.2 North America Offshore Oil & Gas Decommissioning Market Size Estimation and Forecast by Country
13.3 North America Offshore Oil & Gas Decommissioning Market Size Estimation and Forecast by Removal Type
13.4 North America Offshore Oil & Gas Decommissioning Market Size Estimation and Forecast by Techniques
10.5 North America Offshore Oil & Gas Decommissioning Market Size Estimation and Forecast by Technology
10.6 North America Offshore Oil & Gas Decommissioning Market Size Estimation and Forecast by Services
10.7 North America Offshore Oil & Gas Decommissioning Market Size Estimation and Forecast by Structure
13.5 U.S. Market Analysis
13.6 Canada Market Analysis
14 Europe Offshore Oil & Gas Decommissioning Market Analysis
14.1 Key Findings
14.1.1 Europe Offshore Oil & Gas Decommissioning Market Attractiveness Index
14.1.2 Europe Offshore Oil & Gas Decommissioning Market Share by Region, 2023 & 2033
14.2 Europe Offshore Oil & Gas Decommissioning Market Size Estimation and Forecast by Country
14.3 Europe Offshore Oil & Gas Decommissioning Market Size Estimation and Forecast by Removal Type
14.4 Europe Offshore Oil & Gas Decommissioning Market Size Estimation and Forecast by Techniques
11.5 Europe Offshore Oil & Gas Decommissioning Market Size Estimation and Forecast by Technology
11.6 Europe Offshore Oil & Gas Decommissioning Market Size Estimation and Forecast by Services
11.7 Europe Offshore Oil & Gas Decommissioning Market Size Estimation and Forecast by Structure
11.8 UK Market Analysis
11.9 Norway Market Analysis
14.10 Netherlands Market Analysis
14.11 Russia Market Analysis
14.12 Italy Market Analysis
14.13 Rest of Europe Market Analysis
15 Asia-Pacific Offshore Oil & Gas Decommissioning Market Analysis
15.1 Key Findings
15.1.1 Asia-Pacific Offshore Oil & Gas Decommissioning Market Attractiveness Index
15.1.2 Asia-Pacific Offshore Oil & Gas Decommissioning Market Share by Region, 2023 & 2033
15.2 Asia-Pacific Offshore Oil & Gas Decommissioning Market Size Estimation and Forecast by Country
15.3 Asia-Pacific Offshore Oil & Gas Decommissioning Market Size Estimation and Forecast by Removal Type
15.4 Asia-Pacific Offshore Oil & Gas Decommissioning Market Size Estimation and Forecast by Techniques
12.5 Asia-Pacific Offshore Oil & Gas Decommissioning Market Size Estimation and Forecast by Technology
12.6 Asia-Pacific Offshore Oil & Gas Decommissioning Market Size Estimation and Forecast by Services
12.7 Asia-Pacific Offshore Oil & Gas Decommissioning Market Size Estimation and Forecast by Structure
12.8 China Market Analysis
12.9 Indonesia Market Analysis
15.10 Malaysia Market Analysis
15.11 Australia Market Analysis
15.12 Vietnam Market Analysis
15.13 Rest of Asia-Pacific Market Analysis
16 Middle East & Africa Offshore Oil & Gas Decommissioning Market Analysis
16.1 Key Findings
16.1.1 Middle East & Africa Offshore Oil & Gas Decommissioning Market Attractiveness Index
16.1.2 Middle East & Africa Offshore Oil & Gas Decommissioning Market Share by Region, 2023 & 2033
16.2 Middle East & Africa Offshore Oil & Gas Decommissioning Market Size Estimation and Forecast by Country
16.3 Middle East & Africa Offshore Oil & Gas Decommissioning Market Size Estimation and Forecast by Removal Type
16.4 Middle East & Africa Offshore Oil & Gas Decommissioning Market Size Estimation and Forecast by Techniques
12.5 Middle East & Africa Offshore Oil & Gas Decommissioning Market Size Estimation and Forecast by Technology
12.6 Middle East & Africa Offshore Oil & Gas Decommissioning Market Size Estimation and Forecast by Services
12.7 Middle East & Africa Offshore Oil & Gas Decommissioning Market Size Estimation and Forecast by Structure
12.8 GCC Market Analysis
12.9 South Africa Market Analysis
12.9 Rest of Middle East & Africa Market Analysis
17 Latin America Offshore Oil & Gas Decommissioning Market Analysis
17.1 Key Findings
17.1.1 Latin America Offshore Oil & Gas Decommissioning Market Attractiveness Index
17.1.2 Latin America Offshore Oil & Gas Decommissioning Market Share by Region, 2023 & 2033
17.2 Latin America Offshore Oil & Gas Decommissioning Market Size Estimation and Forecast by Country
17.3 Latin America Offshore Oil & Gas Decommissioning Market Size Estimation and Forecast by Removal Type
17.4 Latin America Offshore Oil & Gas Decommissioning Market Size Estimation and Forecast by Techniques
17.5 Latin America Offshore Oil & Gas Decommissioning Market Size Estimation and Forecast by Technology
17.6 Latin America Offshore Oil & Gas Decommissioning Market Size Estimation and Forecast by Services
17.7 Latin America Offshore Oil & Gas Decommissioning Market Size Estimation and Forecast by Structure
17.8 Brazil Market Analysis
17.9 Mexico Market Analysis
17.9 Rest of Latin America Market Analysis
18 Company Profiles
18.1 Halliburton Company
18.1.1 Company Snapshot
18.1.2 Company Overview
18.1.3 Financial Analysis
18.1.4 Product Benchmarking
18.1.5 Strategic Outlook
18.2 Petrofac Limited
18.2.1 Company Snapshot
18.2.2 Company Overview
18.2.3 Financial Analysis
18.2.4 Product Benchmarking
18.2.5 Strategic Outlook
18.3 Weatherford International Plc.
18.3.1 Company Snapshot
18.3.2 Company Overview
18.3.3 Financial Analysis
18.3.4 Product Benchmarking
18.3.5 Strategic Outlook
18.4 Schlumderger N.V.
18.4.1 Company Snapshot
18.4.2 Company Overview
18.4.3 Financial Analysis
18.4.4 Product Benchmarking
18.4.5 Strategic Outlook
18.5 Subsea 7 SA
18.5.1 Company Snapshot
18.5.2 Company Overview
18.5.3 Financial Analysis
18.5.4 Product Benchmarking
18.5.5 Strategic Outlook
18.6 TechnipFMC Plc
18.6.1 Company Snapshot
18.6.2 Company Overview
18.6.3 Financial Analysis
18.6.4 Product Benchmarking
18.6.5 Strategic Outlook
18.7 John Wood Group PLC
18.7.1 Company Snapshot
18.7.2 Company Overview
18.7.3 Product Benchmarking
18.7.4 Strategic Outlook
18.8 Ramboll
18.8.1 Company Snapshot
18.8.2 Company Overview
18.8.3 Product Benchmarking
18.8.4 Strategic Outlook
18.9 Oceaneering International, Inc.
18.9.1 Company Snapshot
18.9.2 Company Overview
18.9.3 Financial Analysis
18.9.4 Product Benchmarking
18.9.5 Strategic Outlook
18.10 Baker Hughes Company
18.10.1 Company Snapshot
18.10.2 Company Overview
18.10.3 Financial Analysis
18.10.4 Product Benchmarking
18.10.5 Strategic Outlook
18.11 Aker Solutions ASA
18.11.1 Company Snapshot
18.11.2 Company Overview
18.11.3 Product Benchmarking
18.11.4 Strategic Outlook
18.12 DNV GL
18.12.1 Company Snapshot
18.12.2 Company Overview
18.12.3 Product Benchmarking
18.12.4 Strategic Outlook
18.13 Occidental Petroleum Corporation
18.13.1 Company Snapshot
18.13.2 Company Overview
18.13.3 Financial Analysis
18.13.4 Product Benchmarking
18.13.5 Strategic Outlook
18.14 Saipem S.p.A.
18.14.1 Company Snapshot
18.14.2 Company Overview
18.14.3 Financial Analysis
18.14.4 Product Benchmarking
18.14.5 Strategic Outlook
18.15 Heerema Marine Contractors
18.15.1 Company Snapshot
18.15.2 Company Overview
18.15.3 Product Benchmarking
18.15.4 Strategic Outlook
18.16 Claxton Engineering
18.16.1 Company Snapshot
18.16.2 Company Overview
18.16.3 Product Benchmarking
18.16.4 Strategic Outlook
18.17 DeepOcean Group
18.17.1 Company Snapshot
18.17.2 Company Overview
18.17.3 Product Benchmarking
18.17.4 Strategic Outlook
18.18 AF Gruppen ASA
18.18.1 Company Snapshot
18.18.2 Company Overview
18.18.3 Product Benchmarking
18.18.4 Strategic Outlook
18.19 Bureau Veritas SA
18.19.1 Company Snapshot
18.19.2 Company Overview
18.19.3 Product Benchmarking
18.19.4 Strategic Outlook
19 Conclusion and Recommendations
19.1 Concluding Remarks from Visiongain
19.2 Recommendations for Market Players
19.2.1 The Offshore Industry Requires a Public Awareness Campaign
19.2.2 Comparative Cost Estimates
19.2.3 Safety Management Suite
List of Tables
Table 1 Global Offshore Oil & Gas Decommissioning Market Snapshot, 2023 & 2033 (US$billion, CAGR %)
Table 2 Global Offshore Oil & Gas Decommissioning Market by Removal Type, 2023-2033 (US$ Mn, AGR (%), CAGR (%))
Table 3 Global Leave in Place Removal Market Forecast, 2023-2033 (US$ Mn, AGR (%), CAGR (%))
Table 4 Global Leave in Place Removal Market by Region, 2023-2033 (US$ Mn, AGR (%), CAGR (%))
Table 5 Global Partial Removal Market Forecast, 2023-2033 (US$ Mn, AGR (%), CAGR (%))
Table 6 Global Partial Removal Market by Region, 2023-2033 (US$ Mn, AGR (%), CAGR (%))
Table 7 Global Toppled in Place Removal Market Forecast, 2023-2033 (US$ Mn, AGR (%), CAGR (%))
Table 8 Global Toppled in Place Removal Market by Region, 2023-2033 (US$ Mn, AGR (%), CAGR (%))
Table 9 Global Complete Removal Market Forecast, 2023-2033 (US$ Mn, AGR (%), CAGR (%))
Table 10 Global Complete Removal Market by Region, 2023-2033 (US$ Mn, AGR (%), CAGR (%))
Table 11 Global Offshore Oil & Gas Decommissioning Market by Techniques, 2023-2033 (US$ Mn, AGR (%), CAGR (%))
Table 12 Global Well Plugging and Abandonment Market Forecast, 2023-2033 (US$ Mn, AGR (%), CAGR (%))
Table 13 Global Well Plugging and Abandonment Market by Region, 2023-2033 (US$ Mn, AGR (%), CAGR (%))
Table 14 Global Pipeline Decommissioning Market Forecast, 2023-2033 (US$ Mn, AGR (%), CAGR (%))
Table 15 Global Pipeline Decommissioning Market by Region, 2023-2033 (US$ Mn, AGR (%), CAGR (%))
Table 16 Global Platform Decommissioning Market Forecast, 2023-2033 (US$ Mn, AGR (%), CAGR (%))
Table 17 Global Platform Decommissioning Market by Region, 2023-2033 (US$ Mn, AGR (%), CAGR (%))
Table 18 Global Umbilical Decommissioning Market Forecast, 2023-2033 (US$ Mn, AGR (%), CAGR (%))
Table 19 Global Umbilical Decommissioning Market by Region, 2023-2033 (US$ Mn, AGR (%), CAGR (%))
Table 20 Global Subsea Structure Decommissioning Market Forecast, 2023-2033 (US$ Mn, AGR (%), CAGR (%))
Table 21 Global Subsea Structure Decommissioning Market by Region, 2023-2033 (US$ Mn, AGR (%), CAGR (%))
Table 22 Global Offshore Oil & Gas Decommissioning Market by Technology, 2023-2033 (US$ Mn, AGR (%), CAGR (%))
Table 23 Global Jack side & Topside Removal Market Forecast, 2023-2033 (US$ Mn, AGR (%), CAGR (%))
Table 24 Global Jack side & Topside Removal Market by Region, 2023-2033 (US$ Mn, AGR (%), CAGR (%))
Table 25 Global Well Intervention Vessels and Systems Market Forecast, 2023-2033 (US$ Mn, AGR (%), CAGR (%))
Table 26 Global Well Intervention Vessels and Systems Market by Region, 2023-2033 (US$ Mn, AGR (%), CAGR (%))
Table 27 Global Cutting and Severing Market Forecast, 2023-2033 (US$ Mn, AGR (%), CAGR (%))
Table 28 Global Cutting and Severing Market by Region, 2023-2033 (US$ Mn, AGR (%), CAGR (%))
Table 29 Global Heavy Lift Technologies Market Forecast, 2023-2033 (US$ Mn, AGR (%), CAGR (%))
Table 30 Global Heavy Lift Technologies Market by Region, 2023-2033 (US$ Mn, AGR (%), CAGR (%))
Table 31 Global Offshore Oil & Gas Decommissioning Market by Services, 2023-2033 (US$ Mn, AGR (%), CAGR (%))
Table 32 Global Project management & Compliance Market Forecast, 2023-2033 (US$ Mn, AGR (%), CAGR (%))
Table 33 Global Project management & Compliance Market by Region, 2023-2033 (US$ Mn, AGR (%), CAGR (%))
Table 34 Global Mobilization & Demobilization of Derrick Barges Market Forecast, 2023-2033 (US$ Mn, AGR (%), CAGR (%))
Table 35 Global Mobilization & Demobilization of Derrick Barges Market by Region, 2023-2033 (US$ Mn, AGR (%), CAGR (%))
Table 36 Global Materials Disposal Market Forecast, 2023-2033 (US$ Mn, AGR (%), CAGR (%))
Table 37 Global Materials Disposal Market by Region, 2023-2033 (US$ Mn, AGR (%), CAGR (%))
Table 38 Global Site Clearance Market Forecast, 2023-2033 (US$ Mn, AGR (%), CAGR (%))
Table 39 Global Site Clearance Market by Region, 2023-2033 (US$ Mn, AGR (%), CAGR (%))
Table 40 Global Conductor & Power Cable Removal Market Forecast, 2023-2033 (US$ Mn, AGR (%), CAGR (%))
Table 41 Global Conductor & Power Cable Removal Market by Region, 2023-2033 (US$ Mn, AGR (%), CAGR (%))
Table 42 Global Offshore Oil & Gas Decommissioning Market by Structure, 2023-2033 (US$ Mn, AGR (%), CAGR (%))
Table 43 Global Fixed Platforms Market Forecast, 2023-2033 (US$ Mn, AGR (%), CAGR (%))
Table 44 Global Fixed Platforms Market by Region, 2023-2033 (US$ Mn, AGR (%), CAGR (%))
Table 45 Global Compliant Towers (CT) Market Forecast, 2023-2033 (US$ Mn, AGR (%), CAGR (%))
Table 46 Global Compliant Towers (CT) Market by Region, 2023-2033 (US$ Mn, AGR (%), CAGR (%))
Table 47 Global Caissons Market Forecast, 2023-2033 (US$ Mn, AGR (%), CAGR (%))
Table 48 Global Caissons Market by Region, 2023-2033 (US$ Mn, AGR (%), CAGR (%))
Table 49 Global Mobile Offshore Production Units (MOPU) Market Forecast, 2023-2033 (US$ Mn, AGR (%), CAGR (%))
Table 50 Global Mobile Offshore Production Units (MOPU) Market by Region, 2023-2033 (US$ Mn, AGR (%), CAGR (%))
Table 51 Global Well Protectors (WP) Market Forecast, 2023-2033 (US$ Mn, AGR (%), CAGR (%))
Table 52 Global Well Protectors (WP) Market by Region, 2023-2033 (US$ Mn, AGR (%), CAGR (%))
Table 53 Global Subsea Templates (SSTMP) Market Forecast, 2023-2033 (US$ Mn, AGR (%), CAGR (%))
Table 54 Global Subsea Templates (SSTMP) Market by Region, 2023-2033 (US$ Mn, AGR (%), CAGR (%))
Table 55 Global Offshore Oil & Gas Decommissioning Market by Region, 2023-2033 (US$ Mn, AGR (%), CAGR (%))
Table 56 Global Offshore Oil & Gas Decommissioning Market by Region, 2023-2033 (US$ Mn, AGR (%), CAGR (%)) (V-Shaped Recovery Scenario)
Table 57 Global Offshore Oil & Gas Decommissioning Market by Region, 2023-2033 (US$ Mn, AGR (%), CAGR (%)) (U-Shaped Recovery Scenario)
Table 58 Global Offshore Oil & Gas Decommissioning Market by Region, 2023-2033 (US$ Mn, AGR (%), CAGR (%)) (W-Shaped Recovery Scenario)
Table 59 Global Offshore Oil & Gas Decommissioning Market by Region, 2023-2033 (US$ Mn, AGR (%), CAGR (%)) (L-Shaped Recovery Scenario)
Table 60 North America Offshore Oil & Gas Decommissioning Market by Country, 2023-2033 (US$ Mn, AGR (%), CAGR (%))
Table 61 North America Offshore Oil & Gas Decommissioning Market by Removal Type, 2023-2033 (US$ Mn, AGR (%), CAGR (%))
Table 62 North America Offshore Oil & Gas Decommissioning Market by Techniques, 2023-2033 (US$ Mn, AGR (%), CAGR (%))
Table 63 North America Offshore Oil & Gas Decommissioning Market by Technology, 2023-2033 (US$ Mn, AGR (%), CAGR (%))
Table 64 North America Offshore Oil & Gas Decommissioning Market by Services, 2023-2033 (US$ Mn, AGR (%), CAGR (%))
Table 65 North America Offshore Oil & Gas Decommissioning Market by Structure, 2023-2033 (US$ Mn, AGR (%), CAGR (%))
Table 66 US Offshore Oil & Gas Decommissioning Market by Value, 2023-2033 (US$ Mn, AGR (%), CAGR (%))
Table 67 Canada Offshore Oil & Gas Decommissioning Market by Value, 2023-2033 (US$ Mn, AGR (%), CAGR (%))
Table 68 Europe Offshore Oil & Gas Decommissioning Market by Country, 2023-2033 (US$ Mn, AGR (%), CAGR (%))
Table 69 Europe Offshore Oil & Gas Decommissioning Market by Removal Type, 2023-2033 (US$ Mn, AGR (%), CAGR (%))
Table 70 Europe Offshore Oil & Gas Decommissioning Market by Techniques, 2023-2033 (US$ Mn, AGR (%), CAGR (%))
Table 71 Europe Offshore Oil & Gas Decommissioning Market by Technology, 2023-2033 (US$ Mn, AGR (%), CAGR (%))
Table 72 Europe Offshore Oil & Gas Decommissioning Market by Services, 2023-2033 (US$ Mn, AGR (%), CAGR (%))
Table 73 Europe Offshore Oil & Gas Decommissioning Market by Structure, 2023-2033 (US$ Mn, AGR (%), CAGR (%))
Table 74 UK Offshore Oil & Gas Decommissioning Market by Value, 2023-2033 (US$ Mn, AGR (%), CAGR (%))
Table 75 Norway Offshore Oil & Gas Decommissioning Market by Value, 2023-2033 (US$ Mn, AGR (%), CAGR (%))
Table 76 Netherlands Offshore Oil & Gas Decommissioning Market by Value, 2023-2033 (US$ Mn, AGR (%), CAGR (%))
Table 77 Russia Offshore Oil & Gas Decommissioning Market by Value, 2023-2033 (US$ Mn, AGR (%), CAGR (%))
Table 78 Italy Offshore Oil & Gas Decommissioning Market by Value, 2023-2033 (US$ Mn, AGR (%), CAGR (%))
Table 79 Rest of Europe Offshore Oil & Gas Decommissioning Market by Value, 2023-2033 (US$ Mn, AGR (%), CAGR (%))
Table 80 Asia-Pacific Offshore Oil & Gas Decommissioning Market by Country, 2023-2033 (US$ Mn, AGR (%), CAGR (%))
Table 81 Asia-Pacific Offshore Oil & Gas Decommissioning Market by Removal Type, 2023-2033 (US$ Mn, AGR (%), CAGR (%))
Table 82 Asia-Pacific Offshore Oil & Gas Decommissioning Market by Techniques, 2023-2033 (US$ Mn, AGR (%), CAGR (%))
Table 83 Asia-Pacific Offshore Oil & Gas Decommissioning Market by Technology, 2023-2033 (US$ Mn, AGR (%), CAGR (%))
Table 84 Asia-Pacific Offshore Oil & Gas Decommissioning Market by Services, 2023-2033 (US$ Mn, AGR (%), CAGR (%))
Table 85 Asia-Pacific Offshore Oil & Gas Decommissioning Market by Structure, 2023-2033 (US$ Mn, AGR (%), CAGR (%))
Table 86 China Offshore Oil & Gas Decommissioning Market by Value, 2023-2033 (US$ Mn, AGR (%), CAGR (%))
Table 87 Indonesia Offshore Oil & Gas Decommissioning Market by Value, 2023-2033 (US$ Mn, AGR (%), CAGR (%))
Table 88 Malaysia Offshore Oil & Gas Decommissioning Market by Value, 2023-2033 (US$ Mn, AGR (%), CAGR (%))
Table 89 Australia Offshore Oil & Gas Decommissioning Market by Value, 2023-2033 (US$ Mn, AGR (%), CAGR (%))
Table 90 Vietnam Offshore Oil & Gas Decommissioning Market by Value, 2023-2033 (US$ Mn, AGR (%), CAGR (%))
Table 91 Rest of Asia-Pacific Offshore Oil & Gas Decommissioning Market by Value, 2023-2033 (US$ Mn, AGR (%), CAGR (%))
Table 92 Middle East & Africa Offshore Oil & Gas Decommissioning Market by Country, 2023-2033 (US$ Mn, AGR (%), CAGR (%))
Table 93 Middle East & Africa Offshore Oil & Gas Decommissioning Market by Removal Type, 2023-2033 (US$ Mn, AGR (%), CAGR (%))
Table 94 Middle East & Africa Offshore Oil & Gas Decommissioning Market by Techniques, 2023-2033 (US$ Mn, AGR (%), CAGR (%))
Table 95 Middle East & Africa Offshore Oil & Gas Decommissioning Market by Technology, 2023-2033 (US$ Mn, AGR (%), CAGR (%))
Table 96 Middle East & Africa Offshore Oil & Gas Decommissioning Market by Services, 2023-2033 (US$ Mn, AGR (%), CAGR (%))
Table 97 Middle East & Africa Offshore Oil & Gas Decommissioning Market by Structure, 2023-2033 (US$ Mn, AGR (%), CAGR (%))
Table 98 GCC Offshore Oil & Gas Decommissioning Market by Value, 2023-2033 (US$ Mn, AGR (%), CAGR (%))
Table 99 South Africa Offshore Oil & Gas Decommissioning Market by Value, 2023-2033 (US$ Mn, AGR (%), CAGR (%))
Table 100 Rest of Middle East & Africa Offshore Oil & Gas Decommissioning Market by Value, 2023-2033 (US$ Mn, AGR (%), CAGR (%))
Table 101 Latin America Offshore Oil & Gas Decommissioning Market by Country, 2023-2033 (US$ Mn, AGR (%), CAGR (%))
Table 102 Latin America Offshore Oil & Gas Decommissioning Market by Removal Type, 2023-2033 (US$ Mn, AGR (%), CAGR (%))
Table 103 Latin America Offshore Oil & Gas Decommissioning Market by Techniques, 2023-2033 (US$ Mn, AGR (%), CAGR (%))
Table 104 Latin America Offshore Oil & Gas Decommissioning Market by Technology, 2023-2033 (US$ Mn, AGR (%), CAGR (%))
Table 105 Latin America Offshore Oil & Gas Decommissioning Market by Services, 2023-2033 (US$ Mn, AGR (%), CAGR (%))
Table 106 Latin America Offshore Oil & Gas Decommissioning Market by Structure, 2023-2033 (US$ Mn, AGR (%), CAGR (%))
Table 107 Brazil Offshore Oil & Gas Decommissioning Market by Value, 2023-2033 (US$ Mn, AGR (%), CAGR (%))
Table 108 Mexico Offshore Oil & Gas Decommissioning Market by Value, 2023-2033 (US$ Mn, AGR (%), CAGR (%))
Table 109 Rest of Latin America Offshore Oil & Gas Decommissioning Market by Value, 2023-2033 (US$ Mn, AGR (%), CAGR (%))
Table 110 Halliburton Company: Key Details, (CEO, HQ, Revenue, Founded, No. of Employees, Company Type, Website, Business Segment)
Table 111 Halliburton Company: Product Benchmarking
Table 112 Halliburton Company: Strategic Outlook
Table 113 Petrofac: Key Details, (CEO, HQ, Revenue, Founded, No. of Employees, Company Type, Website, Business Segment)
Table 114 Petrofac: Product Benchmarking
Table 115 Petrofac: Strategic Outlook
Table 116 Weatherford International Plc: Key Details, (CEO, HQ, Revenue, Founded, No. of Employees, Company Type, Website, Business Segment)
Table 117 Weatherford International Plc: Product Benchmarking
Table 118 Weatherford International Plc: Strategic Outlook
Table 119 Schlumderger N.V: Key Details, (CEO, HQ, Revenue, Founded, No. of Employees, Company Type, Website, Business Segment)
Table 120 Schlumderger N.V: Product Benchmarking
Table 121 Schlumderger N.V: Strategic Outlook
Table 122 Subsea 7 SA: Key Details, (CEO, HQ, Revenue, Founded, No. of Employees, Company Type, Website, Business Segment)
Table 123 Subsea 7 SA: Product Benchmarking
Table 124 Subsea 7 SA: Strategic Outlook
Table 125 TechnipFMC Plc: Key Details, (CEO, HQ, Revenue, Founded, No. of Employees, Company Type, Website, Business Segment)
Table 126 TechnipFMC Plc: Product Benchmarking
Table 127 TechnipFMC Plc: Strategic Outlook
Table 128 John Wood Group PLC: Key Details, (CEO, HQ, Revenue, Founded, No. of Employees, Company Type, Website, Business Segment)
Table 129 John Wood Group PLC: Product Benchmarking
Table 130 John Wood Group PLC: Strategic Outlook
Table 131 Ramboll: Key Details, (CEO, HQ, Revenue, Founded, No. of Employees, Company Type, Website, Business Segment)
Table 132 Ramboll: Product Benchmarking
Table 133 Ramboll: Strategic Outlook
Table 134 Oceaneering International, Inc: Key Details, (CEO, HQ, Revenue, Founded, No. of Employees, Company Type, Website, Business Segment)
Table 135 Oceaneering International, Inc: Product Benchmarking
Table 136 Oceaneering International, Inc: Strategic Outlook
Table 137 Baker Hughes Company: Key Details, (CEO, HQ, Revenue, Founded, No. of Employees, Company Type, Website, Business Segment)
Table 138 Baker Hughes Company: Product Benchmarking
Table 139 Baker Hughes Company: Strategic Outlook
Table 140 Aker Solutions ASA: Key Details, (CEO, HQ, Revenue, Founded, No. of Employees, Company Type, Website, Business Segment)
Table 141 Aker Solutions ASA: Product Benchmarking
Table 142 Aker Solutions ASA: Strategic Outlook
Table 143 DNV GL: Key Details, (CEO, HQ, Revenue, Founded, No. of Employees, Company Type, Website, Business Segment)
Table 144 DNV GL: Product Benchmarking
Table 145 DNV GL: Strategic Outlook
Table 146 Occidental Petroleum Corporation: Key Details, (CEO, HQ, Revenue, Founded, No. of Employees, Company Type, Website, Business Segment)
Table 147 Occidental Petroleum Corporation: Product Benchmarking
Table 148 Occidental Petroleum Corporation: Strategic Outlook
Table 149 Saipem S.p.A.: Key Details, (CEO, HQ, Revenue, Founded, No. of Employees, Company Type, Website, Business Segment)
Table 150 Saipem S.p.A.: Product Benchmarking
Table 151 Saipem S.p.A.: Strategic Outlook
Table 152 Heerema Marine Contractors: Key Details, (CEO, HQ, Revenue, Founded, No. of Employees, Company Type, Website, Business Segment)
Table 153 Heerema Marine Contractors: Strategic Outlook
Table 154 Claxton Engineering: Key Details, (CEO, HQ, Revenue, Founded, No. of Employees, Company Type, Website, Business Segment)
Table 155 Claxton Engineering: Product Benchmarking
Table 156 Claxton Engineering: Strategic Outlook
Table 157 DeepOcean Group: Key Details, (CEO, HQ, Revenue, Founded, No. of Employees, Company Type, Website, Business Segment)
Table 158 DeepOcean Group: Product Benchmarking
Table 159 DeepOcean Group: Strategic Outlook
Table 160 AF Gruppen ASA: Key Details, (CEO, HQ, Revenue, Founded, No. of Employees, Company Type, Website, Business Segment)
Table 161 AF Gruppen ASA: Product Benchmarking
Table 162 AF Gruppen ASA: Strategic Outlook
Table 163 Bureau Veritas SA: Key Details, (CEO, HQ, Revenue, Founded, No. of Employees, Company Type, Website, Business Segment)
Table 164 Bureau Veritas SA: Product Benchmarking
Table 165 Bureau Veritas SA: Strategic Outlook
List of Figures
Figure 1 Global Offshore Oil & Gas Decommissioning Market Segmentation
Figure 2 Breakdown of Primary Interviews: By Company Type, Designation, & Region
Figure 3 Global Offshore Oil & Gas Decommissioning Market Forecast by Region: Market Attractiveness Index
Figure 4 Global Offshore Oil & Gas Decommissioning Market by Removal Type: Market Attractiveness Index
Figure 5 Global Offshore Oil & Gas Decommissioning Market by Technology: Market Attractiveness Index
Figure 6 Global Offshore Oil & Gas Decommissioning Market by Techniques: Market Attractiveness Index
Figure 7 Global Offshore Oil & Gas Decommissioning Market by Services: Market Attractiveness Index
Figure 8 Global Offshore Oil & Gas Decommissioning Market by Structure: Market Attractiveness Index
Figure 9 Cost Incurred While Offshore Decommissioning
Figure 10 Global Offshore Oil & Gas Decommissioning Market: Market Dynamics
Figure 11 Global Offshore Oil & Gas Decommissioning Market: Porter’s Five Forces Analysis
Figure 12 Global Offshore Oil & Gas Decommissioning Market: PESTLE Analysis
Figure 14 Global Offshore Oil & Gas Decommissioning Market Forecast by Removal Type 2023, 2033 (Revenue, CAGR%)
Figure 15 Global Offshore Oil & Gas Decommissioning Market Forecast by Removal Type Type,2023, 2033 (Revenue, CAGR%)
Figure 16 Global Offshore Oil & Gas Decommissioning Market by Removal Type, 2023-2033 (US$ Mn, AGR (%))
Figure 17 Global Leave in Place Removal Market Forecast, 2023-2033 (US$ Mn, AGR (%))
Figure 18 Global Leave in Place Removal Market by Region, 2023-2033 (US$ Mn, AGR (%))
Figure 19 Global Partial Removal Market Forecast, 2023-2033 (US$ Mn, AGR (%))
Figure 20 Global Partial Removal Market by Region, 2023-2033 (US$ Mn, AGR (%))
Figure 21 Global Toppled in Place Removal Market Forecast, 2023-2033 (US$ Mn, AGR (%))
Figure 22 Global Toppled in Place Removal Market by Region, 2023-2033 (US$ Mn, AGR (%))
Figure 23 Global Complete Removal Market Forecast, 2023-2033 (US$ Mn, AGR (%))
Figure 24 Global Complete Removal Market by Region, 2023-2033 (US$ Mn, AGR (%))
Figure 25 Global Offshore Oil & Gas Decommissioning Market Forecast by Techniques 2023, 2033 (Revenue, CAGR%)
Figure 26 Global Offshore Oil & Gas Decommissioning Market Forecast by Techniques Type,2023, 2033 (Revenue, CAGR%)
Figure 27 Global Offshore Oil & Gas Decommissioning Market by Techniques, 2023-2033 (US$ Mn, AGR (%))
Figure 28 Global Well Plugging and Abandonment Market Forecast, 2023-2033 (US$ Mn, AGR (%))
Figure 29 Global Well Plugging and Abandonment Market by Region, 2023-2033 (US$ Mn, AGR (%))
Figure 30 Global Pipeline Decommissioning Market Forecast, 2023-2033 (US$ Mn, AGR (%))
Figure 31 Global Pipeline Decommissioning Market by Region, 2023-2033 (US$ Mn, AGR (%))
Figure 32 Global Platform Decommissioning Market Forecast, 2023-2033 (US$ Mn, AGR (%))
Figure 33 Global Platform Decommissioning Market by Region, 2023-2033 (US$ Mn, AGR (%))
Figure 34 Global Umbilical Decommissioning Market Forecast, 2023-2033 (US$ Mn, AGR (%))
Figure 35 Global Umbilical Decommissioning Market by Region, 2023-2033 (US$ Mn, AGR (%))
Figure 36 Global Subsea Structure Decommissioning Market Forecast, 2023-2033 (US$ Mn, AGR (%))
Figure 37 Global Subsea Structure Decommissioning Market by Region, 2023-2033 (US$ Mn, AGR (%))
Figure 38 Global Offshore Oil & Gas Decommissioning Market Forecast by Technology 2023, 2033 (Revenue, CAGR%)
Figure 39 Global Offshore Oil & Gas Decommissioning Market Forecast by Technology Type,2023, 2033 (Revenue, CAGR%)
Figure 40 Global Offshore Oil & Gas Decommissioning Market by Technology, 2023-2033 (US$ Mn, AGR (%))
Figure 41 Global Jack side & Topside Removal Market Forecast, 2023-2033 (US$ Mn, AGR (%))
Figure 42 Global Jack side & Topside Removal Market by Region, 2023-2033 (US$ Mn, AGR (%))
Figure 43 Global Well Intervention Vessels and Systems Market Forecast, 2023-2033 (US$ Mn, AGR (%))
Figure 44 Global Well Intervention Vessels and Systems Market by Region, 2023-2033 (US$ Mn, AGR (%))
Figure 45 Global Cutting and Severing Market Forecast, 2023-2033 (US$ Mn, AGR (%))
Figure 46 Global Cutting and Severing Market by Region, 2023-2033 (US$ Mn, AGR (%))
Figure 47 Global Heavy Lift Technologies Market Forecast, 2023-2033 (US$ Mn, AGR (%))
Figure 48 Global Heavy Lift Technologies Market by Region, 2023-2033 (US$ Mn, AGR (%))
Figure 49 Global Offshore Oil & Gas Decommissioning Market Forecast by Services 2023, 2033 (Revenue, CAGR%)
Figure 50 Global Offshore Oil & Gas Decommissioning Market Forecast by Services Type,2023, 2033 (Revenue, CAGR%)
Figure 51 Global Offshore Oil & Gas Decommissioning Market by Services, 2023-2033 (US$ Mn, AGR (%))
Figure 52 Global Project management & Compliance Market Forecast, 2023-2033 (US$ Mn, AGR (%))
Figure 53 Global Project management & Compliance Market by Region, 2023-2033 (US$ Mn, AGR (%))
Figure 54 Global Mobilization & Demobilization of Derrick Barges Market Forecast, 2023-2033 (US$ Mn, AGR (%))
Figure 55 Global Mobilization & Demobilization of Derrick Barges Market by Region, 2023-2033 (US$ Mn, AGR (%))
Figure 56 Global Materials Disposal Market Forecast, 2023-2033 (US$ Mn, AGR (%))
Figure 57 Global Materials Disposal Market by Region, 2023-2033 (US$ Mn, AGR (%))
Figure 58 Global Site Clearance Market Forecast, 2023-2033 (US$ Mn, AGR (%))
Figure 59 Global Site Clearance Market by Region, 2023-2033 (US$ Mn, AGR (%))
Figure 60 Global Conductor & Power Cable Removal Market Forecast, 2023-2033 (US$ Mn, AGR (%))
Figure 61 Global Conductor & Power Cable Removal Market by Region, 2023-2033 (US$ Mn, AGR (%))
Figure 62 Global Offshore Oil & Gas Decommissioning Market Forecast by Structure,2023, 2033 (Revenue, CAGR%)
Figure 63 Global Offshore Oil & Gas Decommissioning Market Forecast by Structure Type,2023, 2033 (Revenue, CAGR%)
Figure 64 Global Offshore Oil & Gas Decommissioning Market by Structure, 2023-2033 (US$ Mn, AGR (%))
Figure 65 Global Fixed Platforms Market Forecast, 2023-2033 (US$ Mn, AGR (%))
Figure 66 Global Fixed Platforms Market by Region, 2023-2033 (US$ Mn, AGR (%))
Figure 67 Global Compliant Towers (CT) Market Forecast, 2023-2033 (US$ Mn, AGR (%))
Figure 68 Global Compliant Towers (CT) Market by Region, 2023-2033 (US$ Mn, AGR (%))
Figure 69 Global Caissons Market Forecast, 2023-2033 (US$ Mn, AGR (%))
Figure 70 Global Caissons Market by Region, 2023-2033 (US$ Mn, AGR (%))
Figure 71 Global Mobile Offshore Production Units (MOPU) Market Forecast, 2023-2033 (US$ Mn, AGR (%))
Figure 72 Global Mobile Offshore Production Units (MOPU) Market by Region, 2023-2033 (US$ Mn, AGR (%))
Figure 73 Global Well Protectors (WP) Market Forecast, 2023-2033 (US$ Mn, AGR (%))
Figure 74 Global Well Protectors (WP) Market by Region, 2023-2033 (US$ Mn, AGR (%))
Figure 75 Global Subsea Templates (SSTMP) Market Forecast, 2023-2033 (US$ Mn, AGR (%))
Figure 76 Global Subsea Templates (SSTMP) Market by Region, 2023-2033 (US$ Mn, AGR (%))
Figure 77 Global Offshore Oil & Gas Decommissioning Market by Region, 2023-2033 (US$ Mn, AGR (%))
Figure 78 Global Offshore Oil & Gas Decommissioning Market by Region, 2023-2033 (US$ Mn, AGR (%)) (V-Shaped Recovery Scenario)
Figure 79 Global Offshore Oil & Gas Decommissioning Market by Region, 2023-2033 (US$ Mn, AGR (%)) (U-Shaped Recovery Scenario)
Figure 80 Global Offshore Oil & Gas Decommissioning Market by Region, 2023-2033 (US$ Mn, AGR (%)) (W-Shaped Recovery Scenario)
Figure 81 Global Offshore Oil & Gas Decommissioning Market by Region, 2023-2033 (US$ Mn, AGR (%)) (L-Shaped Recovery Scenario)
Figure 82 North America Offshore Oil & Gas Decommissioning Market Attractiveness Index
Figure 83 North America Offshore Oil & Gas Decommissioning Market Share Forecast 2023, 2033 (%)
Figure 84 North America Offshore Oil & Gas Decommissioning Market by Country, 2023-2033 (US$ Mn, AGR (%))
Figure 85 North America Offshore Oil & Gas Decommissioning Market by Removal Type, 2023-2033 (US$ Mn, AGR (%))
Figure 86 North America Offshore Oil & Gas Decommissioning Market Share Forecast by Removal Type, 2023 & 2033 (%)
Figure 87 North America Offshore Oil & Gas Decommissioning Market by Techniques, 2023-2033 (US$ Mn, AGR (%))
Figure 88 North America Offshore Oil & Gas Decommissioning Market Share Forecast by Techniques, 2023 & 2033 (%)
Figure 89 North America Offshore Oil & Gas Decommissioning Market by Technology, 2023-2033 (US$ Mn, AGR (%))
Figure 90 North America Offshore Oil & Gas Decommissioning Market Share Forecast Technology, 2023 & 2033 (%)
Figure 91 North America Offshore Oil & Gas Decommissioning Market by Services, 2023-2033 (US$ Mn, AGR (%))
Figure 92 North America Offshore Oil & Gas Decommissioning Market Share Forecast Service, 2023 & 2033 (%)
Figure 93 North America Offshore Oil & Gas Decommissioning Market by Structure, 2023-2033 (US$ Mn, AGR (%))
Figure 94 North America Offshore Oil & Gas Decommissioning Market Share Forecast Structure, 2023 & 2033 (%)
Figure 95 US Offshore Oil & Gas Decommissioning Market by Value, 2023-2033 (US$ Mn, AGR (%))
Figure 96 Canada Offshore Oil & Gas Decommissioning Market by Value, 2023-2033 (US$ Mn, AGR (%))
Figure 97 Europe Offshore Oil & Gas Decommissioning Market Attractiveness Index
Figure 98 Europe Offshore Oil & Gas Decommissioning Market Share Forecast 2023, 2033 (%)
Figure 99 Europe Offshore Oil & Gas Decommissioning Market by Country, 2023-2033 (US$ Mn, AGR (%))
Figure 100 Europe Offshore Oil & Gas Decommissioning Market by Removal Type, 2023-2033 (US$ Mn, AGR (%))
Figure 101 Europe Offshore Oil & Gas Decommissioning Market Share Forecast by Removal Type, 2023 & 2033 (%)
Figure 102 Europe Offshore Oil & Gas Decommissioning Market by Techniques, 2023-2033 (US$ Mn, AGR (%))
Figure 103 Europe Offshore Oil & Gas Decommissioning Market Share Forecast by Techniques, 2023 & 2033 (%)
Figure 104 Europe Offshore Oil & Gas Decommissioning Market by Technology, 2023-2033 (US$ Mn, AGR (%))
Figure 105 Europe Offshore Oil & Gas Decommissioning Market Share Forecast Technology, 2023 & 2033 (%)
Figure 106 Europe Offshore Oil & Gas Decommissioning Market by Services, 2023-2033 (US$ Mn, AGR (%))
Figure 107 Europe Offshore Oil & Gas Decommissioning Market Share Forecast Service, 2023 & 2033 (%)
Figure 108 Europe Offshore Oil & Gas Decommissioning Market by Structure, 2023-2033 (US$ Mn, AGR (%))
Figure 109 Europe Offshore Oil & Gas Decommissioning Market Share Forecast Structure, 2023 & 2033 (%)
Figure 110 UK Offshore Oil & Gas Decommissioning Market by Value, 2023-2033 (US$ Mn, AGR (%))
Figure 111 Norway Offshore Oil & Gas Decommissioning Market by Value, 2023-2033 (US$ Mn, AGR (%))
Figure 112 Netherlands Offshore Oil & Gas Decommissioning Market by Value, 2023-2033 (US$ Mn, AGR (%))
Figure 113 Russia Offshore Oil & Gas Decommissioning Market by Value, 2023-2033 (US$ Mn, AGR (%))
Figure 114 Italy Offshore Oil & Gas Decommissioning Market by Value, 2023-2033 (US$ Mn, AGR (%))
Figure 115 Rest of Europe Offshore Oil & Gas Decommissioning Market by Value, 2023-2033 (US$ Mn, AGR (%))
Figure 116 Asia-Pacific Offshore Oil & Gas Decommissioning Market Attractiveness Index
Figure 117 Asia-Pacific Offshore Oil & Gas Decommissioning Market Share Forecast 2023, 2033 (%)
Figure 118 Asia-Pacific Offshore Oil & Gas Decommissioning Market by Country, 2023-2033 (US$ Mn, AGR (%))
Figure 119 Asia-Pacific Offshore Oil & Gas Decommissioning Market by Removal Type, 2023-2033 (US$ Mn, AGR (%))
Figure 120 Asia-Pacific Offshore Oil & Gas Decommissioning Market Share Forecast by Removal Type, 2023 & 2033 (%)
Figure 121 Asia-Pacific Offshore Oil & Gas Decommissioning Market by Techniques, 2023-2033 (US$ Mn, AGR (%))
Figure 122 Asia-Pacific Offshore Oil & Gas Decommissioning Market Share Forecast by Techniques, 2023 & 2033 (%)
Figure 123 Asia-Pacific Offshore Oil & Gas Decommissioning Market by Technology, 2023-2033 (US$ Mn, AGR (%))
Figure 124 Asia-Pacific Offshore Oil & Gas Decommissioning Market Share Forecast Technology, 2023 & 2033 (%)
Figure 125 Asia-Pacific Offshore Oil & Gas Decommissioning Market by Services, 2023-2033 (US$ Mn, AGR (%))
Figure 126 Asia-Pacific Offshore Oil & Gas Decommissioning Market Share Forecast Service, 2023 & 2033 (%)
Figure 127 Asia-Pacific Offshore Oil & Gas Decommissioning Market by Structure, 2023-2033 (US$ Mn, AGR (%))
Figure 128 Asia-Pacific Offshore Oil & Gas Decommissioning Market Share Forecast Structure, 2023 & 2033 (%)
Figure 129 China Offshore Oil & Gas Decommissioning Market by Value, 2023-2033 (US$ Mn, AGR (%))
Figure 130 Indonesia Offshore Oil & Gas Decommissioning Market by Value, 2023-2033 (US$ Mn, AGR (%))
Figure 131 Malaysia Offshore Oil & Gas Decommissioning Market by Value, 2023-2033 (US$ Mn, AGR (%))
Figure 132 Australia Offshore Oil & Gas Decommissioning Market by Value, 2023-2033 (US$ Mn, AGR (%))
Figure 133 Vietnam Offshore Oil & Gas Decommissioning Market by Value, 2023-2033 (US$ Mn, AGR (%))
Figure 134 Rest of Asia-Pacific Offshore Oil & Gas Decommissioning Market by Value, 2023-2033 (US$ Mn, AGR (%))
Figure 135 Middle East & Africa Offshore Oil & Gas Decommissioning Market Attractiveness Index
Figure 136 Middle East & Africa Offshore Oil & Gas Decommissioning Market Share Forecast 2023, 2033 (%)
Figure 137 Middle East & Africa Offshore Oil & Gas Decommissioning Market by Country, 2023-2033 (US$ Mn, AGR (%))
Figure 138 Middle East & Africa Offshore Oil & Gas Decommissioning Market by Removal Type, 2023-2033 (US$ Mn, AGR (%))
Figure 139 Middle East & Africa Offshore Oil & Gas Decommissioning Market Share Forecast by Removal Type, 2023 & 2033 (%)
Figure 140 Middle East & Africa Offshore Oil & Gas Decommissioning Market by Techniques, 2023-2033 (US$ Mn, AGR (%))
Figure 141 Middle East & Africa Offshore Oil & Gas Decommissioning Market Share Forecast by Techniques, 2023 & 2033 (%)
Figure 142 Middle East & Africa Offshore Oil & Gas Decommissioning Market by Technology, 2023-2033 (US$ Mn, AGR (%))
Figure 143 Middle East & Africa Offshore Oil & Gas Decommissioning Market Share Forecast Technology, 2023 & 2033 (%)
Figure 144 Middle East & Africa Offshore Oil & Gas Decommissioning Market by Services, 2023-2033 (US$ Mn, AGR (%))
Figure 145 Middle East & Africa Offshore Oil & Gas Decommissioning Market Share Forecast Service, 2023 & 2033 (%)
Figure 146 Middle East & Africa Offshore Oil & Gas Decommissioning Market by Structure, 2023-2033 (US$ Mn, AGR (%))
Figure 147 Middle East & Africa Offshore Oil & Gas Decommissioning Market Share Forecast Structure, 2023 & 2033 (%)
Figure 148 GCC Offshore Oil & Gas Decommissioning Market by Value, 2023-2033 (US$ Mn, AGR (%))
Figure 149 South Africa Offshore Oil & Gas Decommissioning Market by Value, 2023-2033 (US$ Mn, AGR (%))
Figure 150 Rest of Middle East & Africa Offshore Oil & Gas Decommissioning Market by Value, 2023-2033 (US$ Mn, AGR (%))
Figure 151 Latin America Offshore Oil & Gas Decommissioning Market Attractiveness Index
Figure 152 Latin America Offshore Oil & Gas Decommissioning Market Share Forecast 2023, 2033 (%)
Figure 153 Latin America Offshore Oil & Gas Decommissioning Market by Country, 2023-2033 (US$ Mn, AGR (%))
Figure 154 Latin America Offshore Oil & Gas Decommissioning Market by Removal Type, 2023-2033 (US$ Mn, AGR (%))
Figure 155 Latin America Offshore Oil & Gas Decommissioning Market Share Forecast by Removal Type, 2023 & 2033 (%)
Figure 156 Latin America Offshore Oil & Gas Decommissioning Market by Techniques, 2023-2033 (US$ Mn, AGR (%))
Figure 157 Latin America Offshore Oil & Gas Decommissioning Market Share Forecast by Techniques, 2023 & 2033 (%)
Figure 158 Latin America Offshore Oil & Gas Decommissioning Market by Technology, 2023-2033 (US$ Mn, AGR (%))
Figure 159 Latin America Offshore Oil & Gas Decommissioning Market Share Forecast Technology, 2023 & 2033 (%)
Figure 160 Latin America Offshore Oil & Gas Decommissioning Market by Services, 2023-2033 (US$ Mn, AGR (%))
Figure 161 Latin America Offshore Oil & Gas Decommissioning Market Share Forecast Service, 2023 & 2033 (%)
Figure 162 Latin America Offshore Oil & Gas Decommissioning Market by Structure, 2023-2033 (US$ Mn, AGR (%))
Figure 163 Latin America Offshore Oil & Gas Decommissioning Market Share Forecast Structure, 2023 & 2033 (%)
Figure 164 Brazil Offshore Oil & Gas Decommissioning Market by Value, 2023-2033 (US$ Mn, AGR (%))
Figure 165 Mexico Offshore Oil & Gas Decommissioning Market by Value, 2023-2033 (US$ Mn, AGR (%))
Figure 166 Rest of Latin America Offshore Oil & Gas Decommissioning Market by Value, 2023-2033 (US$ Mn, AGR (%))
Figure 167 Halliburton Company: Net Revenue, 2017-2021 (US$ million, AGR%)
Figure 168 Halliburton Company: Gross Profit, 2017-2021 (US$ million, AGR%)
Figure 169 Halliburton Company: Operational Income, 2017-2021 (US$ million, AGR%)
Figure 170 Halliburton Company: EBITDA, 2017-2021 (US$ million, AGR%)
Figure 171 Petrofac: Net Revenue, 2017-2021 (US$ million, AGR%)
Figure 172 Petrofac: Gross Profit, 2017-2021 (US$ million, AGR%)
Figure 173 Petrofac: Operational Income, 2017-2021 (US$ million, AGR%)
Figure 174 Petrofac: EBITDA, 2017-2021 (US$ million, AGR%)
Figure 175 Weatherford International Plc: Net Revenue, 2017-2021 (US$ million, AGR%)
Figure 176 Weatherford International Plc: Gross Profit, 2017-2021 (US$ million, AGR%)
Figure 177 Weatherford International Plc: Operational Income, 2017-2021 (US$ million, AGR%)
Figure 178 Weatherford International Plc: EBITDA, 2017-2021 (US$ million, AGR%)
Figure 179 Schlumderger N.V: Net Revenue, 2017-2021 (US$ million, AGR%)
Figure 180 Schlumderger N.V: Gross Profit, 2017-2021 (US$ million, AGR%)
Figure 181 Schlumderger N.V: Operational Income, 2017-2021 (US$ million, AGR%)
Figure 182 Schlumderger N.V: EBITDA, 2017-2021 (US$ million, AGR%)
Figure 183 Subsea 7 SA: Net Revenue, 2017-2021 (US$ million, AGR%)
Figure 184 Subsea 7 SA: Gross Profit, 2017-2021 (US$ million, AGR%)
Figure 185 Subsea 7 SA: Operational Income, 2017-2021 (US$ million, AGR%)
Figure 186 Subsea 7 SA: EBITDA, 2017-2021 (US$ million, AGR%)
Figure 187 TechnipFMC Plc: Net Revenue, 2017-2021 (US$ million, AGR%)
Figure 188 TechnipFMC Plc: Gross Profit, 2017-2021 (US$ million, AGR%)
Figure 189 TechnipFMC Plc: Operational Income, 2017-2021 (US$ million, AGR%)
Figure 190 TechnipFMC Plc: EBITDA, 2017-2021 (US$ million, AGR%)
Figure 191 Oceaneering International, Inc: Net Revenue, 2017-2021 (US$ million, AGR%)
Figure 192 Oceaneering International, Inc: Gross Profit, 2017-2021 (US$ million, AGR%)
Figure 193 Oceaneering International, Inc: Operational Income, 2017-2021 (US$ million, AGR%)
Figure 194 Oceaneering International, Inc: EBITDA, 2017-2021 (US$ million, AGR%)
Figure 195 Baker Hughes Company: Net Revenue, 2017-2021 (US$ million, AGR%)
Figure 196 Baker Hughes Company: Gross Profit, 2017-2021 (US$ million, AGR%)
Figure 197 Baker Hughes Company: Operational Income, 2017-2021 (US$ million, AGR%)
Figure 198 Baker Hughes Company: EBITDA, 2017-2021 (US$ million, AGR%)
Figure 199 Occidental Petroleum Corporation: Net Revenue, 2017-2021 (US$ million, AGR%)
Figure 200 Occidental Petroleum Corporation: Gross Profit, 2017-2021 (US$ million, AGR%)
Figure 201 Occidental Petroleum Corporation: Operational Income, 2017-2021 (US$ million, AGR%)
Figure 202 Occidental Petroleum Corporation: EBITDA, 2017-2021 (US$ million, AGR%)
Figure 203 Saipem S.p.A.: Net Revenue, 2017-2021 (US$ million, AGR%)
Figure 204 Saipem S.p.A.: Gross Profit, 2017-2021 (US$ million, AGR%)
Figure 205 Saipem S.p.A.: Operational Income, 2017-2021 (US$ million, AGR%)
Figure 206 Saipem S.p.A.: EBITDA, 2017-2021 (US$ million, AGR%)
ページTOPに戻る
本レポートと同じKEY WORD(oil)の最新刊レポート
よくあるご質問
Visiongain社はどのような調査会社ですか?
英国の調査会社ヴィジョンゲイン社(Visiongain)は、通信とエネルギーのほか、自動車や化学・医薬品、金属など、広範な市場を対象に調査を行っています。自動車市場については、市場全般に関する調査のほ... もっと見る
調査レポートの納品までの日数はどの程度ですか?
在庫のあるものは速納となりますが、平均的には 3-4日と見て下さい。
但し、一部の調査レポートでは、発注を受けた段階で内容更新をして納品をする場合もあります。
発注をする前のお問合せをお願いします。
注文の手続きはどのようになっていますか?
1)お客様からの御問い合わせをいただきます。
2)見積書やサンプルの提示をいたします。
3)お客様指定、もしくは弊社の発注書をメール添付にて発送してください。
4)データリソース社からレポート発行元の調査会社へ納品手配します。
5) 調査会社からお客様へ納品されます。最近は、pdfにてのメール納品が大半です。
お支払方法の方法はどのようになっていますか?
納品と同時にデータリソース社よりお客様へ請求書(必要に応じて納品書も)を発送いたします。
お客様よりデータリソース社へ(通常は円払い)の御振り込みをお願いします。
請求書は、納品日の日付で発行しますので、翌月最終営業日までの当社指定口座への振込みをお願いします。振込み手数料は御社負担にてお願いします。
お客様の御支払い条件が60日以上の場合は御相談ください。
尚、初めてのお取引先や個人の場合、前払いをお願いすることもあります。ご了承のほど、お願いします。
データリソース社はどのような会社ですか?
当社は、世界各国の主要調査会社・レポート出版社と提携し、世界各国の市場調査レポートや技術動向レポートなどを日本国内の企業・公官庁及び教育研究機関に提供しております。
世界各国の「市場・技術・法規制などの」実情を調査・収集される時には、データリソース社にご相談ください。
お客様の御要望にあったデータや情報を抽出する為のレポート紹介や調査のアドバイスも致します。
|
|

