ウイルスベクターとプラスミドDNA製造市場レポート:2022-2032
Viral Vectors & Plasmid DNA Manufacturing Market Report 2022-2032
レポート詳細
ウイルスベクターとプラスミドDNA製造市場レポート 2022-2032年 :本レポートは、新たな収益の柱を目指すリーディングカンパニーが、業界とその背景にあるダイナミクスをより深く理解す... もっと見る
※上記価格は部署ライセンス(Departmental licence)価格です。
その他の価格についてはデータリソースまでお問合せください。
日本語のページは自動翻訳を利用し作成しています。
実際のレポートは英文のみでご納品いたします。

|
サマリー
レポート詳細
ウイルスベクターとプラスミドDNA製造市場レポート 2022-2032年:本レポートは、新たな収益の柱を目指すリーディングカンパニーが、業界とその背景にあるダイナミクスをより深く理解する上で、非常に有益なものとなるでしょう。また、異業種への進出や新地域での既存事業の拡大を目指す企業にとっても有用なレポートです。
ウイルスベクター遺伝子治療がもたらす好機
近年、多くの遺伝子治療製品が承認されたおかげで、待望の医薬品がその期待に応え、患者の健康に大きな影響を与え始めています。遺伝子治療は、広範な研究、業界のベストプラクティス、挑戦的な教訓の結果として進歩した、新しい医療戦略です。遺伝子治療は、年々開発・臨床試験中の薬剤が増えているにもかかわらず、まだ発展途上の段階にあります。今日、メーカーはAAVベースの医薬品の研究開発から生産、規制当局の承認に至るまで、医薬品商業化プロセスのあらゆる段階で新たな問題や困難に直面しています。この新しい産業は、遺伝子組換え抗体の分野で蓄積された専門知識を活用することができます。
プロセス開発において、コストと市場投入のスピードは重要な要素です。より効率的に、高い収率で製品を生産し、フルとエンプティのAAVの割合が高い生産システムを選択することが極めて重要です。トランスフェクションや接着細胞は、市場への到達が早いため、現在多くの企業で利用されています。ウイルスベクターの生産能力は、現在と将来の商業的な供給に対する需要を満たすために必要な能力よりも1〜2桁低いと考えられています。そのため、この分野では、生産能力の持続的な向上を達成するために必要なことに集中しています。現在ある製造施設や新しい製造施設による製造能力の拡大に加えて、生産性を向上させる製造手順の開発が継続的に行われています。これには、プラスミド構築や細胞株の改良、下流工程での工程回復などが含まれます。
マーケットリサーチレポートを購入する前に、どのような質問をすべきでしょうか?
- ウイルスベクターとプラスミドDNA製造市場はどのように進化しているのか?
- ウイルスベクターとプラスミドDNA製造市場の推進要因および抑制要因は何か?
- 各ウイルスベクターとプラスミドDNA製造サブマーケットセグメントは予測期間中にどのように成長し、2032年にこれらのサブマーケットが占める収益はどの程度になるのでしょうか?
- 2022年から2032年にかけて、各ウイルスベクターとプラスミドDNA製造サブマーケットの市場シェアはどのように推移するのでしょうか?
- 2022年から2032年にかけて、市場全体の主なドライバーは何でしょうか?
- 主要なウイルスベクターとプラスミドDNA製造市場は、マクロ経済のダイナミクスに広く追随するのか、それとも個々の国内市場が他を凌駕するのか?
- 2032年までに各国市場のシェアはどのように変化し、どの地域が2032年に市場をリードするのでしょうか?
- 主要プレイヤーは誰か、また予測期間中の見通しは?
- これらの主要企業のウイルスベクターとプラスミドDNA製造プロジェクトはどのようなものですか?
- 2022年から2032年の間に、業界はどのように進化していくのか?ウイルスベクターとプラスミドDNAの
現在および今後10年間に行われるウイルスベクターとプラスミドDNAの製造プロジェクトにはどのような意味があるのでしょうか?
- ウイルスベクターとプラスミド DNA製造市場の規模をさらに拡大するために、製品の商業化の必要性が高まっているのか?
- ウイルスベクターとプラスミド DNA製造市場の方向性と、市場の最前線にいることを保証する方法とは?
- 新製品やサービスラインに対する最適な投資オプションは何か?
- 企業を新たな成長軌道に乗せ、C-suiteに移行させるための重要な展望とは?
ウイルスベクターとプラスミドDNAの製造市場に、現在、そして今後10年間、どのような影響を与えるかを知る必要があります。
- 403ページにわたる本レポートでは、152の表と177のチャート/グラフを独占的に提供します。
- このレポートでは、業界における主要な収益性の高い分野をハイライトしているため、今すぐターゲットを絞ることができます。
- 世界、地域、国別の売上高と成長率を詳細に分析しています。
- 競合他社が成功した主要なトレンド、変化、収益予測をハイライトしています。
このレポートは、ウイルスベクターとプラスミドDNA製造市場が今後10年間にどのように発展するか、またCOVID-19の景気後退と回復の変動に即して、今日あなたに伝えます。この市場は、過去10年間のどの時点よりも、今がより重要なのです。
2032年までの予測やその他の分析により、商業的な展望が見えてくる
- 2032年までの収益予測に加え、直近の実績、成長率、市場シェアもご覧いただけます。
- ビジネスの展望や展開など、独自の分析もご覧いただけます。
- 定性的分析(市場力学、ドライバー、機会、阻害要因など)、ポーターのファイブフォース分析、PEST分析、最近の動向をご覧いただけます。
本レポートには、COVID-19が業界と貴社にどのような影響を与えるかについてのデータ分析と貴重な洞察が含まれています。COVID-19の4つの回収パターンとその影響、すなわち「V」、「L」、「W」、「U」について考察しています。
報告書の対象セグメント
ベクタータイプ別
- アデノウイルス
- レトロウイルス
- プラスミドDNA
- AAV
- レンチウイルス
- その他
用途別
- アンチセンス・RNAi
- 遺伝子治療
- 細胞治療
- ワクチン療法
エンドユース別
- 製薬会社、バイオファーマ
- 研究機関
疾患別
- 腫瘍学
- 遺伝子疾患
- 感染症
- その他
ワークフロー別
- アップストリーム
- ダウンストリーム
世界市場全体とセグメントの収益予測に加え、5つの地域と21の主要国市場の収益予測も掲載しています。
北アメリカ
- 米国
- カナダ
欧州
- ドイツ
- 英国
- フランス
- イタリア
- スペイン
- その他の欧州
アジア太平洋
- 日本
- 中国
- インド
- オーストラリア
- 韓国
- その他のアジア太平洋地域
ラテンアメリカ
- ブラジル
- メキシコ
- アルゼンチン
- その他のラテンアメリカ地域
MEA
- GCC
- 南アフリカ
- その他のMEA
レポートには、ウイルスベクターとプラスミドDNA製造市場における主要企業のプロファイルと2022年から2032年まで、これらの企業のこのセグメントに焦点を当てたものも含まれています。
主要企業と市場成長の可能性
・ Advanced BioScience Laboratories, Inc. (ABL, Inc.)
・ Batavia Biosciences
・ BioMarin
・ BioNTech IMFS
・ Biovian Oy
・ bluebird bio, Inc.
・ Creative Biogene
・ CEVEC Pharmaceuticals GmbH
・ Charles River Laboratories
・ Cytiva
・ FUJIFILM Diosynth Biotechnologies
・ Genezen
・ Lonza
・ Merck KGaA
・ Novasep (Thermofisher Scientific Inc.)
・ Patheon Pharma Services (Thermo Fisher Scientific Inc.)
・ Paragon Bioservices, Inc. (Catalent)
・ Sirion-Biotech GmbH
・ VGXI, Inc.
・ Vibalogics
・ Virovek
・ Vivebiotech
・ Waisman Biomanufacturing
・ Wuxi AppTec, Yposkesi, Inc.
・ Yposkesi, Inc.
ウイルスベクターとプラスミドDNA製造市場の世界全体の収益、金額で2022年から2032年まで、市場は2022年に5億5500万米ドルを超えると、我々の仕事は計算しています。また、2032年までの間に収益が大きく伸びると予測しています。この調査では、最も大きな可能性を秘めた企業を特定しています。彼らの能力、進歩、商業的展望を発見することで、一歩先を行くことができます。
ウイルスベクターとプラスミドDNA製造市場、2022年から2032年までのレポートはどのようにあなたのお役に立ちますか?
400ページを超えるレポートでは、要約すると以下のような知識を得ることができます。
- ウイルスベクターとプラスミドDNA製造市場の2032年までの収益予測、ベクタータイプ、アプリケーション、最終用途、疾患、ワークフローの各予測を世界と地域レベルで掲載 - 業界の展望を見出し、投資と収益に最も有利な場所を見つけることができます。
- 5地域と21主要国市場の2032年までの収益予測 - 北米、欧州、アジア太平洋、中南米、MEAのウイルスベクターとプラスミドDNA製造市場、2022年から2032年の市場予測をご覧いただけます。また、米国、カナダ、メキシコ、ブラジル、ドイツ、フランス、イギリス、イタリア、中国、インド、日本、オーストラリアなどの主要経済圏の市場も予測されています。
- 既存企業および市場参入を目指す企業の展望 - ウイルスベクターとプラスミドDNA製造市場に関わる主要企業25社の企業プロファイルを含む、2022年から2032年までの展望を掲載しています。
定量的・定性的な分析と独自の予測をご覧いただけます。私たちのレポートだけが持つ情報を入手し、貴重なビジネスインテリジェンスを得ることができます。
他にはない情報
私たちの新しいレポートがあれば、知識の遅れを取り戻し、チャンスを逃す可能性が低くなります。私たちの研究が貴社の研究、分析、意思決定にどのように役立つかをご覧ください。Visiongainの研究は、ウイルスベクターとプラスミドDNA製造市場、2022年から2032年、市場の主要企業のための商業分析を必要とするすべての人のためのものです。データ、トレンド、予測を見つけることができます。
ページTOPに戻る
目次
目次
1.レポートの概要
1.1 調査の目的
1.2 ウイルスベクターとプラスミドDNA製造市場の紹介
1.3 本レポートが提供するもの
1.4 本レポートを読むべき理由
1.5 本分析レポートが回答する主な質問には以下が含まれます。
1.6 本レポートは誰のためのものなのか?
1.7 方法論
1.7.1 市場の定義
1.7.2 市場評価・予測手法
1.7.3 データの検証
1.7.3.1 一次調査
1.7.3.2 セカンダリーリサーチ
1.8 よくある質問と回答(FAQ)
1.9 関連するVisiongainのレポート
1.10 Visiongainについて
2 エグゼクティブサマリー
3 市場の概要
3.1 主要な調査結果
3.2 マーケットダイナミクス
3.2.1 市場の推進要因
3.2.1.1 遺伝子治療薬とウイルスベクターの強固なパイプライン
3.2.1.2 メーカーによる生産能力の向上
3.2.1.3 ゲノム解読の進歩が市場成長を促進する
3.2.2 市場抑制要因
3.2.2.1 治療法のコスト高
3.2.2.2 メーカーが経験するボトルネック
3.2.3 市場機会
3.2.3.1 同種細胞療法、自己細胞療法の開発の増加
3.2.3.2 神経科学研究の前臨床研究ツールとして使用されることの増加
3.2.3.3 臨床研究数の増加
3.3 COVID-19の影響度分析
3.4 ポーターのファイブフォース分析
3.4.1 サプライヤーパワー
3.4.2 バイヤーパワー
3.4.3 競合他社の競争力
3.4.4 代替品による脅威
3.4.5 新規参入者の脅威
4 ウイルスベクター生産能力マッピング分析
4.1 CMOのウイルスベクター製造能力
4.2 クリーンルームスイートの設備主要なウイルスベクターメーカー
5 ウイルスベクター製造と収量分析
5.1 概要
5.2 ATMPベクターと製造プラットフォーム
5.3 細胞・遺伝子治療用ウイルスベクターに関する規制上の課題
6 ウイルスベクター製造:プロセス経済に関する考察と課題
6.1 製造における技術的進歩
6.2 安定した生産者細胞株
6.3 安定生産者細胞株による細胞毒性の課題への対応
6.4 安定生産者細胞株を使用する際のプロセス開発の留意点とは?
6.5 Stable Producer Cell Linesは、どのようにCGTの製造の効率化とコスト削減を実現するか?
6.5.1 上流工程の簡素化
6.5.2 試薬と労働力のコスト削減
6.5.3 スケールアップのための柔軟性向上
6.6 LVV製造のための一過性トランスフェクションから安定した生産者細胞株への切り替え時期とは?
6.7 コストに関する考察
6.8 規制当局への期待
7 ウイルスベクター生産工程分析
7.1 概要
7.2 上流ユニット業務(細胞解凍・増殖~トランスフェクション)
7.3 ダウンストリームユニット業務(収穫~精製)
7.4 製剤化・安定化、充填・仕上げ
7.5 ウイルス解析
7.6 ウイルスベクター生産施設の必要性
7.7 規制基準のニーズ
7.8 人材育成とニーズ
8 ウイルスベクターとプラスミドDNA製造市場分析:ベクタータイプ別
8.1 主な調査結果
8.2 ベクタータイプのセグメント市場魅力度指数
8.3 ウイルスベクター・プラスミドDNA製造 ベクタータイプ別市場規模推定・予測
8.4 アデノウイルス
8.4.1 地域別市場予測、2022年〜2032年 (US$ Mn)
8.4.2 地域別市場シェア、2022年&2032年(%)
8.5 レトロウイルス
8.5.1 地域別市場予測、2022年〜2032年(US$ Mn)
8.5.2 地域別市場シェア、2022年&2032年(%)
8.6 プラスミドDNA
8.6.1 地域別市場予測、2022年~2032年(US$ Mn)
8.6.2 地域別市場シェア、2022年&2032年(%)
8.7 AAV(アデノ随伴ウイルス)
8.7.1 地域別市場予測、2022年~2032年 (US$ Mn)
8.7.2 地域別市場シェア、2022年&2032年(%)
8.8 レンチウイルス
8.8.1 地域別市場予測、2022年~2032年(US$ Mn)
8.8.2 地域別市場シェア、2022年&2032年(%)
8.9 その他
8.9.1 地域別市場予測、2022年〜2032年 (US$ Mn)
8.9.2 地域別市場シェア、2022年&2032年(%)
9 ウイルスベクターとプラスミドDNA製造市場分析:用途別
9.1 主な調査結果
9.2 用途別セグメント市場魅力度指数
9.3 ウイルスベクターとプラスミドDNA製造の用途別市場規模の推定と予測
9.4 アンチセンス&RNAi
9.4.1 地域別市場予測、2022-2032年 (US$ Mn)
9.4.2 地域別市場シェア、2022年&2032年(%)
9.5 遺伝子治療
9.5.1 地域別市場予測、2022年~2032年(US$ Mn)
9.5.2 地域別市場シェア、2022年&2032年(%)
9.6 細胞治療
9.6.1 地域別市場予測、2022年~2032年 (US$ Mn)
9.6.2 地域別市場シェア、2022年&2032年(%)
9.7 ワクチン療法
9.7.1 地域別市場予測、2022年〜2032年 (US$ Mn)
9.7.2 地域別市場シェア、2022年&2032年(%)
10 ウイルスベクターとプラスミドDNAの製造市場分析:エンドユース別
10.1 主な調査結果
10.2 エンドユーズセグメンテーション市場魅力度指数
10.3 ウイルスベクターとプラスミドDNA製造のエンドユーザー別市場規模の推定と予測
10.4 製薬会社・バイオファーマ会社
10.4.1 地域別市場予測、2022-2032 (US$ Mn)
10.4.2 地域別市場シェア、2022年&2032年(%)
10.5 研究機関
10.5.1 地域別市場予測、2022年~2032年 (US$ Mn)
10.5.2 地域別市場シェア、2022年&2032年(%)
11 ウイルスベクターとプラスミドDNA製造市場分析:疾患別
11.1 主要な調査結果
11.2 疾患別セグメント市場魅力度指数
11.3 ウイルスベクターとプラスミドDNA製造の疾患別市場規模の推定と予測
11.4 オンコロジー
11.4.1 地域別市場予測、2022年〜2032年 (US$ Mn)
11.4.2 地域別市場シェア、2022年&2032年(%)
11.5 遺伝子疾患
11.5.1 地域別市場予測、2022年〜2032年 (US$ Mn)
11.5.2 地域別市場シェア、2022年&2032年(%)
11.6 感染症
11.6.1 地域別市場予測、2022年~2032年 (US$ Mn)
11.6.2 地域別市場シェア、2022年&2032年(%)
11.7 その他
11.7.1 地域別市場予測、2022年〜2032年 (US$ Mn)
11.7.2 地域別市場シェア、2022年&2032年(%)
12 ウイルスベクターとプラスミドDNA製造市場分析:ワークフロー別
12.1 主な調査結果
12.2 ワークフローセグメント市場魅力度指数
12.3 ウイルスベクターとプラスミドDNA製造のワークフロー別市場規模の推定と予測
12.4 上流
12.4.1 地域別市場予測、2022年〜2032年 (US$ Mn)
12.4.2 地域別市場シェア、2022年&2032年(%)
12.5 ダウンストリーム
12.5.1 地域別市場予測、2022年~2032年 (US$ Mn)
12.5.2 地域別市場シェア、2022年&2032年(%)
13 ウイルスベクターとプラスミドDNA製造市場分析:地域別
13.1 主要な調査結果
13.2 地域別市場規模の推定と予測
14 北米のウイルスベクターとプラスミドDNA製造市場分析
14.1 主な調査結果
14.2 北米ウイルスベクターとプラスミドDNA製造市場の魅力度指数
14.3 国別市場規模、2022年、2027年&2032年 (US$ Mn)
14.4 国別市場規模予測・予測、2022年~2032年(US$ Mn)
14.5 ベクタータイプ別市場規模予測・予測、2022年~2032年(US$ Mn)
14.6 用途別市場規模予測・予測、2022年~2032年 (US$ Mn)
14.7 エンドユース別市場規模予測・予測、2022年~2032年 (US$ Mn)
14.8 疾患別市場規模予測・予測、2022年~2032年(US$ Mn)
14.9 ワークフロー別市場規模推定・予測、2022年~2032年 (US$ Mn)
14.10 米国
14.11 カナダ
15 欧州のウイルスベクターとプラスミドDNAの製造市場分析
15.1 主な調査結果
15.2 欧州のウイルスベクターとプラスミドDNA製造市場の魅力度指数
15.3 国別市場規模、2022年、2027年&2032年 (US$ Mn)
15.4 国別市場規模予測・予測、2022年~2032年(US$ Mn)
15.5 ベクタータイプ別市場規模予測・予測、2022年~2032年(US$ Mn)
15.6 用途別市場規模予測・予測、2022年~2032年 (US$ Mn)
15.7 エンドユース別市場規模予測・予測、2022年~2032年 (US$ Mn)
15.8 疾患別市場規模予測・予測、2022年~2032年(US$ Mn)
15.9 ワークフロー別市場規模推定・予測、2022年~2032年 (US$ Mn)
15.10 ドイツ
15.11 イギリス
15.12 フランス
15.13 イタリア
15.14 スペイン
15.15 その他の欧州
16 アジア太平洋地域のウイルスベクターとプラスミドDNA製造市場分析
16.1 主な調査結果
16.2 アジア太平洋地域のウイルスベクターとプラスミドDNA製造市場の魅力度指数
16.3 国別市場規模、2022年、2027年&2032年 (US$Mn)(単位:百万円
16.4 国別市場規模予測・予測、2022年~2032年(US$ Mn)
16.5 ベクタータイプ別市場規模予測・予測、2022年~2032年(US$ Mn)
16.6 用途別市場規模予測・予測、2022年~2032年 (US$ Mn)
16.7 エンドユース別市場規模予測・予測、2022年〜2032年 (US$ Mn)
16.8 疾患別市場規模予測・予測、2022年~2032年(US$ Mn)
16.9 ワークフロー別市場規模推定・予測、2022年~2032年 (US$ Mn)
16.10 日本
16.11 中国
16.12 インド
16.13 オーストラリア
16.14 韓国
16.15 その他のアジア太平洋地域
17 ラテンアメリカのウイルスベクターとプラスミドDNA製造市場分析
17.1 主な調査結果
17.2 ラテンアメリカのウイルスベクターとプラスミドDNA製造市場の魅力度指数
17.3 国別市場規模、2022年、2027年&2032年 (US$ Mn)
17.4 国別市場規模予測・予測、2022年~2032年(US$ Mn)
17.5 ベクタータイプ別市場規模予測・予測、2022年~2032年(US$ Mn)
17.6 用途別市場規模予測・予測、2022年~2032年 (US$ Mn)
17.7 エンドユース別市場規模予測・予測、2022年〜2032年 (US$ Mn)
17.8 疾患別市場規模予測・予測、2022年~2032年(US$ Mn)
17.9 ワークフロー別市場規模予測・予測、2022年~2032年(US$ Mn)
17.10 ブラジル
17.11 メキシコ
17.12 アルゼンチン
17.13 その他のラテンアメリカ地域
18 MEAのウイルスベクターとプラスミドDNA製造市場分析
18.1 主要な調査結果
18.2 MEAのウイルスベクターとプラスミドDNA製造市場の魅力度指数
18.3 国別市場規模、2022年、2027年&2032年 (US$ Mn)
18.4 国別市場規模予測・予測、2022年~2032年(US$ Mn)
18.5 ベクタータイプ別市場規模予測・予測、2022年~2032年(US$ Mn)
18.6 用途別市場規模予測・予測、2022年~2032年 (US$ Mn)
18.7 エンドユース別市場規模予測・予測、2022年~2032年 (US$ Mn)
18.8 疾患別市場規模予測・予測、2022年~2032年(US$ Mn)
18.9 ワークフロー別市場規模推定・予測、2022年~2032年 (US$ Mn)
18.10 GCC
18.11 南アフリカ
18.12 その他のMEA地域
19 主要企業のプロフィール
19.1 戦略的展望、2019-2022年
19.2 メルクKGaA
19.2.1 企業スナップショット
19.2.2 会社概要
19.2.3 財務分析、2016-2021年
19.2.3.1 売上高、2016-2021年
19.2.3.2 売上総利益、2016-2021年
19.2.3.3 R&D、2016-2021年
19.2.4 製品ベンチマーク
19.2.5 戦略的な展望
19.3 ロンザ
19.3.1 企業スナップショット
19.3.2 会社概要
19.3.3 財務分析、2016-2021年
19.3.3.1 売上高、2016-2021年
19.3.3.2 売上総利益、2016-2021年
19.3.3.3 R&D、2017-2020年
19.3.4 製品ベンチマーク
19.3.5 戦略的な展望
19.4 富士フイルムジオシンセ・バイオテクノロジーズ
19.4.1 企業スナップショット
19.4.2 会社概要
19.4.3 ベンチマーキング
19.4.4 戦略的展望
19.5 チャールズリバーラボラトリーズ
19.5.1 企業スナップショット
19.5.2 会社概要
19.5.3 財務分析、2016-2021年
19.5.3.1 収益、2016年-2021年
19.5.3.2 売上総利益、2016年-2021年
19.5.4 製品ベンチマーク
19.5.5 戦略的な展望
19.6 パセオン ファーマ サービス(サーモフィッシャーサイエンティフィック社)
19.6.1 企業スナップショット
19.6.2 会社概要
19.6.3 財務分析、2016-2021年
19.6.3.1 売上高、2016-2021年
19.6.3.2 売上総利益、2016年-2021年
19.6.3.3 R&D、2016-2021年
19.6.4 製品ベンチマーク
19.6.5 戦略的な展望
19.7 ワイズマン・バイオマニュファクチャリング
19.7.1 企業スナップショット
19.7.2 会社概要
19.7.3 ベンチマーキング
19.8 ジェネゼン
19.8.1 企業スナップショット
19.8.2 会社概要
19.8.3 ベンチマーキング
19.8.4 戦略的展望
19.9 イーポスケーシ
19.9.1 企業スナップショット
19.9.2 会社概要
19.9.3 ベンチマーキング
19.9.4 戦略的展望
19.10 アドバンスト・バイオサイエンス・ラボラトリーズ(ABL, Inc.)
19.10.1 企業スナップショット
19.10.2 会社概要
19.10.3 製品ベンチマーク
19.10.4 戦略的展望
19.11 ノバセップ(サーモフィッシャーサイエンティフィック社)
19.11.1 企業スナップショット
19.11.2 会社概要
19.11.3 ベンチマーキング
19.11.4 戦略的展望
19.12 Cytiva
19.12.1 企業スナップショット
19.12.2 会社概要
19.12.3 ベンチマーキング
19.12.4 戦略的展望
19.13 CEVECファーマシューティカルズGmbH
19.13.1 企業スナップショット
19.13.2 会社概要
19.13.3 ベンチマーキング
19.13.4 戦略的展望
19.14 バタビア・バイオサイエンス
19.14.1 企業スナップショット
19.14.2 会社概要
19.14.3 製品ベンチマーク
19.14.4 戦略的展望
19.15 ビオビアン・オイ
19.15.1 企業スナップショット
19.15.2 会社概要
19.15.3 製品ベンチマーク
19.16 無錫 AppTec
19.16.1 企業スナップショット
19.16.2 会社概要
19.16.3 財務分析、2016-2021年
19.16.3.1 収益、2016-2021年
19.16.3.2 売上総利益、2016年-2020年
19.16.4 製品ベンチマーク
19.16.5 戦略的な展望
19.17 VGXI, Inc.
19.17.1 企業スナップショット
19.17.2 会社概要
19.17.3 ベンチマーキング
19.18 パラゴン・バイオサービス(キャタレント)
19.18.1 企業スナップショット
19.18.2 会社概要
19.18.3 製品ベンチマーク
19.18.4 戦略的な展望
19.19 シリオンバイオテック社
19.19.1 企業スナップショット
19.19.2 会社概要
19.19.3 ベンチマーキング
19.20 ビロベック
19.20.1 企業スナップショット
19.20.2 会社概要
19.20.3 ベンチマーキング
19.21 バイオテックIMFS
19.21.1 企業スナップショット
19.21.2 会社概要
19.21.3 ベンチマーキング
19.22 ビーブバイオテック
19.22.1 企業スナップショット
19.22.2 会社概要
19.22.3 ベンチマーキング
19.22.4 戦略的な展望
19.23 クリエイティブ・バイオジーン
19.23.1 企業スナップショット
19.23.2 会社概要
19.23.3 製品ベンチマーク
19.23.4 戦略的展望
19.24 バイバロジックス
19.24.1 企業スナップショット
19.24.2 会社概要
19.24.3 ベンチマーキング
19.24.4 戦略的展望
19.25 ブルーバードバイオ
19.25.1 企業スナップショット
19.25.2 会社概要
19.25.3 財務分析、2016-2021年
19.25.3.1 収入、2016-2021年
19.25.3.2 R&D、2016-2021年
19.25.4 製品ベンチマーク
19.25.5 戦略的な展望
19.26 アルデブロン
19.26.1 企業スナップショット
19.26.2 会社概要
19.26.3 ベンチマーキング
20 結論と提言
20.1 ヴィジョンゲインからの結論
20.2 市場関係者への提言
表の一覧
Table 1 Viral Vectors and Plasmid DNA Manufacturing Market Snapshot, 2022 & 2032 (US$ million, CAGR %)
Table 2 Viral Vectors and Plasmid DNA Manufacturing Market Forecast by Region, 2022-2032 (US$ mn, AGR%, CAGR%): “V” Shaped Recovery
Table 3 Viral Vectors and Plasmid DNA Manufacturing Market Forecast by Region, 2022-2032 (US$ mn, AGR%, CAGR%): "U" Shaped Recovery
Table 4 Viral Vectors and Plasmid DNA Manufacturing Market Forecast by Region, 2022-2032 (US$ mn, AGR%, CAGR%): "W" Shaped Recovery
Table 5 Viral Vectors and Plasmid DNA Manufacturing Market Forecast by Region, 2022-2032 (US$ mn, AGR%, CAGR%): "L" Shaped Recovery
Table 6 Viral Vectors and Plasmid DNA Manufacturing Market Forecast by Vector Type, 2022-2032 (US$ mn, AGR%, CAGR%)
Table 7 Ongoing and Completed Clinical Trials Employing Ad Vectors
Table 8 Adenovirus Segment Market Forecast by Region, 2022-2032 (US$ mn, AGR%, CAGR%)
Table 9 Retrovirus Segment Market Forecast by Region, 2022-2032 (US$ mn, AGR%, CAGR%)
Table 10 Plasmid DNA Segment Market Forecast by Region, 2022-2032 (US$ mn, AGR%, CAGR%)
Table 11 Ongoing Clinical Trials Employing AAV Vectors
Table 12 AAV Segment Market Forecast by Region, 2022-2032 (US$ mn, AGR%, CAGR%)
Table 13 Lentivirus Segment Market Forecast by Region, 2022-2032 (US$ mn, AGR%, CAGR%)
Table 14 Others Segment Market Forecast by Region, 2022-2032 (US$ mn, AGR%, CAGR%)
Table 15 Viral Vectors and Plasmid DNA Manufacturing Market Forecast by Application, 2022-2032 (US$ mn, AGR%, CAGR%)
Table 16 Antisense & RNAi Segment Market Forecast by Region, 2022-2032 (US$ mn, AGR%, CAGR%)
Table 17 Gene Therapy Segment Market Forecast by Region, 2022-2032 (US$ mn, AGR%, CAGR%)
Table 18 List of Cell Therapy Companies Worldwide by Location and Type
Table 19 Cell Therapy Segment Market Forecast by Region, 2022-2032 (US$ mn, AGR%, CAGR%)
Table 20 Vaccinology Segment Market Forecast by Region, 2022-2032 (US$ mn, AGR%, CAGR%)
Table 21 Viral Vectors and Plasmid DNA Manufacturing Market Forecast by End-use, 2022-2032 (US$ mn, AGR%, CAGR%)
Table 22 Pharma and Biopharma Companies Segment Market Forecast by Region, 2022-2032 (US$ mn, AGR%, CAGR%)
Table 23 Research Institutes Segment Market Forecast by Region, 2022-2032 (US$ mn, AGR%, CAGR%)
Table 24 Viral Vectors and Plasmid DNA Manufacturing Market Forecast by Disease, 2022-2032 (US$ mn, AGR%, CAGR%)
Table 25 Oncology Segment Market Forecast by Region, 2022-2032 (US$ mn, AGR%, CAGR%)
Table 26 Genetic Disorders Segment Market Forecast by Region, 2022-2032 (US$ mn, AGR%, CAGR%)
Table 27 Infectious Diseases Segment Market Forecast by Region, 2022-2032 (US$ mn, AGR%, CAGR%)
Table 28 Others Segment Market Forecast by Region, 2022-2032 (US$ mn, AGR%, CAGR%)
Table 29 Viral Vectors and Plasmid DNA Manufacturing Market Forecast by Workflow, 2022-2032 (US$ mn, AGR%, CAGR%)
Table 30 Upstream Segment Market Forecast by Region, 2022-2032 (US$ mn, AGR%, CAGR%)
Table 31 Downstream Segment Market Forecast by Region, 2022-2032 (US$ mn, AGR%, CAGR%)
Table 32 Global Viral Vectors and Plasmid DNA Manufacturing Market Forecast by Region, 2022-2032 (US$ mn, AGR%, CAGR%)
Table 33 North America Viral Vectors and Plasmid DNA Manufacturing Market Forecast by Country, 2022-2032 (US$ mn, AGR%, CAGR%)
Table 34 North America Viral Vectors and Plasmid DNA Manufacturing Market Forecast by Vector Type, 2022-2032 (US$ mn, AGR%, CAGR%)
Table 35 North America Viral Vectors and Plasmid DNA Manufacturing Market Forecast by Application, 2022-2032 (US$ mn, AGR%, CAGR%)
Table 36 North America Viral Vectors and Plasmid DNA Manufacturing Market Forecast by End-use, 2022-2032 (US$ mn, AGR%, CAGR%)
Table 37 North America Viral Vectors and Plasmid DNA Manufacturing Market Forecast by Disease, 2022-2032 (US$ mn, AGR%, CAGR%)
Table 38 North America Viral Vectors and Plasmid DNA Manufacturing Market Forecast by Workflow, 2022-2032 (US$ mn, AGR%, CAGR%)
Table 39 U.S. Viral Vectors and Plasmid DNA Manufacturing Market Forecast, 2022-2032 (US$ mn, AGR%, CAGR%)
Table 40 Canada Viral Vectors and Plasmid DNA Manufacturing Market Forecast, 2022-2032 (US$ mn, AGR%, CAGR%)
Table 41 Europe Viral Vectors and Plasmid DNA Manufacturing Market Forecast by Country, 2022-2032 (US$ mn, AGR%, CAGR%)
Table 42 Europe Viral Vectors and Plasmid DNA Manufacturing Market Forecast by Vector Type, 2022-2032 (US$ mn, AGR%, CAGR%)
Table 43 Europe Viral Vectors and Plasmid DNA Manufacturing Market Forecast by Application, 2022-2032 (US$ mn, AGR%, CAGR%)
Table 44 Europe Viral Vectors and Plasmid DNA Manufacturing Market Forecast by End-use, 2022-2032 (US$ mn, AGR%, CAGR%)
Table 45 Europe Viral Vectors and Plasmid DNA Manufacturing Market Forecast by Disease, 2022-2032 (US$ mn, AGR%, CAGR%)
Table 46 Europe Viral Vectors and Plasmid DNA Manufacturing Market Forecast by Workflow, 2022-2032 (US$ mn, AGR%, CAGR%)
Table 47 Germany Viral Vectors and Plasmid DNA Manufacturing Market Forecast, 2022-2032 (US$ mn, AGR%, CAGR%)
Table 48 UK Viral Vectors and Plasmid DNA Manufacturing Market Forecast, 2022-2032 (US$ mn, AGR%, CAGR%)
Table 49 France Viral Vectors and Plasmid DNA Manufacturing Market Forecast, 2022-2032 (US$ mn, AGR%, CAGR%)
Table 50 Italy Viral Vectors and Plasmid DNA Manufacturing Market Forecast, 2022-2032 (US$ mn, AGR%, CAGR%)
Table 51 Spain Viral Vectors and Plasmid DNA Manufacturing Market Forecast, 2022-2032 (US$ mn, AGR%, CAGR%)
Table 52 Rest of Europe Viral Vectors and Plasmid DNA Manufacturing Market Forecast, 2022-2032 (US$ mn, AGR%, CAGR%)
Table 53 Asia Pacific Viral Vectors and Plasmid DNA Manufacturing Market Forecast by Country, 2022-2032 (US$ mn, AGR%, CAGR%)
Table 54 Asia Pacific Viral Vectors and Plasmid DNA Manufacturing Market Forecast by Vector Type, 2022-2032 (US$ mn, AGR%, CAGR%)
Table 55 Asia Pacific Viral Vectors and Plasmid DNA Manufacturing Market Forecast by Application, 2022-2032 (US$ mn, AGR%, CAGR%)
Table 56 Asia Pacific Viral Vectors and Plasmid DNA Manufacturing Market Forecast by End-use, 2022-2032 (US$ mn, AGR%, CAGR%)
Table 57 Asia Pacific Viral Vectors and Plasmid DNA Manufacturing Market Forecast by Disease, 2022-2032 (US$ mn, AGR%, CAGR%)
Table 58 Asia Pacific Viral Vectors and Plasmid DNA Manufacturing Market Forecast by Workflow, 2022-2032 (US$ mn, AGR%, CAGR%)
Table 59 Japan Viral Vectors and Plasmid DNA Manufacturing Market Forecast, 2022-2032 (US$ mn, AGR%, CAGR%)
Table 60 China Viral Vectors and Plasmid DNA Manufacturing Market Forecast, 2022-2032 (US$ mn, AGR%, CAGR%)
Table 61 India Viral Vectors and Plasmid DNA Manufacturing Market Forecast, 2022-2032 (US$ mn, AGR%, CAGR%)
Table 62 Australia Viral Vectors and Plasmid DNA Manufacturing Market Forecast, 2022-2032 (US$ mn, AGR%, CAGR%)
Table 63 Australia Viral Vectors and Plasmid DNA Manufacturing Market Forecast, 2022-2032 (US$ mn, AGR%, CAGR%)
Table 64 Rest of Asia Pacific Viral Vectors and Plasmid DNA Manufacturing Market Forecast, 2022-2032 (US$ mn, AGR%, CAGR%)
Table 65 Latin America Viral Vectors and Plasmid DNA Manufacturing Market Forecast by Country, 2022-2032 (US$ mn, AGR%, CAGR%)
Table 66 Latin America Viral Vectors and Plasmid DNA Manufacturing Market Forecast by Vector Type, 2022-2032 (US$ mn, AGR%, CAGR%)
Table 67 Latin America Viral Vectors and Plasmid DNA Manufacturing Market Forecast by Application, 2022-2032 (US$ mn, AGR%, CAGR%)
Table 68 Latin America Viral Vectors and Plasmid DNA Manufacturing Market Forecast by End-use, 2022-2032 (US$ mn, AGR%, CAGR%)
Table 69 Latin America Viral Vectors and Plasmid DNA Manufacturing Market Forecast by Disease, 2022-2032 (US$ mn, AGR%, CAGR%)
Table 70 Latin America Viral Vectors and Plasmid DNA Manufacturing Market Forecast by Workflow, 2022-2032 (US$ mn, AGR%, CAGR%)
Table 71 Brazil Viral Vectors and Plasmid DNA Manufacturing Market Forecast, 2022-2032 (US$ mn, AGR%, CAGR%)
Table 72 Mexico Viral Vectors and Plasmid DNA Manufacturing Market Forecast, 2022-2032 (US$ mn, AGR%, CAGR%)
Table 73 Argentina Viral Vectors and Plasmid DNA Manufacturing Market Forecast, 2022-2032 (US$ mn, AGR%, CAGR%)
Table 74 Rest of Latin America Viral Vectors and Plasmid DNA Manufacturing Market Forecast, 2022-2032 (US$ mn, AGR%, CAGR%)
Table 75 MEA Viral Vectors and Plasmid DNA Manufacturing Market Forecast by Country, 2022-2032 (US$ mn, AGR%, CAGR%)
Table 76 MEA Viral Vectors and Plasmid DNA Manufacturing Market Forecast by Vector Type, 2022-2032 (US$ mn, AGR%, CAGR%)
Table 77 MEA Viral Vectors and Plasmid DNA Manufacturing Market Forecast by Application, 2022-2032 (US$ mn, AGR%, CAGR%)
Table 78 MEA Viral Vectors and Plasmid DNA Manufacturing Market Forecast by End-use, 2022-2032 (US$ mn, AGR%, CAGR%)
Table 79 MEA Viral Vectors and Plasmid DNA Manufacturing Market Forecast by Disease, 2022-2032 (US$ mn, AGR%, CAGR%)
Table 80 MEA Viral Vectors and Plasmid DNA Manufacturing Market Forecast by Workflow, 2022-2032 (US$ mn, AGR%, CAGR%)
Table 81 GCC Viral Vectors and Plasmid DNA Manufacturing Market Forecast, 2022-2032 (US$ mn, AGR%, CAGR%)
Table 82 South Africa Viral Vectors and Plasmid DNA Manufacturing Market Forecast, 2022-2032 (US$ mn, AGR%, CAGR%)
Table 83 Rest of MEA Viral Vectors and Plasmid DNA Manufacturing Market Forecast, 2022-2032 (US$ mn, AGR%, CAGR%)
Table 84 Strategic Outlook, 2019-2022
Table 85 Merck KGaA: Key Details (CEO, HQ, Founded, No. of Employees, Company Type, Website, Business Segment)
Table 86 Merck KGaA: Product Portfolio
Table 87 Merck KGaA: Strategic Outlook
Table 88 Lonza: Key Details (CEO, HQ, Founded, No. of Employees, Company Type, Website, Business Segment)
Table 89 Lonza: Product Portfolio
Table 90 Lonza: Strategic Outlook
Table 91 FUJIFILM Diosynth Biotechnologies: Key Details (CEO, HQ, Founded, No. of Employees, Company Type, Website, Business Segment)
Table 92 FUJIFILM Diosynth Biotechnologies: Product Portfolio
Table 93 FUJIFILM Diosynth Biotechnologies: Strategic Outlook
Table 94 Charles River Laboratories: Key Details (CEO, HQ, Founded, No. of Employees, Company Type, Website, Business Segment)
Table 95 Charles River Laboratories: Product Portfolio
Table 96 Charles River Laboratories: Strategic Outlook
Table 97 Patheon Pharma Services (Thermo Fisher Scientific Inc.): Key Details (CEO, HQ, Founded, No. of Employees, Company Type, Website, Business Segment)
Table 98 Patheon Pharma Services (Thermo Fisher Scientific Inc.): Product Portfolio
Table 99 Patheon Pharma Services (Thermo Fisher Scientific Inc.): Strategic Outlook
Table 100 Waisman Biomanufacturing: Key Details (CEO, HQ, Founded, No. of Employees, Company Type, Website, Business Segment)
Table 101 Waisman Biomanufacturing: Product Portfolio
Table 102 Genezen: Key Details (CEO, HQ, Founded, No. of Employees, Company Type, Website, Business Segment)
Table 103 Genezen: Product Portfolio
Table 104 Genezen: Strategic Outlook
Table 105 Yposkesi, Inc.: Key Details (CEO, HQ, Founded, No. of Employees, Company Type, Website, Business Segment)
Table 106 Yposkesi, Inc.: Product Portfolio
Table 107 Yposkesi, Inc.: Strategic Outlook
Table 108 Advanced BioScience Laboratories, Inc. (ABL, Inc.): Key Details (CEO, HQ, Founded, No. of Employees, Company Type, Website, Business Segment)
Table 109 Advanced BioScience Laboratories, Inc. (ABL, Inc.): Product Portfolio
Table 110 Advanced BioScience Laboratories, Inc. (ABL, Inc.): Strategic Outlook
Table 111 Novasep: Key Details (CEO, HQ, Founded, No. of Employees, Company Type, Website, Business Segment)
Table 112 Novasep Holding S.A.S: Product Portfolio
Table 113 Novasep Holding S.A.S: Strategic Outlook
Table 114 Cytiva: Key Details (CEO, HQ, Founded, No. of Employees, Company Type, Website, Business Segment)
Table 115 Cytiva: Product Portfolio
Table 116 Cytiva: Strategic Outlook
Table 117 CEVEC Pharmaceuticals GmbH: Key Details (CEO, HQ, Founded, No. of Employees, Company Type, Website, Business Segment)
Table 118 CEVEC Pharmaceuticals GmbH: Product Portfolio
Table 119 CEVEC Pharmaceuticals GmbH: Strategic Outlook
Table 120 Batavia Biosciences: Key Details (CEO, HQ, Founded, No. of Employees, Company Type, Website, Business Segment)
Table 121 Batavia Biosciences: Product Portfolio
Table 122 Batavia Biosciences: Strategic Outlook
Table 123 Biovian Oy: Key Details (CEO, HQ, Founded, No. of Employees, Company Type, Website, Business Segment)
Table 124 Biovian Oy: Product Portfolio
Table 125 Wuxi AppTec: Key Details (CEO, HQ, Founded, No. of Employees, Company Type, Website, Business Segment)
Table 126 Wuxi AppTec: Product Portfolio
Table 127 Wuxi AppTec: Strategic Outlook
Table 128 VGXI, Inc.: Key Details (CEO, HQ, Founded, No. of Employees, Company Type, Website, Business Segment)
Table 129 VGXI, Inc.: Product Portfolio
Table 130 Paragon Bioservices, Inc.: Key Details (CEO, HQ, Founded, No. of Employees, Company Type, Website, Business Segment)
Table 131 Paragon Bioservices, Inc.: Product Portfolio
Table 132 Paragon Bioservices, Inc.: Strategic Outlook
Table 133 Sirion-Biotech GmbH: Key Details (CEO, HQ, Founded, No. of Employees, Company Type, Website, Business Segment)
Table 134 Sirion-Biotech GmbH: Product Portfolio
Table 135 Virovek : Key Details (CEO, HQ, Founded, No. of Employees, Company Type, Website, Business Segment)
Table 136 Virovek : Product Portfolio
Table 137 BioNTech IMFS: Key Details (CEO, HQ, Founded, No. of Employees, Company Type, Website, Business Segment)
Table 138 BioNTech IMFS: Product Portfolio
Table 139 Vivebiotech: Key Details (CEO, HQ, Founded, No. of Employees, Company Type, Website, Business Segment)
Table 140 Vivebiotech: Product Portfolio
Table 141 Vivebiotech: Strategic Outlook
Table 142 Creative Biogene: Key Details (CEO, HQ, Founded, No. of Employees, Company Type, Website, Business Segment)
Table 143 Creative Biogene: Product Portfolio
Table 144 Creative Biogene: Strategic Outlook
Table 145 Vibalogics: Key Details (CEO, HQ, Founded, No. of Employees, Company Type, Website, Business Segment)
Table 146 Vibalogics: Product Portfolio
Table 147 Vibalogics: Strategic Outlook
Table 148 bluebird bio, Inc.: Key Details (CEO, HQ, Founded, No. of Employees, Company Type, Website, Business Segment)
Table 149 bluebird bio, Inc.: Product Portfolio
Table 150 bluebird bio, Inc.: Strategic Outlook
Table 151 Aldevron: Key Details (CEO, HQ, Founded, No. of Employees, Company Type, Website, Business Segment)
Table 152 Aldevron: Product Portfolio
図の一覧
Figure 1 Viral Vectors and Plasmid DNA Manufacturing Market Segmentation
Figure 2 Viral Vectors and Plasmid DNA Manufacturing Market by Vector Type: Market Attractiveness Index
Figure 3 Viral Vectors and Plasmid DNA Manufacturing Market by Application: Market Attractiveness Index
Figure 4 Viral Vectors and Plasmid DNA Manufacturing Market by End-use: Market Attractiveness Index
Figure 5 Viral Vectors and Plasmid DNA Manufacturing Market by Disease: Market Attractiveness Index
Figure 6 Viral Vectors and Plasmid DNA Manufacturing Market by Workflow: Market Attractiveness Index
Figure 7 Viral Vectors and Plasmid DNA Manufacturing Market Attractiveness Index by Region
Figure 8 Viral Vectors and Plasmid DNA Manufacturing Market: Market Dynamics
Figure 9 Cell and Gene Therapy Modalities
Figure 10 COVID Impact Analysis: Viral Vectors and Plasmid DNA Manufacturing Market Recovery Scenarios
Figure 11 Viral Vectors and Plasmid DNA Manufacturing Market by Region, 2022-2032 (US$ Mn, AGR %): “V” Shaped Recovery
Figure 12 Viral Vectors and Plasmid DNA Manufacturing Market by Region, 2022-2032 (US$ Mn, AGR %): “U” Shaped Recovery
Figure 13 Viral Vectors and Plasmid DNA Manufacturing Market by Region, 2022-2032 (US$ Mn, AGR %): “W” Shaped Recovery
Figure 14 Viral Vectors and Plasmid DNA Manufacturing Market by Region, 2022-2032 (US$ Mn, AGR %): “L” Shaped Recovery
Figure 15 Viral Vectors and Plasmid DNA Manufacturing Market: Porter’s Five Forces Analysis
Figure 16 Upstream Analysis
Figure 17 Downstream Analysis
Figure 18 Viral Vectors and Plasmid DNA Manufacturing Market Attractiveness Index by Vector Type
Figure 19 Viral Vectors and Plasmid DNA Manufacturing Market Forecast by Vector Type, 2022-2032 (US$ million)
Figure 20 Viral Vectors and Plasmid DNA Manufacturing Market Share Forecast by Vector Type, 2022, 2027, 2032 (%)
Figure 21 Adenovirus Market Forecast by Region, 2022-2032 (US$ million)
Figure 22 Adenovirus Market Share Forecast by Region, 2022 & 2032 (%)
Figure 23 Retrovirus Market Forecast by Region, 2022-2032 (US$ million)
Figure 24 Retrovirus Market Share Forecast by Region, 2022 & 2032 (%)
Figure 25 Plasmid DNA Market Forecast by Region, 2022-2032 (US$ million)
Figure 26 Plasmid DNA Market Share Forecast by Region, 2022 & 2032 (%)
Figure 27 AAV Market Forecast by Region, 2022-2032 (US$ million)
Figure 28 AAV Market Share Forecast by Region, 2022 & 2032 (%)
Figure 29 Lentivirus Market Forecast by Region, 2022-2032 (US$ million)
Figure 30 Lentivirus Market Share Forecast by Region, 2022 & 2032 (%)
Figure 31 Others Market Forecast by Region, 2022-2032 (US$ million)
Figure 32 Others Market Share Forecast by Region, 2022 & 2032 (%)
Figure 33 Viral Vectors and Plasmid DNA Manufacturing Market Attractiveness Index by Vector Type
Figure 34 Viral Vectors and Plasmid DNA Manufacturing Market Forecast by Application, 2022-2032 (US$ million)
Figure 35 Viral Vectors and Plasmid DNA Manufacturing Market Share Forecast by Application, 2022, 2027, 2032 (%)
Figure 36 Antisense & RNAi Market Forecast by Region, 2022-2032 (US$ million)
Figure 37 Antisense & RNAi Market Share Forecast by Region, 2022 & 2032 (%)
Figure 38 Gene Therapy Market Forecast by Region, 2022-2032 (US$ million)
Figure 39 Gene Therapy Market Share Forecast by Region, 2022 & 2032 (%)
Figure 40 Cell Therapy Market Forecast by Region, 2022-2032 (US$ million)
Figure 41 Cell Therapy Market Share Forecast by Region, 2022 & 2032 (%)
Figure 42 Vaccinology Market Forecast by Region, 2022-2032 (US$ million)
Figure 43 Vaccinology Market Share Forecast by Region, 2022 & 2032 (%)
Figure 44 Viral Vectors and Plasmid DNA Manufacturing Market Attractiveness Index by End-use
Figure 45 Viral Vectors and Plasmid DNA Manufacturing Market Forecast by End-use, 2022-2032 (US$ million)
Figure 46 Viral Vectors and Plasmid DNA Manufacturing Market Share Forecast by End-use, 2022, 2027, 2032 (%)
Figure 47 Pharma and Biopharma Companies Market Forecast by Region, 2022-2032 (US$ million)
Figure 48 Pharma and Biopharma Companies Market Share Forecast by Region, 2022 & 2032 (%)
Figure 49 Research Institutes Market Forecast by Region, 2022-2032 (US$ million)
Figure 50 Research Institutes Market Share Forecast by Region, 2022 & 2032 (%)
Figure 51 Viral Vectors and Plasmid DNA Manufacturing Market Attractiveness Index by Disease
Figure 52 Viral Vectors and Plasmid DNA Manufacturing Market Forecast by Disease, 2022-2032 (US$ million)
Figure 53 Viral Vectors and Plasmid DNA Manufacturing Market Share Forecast by Disease, 2022, 2027, 2032 (%)
Figure 54 Oncology Market Forecast by Region, 2022-2032 (US$ million)
Figure 55 Oncology Market Share Forecast by Region, 2022 & 2032 (%)
Figure 56 Genetic Disorders Market Forecast by Region, 2022-2032 (US$ million)
Figure 57 Genetic Disorders Market Share Forecast by Region, 2022 & 2032 (%)
Figure 58 Infectious Diseases Market Forecast by Region, 2022-2032 (US$ million)
Figure 59 Infectious Diseases Market Share Forecast by Region, 2022 & 2032 (%)
Figure 60 Others Market Forecast by Region, 2022-2032 (US$ million)
Figure 61 Others Market Share Forecast by Region, 2022 & 2032 (%)
Figure 62 Viral Vectors and Plasmid DNA Manufacturing Market Attractiveness Index by Workflow
Figure 63 Viral Vectors and Plasmid DNA Manufacturing Market Forecast by Workflow, 2022-2032 (US$ million)
Figure 64 Viral Vectors and Plasmid DNA Manufacturing Market Share Forecast by Workflow, 2022, 2027, 2032 (%)
Figure 65 Upstream Market Forecast by Region, 2022-2032 (US$ million)
Figure 66 Upstream Market Share Forecast by Region, 2022 & 2032 (%)
Figure 67 Downstream Market Forecast by Region, 2022-2032 (US$ million)
Figure 68 Downstream Market Share Forecast by Region, 2022 & 2032 (%)
Figure 69 Viral Vectors and Plasmid DNA Manufacturing Market Forecast by Region 2022, 2032 (Revenue, CAGR%)
Figure 70 Viral Vectors and Plasmid DNA Manufacturing Market Share Forecast by Region 2022, 2027, 2032(%)
Figure 71 Viral Vectors and Plasmid DNA Manufacturing Market by Region, 2022-2032 (US$ Mn)
Figure 72 North America Viral Vectors and Plasmid DNA Manufacturing Market Attractiveness Index
Figure 73 North America Viral Vectors and Plasmid DNA Manufacturing Market by Region, 2022, 2027 & 2032 (US$ million)
Figure 74 North America Viral Vectors and Plasmid DNA Manufacturing Market Forecast by Country, 2022-2032 (US$ million)
Figure 75 North America Viral Vectors and Plasmid DNA Manufacturing Market Share Forecast by Country, 2022 & 2032 (%)
Figure 76 North America Viral Vectors and Plasmid DNA Manufacturing Market Forecast by Vector Type, 2022-2032 (US$ million)
Figure 77 North America Viral Vectors and Plasmid DNA Manufacturing Market Share Forecast by Vector Type, 2022 & 2032 (%)
Figure 78 North America Viral Vectors and Plasmid DNA Manufacturing Market Forecast by Application, 2022-2032 (US$ million)
Figure 79 North America Viral Vectors and Plasmid DNA Manufacturing Market Share Forecast by Application, 2022 & 2032 (%)
Figure 80 North America Viral Vectors and Plasmid DNA Manufacturing Market Forecast by End-use, 2022-2032 (US$ million)
Figure 81 North America Viral Vectors and Plasmid DNA Manufacturing Market Share Forecast by End-use, 2022 & 2032 (%)
Figure 82 North America Viral Vectors and Plasmid DNA Manufacturing Market Forecast by Disease, 2022-2032 (US$ million)
Figure 83 North America Viral Vectors and Plasmid DNA Manufacturing Market Share Forecast by Disease, 2022 & 2032 (%)
Figure 84 North America Viral Vectors and Plasmid DNA Manufacturing Market Forecast by Workflow, 2022-2032 (US$ million)
Figure 85 North America Viral Vectors and Plasmid DNA Manufacturing Market Share Forecast by Workflow, 2022 & 2032 (%)
Figure 86 U.S. Viral Vectors and Plasmid DNA Manufacturing Market Forecast, 2022-2032 (US$ million, AGR %)
Figure 87 Canada Viral Vectors and Plasmid DNA Manufacturing Market Forecast, 2022-2032 (US$ million, AGR %)
Figure 88 Europe Viral Vectors and Plasmid DNA Manufacturing Market Attractiveness Index
Figure 89 Europe Viral Vectors and Plasmid DNA Manufacturing Market by Region, 2022, 2027 & 2032 (US$ million)
Figure 90 Europe Viral Vectors and Plasmid DNA Manufacturing Market Forecast by Country, 2022-2032 (US$ million)
Figure 91 Europe Viral Vectors and Plasmid DNA Manufacturing Market Share Forecast by Country, 2022 & 2032 (%)
Figure 92 Europe Viral Vectors and Plasmid DNA Manufacturing Market Forecast by Vector Type, 2022-2032 (US$ million)
Figure 93 Europe Viral Vectors and Plasmid DNA Manufacturing Market Share Forecast by Vector Type, 2022 & 2032 (%)
Figure 94 Europe Viral Vectors and Plasmid DNA Manufacturing Market Forecast by Application, 2022-2032 (US$ million)
Figure 95 Europe Viral Vectors and Plasmid DNA Manufacturing Market Share Forecast by Application, 2022 & 2032 (%)
Figure 96 Europe Viral Vectors and Plasmid DNA Manufacturing Market Forecast by End-use, 2022-2032 (US$ million)
Figure 97 Europe Viral Vectors and Plasmid DNA Manufacturing Market Share Forecast by End-use, 2022 & 2032 (%)
Figure 98 Europe Viral Vectors and Plasmid DNA Manufacturing Market Forecast by Disease, 2022-2032 (US$ million)
Figure 99 Europe Viral Vectors and Plasmid DNA Manufacturing Market Share Forecast by Disease, 2022 & 2032 (%)
Figure 100 Europe Viral Vectors and Plasmid DNA Manufacturing Market Forecast by Workflow, 2022-2032 (US$ million)
Figure 101 Europe Viral Vectors and Plasmid DNA Manufacturing Market Share Forecast by Workflow, 2022 & 2032 (%)
Figure 102 Germany Viral Vectors and Plasmid DNA Manufacturing Market Forecast, 2022-2032 (US$ million, AGR %)
Figure 103 UK Viral Vectors and Plasmid DNA Manufacturing Market Forecast, 2022-2032 (US$ million, AGR %)
Figure 104 France Viral Vectors and Plasmid DNA Manufacturing Market Forecast, 2022-2032 (US$ million, AGR %)
Figure 105 Italy Viral Vectors and Plasmid DNA Manufacturing Market Forecast, 2022-2032 (US$ million, AGR %)
Figure 106 Spain Viral Vectors and Plasmid DNA Manufacturing Market Forecast, 2022-2032 (US$ million, AGR %)
Figure 107 Rest of Europe Viral Vectors and Plasmid DNA Manufacturing Market Forecast, 2022-2032 (US$ million, AGR %)
Figure 108 Asia Pacific Viral Vectors and Plasmid DNA Manufacturing Market Attractiveness Index
Figure 109 Asia Pacific Viral Vectors and Plasmid DNA Manufacturing Market by Region, 2022, 2027 & 2032 (US$ million)
Figure 110 Asia Pacific Viral Vectors and Plasmid DNA Manufacturing Market Forecast by Country, 2022-2032 (US$ million)
Figure 111 Asia Pacific Viral Vectors and Plasmid DNA Manufacturing Market Share Forecast by Country, 2022 & 2032 (%)
Figure 112 Asia Pacific Viral Vectors and Plasmid DNA Manufacturing Market Forecast by Vector Type, 2022-2032 (US$ million)
Figure 113 Asia Pacific Viral Vectors and Plasmid DNA Manufacturing Market Share Forecast by Vector Type, 2022 & 2032 (%)
Figure 114 Asia Pacific Viral Vectors and Plasmid DNA Manufacturing Market Forecast by Application, 2022-2032 (US$ million)
Figure 115 Asia Pacific Viral Vectors and Plasmid DNA Manufacturing Market Share Forecast by Application, 2022 & 2032 (%)
Figure 116 Asia Pacific Viral Vectors and Plasmid DNA Manufacturing Market Forecast by End-use, 2022-2032 (US$ million)
Figure 117 Asia Pacific Viral Vectors and Plasmid DNA Manufacturing Market Share Forecast by End-use, 2022 & 2032 (%)
Figure 118 Asia Pacific Viral Vectors and Plasmid DNA Manufacturing Market Forecast by Disease, 2022-2032 (US$ million)
Figure 119 Asia Pacific Viral Vectors and Plasmid DNA Manufacturing Market Share Forecast by Disease, 2022 & 2032 (%)
Figure 120 Asia Pacific Viral Vectors and Plasmid DNA Manufacturing Market Forecast by Workflow, 2022-2032 (US$ million)
Figure 121 Asia Pacific Viral Vectors and Plasmid DNA Manufacturing Market Share Forecast by Workflow, 2022 & 2032 (%)
Figure 122 Japan Viral Vectors and Plasmid DNA Manufacturing Market Forecast, 2022-2032 (US$ million, AGR %)
Figure 123 China Viral Vectors and Plasmid DNA Manufacturing Market Forecast, 2022-2032 (US$ million, AGR %)
Figure 124 India Viral Vectors and Plasmid DNA Manufacturing Market Forecast, 2022-2032 (US$ million, AGR %)
Figure 125 Australia Viral Vectors and Plasmid DNA Manufacturing Market Forecast, 2022-2032 (US$ million, AGR %)
Figure 126 South Korea Viral Vectors and Plasmid DNA Manufacturing Market Forecast, 2022-2032 (US$ million, AGR %)
Figure 127 Rest of Asia Pacific Viral Vectors and Plasmid DNA Manufacturing Market Forecast, 2022-2032 (US$ million, AGR %)
Figure 128 Latin America Viral Vectors and Plasmid DNA Manufacturing Market Attractiveness Index
Figure 129 Latin America Viral Vectors and Plasmid DNA Manufacturing Market by Region, 2022, 2027 & 2032 (US$ million)
Figure 130 Latin America Viral Vectors and Plasmid DNA Manufacturing Market Forecast by Country, 2022-2032 (US$ million)
Figure 131 Latin America Viral Vectors and Plasmid DNA Manufacturing Market Share Forecast by Country, 2022 & 2032 (%)
Figure 132 Latin America Viral Vectors and Plasmid DNA Manufacturing Market Forecast by Vector Type, 2022-2032 (US$ million)
Figure 133 Latin America Viral Vectors and Plasmid DNA Manufacturing Market Share Forecast by Vector Type, 2022 & 2032 (%)
Figure 134 Latin America Viral Vectors and Plasmid DNA Manufacturing Market Forecast by Application, 2022-2032 (US$ million)
Figure 135 Latin America Viral Vectors and Plasmid DNA Manufacturing Market Share Forecast by Application, 2022 & 2032 (%)
Figure 136 Latin America Viral Vectors and Plasmid DNA Manufacturing Market Forecast by End-use, 2022-2032 (US$ million)
Figure 137 Latin America Viral Vectors and Plasmid DNA Manufacturing Market Share Forecast by End-use, 2022 & 2032 (%)
Figure 138 Latin America Viral Vectors and Plasmid DNA Manufacturing Market Forecast by Disease, 2022-2032 (US$ million)
Figure 139 Latin America Viral Vectors and Plasmid DNA Manufacturing Market Share Forecast by Disease, 2022 & 2032 (%)
Figure 140 Latin America Viral Vectors and Plasmid DNA Manufacturing Market Forecast by Workflow, 2022-2032 (US$ million)
Figure 141 Latin America Viral Vectors and Plasmid DNA Manufacturing Market Share Forecast by Workflow, 2022 & 2032 (%)
Figure 142 Brazil Viral Vectors and Plasmid DNA Manufacturing Market Forecast, 2022-2032 (US$ million, AGR %)
Figure 143 Mexico Viral Vectors and Plasmid DNA Manufacturing Market Forecast, 2022-2032 (US$ million), AGR %
Figure 144 Argentina Viral Vectors and Plasmid DNA Manufacturing Market Forecast, 2022-2032 (US$ million, AGR %)
Figure 145 Rest of Latin America Viral Vectors and Plasmid DNA Manufacturing Market Forecast, 2022-2032 (US$ million, AGR %)
Figure 146 MEA Viral Vectors and Plasmid DNA Manufacturing Market Attractiveness Index
Figure 147 MEA Viral Vectors and Plasmid DNA Manufacturing Market by Region, 2022, 2027 & 2032 (US$ million)
Figure 148 MEA Viral Vectors and Plasmid DNA Manufacturing Market Forecast by Country, 2022-2032 (US$ million)
Figure 149 MEA Viral Vectors and Plasmid DNA Manufacturing Market Share Forecast by Country, 2022 & 2032 (%)
Figure 150 MEA Viral Vectors and Plasmid DNA Manufacturing Market Forecast by Vector Type, 2022-2032 (US$ million)
Figure 151 MEA Viral Vectors and Plasmid DNA Manufacturing Market Share Forecast by Vector Type, 2022 & 2032 (%)
Figure 152 MEA Viral Vectors and Plasmid DNA Manufacturing Market Forecast by Application, 2022-2032 (US$ million)
Figure 153 MEA Viral Vectors and Plasmid DNA Manufacturing Market Share Forecast by Application, 2022 & 2032 (%)
Figure 154 MEA Viral Vectors and Plasmid DNA Manufacturing Market Forecast by End-use, 2022-2032 (US$ million)
Figure 155 MEA Viral Vectors and Plasmid DNA Manufacturing Market Share Forecast by End-use, 2022 & 2032 (%)
Figure 156 MEA Viral Vectors and Plasmid DNA Manufacturing Market Forecast by Disease, 2022-2032 (US$ million)
Figure 157 MEA Viral Vectors and Plasmid DNA Manufacturing Market Share Forecast by Disease, 2022 & 2032 (%)
Figure 158 MEA Viral Vectors and Plasmid DNA Manufacturing Market Forecast by Workflow, 2022-2032 (US$ million)
Figure 159 MEA Viral Vectors and Plasmid DNA Manufacturing Market Share Forecast by Workflow, 2022 & 2032 (%)
Figure 160 GCC Viral Vectors and Plasmid DNA Manufacturing Market Forecast, 2022-2032 (US$ million, AGR %)
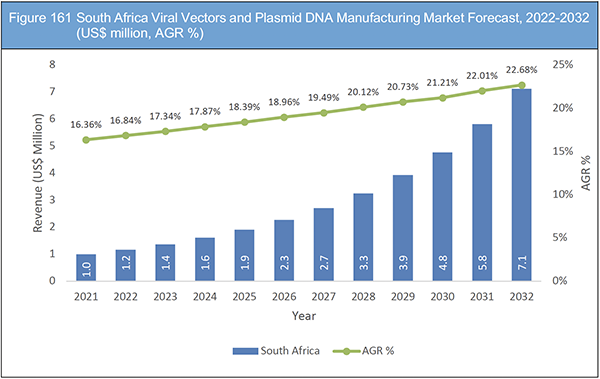
Figure 161 South Africa Viral Vectors and Plasmid DNA Manufacturing Market Forecast, 2022-2032 (US$ million, AGR %)
Figure 162 Rest of MEA Viral Vectors and Plasmid DNA Manufacturing Market Forecast, 2022-2032 (US$ million, AGR %)
Figure 163 Merck KGaA.: Net Revenue, 2016-2021 (US$ Mn, AGR%)
Figure 164 Merck KGaA.: Gross Profit, 2016-2021 (US$ Mn, AGR%)
Figure 165 Merck KGaA.: R&D, 2016-2021 (US$ Mn, AGR%)
Figure 166 Lonza.: Net Revenue, 2016-2021 (US$ Mn, AGR%)
Figure 167 Lonza.: Gross Profit, 2016-2021 (US$ Mn, AGR%)
Figure 168 Lonza.: R&D, 2017-2020 (US$ Mn, AGR%)
Figure 169 Charles River Laboratories.: Net Revenue, 2016-2021 (US$ Mn, AGR%)
Figure 170 Charles River Laboratories.: Gross Profit, 2016-2021 (US$ Mn, AGR%)
Figure 171 Thermofisher Fisher Scientific Inc..: Net Revenue, 2016-2021 (US$ Mn, AGR%)
Figure 172 Thermofisher Scientific Inc..: Gross Profit, 2016-2021 (US$ Mn, AGR%)
Figure 173 Thermofisher Scientific Inc.: R&D, 2016-2021 (US$ Mn, AGR%)
Figure 174 Wuxi AppTec.: Net Revenue, 2016-2021 (US$ Mn, AGR%)
Figure 175 Wuxi AppTec.: Gross Profit, 2016-2020 (US$ Mn, AGR%)
Figure 176 bluebird bio, Inc.: Net Revenue, 2016-2021 (US$ Mn, AGR%)
Figure 177 bluebird bio, Inc.: R&D, 2016-2021 (US$ Mn, AGR%)
ページTOPに戻る
Summary
この調査レポートは世界のウイルスベクターとプラスミドDNA製造市場を調査し、ベクタータイプ別、用途別、エンドユース別、ワークフロー別、地域別に2022年から2032年までの予測結果を掲載しています。また関連企業情報を提供しています。
主な掲載内容(目次より抜粋)
-
レポート概要
-
エグゼクティブサマリー
-
市場概要
-
ウイルスベクター生産能力マッピング分析
-
ウイルスベクター生産・収量分析
-
ウイルスベクター製造:プロセス経済に関する考察と課題
-
ウイルスベクター製造工程分析
-
ウイルスベクターとプラスミドDNA製造市場分析:ベクタータイプ別
-
ウイルスベクターとプラスミドDNA製造市場分析:用途別
-
ウイルスベクターとプラスミドDNA製造市場分析:エンドユース別
-
ウイルスベクターとプラスミドDNA製造市場分析:疾患別
-
ウイルスベクターとプラスミドDNA製造市場分析:ワークフロー別
-
ウイルスベクターとプラスミドDNA製造市場分析:地域別
-
北米のウイルスベクターとプラスミドDNA製造市場分析
-
欧州のウイルスベクターとプラスミドDNA製造市場分析
-
アジア太平洋地域のウイルスベクターとプラスミドDNA製造市場分析
-
ラテンアメリカのウイルスベクターとプラスミドDNA製造市場分析
-
MEAのウイルスベクターとプラスミドDNA製造市場分析
-
主要企業のプロフィール
Report Details
The Viral Vectors and Plasmid DNA Manufacturing Market Report 2022-2032: This report will prove invaluable to leading firms striving for new revenue pockets if they wish to better understand the industry and its underlying dynamics. It will be useful for companies that would like to expand into different industries or to expand their existing operations in a new region.
Viral-Vector Gene Therapy Offers Lucrative Opportunities
The long anticipated medicines are beginning to live up to their promise and have a significant impact on patient health thanks to the approval of a number of gene therapy products in recent years. Gene treatments are a novel medical strategy that have advanced as a result of extensive research, industry best practises, and challenging lessons. Gene therapy is still in its infancy, despite the fact that there are more and more medications in development and clinical trials every year. Manufacturers today face fresh issues and difficulties at every stage of the drug-commercialization process, from research and development to production and regulatory approval of AAV-based medicines. While this emerging industry can profit from the expertise amassed in the recombinant antibody space.
Costs and speed to market are important factors in process development. It is crucial to choose a production system that produces products more efficiently, with high yields, and with a high proportion of full to empty AAV. Transfection and adherent cells are currently being used by a number of businesses to reach the market since they offer a quick path there. The capacity to produce viral vectors is thought to be between one and two orders of magnitude less than what is required to meet both the present and future demands for commercial supply. As a result, the entire sector is concentrating on what is required to achieve sustained growth in capacity. The development of manufacturing procedures that can boost productivity is continuous, in addition to expanding manufacturing capacity through current and new manufacturing facilities. This entails improving plasmid constructions and cell lines, as well as process recovery in downstream processing.
What Questions Should You Ask before Buying a Market Research Report?
• How is the viral vectors and plasmid DNA manufacturing market evolving?
• What is driving and restraining the viral vectors and plasmid DNA manufacturing market?
• How will each viral vectors and plasmid DNA manufacturing submarket segment grow over the forecast period and how much revenue will these submarkets account for in 2032?
• How will the market shares for each viral vectors and plasmid DNA manufacturing submarket develop from 2022 to 2032?
• What will be the main driver for the overall market from 2022 to 2032?
• Will leading viral vectors and plasmid DNA manufacturing markets broadly follow the macroeconomic dynamics, or will individual national markets outperform others?
• How will the market shares of the national markets change by 2032 and which geographical region will lead the market in 2032?
• Who are the leading players and what are their prospects over the forecast period?
• What are the viral vectors and plasmid DNA manufacturing projects for these leading companies?
• How will the industry evolve during the period between 2022 and 2032? What are the implications of
viral vectors and plasmid DNA manufacturing projects taking place now and over the next 10 years?
• Is there a greater need for product commercialisation to further scale the viral vectors and plasmid DNA manufacturing market?
• Where is the viral vectors and plasmid DNA manufacturing market heading and how can you ensure you are at the forefront of the market?
• What are the best investment options for new product and service lines?
• What are the key prospects for moving companies into a new growth path and C-suite?
You need to discover how this will impact the viral vectors and plasmid DNA manufacturing market today, and over the next 10 years:
• Our 403-page report provides 152 tables and 177 charts/graphs exclusively to you.
• The report highlights key lucrative areas in the industry so you can target them – NOW.
• It contains in-depth analysis of global, regional and national sales and growth.
• It highlights for you the key successful trends, changes and revenue projections made by your competitors.
This report tells you TODAY how the viral vectors and plasmid DNA manufacturing market will develop in the next 10 years, and in line with the variations in COVID-19 economic recession and bounce. This market is more critical now than at any point over the last 10 years.
Forecasts to 2032 and other analyses reveal commercial prospects
• In addition to revenue forecasting to 2032, our new study provides you with recent results, growth rates, and market shares.
• You will find original analyses, with business outlooks and developments.
• Discover qualitative analyses (including market dynamics, drivers, opportunities, and restraints), Porter’s Five Forces Analysis, PEST Analysis and recent developments.
This report includes data analysis and invaluable insight into how COVID-19 will affect the industry and your company. Four COVID-19 recovery patterns and their impact, namely, “V”, “L”, “W” and “U” are discussed in this report.
Segments Covered in the Report
Vector Type
• Adenovirus
• Retrovirus
• Plasmid DNA
• AAV
• Lentivirus
• Others
Application
• Antisense & RNAi
• Gene Therapy
• Cell Therapy
• Vaccinology
End-use
• Pharma and Biopharma Companies
• Research Institutes
Disease
• Oncology
• Genetic Disorders
• Infectious Diseases
• Others
Workflow
• Upstream
• Downstream
In addition to the revenue predictions for the overall world market and segments, you will also find revenue forecasts for five regional and 21 leading national markets:
North America
• U.S.
• Canada
Europe
• Germany
• UK
• France
• Italy
• Spain
• Rest of Europe
Asia Pacific
• Japan
• China
• India
• Australia
• South Korea
• Rest of Asia Pacific
Latin America
• Brazil
• Mexico
• Argentina
• Rest of Latin America
MEA
• GCC
• South Africa
• Rest of MEA
The report also includes profiles and for some of the leading companies in the Viral Vectors and Plasmid DNA Manufacturing Market, 2022 to 2032, with a focus on this segment of these companies’ operations.
Leading companies and the potential for market growth
• Advanced BioScience Laboratories, Inc. (ABL, Inc.)
• Batavia Biosciences
• BioMarin
• BioNTech IMFS
• Biovian Oy
• bluebird bio, Inc.
• Creative Biogene
• CEVEC Pharmaceuticals GmbH
• Charles River Laboratories
• Cytiva
• FUJIFILM Diosynth Biotechnologies
• Genezen
• Lonza
• Merck KGaA
• Novasep (Thermofisher Scientific Inc.)
• Patheon Pharma Services (Thermo Fisher Scientific Inc.)
• Paragon Bioservices, Inc. (Catalent)
• Sirion-Biotech GmbH
• VGXI, Inc.
• Vibalogics
• Virovek
• Vivebiotech
• Waisman Biomanufacturing
• Wuxi AppTec, Yposkesi, Inc.
• Yposkesi, Inc.
Overall world revenue for Viral Vectors and Plasmid DNA Manufacturing Market, 2022 to 2032 in terms of value the market will surpass US$555 million in 2022, our work calculates. We predict strong revenue growth through to 2032. Our work identifies which organizations hold the greatest potential. Discover their capabilities, progress, and commercial prospects, helping you stay ahead.
How will the Viral Vectors and Plasmid DNA Manufacturing Market, 2022 to 2032 report help you?
In summary, our 400+ page report provides you with the following knowledge:
• Revenue forecasts to 2032 for Viral Vectors and Plasmid DNA Manufacturing Market, 2022 to 2032 Market, with forecasts for vector type, application, end-use, disease, and workflow, each forecast at a global and regional level – discover the industry’s prospects, finding the most lucrative places for investments and revenues.
• Revenue forecasts to 2032 for five regional and 21 key national markets – See forecasts for the Viral Vectors and Plasmid DNA Manufacturing Market, 2022 to 2032 market in North America, Europe, Asia-Pacific, Latin America, and MEA. Also forecasted is the market in the US, Canada, Mexico, Brazil, Germany, France, UK, Italy, China, India, Japan, and Australia among other prominent economies.
• Prospects for established firms and those seeking to enter the market – including company profiles for 25 of the major companies involved in the Viral Vectors and Plasmid DNA Manufacturing Market, 2022 to 2032.
Find quantitative and qualitative analyses with independent predictions. Receive information that only our report contains, staying informed with invaluable business intelligence.
Information found nowhere else
With our new report, you are less likely to fall behind in knowledge or miss out on opportunities. See how our work could benefit your research, analyses, and decisions. Visiongain’s study is for everybody needing commercial analyses for the Viral Vectors and Plasmid DNA Manufacturing Market, 2022 to 2032, market-leading companies. You will find data, trends and predictions.
ページTOPに戻る
Table of Contents
Table of Contents
1. Report Overview
1.1 Objectives of the Study
1.2 Introduction to Viral Vectors and Plasmid DNA Manufacturing Market
1.3 What This Report Delivers
1.4 Why You Should Read This Report
1.5 Key Questions Answered By This Analytical Report Include:
1.6 Who is This Report For?
1.7 Methodology
1.7.1 Market Definitions
1.7.2 Market Evaluation & Forecasting Methodology
1.7.3 Data Validation
1.7.3.1 Primary Research
1.7.3.2 Secondary Research
1.8 Frequently Asked Questions (FAQs)
1.9 Associated Visiongain Reports
1.10 About Visiongain
2 Executive Summary
3 Market Overview
3.1 Key Findings
3.2 Market Dynamics
3.2.1 Market Driving Factors
3.2.1.1 Robust Pipeline for Gene Therapy and Viral Vectors
3.2.1.2 Increasing Capacities by Manufacturers
3.2.1.3 Advances in Genome Sequencing to Fuel Market Growth
3.2.2 Market Restraining Factors
3.2.2.1 High Cost of Therapies
3.2.2.2 Bottlenecks Experienced by Manufacturers
3.2.3 Market Opportunities
3.2.3.1 Rise in the Development of Allogenic and Autologous Cell Therapy
3.2.3.2 Increasing Applications As Preclinical Tool In Neuroscience Research
3.2.3.3 Increasing Number of Clinical Studies
3.3 COVID-19 Impact Analysis
3.4 Porter’s Five Forces Analysis
3.4.1 Supplier Power
3.4.2 Buyer Power
3.4.3 Competitive Rivalry
3.4.4 Threat from Substitutes
3.4.5 Threat of New Entrants
4 Viral Vector Production Capacity Mapping Analysis
4.1 CMOs Capacity for Viral Vector Manufacturing
4.2 Cleanroom Suites Facilities: Leading Viral Vector Manufacturers
5 Viral Vector Production & Yield Analysis
5.1 Introduction
5.2 ATMP Vectors and Manufacturing Platforms
5.3 Regulatory Challenges for Viral Vectors for Cell and Gene Therapy
6 Viral Vector Manufacturing: Process Economic Considerations and Challenges
6.1 Technological Advances in Manufacturing
6.2 Stable Producer Cell Lines
6.3 Addressing the Challenges of Cytotoxicity with Stable Producer Lines
6.4 What are the Process Development Considerations for the Use of Stable Producer Lines?
6.5 How Do Stable Producer Cell Lines Create Efficiencies and Reduce Costs in the Production of CGTs?
6.5.1 Simplified Upstream Production
6.5.2 Lower Costs for Reagents and Labour
6.5.3 More Flexibility for Scale Up
6.6 When is the Time to Switch from Transient Transfection to Stable Producer Cell Lines for LVV Manufacturing?
6.7 Cost Considerations
6.8 Regulatory Expectations
7 Viral Vectors Production Process Analysis
7.1 Introduction
7.2 Upstream Unit Operations (Cell Thaw and Expansion Through Transfection)
7.3 Downstream Unit Operations (Harvest Through Purification)
7.4 Formulation/Stability and Fill/Finish
7.5 Viral Analytics
7.6 Viral Vector Production: Facilities Needs
7.7 Regulatory Standard Needs
7.8 Workforce Development and Needs
8 Viral Vectors and Plasmid DNA Manufacturing Market Analysis by Vector Type
8.1 Key Findings
8.2 Vector Type Segment: Market Attractiveness Index
8.3 Viral Vectors and Plasmid DNA Manufacturing Market Size Estimation and Forecast by Vector Type
8.4 Adenovirus
8.4.1 Market Forecast by Region, 2022-2032 (US$ Mn)
8.4.2 Market Share by Region, 2022 & 2032 (%)
8.5 Retrovirus
8.5.1 Market Forecast by Region, 2022-2032 (US$ Mn)
8.5.2 Market Share by Region, 2022 & 2032 (%)
8.6 Plasmid DNA
8.6.1 Market Forecast by Region, 2022-2032 (US$ Mn)
8.6.2 Market Share by Region, 2022 & 2032 (%)
8.7 AAV (Adeno-associated Viruses)
8.7.1 Market Forecast by Region, 2022-2032 (US$ Mn)
8.7.2 Market Share by Region, 2022 & 2032 (%)
8.8 Lentivirus
8.8.1 Market Forecast by Region, 2022-2032 (US$ Mn)
8.8.2 Market Share by Region, 2022 & 2032 (%)
8.9 Others
8.9.1 Market Forecast by Region, 2022-2032 (US$ Mn)
8.9.2 Market Share by Region, 2022 & 2032 (%)
9 Viral Vectors and Plasmid DNA Manufacturing Market Analysis by Application
9.1 Key Findings
9.2 Application Segment: Market Attractiveness Index
9.3 Viral Vectors and Plasmid DNA Manufacturing Market Size Estimation and Forecast by Application
9.4 Antisense & RNAi
9.4.1 Market Forecast by Region, 2022-2032 (US$ Mn)
9.4.2 Market Share by Region, 2022 & 2032 (%)
9.5 Gene Therapy
9.5.1 Market Forecast by Region, 2022-2032 (US$ Mn)
9.5.2 Market Share by Region, 2022 & 2032 (%)
9.6 Cell Therapy
9.6.1 Market Forecast by Region, 2022-2032 (US$ Mn)
9.6.2 Market Share by Region, 2022 & 2032 (%)
9.7 Vaccinology
9.7.1 Market Forecast by Region, 2022-2032 (US$ Mn)
9.7.2 Market Share by Region, 2022 & 2032 (%)
10 Viral Vectors and Plasmid DNA Manufacturing Market Analysis by End-use
10.1 Key Findings
10.2 End-use Segment: Market Attractiveness Index
10.3 Viral Vectors and Plasmid DNA Manufacturing Market Size Estimation and Forecast by End-use
10.4 Pharma and Biopharma Companies
10.4.1 Market Forecast by Region, 2022-2032 (US$ Mn)
10.4.2 Market Share by Region, 2022 & 2032 (%)
10.5 Research Institutes
10.5.1 Market Forecast by Region, 2022-2032 (US$ Mn)
10.5.2 Market Share by Region, 2022 & 2032 (%)
11 Viral Vectors and Plasmid DNA Manufacturing Market Analysis by Disease
11.1 Key Findings
11.2 Disease Segment: Market Attractiveness Index
11.3 Viral Vectors and Plasmid DNA Manufacturing Market Size Estimation and Forecast by Disease
11.4 Oncology
11.4.1 Market Forecast by Region, 2022-2032 (US$ Mn)
11.4.2 Market Share by Region, 2022 & 2032 (%)
11.5 Genetic Disorders
11.5.1 Market Forecast by Region, 2022-2032 (US$ Mn)
11.5.2 Market Share by Region, 2022 & 2032 (%)
11.6 Infectious Diseases
11.6.1 Market Forecast by Region, 2022-2032 (US$ Mn)
11.6.2 Market Share by Region, 2022 & 2032 (%)
11.7 Others
11.7.1 Market Forecast by Region, 2022-2032 (US$ Mn)
11.7.2 Market Share by Region, 2022 & 2032 (%)
12 Viral Vectors and Plasmid DNA Manufacturing Market Analysis by Workflow
12.1 Key Findings
12.2 Workflow Segment: Market Attractiveness Index
12.3 Viral Vectors and Plasmid DNA Manufacturing Market Size Estimation and Forecast by Workflow
12.4 Upstream
12.4.1 Market Forecast by Region, 2022-2032 (US$ Mn)
12.4.2 Market Share by Region, 2022 & 2032 (%)
12.5 Downstream
12.5.1 Market Forecast by Region, 2022-2032 (US$ Mn)
12.5.2 Market Share by Region, 2022 & 2032 (%)
13 Viral Vectors and Plasmid DNA Manufacturing Market Analysis by Region
13.1 Key Findings
13.2 Regional Market Size Estimation and Forecast
14 North America Viral Vectors and Plasmid DNA Manufacturing Market Analysis
14.1 Key Findings
14.2 North America Viral Vectors and Plasmid DNA Manufacturing Market Attractiveness Index
14.3 Market Size by Country, 2022, 2027 & 2032 (US$ Mn)
14.4 Market Size Estimation and Forecast by Country, 2022-2032 (US$ Mn)
14.5 Market Size Estimation and Forecast by Vector Type, 2022-2032 (US$ Mn)
14.6 Market Size Estimation and Forecast by Application, 2022-2032 (US$ Mn)
14.7 Market Size Estimation and Forecast by End-use, 2022-2032 (US$ Mn)
14.8 Market Size Estimation and Forecast by Disease, 2022-2032 (US$ Mn)
14.9 Market Size Estimation and Forecast by Workflow, 2022-2032 (US$ Mn)
14.10 U.S.
14.11 Canada
15 Europe Viral Vectors and Plasmid DNA Manufacturing Market Analysis
15.1 Key Findings
15.2 Europe Viral Vectors and Plasmid DNA Manufacturing Market Attractiveness Index
15.3 Market Size by Country, 2022, 2027 & 2032 (US$ Mn)
15.4 Market Size Estimation and Forecast by Country, 2022-2032 (US$ Mn)
15.5 Market Size Estimation and Forecast by Vector Type, 2022-2032 (US$ Mn)
15.6 Market Size Estimation and Forecast by Application, 2022-2032 (US$ Mn)
15.7 Market Size Estimation and Forecast by End-use, 2022-2032 (US$ Mn)
15.8 Market Size Estimation and Forecast by Disease, 2022-2032 (US$ Mn)
15.9 Market Size Estimation and Forecast by Workflow, 2022-2032 (US$ Mn)
15.10 Germany
15.11 UK
15.12 France
15.13 Italy
15.14 Spain
15.15 Rest of Europe
16 Asia Pacific Viral Vectors and Plasmid DNA Manufacturing Market Analysis
16.1 Key Findings
16.2 Asia Pacific Viral Vectors and Plasmid DNA Manufacturing Market Attractiveness Index
16.3 Market Size by Country, 2022, 2027 & 2032 (US$ Mn)
16.4 Market Size Estimation and Forecast by Country, 2022-2032 (US$ Mn)
16.5 Market Size Estimation and Forecast by Vector Type, 2022-2032 (US$ Mn)
16.6 Market Size Estimation and Forecast by Application, 2022-2032 (US$ Mn)
16.7 Market Size Estimation and Forecast by End-use, 2022-2032 (US$ Mn)
16.8 Market Size Estimation and Forecast by Disease, 2022-2032 (US$ Mn)
16.9 Market Size Estimation and Forecast by Workflow, 2022-2032 (US$ Mn)
16.10 Japan
16.11 China
16.12 India
16.13 Australia
16.14 South Korea
16.15 Rest of Asia Pacific
17 Latin America Viral Vectors and Plasmid DNA Manufacturing Market Analysis
17.1 Key Findings
17.2 Latin America Viral Vectors and Plasmid DNA Manufacturing Market Attractiveness Index
17.3 Market Size by Country, 2022, 2027 & 2032 (US$ Mn)
17.4 Market Size Estimation and Forecast by Country, 2022-2032 (US$ Mn)
17.5 Market Size Estimation and Forecast by Vector Type, 2022-2032 (US$ Mn)
17.6 Market Size Estimation and Forecast by Application, 2022-2032 (US$ Mn)
17.7 Market Size Estimation and Forecast by End-use, 2022-2032 (US$ Mn)
17.8 Market Size Estimation and Forecast by Disease, 2022-2032 (US$ Mn)
17.9 Market Size Estimation and Forecast by Workflow, 2022-2032 (US$ Mn)
17.10 Brazil
17.11 Mexico
17.12 Argentina
17.13 Rest of Latin America
18 MEA Viral Vectors and Plasmid DNA Manufacturing Market Analysis
18.1 Key Findings
18.2 MEA Viral Vectors and Plasmid DNA Manufacturing Market Attractiveness Index
18.3 Market Size by Country, 2022, 2027 & 2032 (US$ Mn)
18.4 Market Size Estimation and Forecast by Country, 2022-2032 (US$ Mn)
18.5 Market Size Estimation and Forecast by Vector Type, 2022-2032 (US$ Mn)
18.6 Market Size Estimation and Forecast by Application, 2022-2032 (US$ Mn)
18.7 Market Size Estimation and Forecast by End-use, 2022-2032 (US$ Mn)
18.8 Market Size Estimation and Forecast by Disease, 2022-2032 (US$ Mn)
18.9 Market Size Estimation and Forecast by Workflow, 2022-2032 (US$ Mn)
18.10 GCC
18.11 South Africa
18.12 Rest of MEA
19 Company Profiles
19.1 Strategic Outlook, 2019-2022
19.2 Merck KGaA
19.2.1 Company Snapshot
19.2.2 Company Overview
19.2.3 Financial Analysis, 2016-2021
19.2.3.1 Revenue, 2016-2021
19.2.3.2 Gross Profit, 2016-2021
19.2.3.3 R&D, 2016-2021
19.2.4 Product Benchmarking
19.2.5 Strategic Outlook
19.3 Lonza
19.3.1 Company Snapshot
19.3.2 Company Overview
19.3.3 Financial Analysis, 2016-2021
19.3.3.1 Revenue, 2016-2021
19.3.3.2 Gross Profit, 2016-2021
19.3.3.3 R&D, 2017-2020
19.3.4 Product Benchmarking
19.3.5 Strategic Outlook
19.4 FUJIFILM Diosynth Biotechnologies
19.4.1 Company Snapshot
19.4.2 Company Overview
19.4.3 Product Benchmarking
19.4.4 Strategic Outlook
19.5 Charles River Laboratories
19.5.1 Company Snapshot
19.5.2 Company Overview
19.5.3 Financial Analysis, 2016-2021
19.5.3.1 Revenue, 2016-2021
19.5.3.2 Gross Profit, 2016-2021
19.5.4 Product Benchmarking
19.5.5 Strategic Outlook
19.6 Patheon Pharma Services (Thermo Fisher Scientific Inc.)
19.6.1 Company Snapshot
19.6.2 Company Overview
19.6.3 Financial Analysis, 2016-2021
19.6.3.1 Revenue, 2016-2021
19.6.3.2 Gross Profit, 2016-2021
19.6.3.3 R&D, 2016-2021
19.6.4 Product Benchmarking
19.6.5 Strategic Outlook
19.7 Waisman Biomanufacturing
19.7.1 Company Snapshot
19.7.2 Company Overview
19.7.3 Product Benchmarking
19.8 Genezen
19.8.1 Company Snapshot
19.8.2 Company Overview
19.8.3 Product Benchmarking
19.8.4 Strategic Outlook
19.9 Yposkesi, Inc.
19.9.1 Company Snapshot
19.9.2 Company Overview
19.9.3 Product Benchmarking
19.9.4 Strategic Outlook
19.10 Advanced BioScience Laboratories, Inc. (ABL, Inc.)
19.10.1 Company Snapshot
19.10.2 Company Overview
19.10.3 Product Benchmarking
19.10.4 Strategic Outlook
19.11 Novasep (Thermofisher Scientific Inc.)
19.11.1 Company Snapshot
19.11.2 Company Overview
19.11.3 Product Benchmarking
19.11.4 Strategic Outlook
19.12 Cytiva
19.12.1 Company Snapshot
19.12.2 Company Overview
19.12.3 Product Benchmarking
19.12.4 Strategic Outlook
19.13 CEVEC Pharmaceuticals GmbH
19.13.1 Company Snapshot
19.13.2 Company Overview
19.13.3 Product Benchmarking
19.13.4 Strategic Outlook
19.14 Batavia Biosciences
19.14.1 Company Snapshot
19.14.2 Company Overview
19.14.3 Product Benchmarking
19.14.4 Strategic Outlook
19.15 Biovian Oy
19.15.1 Company Snapshot
19.15.2 Company Overview
19.15.3 Product Benchmarking
19.16 Wuxi AppTec
19.16.1 Company Snapshot
19.16.2 Company Overview
19.16.3 Financial Analysis, 2016-2021
19.16.3.1 Revenue, 2016-2021
19.16.3.2 Gross Profit, 2016-2020
19.16.4 Product Benchmarking
19.16.5 Strategic Outlook
19.17 VGXI, Inc.
19.17.1 Company Snapshot
19.17.2 Company Overview
19.17.3 Product Benchmarking
19.18 Paragon Bioservices, Inc. (Catalent)
19.18.1 Company Snapshot
19.18.2 Company Overview
19.18.3 Product Benchmarking
19.18.4 Strategic Outlook
19.19 Sirion-Biotech GmbH
19.19.1 Company Snapshot
19.19.2 Company Overview
19.19.3 Product Benchmarking
19.20 Virovek
19.20.1 Company Snapshot
19.20.2 Company Overview
19.20.3 Product Benchmarking
19.21 BioNTech IMFS
19.21.1 Company Snapshot
19.21.2 Company Overview
19.21.3 Product Benchmarking
19.22 Vivebiotech
19.22.1 Company Snapshot
19.22.2 Company Overview
19.22.3 Product Benchmarking
19.22.4 Strategic Outlook
19.23 Creative Biogene
19.23.1 Company Snapshot
19.23.2 Company Overview
19.23.3 Product Benchmarking
19.23.4 Strategic Outlook
19.24 Vibalogics
19.24.1 Company Snapshot
19.24.2 Company Overview
19.24.3 Product Benchmarking
19.24.4 Strategic Outlook
19.25 bluebird bio, Inc.
19.25.1 Company Snapshot
19.25.2 Company Overview
19.25.3 Financial Analysis, 2016-2021
19.25.3.1 Revenue, 2016-2021
19.25.3.2 R&D, 2016-2021
19.25.4 Product Benchmarking
19.25.5 Strategic Outlook
19.26 Aldevron
19.26.1 Company Snapshot
19.26.2 Company Overview
19.26.3 Product Benchmarking
20 Conclusion and Recommendations
20.1 Concluding Remarks from Visiongain
20.2 Recommendations for Market Players
List of Tables
Table 1 Viral Vectors and Plasmid DNA Manufacturing Market Snapshot, 2022 & 2032 (US$ million, CAGR %)
Table 2 Viral Vectors and Plasmid DNA Manufacturing Market Forecast by Region, 2022-2032 (US$ mn, AGR%, CAGR%): “V” Shaped Recovery
Table 3 Viral Vectors and Plasmid DNA Manufacturing Market Forecast by Region, 2022-2032 (US$ mn, AGR%, CAGR%): "U" Shaped Recovery
Table 4 Viral Vectors and Plasmid DNA Manufacturing Market Forecast by Region, 2022-2032 (US$ mn, AGR%, CAGR%): "W" Shaped Recovery
Table 5 Viral Vectors and Plasmid DNA Manufacturing Market Forecast by Region, 2022-2032 (US$ mn, AGR%, CAGR%): "L" Shaped Recovery
Table 6 Viral Vectors and Plasmid DNA Manufacturing Market Forecast by Vector Type, 2022-2032 (US$ mn, AGR%, CAGR%)
Table 7 Ongoing and Completed Clinical Trials Employing Ad Vectors
Table 8 Adenovirus Segment Market Forecast by Region, 2022-2032 (US$ mn, AGR%, CAGR%)
Table 9 Retrovirus Segment Market Forecast by Region, 2022-2032 (US$ mn, AGR%, CAGR%)
Table 10 Plasmid DNA Segment Market Forecast by Region, 2022-2032 (US$ mn, AGR%, CAGR%)
Table 11 Ongoing Clinical Trials Employing AAV Vectors
Table 12 AAV Segment Market Forecast by Region, 2022-2032 (US$ mn, AGR%, CAGR%)
Table 13 Lentivirus Segment Market Forecast by Region, 2022-2032 (US$ mn, AGR%, CAGR%)
Table 14 Others Segment Market Forecast by Region, 2022-2032 (US$ mn, AGR%, CAGR%)
Table 15 Viral Vectors and Plasmid DNA Manufacturing Market Forecast by Application, 2022-2032 (US$ mn, AGR%, CAGR%)
Table 16 Antisense & RNAi Segment Market Forecast by Region, 2022-2032 (US$ mn, AGR%, CAGR%)
Table 17 Gene Therapy Segment Market Forecast by Region, 2022-2032 (US$ mn, AGR%, CAGR%)
Table 18 List of Cell Therapy Companies Worldwide by Location and Type
Table 19 Cell Therapy Segment Market Forecast by Region, 2022-2032 (US$ mn, AGR%, CAGR%)
Table 20 Vaccinology Segment Market Forecast by Region, 2022-2032 (US$ mn, AGR%, CAGR%)
Table 21 Viral Vectors and Plasmid DNA Manufacturing Market Forecast by End-use, 2022-2032 (US$ mn, AGR%, CAGR%)
Table 22 Pharma and Biopharma Companies Segment Market Forecast by Region, 2022-2032 (US$ mn, AGR%, CAGR%)
Table 23 Research Institutes Segment Market Forecast by Region, 2022-2032 (US$ mn, AGR%, CAGR%)
Table 24 Viral Vectors and Plasmid DNA Manufacturing Market Forecast by Disease, 2022-2032 (US$ mn, AGR%, CAGR%)
Table 25 Oncology Segment Market Forecast by Region, 2022-2032 (US$ mn, AGR%, CAGR%)
Table 26 Genetic Disorders Segment Market Forecast by Region, 2022-2032 (US$ mn, AGR%, CAGR%)
Table 27 Infectious Diseases Segment Market Forecast by Region, 2022-2032 (US$ mn, AGR%, CAGR%)
Table 28 Others Segment Market Forecast by Region, 2022-2032 (US$ mn, AGR%, CAGR%)
Table 29 Viral Vectors and Plasmid DNA Manufacturing Market Forecast by Workflow, 2022-2032 (US$ mn, AGR%, CAGR%)
Table 30 Upstream Segment Market Forecast by Region, 2022-2032 (US$ mn, AGR%, CAGR%)
Table 31 Downstream Segment Market Forecast by Region, 2022-2032 (US$ mn, AGR%, CAGR%)
Table 32 Global Viral Vectors and Plasmid DNA Manufacturing Market Forecast by Region, 2022-2032 (US$ mn, AGR%, CAGR%)
Table 33 North America Viral Vectors and Plasmid DNA Manufacturing Market Forecast by Country, 2022-2032 (US$ mn, AGR%, CAGR%)
Table 34 North America Viral Vectors and Plasmid DNA Manufacturing Market Forecast by Vector Type, 2022-2032 (US$ mn, AGR%, CAGR%)
Table 35 North America Viral Vectors and Plasmid DNA Manufacturing Market Forecast by Application, 2022-2032 (US$ mn, AGR%, CAGR%)
Table 36 North America Viral Vectors and Plasmid DNA Manufacturing Market Forecast by End-use, 2022-2032 (US$ mn, AGR%, CAGR%)
Table 37 North America Viral Vectors and Plasmid DNA Manufacturing Market Forecast by Disease, 2022-2032 (US$ mn, AGR%, CAGR%)
Table 38 North America Viral Vectors and Plasmid DNA Manufacturing Market Forecast by Workflow, 2022-2032 (US$ mn, AGR%, CAGR%)
Table 39 U.S. Viral Vectors and Plasmid DNA Manufacturing Market Forecast, 2022-2032 (US$ mn, AGR%, CAGR%)
Table 40 Canada Viral Vectors and Plasmid DNA Manufacturing Market Forecast, 2022-2032 (US$ mn, AGR%, CAGR%)
Table 41 Europe Viral Vectors and Plasmid DNA Manufacturing Market Forecast by Country, 2022-2032 (US$ mn, AGR%, CAGR%)
Table 42 Europe Viral Vectors and Plasmid DNA Manufacturing Market Forecast by Vector Type, 2022-2032 (US$ mn, AGR%, CAGR%)
Table 43 Europe Viral Vectors and Plasmid DNA Manufacturing Market Forecast by Application, 2022-2032 (US$ mn, AGR%, CAGR%)
Table 44 Europe Viral Vectors and Plasmid DNA Manufacturing Market Forecast by End-use, 2022-2032 (US$ mn, AGR%, CAGR%)
Table 45 Europe Viral Vectors and Plasmid DNA Manufacturing Market Forecast by Disease, 2022-2032 (US$ mn, AGR%, CAGR%)
Table 46 Europe Viral Vectors and Plasmid DNA Manufacturing Market Forecast by Workflow, 2022-2032 (US$ mn, AGR%, CAGR%)
Table 47 Germany Viral Vectors and Plasmid DNA Manufacturing Market Forecast, 2022-2032 (US$ mn, AGR%, CAGR%)
Table 48 UK Viral Vectors and Plasmid DNA Manufacturing Market Forecast, 2022-2032 (US$ mn, AGR%, CAGR%)
Table 49 France Viral Vectors and Plasmid DNA Manufacturing Market Forecast, 2022-2032 (US$ mn, AGR%, CAGR%)
Table 50 Italy Viral Vectors and Plasmid DNA Manufacturing Market Forecast, 2022-2032 (US$ mn, AGR%, CAGR%)
Table 51 Spain Viral Vectors and Plasmid DNA Manufacturing Market Forecast, 2022-2032 (US$ mn, AGR%, CAGR%)
Table 52 Rest of Europe Viral Vectors and Plasmid DNA Manufacturing Market Forecast, 2022-2032 (US$ mn, AGR%, CAGR%)
Table 53 Asia Pacific Viral Vectors and Plasmid DNA Manufacturing Market Forecast by Country, 2022-2032 (US$ mn, AGR%, CAGR%)
Table 54 Asia Pacific Viral Vectors and Plasmid DNA Manufacturing Market Forecast by Vector Type, 2022-2032 (US$ mn, AGR%, CAGR%)
Table 55 Asia Pacific Viral Vectors and Plasmid DNA Manufacturing Market Forecast by Application, 2022-2032 (US$ mn, AGR%, CAGR%)
Table 56 Asia Pacific Viral Vectors and Plasmid DNA Manufacturing Market Forecast by End-use, 2022-2032 (US$ mn, AGR%, CAGR%)
Table 57 Asia Pacific Viral Vectors and Plasmid DNA Manufacturing Market Forecast by Disease, 2022-2032 (US$ mn, AGR%, CAGR%)
Table 58 Asia Pacific Viral Vectors and Plasmid DNA Manufacturing Market Forecast by Workflow, 2022-2032 (US$ mn, AGR%, CAGR%)
Table 59 Japan Viral Vectors and Plasmid DNA Manufacturing Market Forecast, 2022-2032 (US$ mn, AGR%, CAGR%)
Table 60 China Viral Vectors and Plasmid DNA Manufacturing Market Forecast, 2022-2032 (US$ mn, AGR%, CAGR%)
Table 61 India Viral Vectors and Plasmid DNA Manufacturing Market Forecast, 2022-2032 (US$ mn, AGR%, CAGR%)
Table 62 Australia Viral Vectors and Plasmid DNA Manufacturing Market Forecast, 2022-2032 (US$ mn, AGR%, CAGR%)
Table 63 Australia Viral Vectors and Plasmid DNA Manufacturing Market Forecast, 2022-2032 (US$ mn, AGR%, CAGR%)
Table 64 Rest of Asia Pacific Viral Vectors and Plasmid DNA Manufacturing Market Forecast, 2022-2032 (US$ mn, AGR%, CAGR%)
Table 65 Latin America Viral Vectors and Plasmid DNA Manufacturing Market Forecast by Country, 2022-2032 (US$ mn, AGR%, CAGR%)
Table 66 Latin America Viral Vectors and Plasmid DNA Manufacturing Market Forecast by Vector Type, 2022-2032 (US$ mn, AGR%, CAGR%)
Table 67 Latin America Viral Vectors and Plasmid DNA Manufacturing Market Forecast by Application, 2022-2032 (US$ mn, AGR%, CAGR%)
Table 68 Latin America Viral Vectors and Plasmid DNA Manufacturing Market Forecast by End-use, 2022-2032 (US$ mn, AGR%, CAGR%)
Table 69 Latin America Viral Vectors and Plasmid DNA Manufacturing Market Forecast by Disease, 2022-2032 (US$ mn, AGR%, CAGR%)
Table 70 Latin America Viral Vectors and Plasmid DNA Manufacturing Market Forecast by Workflow, 2022-2032 (US$ mn, AGR%, CAGR%)
Table 71 Brazil Viral Vectors and Plasmid DNA Manufacturing Market Forecast, 2022-2032 (US$ mn, AGR%, CAGR%)
Table 72 Mexico Viral Vectors and Plasmid DNA Manufacturing Market Forecast, 2022-2032 (US$ mn, AGR%, CAGR%)
Table 73 Argentina Viral Vectors and Plasmid DNA Manufacturing Market Forecast, 2022-2032 (US$ mn, AGR%, CAGR%)
Table 74 Rest of Latin America Viral Vectors and Plasmid DNA Manufacturing Market Forecast, 2022-2032 (US$ mn, AGR%, CAGR%)
Table 75 MEA Viral Vectors and Plasmid DNA Manufacturing Market Forecast by Country, 2022-2032 (US$ mn, AGR%, CAGR%)
Table 76 MEA Viral Vectors and Plasmid DNA Manufacturing Market Forecast by Vector Type, 2022-2032 (US$ mn, AGR%, CAGR%)
Table 77 MEA Viral Vectors and Plasmid DNA Manufacturing Market Forecast by Application, 2022-2032 (US$ mn, AGR%, CAGR%)
Table 78 MEA Viral Vectors and Plasmid DNA Manufacturing Market Forecast by End-use, 2022-2032 (US$ mn, AGR%, CAGR%)
Table 79 MEA Viral Vectors and Plasmid DNA Manufacturing Market Forecast by Disease, 2022-2032 (US$ mn, AGR%, CAGR%)
Table 80 MEA Viral Vectors and Plasmid DNA Manufacturing Market Forecast by Workflow, 2022-2032 (US$ mn, AGR%, CAGR%)
Table 81 GCC Viral Vectors and Plasmid DNA Manufacturing Market Forecast, 2022-2032 (US$ mn, AGR%, CAGR%)
Table 82 South Africa Viral Vectors and Plasmid DNA Manufacturing Market Forecast, 2022-2032 (US$ mn, AGR%, CAGR%)
Table 83 Rest of MEA Viral Vectors and Plasmid DNA Manufacturing Market Forecast, 2022-2032 (US$ mn, AGR%, CAGR%)
Table 84 Strategic Outlook, 2019-2022
Table 85 Merck KGaA: Key Details (CEO, HQ, Founded, No. of Employees, Company Type, Website, Business Segment)
Table 86 Merck KGaA: Product Portfolio
Table 87 Merck KGaA: Strategic Outlook
Table 88 Lonza: Key Details (CEO, HQ, Founded, No. of Employees, Company Type, Website, Business Segment)
Table 89 Lonza: Product Portfolio
Table 90 Lonza: Strategic Outlook
Table 91 FUJIFILM Diosynth Biotechnologies: Key Details (CEO, HQ, Founded, No. of Employees, Company Type, Website, Business Segment)
Table 92 FUJIFILM Diosynth Biotechnologies: Product Portfolio
Table 93 FUJIFILM Diosynth Biotechnologies: Strategic Outlook
Table 94 Charles River Laboratories: Key Details (CEO, HQ, Founded, No. of Employees, Company Type, Website, Business Segment)
Table 95 Charles River Laboratories: Product Portfolio
Table 96 Charles River Laboratories: Strategic Outlook
Table 97 Patheon Pharma Services (Thermo Fisher Scientific Inc.): Key Details (CEO, HQ, Founded, No. of Employees, Company Type, Website, Business Segment)
Table 98 Patheon Pharma Services (Thermo Fisher Scientific Inc.): Product Portfolio
Table 99 Patheon Pharma Services (Thermo Fisher Scientific Inc.): Strategic Outlook
Table 100 Waisman Biomanufacturing: Key Details (CEO, HQ, Founded, No. of Employees, Company Type, Website, Business Segment)
Table 101 Waisman Biomanufacturing: Product Portfolio
Table 102 Genezen: Key Details (CEO, HQ, Founded, No. of Employees, Company Type, Website, Business Segment)
Table 103 Genezen: Product Portfolio
Table 104 Genezen: Strategic Outlook
Table 105 Yposkesi, Inc.: Key Details (CEO, HQ, Founded, No. of Employees, Company Type, Website, Business Segment)
Table 106 Yposkesi, Inc.: Product Portfolio
Table 107 Yposkesi, Inc.: Strategic Outlook
Table 108 Advanced BioScience Laboratories, Inc. (ABL, Inc.): Key Details (CEO, HQ, Founded, No. of Employees, Company Type, Website, Business Segment)
Table 109 Advanced BioScience Laboratories, Inc. (ABL, Inc.): Product Portfolio
Table 110 Advanced BioScience Laboratories, Inc. (ABL, Inc.): Strategic Outlook
Table 111 Novasep: Key Details (CEO, HQ, Founded, No. of Employees, Company Type, Website, Business Segment)
Table 112 Novasep Holding S.A.S: Product Portfolio
Table 113 Novasep Holding S.A.S: Strategic Outlook
Table 114 Cytiva: Key Details (CEO, HQ, Founded, No. of Employees, Company Type, Website, Business Segment)
Table 115 Cytiva: Product Portfolio
Table 116 Cytiva: Strategic Outlook
Table 117 CEVEC Pharmaceuticals GmbH: Key Details (CEO, HQ, Founded, No. of Employees, Company Type, Website, Business Segment)
Table 118 CEVEC Pharmaceuticals GmbH: Product Portfolio
Table 119 CEVEC Pharmaceuticals GmbH: Strategic Outlook
Table 120 Batavia Biosciences: Key Details (CEO, HQ, Founded, No. of Employees, Company Type, Website, Business Segment)
Table 121 Batavia Biosciences: Product Portfolio
Table 122 Batavia Biosciences: Strategic Outlook
Table 123 Biovian Oy: Key Details (CEO, HQ, Founded, No. of Employees, Company Type, Website, Business Segment)
Table 124 Biovian Oy: Product Portfolio
Table 125 Wuxi AppTec: Key Details (CEO, HQ, Founded, No. of Employees, Company Type, Website, Business Segment)
Table 126 Wuxi AppTec: Product Portfolio
Table 127 Wuxi AppTec: Strategic Outlook
Table 128 VGXI, Inc.: Key Details (CEO, HQ, Founded, No. of Employees, Company Type, Website, Business Segment)
Table 129 VGXI, Inc.: Product Portfolio
Table 130 Paragon Bioservices, Inc.: Key Details (CEO, HQ, Founded, No. of Employees, Company Type, Website, Business Segment)
Table 131 Paragon Bioservices, Inc.: Product Portfolio
Table 132 Paragon Bioservices, Inc.: Strategic Outlook
Table 133 Sirion-Biotech GmbH: Key Details (CEO, HQ, Founded, No. of Employees, Company Type, Website, Business Segment)
Table 134 Sirion-Biotech GmbH: Product Portfolio
Table 135 Virovek : Key Details (CEO, HQ, Founded, No. of Employees, Company Type, Website, Business Segment)
Table 136 Virovek : Product Portfolio
Table 137 BioNTech IMFS: Key Details (CEO, HQ, Founded, No. of Employees, Company Type, Website, Business Segment)
Table 138 BioNTech IMFS: Product Portfolio
Table 139 Vivebiotech: Key Details (CEO, HQ, Founded, No. of Employees, Company Type, Website, Business Segment)
Table 140 Vivebiotech: Product Portfolio
Table 141 Vivebiotech: Strategic Outlook
Table 142 Creative Biogene: Key Details (CEO, HQ, Founded, No. of Employees, Company Type, Website, Business Segment)
Table 143 Creative Biogene: Product Portfolio
Table 144 Creative Biogene: Strategic Outlook
Table 145 Vibalogics: Key Details (CEO, HQ, Founded, No. of Employees, Company Type, Website, Business Segment)
Table 146 Vibalogics: Product Portfolio
Table 147 Vibalogics: Strategic Outlook
Table 148 bluebird bio, Inc.: Key Details (CEO, HQ, Founded, No. of Employees, Company Type, Website, Business Segment)
Table 149 bluebird bio, Inc.: Product Portfolio
Table 150 bluebird bio, Inc.: Strategic Outlook
Table 151 Aldevron: Key Details (CEO, HQ, Founded, No. of Employees, Company Type, Website, Business Segment)
Table 152 Aldevron: Product Portfolio
List of Figures
Figure 1 Viral Vectors and Plasmid DNA Manufacturing Market Segmentation
Figure 2 Viral Vectors and Plasmid DNA Manufacturing Market by Vector Type: Market Attractiveness Index
Figure 3 Viral Vectors and Plasmid DNA Manufacturing Market by Application: Market Attractiveness Index
Figure 4 Viral Vectors and Plasmid DNA Manufacturing Market by End-use: Market Attractiveness Index
Figure 5 Viral Vectors and Plasmid DNA Manufacturing Market by Disease: Market Attractiveness Index
Figure 6 Viral Vectors and Plasmid DNA Manufacturing Market by Workflow: Market Attractiveness Index
Figure 7 Viral Vectors and Plasmid DNA Manufacturing Market Attractiveness Index by Region
Figure 8 Viral Vectors and Plasmid DNA Manufacturing Market: Market Dynamics
Figure 9 Cell and Gene Therapy Modalities
Figure 10 COVID Impact Analysis: Viral Vectors and Plasmid DNA Manufacturing Market Recovery Scenarios
Figure 11 Viral Vectors and Plasmid DNA Manufacturing Market by Region, 2022-2032 (US$ Mn, AGR %): “V” Shaped Recovery
Figure 12 Viral Vectors and Plasmid DNA Manufacturing Market by Region, 2022-2032 (US$ Mn, AGR %): “U” Shaped Recovery
Figure 13 Viral Vectors and Plasmid DNA Manufacturing Market by Region, 2022-2032 (US$ Mn, AGR %): “W” Shaped Recovery
Figure 14 Viral Vectors and Plasmid DNA Manufacturing Market by Region, 2022-2032 (US$ Mn, AGR %): “L” Shaped Recovery
Figure 15 Viral Vectors and Plasmid DNA Manufacturing Market: Porter’s Five Forces Analysis
Figure 16 Upstream Analysis
Figure 17 Downstream Analysis
Figure 18 Viral Vectors and Plasmid DNA Manufacturing Market Attractiveness Index by Vector Type
Figure 19 Viral Vectors and Plasmid DNA Manufacturing Market Forecast by Vector Type, 2022-2032 (US$ million)
Figure 20 Viral Vectors and Plasmid DNA Manufacturing Market Share Forecast by Vector Type, 2022, 2027, 2032 (%)
Figure 21 Adenovirus Market Forecast by Region, 2022-2032 (US$ million)
Figure 22 Adenovirus Market Share Forecast by Region, 2022 & 2032 (%)
Figure 23 Retrovirus Market Forecast by Region, 2022-2032 (US$ million)
Figure 24 Retrovirus Market Share Forecast by Region, 2022 & 2032 (%)
Figure 25 Plasmid DNA Market Forecast by Region, 2022-2032 (US$ million)
Figure 26 Plasmid DNA Market Share Forecast by Region, 2022 & 2032 (%)
Figure 27 AAV Market Forecast by Region, 2022-2032 (US$ million)
Figure 28 AAV Market Share Forecast by Region, 2022 & 2032 (%)
Figure 29 Lentivirus Market Forecast by Region, 2022-2032 (US$ million)
Figure 30 Lentivirus Market Share Forecast by Region, 2022 & 2032 (%)
Figure 31 Others Market Forecast by Region, 2022-2032 (US$ million)
Figure 32 Others Market Share Forecast by Region, 2022 & 2032 (%)
Figure 33 Viral Vectors and Plasmid DNA Manufacturing Market Attractiveness Index by Vector Type
Figure 34 Viral Vectors and Plasmid DNA Manufacturing Market Forecast by Application, 2022-2032 (US$ million)
Figure 35 Viral Vectors and Plasmid DNA Manufacturing Market Share Forecast by Application, 2022, 2027, 2032 (%)
Figure 36 Antisense & RNAi Market Forecast by Region, 2022-2032 (US$ million)
Figure 37 Antisense & RNAi Market Share Forecast by Region, 2022 & 2032 (%)
Figure 38 Gene Therapy Market Forecast by Region, 2022-2032 (US$ million)
Figure 39 Gene Therapy Market Share Forecast by Region, 2022 & 2032 (%)
Figure 40 Cell Therapy Market Forecast by Region, 2022-2032 (US$ million)
Figure 41 Cell Therapy Market Share Forecast by Region, 2022 & 2032 (%)
Figure 42 Vaccinology Market Forecast by Region, 2022-2032 (US$ million)
Figure 43 Vaccinology Market Share Forecast by Region, 2022 & 2032 (%)
Figure 44 Viral Vectors and Plasmid DNA Manufacturing Market Attractiveness Index by End-use
Figure 45 Viral Vectors and Plasmid DNA Manufacturing Market Forecast by End-use, 2022-2032 (US$ million)
Figure 46 Viral Vectors and Plasmid DNA Manufacturing Market Share Forecast by End-use, 2022, 2027, 2032 (%)
Figure 47 Pharma and Biopharma Companies Market Forecast by Region, 2022-2032 (US$ million)
Figure 48 Pharma and Biopharma Companies Market Share Forecast by Region, 2022 & 2032 (%)
Figure 49 Research Institutes Market Forecast by Region, 2022-2032 (US$ million)
Figure 50 Research Institutes Market Share Forecast by Region, 2022 & 2032 (%)
Figure 51 Viral Vectors and Plasmid DNA Manufacturing Market Attractiveness Index by Disease
Figure 52 Viral Vectors and Plasmid DNA Manufacturing Market Forecast by Disease, 2022-2032 (US$ million)
Figure 53 Viral Vectors and Plasmid DNA Manufacturing Market Share Forecast by Disease, 2022, 2027, 2032 (%)
Figure 54 Oncology Market Forecast by Region, 2022-2032 (US$ million)
Figure 55 Oncology Market Share Forecast by Region, 2022 & 2032 (%)
Figure 56 Genetic Disorders Market Forecast by Region, 2022-2032 (US$ million)
Figure 57 Genetic Disorders Market Share Forecast by Region, 2022 & 2032 (%)
Figure 58 Infectious Diseases Market Forecast by Region, 2022-2032 (US$ million)
Figure 59 Infectious Diseases Market Share Forecast by Region, 2022 & 2032 (%)
Figure 60 Others Market Forecast by Region, 2022-2032 (US$ million)
Figure 61 Others Market Share Forecast by Region, 2022 & 2032 (%)
Figure 62 Viral Vectors and Plasmid DNA Manufacturing Market Attractiveness Index by Workflow
Figure 63 Viral Vectors and Plasmid DNA Manufacturing Market Forecast by Workflow, 2022-2032 (US$ million)
Figure 64 Viral Vectors and Plasmid DNA Manufacturing Market Share Forecast by Workflow, 2022, 2027, 2032 (%)
Figure 65 Upstream Market Forecast by Region, 2022-2032 (US$ million)
Figure 66 Upstream Market Share Forecast by Region, 2022 & 2032 (%)
Figure 67 Downstream Market Forecast by Region, 2022-2032 (US$ million)
Figure 68 Downstream Market Share Forecast by Region, 2022 & 2032 (%)
Figure 69 Viral Vectors and Plasmid DNA Manufacturing Market Forecast by Region 2022, 2032 (Revenue, CAGR%)
Figure 70 Viral Vectors and Plasmid DNA Manufacturing Market Share Forecast by Region 2022, 2027, 2032(%)
Figure 71 Viral Vectors and Plasmid DNA Manufacturing Market by Region, 2022-2032 (US$ Mn)
Figure 72 North America Viral Vectors and Plasmid DNA Manufacturing Market Attractiveness Index
Figure 73 North America Viral Vectors and Plasmid DNA Manufacturing Market by Region, 2022, 2027 & 2032 (US$ million)
Figure 74 North America Viral Vectors and Plasmid DNA Manufacturing Market Forecast by Country, 2022-2032 (US$ million)
Figure 75 North America Viral Vectors and Plasmid DNA Manufacturing Market Share Forecast by Country, 2022 & 2032 (%)
Figure 76 North America Viral Vectors and Plasmid DNA Manufacturing Market Forecast by Vector Type, 2022-2032 (US$ million)
Figure 77 North America Viral Vectors and Plasmid DNA Manufacturing Market Share Forecast by Vector Type, 2022 & 2032 (%)
Figure 78 North America Viral Vectors and Plasmid DNA Manufacturing Market Forecast by Application, 2022-2032 (US$ million)
Figure 79 North America Viral Vectors and Plasmid DNA Manufacturing Market Share Forecast by Application, 2022 & 2032 (%)
Figure 80 North America Viral Vectors and Plasmid DNA Manufacturing Market Forecast by End-use, 2022-2032 (US$ million)
Figure 81 North America Viral Vectors and Plasmid DNA Manufacturing Market Share Forecast by End-use, 2022 & 2032 (%)
Figure 82 North America Viral Vectors and Plasmid DNA Manufacturing Market Forecast by Disease, 2022-2032 (US$ million)
Figure 83 North America Viral Vectors and Plasmid DNA Manufacturing Market Share Forecast by Disease, 2022 & 2032 (%)
Figure 84 North America Viral Vectors and Plasmid DNA Manufacturing Market Forecast by Workflow, 2022-2032 (US$ million)
Figure 85 North America Viral Vectors and Plasmid DNA Manufacturing Market Share Forecast by Workflow, 2022 & 2032 (%)
Figure 86 U.S. Viral Vectors and Plasmid DNA Manufacturing Market Forecast, 2022-2032 (US$ million, AGR %)
Figure 87 Canada Viral Vectors and Plasmid DNA Manufacturing Market Forecast, 2022-2032 (US$ million, AGR %)
Figure 88 Europe Viral Vectors and Plasmid DNA Manufacturing Market Attractiveness Index
Figure 89 Europe Viral Vectors and Plasmid DNA Manufacturing Market by Region, 2022, 2027 & 2032 (US$ million)
Figure 90 Europe Viral Vectors and Plasmid DNA Manufacturing Market Forecast by Country, 2022-2032 (US$ million)
Figure 91 Europe Viral Vectors and Plasmid DNA Manufacturing Market Share Forecast by Country, 2022 & 2032 (%)
Figure 92 Europe Viral Vectors and Plasmid DNA Manufacturing Market Forecast by Vector Type, 2022-2032 (US$ million)
Figure 93 Europe Viral Vectors and Plasmid DNA Manufacturing Market Share Forecast by Vector Type, 2022 & 2032 (%)
Figure 94 Europe Viral Vectors and Plasmid DNA Manufacturing Market Forecast by Application, 2022-2032 (US$ million)
Figure 95 Europe Viral Vectors and Plasmid DNA Manufacturing Market Share Forecast by Application, 2022 & 2032 (%)
Figure 96 Europe Viral Vectors and Plasmid DNA Manufacturing Market Forecast by End-use, 2022-2032 (US$ million)
Figure 97 Europe Viral Vectors and Plasmid DNA Manufacturing Market Share Forecast by End-use, 2022 & 2032 (%)
Figure 98 Europe Viral Vectors and Plasmid DNA Manufacturing Market Forecast by Disease, 2022-2032 (US$ million)
Figure 99 Europe Viral Vectors and Plasmid DNA Manufacturing Market Share Forecast by Disease, 2022 & 2032 (%)
Figure 100 Europe Viral Vectors and Plasmid DNA Manufacturing Market Forecast by Workflow, 2022-2032 (US$ million)
Figure 101 Europe Viral Vectors and Plasmid DNA Manufacturing Market Share Forecast by Workflow, 2022 & 2032 (%)
Figure 102 Germany Viral Vectors and Plasmid DNA Manufacturing Market Forecast, 2022-2032 (US$ million, AGR %)
Figure 103 UK Viral Vectors and Plasmid DNA Manufacturing Market Forecast, 2022-2032 (US$ million, AGR %)
Figure 104 France Viral Vectors and Plasmid DNA Manufacturing Market Forecast, 2022-2032 (US$ million, AGR %)
Figure 105 Italy Viral Vectors and Plasmid DNA Manufacturing Market Forecast, 2022-2032 (US$ million, AGR %)
Figure 106 Spain Viral Vectors and Plasmid DNA Manufacturing Market Forecast, 2022-2032 (US$ million, AGR %)
Figure 107 Rest of Europe Viral Vectors and Plasmid DNA Manufacturing Market Forecast, 2022-2032 (US$ million, AGR %)
Figure 108 Asia Pacific Viral Vectors and Plasmid DNA Manufacturing Market Attractiveness Index
Figure 109 Asia Pacific Viral Vectors and Plasmid DNA Manufacturing Market by Region, 2022, 2027 & 2032 (US$ million)
Figure 110 Asia Pacific Viral Vectors and Plasmid DNA Manufacturing Market Forecast by Country, 2022-2032 (US$ million)
Figure 111 Asia Pacific Viral Vectors and Plasmid DNA Manufacturing Market Share Forecast by Country, 2022 & 2032 (%)
Figure 112 Asia Pacific Viral Vectors and Plasmid DNA Manufacturing Market Forecast by Vector Type, 2022-2032 (US$ million)
Figure 113 Asia Pacific Viral Vectors and Plasmid DNA Manufacturing Market Share Forecast by Vector Type, 2022 & 2032 (%)
Figure 114 Asia Pacific Viral Vectors and Plasmid DNA Manufacturing Market Forecast by Application, 2022-2032 (US$ million)
Figure 115 Asia Pacific Viral Vectors and Plasmid DNA Manufacturing Market Share Forecast by Application, 2022 & 2032 (%)
Figure 116 Asia Pacific Viral Vectors and Plasmid DNA Manufacturing Market Forecast by End-use, 2022-2032 (US$ million)
Figure 117 Asia Pacific Viral Vectors and Plasmid DNA Manufacturing Market Share Forecast by End-use, 2022 & 2032 (%)
Figure 118 Asia Pacific Viral Vectors and Plasmid DNA Manufacturing Market Forecast by Disease, 2022-2032 (US$ million)
Figure 119 Asia Pacific Viral Vectors and Plasmid DNA Manufacturing Market Share Forecast by Disease, 2022 & 2032 (%)
Figure 120 Asia Pacific Viral Vectors and Plasmid DNA Manufacturing Market Forecast by Workflow, 2022-2032 (US$ million)
Figure 121 Asia Pacific Viral Vectors and Plasmid DNA Manufacturing Market Share Forecast by Workflow, 2022 & 2032 (%)
Figure 122 Japan Viral Vectors and Plasmid DNA Manufacturing Market Forecast, 2022-2032 (US$ million, AGR %)
Figure 123 China Viral Vectors and Plasmid DNA Manufacturing Market Forecast, 2022-2032 (US$ million, AGR %)
Figure 124 India Viral Vectors and Plasmid DNA Manufacturing Market Forecast, 2022-2032 (US$ million, AGR %)
Figure 125 Australia Viral Vectors and Plasmid DNA Manufacturing Market Forecast, 2022-2032 (US$ million, AGR %)
Figure 126 South Korea Viral Vectors and Plasmid DNA Manufacturing Market Forecast, 2022-2032 (US$ million, AGR %)
Figure 127 Rest of Asia Pacific Viral Vectors and Plasmid DNA Manufacturing Market Forecast, 2022-2032 (US$ million, AGR %)
Figure 128 Latin America Viral Vectors and Plasmid DNA Manufacturing Market Attractiveness Index
Figure 129 Latin America Viral Vectors and Plasmid DNA Manufacturing Market by Region, 2022, 2027 & 2032 (US$ million)
Figure 130 Latin America Viral Vectors and Plasmid DNA Manufacturing Market Forecast by Country, 2022-2032 (US$ million)
Figure 131 Latin America Viral Vectors and Plasmid DNA Manufacturing Market Share Forecast by Country, 2022 & 2032 (%)
Figure 132 Latin America Viral Vectors and Plasmid DNA Manufacturing Market Forecast by Vector Type, 2022-2032 (US$ million)
Figure 133 Latin America Viral Vectors and Plasmid DNA Manufacturing Market Share Forecast by Vector Type, 2022 & 2032 (%)
Figure 134 Latin America Viral Vectors and Plasmid DNA Manufacturing Market Forecast by Application, 2022-2032 (US$ million)
Figure 135 Latin America Viral Vectors and Plasmid DNA Manufacturing Market Share Forecast by Application, 2022 & 2032 (%)
Figure 136 Latin America Viral Vectors and Plasmid DNA Manufacturing Market Forecast by End-use, 2022-2032 (US$ million)
Figure 137 Latin America Viral Vectors and Plasmid DNA Manufacturing Market Share Forecast by End-use, 2022 & 2032 (%)
Figure 138 Latin America Viral Vectors and Plasmid DNA Manufacturing Market Forecast by Disease, 2022-2032 (US$ million)
Figure 139 Latin America Viral Vectors and Plasmid DNA Manufacturing Market Share Forecast by Disease, 2022 & 2032 (%)
Figure 140 Latin America Viral Vectors and Plasmid DNA Manufacturing Market Forecast by Workflow, 2022-2032 (US$ million)
Figure 141 Latin America Viral Vectors and Plasmid DNA Manufacturing Market Share Forecast by Workflow, 2022 & 2032 (%)
Figure 142 Brazil Viral Vectors and Plasmid DNA Manufacturing Market Forecast, 2022-2032 (US$ million, AGR %)
Figure 143 Mexico Viral Vectors and Plasmid DNA Manufacturing Market Forecast, 2022-2032 (US$ million), AGR %
Figure 144 Argentina Viral Vectors and Plasmid DNA Manufacturing Market Forecast, 2022-2032 (US$ million, AGR %)
Figure 145 Rest of Latin America Viral Vectors and Plasmid DNA Manufacturing Market Forecast, 2022-2032 (US$ million, AGR %)
Figure 146 MEA Viral Vectors and Plasmid DNA Manufacturing Market Attractiveness Index
Figure 147 MEA Viral Vectors and Plasmid DNA Manufacturing Market by Region, 2022, 2027 & 2032 (US$ million)
Figure 148 MEA Viral Vectors and Plasmid DNA Manufacturing Market Forecast by Country, 2022-2032 (US$ million)
Figure 149 MEA Viral Vectors and Plasmid DNA Manufacturing Market Share Forecast by Country, 2022 & 2032 (%)
Figure 150 MEA Viral Vectors and Plasmid DNA Manufacturing Market Forecast by Vector Type, 2022-2032 (US$ million)
Figure 151 MEA Viral Vectors and Plasmid DNA Manufacturing Market Share Forecast by Vector Type, 2022 & 2032 (%)
Figure 152 MEA Viral Vectors and Plasmid DNA Manufacturing Market Forecast by Application, 2022-2032 (US$ million)
Figure 153 MEA Viral Vectors and Plasmid DNA Manufacturing Market Share Forecast by Application, 2022 & 2032 (%)
Figure 154 MEA Viral Vectors and Plasmid DNA Manufacturing Market Forecast by End-use, 2022-2032 (US$ million)
Figure 155 MEA Viral Vectors and Plasmid DNA Manufacturing Market Share Forecast by End-use, 2022 & 2032 (%)
Figure 156 MEA Viral Vectors and Plasmid DNA Manufacturing Market Forecast by Disease, 2022-2032 (US$ million)
Figure 157 MEA Viral Vectors and Plasmid DNA Manufacturing Market Share Forecast by Disease, 2022 & 2032 (%)
Figure 158 MEA Viral Vectors and Plasmid DNA Manufacturing Market Forecast by Workflow, 2022-2032 (US$ million)
Figure 159 MEA Viral Vectors and Plasmid DNA Manufacturing Market Share Forecast by Workflow, 2022 & 2032 (%)
Figure 160 GCC Viral Vectors and Plasmid DNA Manufacturing Market Forecast, 2022-2032 (US$ million, AGR %)
Figure 161 South Africa Viral Vectors and Plasmid DNA Manufacturing Market Forecast, 2022-2032 (US$ million, AGR %)
Figure 162 Rest of MEA Viral Vectors and Plasmid DNA Manufacturing Market Forecast, 2022-2032 (US$ million, AGR %)
Figure 163 Merck KGaA.: Net Revenue, 2016-2021 (US$ Mn, AGR%)
Figure 164 Merck KGaA.: Gross Profit, 2016-2021 (US$ Mn, AGR%)
Figure 165 Merck KGaA.: R&D, 2016-2021 (US$ Mn, AGR%)
Figure 166 Lonza.: Net Revenue, 2016-2021 (US$ Mn, AGR%)
Figure 167 Lonza.: Gross Profit, 2016-2021 (US$ Mn, AGR%)
Figure 168 Lonza.: R&D, 2017-2020 (US$ Mn, AGR%)
Figure 169 Charles River Laboratories.: Net Revenue, 2016-2021 (US$ Mn, AGR%)
Figure 170 Charles River Laboratories.: Gross Profit, 2016-2021 (US$ Mn, AGR%)
Figure 171 Thermofisher Fisher Scientific Inc..: Net Revenue, 2016-2021 (US$ Mn, AGR%)
Figure 172 Thermofisher Scientific Inc..: Gross Profit, 2016-2021 (US$ Mn, AGR%)
Figure 173 Thermofisher Scientific Inc.: R&D, 2016-2021 (US$ Mn, AGR%)
Figure 174 Wuxi AppTec.: Net Revenue, 2016-2021 (US$ Mn, AGR%)
Figure 175 Wuxi AppTec.: Gross Profit, 2016-2020 (US$ Mn, AGR%)
Figure 176 bluebird bio, Inc.: Net Revenue, 2016-2021 (US$ Mn, AGR%)
Figure 177 bluebird bio, Inc.: R&D, 2016-2021 (US$ Mn, AGR%)
ページTOPに戻る
本レポートと同じKEY WORD(vector)の最新刊レポート
- 本レポートと同じKEY WORDの最新刊レポートはありません。
よくあるご質問
Visiongain社はどのような調査会社ですか?
英国の調査会社ヴィジョンゲイン社(Visiongain)は、通信とエネルギーのほか、自動車や化学・医薬品、金属など、広範な市場を対象に調査を行っています。自動車市場については、市場全般に関する調査のほ... もっと見る
調査レポートの納品までの日数はどの程度ですか?
在庫のあるものは速納となりますが、平均的には 3-4日と見て下さい。
但し、一部の調査レポートでは、発注を受けた段階で内容更新をして納品をする場合もあります。
発注をする前のお問合せをお願いします。
注文の手続きはどのようになっていますか?
1)お客様からの御問い合わせをいただきます。
2)見積書やサンプルの提示をいたします。
3)お客様指定、もしくは弊社の発注書をメール添付にて発送してください。
4)データリソース社からレポート発行元の調査会社へ納品手配します。
5) 調査会社からお客様へ納品されます。最近は、pdfにてのメール納品が大半です。
お支払方法の方法はどのようになっていますか?
納品と同時にデータリソース社よりお客様へ請求書(必要に応じて納品書も)を発送いたします。
お客様よりデータリソース社へ(通常は円払い)の御振り込みをお願いします。
請求書は、納品日の日付で発行しますので、翌月最終営業日までの当社指定口座への振込みをお願いします。振込み手数料は御社負担にてお願いします。
お客様の御支払い条件が60日以上の場合は御相談ください。
尚、初めてのお取引先や個人の場合、前払いをお願いすることもあります。ご了承のほど、お願いします。
データリソース社はどのような会社ですか?
当社は、世界各国の主要調査会社・レポート出版社と提携し、世界各国の市場調査レポートや技術動向レポートなどを日本国内の企業・公官庁及び教育研究機関に提供しております。
世界各国の「市場・技術・法規制などの」実情を調査・収集される時には、データリソース社にご相談ください。
お客様の御要望にあったデータや情報を抽出する為のレポート紹介や調査のアドバイスも致します。
|
|

