眼科用医薬品市場レポート:2023-2033
Ophthalmic Drugs Market Report 2023-2033
レポート詳細
眼科用医薬品の市場レポート 2023-2033 :本レポートは、新たな収益の柱を目指すリーディングカンパニーが、業界とその背景にあるダイナミクスをより深く理解する上で、非常に有益なもの... もっと見る
※上記価格は部署ライセンス(Departmental licence)価格です。
その他の価格についてはデータリソースまでお問合せください。
日本語のページは自動翻訳を利用し作成しています。
実際のレポートは英文のみでご納品いたします。
サマリー
レポート詳細
眼科用医薬品の市場レポート 2023-2033:本レポートは、新たな収益の柱を目指すリーディングカンパニーが、業界とその背景にあるダイナミクスをより深く理解する上で、非常に有益なものとなるでしょう。また、異業種への進出や新地域での既存事業の拡大を目指す企業にとっても有用なレポートです。
目に関連する疾患の頻度と発生率の増加、糖尿病患者の増加、強力な新開発パイプラインの存在が市場成長を促進する
眼科用医薬品市場を推進する主な要因としては、眼に関連する疾患の頻度や発生率の上昇、糖尿病の蔓延、強力な新薬の存在などが挙げられます。WHO(世界保健機関)のデータによると、世界では20億人以上の人が近視や遠視の障害に苦しんでいます。このうち約10億人が視力障害を放置しています。
さらに、主要企業が有望な医薬品をパイプラインに抱えているため、新製品の承認や上市の可能性が高く、眼科用医薬品市場は将来的に大きく発展する可能性を秘めています。企業は、眼科疾患とその治療オプションに関する認知度向上に積極的に取り組んでいます。また、デジタルマーケティングを活用することで、新製品に関する認知度を高めることにも成功しています。
ブロックバスター医薬品の特許満了について
医薬品の初期の開発者や革新者は、売上や収益の面で特許保護の恩恵を大きく受け、特許保護された医薬品の粗利率は90%を超える場合もある。しかし、後発医薬品が市場に出回るようになると、特許が切れることによって開発元は困難に直面します。医薬品の特許が切れると、先発メーカー以外のメーカーがより安価な後発品を発売することが可能になる。ジェネリック医薬品は、ブランド品や商標品に比べ、およそ20〜30%安価であることが指摘されている。必要な医薬品をより安価に購入できるようになり、消費者に節約の機会を与える。これは市場拡大の妨げになります。
マーケットリサーチレポートを購入する前に、どのような質問をすべきでしょうか?
- 眼科用医薬品市場はどのように進化しているのか?
- 眼科用医薬品市場の推進要因と抑制要因は何か?
- 予測期間中、各眼科用医薬品のサブマーケットセグメントはどのように成長し、2033年にこれらのサブマーケットが占める売上はどの程度になるのか?
- 2023年から2033年にかけて、各眼科用医薬品のサブマーケットの市場シェアはどのように推移するのか?
- 2023年から2033年にかけて、市場全体の主なドライバーは何になるのか?
- 眼科用医薬品の主要市場はマクロ経済のダイナミクスに概ね追随するのか、それとも個々の国市場が他を凌駕するのか?
- 2033年までに各国市場のシェアはどのように変化し、どの地域が2033年の市場をリードするのか?
- 主要プレイヤーは誰か、また予測期間中の展望は?
- 2023年から2033年の間に、業界はどのように進化していくのか?現在および今後10年間に行われる眼科薬プロジェクトにはどのような意味があるのか?
- 眼科用医薬品の市場をさらに拡大するために、製品の商業化の必要性は高いか?
- 眼科用医薬品市場はどこへ向かっているのか、そして市場の最前線に立つにはどうすればいいのか?
- 新製品やサービスラインに対する最適な投資オプションは?
- 企業を新たな成長軌道に乗せ、C-suiteに移行させるための重要な展望とは?
このことが、現在、そして今後10年間の眼科用医薬品市場にどのような影響を与えるかを知る必要があります。
- 本レポートは232ページにわたり、104の表と168のグラフを掲載しています。
- このレポートでは、業界における主要な収益性の高い分野をハイライトしているため、今すぐターゲットを絞ることができます。
- 世界、地域、国別の売上高と成長率を詳細に分析しています。
- 競合他社が成功した主要なトレンド、変化、収益予測をハイライトしています。
今後10年間に眼科用医薬品市場がどのように発展するか、またCOVID-19の景気後退と回復の変動に合わせて、今日あなたにお伝えします。この市場は、過去10年間のどの時点よりも今が重要なのです。
レポートでは、COVID-19のバリエーションや経済データなど、お客様の市場に特化した独自の情報をお届けしています。
2033年までの予測やその他の分析により、商業的な展望が見えてきた
- 2033年までの収益予測に加え、直近の実績、成長率、市場シェアもご覧いただけます。
- ビジネスの展望や展開など、独自の分析もご覧いただけます。
- 定性的分析(市場力学、ドライバー、機会、阻害要因、課題など)、コスト構造、眼科用医薬品の価格上昇の影響、最近の開発状況をご覧いただけます。
本レポートでは、COVID-19が業界と貴社にどのような影響を及ぼすかについて、データ分析と貴重な洞察を掲載しています。本レポートでは、COVID-19の4つの回収パターンとその影響、すなわち「V」、「L」、「W」、「U」について論じています。
報告書の対象セグメント
タイプ
- 医療用医薬品
- OTC医薬品
流通チャネル
- 病院薬局
- ドラッグストア
- オンライン薬局
適応症
- 網膜疾患
- 感染症・炎症・アレルギー
- ドライアイ
- 緑内障
投与経路
- 局所
- 非経口
世界市場全体およびセグメントの収益予測に加え、4地域および20の主要国市場の収益予測も掲載しています。
北米
- 米国
- カナダ
欧州
- ドイツ
- スペイン
- 英国
- フランス
- イタリア
- その他の欧州
アジア太平洋地域
- 中国
- 日本
- インド
- オーストラリア
- 韓国
- その他のアジア太平洋地域
ラテンアメリカ
- ブラジル
- メキシコ
- その他のラテンアメリカ地域
MEA
- GCC
- 南アフリカ
-その他のMEA
眼科用医薬品市場の2023年から2033年までの主要企業のプロファイルと、これらの企業の事業のこのセグメントに焦点を当てたものも含まれています。
主要企業と市場成長の可能性
・ AbbVie Inc.
・ Bayer AG
・ Bausch & Lomb Incorporated
・ F. Hoffmann-La Roche Ltd
・ Johnson & Johnson Services, Inc.
・ Novartis AG
・ Pfizer Inc.
・ Regeneron Pharmaceuticals Inc.
・ Santen Pharmaceutical Co., Ltd.
・ Teva Pharmaceutical Industries Ltd.
眼科用医薬品の世界全体売上高、2023年から2033年まで金額ベースで2022年に290億米ドルを突破する、と当研究所は算出しています。また、2033年までの売上高の大幅な伸びを予測している。本調査では、最も大きな可能性を秘めた企業を特定します。彼らの能力、進歩、商業的展望を発見することで、一歩先を行くことができます。
眼科用医薬品市場、2023年~2033年版レポートはどのように役立つのでしょうか?
230ページを超えるレポートでは、要約すると以下のような知識を得ることができます。
- 眼科用医薬品市場、2023年から2033年までの収益予測 世界と地域レベルでのタイプ、適応症、流通チャネル、投与経路の各予測を掲載 - 投資と収益に最も有利な場所を見つけ、業界の展望を発見することができます。
- 5つの地域と16の主要国市場の2033年までの収益予測 - 北米、欧州、アジア太平洋、中南米、MEAの眼科用医薬品市場、2023年から2033年の市場予測をご覧ください。また、米国、カナダ、メキシコ、ブラジル、ドイツ、フランス、英国、イタリア、中国、インド、日本、オーストラリアなどの主要経済圏の市場も予測されています。
- 既存企業および市場参入を目指す企業の展望 - 眼科用医薬品市場に関わる主要企業20社の企業プロファイルを含む、2023年から2033年までの展望。
定量的・定性的な分析と独自の予測をご覧いただけます。私たちのレポートだけが持つ情報を入手し、貴重なビジネスインテリジェンスを得ることができます。
他にはない情報
私たちの新しいレポートがあれば、知識の遅れを取り戻し、チャンスを逃す可能性が低くなります。私たちの研究が貴社の調査、分析、意思決定にどのように役立つかをご覧ください。Visiongainの研究は、眼科用医薬品市場、2023年から2033年、市場をリードする企業のための商業分析を必要とするすべての人のためのものです。データ、トレンド、予測を見つけることができます。
ページTOPに戻る
目次
目次
1.レポートの概要
1.1 調査の目的
1.2 眼科用医薬品市場の紹介
1.3 本レポートが提供するもの
1.4 なぜ本レポートを読むべきなのか
1.5 本分析レポートが回答する重要な質問
1.6 本レポートは誰のためのものなのか?
1.7 方法論
1.7.1 市場の定義
1.7.2 市場評価・予測手法
1.7.3 データの検証
1.7.3.1 一次調査
1.7.3.2 セカンダリーリサーチ
1.8 よくある質問(FAQ)
1.9 関連するVisiongainのレポート
1.10 Visiongainについて
2 エグゼクティブサマリー
3 市場の概要
3.1 主要な調査結果
3.2 マーケットダイナミクス
3.2.1 市場の推進要因
3.2.1.1 目に関する症状の頻度と発生率の上昇
3.2.1.2 糖尿病の有病率の増加
3.2.1.3 新興の強力なパイプライン医薬品の存在
3.2.2 市場阻害要因
3.2.2.1 発展途上国における健康保険の欠如
3.2.2.2 利用可能な治療オプションに関する認知度の低さ
3.2.2.3 薬剤の副作用
3.2.2.4 ブロックバスター医薬品の特許失効
3.2.3 市場機会
3.2.3.1 研究開発への投資の増加
3.2.3.2 老年人口の増加
3.3 コビド19の影響度分析
3.4 ポーターのファイブフォース分析
3.4.1 供給者のバーゲニングパワー
3.4.2 バイヤーのバーゲニングパワー
3.4.3 競争相手との競合
3.4.4 代替品の脅威
3.4.5 新規参入の脅威
3.5 PEST分析
4 眼科用医薬品市場分析:タイプ別
4.1 主な調査結果
4.2 タイプ別成長展望
4.3 眼科用医薬品のタイプ別市場規模の推定と予測
4.4 処方箋薬
4.4.1 地域別市場規模、2023年〜2033年 (10億米ドル)
4.4.2 地域別市場シェア、2023年&2033年(%)
4.5 一般用医薬品
4.5.1 地域別市場規模、2023年~2033年 (10億米ドル)
4.5.2 地域別市場シェア、2023年&2033年(%)
5 眼科用医薬品市場分析:流通チャネル別
5.1 主な調査結果
5.2 流通チャネル別成長展望
5.3 流通チャネル別眼科薬市場規模推定・予測
5.4 病院内薬局
5.4.1 地域別市場規模、2023年〜2033年(10億米ドル)
5.4.2 地域別市場シェア、2023年&2033年(%)
5.5 ドラッグストア
5.5.1 地域別市場規模、2023年~2033年 (10億米ドル)
5.5.2 地域別市場シェア(2023年&2033年)(%)
5.6 オンライン薬局
5.6.1 地域別市場規模、2023年〜2033年 (10億米ドル)
5.6.2 地域別市場シェア、2023年&2033年(%)
6 眼科用医薬品市場分析:適応症別
6.1 主要な調査結果
6.2 効能別セグメント成長展望
6.3 眼科用医薬品の適応症別市場規模の推定と予測
6.4 網膜疾患
6.4.1 地域別市場規模、2023年〜2033年(10億米ドル)
6.4.2 地域別市場シェア、2023年&2033年(%)
6.4.3 ブランド別網膜障害、2023年~2033年 (10億米ドル)
6.5 感染症/炎症/アレルギー
6.5.1 地域別市場規模、2023年~2033年 (10億米ドル)
6.5.2 地域別市場シェア、2023年&2033年(%)
6.5.3 ブランド別感染症/炎症/アレルギー、2023年~2033年 (億米ドル)
6.6 ドライアイ
6.6.1 地域別市場規模、2023〜2033年 (10億米ドル)
6.6.2 地域別市場シェア、2023年&2033年(%)
6.6.3 ブランド別ドライアイ、2023年~2033年 (10億米ドル)
6.7 緑内障
6.7.1 地域別市場規模、2023年~2033年 (10億米ドル)
6.7.2 地域別市場シェア、2023年&2033年(%)
6.7.3 緑内障のブランド別市場規模、2023年~2033年 (10億米ドル)
7 眼科用医薬品市場分析:投与経路別
7.1 主な調査結果
7.2 投与経路別セグメントの成長展望
7.3 眼科用医薬品の適応症別市場規模の推定と予測
7.4 局所
7.4.1 地域別市場規模、2023年〜2033年 (10億米ドル)
7.4.2 地域別市場シェア、2023年&2033年(%)
7.5 非経口剤
7.5.1 地域別市場規模、2023年~2033年 (10億米ドル)
7.5.2 地域別市場シェア、2023年&2033年(%)
8 眼科用医薬品市場分析:地域別
8.1 主要な調査結果
8.2 地域別市場規模の推定と予測
8.3 COVID-19の影響度分析。回復シナリオ(V, U, W, L)
9 北米の眼科用医薬品市場分析
9.1 主な調査結果
9.2 北米の眼科用医薬品の市場魅力度指数
9.3 北米の眼科用医薬品国別市場、2023年、2028年&2033年(10億US$)
9.4 北米の眼科用医薬品の国別市場規模の推定と予測
9.5 北米の眼科用医薬品の種類別市場規模の推定と予測
9.6 北米の眼科用医薬品の市場規模予測・流通経路別予測
9.7 北米の眼科用医薬品の適応症別市場規模予測・予想
9.8 北米の眼科用医薬品の投与経路別市場規模予測・予測
9.9 米国の眼科用医薬品の市場分析
9.10 カナダの眼科用医薬品の市場分析
10 欧州の眼科用医薬品市場分析
10.1 主な調査結果
10.2 欧州の眼科用医薬品市場魅力度指数
10.3 欧州の眼科用医薬品市場の国別推移、2023年、2028年&2033年(10億米ドル)
10.4 欧州の眼科用医薬品市場 国別市場規模予測・予測
10.5 欧州の眼科用医薬品の種類別市場規模予測・予測
10.6 欧州の眼科用医薬品の市場規模予測・流通チャネル別予測
10.7 欧州の眼科用医薬品の適応症別市場規模予測・予測
10.8 欧州の眼科用医薬品の投与経路別市場規模予測・予測
10.9 ドイツの眼科用医薬品の市場分析
10.10 フランスの眼科用医薬品の市場分析
10.11 イギリスの眼科用医薬品の市場分析
10.12 イタリアの眼科用医薬品の市場分析
10.13 スペインの眼科用医薬品の市場分析
10.14 その他の欧州の眼科用医薬品の市場分析
11 アジア太平洋地域の眼科用医薬品市場分析
11.1 主な調査結果
11.2 アジア太平洋地域の眼科用医薬品市場の魅力度指数
11.3 アジア太平洋地域の眼科用医薬品国別市場 2023年、2028年&2033年 (10億米ドル)
11.4 アジア太平洋地域の眼科用医薬品の国別市場規模の推定と予測
11.5 アジア太平洋地域の眼科用医薬品の種類別市場規模予測・予想
11.6 アジア太平洋地域の眼科用医薬品の市場規模予測・流通チャネル別予測
11.7 アジア太平洋地域の眼科用医薬品の適応症別市場規模予測・予測
11.8 アジア太平洋地域の眼科用医薬品の投与経路別市場規模予測・予測
11.9 日本の眼科用医薬品の市場分析
11.10 中国の眼科用医薬品の市場分析
11.11 インドの眼科用医薬品の市場分析
11.12 オーストラリアの眼科用医薬品の市場分析
11.13 韓国の眼科用医薬品の市場分析
11.14 その他のアジア太平洋地域の眼科用医薬品の市場分析
12 ラテンアメリカの眼科用医薬品市場分析
12.1 主な調査結果
12.2 ラテンアメリカの眼科用医薬品市場魅力度指数
12.3 中南米の眼科用医薬品国別市場 2023年、2028年&2033年 (10億米ドル)
12.4 中南米の眼科用医薬品国別市場規模の推定と予測
12.5 中南米の眼科用医薬品の種類別市場規模予測・予想
12.6 中南米の眼科用医薬品の市場規模予測・流通経路別予測
12.7 中南米の眼科用医薬品の市場規模予測・適応症別予測
12.8 中南米の眼科用医薬品の市場規模予測・予測:投与経路別
12.9 ブラジルの眼科用医薬品の市場分析
12.10 メキシコの眼科用医薬品の市場分析
12.11 その他の中南米地域の眼科用医薬品の市場分析
13 MEAの眼科用医薬品市場分析
13.1 主な調査結果
13.2 MEAの眼科用医薬品市場魅力度指数
13.3 MEAの眼科用医薬品市場:国別、2023年、2028年&2033年(10億米ドル)
13.4 MEAの眼科用医薬品の国別市場規模の推定と予測
13.5 MEAの眼科用医薬品のタイプ別市場規模の推定と予測
13.6 MEAの眼科用医薬品の市場規模予測・流通経路別予測
13.7 MEAの眼科用医薬品の適応症別市場規模予測・予想
13.8 MEAの眼科用医薬品の投与経路別市場規模予測・予測
13.9 GCCの眼科用医薬品の市場分析
13.10 南アフリカの眼科用医薬品の市場分析
13.11 MEAのその他の地域の眼科用医薬品の市場分析
14 主要企業のプロフィール
14.1 競合他社の状況、2021年
14.2 ノバルティスAG
14.2.1 会社概要
14.2.2 会社概要
14.2.3 財務分析
14.2.3.1 収益、2017年~2021年
14.2.3.2 地域別市場シェア、2021年(%)
14.2.4 製品ベンチマーク
14.2.5 戦略的な展望
14.3 バイエルAG
14.3.1 企業スナップショット
14.3.2 会社概要
14.3.3 財務分析
14.3.3.1 収益、2017-2021年
14.3.3.2 R&D、2017-2021年
14.3.3.3 地域別市場シェア、2021年(%)
14.3.4 製品ベンチマーク
14.3.5 戦略的な展望
14.4 ファイザー
14.4.1 企業スナップショット
14.4.2 会社概要
14.4.3 財務分析
14.4.3.1 収益、2017-2021年
14.4.3.2 R&D、2017-2021年
14.4.3.3 地域別市場シェア、2021年(%)
14.4.4 製品ベンチマーク
14.5 ボシュロム・インコーポレイテッド
14.5.1 企業スナップショット
14.5.2 会社概要
14.5.3 財務分析
14.5.3.1 収益、2017-2021年
14.5.3.2 R&D、2017-2021年
14.5.3.3 地域別市場シェア、2021年(%)
14.5.4 製品ベンチマーク
14.5.5 戦略的な展望
14.6 参天製薬
14.6.1 企業スナップショット
14.6.2 会社概要
14.6.3 財務分析
14.6.3.1 収益、2017-2021年
14.6.3.2 R&D、2017年-2021年
14.6.3.3 事業セグメント市場シェア、2021年(%)
14.6.4 製品ベンチマーク
14.6.5 戦略的な展望
14.7 ジョンソン・エンド・ジョンソン プライベート リミテッド
14.7.1 企業スナップショット
14.7.2 会社概要
14.7.3 財務分析
14.7.3.1 収益、2017-2021年
14.7.3.2 R&D、2017-2021年
14.7.3.3 地域別市場シェア、2021年(%)
14.7.4 製品ベンチマーク
14.7.5 戦略的な展望
14.8 リジェネロン・ファーマシューティカルズ・インク
14.8.1 企業スナップショット
14.8.2 会社概要
14.8.3 財務分析
14.8.3.1 収益、2017年-2021年
14.8.3.2 R&D、2017年-2021年
14.8.4 製品ベンチマーク
14.9 アッヴィー社
14.9.1 企業スナップショット
14.9.2 会社概要
14.9.3 財務分析
14.9.3.1 収益、2017-2021年
14.9.3.2 R&D、2017-2021年
14.9.3.3 地域別市場シェア、2021年(%)
14.9.4 製品ベンチマーク
14.9.5 戦略的な展望
14.10 F. ホフマン・ラ・ロシュ社
14.10.1 企業スナップショット
14.10.2 会社概要
14.10.3 財務分析
14.10.3.1 収益、2017-2021年
14.10.3.2 R&D、2017-2021年
14.10.3.3 地域別市場シェア、2021年 (%)
14.10.4 製品ベンチマーク
14.10.5 戦略的な展望
14.11 テバ・ファーマシューティカル・インダストリーズ
14.11.1 企業スナップショット
14.11.2 会社概要
14.11.3 財務分析
14.11.3.1 収入、2017-2021年
14.11.3.2 R&D費、2017年〜2021年
14.11.3.3 地域別市場シェア、2021年(%)
14.11.4 製品ベンチマーク
14.11.5 戦略的展望
15 結論と提言
15.1 ヴィジョンゲインからの結論
15.2 市場関係者への提言
表の一覧
Table 1 Ophthalmic Drugs Market Snapshot, 2023 & 2033 (US$ billion, CAGR %)
Table 2 Ophthalmic Drugs Market, Product Pipeline
Table 3 Ophthalmic Drugs Market by Region, 2023-2033 (US$ bn, AGR (%), CAGR(%)): “V” Shaped Recovery Scenario
Table 4 Ophthalmic Drugs Market Forecast by Region 2023-2033 (US$ bn, AGR%): "U" Shaped Recovery
Table 5 Ophthalmic Drugs Market Forecast by Region 2023-2033 (US$ Mn, AGR%): "W" Shaped Recovery
Table 6 Ophthalmic Drugs Market Forecast by Region 2023-2033 (US$ Mn, AGR%): "L" Shaped Recovery
Table 7 Ophthalmic Drugs Market Forecast by Type, 2023-2033 (US$ bn, AGR%, CAGR%)
Table 8 Prescription Drugs Market Forecast by Region, 2023-2033 (US$ bn, AGR%, CAGR%)
Table 9 OTC Drugs Market Forecast by Region, 2023-2033 (US$ bn, AGR%, CAGR%)
Table 10 Ophthalmic Drugs Market Forecast by Distribution Channel, 2023-2033 (US$ bn, AGR%, CAGR%)
Table 11 Hospital Pharmacies Market Forecast by Region, 2023-2033 (US$ bn, AGR%, CAGR%)
Table 12 Drug Stores Market Forecast by Region, 2023-2033 (US$ bn, AGR%, CAGR%)
Table 13 Online Pharmacies Market Forecast by Region, 2023-2033 (US$ bn, AGR%, CAGR%)
Table 14 Ophthalmic Drugs Market Forecast by Indications, 2023-2033 (US$ bn, AGR%, CAGR%)
Table 15 Retinal Disorders Market Forecast by Region, 2023-2033 (US$ bn, AGR%, CAGR%)
Table 16 Global Retinal Disorders in Ophthalmic Drugs Market Forecast by Brands, 2023-2033 (US$ bn, AGR%, CAGR%)
Table 17 Infection/Inflammation/Allergy Market Forecast by Region, 2023-2033 (US$ bn, AGR%, CAGR%)
Table 18 Global Infection/Inflammation/Allergy in Ophthalmic Drugs Market Forecast by Brands, 2023-2033 (US$ bn, AGR%, CAGR%)
Table 19 Dry Eye Market Forecast by Region, 2023-2033 (US$ bn, AGR%, CAGR%)
Table 20 Global Dry Eye in Ophthalmic Drugs Market Forecast by Brands, 2023-2033 (US$ bn, AGR%, CAGR%)
Table 21 Glaucoma Market Forecast by Region, 2023-2033 (US$ bn, AGR%, CAGR%)
Table 22 Global Glaucoma in Ophthalmic Drugs Market Forecast by Brands, 2023-2033 (US$ bn, AGR%, CAGR%)
Table 23 Ophthalmic Drugs Market Forecast by Route of Administration, 2023-2033 (US$ bn, AGR%, CAGR%)
Table 24 Topical Market Forecast by Region, 2023-2033 (US$ bn, AGR%, CAGR%)
Table 25 Parenteral Market Forecast by Region, 2023-2033 (US$ bn, AGR%, CAGR%)
Table 26 Ophthalmic Drugs Market Forecast by Region, 2023-2033 (US$ bn, AGR%, CAGR%)
Table 27 Ophthalmic Drugs Market by Region, 2023-2033 (US$ bn, AGR (%), CAGR(%)):
“V” Shaped Recovery Scenario
Table 28 Ophthalmic Drugs Market Forecast by Region 2023-2033 (US$ bn, AGR%): "U" Shaped Recovery
Table 29 Ophthalmic Drugs Market Forecast by Region 2023-2033 (US$ Mn, AGR%): "W" Shaped Recovery
Table 30 Ophthalmic Drugs Market Forecast by Region 2023-20323(US$ Mn, AGR%): "L" Shaped Recovery
Table 31 North America Ophthalmic Drugs Market Forecast by Country, 2023-2033 (US$ bn, AGR%, CAGR%)
Table 32 North America Ophthalmic Drugs Market Forecast by Type, 2023-2033 (US$ bn, AGR%, CAGR%)
Table 33 North America Ophthalmic Drugs Market Forecast by Distribution Channel, 2023-2033 (US$ bn, AGR%, CAGR%)
Table 34
Table 35 North America Ophthalmic Drugs Market Forecast by Indications, 2023-2033 (US$ bn, AGR%, CAGR%)
Table 36 North America Ophthalmic Drugs Market Forecast by Route of Administration, 2023-2033 (US$ bn, AGR%, CAGR%)
Table 37 U.S. Ophthalmic Drugs Market Forecast, 2023-2033 (US$ bn, AGR%, CAGR%)
Table 38 Canada Ophthalmic Drugs Market Forecast, 2023-2033 (US$ bn, AGR%, CAGR%)
Table 39 Europe Ophthalmic Drugs Market Forecast by Country, 2023-2033 (US$ bn, AGR%, CAGR%)
Table 40 Europe Ophthalmic Drugs Market Forecast by Type, 2023-2033 (US$ bn, AGR%, CAGR%)
Table 41 Europe Ophthalmic Drugs Market Forecast by Distribution Channel, 2023-2033 (US$ bn, AGR%, CAGR%)
Table 42 Europe Ophthalmic Drugs Market Forecast by Indications, 2023-2033 (US$ bn, AGR%, CAGR%)
Table 43 Europe Ophthalmic Drugs Market Forecast by Route of Administration, 2023-2033 (US$ bn, AGR%, CAGR%)
Table 44 Germany Ophthalmic Drugs Market Forecast, 2023-2033 (US$ bn, AGR%, CAGR%)
Table 45 France Ophthalmic Drugs Market Forecast, 2023-2033 (US$ bn, AGR%, CAGR%)
Table 46 U.K. Ophthalmic Drugs Market Forecast, 2023-2033 (US$ bn, AGR%, CAGR%)
Table 47 Italy Ophthalmic Drugs Market Forecast, 2023-2033 (US$ bn, AGR%, CAGR%)
Table 48 Spain Ophthalmic Drugs Market Forecast, 2023-2033 (US$ bn, AGR%, CAGR%)
Table 49 Rest of Europe Ophthalmic Drugs Market Forecast, 2023-2033 (US$ bn, AGR%, CAGR%)
Table 50 Asia-Pacific Ophthalmic Drugs Market Forecast by Country, 2023-2033 (US$ bn, AGR%, CAGR%)
Table 51 Asia-Pacific Ophthalmic Drugs Market Forecast by Type, 2023-2033 (US$ bn, AGR%, CAGR%)
Table 52 Asia-Pacific Ophthalmic Drugs Market Forecast by Distribution Channel, 2023-2033 (US$ bn, AGR%, CAGR%)
Table 53 Asia-Pacific Ophthalmic Drugs Market Forecast by Indications, 2023-2033 (US$ bn, AGR%, CAGR%)
Table 54 Asia-Pacific Ophthalmic Drugs Market Forecast by Route of Administration, 2023-2033 (US$ bn, AGR%, CAGR%)
Table 55 Japan Ophthalmic Drugs Market Forecast, 2023-2033 (US$ bn, AGR%, CAGR%)
Table 56 China Ophthalmic Drugs Market Forecast, 2023-2033 (US$ bn, AGR%, CAGR%)
Table 57 India Ophthalmic Drugs Market Forecast, 2023-2033 (US$ bn, AGR%, CAGR%)
Table 58 Australia Ophthalmic Drugs Market Forecast, 2023-2033 (US$ bn, AGR%, CAGR%)
Table 59 South Korea Ophthalmic Drugs Market Forecast, 2023-2033 (US$ bn, AGR%, CAGR%)
Table 60 Asia-Pacific Ophthalmic Drugs Market Forecast, 2023-2033 (US$ bn, AGR%, CAGR%)
Table 61 Latin America Ophthalmic Drugs Market Forecast by Country, 2023-2033 (US$ bn, AGR%, CAGR%)
Table 62 Latin America Ophthalmic Drugs Market Forecast by Type, 2023-2033 (US$ bn, AGR%, CAGR%)
Table 63 Latin America Ophthalmic Drugs Market Forecast by Distribution Channel, 2023-2033 (US$ bn, AGR%, CAGR%)
Table 64 Latin America Ophthalmic Drugs Market Forecast by Indications, 2023-2033 (US$ bn, AGR%, CAGR%)
Table 65 Latin America Ophthalmic Drugs Market Forecast by Route of Administration, 2023-2033 (US$ bn, AGR%, CAGR%)
Table 66 Brazil Ophthalmic Drugs Market Forecast, 2023-2033 (US$ bn, AGR%, CAGR%)
Table 67 Mexico Ophthalmic Drugs Market Forecast, 2023-2033 (US$ bn, AGR%, CAGR%)
Table 68 Rest of Latin America Ophthalmic Drugs Market Forecast, 2023-2033 (US$ bn, AGR%, CAGR%)
Table 69 MEA Ophthalmic Drugs Market Forecast by Country, 2023-2033 (US$ bn, AGR%, CAGR%)
Table 70 MEA Ophthalmic Drugs Market Forecast by Type, 2023-2033 (US$ bn, AGR%, CAGR%)
Table 71 MEA Ophthalmic Drugs Market Forecast by Distribution Channel, 2023-2033 (US$ bn, AGR%, CAGR%)
Table 72 MEA Ophthalmic Drugs Market Forecast by Indications, 2023-2033 (US$ bn, AGR%, CAGR%)
Table 73 MEA Ophthalmic Drugs Market Forecast by Route of Administration, 2023-2033 (US$ bn, AGR%, CAGR%)
Table 74 GCC Ophthalmic Drugs Market Forecast, 2023-2033 (US$ bn, AGR%, CAGR%)
Table 75 South Africa Ophthalmic Drugs Market Forecast, 2023-2033 (US$ bn, AGR%, CAGR%)
Table 76 Rest of MEA Ophthalmic Drugs Market Forecast, 2023-2033 (US$ bn, AGR%, CAGR%)
Table 77 Novartis AG: Key Details, (CEO, HQ, Revenue, Founded, No. of Employees, Company Type, Website, Business Segment)
Table 78 Novartis AG: Product Benchmarking
Table 79 Novartis AG: Strategic Outlook
Table 80 Bayer AG: Key Details, (CEO, HQ, Revenue, Founded, No. of Employees, Company Type, Website, Business Segment)
Table 81 Bayer AG: Product Benchmarking
Table 82 Bayer AG: Strategic Outlook
Table 83 Pfizer Inc.: Key Details, (CEO, HQ, Revenue, Founded, No. of Employees, Company Type, Website, Business Segment)
Table 84 Pfizer Inc.: Product Benchmarking
Table 85 Bausch & Lomb Incorporated : Key Details, (CEO, HQ, Revenue, Founded, No. of Employees, Company Type, Website, Business Segment)
Table 86 Bausch & Lomb Incorporated : Product Benchmarking
Table 87 Bausch & Lomb Incorporated : Strategic Outlook
Table 88 Santen Pharmaceutical Co., Ltd.: Key Details, (CEO, HQ, Revenue, Founded, No. of Employees, Company Type, Website, Business Segment)
Table 89 Santen Pharmaceutical Co., Ltd.: Product Benchmarking
Table 90 Santen Pharmaceutical Co., Ltd.: Strategic Outlook
Table 91 Johnson & Johnson Private Limited: Key Details, (CEO, HQ, Revenue, Founded, No. of Employees, Company Type, Website, Business Segment)
Table 92 Johnson & Johnson Private Limited: Product Benchmarking
Table 93 Johnson & Johnson Private Limited: Strategic Outlook
Table 94 Regeneron Pharmaceuticals Inc.: Key Details, (CEO, HQ, Revenue, Founded, No. of Employees, Company Type, Website, Business Segment)
Table 95 Regeneron Pharmaceuticals Inc.: Product Benchmarking
Table 96 AbbVie Inc.: Key Details, (CEO, HQ, Revenue, Founded, No. of Employees, Company Type, Website, Business Segment)
Table 97 AbbVie Inc.: Product Benchmarking
Table 98 AbbVie Inc.: Strategic Outlook
Table 99 F. Hoffmann-La Roche Ltd: Key Details, (CEO, HQ, Revenue, Founded, No. of Employees, Company Type, Website, Business Segment)
Table 100 F. Hoffmann-La Roche Ltd: Product Benchmarking
Table 101 F. Hoffmann-La Roche Ltd: Strategic Outlook
Table 102 Teva Pharmaceutical Industries Ltd.: Key Details, (CEO, HQ, Revenue, Founded, No. of Employees, Company Type, Website, Business Segment)
Table 103 Teva Pharmaceutical Industries Ltd.: Product Benchmarking
Table 104 Teva Pharmaceutical Industries Ltd.: Strategic Outlook
図の一覧
Figure 1 Ophthalmic Drugs Market Segmentation
Figure 2 Ophthalmic Drugs Market by Type: Market Attractiveness Index
Figure 3 Ophthalmic Drugs Market Forecast by Distribution Channel: Market Attractiveness Index
Figure 4 Ophthalmic Drugs Market Forecast by Indications: Market Attractiveness Index
Figure 5 Ophthalmic Drugs Market Forecast by Route of Administration: Market Attractiveness Index
Figure 6 Ophthalmic Drugs Market Attractiveness Index by Region
Figure 7 Ophthalmic Drugs Market: Market Dynamics
Figure 8 Global COVID Impact Analysis: Ophthalmic Drugs Market Recovery Scenarios
Figure 9 Ophthalmology drugs market by Region, 2023-2033 (US$ bn, AGR %): “V” Shaped Recovery
Figure 10 Ophthalmology drugs market by Region, 2023-2033 (US$ bn, AGR (%), CAGR (%)): “U” Shaped Recovery
Figure 11 Ophthalmology drugs market by Region, 2023-2033 (US$ bn, AGR (%), CAGR (%)): “W” Shaped Recovery
Figure 12 Ophthalmology drugs market by Region, 2023-2033 (US$ bn, AGR (%), CAGR (%)): “L” Shaped Recovery
Figure 13 Ophthalmic Drugs Market: Porter’s Five Forces Analysis
Figure 14 Ophthalmic Drugs Market: PEST Analysis
Figure 15 Ophthalmic Drugs Market Forecast by Type: Market Attractiveness Index
Figure 16 Ophthalmic Drugs Market Forecast By Type, 2023-2033 (US$ billion)
Figure 17 Ophthalmic Drugs Market Share Forecast by Type, 2023, 2028, 2033 (%)
Figure 18 Prescription Drugs Market Forecast by Region, 2023-2033 (US$ billion)
Figure 19 Prescription Drugs Market Share Forecast by Region, 2023 & 2033 (%)
Figure 20 OTC Market Forecast by Region, 2023-2033 (US$ billion)
Figure 21 OTC Market Share Forecast by Region, 2023 & 2033 (%)
Figure 22 Ophthalmic Drugs Market Forecast by Distribution Channel: Market Attractiveness Index
Figure 23 Ophthalmic Drugs Market Forecast By Distribution Channel, 2023-2033 (US$ billion)
Figure 24 Ophthalmic Drugs Market Share Forecast by Distribution Channel, 2023, 2028, 2033 (%)
Figure 25 Hospital Pharmacies Market Forecast by Region, 2023-2033 (US$ billion)
Figure 26 Hospital Pharmacies Market Share Forecast by Region, 2023 & 2033 (%)
Figure 27 Drug Stores Market Forecast by Region, 2023-2033 (US$ billion)
Figure 28 Drug Stores Market Share Forecast by Region, 2023 & 2033 (%)
Figure 29 Online Pharmacies Market Forecast by Region, 2023-2033 (US$ billion)
Figure 30 Online Pharmacies Market Share Forecast by Region, 2023 & 2033 (%)
Figure 31 Ophthalmic Drugs Market Forecast by Indications: Market Attractiveness Index
Figure 32 Ophthalmic Drugs Market Forecast By Indications, 2023-2033 (US$ billion)
Figure 33 Ophthalmic Drugs Market Share Forecast by Indications, 2023, 2028, 2033 (%)
Figure 34 Retinal Disorders Market Forecast by Region, 2023-2033 (US$ billion)
Figure 35 Retinal Disorders Market Share Forecast by Region, 2023 & 2033 (%)
Figure 36 Retinal Disorders Market Forecast by Brands, 2023-2033 (US$ billion)
Figure 37 Infection/Inflammation/Allergy Market Forecast by Region, 2023-2033 (US$ billion)
Figure 38 Infection/Inflammation/Allergy Market Share Forecast by Region, 2023 & 2033 (%)
Figure 39 Infection/Inflammation/Allergy Market Forecast by Brands, 2023-2033 (US$ billion)
Figure 40 Dry Eye Market Forecast by Region, 2023-2033 (US$ billion)
Figure 41 Dry Eye Market Share Forecast by Region, 2023 & 2033 (%)
Figure 42 Dry Eye Market Forecast by Brands, 2023-2033 (US$ billion)
Figure 43 Glaucoma Market Forecast by Region, 2023-2033 (US$ billion)
Figure 44 Glaucoma Market Share Forecast by Region, 2023 & 2033 (%)
Figure 45 Glaucoma Market Forecast by Brands, 2023-2033 (US$ billion)
Figure 46 Ophthalmic Drugs Market Forecast by Route of Administration: Market Attractiveness Index
Figure 47 Ophthalmic Drugs Market Forecast By Route of Administration, 2023-2033 (US$ billion)
Figure 48 Ophthalmic Drugs Market Share Forecast by Route of Administration, 2023, 2028, 2033 (%)
Figure 49 Topical Market Forecast by Region, 2023-2033 (US$ billion)
Figure 50 Topical Market Share Forecast by Region, 2023 & 2033 (%)
Figure 51 Parenteral Market Forecast by Region, 2023-2033 (US$ billion)
Figure 52 Parenteral Market Share Forecast by Region, 2023 & 2033 (%)
Figure 53 Ophthalmic Drugs Market Forecast by Region 2023, 2028, 2033 (Revenue, CAGR%)
Figure 54 Ophthalmic Drugs Market Share Forecast by Region 2023, 2028, 2033(%)
Figure 55 Ophthalmic Drugs Market by Region, 2023-2033 (US$ bn)
Figure 56 Ophthalmic Drugs Market by Region, 2023-2033 (US$ bn, AGR %): “V” Shaped Recovery
Figure 57 Ophthalmic Drugs Market by Region, 2023-2033 (US$ bn, AGR (%): “U” Shaped Recovery
Figure 58 Ophthalmic Drugs Market by Region, 2023-2033 (US$ bn, AGR (%), CAGR (%)): “W” Shaped Recovery
Figure 59 Ophthalmic Drugs Market by Region, 2023-2033 (US$ bn, AGR (%), CAGR (%)): “L” Shaped Recovery
Figure 60 North America Ophthalmic Drugs Market Attractiveness Index
Figure 61 North America Ophthalmic Drugs Market by Region, 2023, 2028 & 2033 (US$ billion)
Figure 62 North America Ophthalmic Drugs Market Forecast by Country, 2023-2033 (US$ billion)
Figure 63 North America Ophthalmic Drugs Market Share Forecast by Country, 2023 & 2033 (%)
Figure 64 North America Ophthalmic Drugs Market Forecast by Type, 2023-2033 (US$ billion)
Figure 65 North America Ophthalmic Drugs Market Share Forecast by Type, 2023 & 2033 (%)
Figure 66 North America Ophthalmic Drugs Market Forecast by Distribution Channel, 2023-2033 (US$ billion)
Figure 67 North America Ophthalmic Drugs Market Share Forecast by Distribution Channel, 2023 & 2033 (%)
Figure 68 North America Ophthalmic Drugs Market Forecast by Indications, 2023-2033 (US$ billion)
Figure 69 North America Ophthalmic Drugs Market Share Forecast by Indications, 2023 & 2033 (%)
Figure 70 North America Ophthalmic Drugs Market Forecast by Route of Administration, 2023-2033 (US$ billion)
Figure 71 North America Ophthalmic Drugs Market Share Forecast by Route of Administration, 2023 & 2033 (%)
Figure 72 U.S. Ophthalmic Drugs Market Forecast, 2023-2033 (US$ billion, AGR %)
Figure 73 Canada Ophthalmic Drugs Market Forecast, 2023-2033 (US$ billion, AGR %)
Figure 74 Europe Ophthalmic Drugs Market Attractiveness Index
Figure 75 Europe Ophthalmic Drugs Market by Region, 2023, 2028 & 2033 (US$ billion)
Figure 76 Europe Ophthalmic Drugs Market Forecast by Country, 2023-2033 (US$ billion)
Figure 77 Europe Ophthalmic Drugs Market Share Forecast by Country, 2023 & 2033 (%)
Figure 78 Europe Ophthalmic Drugs Market Forecast by Type, 2023-2033 (US$ billion)
Figure 79 Europe Ophthalmic Drugs Market Share Forecast by Type, 2023 & 2033 (%)
Figure 80 Europe Ophthalmic Drugs Market Forecast by Distribution Channel, 2023-2033 (US$ billion)
Figure 81 Europe Ophthalmic Drugs Market Share Forecast by Distribution Channel, 2023 & 2033 (%)
Figure 82 Europe Ophthalmic Drugs Market Forecast by Indications, 2023-2033 (US$ billion)
Figure 83 Europe Ophthalmic Drugs Market Share Forecast by Indications, 2023 & 2033 (%)
Figure 84 Europe Ophthalmic Drugs Market Forecast by Route of Administration, 2023-2033 (US$ billion)
Figure 85 Europe Ophthalmic Drugs Market Share Forecast by Route of Administration, 2023 & 2033 (%)
Figure 86 Germany Ophthalmic Drugs Market Forecast, 2023-2033 (US$ billion, AGR %)
Figure 87 France Ophthalmic Drugs Market Forecast, 2023-2033 (US$ billion, AGR %)
Figure 88 U.K. Ophthalmic Drugs Market Forecast, 2023-2033 (US$ billion, AGR %)
Figure 89 Italy Ophthalmic Drugs Market Forecast, 2023-2033 (US$ billion, AGR %)
Figure 90 Spain Ophthalmic Drugs Market Forecast, 2023-2033 (US$ billion, AGR %)
Figure 91 Rest of Europe Ophthalmic Drugs Market Forecast, 2023-2033 (US$ billion, AGR %)
Figure 92 Asia Pacific Ophthalmic Drugs Market Attractiveness Index
Figure 93 Asia Pacific Ophthalmic Drugs Market by Region, 2023, 2028 & 2033 (US$ billion)
Figure 94 Asia Pacific Ophthalmic Drugs Market Forecast by Country, 2023-2033 (US$ billion)
Figure 95 Asia Pacific Ophthalmic Drugs Market Share Forecast by Country, 2023 & 2033 (%)
Figure 96 Asia-Pacific Ophthalmic Drugs Market Forecast by Type, 2023-2033 (US$ billion)
Figure 97 Asia-Pacific Ophthalmic Drugs Market Share Forecast by Type, 2023 & 2033 (%)
Figure 98 Asia-Pacific Ophthalmic Drugs Market Forecast by Distribution Channel, 2023-2033 (US$ billion)
Figure 99 Asia-Pacific Ophthalmic Drugs Market Share Forecast by Distribution Channel, 2023 & 2033 (%)
Figure 100 Asia-Pacific Ophthalmic Drugs Market Forecast by Indications, 2023-2033 (US$ billion)
Figure 101 Asia-Pacific Ophthalmic Drugs Market Share Forecast by Indications, 2023 & 2033 (%)
Figure 102 Asia-Pacific Ophthalmic Drugs Market Forecast by Route of Administration, 2023-2033 (US$ billion)
Figure 103 Asia-Pacific Ophthalmic Drugs Market Share Forecast by Route of Administration, 2023 & 2033 (%)
Figure 104 Japan Ophthalmic Drugs Market Forecast, 2023-2033 (US$ billion, AGR %)
Figure 105 China Ophthalmic Drugs Market Forecast, 2023-2033 (US$ billion, AGR %)
Figure 106 India Ophthalmic Drugs Market Forecast, 2023-2033 (US$ billion, AGR %)
Figure 107 Australia Ophthalmic Drugs Market Forecast, 2023-2033 (US$ billion, AGR %)
Figure 108 South Korea Ophthalmic Drugs Market Forecast, 2023-2033 (US$ billion, AGR %)
Figure 109 Rest of Asia Pacific Ophthalmic Drugs Market Forecast, 2023-2033 (US$ billion, AGR %)
Figure 110 Latin America Ophthalmic Drugs Market Attractiveness Index
Figure 111 Latin America Ophthalmic Drugs Market by Region, 2023, 2028 & 2033 (US$ billion)
Figure 112 Latin America Ophthalmic Drugs Market Forecast by Country, 2023-2033 (US$ billion)
Figure 113 Latin America Ophthalmic Drugs Market Share Forecast by Country, 2023 & 2033 (%)
Figure 114 Latin America Ophthalmic Drugs Market Forecast by Type, 2023-2033 (US$ billion)
Figure 115 Latin America Ophthalmic Drugs Market Share Forecast by Type, 2023 & 2033 (%)
Figure 116 Latin America Ophthalmic Drugs Market Forecast by Distribution Channel, 2023-2033 (US$ billion)
Figure 117 Latin America Ophthalmic Drugs Market Share Forecast by Distribution Channel, 2023 & 2033 (%)
Figure 118 Latin America Ophthalmic Drugs Market Forecast by Indications, 2023-2033 (US$ billion)
Figure 119 Latin America Ophthalmic Drugs Market Share Forecast by Indications, 2023 & 2033 (%)
Figure 120 Latin America Ophthalmic Drugs Market Forecast by Route of Administration, 2023-2033 (US$ billion)
Figure 121 Latin America Ophthalmic Drugs Market Share Forecast by Route of Administration, 2023 & 2033 (%)
Figure 122 Brazil Ophthalmic Drugs Market Forecast, 2023-2033 (US$ billion, AGR %)
Figure 123 Mexico Ophthalmic Drugs Market Forecast, 2023-2033 (US$ billion, AGR %)
Figure 124 Rest of Latin America Ophthalmic Drugs Market Forecast, 2023-2033 (US$ billion, AGR %)
Figure 125 MEA Ophthalmic Drugs Market Attractiveness Index
Figure 126 MEA Ophthalmic Drugs Market by Region, 2023, 2028 & 2033 (US$ billion)
Figure 127 MEA Ophthalmic Drugs Market Forecast by Country, 2023-2033 (US$ billion)
Figure 128 MEA Ophthalmic Drugs Market Share Forecast by Country, 2023 & 2033 (%)
Figure 129 MEA Ophthalmic Drugs Market Forecast by Type, 2023-2033 (US$ billion)
Figure 130 MEA Ophthalmic Drugs Market Share Forecast by Type, 2023 & 2033 (%)
Figure 131 MEA Ophthalmic Drugs Market Forecast by Distribution Channel, 2023-2033 (US$ billion)
Figure 132 MEA Ophthalmic Drugs Market Share Forecast by Distribution Channel, 2023 & 2033 (%)
Figure 133 MEA Ophthalmic Drugs Market Forecast by Indications, 2023-2033 (US$ billion)
Figure 134 MEA Ophthalmic Drugs Market Share Forecast by Indications, 2023 & 2033 (%)
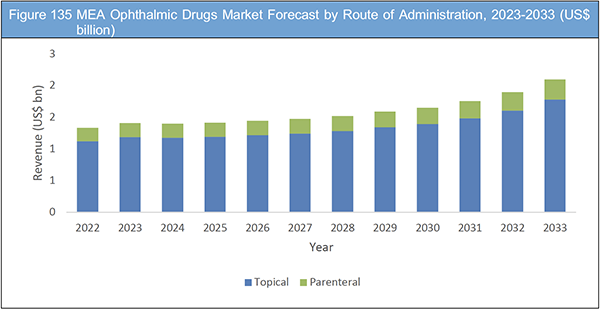
Figure 135 MEA Ophthalmic Drugs Market Forecast by Route of Administration, 2023-2033 (US$ billion)
Figure 136 MEA Ophthalmic Drugs Market Share Forecast by Route of Administration, 2023 & 2033 (%)
Figure 137 GCC Ophthalmic Drugs Market Forecast, 2023-2033 (US$ billion, AGR %)
Figure 138 South Africa Ophthalmic Drugs Market Forecast, 2023-2033 (US$ billion, AGR %)
Figure 139 Rest of MEA Ophthalmic Drugs Market Forecast, 2023-2033 (US$ billion, AGR %)
Figure 140 Ophthalmic Drugs Market: Company Share/Ranking, 2021
Figure 141 Novartis AG: Revenue, 2017-2021 (US$ million, AGR%)
Figure 142 Novartis AG: Regional Market Shares, 2021 (%)
Figure 143 Bayer AG: Net Sales, 2017-2021 (US$ million, AGR%)
Figure 144 Bayer AG: R&D Expenses, 2017-2021 (US$ million, AGR%)
Figure 145 Bayer AG: Regional Market Shares, 2021 (%)
Figure 146 Pfizer Inc.: Revenue, 2017-2021 (US$ million, AGR%)
Figure 147 Pfizer Inc.: Net Income, 2017-2021 (US$ million, AGR%)
Figure 148 Pfizer Inc.: Regional Market Shares, 2021 (%)
Figure 149 Bausch & Lomb Incorporated : Net Sales, 2017-2021 (US$ million, AGR%)
Figure 150 Bausch & Lomb Incorporated : R&D Expenses, 2017-2021 (US$ million, AGR%)
Figure 151 Bausch & Lomb Incorporated : Regional Market Shares, 2021 (%)
Figure 152 Santen Pharmaceutical Co., Ltd.: Revenue, 2017-2021 (US$ million, AGR%)
Figure 153 Santen Pharmaceutical Co., Ltd.: Net Income, 2017-2021 (US$ million, AGR%)
Figure 154 Santen Pharmaceutical Co., Ltd.: Business Segment Shares, 2021 (%)
Figure 155 Johnson & Johnson Private Limited: Revenue, 2017-2021 (US$ million, AGR%)
Figure 156 Johnson & Johnson Private Limited: R&D, 2017-2021 (US$ million, AGR%)
Figure 157 Johnson & Johnson Private Limited: Regional Market Shares, 2021 (%)
Figure 158 Regeneron Pharmaceuticals Inc.: Revenue, 2017-2021 (US$ million, AGR%)
Figure 159 Regeneron Pharmaceuticals Inc.: R&D, 2017-2021 (US$ million, AGR%)
Figure 160 AbbVie Inc.: Revenue, 2017-2021 (US$ million, AGR%)
Figure 161 AbbVie Inc.: R&D, 2017-2021 (US$ million, AGR%)
Figure 162 AbbVie Inc.: Regional Market Shares, 2021 (%)
Figure 163 F. Hoffmann-La Roche Ltd: Revenue, 2017-2021 (US$ million, AGR%)
Figure 164 F. Hoffmann-La Roche Ltd: R&D Expenses, 2017-2021 (US$ million, AGR%)
Figure 165 F. Hoffmann-La Roche Ltd: Regional Market Shares, 2021 (%)
Figure 166 Teva Pharmaceutical Industries Ltd.: Revenue, 2017-2021 (US$ million, AGR%)
Figure 167 Teva Pharmaceutical Industries Ltd.: R&D, 2017-2021 (US$ million, AGR%)
Figure 168 Teva Pharmaceutical Industries Ltd.: Regional Market Shares, 2021 (%)
ページTOPに戻る
Summary
この調査レポートは世界の眼科用医薬品市場を調査し、タイプ別、流通チャネル別、適応症別、投与経路別、地域別に2022年から2032年までの予測結果を掲載しています。また関連企業情報を提供しています。
主な掲載内容(目次より抜粋)
-
レポート概要
-
エグゼクティブサマリー
-
市場概要
-
眼科用医薬品市場分析:タイプ別
-
眼科用医薬品市場分析:流通チャネル別
-
眼科用医薬品市場分析:適応症別
-
眼科用医薬品市場分析:投与経路別
-
眼科用医薬品市場分析:地域別
-
北米の眼科用医薬品市場分析
-
欧州の眼科用医薬品市場分析
-
アジア太平洋地域の眼科用医薬品市場分析
-
ラテンアメリカの眼科用医薬品市場分析
-
MEAの眼科用医薬品市場分析
-
主要企業のプロフィール
Report Details
The Ophthalmic Drugs Market Report 2023-2033: This report will prove invaluable to leading firms striving for new revenue pockets if they wish to better understand the industry and its underlying dynamics. It will be useful for companies that would like to expand into different industries or to expand their existing operations in a new region.
Rising Frequency and Occurrence of Eye-related Conditions, Increasing Prevalence of Diabetes, and Presence of Strong Emerging Pipeline Drugs Are Driving the Market Growth
Some of the major forces propelling the ophthalmic drugs market include rising frequency and occurrence of eye-related conditions, increasing prevalence of diabetes, and presence of strong emerging pipeline drugs. As per the data provided by WHO (World Health Organization), globally over 2 billion people suffer from a near or distance vision impairment. Approximately 1 billion of these people’s vision damage have been neglected.
Furthermore, ophthalmic drugs market holds a great potential to flourish in the future as there is a great possibilities of new product approvals and launches as key players have high potential drugs in their pipeline. The companies are actively involving in creating awareness regarding the ophthalmic disorders and their treatment options. Along with this companies are taking advantage of digital marketing in a meaningful way to spread the awareness regarding their new products.
Patent Expiry of Blockbuster Drugs
The early developers and innovators of the pharmaceuticals benefit greatly from patent protection in terms of sales and earnings; in certain instances, the gross profit margins for the patent-protected drugs surpass 90%. The market introduction of generic competitors, however, presents difficulties for the original developer as a result of the patent expiration. Drug patent expiration enables producers other than the original creator to release less expensive generic versions. It has been noted that the generic versions of the pharmaceuticals cost roughly 20–30% less than the branded and trademarked products. It gives consumers the chance to save money by enabling them to purchase necessary medications for less money. This will impede market expansion.
What Questions Should You Ask before Buying a Market Research Report?
• How is the ophthalmic drugs market evolving?
• What is driving and restraining the ophthalmic drugs market?
• How will each ophthalmic drugs submarket segment grow over the forecast period and how much revenue will these submarkets account for in 2033?
• How will the market shares for each ophthalmic drugs submarket develop from 2023 to 2033?
• What will be the main driver for the overall market from 2023 to 2033?
• Will leading ophthalmic drugs markets broadly follow the macroeconomic dynamics, or will individual national markets outperform others?
• How will the market shares of the national markets change by 2033 and which geographical region will lead the market in 2033?
• Who are the leading players and what are their prospects over the forecast period?
• How will the industry evolve during the period between 2023 and 2033? What are the implications of ophthalmic drugs projects taking place now and over the next 10 years?
• Is there a greater need for product commercialisation to further scale the ophthalmic drugs market?
• Where is the ophthalmic drugs market heading and how can you ensure you are at the forefront of the market?
• What are the best investment options for new product and service lines?
• What are the key prospects for moving companies into a new growth path and C-suite?
You need to discover how this will impact the ophthalmic drugs market today, and over the next 10 years:
• Our 232-page report provides 104 tables and 168 charts/graphs exclusively to you.
• The report highlights key lucrative areas in the industry so you can target them – NOW.
• It contains in-depth analysis of global, regional and national sales and growth.
• It highlights for you the key successful trends, changes and revenue projections made by your competitors.
This report tells you TODAY how the ophthalmic drugs market will develop in the next 10 years, and in line with the variations in COVID-19 economic recession and bounce. This market is more critical now than at any point over the last 10 years.
The report delivers exclusive COVID-19 variations and economic data specific to your market.
Forecasts to 2033 and other analyses reveal commercial prospects
• In addition to revenue forecasting to 2033, our new study provides you with recent results, growth rates, and market shares.
• You will find original analyses, with business outlooks and developments.
• Discover qualitative analyses (including market dynamics, drivers, opportunities, restraints and challenges), cost structure, impact of rising ophthalmic drugs prices and recent developments.
This report includes data analysis and invaluable insight into how COVID-19 will affect the industry and your company. Four COVID-19 recovery patterns and their impact, namely, “V”, “L”, “W” and “U” are discussed in this report.
Segments Covered in the Report
Type
• Prescription Drugs
• OTC Drugs
Distribution Channel
• Hospital Pharmacies
• Drug Stores
• Online Pharmacies
Indications
• Retinal Disorders
• Infection/Inflammation/Allergy
• Dry Eye
• Glaucoma
Route of Administration
• Topical
• Parenteral
In addition to the revenue predictions for the overall world market and segments, you will also find revenue forecasts for four regional and 20 leading national markets:
North America
• U.S.
• Canada
Europe
• Germany
• Spain
• UK
• France
• Italy
• Rest of Europe
Asia Pacific
• China
• Japan
• India
• Australia
• South Korea
• Rest of Asia Pacific
Latin America
• Brazil
• Mexico
• Rest of Latin America
MEA
• GCC
• South Africa
• Rest of MEA
The report also includes profiles and for some of the leading companies in the Ophthalmic Drugs Market, 2023 to 2033, with a focus on this segment of these companies’ operations.
Leading companies and the potential for market growth
• AbbVie Inc.
• Bayer AG
• Bausch & Lomb Incorporated
• F. Hoffmann-La Roche Ltd
• Johnson & Johnson Services, Inc.
• Novartis AG
• Pfizer Inc.
• Regeneron Pharmaceuticals Inc.
• Santen Pharmaceutical Co., Ltd.
• Teva Pharmaceutical Industries Ltd.
Overall world revenue for ophthalmic drugs market, 2023 to 2033 in terms of value the market will surpass US$29 billion in 2022, our work calculates. We predict strong revenue growth through to 2033. Our work identifies which organizations hold the greatest potential. Discover their capabilities, progress, and commercial prospects, helping you stay ahead.
How will the ophthalmic drugs market, 2023 to 2033 report help you?
In summary, our 230+ page report provides you with the following knowledge:
• Revenue forecasts to 2033 for ophthalmic drugs market, 2023 to 2033 Market, with forecasts for type, indication, distribution channel, and route of administration each forecast at a global and regional level – discover the industry’s prospects, finding the most lucrative places for investments and revenues.
• Revenue forecasts to 2033 for five regions and 16 key national markets – See forecasts for the ophthalmic drugs Market, 2023 to 2033 market in North America, Europe, Asia-Pacific, Latin America and MEA. Also forecasted is the market in the US, Canada, Mexico, Brazil, Germany, France, UK, Italy, China, India, Japan, and Australia among other prominent economies.
• Prospects for established firms and those seeking to enter the market – including company profiles for 20 of the major companies involved in the ophthalmic drugs Market, 2023 to 2033.
Find quantitative and qualitative analyses with independent predictions. Receive information that only our report contains, staying informed with invaluable business intelligence.
Information found nowhere else
With our new report, you are less likely to fall behind in knowledge or miss out on opportunities. See how our work could benefit your research, analyses, and decisions. Visiongain’s study is for everybody needing commercial analyses for the ophthalmic drugs market, 2023 to 2033, market-leading companies. You will find data, trends and predictions.
ページTOPに戻る
Table of Contents
Table of Contents
1. Report Overview
1.1 Objectives of the Study
1.2 Introduction to Ophthalmic Drugs market
1.3 What This Report Delivers
1.4 Why You Should Read This Report
1.5 Key Questions Answered by This Analytical Report
1.6 Who is This Report for?
1.7 Methodology
1.7.1 Market Definitions
1.7.2 Market Evaluation & Forecasting Methodology
1.7.3 Data Validation
1.7.3.1 Primary Research
1.7.3.2 Secondary Research
1.8 Frequently Asked Questions (FAQs)
1.9 Associated Visiongain Reports
1.10 About Visiongain
2 Executive Summary
3 Market Overview
3.1 Key Findings
3.2 Market Dynamics
3.2.1 Market Driving Factors
3.2.1.1 Rising Frequency and Occurrence of Eye-related Conditions
3.2.1.2 Increasing Prevalence of Diabetes
3.2.1.3 Presence of Strong Emerging Pipeline Drugs
3.2.2 Market Restraining Factors
3.2.2.1 Lack of Health Insurance in the Developing Countries
3.2.2.2 Lack of Awareness Regarding the Available Treatment Options
3.2.2.3 Side Effects of Drugs
3.2.2.4 Patent Expiry of Blockbuster Drugs
3.2.3 Market Opportunities
3.2.3.1 Rise in Investment in Research and Development
3.2.3.2 Rise in Geriatric Population
3.3 COVID-19 Impact Analysis
3.4 Porter’s Five Forces Analysis
3.4.1 Bargaining Power of Suppliers
3.4.2 Bargaining Power of Buyers
3.4.3 Competitive Rivalry
3.4.4 Threat of Substitutes
3.4.5 Threat of New Entrants
3.5 PEST Analysis
4 Ophthalmic Drugs Market Analysis by Type
4.1 Key Findings
4.2 Type Segment Growth Prospects
4.3 Ophthalmic Drugs Market Size Estimation and Forecast by Type
4.4 Prescription Drugs
4.4.1 Market Size by Region, 2023-2033 (US$ bn)
4.4.2 Market Share by Region, 2023 & 2033 (%)
4.5 OTC
4.5.1 Market Size by Region, 2023-2033 (US$ bn)
4.5.2 Market Share by Region, 2023 & 2033 (%)
5 Ophthalmic Drugs Market Analysis by Distribution Channel
5.1 Key Findings
5.2 Distribution Channel Segment Growth Prospects
5.3 Ophthalmic Drugs Market Size Estimation and Forecast by Distribution Channel
5.4 Hospital Pharmacies
5.4.1 Market Size by Region, 2023-2033 (US$ bn)
5.4.2 Market Share by Region, 2023 & 2033 (%)
5.5 Drug Stores
5.5.1 Market Size by Region, 2023-2033 (US$ bn)
5.5.2 Market Share by Region, 2023 & 2033 (%)
5.6 Online Pharmacies
5.6.1 Market Size by Region, 2023-2033 (US$ bn)
5.6.2 Market Share by Region, 2023 & 2033 (%)
6 Ophthalmic Drugs Market Analysis by Indications
6.1 Key Findings
6.2 Indications Segment Growth Prospects
6.3 Ophthalmic Drugs Market Size Estimation and Forecast by Indications
6.4 Retinal Disorders
6.4.1 Market Size by Region, 2023-2033 (US$ bn)
6.4.2 Market Share by Region, 2023 & 2033 (%)
6.4.3 Retinal Disorders by Brands, 2023-2033 (US$ bn)
6.5 Infection/Inflammation/Allergy
6.5.1 Market Size by Region, 2023-2033 (US$ bn)
6.5.2 Market Share by Region, 2023 & 2033 (%)
6.5.3 Infection/Inflammation/Allergy by Brands, 2023-2033 (US$ bn)
6.6 Dry Eye
6.6.1 Market Size by Region, 2023-2033 (US$ bn)
6.6.2 Market Share by Region, 2023 & 2033 (%)
6.6.3 Dry Eye by Brands, 2023-2033 (US$ bn)
6.7 Glaucoma
6.7.1 Market Size by Region, 2023-2033 (US$ bn)
6.7.2 Market Share by Region, 2023 & 2033 (%)
6.7.3 Glaucoma by Brands, 2023-2033 (US$ bn)
7 Ophthalmic Drugs Market Analysis by Route of Administration
7.1 Key Findings
7.2 Route of Administration Segment Growth Prospects
7.3 Ophthalmic Drugs Market Size Estimation and Forecast by Indications
7.4 Topical
7.4.1 Market Size by Region, 2023-2033 (US$ bn)
7.4.2 Market Share by Region, 2023 & 2033 (%)
7.5 Parenteral
7.5.1 Market Size by Region, 2023-2033 (US$ bn)
7.5.2 Market Share by Region, 2023 & 2033 (%)
8 Ophthalmic Drugs Market Analysis by Region
8.1 Key Findings
8.2 Regional Market Size Estimation and Forecast
8.3 COVID-19 Impact Analysis: Recovery Scenarios (V, U, W, L)
9 North America Ophthalmic Drugs Market Analysis
9.1 Key Findings
9.2 North America Ophthalmic Drugs Market Attractiveness Index
9.3 North America Ophthalmic Drugs Market by Country, 2023, 2028 & 2033 (US$ bn)
9.4 North America Ophthalmic Drugs Market Size Estimation and Forecast by Country
9.5 North America Ophthalmic Drugs Market Size Estimation and Forecast by Type
9.6 North America Ophthalmic Drugs Market Size Estimation and Forecast by Distribution Channel
9.7 North America Ophthalmic Drugs Market Size Estimation and Forecast by Indications
9.8 North America Ophthalmic Drugs Market Size Estimation and Forecast by Route of Administration
9.9 U.S. Ophthalmic Drugs Market Analysis
9.10 Canada Ophthalmic Drugs Market Analysis
10 Europe Ophthalmic Drugs Market Analysis
10.1 Key Findings
10.2 Europe Ophthalmology drugs market Attractiveness Index
10.3 Europe Ophthalmic Drugs Market by Country, 2023, 2028 & 2033 (US$ bn)
10.4 Europe Ophthalmology drugs market Size Estimation and Forecast by Country
10.5 Europe Ophthalmic Drugs Market Size Estimation and Forecast by Type
10.6 Europe Ophthalmic Drugs Market Size Estimation and Forecast by Distribution Channel
10.7 Europe Ophthalmic Drugs Market Size Estimation and Forecast by Indications
10.8 Europe Ophthalmic Drugs Market Size Estimation and Forecast by Route of Administration
10.9 Germany Ophthalmic Drugs Market Analysis
10.10 France Ophthalmic Drugs Market Analysis
10.11 U.K. Ophthalmic Drugs Market Analysis
10.12 Italy Ophthalmic Drugs Market Analysis
10.13 Spain Ophthalmic Drugs Market Analysis
10.14 Rest of Europe Ophthalmic Drugs Market Analysis
11 Asia Pacific Ophthalmic Drugs Market Analysis
11.1 Key Findings
11.2 Asia Pacific Ophthalmic Drugs Market Attractiveness Index
11.3 Asia Pacific Ophthalmic Drugs Market by Country, 2023, 2028 & 2033 (US$ bn)
11.4 Asia Pacific Ophthalmology drugs market Size Estimation and Forecast by Country
11.5 Asia-Pacific Ophthalmic Drugs Market Size Estimation and Forecast by Type
11.6 Asia-Pacific Ophthalmic Drugs Market Size Estimation and Forecast by Distribution Channel
11.7 Asia-Pacific Ophthalmic Drugs Market Size Estimation and Forecast by Indications
11.8 Asia-Pacific Ophthalmic Drugs Market Size Estimation and Forecast by Route of Administration
11.9 Japan Ophthalmic Drugs Market Analysis
11.10 China Ophthalmic Drugs Market Analysis
11.11 India Ophthalmic Drugs Market Analysis
11.12 Australia Ophthalmic Drugs Market Analysis
11.13 South Korea Ophthalmic Drugs Market Analysis
11.14 Rest of Asia Pacific Ophthalmic Drugs Market Analysis
12 Latin America Ophthalmic Drugs Market Analysis
12.1 Key Findings
12.2 Latin America Ophthalmic Drugs Market Attractiveness Index
12.3 Latin America Ophthalmic Drugs Market by Country, 2023, 2028 & 2033 (US$ bn)
12.4 Latin America Ophthalmic Drugs Market Size Estimation and Forecast by Country
12.5 Latin America Ophthalmic Drugs Market Size Estimation and Forecast by Type
12.6 Latin America Ophthalmic Drugs Market Size Estimation and Forecast by Distribution Channel
12.7 Latin America Ophthalmic Drugs Market Size Estimation and Forecast by Indications
12.8 Latin America Ophthalmic Drugs Market Size Estimation and Forecast by Route of Administration
12.9 Brazil Ophthalmic Drugs Market Analysis
12.10 Mexico Ophthalmic Drugs Market Analysis
12.11 Rest of Latin America Ophthalmic Drugs Market Analysis
13 MEA Ophthalmic Drugs Market Analysis
13.1 Key Findings
13.2 MEA Ophthalmic Drugs Market Attractiveness Index
13.3 MEA Ophthalmic Drugs Market by Country, 2023, 2028 & 2033 (US$ bn)
13.4 MEA Ophthalmic Drugs Market Size Estimation and Forecast by Country
13.5 MEA Ophthalmic Drugs Market Size Estimation and Forecast by Type
13.6 MEA Ophthalmic Drugs Market Size Estimation and Forecast by Distribution Channel
13.7 MEA Ophthalmic Drugs Market Size Estimation and Forecast by Indications
13.8 MEA Ophthalmic Drugs Market Size Estimation and Forecast by Route of Administration
13.9 GCC Ophthalmic Drugs Market Analysis
13.10 South Africa Ophthalmic Drugs Market Analysis
13.11 Rest of MEA Ophthalmic Drugs Market Analysis
14 Company Profiles
14.1 Competitive Landscape, 2021
14.2 Novartis AG
14.2.1 Company Snapshot
14.2.2 Company Overview
14.2.3 Financial Analysis
14.2.3.1 Revenue, 2017-2021
14.2.3.2 Regional Market Shares, 2021 (%)
14.2.4 Product Benchmarking
14.2.5 Strategic Outlook
14.3 Bayer AG
14.3.1 Company Snapshot
14.3.2 Company Overview
14.3.3 Financial Analysis
14.3.3.1 Revenue, 2017-2021
14.3.3.2 R&D, 2017-2021
14.3.3.3 Regional Market Shares, 2021 (%)
14.3.4 Product Benchmarking
14.3.5 Strategic Outlook
14.4 Pfizer Inc.
14.4.1 Company Snapshot
14.4.2 Company Overview
14.4.3 Financial Analysis
14.4.3.1 Revenue, 2017-2021
14.4.3.2 R&D, 2017-2021
14.4.3.3 Regional Market Shares, 2021 (%)
14.4.4 Product Benchmarking
14.5 Bausch & Lomb Incorporated
14.5.1 Company Snapshot
14.5.2 Company Overview
14.5.3 Financial Analysis
14.5.3.1 Revenue, 2017-2021
14.5.3.2 R&D, 2017-2021
14.5.3.3 Regional Market Shares, 2021 (%)
14.5.4 Product Benchmarking
14.5.5 Strategic Outlook
14.6 Santen Pharmaceutical Co., Ltd.
14.6.1 Company Snapshot
14.6.2 Company Overview
14.6.3 Financial Analysis
14.6.3.1 Revenue, 2017-2021
14.6.3.2 R&D, 2017-2021
14.6.3.3 Business Segments Market Shares, 2021 (%)
14.6.4 Product Benchmarking
14.6.5 Strategic Outlook
14.7 Johnson & Johnson Private Limited
14.7.1 Company Snapshot
14.7.2 Company Overview
14.7.3 Financial Analysis
14.7.3.1 Revenue, 2017-2021
14.7.3.2 R&D, 2017-2021
14.7.3.3 Regional Market Shares, 2021 (%)
14.7.4 Product Benchmarking
14.7.5 Strategic Outlook
14.8 Regeneron Pharmaceuticals Inc.
14.8.1 Company Snapshot
14.8.2 Company Overview
14.8.3 Financial Analysis
14.8.3.1 Revenue, 2017-2021
14.8.3.2 R&D, 2017-2021
14.8.4 Product Benchmarking
14.9 AbbVie Inc.
14.9.1 Company Snapshot
14.9.2 Company Overview
14.9.3 Financial Analysis
14.9.3.1 Revenue, 2017-2021
14.9.3.2 R&D, 2017-2021
14.9.3.3 Regional Market Shares, 2021 (%)
14.9.4 Product Benchmarking
14.9.5 Strategic Outlook
14.10 F. Hoffmann-La Roche Ltd
14.10.1 Company Snapshot
14.10.2 Company Overview
14.10.3 Financial Analysis
14.10.3.1 Revenue, 2017-2021
14.10.3.2 R&D, 2017-2021
14.10.3.3 Regional Market Shares, 2021 (%)
14.10.4 Product Benchmarking
14.10.5 Strategic Outlook
14.11 Teva Pharmaceutical Industries Ltd.
14.11.1 Company Snapshot
14.11.2 Company Overview
14.11.3 Financial Analysis
14.11.3.1 Revenue, 2017-2021
14.11.3.2 R&D Expenses, 2017-2021
14.11.3.3 Regional Market Shares, 2021 (%)
14.11.4 Product Benchmarking
14.11.5 Strategic Outlook
15 Conclusion and Recommendations
15.1 Concluding Remarks from Visiongain
15.2 Recommendations for Market Players
List of Tables
Table 1 Ophthalmic Drugs Market Snapshot, 2023 & 2033 (US$ billion, CAGR %)
Table 2 Ophthalmic Drugs Market, Product Pipeline
Table 3 Ophthalmic Drugs Market by Region, 2023-2033 (US$ bn, AGR (%), CAGR(%)): “V” Shaped Recovery Scenario
Table 4 Ophthalmic Drugs Market Forecast by Region 2023-2033 (US$ bn, AGR%): "U" Shaped Recovery
Table 5 Ophthalmic Drugs Market Forecast by Region 2023-2033 (US$ Mn, AGR%): "W" Shaped Recovery
Table 6 Ophthalmic Drugs Market Forecast by Region 2023-2033 (US$ Mn, AGR%): "L" Shaped Recovery
Table 7 Ophthalmic Drugs Market Forecast by Type, 2023-2033 (US$ bn, AGR%, CAGR%)
Table 8 Prescription Drugs Market Forecast by Region, 2023-2033 (US$ bn, AGR%, CAGR%)
Table 9 OTC Drugs Market Forecast by Region, 2023-2033 (US$ bn, AGR%, CAGR%)
Table 10 Ophthalmic Drugs Market Forecast by Distribution Channel, 2023-2033 (US$ bn, AGR%, CAGR%)
Table 11 Hospital Pharmacies Market Forecast by Region, 2023-2033 (US$ bn, AGR%, CAGR%)
Table 12 Drug Stores Market Forecast by Region, 2023-2033 (US$ bn, AGR%, CAGR%)
Table 13 Online Pharmacies Market Forecast by Region, 2023-2033 (US$ bn, AGR%, CAGR%)
Table 14 Ophthalmic Drugs Market Forecast by Indications, 2023-2033 (US$ bn, AGR%, CAGR%)
Table 15 Retinal Disorders Market Forecast by Region, 2023-2033 (US$ bn, AGR%, CAGR%)
Table 16 Global Retinal Disorders in Ophthalmic Drugs Market Forecast by Brands, 2023-2033 (US$ bn, AGR%, CAGR%)
Table 17 Infection/Inflammation/Allergy Market Forecast by Region, 2023-2033 (US$ bn, AGR%, CAGR%)
Table 18 Global Infection/Inflammation/Allergy in Ophthalmic Drugs Market Forecast by Brands, 2023-2033 (US$ bn, AGR%, CAGR%)
Table 19 Dry Eye Market Forecast by Region, 2023-2033 (US$ bn, AGR%, CAGR%)
Table 20 Global Dry Eye in Ophthalmic Drugs Market Forecast by Brands, 2023-2033 (US$ bn, AGR%, CAGR%)
Table 21 Glaucoma Market Forecast by Region, 2023-2033 (US$ bn, AGR%, CAGR%)
Table 22 Global Glaucoma in Ophthalmic Drugs Market Forecast by Brands, 2023-2033 (US$ bn, AGR%, CAGR%)
Table 23 Ophthalmic Drugs Market Forecast by Route of Administration, 2023-2033 (US$ bn, AGR%, CAGR%)
Table 24 Topical Market Forecast by Region, 2023-2033 (US$ bn, AGR%, CAGR%)
Table 25 Parenteral Market Forecast by Region, 2023-2033 (US$ bn, AGR%, CAGR%)
Table 26 Ophthalmic Drugs Market Forecast by Region, 2023-2033 (US$ bn, AGR%, CAGR%)
Table 27 Ophthalmic Drugs Market by Region, 2023-2033 (US$ bn, AGR (%), CAGR(%)):
“V” Shaped Recovery Scenario
Table 28 Ophthalmic Drugs Market Forecast by Region 2023-2033 (US$ bn, AGR%): "U" Shaped Recovery
Table 29 Ophthalmic Drugs Market Forecast by Region 2023-2033 (US$ Mn, AGR%): "W" Shaped Recovery
Table 30 Ophthalmic Drugs Market Forecast by Region 2023-20323(US$ Mn, AGR%): "L" Shaped Recovery
Table 31 North America Ophthalmic Drugs Market Forecast by Country, 2023-2033 (US$ bn, AGR%, CAGR%)
Table 32 North America Ophthalmic Drugs Market Forecast by Type, 2023-2033 (US$ bn, AGR%, CAGR%)
Table 33 North America Ophthalmic Drugs Market Forecast by Distribution Channel, 2023-2033 (US$ bn, AGR%, CAGR%)
Table 34
Table 35 North America Ophthalmic Drugs Market Forecast by Indications, 2023-2033 (US$ bn, AGR%, CAGR%)
Table 36 North America Ophthalmic Drugs Market Forecast by Route of Administration, 2023-2033 (US$ bn, AGR%, CAGR%)
Table 37 U.S. Ophthalmic Drugs Market Forecast, 2023-2033 (US$ bn, AGR%, CAGR%)
Table 38 Canada Ophthalmic Drugs Market Forecast, 2023-2033 (US$ bn, AGR%, CAGR%)
Table 39 Europe Ophthalmic Drugs Market Forecast by Country, 2023-2033 (US$ bn, AGR%, CAGR%)
Table 40 Europe Ophthalmic Drugs Market Forecast by Type, 2023-2033 (US$ bn, AGR%, CAGR%)
Table 41 Europe Ophthalmic Drugs Market Forecast by Distribution Channel, 2023-2033 (US$ bn, AGR%, CAGR%)
Table 42 Europe Ophthalmic Drugs Market Forecast by Indications, 2023-2033 (US$ bn, AGR%, CAGR%)
Table 43 Europe Ophthalmic Drugs Market Forecast by Route of Administration, 2023-2033 (US$ bn, AGR%, CAGR%)
Table 44 Germany Ophthalmic Drugs Market Forecast, 2023-2033 (US$ bn, AGR%, CAGR%)
Table 45 France Ophthalmic Drugs Market Forecast, 2023-2033 (US$ bn, AGR%, CAGR%)
Table 46 U.K. Ophthalmic Drugs Market Forecast, 2023-2033 (US$ bn, AGR%, CAGR%)
Table 47 Italy Ophthalmic Drugs Market Forecast, 2023-2033 (US$ bn, AGR%, CAGR%)
Table 48 Spain Ophthalmic Drugs Market Forecast, 2023-2033 (US$ bn, AGR%, CAGR%)
Table 49 Rest of Europe Ophthalmic Drugs Market Forecast, 2023-2033 (US$ bn, AGR%, CAGR%)
Table 50 Asia-Pacific Ophthalmic Drugs Market Forecast by Country, 2023-2033 (US$ bn, AGR%, CAGR%)
Table 51 Asia-Pacific Ophthalmic Drugs Market Forecast by Type, 2023-2033 (US$ bn, AGR%, CAGR%)
Table 52 Asia-Pacific Ophthalmic Drugs Market Forecast by Distribution Channel, 2023-2033 (US$ bn, AGR%, CAGR%)
Table 53 Asia-Pacific Ophthalmic Drugs Market Forecast by Indications, 2023-2033 (US$ bn, AGR%, CAGR%)
Table 54 Asia-Pacific Ophthalmic Drugs Market Forecast by Route of Administration, 2023-2033 (US$ bn, AGR%, CAGR%)
Table 55 Japan Ophthalmic Drugs Market Forecast, 2023-2033 (US$ bn, AGR%, CAGR%)
Table 56 China Ophthalmic Drugs Market Forecast, 2023-2033 (US$ bn, AGR%, CAGR%)
Table 57 India Ophthalmic Drugs Market Forecast, 2023-2033 (US$ bn, AGR%, CAGR%)
Table 58 Australia Ophthalmic Drugs Market Forecast, 2023-2033 (US$ bn, AGR%, CAGR%)
Table 59 South Korea Ophthalmic Drugs Market Forecast, 2023-2033 (US$ bn, AGR%, CAGR%)
Table 60 Asia-Pacific Ophthalmic Drugs Market Forecast, 2023-2033 (US$ bn, AGR%, CAGR%)
Table 61 Latin America Ophthalmic Drugs Market Forecast by Country, 2023-2033 (US$ bn, AGR%, CAGR%)
Table 62 Latin America Ophthalmic Drugs Market Forecast by Type, 2023-2033 (US$ bn, AGR%, CAGR%)
Table 63 Latin America Ophthalmic Drugs Market Forecast by Distribution Channel, 2023-2033 (US$ bn, AGR%, CAGR%)
Table 64 Latin America Ophthalmic Drugs Market Forecast by Indications, 2023-2033 (US$ bn, AGR%, CAGR%)
Table 65 Latin America Ophthalmic Drugs Market Forecast by Route of Administration, 2023-2033 (US$ bn, AGR%, CAGR%)
Table 66 Brazil Ophthalmic Drugs Market Forecast, 2023-2033 (US$ bn, AGR%, CAGR%)
Table 67 Mexico Ophthalmic Drugs Market Forecast, 2023-2033 (US$ bn, AGR%, CAGR%)
Table 68 Rest of Latin America Ophthalmic Drugs Market Forecast, 2023-2033 (US$ bn, AGR%, CAGR%)
Table 69 MEA Ophthalmic Drugs Market Forecast by Country, 2023-2033 (US$ bn, AGR%, CAGR%)
Table 70 MEA Ophthalmic Drugs Market Forecast by Type, 2023-2033 (US$ bn, AGR%, CAGR%)
Table 71 MEA Ophthalmic Drugs Market Forecast by Distribution Channel, 2023-2033 (US$ bn, AGR%, CAGR%)
Table 72 MEA Ophthalmic Drugs Market Forecast by Indications, 2023-2033 (US$ bn, AGR%, CAGR%)
Table 73 MEA Ophthalmic Drugs Market Forecast by Route of Administration, 2023-2033 (US$ bn, AGR%, CAGR%)
Table 74 GCC Ophthalmic Drugs Market Forecast, 2023-2033 (US$ bn, AGR%, CAGR%)
Table 75 South Africa Ophthalmic Drugs Market Forecast, 2023-2033 (US$ bn, AGR%, CAGR%)
Table 76 Rest of MEA Ophthalmic Drugs Market Forecast, 2023-2033 (US$ bn, AGR%, CAGR%)
Table 77 Novartis AG: Key Details, (CEO, HQ, Revenue, Founded, No. of Employees, Company Type, Website, Business Segment)
Table 78 Novartis AG: Product Benchmarking
Table 79 Novartis AG: Strategic Outlook
Table 80 Bayer AG: Key Details, (CEO, HQ, Revenue, Founded, No. of Employees, Company Type, Website, Business Segment)
Table 81 Bayer AG: Product Benchmarking
Table 82 Bayer AG: Strategic Outlook
Table 83 Pfizer Inc.: Key Details, (CEO, HQ, Revenue, Founded, No. of Employees, Company Type, Website, Business Segment)
Table 84 Pfizer Inc.: Product Benchmarking
Table 85 Bausch & Lomb Incorporated : Key Details, (CEO, HQ, Revenue, Founded, No. of Employees, Company Type, Website, Business Segment)
Table 86 Bausch & Lomb Incorporated : Product Benchmarking
Table 87 Bausch & Lomb Incorporated : Strategic Outlook
Table 88 Santen Pharmaceutical Co., Ltd.: Key Details, (CEO, HQ, Revenue, Founded, No. of Employees, Company Type, Website, Business Segment)
Table 89 Santen Pharmaceutical Co., Ltd.: Product Benchmarking
Table 90 Santen Pharmaceutical Co., Ltd.: Strategic Outlook
Table 91 Johnson & Johnson Private Limited: Key Details, (CEO, HQ, Revenue, Founded, No. of Employees, Company Type, Website, Business Segment)
Table 92 Johnson & Johnson Private Limited: Product Benchmarking
Table 93 Johnson & Johnson Private Limited: Strategic Outlook
Table 94 Regeneron Pharmaceuticals Inc.: Key Details, (CEO, HQ, Revenue, Founded, No. of Employees, Company Type, Website, Business Segment)
Table 95 Regeneron Pharmaceuticals Inc.: Product Benchmarking
Table 96 AbbVie Inc.: Key Details, (CEO, HQ, Revenue, Founded, No. of Employees, Company Type, Website, Business Segment)
Table 97 AbbVie Inc.: Product Benchmarking
Table 98 AbbVie Inc.: Strategic Outlook
Table 99 F. Hoffmann-La Roche Ltd: Key Details, (CEO, HQ, Revenue, Founded, No. of Employees, Company Type, Website, Business Segment)
Table 100 F. Hoffmann-La Roche Ltd: Product Benchmarking
Table 101 F. Hoffmann-La Roche Ltd: Strategic Outlook
Table 102 Teva Pharmaceutical Industries Ltd.: Key Details, (CEO, HQ, Revenue, Founded, No. of Employees, Company Type, Website, Business Segment)
Table 103 Teva Pharmaceutical Industries Ltd.: Product Benchmarking
Table 104 Teva Pharmaceutical Industries Ltd.: Strategic Outlook
List of Figures
Figure 1 Ophthalmic Drugs Market Segmentation
Figure 2 Ophthalmic Drugs Market by Type: Market Attractiveness Index
Figure 3 Ophthalmic Drugs Market Forecast by Distribution Channel: Market Attractiveness Index
Figure 4 Ophthalmic Drugs Market Forecast by Indications: Market Attractiveness Index
Figure 5 Ophthalmic Drugs Market Forecast by Route of Administration: Market Attractiveness Index
Figure 6 Ophthalmic Drugs Market Attractiveness Index by Region
Figure 7 Ophthalmic Drugs Market: Market Dynamics
Figure 8 Global COVID Impact Analysis: Ophthalmic Drugs Market Recovery Scenarios
Figure 9 Ophthalmology drugs market by Region, 2023-2033 (US$ bn, AGR %): “V” Shaped Recovery
Figure 10 Ophthalmology drugs market by Region, 2023-2033 (US$ bn, AGR (%), CAGR (%)): “U” Shaped Recovery
Figure 11 Ophthalmology drugs market by Region, 2023-2033 (US$ bn, AGR (%), CAGR (%)): “W” Shaped Recovery
Figure 12 Ophthalmology drugs market by Region, 2023-2033 (US$ bn, AGR (%), CAGR (%)): “L” Shaped Recovery
Figure 13 Ophthalmic Drugs Market: Porter’s Five Forces Analysis
Figure 14 Ophthalmic Drugs Market: PEST Analysis
Figure 15 Ophthalmic Drugs Market Forecast by Type: Market Attractiveness Index
Figure 16 Ophthalmic Drugs Market Forecast By Type, 2023-2033 (US$ billion)
Figure 17 Ophthalmic Drugs Market Share Forecast by Type, 2023, 2028, 2033 (%)
Figure 18 Prescription Drugs Market Forecast by Region, 2023-2033 (US$ billion)
Figure 19 Prescription Drugs Market Share Forecast by Region, 2023 & 2033 (%)
Figure 20 OTC Market Forecast by Region, 2023-2033 (US$ billion)
Figure 21 OTC Market Share Forecast by Region, 2023 & 2033 (%)
Figure 22 Ophthalmic Drugs Market Forecast by Distribution Channel: Market Attractiveness Index
Figure 23 Ophthalmic Drugs Market Forecast By Distribution Channel, 2023-2033 (US$ billion)
Figure 24 Ophthalmic Drugs Market Share Forecast by Distribution Channel, 2023, 2028, 2033 (%)
Figure 25 Hospital Pharmacies Market Forecast by Region, 2023-2033 (US$ billion)
Figure 26 Hospital Pharmacies Market Share Forecast by Region, 2023 & 2033 (%)
Figure 27 Drug Stores Market Forecast by Region, 2023-2033 (US$ billion)
Figure 28 Drug Stores Market Share Forecast by Region, 2023 & 2033 (%)
Figure 29 Online Pharmacies Market Forecast by Region, 2023-2033 (US$ billion)
Figure 30 Online Pharmacies Market Share Forecast by Region, 2023 & 2033 (%)
Figure 31 Ophthalmic Drugs Market Forecast by Indications: Market Attractiveness Index
Figure 32 Ophthalmic Drugs Market Forecast By Indications, 2023-2033 (US$ billion)
Figure 33 Ophthalmic Drugs Market Share Forecast by Indications, 2023, 2028, 2033 (%)
Figure 34 Retinal Disorders Market Forecast by Region, 2023-2033 (US$ billion)
Figure 35 Retinal Disorders Market Share Forecast by Region, 2023 & 2033 (%)
Figure 36 Retinal Disorders Market Forecast by Brands, 2023-2033 (US$ billion)
Figure 37 Infection/Inflammation/Allergy Market Forecast by Region, 2023-2033 (US$ billion)
Figure 38 Infection/Inflammation/Allergy Market Share Forecast by Region, 2023 & 2033 (%)
Figure 39 Infection/Inflammation/Allergy Market Forecast by Brands, 2023-2033 (US$ billion)
Figure 40 Dry Eye Market Forecast by Region, 2023-2033 (US$ billion)
Figure 41 Dry Eye Market Share Forecast by Region, 2023 & 2033 (%)
Figure 42 Dry Eye Market Forecast by Brands, 2023-2033 (US$ billion)
Figure 43 Glaucoma Market Forecast by Region, 2023-2033 (US$ billion)
Figure 44 Glaucoma Market Share Forecast by Region, 2023 & 2033 (%)
Figure 45 Glaucoma Market Forecast by Brands, 2023-2033 (US$ billion)
Figure 46 Ophthalmic Drugs Market Forecast by Route of Administration: Market Attractiveness Index
Figure 47 Ophthalmic Drugs Market Forecast By Route of Administration, 2023-2033 (US$ billion)
Figure 48 Ophthalmic Drugs Market Share Forecast by Route of Administration, 2023, 2028, 2033 (%)
Figure 49 Topical Market Forecast by Region, 2023-2033 (US$ billion)
Figure 50 Topical Market Share Forecast by Region, 2023 & 2033 (%)
Figure 51 Parenteral Market Forecast by Region, 2023-2033 (US$ billion)
Figure 52 Parenteral Market Share Forecast by Region, 2023 & 2033 (%)
Figure 53 Ophthalmic Drugs Market Forecast by Region 2023, 2028, 2033 (Revenue, CAGR%)
Figure 54 Ophthalmic Drugs Market Share Forecast by Region 2023, 2028, 2033(%)
Figure 55 Ophthalmic Drugs Market by Region, 2023-2033 (US$ bn)
Figure 56 Ophthalmic Drugs Market by Region, 2023-2033 (US$ bn, AGR %): “V” Shaped Recovery
Figure 57 Ophthalmic Drugs Market by Region, 2023-2033 (US$ bn, AGR (%): “U” Shaped Recovery
Figure 58 Ophthalmic Drugs Market by Region, 2023-2033 (US$ bn, AGR (%), CAGR (%)): “W” Shaped Recovery
Figure 59 Ophthalmic Drugs Market by Region, 2023-2033 (US$ bn, AGR (%), CAGR (%)): “L” Shaped Recovery
Figure 60 North America Ophthalmic Drugs Market Attractiveness Index
Figure 61 North America Ophthalmic Drugs Market by Region, 2023, 2028 & 2033 (US$ billion)
Figure 62 North America Ophthalmic Drugs Market Forecast by Country, 2023-2033 (US$ billion)
Figure 63 North America Ophthalmic Drugs Market Share Forecast by Country, 2023 & 2033 (%)
Figure 64 North America Ophthalmic Drugs Market Forecast by Type, 2023-2033 (US$ billion)
Figure 65 North America Ophthalmic Drugs Market Share Forecast by Type, 2023 & 2033 (%)
Figure 66 North America Ophthalmic Drugs Market Forecast by Distribution Channel, 2023-2033 (US$ billion)
Figure 67 North America Ophthalmic Drugs Market Share Forecast by Distribution Channel, 2023 & 2033 (%)
Figure 68 North America Ophthalmic Drugs Market Forecast by Indications, 2023-2033 (US$ billion)
Figure 69 North America Ophthalmic Drugs Market Share Forecast by Indications, 2023 & 2033 (%)
Figure 70 North America Ophthalmic Drugs Market Forecast by Route of Administration, 2023-2033 (US$ billion)
Figure 71 North America Ophthalmic Drugs Market Share Forecast by Route of Administration, 2023 & 2033 (%)
Figure 72 U.S. Ophthalmic Drugs Market Forecast, 2023-2033 (US$ billion, AGR %)
Figure 73 Canada Ophthalmic Drugs Market Forecast, 2023-2033 (US$ billion, AGR %)
Figure 74 Europe Ophthalmic Drugs Market Attractiveness Index
Figure 75 Europe Ophthalmic Drugs Market by Region, 2023, 2028 & 2033 (US$ billion)
Figure 76 Europe Ophthalmic Drugs Market Forecast by Country, 2023-2033 (US$ billion)
Figure 77 Europe Ophthalmic Drugs Market Share Forecast by Country, 2023 & 2033 (%)
Figure 78 Europe Ophthalmic Drugs Market Forecast by Type, 2023-2033 (US$ billion)
Figure 79 Europe Ophthalmic Drugs Market Share Forecast by Type, 2023 & 2033 (%)
Figure 80 Europe Ophthalmic Drugs Market Forecast by Distribution Channel, 2023-2033 (US$ billion)
Figure 81 Europe Ophthalmic Drugs Market Share Forecast by Distribution Channel, 2023 & 2033 (%)
Figure 82 Europe Ophthalmic Drugs Market Forecast by Indications, 2023-2033 (US$ billion)
Figure 83 Europe Ophthalmic Drugs Market Share Forecast by Indications, 2023 & 2033 (%)
Figure 84 Europe Ophthalmic Drugs Market Forecast by Route of Administration, 2023-2033 (US$ billion)
Figure 85 Europe Ophthalmic Drugs Market Share Forecast by Route of Administration, 2023 & 2033 (%)
Figure 86 Germany Ophthalmic Drugs Market Forecast, 2023-2033 (US$ billion, AGR %)
Figure 87 France Ophthalmic Drugs Market Forecast, 2023-2033 (US$ billion, AGR %)
Figure 88 U.K. Ophthalmic Drugs Market Forecast, 2023-2033 (US$ billion, AGR %)
Figure 89 Italy Ophthalmic Drugs Market Forecast, 2023-2033 (US$ billion, AGR %)
Figure 90 Spain Ophthalmic Drugs Market Forecast, 2023-2033 (US$ billion, AGR %)
Figure 91 Rest of Europe Ophthalmic Drugs Market Forecast, 2023-2033 (US$ billion, AGR %)
Figure 92 Asia Pacific Ophthalmic Drugs Market Attractiveness Index
Figure 93 Asia Pacific Ophthalmic Drugs Market by Region, 2023, 2028 & 2033 (US$ billion)
Figure 94 Asia Pacific Ophthalmic Drugs Market Forecast by Country, 2023-2033 (US$ billion)
Figure 95 Asia Pacific Ophthalmic Drugs Market Share Forecast by Country, 2023 & 2033 (%)
Figure 96 Asia-Pacific Ophthalmic Drugs Market Forecast by Type, 2023-2033 (US$ billion)
Figure 97 Asia-Pacific Ophthalmic Drugs Market Share Forecast by Type, 2023 & 2033 (%)
Figure 98 Asia-Pacific Ophthalmic Drugs Market Forecast by Distribution Channel, 2023-2033 (US$ billion)
Figure 99 Asia-Pacific Ophthalmic Drugs Market Share Forecast by Distribution Channel, 2023 & 2033 (%)
Figure 100 Asia-Pacific Ophthalmic Drugs Market Forecast by Indications, 2023-2033 (US$ billion)
Figure 101 Asia-Pacific Ophthalmic Drugs Market Share Forecast by Indications, 2023 & 2033 (%)
Figure 102 Asia-Pacific Ophthalmic Drugs Market Forecast by Route of Administration, 2023-2033 (US$ billion)
Figure 103 Asia-Pacific Ophthalmic Drugs Market Share Forecast by Route of Administration, 2023 & 2033 (%)
Figure 104 Japan Ophthalmic Drugs Market Forecast, 2023-2033 (US$ billion, AGR %)
Figure 105 China Ophthalmic Drugs Market Forecast, 2023-2033 (US$ billion, AGR %)
Figure 106 India Ophthalmic Drugs Market Forecast, 2023-2033 (US$ billion, AGR %)
Figure 107 Australia Ophthalmic Drugs Market Forecast, 2023-2033 (US$ billion, AGR %)
Figure 108 South Korea Ophthalmic Drugs Market Forecast, 2023-2033 (US$ billion, AGR %)
Figure 109 Rest of Asia Pacific Ophthalmic Drugs Market Forecast, 2023-2033 (US$ billion, AGR %)
Figure 110 Latin America Ophthalmic Drugs Market Attractiveness Index
Figure 111 Latin America Ophthalmic Drugs Market by Region, 2023, 2028 & 2033 (US$ billion)
Figure 112 Latin America Ophthalmic Drugs Market Forecast by Country, 2023-2033 (US$ billion)
Figure 113 Latin America Ophthalmic Drugs Market Share Forecast by Country, 2023 & 2033 (%)
Figure 114 Latin America Ophthalmic Drugs Market Forecast by Type, 2023-2033 (US$ billion)
Figure 115 Latin America Ophthalmic Drugs Market Share Forecast by Type, 2023 & 2033 (%)
Figure 116 Latin America Ophthalmic Drugs Market Forecast by Distribution Channel, 2023-2033 (US$ billion)
Figure 117 Latin America Ophthalmic Drugs Market Share Forecast by Distribution Channel, 2023 & 2033 (%)
Figure 118 Latin America Ophthalmic Drugs Market Forecast by Indications, 2023-2033 (US$ billion)
Figure 119 Latin America Ophthalmic Drugs Market Share Forecast by Indications, 2023 & 2033 (%)
Figure 120 Latin America Ophthalmic Drugs Market Forecast by Route of Administration, 2023-2033 (US$ billion)
Figure 121 Latin America Ophthalmic Drugs Market Share Forecast by Route of Administration, 2023 & 2033 (%)
Figure 122 Brazil Ophthalmic Drugs Market Forecast, 2023-2033 (US$ billion, AGR %)
Figure 123 Mexico Ophthalmic Drugs Market Forecast, 2023-2033 (US$ billion, AGR %)
Figure 124 Rest of Latin America Ophthalmic Drugs Market Forecast, 2023-2033 (US$ billion, AGR %)
Figure 125 MEA Ophthalmic Drugs Market Attractiveness Index
Figure 126 MEA Ophthalmic Drugs Market by Region, 2023, 2028 & 2033 (US$ billion)
Figure 127 MEA Ophthalmic Drugs Market Forecast by Country, 2023-2033 (US$ billion)
Figure 128 MEA Ophthalmic Drugs Market Share Forecast by Country, 2023 & 2033 (%)
Figure 129 MEA Ophthalmic Drugs Market Forecast by Type, 2023-2033 (US$ billion)
Figure 130 MEA Ophthalmic Drugs Market Share Forecast by Type, 2023 & 2033 (%)
Figure 131 MEA Ophthalmic Drugs Market Forecast by Distribution Channel, 2023-2033 (US$ billion)
Figure 132 MEA Ophthalmic Drugs Market Share Forecast by Distribution Channel, 2023 & 2033 (%)
Figure 133 MEA Ophthalmic Drugs Market Forecast by Indications, 2023-2033 (US$ billion)
Figure 134 MEA Ophthalmic Drugs Market Share Forecast by Indications, 2023 & 2033 (%)
Figure 135 MEA Ophthalmic Drugs Market Forecast by Route of Administration, 2023-2033 (US$ billion)
Figure 136 MEA Ophthalmic Drugs Market Share Forecast by Route of Administration, 2023 & 2033 (%)
Figure 137 GCC Ophthalmic Drugs Market Forecast, 2023-2033 (US$ billion, AGR %)
Figure 138 South Africa Ophthalmic Drugs Market Forecast, 2023-2033 (US$ billion, AGR %)
Figure 139 Rest of MEA Ophthalmic Drugs Market Forecast, 2023-2033 (US$ billion, AGR %)
Figure 140 Ophthalmic Drugs Market: Company Share/Ranking, 2021
Figure 141 Novartis AG: Revenue, 2017-2021 (US$ million, AGR%)
Figure 142 Novartis AG: Regional Market Shares, 2021 (%)
Figure 143 Bayer AG: Net Sales, 2017-2021 (US$ million, AGR%)
Figure 144 Bayer AG: R&D Expenses, 2017-2021 (US$ million, AGR%)
Figure 145 Bayer AG: Regional Market Shares, 2021 (%)
Figure 146 Pfizer Inc.: Revenue, 2017-2021 (US$ million, AGR%)
Figure 147 Pfizer Inc.: Net Income, 2017-2021 (US$ million, AGR%)
Figure 148 Pfizer Inc.: Regional Market Shares, 2021 (%)
Figure 149 Bausch & Lomb Incorporated : Net Sales, 2017-2021 (US$ million, AGR%)
Figure 150 Bausch & Lomb Incorporated : R&D Expenses, 2017-2021 (US$ million, AGR%)
Figure 151 Bausch & Lomb Incorporated : Regional Market Shares, 2021 (%)
Figure 152 Santen Pharmaceutical Co., Ltd.: Revenue, 2017-2021 (US$ million, AGR%)
Figure 153 Santen Pharmaceutical Co., Ltd.: Net Income, 2017-2021 (US$ million, AGR%)
Figure 154 Santen Pharmaceutical Co., Ltd.: Business Segment Shares, 2021 (%)
Figure 155 Johnson & Johnson Private Limited: Revenue, 2017-2021 (US$ million, AGR%)
Figure 156 Johnson & Johnson Private Limited: R&D, 2017-2021 (US$ million, AGR%)
Figure 157 Johnson & Johnson Private Limited: Regional Market Shares, 2021 (%)
Figure 158 Regeneron Pharmaceuticals Inc.: Revenue, 2017-2021 (US$ million, AGR%)
Figure 159 Regeneron Pharmaceuticals Inc.: R&D, 2017-2021 (US$ million, AGR%)
Figure 160 AbbVie Inc.: Revenue, 2017-2021 (US$ million, AGR%)
Figure 161 AbbVie Inc.: R&D, 2017-2021 (US$ million, AGR%)
Figure 162 AbbVie Inc.: Regional Market Shares, 2021 (%)
Figure 163 F. Hoffmann-La Roche Ltd: Revenue, 2017-2021 (US$ million, AGR%)
Figure 164 F. Hoffmann-La Roche Ltd: R&D Expenses, 2017-2021 (US$ million, AGR%)
Figure 165 F. Hoffmann-La Roche Ltd: Regional Market Shares, 2021 (%)
Figure 166 Teva Pharmaceutical Industries Ltd.: Revenue, 2017-2021 (US$ million, AGR%)
Figure 167 Teva Pharmaceutical Industries Ltd.: R&D, 2017-2021 (US$ million, AGR%)
Figure 168 Teva Pharmaceutical Industries Ltd.: Regional Market Shares, 2021 (%)
ページTOPに戻る
本レポートと同分野(調剤薬)の最新刊レポート
- Enteral Feeding Formulas Market by Product (Polymeric, Elemental, Disease-specific), Stage (Adults, Pediatrics), Application (Oncology, Gastroenterology, Neurology, Hypermetabolism), End User (Hospitals, LTCF, Home care) - Global Forecast to 2027
- 再生医療の世界市場 2022-2026
- 世界の産業用医薬品市場の現状、動向、COVID-19影響レポート2021年版
Visiongain社の医薬・化学品分野での最新刊レポート
本レポートと同じKEY WORD(drug)の最新刊レポート
- 本レポートと同じKEY WORDの最新刊レポートはありません。
よくあるご質問
Visiongain社はどのような調査会社ですか?
英国の調査会社ヴィジョンゲイン社(Visiongain)は、通信とエネルギーのほか、自動車や化学・医薬品、金属など、広範な市場を対象に調査を行っています。自動車市場については、市場全般に関する調査のほ... もっと見る
調査レポートの納品までの日数はどの程度ですか?
在庫のあるものは速納となりますが、平均的には 3-4日と見て下さい。
但し、一部の調査レポートでは、発注を受けた段階で内容更新をして納品をする場合もあります。
発注をする前のお問合せをお願いします。
注文の手続きはどのようになっていますか?
1)お客様からの御問い合わせをいただきます。
2)見積書やサンプルの提示をいたします。
3)お客様指定、もしくは弊社の発注書をメール添付にて発送してください。
4)データリソース社からレポート発行元の調査会社へ納品手配します。
5) 調査会社からお客様へ納品されます。最近は、pdfにてのメール納品が大半です。
お支払方法の方法はどのようになっていますか?
納品と同時にデータリソース社よりお客様へ請求書(必要に応じて納品書も)を発送いたします。
お客様よりデータリソース社へ(通常は円払い)の御振り込みをお願いします。
請求書は、納品日の日付で発行しますので、翌月最終営業日までの当社指定口座への振込みをお願いします。振込み手数料は御社負担にてお願いします。
お客様の御支払い条件が60日以上の場合は御相談ください。
尚、初めてのお取引先や個人の場合、前払いをお願いすることもあります。ご了承のほど、お願いします。
データリソース社はどのような会社ですか?
当社は、世界各国の主要調査会社・レポート出版社と提携し、世界各国の市場調査レポートや技術動向レポートなどを日本国内の企業・公官庁及び教育研究機関に提供しております。
世界各国の「市場・技術・法規制などの」実情を調査・収集される時には、データリソース社にご相談ください。
お客様の御要望にあったデータや情報を抽出する為のレポート紹介や調査のアドバイスも致します。
|
|

