ゲノム編集技術市場レポート:2022-2032
Genome Editing Technologies Market Report 2022-2032
レポート詳細
ゲノム編集技術市場レポート 2022-2032 :本レポートは、新たな収益の柱を目指すリーディングカンパニーが、業界とその背景にあるダイナミクスをより深く理解する上で、非常に有益なもの... もっと見る
※上記価格は部署ライセンス(Departmental licence)価格です。
その他の価格についてはデータリソースまでお問合せください。
日本語のページは自動翻訳を利用し作成しています。
実際のレポートは英文のみでご納品いたします。

|

|
サマリー
レポート詳細
ゲノム編集技術市場レポート 2022-2032:本レポートは、新たな収益の柱を目指すリーディングカンパニーが、業界とその背景にあるダイナミクスをより深く理解する上で、非常に有益なものとなるはずです。また、異業種への進出や新地域での既存事業の拡大を目指す企業にとっても有用なレポートです。
慢性疾患や感染症の増加が、ゲノム編集技術市場の主な促進要因
がんは、年齢や性別を問わず数百万人が罹患し、生活の質に大きな影響を及ぼす世界的な健康問題の一つです。がん罹患率は、2020年には2000万人の新規患者が発生し、2040年には年間3000万人に達すると予測されています。ゲノム編集技術は、シンプルな設計、迅速な操作、低コスト、堅牢な拡張性などの利点を持ち、がんの基礎研究および診断に新たな機会を提供します。CRISPR/Casは急速に進化している編集技術であり、ほとんどすべてのゲノムターゲットに適用されている。zinc finger endonuclease (ZFN), transcription activator-like effector nuclease (TALEN), clustered regularly interspaced short palindromic repeats/CRISPR associated nuclease (CRISPR/Cas) systemなどのいくつかのゲノム編集技術が開発されており、がん、感染症、遺伝病の治療において効率的に遺伝子編集を行うことができるようになりました。さらに、CRISPR遺伝子編集は、感染症研究の分野でも重要な技術となってきています。
CRISPRは、ウイルス、細菌、真菌など幅広い感染症への治療の可能性を持っています。CRISPRは、ウイルス性疾患の研究や新しい治療法の創出に幅広く応用されており、RNAを標的とするCasヌクレアーゼの発見により、SARS-CoV-2ワクチンなど、RNAウイルスを標的とする新しい道が切り開かれた。
遺伝子治療の個別化には、ゲノム編集技術の大きな壁が立ちはだかっている
パーソナライゼーションは、質的にも量的にも(例えば、各患者から採取される細胞の数など)予測不可能性をプロセスに導入するため、自己組織化治療の最も大きな障壁となる。このため、治療法の拡張が難しく、患者から採取する細胞の種類や数の多様性に対応できる柔軟な細胞培養プラットフォームの開発が必要になる。つまり、スケールアップ方式ではなく、スケールアウト方式で複数のプラットフォームを並行して稼働させなければならないのである。このようなニーズに応えるため、一部の開発・製造受託機関(CDMO)はすでにこの市場に参入している。
マーケットリサーチレポートを購入する前に、どのような質問をすべきでしょうか?
- ゲノム編集技術市場はどのように進化しているのか?
- ゲノム編集技術市場の推進要因と抑制要因は何か?
- ゲノム編集技術の各サブマーケットセグメントは予測期間中にどのように成長し、2032年にこれらのサブマーケットが占める収益はどの程度になるのか?
- 2022年から2032年にかけて、各ゲノム編集技術サブマーケットの市場シェアはどのように推移するのか?
- 2022年から2032年にかけて、市場全体の主なドライバーは何になるのか?
- ゲノム編集技術の主要市場はマクロ経済のダイナミクスに概ね追随するのか、それとも個々の国内市場が他を凌駕するのか?
- 2032年までに各国市場のシェアはどのように変化し、どの地域が2032年の市場をリードするのでしょうか?
- 主要プレイヤーは誰か、また予測期間中の展望は?
- これらの主要企業のゲノム編集技術プロジェクトはどのようなものですか?
- 2020年から2032年の間に、業界はどのように進化するのか?現在および今後10年間に実施されるゲノム編集技術プロジェクトにはどのような意味があるのか?
- ゲノム編集技術市場をさらに拡大するために、製品の商業化の必要性は高いか?
- ゲノム編集技術市場はどこに向かい、どのようにすれば市場の最前線に立つことができるのか?
- 新製品やサービスラインに対する最適な投資オプションは何か?
- 企業を新たな成長軌道に乗せ、C-suiteに移行させるための重要な展望とは?
このことが、ゲノム編集技術市場に現在、そして今後10年間、どのような影響を与えるかを知る必要があります。
- 416ページにわたる本レポートでは、154の表と279のグラフを独占的に提供します。
- このレポートでは、業界における主要な収益性の高い分野をハイライトしているため、今すぐその分野をターゲットにすることができます。
- 世界、地域、国別の売上高と成長率を詳細に分析しています。
- 競合他社が成功した主なトレンド、変化、収益予測をハイライトしています。
本レポートは、ゲノム編集技術市場が今後10年間にどのように発展し、COVID-19の景気後退とバウンスの変動に沿うかを今日あなたに伝えます。この市場は、過去10年間のどの時点よりも今が重要なのです。
レポートでは、COVID-19のバリエーションや経済データなど、お客様の市場に特化した独自の情報をお届けしています。
2032年までの予測やその他の分析により、商業的な展望が見えてくる
- 2032年までの収益予測に加え、直近の実績、成長率、市場シェアもご覧いただけます。
- ビジネスの展望や展開など、独自の分析もご覧いただけます。
- 定性的分析(市場力学、ドライバー、機会、抑制、課題など)、コスト構造、ゲノム編集技術価格上昇の影響、最近の動向などをご覧いただけます。
本レポートでは、COVID-19が業界と貴社にどのような影響を与えるかについて、データ分析と貴重な洞察を掲載しています。本レポートでは、COVID-19の4つの回収パターンとその影響、すなわち「V」、「L」、「W」、「U」について論じています。
報告書の対象セグメント
タイプ別
- CRISPR
- TALEN
- ZFN
- Antisense
- その他
用途別
- 細胞株工学
- 遺伝子工学
- 診断薬
- 創薬・医薬品開発
- その他
エンドユーザー別
- バイオテクノロジー企業
- 製薬会社
- 大学・公的研究機関
- その他
世界市場全体およびセグメントの収益予測に加え、4地域および20の主要国市場の収益予測も掲載しています。
北米
- 米国
- カナダ
- メキシコ
欧州
- ドイツ
- スペイン
- イギリス
- フランス
- イタリア
- その他の欧州
アジア太平洋
- 中国
- 日本
- インド
- オーストラリア
- 韓国
- その他のアジア太平洋地域
LAMEA
- ブラジル
- トルコ
- サウジアラビア
- 南アフリカ
- UAE
-その他のラテンアメリカ
ゲノム編集技術市場の2022年から2032年にかけての主要企業のプロファイルと、これらの企業のこのセグメントに焦点を当てた内容も含まれています。
主要企業と市場成長の可能性
・ Agilent Technologies Inc.
・ CRISPR Therapeutics AG
・ Editas Medicine
・ GenScript
・ Lonza
・ Merck KGaA
・ Precision Biosciences
・ Sangamo Therapeutics Inc.
・ Tecan Life Sciences
・ Thermo Fisher Scientific Inc.
ゲノム編集技術市場の世界全体の収益、2022年から2032年まで(金額ベース)は、2022年に4,225.48百万米ドルを超えると、我々の仕事は計算しています。2032年までの間に収益が大きく伸びると予測しています。弊社では、最も大きな可能性を秘めた企業を特定しています。彼らの能力、進歩、商業的展望を知ることで、一歩先を行くことができます。
ゲノム編集技術市場、2022年から2032年までのレポートはどのように役立つのでしょうか?
410ページを超えるレポートでは、要約すると以下のような知識を得ることができます。
- ゲノム編集技術市場の2032年までの収益予測、技術別市場予測、企業規模別市場予測、世界および地域レベルでの各予測 - 産業の展望を見出し、投資と収益に最も有利な場所を発見する。
- 4地域と17主要国市場の2032年までの収益予測 - 北米、欧州、アジア太平洋、LAMEAのゲノム編集技術市場、2022年から2032年までの市場予測をご覧いただけます。また、米国、カナダ、メキシコ、ブラジル、ドイツ、フランス、イギリス、イタリア、中国、インド、日本、オーストラリアなどの主要経済圏の市場も予測されています。
- ゲノム編集技術市場に関与する主要企業12社の企業プロファイルを含む、既存企業および市場参入を目指す企業の展望(2022年から2032年まで)。
定量的・定性的な分析と独自の予測をご覧いただけます。私たちのレポートだけが持つ情報を入手し、貴重なビジネスインテリジェンスを得ることができます。
他にはない情報
私たちの新しいレポートがあれば、知識の遅れを取り戻し、チャンスを逃す可能性が低くなります。私たちの研究が貴社の研究、分析、意思決定にどのように役立つかをご覧ください。Visiongainの研究は、ゲノム編集技術市場、2022年から2032年、市場をリードする企業のための商業分析を必要とするすべての人のためのものです。データ、トレンド、予測をご覧いただけます。
ページTOPに戻る
目次
目次
1.レポートの概要
1.1 調査の目的
1.2 ゲノム編集技術市場の紹介
1.3 本レポートが提供するもの
1.4 なぜ本レポートを読むべきなのか
1.5 本分析レポートが回答する主な質問には以下が含まれます
1.6 本レポートは誰のためのものなのか?
1.7 方法論
1.7.1 市場の定義
1.7.2 市場評価・予測手法
1.7.3 データの検証
1.8 よくある質問と回答(FAQ)
1.9 関連するVisiongainレポート
1.10 Visiongainについて
2 エグゼクティブサマリー
3 プレミアムインサイト
3.1 地域別スナップショット。ゲノム編集技術の世界市場
3.2 タイプ別セグメント市場魅力度指標
3.3 アプリケーションセグメント市場魅力度指標
3.4 エンドユーザセグメント市場魅力度指標
4 市場の概要
4.1 主要な調査結果
4.2 マーケットダイナミクス
4.2.1 市場の推進要因
4.2.2 市場の抑制要因
4.2.3 市場の好機
4.2.4 市場の課題
4.3 COVID-19影響度分析
4.4 ポーターのファイブフォース分析
4.4.1 サプライヤーパワー(中〜高)
4.4.2 バイヤーパワー(低~中)
4.4.3 競争力のあるライバル(中〜高)
4.4.4 代替品の脅威(低~中)
4.4.5 新規参入の脅威(低〜中)
4.5 環境影響度分析
4.5.1 政治的要因
4.5.2 経済的
4.5.3 環境
4.5.4 社会
4.5.5 技術
4.5.6 法律
5 世界のゲノム編集技術市場分析:タイプ別
5.1 主な調査結果
5.2 タイプ別の成長展望
5.3 CRISPR
5.3.1 主要なCRISPRベースの治療薬企業および臨床開発中の薬剤の主要統計値(2021年)
5.3.2 バイオテクノロジーと医療の未来を形成するCRISPRスタートアップ企業トップ15社(2022年)
5.3.3 CRISPR-Casの臨床試験(2022年)
5.3.4 新興のCRISPR治療法(2022年)
5.3.5 CRISPRの地域別市場予測、2022年~2032年(10億米ドル)
5.3.6 CRISPRの地域別市場シェア、2022年~2032年(%)
5.3.7 CRISPRを利用した主な知見
5.4 TALEN
5.4.1 TALENの臨床試験
5.4.2 TALENの地域別市場予測、2022-2032年(Bn米ドル)
5.4.3 TALENの地域別市場シェア、2022-2032年(%)
5.5 ZFN
5.5.1 ZINC FINGER NUCLEASE(ZFN)臨床試験、2022年
5.5.2 ZFNの地域別市場予測、2022年〜2032年 (億米ドル)
5.5.3 ZFNの地域別市場シェア、2022年〜2032年(%)
5.6 アンチセンス
5.6.1 アンチセンス医薬品の臨床開発活動
5.6.2 アンチセンスの地域別市場予測、2022-2032年 (Bn米ドル)
5.6.3 アンチセンスの地域別市場シェア、2022-2032年(%)
5.7 その他
5.7.1 その他の地域別市場予測, 2022-2032年 (億米ドル)
5.7.2 その他地域別市場シェア、2022-2032年(%)
5.8 世界のゲノム編集技術の種類別市場規模の推定と予測
6 世界のゲノム編集技術市場分析:用途別
6.1 主な調査結果
6.2 用途セグメントの成長展望
6.3 細胞培養装置
6.3.1 細胞培養装置地域別市場予測、2022-2032年 (億米ドル)
6.3.2 細胞培養装置地域別市場シェア、2022年-2032年(%)
6.4 遺伝子工学
6.4.1 遺伝子工学の地域別市場予測, 2022-2032年(Bn米ドル)
6.4.2 遺伝子工学の地域別市場シェア、2022年〜2032年(%)
6.5 診断用アプリケーション
6.5.1 診断用アプリケーションの地域別市場予測, 2022-2032年 (億米ドル)
6.5.2 診断用アプリケーションの地域別市場シェア、2022-2032年(%)
6.6 創薬・開発
6.6.1 RNA医薬品の承認
6.6.2 注目される医薬品承認
6.6.3 注目の臨床試験結果(3Q21)
6.6.4 地域別創薬・開発市場予測(2022年~2032年)(億米ドル)
6.6.5 創薬・開発用途の地域別市場シェア(2022-2032年)(%)
6.7 その他
6.7.1 その他の地域別市場予測, 2022-2032年 (億米ドル)
6.7.2 その他の用途別の地域別市場シェア、2022-2032年(%)
6.8 世界のゲノム編集技術の用途別市場規模の推定と予測
7 世界のゲノム編集技術市場分析:エンドユーザー別
7.1 主な調査結果
7.2 エンドユーザー・セグメントの成長展望
7.3 バイオテクノロジー企業
7.3.1 バイオ関連企業の地域別市場予測、2022年〜2032年(10億米ドル)
7.3.2 バイオ関連企業の地域別市場シェア、2022-2032年(%)
7.4 製薬企業
7.4.1 製薬会社の地域別市場予測、2022年〜2032年(Bn米ドル)
7.4.2 製薬会社地域別市場シェア、2022年〜2032年(%)
7.5 学術機関・政府系研究機関
7.5.1 学術・政府系研究機関の地域別市場予測, 2022-2032 (Bn米ドル)
7.5.2 学術・政府系研究機関 地域別市場占有率, 2022-2032 (%)
7.6 その他
7.6.1 その他の地域別市場予測, 2022-2032年 (億米ドル)
7.6.2 その他の地域別市場シェア、2022-2032年(%)
7.7 ゲノム編集技術の世界市場規模予測・エンドユーザー別予測
8 北米のゲノム編集技術市場分析
8.1 主な調査結果
8.2 北米ゲノム編集技術市場の魅力度指数
8.3 北米ゲノム編集技術国別市場、2022年、2027年&2032年(US$ Mn)
8.4 北米ゲノム編集技術国別市場規模推定・予測
8.5 北米ゲノム編集技術市場のタイプ別市場規模予測・予想
8.6 北米ゲノム編集技術市場の用途別市場規模予測・予想
8.7 北米ゲノム編集技術市場のエンドユーザー別市場規模予測・予想
8.8 米国
8.8.1 米国のゲノム編集技術市場:タイプ別
8.8.2 米国のゲノム編集技術市場規模予測・用途別予測
8.8.3 米国のゲノム編集技術市場のエンドユーザー別市場規模予測・予想
8.9 カナダ
8.9.1 カナダのゲノム編集技術市場:タイプ別
8.9.2 カナダのゲノム編集技術市場規模予測・用途別予測
8.9.3 カナダのゲノム編集技術市場のエンドユーザー別市場規模予測・予想
9 欧州のゲノム編集技術市場分析
9.1 主な調査結果
9.2 欧州ゲノム編集技術市場魅力度指数
9.3 欧州ゲノム編集技術国別市場、2022年、2027年&2032年(US$ Mn)
9.4 欧州ゲノム編集技術国別市場規模予測・予測
9.5 欧州ゲノム編集技術市場タイプ別市場規模予測・予測
9.6 欧州ゲノム編集技術市場の用途別市場規模予測・予想
9.7 欧州ゲノム編集技術市場 エンドユーザー別市場規模予測・予想
9.8 ドイツ
9.8.1 ドイツ ゲノム編集技術タイプ別市場規模予測
9.8.2 ドイツ ゲノム編集技術用途別市場規模予測・予測
9.8.3 ドイツゲノム編集技術市場 エンドユーザー別市場規模予測・予測
9.9 イギリス
9.9.1 英国のゲノム編集技術市場:タイプ別
9.9.2 イギリス ゲノム編集技術用途別市場規模予測・予測
9.9.3 イギリスゲノム編集技術市場エンドユーザー別市場規模予測・予想
9.10 フランス
9.10.1 フランス ゲノム編集技術市場:タイプ別
9.10.2 フランスゲノム編集技術用途別市場規模予測・予測
9.10.3 フランスゲノム編集技術市場エンドユーザー別市場規模予測・予想
9.11 イタリア
9.11.1 イタリア ゲノム編集技術市場:タイプ別
9.11.2 イタリア ゲノム編集技術市場規模予測・用途別予測
9.11.3 イタリアゲノム編集技術市場エンドユーザー別市場規模予測・予想
9.12 スペイン
9.12.1 スペイン ゲノム編集技術市場:タイプ別
9.12.2 スペインゲノム編集技術用途別市場規模予測・予測
9.12.3 スペインゲノム編集技術市場エンドユーザー別市場規模予測・予想
9.13 ロシア
9.13.1 ロシア ゲノム編集技術市場:タイプ別
9.13.2 ロシア ゲノム編集技術市場規模予測・用途別予測
9.13.3 ロシアゲノム編集技術市場 エンドユーザー別市場規模予測・予測
9.14 欧州のその他の地域
9.14.1欧州その他の地域 ゲノム編集技術市場:タイプ別
9.14.2 その他の欧州ゲノム編集技術市場規模予測・用途別予測
9.14.3 その他の欧州ゲノム編集技術市場 エンドユーザー別市場規模予測・予測
10 アジア太平洋地域のゲノム編集技術市場分析
10.1 主な調査結果
10.2 アジア太平洋地域のゲノム編集技術市場の魅力度指数
10.3 アジア太平洋地域のゲノム編集技術国別市場、2022年、2027年&2032年(US$ Mn)
10.4 アジア太平洋地域のゲノム編集技術国別市場規模予測・予想
10.5 アジア太平洋地域のゲノム編集技術市場の種類別市場規模予測・予想
10.6 アジア太平洋地域のゲノム編集技術市場の用途別市場規模予測・予想
10.7 アジア太平洋地域のゲノム編集技術市場のエンドユーザー別市場規模予測・予想
10.8 中国
10.8.1 中国ゲノム編集技術市場:タイプ別
10.8.2 中国ゲノム編集技術市場規模予測・用途別予測
10.8.3 中国ゲノム編集技術市場エンドユーザー別市場規模予測・予想
10.9 日本
10.9.1 日本 ゲノム編集技術市場:タイプ別
10.9.2 日本ゲノム編集技術用途別市場規模予測・予測
10.9.3 日本ゲノム編集技術市場エンドユーザー別市場規模予測・予想
10.10 インド
10.10.1 インド ゲノム編集技術市場:タイプ別
10.10.2 インドゲノム編集技術用途別市場規模予測・予測
10.10.3 インドゲノム編集技術市場エンドユーザー別市場規模予測・予想
10.11 フィリピン
10.11.1 フィリピン ゲノム編集技術市場:タイプ別
10.11.2 フィリピン ゲノム編集技術用途別市場規模予測・予測
10.11.3 フィリピン ゲノム編集技術 エンドユーザー別市場規模予測・予測
10.12 韓国
10.12.1 韓国 ゲノム編集技術市場:タイプ別
10.12.2 韓国ゲノム編集技術市場規模予測・用途別予測
10.12.3 韓国ゲノム編集技術市場規模予測・予測:エンドユーザー別
10.13 アジア太平洋地域のその他の地域
10.13.1 その他のアジア太平洋地域のゲノム編集技術市場:タイプ別
10.13.2 その他のアジア太平洋地域のゲノム編集技術市場規模予測・用途別予測
10.13.3 その他のアジア太平洋地域のゲノム編集技術市場のエンドユーザー別市場規模予測・予想
11 ラテンアメリカのゲノム編集技術市場分析
11.1 主な調査結果
11.2 ラテンアメリカのゲノム編集技術市場の魅力度指数
11.3 ラテンアメリカのゲノム編集技術国別市場 2022年、2027年&2032年 (10億米ドル)
11.4 ラテンアメリカのゲノム編集技術国別市場規模予測・予想
11.5 ラテンアメリカのゲノム編集技術市場の種類別市場規模予測・予想
11.6 ラテンアメリカのゲノム編集技術市場の用途別市場規模予測・予想
11.7 ラテンアメリカのゲノム編集技術市場のエンドユーザー別市場規模予測・予想
11.8 ブラジル
11.8.1 ブラジルゲノム編集技術市場:タイプ別
11.8.2 ブラジルゲノム編集技術用途別市場規模予測・予測
11.8.3 ブラジルゲノム編集技術市場エンドユーザー別市場規模予測・予想
11.9 アルゼンチン
11.9.1 アルゼンチンゲノム編集技術市場:タイプ別
11.9.2 アルゼンチンゲノム編集技術市場エンドユーザー別市場規模予測・予測
11.10 その他のラテンアメリカ地域
11.10.1 その他のラテンアメリカ地域 ゲノム編集技術市場:タイプ別
11.10.2 その他のラテンアメリカ地域 ゲノム編集技術市場規模予測・用途別予測
11.10.3 その他のラテンアメリカ地域ゲノム編集技術市場規模予測・予測:エンドユーザー別
12 中東・アフリカのゲノム編集技術市場分析
12.1 主な調査結果
12.2 中東・アフリカのゲノム編集技術市場の魅力度指数
12.3 中東・アフリカ ゲノム編集技術国別市場 2022年、2027年、2032年(10億米ドル)
12.4 中東・アフリカ ゲノム編集技術国別市場規模推定・予測
12.5 中東・アフリカ ゲノム編集技術市場タイプ別市場規模予測・予測
12.6 中東・アフリカ ゲノム編集技術市場の用途別市場規模予測・予想
12.7 中東・アフリカのゲノム編集技術市場のエンドユーザー別市場規模予測・予想
12.8 GCC
12.8.1 GCC ゲノム編集技術市場:タイプ別
12.8.2 GCC ゲノム編集技術の用途別市場規模予測・予測
12.8.3 GCCゲノム編集技術エンドユーザー別市場規模予測・予想
12.9 南アフリカ
12.9.1 南アフリカのゲノム編集技術市場:タイプ別
12.9.2 南アフリカのゲノム編集技術市場規模予測・用途別予測
12.9.3 南アフリカのゲノム編集技術市場のエンドユーザー別市場規模予測・予測
12.10 その他の中東・アフリカ地域
12.10.1 その他の中東&アフリカ ゲノム編集技術市場:タイプ別
12.10.2 その他の中東・アフリカゲノム編集技術市場規模予測・用途別予測
12.10.3 その他の中東・アフリカゲノム編集技術市場のエンドユーザー別市場規模推定・予測
13 競合他社の状況
13.1 企業ランキング
13.2 主要事業戦略分析
13.3 サーモフィッシャーサイエンティフィック社
13.3.1 会社概要
13.3.2 会社概要
13.3.3 財務分析
13.3.4 製品ベンチマーク
13.3.5 戦略的展望
13.4 メルクKGaA
13.4.1 企業スナップショット
13.4.2 会社概要
13.4.3 財務分析
13.4.4 製品ベンチマーク
13.4.5 戦略的展望
13.5 ジェンスクリプト
13.5.1 企業スナップショット
13.5.2 会社概要
13.5.3 財務分析
13.5.4 製品ベンチマーク
13.5.5 戦略的な展望
13.6 サンガモ・セラピューティック社
13.6.1 企業スナップショット
13.6.2 会社概要
13.6.3 財務分析
13.6.4 製品ベンチマーク
13.6.5 戦略的展望
13.7 ロンザ
13.7.1 企業スナップショット
13.7.2 会社概要
13.7.3 財務分析
13.7.4 製品ベンチマーク
13.7.5 戦略的展望
13.8 エディタスメディスン
13.8.1 企業スナップショット
13.8.2 会社概要
13.8.3 財務分析
13.8.4 製品ベンチマーク
13.8.5 戦略的展望
13.9 CRISPR Therapeutics AG
13.9.1 企業スナップショット
13.9.2 会社概要
13.9.3 財務分析
13.9.4 製品ベンチマーキング
13.9.5 戦略的な展望
13.10 アジレント・テクノロジー
13.10.1 企業スナップショット
13.10.2 会社概要
13.10.3 財務分析
13.10.4 製品ベンチマーク
13.10.5 戦略的展望
13.11 プレシジョン・バイオサイエンス
13.11.1 企業スナップショット
13.11.2 会社概要
13.11.3 財務分析
13.11.4 製品ベンチマーク
13.11.5 戦略的展望
13.12 テカンライフサイエンス
13.12.1 企業スナップショット
13.12.2 会社概要
13.12.3 財務分析
13.12.4 製品ベンチマーク
13.12.5 戦略的展望
14 結論と提言
14.1 ビジョンゲインからの結論
14.2 市場関係者への提言
表の一覧
Table 1 Global Genome Editing Technologies Market Snapshot, 2022 & 2032 (US$ million, CAGR %)
Table 2 Approved Cellular and Gene Therapy Products, 2022
Table 3 Global Genome editing technologies Market by Region, 2022-2032 (US$ Mn, AGR (%), CAGR (%)): “V” Shaped Recovery Scenario
Table 4 Global Genome editing technologies Market by Region, 2022-2032 (US$ Mn, AGR (%), CAGR (%)): “U” Shaped Recovery Scenario
Table 5 Global Genome editing technologies Market by Region, 2022-2032 (US$ Mn, AGR (%), CAGR (%)): “W” Shaped Recovery Scenario
Table 6 Global Genome editing technologies Market by Region, 2022-2032 (US$ Mn, AGR (%), CAGR(%)): “L” Shaped Recovery Scenario
Table 7 CRISPR Market Forecast by Region, 2022-2032 (US$ million, AGR%, CAGR %)
Table 8 CRISPR Market Forecast by Region, 2022-2032 (US$ million, AGR%, CAGR %)
Table 9 TALEN Market Forecast by Region, 2022-2032 (US$ million, AGR%, CAGR %)
Table 10 ZFN Market Forecast by Region, 2022-2032 (US$ million, AGR%, CAGR%)
Table 11 Antisense Market Forecast by Region, 2022-2032 (US$ million, AGR%, CAGR %)
Table 12 Others Market Forecast by Region, 2022-2032 (US$ million, AGR%, CAGR %)
Table 13 Global Genome editing technologies Market Forecast by Type, 2022-2032 (US$ million, AGR%, CAGR %)
Table 14 Thermo Fischer Cell Line Services
Table 15 CRISPR Market Forecast by Region, 2022-2032 (US$ million, AGR%, CAGR %)
Table 16 Genetic Engineering Market Forecast by Region, 2022-2032 (US$ million, AGR%, CAGR %)
Table 17 Diagnostic applications Market Forecast by Region, 2022-2032 (US$ million, AGR%, CAGR %)
Table 18 RNA Drugs Approvals
Table 19 Drugs Approvals
Table 20 Notable Clinical Trials Results
Table 21 Drug Discovery & Development Market Forecast by Region, 2022-2032 (US$ million, AGR%, CAGR %)
Table 22 Others Market Forecast by Region, 2022-2032 (US$ million, AGR%, CAGR %)
Table 23 Global Genome editing technologies Market Forecast by Application, 2022-2032 (US$ million, AGR%, CAGR %)
Table 24 Biotechnology Companies Market Forecast by Region, 2022-2032 (US$ million, AGR%, CAGR %)
Table 25 Pharmaceutical Companies Market Forecast by Region, 2022-2032 (US$ million, AGR%, CAGR %)
Table 26 Academic & Government Research Institutes Market Forecast by Region, 2022-2032 (US$ million, AGR%, CAGR %)
Table 27 Others Market Forecast by Region, 2022-2032 (US$ million, AGR%, CAGR %)
Table 28 Global Genome editing technologies Market Forecast by End-User, 2022-2032 (US$ million, AGR%, CAGR %)
Table 29 North America Genome editing technologies Market Forecast by Country, 2022-2032 (US$ million, AGR%, CAGR %)
Table 30 North America Genome editing technologies Market Forecast by Type, 2022-2032 (US$ million, AGR%, CAGR %)
Table 31 North America Genome editing technologies Market Forecast by Application, 2022-2032 (US$ million, AGR%, CAGR %)
Table 32 North America Genome editing technologies Market Forecast by End-users, 2022-2032 (US$ million, AGR%, CAGR %)
Table 33 U.S. Genome editing technologies Market Forecast, 2022-2032 (US$ million, AGR%, CAGR %)
Table 34 US Genome editing technologies Market Forecast by Type, 2022-2032 (US$ million, AGR%, CAGR %)
Table 35 US Genome editing technologies Market Forecast by Application, 2022-2032 (US$ million, AGR%, CAGR %)
Table 36 US Genome editing technologies Market Forecast by End-users, 2022-2032 (US$ million, AGR%, CAGR %)
Table 37 Canada Genome editing technologies Market Forecast, 2022-2032 (US$ million, AGR%, CAGR %)
Table 38 Canada Genome editing technologies Market Forecast by Type, 2022-2032 (US$ million, AGR%, CAGR %)
Table 39 Canada Genome editing technologies Market Forecast by Application, 2022-2032 (US$ million, AGR%, CAGR %)
Table 40 Canada Genome editing technologies Market Forecast by End-users, 2022-2032 (US$ million, AGR%, CAGR %)
Table 41 Europe Genome editing technologies Market Forecast by Country, 2022-2032 (US$ million, AGR%, CAGR %)
Table 42 Europe Genome editing technologies Market Forecast by Type, 2022-2032 (US$ million, AGR%, CAGR %)
Table 43 Europe Genome editing technologies Market Forecast by Application, 2022-2032 (US$ million, AGR%, CAGR %)
Table 44 Europe Genome editing technologies Market Forecast by End-users, 2022-2032 (US$ million, AGR%, CAGR %)
Table 45 Germany Genome editing technologies Market Forecast, 2022-2032 (US$ million, AGR%, CAGR %)
Table 46 Germany Genome editing technologies Market Forecast by Type, 2022-2032 (US$ million, AGR%, CAGR %)
Table 47 Germany Genome editing technologies Market Forecast by Application, 2022-2032 (US$ million, AGR%, CAGR %)
Table 48 Germany Genome editing technologies Market Forecast by End-users, 2022-2032 (US$ million, AGR%, CAGR %)
Table 49 UK Genome editing technologies Market Forecast, 2022-2032 (US$ million, AGR%, CAGR %)
Table 50 UK Genome editing technologies Market Forecast by Type, 2022-2032 (US$ million, AGR%, CAGR %)
Table 51 UK Genome editing technologies Market Forecast by Application, 2022-2032 (US$ million, AGR%, CAGR %)
Table 52 UK Genome editing technologies Market Forecast by End-users, 2022-2032 (US$ million, AGR%, CAGR %)
Table 53 France Genome editing technologies Market Forecast, 2022-2032 (US$ million, AGR%, CAGR %)
Table 54 France Genome editing technologies Market Forecast by Type, 2022-2032 (US$ million, AGR%, CAGR %)
Table 55 France Genome editing technologies Market Forecast by Application, 2022-2032 (US$ million, AGR%, CAGR %)
Table 56 France Genome editing technologies Market Forecast by End-users, 2022-2032 (US$ million, AGR%, CAGR %)
Table 57 Italy Genome editing technologies Market Forecast, 2022-2032 (US$ million, AGR%, CAGR %)
Table 58 Italy Genome editing technologies Market Forecast by Type, 2022-2032 (US$ million, AGR%, CAGR %)
Table 59 Italy Genome editing technologies Market Forecast by Application, 2022-2032 (US$ million, AGR%, CAGR %)
Table 60 Italy Genome editing technologies Market Forecast by End-users, 2022-2032 (US$ million, AGR%, CAGR %)
Table 61 Spain Genome editing technologies Market Forecast, 2022-2032 (US$ million, AGR%, CAGR %)
Table 62 Spain Genome editing technologies Market Forecast by Type, 2022-2032 (US$ million, AGR%, CAGR %)
Table 63 Spain Genome editing technologies Market Forecast by Application, 2022-2032 (US$ million, AGR%, CAGR %)
Table 64 Spain Genome editing technologies Market Forecast by End-users, 2022-2032 (US$ million, AGR%, CAGR %)
Table 65 Russia Genome editing technologies Market Forecast, 2022-2032 (US$ million, AGR%, CAGR %)
Table 66 Russia Genome editing technologies Market Forecast by Type, 2022-2032 (US$ million, AGR%, CAGR %)
Table 67 Russia Genome editing technologies Market Forecast by Application, 2022-2032 (US$ million, AGR%, CAGR %)
Table 68 Russia Genome editing technologies Market Forecast by End-users, 2022-2032 (US$ million, AGR%, CAGR %)
Table 69 Rest of Europe Genome editing technologies Market Forecast, 2022-2032 (US$ million, AGR%, CAGR %)
Table 70 Rest of Europe Genome editing technologies Market Forecast by Type, 2022-2032 (US$ million, AGR%, CAGR %)
Table 71 Rest of Europe Genome editing technologies Market Forecast by Application, 2022-2032 (US$ million, AGR%, CAGR %)
Table 72 Rest of Europe Genome editing technologies Market Forecast by End-users, 2022-2032 (US$ million, AGR%, CAGR %)
Table 73 Asia Pacific Genome editing technologies Market Forecast by Country, 2022-2032 (US$ million, AGR%, CAGR %)
Table 74 Asia Pacific Genome editing technologies Market Forecast by Type, 2022-2032 (US$ million, AGR%, CAGR %)
Table 75 Asia Pacific Genome editing technologies Market Forecast by Application, 2022-2032 (US$ million, AGR%, CAGR %)
Table 76 Asia Pacific Genome editing technologies Market Forecast by End-users, 2022-2032 (US$ million, AGR%, CAGR %)
Table 77 China Genome editing technologies Market Forecast, 2022-2032 (US$ million, AGR%, CAGR %)
Table 78 China Genome editing technologies Market Forecast by Type, 2022-2032 (US$ million, AGR%, CAGR %)
Table 79 China Genome editing technologies Market Forecast by Application, 2022-2032 (US$ million, AGR%, CAGR %)
Table 80 China Genome editing technologies Market Forecast by End-users, 2022-2032 (US$ million, AGR%, CAGR %)
Table 81 Japan Genome editing technologies Market Forecast, 2022-2032 (US$ million, AGR%, CAGR %)
Table 82 Japan Genome editing technologies Market Forecast by Type, 2022-2032 (US$ million, AGR%, CAGR %)
Table 83 Japan Genome editing technologies Market Forecast by Application, 2022-2032 (US$ million, AGR%, CAGR %)
Table 84 Japan Genome editing technologies Market Forecast by End-users, 2022-2032 (US$ million, AGR%, CAGR %)
Table 85 India Genome editing technologies Market Forecast, 2022-2032 (US$ million, AGR%, CAGR %)
Table 86 India Genome editing technologies Market Forecast by Type, 2022-2032 (US$ million, AGR%, CAGR %)
Table 87 India Genome editing technologies Market Forecast by Application, 2022-2032 (US$ million, AGR%, CAGR %)
Table 88 India Genome editing technologies Market Forecast by End-users, 2022-2032 (US$ million, AGR%, CAGR %)
Table 89 Philippines Genome editing technologies Market Forecast, 2022-2032 (US$ million, AGR%, CAGR %)
Table 90 Philippines Genome editing technologies Market Forecast by Type, 2022-2032 (US$ million, AGR%, CAGR %)
Table 91 Philippines Genome editing technologies Market Forecast by Application, 2022-2032 (US$ million, AGR%, CAGR %)
Table 92 Philippines Genome editing technologies Market Forecast by End-users, 2022- 2032 (US$ million, AGR%, CAGR %)
Table 93 South Korea Genome editing technologies Market Forecast, 2022-2032 (US$ million, AGR%, CAGR %)
Table 94 South Korea Genome editing technologies Market Forecast by Type, 2022-2032 (US$ million, AGR%, CAGR %)
Table 95 South Korea Genome editing technologies Market Forecast by Application, 2022-2032 (US$ million, AGR%, CAGR %)
Table 96 South Korea Genome editing technologies Market Forecast by End-users, 2022-2032 (US$ million, AGR%, CAGR %)
Table 97 Rest of Asia Pacific Genome editing technologies Market Forecast, 2022-2032 (US$ million, AGR%, CAGR %)
Table 98 Rest of Asia Pacific Genome editing technologies Market Forecast by Type, 2022-2032 (US$ million, AGR%, CAGR %)
Table 99 Rest of Asia Pacific Genome editing technologies Market Forecast by Application, 2022-2032 (US$ million, AGR%, CAGR %)
Table 100 Rest of Asia Pacific Genome editing technologies Market Forecast by End-users, 2022-2032 (US$ million, AGR%, CAGR %)
Table 101 Latin America Genome editing technologies Market Forecast by Country, 2022-2032 (US$ million, AGR%, CAGR %)
Table 102 Latin America Genome editing technologies Market Forecast by Type, 2022-2032 (US$ million, AGR%, CAGR %)
Table 103 Latin America Genome editing technologies Market Forecast by Application, 2022-2032 (US$ million, AGR%, CAGR %)
Table 104 Latin America Genome editing technologies Market Forecast by End-users, 2022-2032 (US$ million, AGR%, CAGR %)
Table 105 Brazil Genome editing technologies Market Forecast, 2022-2032 (US$ million, AGR%, CAGR %)
Table 106 Brazil Genome editing technologies Market Forecast by Type, 2022-2032 (US$ million, AGR%, CAGR %)
Table 107 Brazil Genome editing technologies Market Forecast by Application, 2022-2032 (US$ million, AGR%, CAGR %)
Table 108 Brazil Genome editing technologies Market Forecast by End-users, 2022-2032 (US$ million, AGR%, CAGR %)
Table 109 Argentina Genome editing technologies Market Forecast, 2022-2032 (US$ million, AGR%, CAGR %)
Table 110 Argentina Genome editing technologies Market Forecast by Type, 2022-2032 (US$ million, AGR%, CAGR %)
Table 111 Argentina Genome editing technologies Market Forecast by Application, 2022-2032 (US$ million, AGR%, CAGR %)
Table 112 Argentina Genome editing technologies Market Forecast by End-users, 2022-2032 (US$ million, AGR%, CAGR %)
Table 113 Rest of Latin America Genome editing technologies Market Forecast, 2022-2032 (US$ million, AGR%, CAGR %)
Table 114 Rest of Latin America Genome editing technologies Market Forecast by Type, 2022-2032 (US$ million, AGR%, CAGR %)
Table 115 Rest of Latin America Genome editing technologies Market Forecast by Application, 2022-2032 (US$ million, AGR%, CAGR %)
Table 116 Rest of Latin America Genome editing technologies Market Forecast by End-users, 2022-2032 (US$ million, AGR%, CAGR %)
Table 117 Middle East & Africa Genome editing technologies Market Forecast by Country, 2022-2032 (US$ million, AGR%, CAGR %)
Table 118 Middle East & Africa Genome editing technologies Market Forecast by Type, 2022-2032 (US$ million, AGR%, CAGR %)
Table 119 Middle East & Africa Genome editing technologies Market Forecast by Application, 2022-2032 (US$ million, AGR%, CAGR %)
Table 120 Middle East & Africa Genome editing technologies Market Forecast by End-users, 2022-2032 (US$ million, AGR%, CAGR%)
Table 121 GCC Genome editing technologies Market Forecast, 2022-2032 (US$ million, AGR%, CAGR %)
Table 122 GCC Genome editing technologies Market Forecast by Type, 2022-2032 (US$ million, AGR%, CAGR %)
Table 123 GCC Genome editing technologies Market Forecast by Application, 2022-2032 (US$ million, AGR%, CAGR %)
Table 124 GCC Genome editing technologies Market Forecast by End-users, 2022-2032 (US$ million, AGR%, CAGR %)
Table 125 South Africa Genome editing technologies Market Forecast, 2022-2032 (US$ million, AGR%, CAGR %)
Table 126 South Africa Genome editing technologies Market Forecast by Type, 2022-2032 (US$ million, AGR%, CAGR %)
Table 127 South Africa Genome editing technologies Market Forecast by Application, 2022-2032 (US$ million, AGR%, CAGR %)
Table 128 South Africa Genome editing technologies Market Forecast by End-users, 2022-2032 (US$ million, AGR%, CAGR %)
Table 129 Rest of Middle East & Africa Genome editing technologies Market Forecast, 2022-2032 (US$ million, AGR%, CAGR%)
Table 130 Rest of Middle East & Africa Genome editing technologies Market Forecast by Type, 2022-2032 (US$ million, AGR%, CAGR%)
Table 131 Rest of Middle East & Africa Genome editing technologies Market Forecast by Application, 2022-2032 (US$ million, AGR%, CAGR%)
Table 132 Rest of Middle East & Africa Genome editing technologies Market Forecast by End-users, 2022-2032 (US$ million, AGR%, CAGR%)
Table 133 Top 10 Ranking of Key Vendors in Genome Editing Technologies Market, 2021
Table 134 Key Business Strategies Adopted by Key Players in Global Genome editing technologies Market
Table 135 Thermo Fisher Scientific Inc: Key Details, (CEO, HQ, Revenue, Founded, No. of Employees, Company Type, Website, Business Segment)
Table 136 Thermo Fisher Scientific Inc.: Product Benchmarking
Table 137 Merck KGaA: Key Details, (CEO, HQ, Revenue, Founded, No. of Employees, Company Type, Website, Business Segment)
Table 138 Merck KGaA: Product Benchmarking
Table 139 GenScript: Key Details, (CEO, HQ, Revenue, Founded, No. of Employees, Company Type, Website, Business Segment)
Table 140 GenScript: Product Benchmarking
Table 141 Sangamo Therapeutics Inc.: Key Details, (CEO, HQ, Revenue, Founded, No. of Employees, Company Type, Website, Business Segment)
Table 142 Sangamo Therapeutics Inc.: Product Benchmarking
Table 143 Lonza: Key Details, (CEO, HQ, Revenue, Founded, No. of Employees, Company Type, Website, Business Segment)
Table 144 Lonza: Product Benchmarking
Table 145 Editas Medicine: Key Details, (CEO, HQ, Revenue, Founded, No. of Employees, Company Type, Website, Business Segment)
Table 146 Editas Medicine: Product Benchmarking
Table 147 CRISPR Therapeutics AG: Key Details, (CEO, HQ, Revenue, Founded, No. of Employees, Company Type, Website, Business Segment)
Table 148 CRISPR Therapeutics AG: Product Benchmarking
Table 149 Agilent Technologies Inc.: Key Details, (CEO, HQ, Revenue, Founded, No. of Employees, Company Type, Website, Business Segment)
Table 150 Agilent Technologies Inc.: Product Benchmarking
Table 151 Precision Biosciences: Key Details, (CEO, HQ, Revenue, Founded, No. of Employees, Company Type, Website, Business Segment)
Table 152 Precision Biosciences: Product Benchmarking
Table 153 Tecan Life Sciences: Key Details, (CEO, HQ, Revenue, Founded, No. of Employees, Company Type, Website, Business Segment)
Table 154 Tecan Life Sciences: Product Benchmarking
List of Figures
Figure 1 Global Genome editing technologies Market Segmentation
Figure 2 Breakdown of Primary Interviews: By Company Type, Designation, & Region
Figure 3 Global Genome editing technologies Market Forecast by Region: Market Attractiveness Index
Figure 4 Global Genome editing technologies Market by Type: Market Attractiveness Index
Figure 5 Global Genome editing technologies Market by Application: Market Attractiveness Index
Figure 6 Global Genome editing technologies Market by End-users: Market Attractiveness Index
Figure 7 Global Precision Medicine Market: Market Dynamics
Figure 8 Global COVID Impact Analysis: Genome editing technologies Market Recovery Scenarios
Figure 9 Global Genome editing technologies Market by Region, 2022-2032 (US$ Mn, AGR (%), CAGR (%)): “V” Shaped Recovery
Figure 10 Global Genome editing technologies Market by Region, 2022-2032 (US$ Mn, AGR (%), CAGR (%)): “U” Shaped Recovery
Figure 11 Global Genome editing technologies Market by Region, 2022-2032 (US$ Mn, AGR (%), CAGR (%)): “W” Shaped Recovery
Figure 12 Global Genome editing technologies Market by Region, 2022-2032 (US$ Mn, AGR (%), CAGR (%)): “L” Shaped Recovery
Figure 13 Global Precision Medicine Market: Porter’s Five Forces Analysis
Figure 14 Global Genome editing technologies Market Share Forecast by Type, 2022, 2027, 2032 (%)
Figure 15 CRISPR Market Forecast by Region, 2022-2032 (US$ million)
Figure 16 CRISPR Market Share Forecast by Region, 2022-2032 (%)
Figure 17 TALEN Market Forecast by Region, 2022-2032 (US$ million)
Figure 18 TALEN Market Share Forecast by Region, 2022-2032 (%)
Figure 19 ZFN Market Forecast by Region, 2022-2032 (US$ million)
Figure 20 ZFN Market Share Forecast by Region, 2022-2032 (%)
Figure 21 Antisense Market Forecast by Region, 2022-2032 (US$ million)
Figure 22 Antisense Market Share Forecast by Region, 2022-2032 (%)
Figure 23 CVDs Market Forecast by Region, 2022-2032 (US$ million)
Figure 24 Others Market Share Forecast by Region, 2022-2032 (%)
Figure 25 Global Genome editing technologies Market Forecast by Type, 2022-2032 (US$ million, AGR %)
Figure 26 Global Genome editing technologies Market Share Forecast by Type, 2022, 2027, 2032 (%)
Figure 27 Global Genome editing technologies Market Forecast by Application 2022, 2027, 2032 (Revenue, CAGR %)
Figure 28 Cell Line Engineering Market Forecast by Region, 2022-2032 (US$ million)
Figure 29 Cell Line Engineering Market Share Forecast by Region, 2022-2032 (%)
Figure 30 Genetic Engineering Market Forecast by Region, 2022-2032 (US$ million)
Figure 31 Genetic Engineering Market Share Forecast by Region, 2022-2032 (%)
Figure 32 Diagnostic Applications Market Forecast by Region, 2022-2032 (US$ million)
Figure 33 Genetic Engineering Market Share Forecast by Region, 2022-2032 (%)
Figure 34 Drug Discovery & Development Applications Market Forecast by Region, 2022-2032 (US$ million)
Figure 35 Drug Discovery & Development Market Share Forecast by Region, 2022-2032 (%)
Figure 36 Other Applications Market Forecast by Region, 2022-2032 (US$ million)
Figure 37 Other Market Share Forecast by Region, 2022-2032 (%)
Figure 38 Global Genome editing technologies Market Forecast by Type, 2022-2032 (US$ million, AGR %)
Figure 39 Global Genome editing technologies Market Forecast by Application 2022, 2027, 2032 (Revenue, CAGR %)
Figure 40 Global Genome editing technologies Market Forecast by End-User 2022, 2027, 2032 (%)
Figure 41 Biotechnology Companies Market Forecast by Region, 2022-2032 (US$ million)
Figure 42 Biotechnology Companies Market Share Forecast by Region, 2022-2032 (%)
Figure 43 Pharmaceutical Companies Market Forecast by Region, 2022-2032 (US$ million)
Figure 44 Biotechnology Companies Market Share Forecast by Region, 2022-2032 (%)
Figure 45 Academic & Government Research Institutes Market Forecast by Region, 2022-2032 (US$ million)
Figure 46 Academic & Government Research Institutes Market Share Forecast by Region, 2022-2032 (%)
Figure 47 Others Market Forecast by Region, 2022-2032 (US$ million)
Figure 48 Others Market Share Forecast by Region, 2022-2032 (%)
Figure 49 Global Genome editing technologies Market Forecast by Type, 2022-2032 (US$ million, AGR %)
Figure 50 Global Genome editing technologies Market Forecast by End-User 2022, 2027, 2032 (Revenue, CAGR %)
Figure 51 North America Genome editing technologies Market Attractiveness Index
Figure 52 North America Genome editing technologies Market by Region, 2022, 2027 & 2032 (US$ million)
Figure 53 North America Genome editing technologies Market Forecast by Country, 2022-2032 (US$ million, AGR %)
Figure 54 North America Genome editing technologies Market Share Forecast by Country, 2022 & 2032 (%)
Figure 55 North America Genome editing technologies Market Forecast by Type, 2022-2032 (US$ million, AGR %)
Figure 56 North America Genome editing technologies Market Share Forecast by Type, 2022 & 2032 (%)
Figure 57 North America Genome editing technologies Market Forecast by Application, 2022-2032 (US$ million, AGR %)
Figure 58 North America Genome editing technologies Market Share Forecast by Application, 2022 & 2032 (%)
Figure 59 North America Genome editing technologies Market Forecast by End-users, 2022-2032 (US$ million, AGR %)
Figure 60 North America Genome editing technologies Market Share Forecast by End-users, 2022 & 2032 (%)
Figure 61 U.S. Genome editing technologies Market Forecast, 2022-2032 (US$ million, AGR %)
Figure 62 U.S. Genome editing technologies Market Forecast by Type, 2022-2032 (US$ million, AGR %)
Figure 63 U.S. Genome editing technologies Market Share Forecast by Type, 2022 & 2032 (%)
Figure 64 US Genome editing technologies Market Forecast by Application, 2022-2032 (US$ million, AGR %)
Figure 65 US Genome editing technologies Market Share Forecast by Application, 2022 & 2032 (%)
Figure 66 US Genome editing technologies Market Forecast by End-users, 2022-2032 (US$ million, AGR %)
Figure 67 US Genome editing technologies Market Share Forecast by End-users, 2022 & 2032 (%)
Figure 68 Canada Genome editing technologies Market Forecast, 2022-2032 (US$ million, AGR %)
Figure 69 Canada Genome editing technologies Market Forecast by Type, 2022-2032 (US$ million, AGR %)
Figure 70 Canada Genome editing technologies Market Share Forecast by Type, 2022 & 2032 (%)
Figure 71 Canada Genome editing technologies Market Forecast by Application, 2022-2032 (US$ million, AGR %)
Figure 72 Canada Genome editing technologies Market Share Forecast by Application, 2022 & 2032 (%)
Figure 73 Canada Genome editing technologies Market Forecast by End-users, 2022-2032 (US$ million, AGR %)
Figure 74 Canada Genome editing technologies Market Share Forecast by End-users, 2022 & 2032 (%)
Figure 75 Europe Genome editing technologies Market Attractiveness Index
Figure 76 Europe Genome editing technologies Market by Region, 2022, 2027 & 2032 (US$ million)
Figure 77 Europe Genome editing technologies Market Forecast by Country, 2022-2032 (US$ million, AGR %)
Figure 78 Europe Genome editing technologies Market Share Forecast by Country, 2022 & 2032 (%)
Figure 79 Europe Genome editing technologies Market Forecast by Type, 2022-2032 (US$ million, AGR %)
Figure 80 Europe Genome editing technologies Market Share Forecast by Type, 2022 & 2032 (%)
Figure 81 Europe Genome editing technologies Market Forecast by Application, 2022-2032 (US$ million, AGR %)
Figure 82 Europe Genome editing technologies Market Share Forecast by Application, 2022 & 2032 (%)
Figure 83 Europe Genome editing technologies Market Forecast by End-users, 2022-2032 (US$ million, AGR %)
Figure 84 Europe Genome editing technologies Market Share Forecast by End-users, 2022 & 2032 (%)
Figure 85 Germany Genome editing technologies Market Forecast, 2022-2032 (US$ million, AGR %)
Figure 86 Germany Genome editing technologies Market Forecast by Type, 2022-2032 (US$ million, AGR %)
Figure 87 Germany Genome editing technologies Market Share Forecast by Type, 2022 & 2032 (%)
Figure 88 Germany Genome editing technologies Market Forecast by Application, 2022-2032 (US$ million, AGR %)
Figure 89 Germany Genome editing technologies Market Share Forecast by Application, 2022 & 2032 (%)
Figure 90 Germany Genome editing technologies Market Forecast by End-users, 2022-2032 (US$ million, AGR %)
Figure 91 Germany Genome editing technologies Market Share Forecast by End-users, 2022 & 2032 (%)
Figure 92 UK Genome editing technologies Market Forecast, 2022-2032 (US$ million, AGR %)
Figure 93 UK Genome editing technologies Market Forecast by Type, 2022-2032 (US$ million, AGR %)
Figure 94 UK Genome editing technologies Market Share Forecast by Type, 2022 & 2032 (%)
Figure 95 UK Genome editing technologies Market Forecast by Application, 2022-2032 (US$ million, AGR %)
Figure 96 UK Genome editing technologies Market Share Forecast by Application, 2022 & 2032 (%)
Figure 97 UK Genome editing technologies Market Forecast by End-users, 2022-2032 (US$ million, AGR %)
Figure 98 UK Genome editing technologies Market Share Forecast by End-users, 2022 & 2032 (%)
Figure 99 France Genome editing technologies Market Forecast, 2022-2032 (US$ million, AGR %)
Figure 100 France Genome editing technologies Market Forecast by Type, 2022-2032 (US$ million, AGR %)
Figure 101 France Genome editing technologies Market Share Forecast by Type, 2022 & 2032 (%)
Figure 102 France Genome editing technologies Market Forecast by Application, 2022-2032 (US$ million, AGR %)
Figure 103 France Genome editing technologies Market Share Forecast by Application, 2022 & 2032 (%)
Figure 104 France Genome editing technologies Market Forecast by End-users, 2022-2032 (US$ million, AGR %)
Figure 105 France Genome editing technologies Market Share Forecast by End-users, 2022 & 2032 (%)
Figure 106 Italy Genome editing technologies Market Forecast, 2022-2032 (US$ million, AGR %)
Figure 107 Italy Genome editing technologies Market Forecast by Type, 2022-2032 (US$ million, AGR %)
Figure 108 Italy Genome editing technologies Market Share Forecast by Type, 2022 & 2032 (%)
Figure 109 Italy Genome editing technologies Market Forecast by Application, 2022-2032 (US$ million, AGR %)
Figure 110 Italy Genome editing technologies Market Share Forecast by Application, 2022 & 2032 (%)
Figure 111 Italy Genome editing technologies Market Forecast by End-users, 2022-2032 (US$ million, AGR %)
Figure 112 Italy Genome editing technologies Market Share Forecast by End-users, 2022 & 2032 (%)
Figure 113 Spain Genome editing technologies Market Forecast, 2022-2032 (US$ million, AGR %)
Figure 114 Spain Genome editing technologies Market Forecast by Type, 2022-2032 (US$ million, AGR %)
Figure 115 Spain Genome editing technologies Market Share Forecast by Type, 2022 & 2032 (%)
Figure 116 Spain Genome editing technologies Market Forecast by Application, 2022-2032 (US$ million, AGR %)
Figure 117 Spain Genome editing technologies Market Share Forecast by Application, 2022 & 2032 (%)
Figure 118 Spain Genome editing technologies Market Forecast by End-users, 2022-2032 (US$ million, AGR %)
Figure 119 Spain Genome editing technologies Market Share Forecast by End-users, 2022 & 2032 (%)
Figure 120 Russia Genome editing technologies Market Forecast, 2022-2032 (US$ million, AGR %)
Figure 121 Russia Genome editing technologies Market Forecast by Type, 2022-2032 (US$ million, AGR %)
Figure 122 Russia Genome editing technologies Market Share Forecast by Type, 2022 & 2032 (%)
Figure 123 Russia Genome editing technologies Market Forecast by Application, 2022-2032 (US$ million, AGR %)
Figure 124 Russia Genome editing technologies Market Share Forecast by Application, 2022 & 2032 (%)
Figure 125 Russia Genome editing technologies Market Forecast by End-users, 2022-2032 (US$ million, AGR %)
Figure 126 Russia Genome editing technologies Market Share Forecast by End-users, 2022 & 2032 (%)
Figure 127 Rest of Europe Genome editing technologies Market Forecast, 2022-2032 (US$ million, AGR %)
Figure 128 Rest of Europe Genome editing technologies Market Forecast by Type, 2022-2032 (US$ million, AGR %)
Figure 129 Rest of Europe Genome editing technologies Market Share Forecast by Type, 2022 & 2032 (%)
Figure 130 Rest of Europe Genome editing technologies Market Forecast by Application, 2022-2032 (US$ million, AGR %)
Figure 131 Rest of Europe Genome editing technologies Market Share Forecast by Application, 2022 & 2032 (%)
Figure 132 Rest of Europe Genome editing technologies Market Forecast by End-users, 2022-2032 (US$ million, AGR %)
Figure 133 Rest of Europe Genome editing technologies Market Share Forecast by End-users, 2022 & 2032 (%)
Figure 134 Asia Pacific Genome editing technologies Market Attractiveness Index
Figure 135 Asia Pacific Genome editing technologies Market by Region, 2022, 2027 & 2032 (US$ million)
Figure 136 Asia Pacific Genome editing technologies Market Forecast by Country, 2022-2032 (US$ million, AGR %)
Figure 137 Asia Pacific Genome editing technologies Market Share Forecast by Country, 2022 & 2032 (%)
Figure 138 Asia Pacific Genome editing technologies Market Forecast by Type, 2022-2032 (US$ million, AGR %)
Figure 139 Asia Pacific Genome editing technologies Market Share Forecast by Type, 2022 & 2032 (%)
Figure 140 Asia Pacific Genome editing technologies Market Forecast by Application, 2022-2032 (US$ million, AGR %)
Figure 141 Asia Pacific Genome editing technologies Market Share Forecast by Application, 2022 & 2032 (%)
Figure 142 Asia Pacific Genome editing technologies Market Forecast by End-users, 2022-2032 (US$ million, AGR %)
Figure 143 Asia Pacific Genome editing technologies Market Share Forecast by End-users, 2022 & 2032 (%)
Figure 144 China Genome editing technologies Market Forecast, 2022-2032 (US$ million, AGR %)
Figure 145 China Genome editing technologies Market Forecast by Type, 2022-2032 (US$ million, AGR %)
Figure 146 China Genome editing technologies Market Share Forecast by Type, 2022 & 2032 (%)
Figure 147 China Genome editing technologies Market Forecast by Application, 2022-2032 (US$ million, AGR %)
Figure 148 China Genome editing technologies Market Share Forecast by Application, 2022 & 2032 (%)
Figure 149 China Genome editing technologies Market Forecast by End-users, 2022-2032 (US$ million, AGR %)
Figure 150 China Genome editing technologies Market Share Forecast by End-users, 2022 & 2032 (%)
Figure 151 Japan Genome editing technologies Market Forecast, 2022-2032 (US$ million, AGR %)
Figure 152 Japan Genome editing technologies Market Forecast by Type, 2022-2032 (US$ million, AGR %)
Figure 153 Japan Genome editing technologies Market Share Forecast by Type, 2022 & 2032 (%)
Figure 154 Japan Genome editing technologies Market Forecast by Application, 2022-2032 (US$ million, AGR %)
Figure 155 Japan Genome editing technologies Market Share Forecast by Application, 2022 & 2032 (%)
Figure 156 Japan Genome editing technologies Market Forecast by End-users, 2022-2032 (US$ million, AGR %)
Figure 157 Japan Genome editing technologies Market Share Forecast by End-users, 2022 & 2032 (%)
Figure 158 India Genome editing technologies Market Forecast, 2022-2032 (US$ million, AGR %)
Figure 159 India Genome editing technologies Market Forecast by Type, 2022-2032 (US$ million, AGR %)
Figure 160 India Genome editing technologies Market Share Forecast by Type, 2022 & 2032 (%)
Figure 161 India Genome editing technologies Market Forecast by Application, 2022-2032 (US$ million, AGR %)
Figure 162 India Genome editing technologies Market Share Forecast by Application, 2022 & 2032 (%)
Figure 163 India Genome editing technologies Market Forecast by End-users, 2022-2032 (US$ million, AGR %)
Figure 164 India Genome editing technologies Market Share Forecast by End-users, 2022 & 2032 (%)
Figure 165 Philippines Genome editing technologies Market Forecast, 2022-2032 (US$ million, AGR %)
Figure 166 Philippines Genome editing technologies Market Forecast by Type, 2022-2032 (US$ million, AGR %)
Figure 167 Philippines Genome editing technologies Market Share Forecast by Type, 2022 & 2032 (%)
Figure 168 Philippines Genome editing technologies Market Forecast by Application, 2022-2032 (US$ million, AGR %)
Figure 169 Philippines Genome editing technologies Market Share Forecast by Application, 2022 & 2032 (%)
Figure 170 Philippines Genome editing technologies Market Forecast by End-users, 2022-2032 (US$ million, AGR %)
Figure 171 Philippines Genome editing technologies Market Share Forecast by End-users, 2022 & 2032 (%)
Figure 172 South Korea Genome editing technologies Market Forecast, 2022-2032 (US$ million, AGR %)
Figure 173 South Korea Genome editing technologies Market Forecast by Type, 2022-2032 (US$ million, AGR %)
Figure 174 South Korea Genome editing technologies Market Share Forecast by Type, 2022 & 2032 (%)
Figure 175 South Korea Genome editing technologies Market Forecast by Application, 2022-2032 (US$ million, AGR %)
Figure 176 South Korea Genome editing technologies Market Share Forecast by Application, 2022 & 2032 (%)
Figure 177 South Korea Genome editing technologies Market Forecast by End-users, 2022-2032 (US$ million, AGR %)
Figure 178 South Korea Genome editing technologies Market Share Forecast by End-users, 2022 & 2032 (%)
Figure 179 Rest of Asia Pacific Genome editing technologies Market Forecast, 2022-2032 (US$ million, AGR %)
Figure 180 Rest of Asia Pacific Genome editing technologies Market Forecast by Type, 2022-2032 (US$ million, AGR %)
Figure 181 Rest of Asia Pacific Genome editing technologies Market Share Forecast by Type, 2022 & 2032 (%)
Figure 182 Rest of Asia Pacific Genome editing technologies Market Forecast by Application, 2022-2032 (US$ million, AGR %)
Figure 183 Rest of Asia Pacific Genome editing technologies Market Share Forecast by Application, 2022 & 2032 (%)
Figure 184 Rest of Asia Pacific Genome editing technologies Market Forecast by End-users, 2022-2032 (US$ million, AGR %)
Figure 185 Rest of Asia Pacific Genome editing technologies Market Share Forecast by End-users, 2022 & 2032 (%)
Figure 186 Latin America Genome editing technologies Market Attractiveness Index
Figure 187 Latin America Genome editing technologies Market by Region, 2022, 2027 & 2032 (US$ million)
Figure 188 Latin America Genome editing technologies Market Forecast by Country, 2022-2032 (US$ million, AGR %)
Figure 189 Latin America Genome editing technologies Market Share Forecast by Country, 2022 & 2032 (%)
Figure 190 Latin America Genome editing technologies Market Forecast by Type, 2022-2032 (US$ million, AGR %)
Figure 191 Latin America Genome editing technologies Market Share Forecast by Type, 2022 & 2032 (%)
Figure 192 Latin America Genome editing technologies Market Forecast by Application, 2022-2032 (US$ million, AGR %)
Figure 193 Latin America Genome editing technologies Market Share Forecast by Application, 2022 & 2032 (%)
Figure 194 Latin America Genome editing technologies Market Forecast by End-users, 2022-2032 (US$ million, AGR %)
Figure 195 Latin America Genome editing technologies Market Share Forecast by End-users, 2022 & 2032 (%)
Figure 196 Brazil Genome editing technologies Market Forecast, 2022-2032 (US$ million, AGR %)
Figure 197 Brazil Genome editing technologies Market Forecast by Type, 2022-2032 (US$ million, AGR %)
Figure 198 Brazil Genome editing technologies Market Share Forecast by Type, 2022 & 2032 (%)
Figure 199 Brazil Genome editing technologies Market Forecast by Application, 2022-2032 (US$ million, AGR %)
Figure 200 Brazil Genome editing technologies Market Share Forecast by Application, 2022 & 2032 (%)
Figure 201 Brazil Genome editing technologies Market Forecast by End-users, 2022-2032 (US$ million, AGR %)
Figure 202 Brazil Genome editing technologies Market Share Forecast by End-users, 2022 & 2032 (%)
Figure 203 Argentina Genome editing technologies Market Forecast, 2022-2032 (US$ million, AGR %)
Figure 204 Argentina Genome editing technologies Market Forecast by Type, 2022-2032 (US$ million, AGR %)
Figure 205 Argentina Genome editing technologies Market Share Forecast by Type, 2022 & 2032 (%)
Figure 206 Argentina Genome editing technologies Market Forecast by Application, 2022-2032 (US$ million, AGR %)
Figure 207 Argentina Genome editing technologies Market Share Forecast by Application, 2022 & 2032 (%)
Figure 208 Argentina Genome editing technologies Market Forecast by End-users, 2022-2032 (US$ million, AGR %)
Figure 209 Argentina Genome editing technologies Market Share Forecast by End-users, 2022 & 2032 (%)
Figure 210 Rest of Latin America Genome editing technologies Market Forecast, 2022-2032 (US$ million, AGR %)
Figure 211 Rest of Latin America Genome editing technologies Market Forecast by Type, 2022-2032 (US$ million, AGR %)
Figure 212 Rest of Latin America Genome editing technologies Market Share Forecast by Type, 2022 & 2032 (%)
Figure 213 Rest of Latin America Genome editing technologies Market Forecast by Application, 2022-2032 (US$ million, AGR %)
Figure 214 Rest of Latin America Genome editing technologies Market Share Forecast by Application, 2022 & 2032 (%)
Figure 215 Rest of Latin America Genome editing technologies Market Forecast by End-users, 2022-2032 (US$ million, AGR %)
Figure 216 Rest of Latin America Genome editing technologies Market Share Forecast by End-users, 2022 & 2032 (%)
Figure 217 Middle East & Africa Genome editing technologies Market Attractiveness Index
Figure 218 Middle East & Africa Genome editing technologies Market by Region, 2022, 2027 & 2032 (US$ million)
Figure 219 Middle East & Africa Genome editing technologies Market Forecast by Country, 2022-2032 (US$ million, AGR %)
Figure 220 Middle East & Africa Genome editing technologies Market Share Forecast by Country, 2022 & 2032 (%)
Figure 221 Middle East & Africa Genome editing technologies Market Forecast by Type, 2022-2032 (US$ million, AGR %)
Figure 222 Middle East & Africa Genome editing technologies Market Share Forecast by Type, 2022 & 2032 (%)
Figure 223 Middle East & Africa Genome editing technologies Market Forecast by Application, 2022-2032 (US$ million, AGR %)
Figure 224 Middle East & Africa Genome editing technologies Market Share Forecast by Application, 2022 & 2032 (%)
Figure 225 Middle East & Africa Genome editing technologies Market Forecast by End-users, 2022-2032 (US$ million, AGR %)
Figure 226 Middle East & Africa Genome editing technologies Market Share Forecast by End-users, 2022 & 2032 (%)
Figure 227 GCC Genome editing technologies Market Forecast, 2022-2032 (US$ million, AGR %)
Figure 228 GCC Genome editing technologies Market Forecast by Type, 2022-2032 (US$ million, AGR %)
Figure 229 GCC Genome editing technologies Market Share Forecast by Type, 2022 & 2032 (%)
Figure 230 GCC Genome editing technologies Market Forecast by Application, 2022-2032 (US$ million, AGR %)
Figure 231 GCC Genome editing technologies Market Share Forecast by Application, 2022 & 2032 (%)
Figure 232 GCC Genome editing technologies Market Forecast by End-users, 2022-2032 (US$ million, AGR %)
Figure 233 GCC Genome editing technologies Market Share Forecast by End-users, 2022 & 2032 (%)
Figure 234 South Africa Genome editing technologies Market Forecast, 2022-2032 (US$ million, AGR %)
Figure 235 South Africa Genome editing technologies Market Forecast by Type, 2022-2032 (US$ million, AGR %)
Figure 236 South Africa Genome editing technologies Market Share Forecast by Type, 2022 & 2032 (%)
Figure 237 South Africa Genome editing technologies Market Forecast by Application, 2022-2032 (US$ million, AGR %)
Figure 238 South Africa Genome editing technologies Market Share Forecast by Application, 2022 & 2032 (%)
Figure 239 South Africa Genome editing technologies Market Forecast by End-users, 2022-2032 (US$ million, AGR %)
Figure 240 South Africa Genome editing technologies Market Share Forecast by End-users, 2022 & 2032 (%)
Figure 241 Rest of Middle East & Africa Genome editing technologies Market Forecast, 2022-2032 (US$ million, AGR %)
Figure 242 Rest of Middle East & Africa Genome editing technologies Market Forecast by Type, 2022-2032 (US$ million, AGR %)
Figure 243 Rest of Middle East & Africa Genome editing technologies Market Share Forecast by Type, 2022 & 2032 (%)
Figure 244 Rest of Middle East & Africa Genome editing technologies Market Forecast by Application, 2022-2032 (US$ million, AGR %)
Figure 245 Rest of Middle East & Africa Genome editing technologies Market Share Forecast by Application, 2022 & 2032 (%)
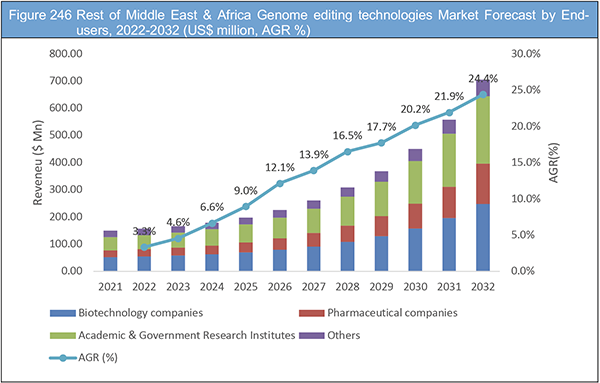
Figure 246 Rest of Middle East & Africa Genome editing technologies Market Forecast by End-users, 2022-2032 (US$ million, AGR %)
Figure 247 Rest of Middle East & Africa Genome editing technologies Market Share Forecast by End-users, 2022 & 2032 (%)
Figure 248 Thermo Fisher Scientific Inc.: Net Revenue, 2019-2021 (US$ Billion, AGR %)
Figure 249 Thermo Fisher Scientific Inc.: Regional Market Shares, 2021
Figure 250 Thermo Fisher Scientific Inc.: Gross Profit, 2019-2021 (US$ Billion, AGR %)
Figure 251 Thermo Fisher Scientific Inc.: R&D, 2019-2021 (US$ Billion, AGR %)
Figure 252 Merck KGaA: Net Revenue, 2019-2021 (US$ Billion, AGR %)
Figure 253 Merck KGaA: Regional Market Shares, 2021
Figure 254 Merck KGaA: Gross Profit, 2019-2021 (US$ Billion, AGR %)
Figure 255 Merck KGaA: R&D, 2019-2021 (US$ Billion, AGR %)
Figure 256 GenScript: Net Revenue, 2019-2021 (US$ Billion, AGR %)
Figure 257 GenScript: Regional Market Shares, 2021
Figure 258 GenScript: Gross Profit, 2019-2021 (US$ Billion, AGR %)
Figure 259 GenScript: R&D, 2019-2021 (US$ Billion, AGR %)
Figure 260 Sangamo Therapeutics Inc.: Net Revenue, 2019-2021 (US$ Billion, AGR %)
Figure 261 Sangamo Therapeutics Inc.: R&D, 2019-2021 (US$ Billion, AGR %)
Figure 262 Lonza: Net Revenue, 2019-2021 (US$ Billion, AGR %)
Figure 263 Lonza: Gross Profit, 2019-2021 (US$ Billion, AGR %)
Figure 264 Lonza: R&D, 2019-2021 (US$ Billion, AGR %)
Figure 265 Editas Medicine: Net Revenue, 2019-2021 (US$ Billion, AGR %)
Figure 266 Editas Medicine: Gross Profit, 2019-2021 (US$ Billion, AGR %)
Figure 267 Editas Medicine: R&D, 2019-2021 (US$ Billion, AGR %)
Figure 268 CRISPR Therapeutics AG: Net Revenue, 2019-2021 (US$ Billion, AGR %)
Figure 269 CRISPR Therapeutics AG: R&D, 2019-2021 (US$ Billion, AGR %)
Figure 270 Agilent Technologies Inc.: Net Revenue, 2019-2021 (US$ Billion, AGR %)
Figure 271 Agilent Technologies Inc.: Regional Market Shares, 2021
Figure 272 Agilent Technologies Inc.: Gross Profit, 2019-2021 (US$ Billion, AGR %)
Figure 273 Agilent Technologies Inc.: R&D, 2019-2021 (US$ Billion, AGR %)
Figure 274 Precision Biosciences: Net Revenue, 2019-2021 (US$ Billion, AGR %)
Figure 275 Precision Biosciences: R&D, 2019-2021 (US$ Billion, AGR %)
Figure 276 Tecan Life Sciences: Net Revenue, 2019-2021 (US$ Billion, AGR %)
Figure 277 Tecan Life Sciences: Regional Market Shares, 2021
Figure 278 Tecan Life Sciences: Gross Profit, 2019-2021 (US$ Billion, AGR %)
Figure 279 Tecan Life Sciences: R&D, 2019-2021 (US$ Billion, AGR %)
図の一覧
Table 1 Global Liposomal Drug Delivery Devices Market Snapshot, 2022 & 2032 (US$ million, CAGR %)
Table 2 Candidate Liposomal Vaccine Formulations
Table 3 List of Clinically Approved Nanomedicines for Cancer Treatment
Table 4 Global Liposomal Drug Delivery Devices Market Forecast by Type, 2022-2032 (US$ million, AGR%, CAGR%)
Table 5 Liposome-based Drugs on Market
Table 6 Liposome-based Drugs in Clinical Trails
Table 7 Global Liposomal Drug Delivery Devices Market Forecast for Liposomal Doxorubicin Segment, 2022-2032 (US$ Million, AGR%, CAGR%)
Table 8 Global Liposomal Drug Delivery Devices Market Forecast for Liposomal Doxorubicin Segment, 2022-2032 (US$ Million, AGR%, CAGR%): "V" Shaped Recovery
Table 9 Global Liposomal Drug Delivery Devices Market Forecast for Liposomal Doxorubicin Segment, 2022-2032 (US$ Million, AGR%, CAGR%): "U" Shaped Recovery
Table 10 Global Liposomal Drug Delivery Devices Market Forecast for Liposomal Doxorubicin Segment, 2022-2032 (US$ Million, AGR%, CAGR%): "W" Shaped Recovery
Table 11 Global Liposomal Drug Delivery Devices Market Forecast for Liposomal Doxorubicin Segment, 2022-2032 (US$ Million, AGR%, CAGR%): "L" Shaped Recovery
Table 12 Global Liposomal Drug Delivery Devices Market Forecast for Liposomal Paclitaxel Segment, 2022-2032 (US$ Million, AGR%, CAGR%)
Table 13 Global Liposomal Drug Delivery Devices Market Forecast for Liposomal Paclitaxel Segment, 2022-2032 (US$ Million, AGR%, CAGR%): "V" Shaped Recovery
Table 14 Global Liposomal Drug Delivery Devices Market Forecast for Liposomal Paclitaxel Segment, 2022-2032 (US$ Million, AGR%, CAGR%): "U" Shaped Recovery
Table 15 Global Liposomal Drug Delivery Devices Market Forecast for Liposomal Paclitaxel Segment, 2022-2032 (US$ Million, AGR%, CAGR%): "W" Shaped Recovery
Table 16 Global Liposomal Drug Delivery Devices Market Forecast for Liposomal Paclitaxel Segment, 2022-2032 (US$ Million, AGR%, CAGR%): "L" Shaped Recovery
Table 17 Global Liposomal Drug Delivery Devices Market Forecast for Liposomal Amphotericin B Segment, 2022-2032 (US$ Million, AGR%, CAGR%)
Table 18 Global Liposomal Drug Delivery Devices Market Forecast for Liposomal Amphotericin B Segment, 2022-2032 (US$ Million, AGR%, CAGR%): "V" Shaped Recovery
Table 19 Global Liposomal Drug Delivery Devices Market Forecast for Liposomal Amphotericin B Segment, 2022-2032 (US$ Million, AGR%, CAGR%): "U" Shaped Recovery
Table 20 Global Liposomal Drug Delivery Devices Market Forecast for Liposomal Amphotericin B Segment, 2022-2032 (US$ Million, AGR%, CAGR%): "W" Shaped Recovery
Table 21 Global Liposomal Drug Delivery Devices Market Forecast for Liposomal Amphotericin B Segment, 2022-2032 (US$ Million, AGR%, CAGR%): "L" Shaped Recovery
Table 22 Global Liposomal Drug Delivery Devices Market Forecast by Technology, 2022-2032 (US$ million, AGR%, CAGR%)
Table 23 Global Liposomal Drug Delivery Devices Market Forecast for Stealth Liposome Technology Segment, 2022-2032 (US$ Million, AGR%, CAGR%)
Table 24 Global Liposomal Drug Delivery Devices Market Forecast for Stealth Liposome Technology Segment, 2022-2032 (US$ Million, AGR%, CAGR%): "V" Shaped Recovery
Table 25 Global Liposomal Drug Delivery Devices Market Forecast for Stealth Liposome Technology Segment, 2022-2032 (US$ Million, AGR%, CAGR%): "U" Shaped Recovery
Table 26 Global Liposomal Drug Delivery Devices Market Forecast for Stealth Liposome Technology Segment, 2022-2032 (US$ Million, AGR%, CAGR%): "W" Shaped Recovery
Table 27 Global Liposomal Drug Delivery Devices Market Forecast for Stealth Liposome Technology Segment, 2022-2032 (US$ Million, AGR%, CAGR%): "L" Shaped Recovery
Table 28 Global Liposomal Drug Delivery Devices Market Forecast for Non-PEGylated Liposome Technology Segment, 2022-2032 (US$ Million, AGR%, CAGR%)
Table 29 Global Liposomal Drug Delivery Devices Market Forecast for Non-PEGylated Liposome Technology Segment, 2022-2032 (US$ Million, AGR%, CAGR%): "V" Shaped Recovery
Table 30 Global Liposomal Drug Delivery Devices Market Forecast for Non-PEGylated Liposome Technology Segment, 2022-2032 (US$ Million, AGR%, CAGR%): "U" Shaped Recovery
Table 31 Global Liposomal Drug Delivery Devices Market Forecast for Non-PEGylated Liposome Technology Segment, 2022-2032 (US$ Million, AGR%, CAGR%): "W" Shaped Recovery
Table 32 Global Liposomal Drug Delivery Devices Market Forecast for Non-PEGylated Liposome Technology Segment, 2022-2032 (US$ Million, AGR%, CAGR%): "L" Shaped Recovery
Table 33 Global Liposomal Drug Delivery Devices Market Forecast for DepoFoam Liposome Technology Segment, 2022-2032 (US$ Million, AGR%, CAGR%)
Table 34 Global Liposomal Drug Delivery Devices Market Forecast for DepoFoam Liposome Technology Segment, 2022-2032 (US$ Million, AGR%, CAGR%): "V" Shaped Recovery
Table 35 Global Liposomal Drug Delivery Devices Market Forecast for DepoFoam Liposome Technology Segment, 2022-2032 (US$ Million, AGR%, CAGR%): "U" Shaped Recovery
Table 36 Global Liposomal Drug Delivery Devices Market Forecast for DepoFoam Liposome Technology Segment, 2022-2032 (US$ Million, AGR%, CAGR%): "W" Shaped Recovery
Table 37 Global Liposomal Drug Delivery Devices Market Forecast for DepoFoam Liposome Technology Segment, 2022-2032 (US$ Million, AGR%, CAGR%): "L" Shaped Recovery
Table 38 Global Liposomal Drug Delivery Devices Market Forecast by Application, 2022-2032 (US$ million, AGR%, CAGR%)
Table 39 Global Liposomal Drug Delivery Devices Market Forecast for Fungal Diseases Segment, 2022-2032 (US$ Million, AGR%, CAGR%)
Table 40 Global Liposomal Drug Delivery Devices Market Forecast for Fungal Diseases Segment, 2022-2032 (US$ Million, AGR%, CAGR%): "V" Shaped Recovery
Table 41 Global Liposomal Drug Delivery Devices Market Forecast for Fungal Diseases Segment, 2022-2032 (US$ Million, AGR%, CAGR%): "U" Shaped Recovery
Table 42 Global Liposomal Drug Delivery Devices Market Forecast for Fungal Diseases Segment, 2022-2032 (US$ Million, AGR%, CAGR%): "W" Shaped Recovery
Table 43 Global Liposomal Drug Delivery Devices Market Forecast for Fungal Diseases Segment, 2022-2032 (US$ Million, AGR%, CAGR%): "L" Shaped Recovery
Table 44 FDA-approval drug products of injection delivery based on liposome technology (liposome, nanoparticle, nanosuspension, microemulsion, microsphere)
Table 45 Global Liposomal Drug Delivery Devices Market Forecast for Cancer Therapy Segment, 2022-2032 (US$ Million, AGR%, CAGR%)
Table 46 Global Liposomal Drug Delivery Devices Market Forecast for Cancer Therapy Segment, 2022-2032 (US$ Million, AGR%, CAGR%): "V" Shaped Recovery
Table 47 Global Liposomal Drug Delivery Devices Market Forecast for Cancer Therapy Segment, 2022-2032 (US$ Million, AGR%, CAGR%): "U" Shaped Recovery
Table 48 Global Liposomal Drug Delivery Devices Market Forecast for Cancer Therapy Segment, 2022-2032 (US$ Million, AGR%, CAGR%): "W" Shaped Recovery
Table 49 Global Liposomal Drug Delivery Devices Market Forecast for Cancer Therapy Segment, 2022-2032 (US$ Million, AGR%, CAGR%): "L" Shaped Recovery
Table 50 Global Liposomal Drug Delivery Devices Market Forecast for Pain Management Segment, 2022-2032 (US$ Million, AGR%, CAGR%)
Table 51 Global Liposomal Drug Delivery Devices Market Forecast for Pain Management Segment, 2022-2032 (US$ Million, AGR%, CAGR%): "V" Shaped Recovery
Table 52 Global Liposomal Drug Delivery Devices Market Forecast for Pain Management Segment, 2022-2032 (US$ Million, AGR%, CAGR%): "U" Shaped Recovery
Table 53 Global Liposomal Drug Delivery Devices Market Forecast for Pain Management Segment, 2022-2032 (US$ Million, AGR%, CAGR%): "W" Shaped Recovery
Table 54 Global Liposomal Drug Delivery Devices Market Forecast for Pain Management Segment, 2022-2032 (US$ Million, AGR%, CAGR%): "L" Shaped Recovery
Table 55 List of Pipeline Candidate Vaccine Formulations
Table 56 Global Liposomal Drug Delivery Devices Market Forecast for Viral Vaccines Segment, 2022-2032 (US$ Million, AGR%, CAGR%)
Table 57 Global Liposomal Drug Delivery Devices Market Forecast for Viral Vaccines Segment, 2022-2032 (US$ Million, AGR%, CAGR%): "V" Shaped Recovery
Table 58 Global Liposomal Drug Delivery Devices Market Forecast for Viral Vaccines Segment, 2022-2032 (US$ Million, AGR%, CAGR%): "U" Shaped Recovery
Table 59 Global Liposomal Drug Delivery Devices Market Forecast for Viral Vaccines Segment, 2022-2032 (US$ Million, AGR%, CAGR%): "W" Shaped Recovery
Table 60 Global Liposomal Drug Delivery Devices Market Forecast for Viral Vaccines Segment, 2022-2032 (US$ Million, AGR%, CAGR%): "L" Shaped Recovery
Table 61 Encapsulation of Photosensitizers (PSs) into Liposomes in Cancer PDT
Table 62 Global Liposomal Drug Delivery Devices Market Forecast for Photodynamic Therapy Segment, 2022-2032 (US$ Million, AGR%, CAGR%)
Table 63 Global Liposomal Drug Delivery Devices Market Forecast for Photodynamic Therapy Segment, 2022-2032 (US$ Million, AGR%, CAGR%): "V" Shaped Recovery
Table 64 Global Liposomal Drug Delivery Devices Market Forecast for Photodynamic Therapy Segment, 2022-2032 (US$ Million, AGR%, CAGR%): "U" Shaped Recovery
Table 65 Global Liposomal Drug Delivery Devices Market Forecast for Photodynamic Therapy Segment, 2022-2032 (US$ Million, AGR%, CAGR%): "W" Shaped Recovery
Table 66 Global Liposomal Drug Delivery Devices Market Forecast for Photodynamic Therapy Segment, 2022-2032 (US$ Million, AGR%, CAGR%): "L" Shaped Recovery
Table 67 Global Liposomal Drug Delivery Devices Market Forecast by End-User, 2022-2032 (US$ million, AGR%, CAGR%)
Table 68 Global Liposomal Drug Delivery Devices Market Forecast for Hospitals Segment, 2022-2032 (US$ Million, AGR%, CAGR%)
Table 69 Global Liposomal Drug Delivery Devices Market Forecast for Hospitals Segment, 2022-2032 (US$ Million, AGR%, CAGR%): "V" Shaped Recovery
Table 70 Global Liposomal Drug Delivery Devices Market Forecast for Hospitals Segment, 2022-2032 (US$ Million, AGR%, CAGR%): "U" Shaped Recovery
Table 71 Global Liposomal Drug Delivery Devices Market Forecast for Hospitals Segment, 2022-2032 (US$ Million, AGR%, CAGR%): "W" Shaped Recovery
Table 72 Global Liposomal Drug Delivery Devices Market Forecast for Hospitals Segment, 2022-2032 (US$ Million, AGR%, CAGR%): "L" Shaped Recovery
Table 73 Global Liposomal Drug Delivery Devices Market Forecast for Diagnostic Centers Segment, 2022-2032 (US$ Million, AGR%, CAGR%)
Table 74 Global Liposomal Drug Delivery Devices Market Forecast for Diagnostic Centers Segment, 2022-2032 (US$ Million, AGR%, CAGR%): "V" Shaped Recovery
Table 75 Global Liposomal Drug Delivery Devices Market Forecast for Diagnostic Centers Segment, 2022-2032 (US$ Million, AGR%, CAGR%): "U" Shaped Recovery
Table 76 Global Liposomal Drug Delivery Devices Market Forecast for Diagnostic Centers Segment, 2022-2032 (US$ Million, AGR%, CAGR%): "W" Shaped Recovery
Table 77 Global Liposomal Drug Delivery Devices Market Forecast for Diagnostic Centers Segment, 2022-2032 (US$ Million, AGR%, CAGR%): "L" Shaped Recovery
Table 78 Global Liposomal Drug Delivery Devices Market Forecast for Ambulatory Surgery Centers/Clinics Segment, 2022-2032 (US$ Million, AGR%, CAGR%)
Table 79 Global Liposomal Drug Delivery Devices Market Forecast for Ambulatory Surgery Centers/Clinics Segment, 2022-2032 (US$ Million, AGR%, CAGR%): "V" Shaped Recovery
Table 80 Global Liposomal Drug Delivery Devices Market Forecast for Ambulatory Surgery Centers/Clinics Segment, 2022-2032 (US$ Million, AGR%, CAGR%): "U" Shaped Recovery
Table 81 Global Liposomal Drug Delivery Devices Market Forecast for Ambulatory Surgery Centers/Clinics Segment, 2022-2032 (US$ Million, AGR%, CAGR%): "W" Shaped Recovery
Table 82 Global Liposomal Drug Delivery Devices Market Forecast for Ambulatory Surgery Centers/Clinics Segment, 2022-2032 (US$ Million, AGR%, CAGR%): "L" Shaped Recovery
Table 83 Global Liposomal Drug Delivery Devices Market Forecast by Region, 2022-2032 (US$ million, AGR%, CAGR%)
Table 84 Global Liposomal Drug Delivery Devices Market Forecast by Region, 2022-2032 (US$ Million, AGR%, CAGR%): "V" Shaped Recovery
Table 85 Global Liposomal Drug Delivery Devices Market Forecast by Region, 2022-2032 (US$ Million, AGR%, CAGR%): "U" Shaped Recovery
Table 86 Global Liposomal Drug Delivery Devices Market Forecast by Region, 2022-2032 (US$ Million, AGR%, CAGR%): "W" Shaped Recovery
Table 87 Global Liposomal Drug Delivery Devices Market Forecast by Region, 2022-2032 (US$ Million, AGR%, CAGR%): "L" Shaped Recovery
Table 88 North America Liposomal Drug Delivery Devices Market Forecast by Country, 2022-2032 (US$ million, AGR%, CAGR%)
Table 89 North America Liposomal Drug Delivery Devices Market Forecast by Type, 2022-2032 (US$ million, AGR%, CAGR%)
Table 90 North America Liposomal Drug Delivery Devices Market Forecast by Type, 2022-2032 (US$ Million, AGR%, CAGR%): "V" Shaped Recovery
Table 91 North America Liposomal Drug Delivery Devices Market Forecast by Type, 2022-2032 (US$ Million, AGR%, CAGR%): "U" Shaped Recovery
Table 92 North America Liposomal Drug Delivery Devices Market Forecast by Type, 2022-2032 (US$ Million, AGR%, CAGR%): "W" Shaped Recovery
Table 93 North America Liposomal Drug Delivery Devices Market Forecast by Type, 2022-2032 (US$ Million, AGR%, CAGR%): "L" Shaped Recovery
Table 94 North America Liposomal Drug Delivery Devices Market Forecast by Technology, 2022-2032 (US$ million, AGR%, CAGR%)
Table 95 North America Liposomal Drug Delivery Devices Market Forecast by Technology, 2022-2032 (US$ Million, AGR%, CAGR%): "V" Shaped Recovery
Table 96 North America Liposomal Drug Delivery Devices Market Forecast by Technology, 2022-2032 (US$ Million, AGR%, CAGR%): "U" Shaped Recovery
Table 97 North America Liposomal Drug Delivery Devices Market Forecast by Technology, 2022-2032 (US$ Million, AGR%, CAGR%): "W" Shaped Recovery
Table 98 North America Liposomal Drug Delivery Devices Market Forecast by Technology, 2022-2032 (US$ Million, AGR%, CAGR%): "L" Shaped Recovery
Table 99 North America Liposomal Drug Delivery Devices Market Forecast by Application, 2022-2032 (US$ million, AGR%, CAGR%)
Table 100 North America Liposomal Drug Delivery Devices Market Forecast by Application, 2022-2032 (US$ Million, AGR%, CAGR%): "V" Shaped Recovery
Table 101 North America Liposomal Drug Delivery Devices Market Forecast by Application, 2022-2032 (US$ Million, AGR%, CAGR%): "U" Shaped Recovery
Table 102 North America Liposomal Drug Delivery Devices Market Forecast by Application, 2022-2032 (US$ Million, AGR%, CAGR%): "W" Shaped Recovery
Table 103 North America Liposomal Drug Delivery Devices Market Forecast by Application, 2022-2032 (US$ Million, AGR%, CAGR%): "L" Shaped Recovery
Table 104 North America Liposomal Drug Delivery Devices Market Forecast by End-User, 2022-2032 (US$ million, AGR%, CAGR%)
Table 105 North America Liposomal Drug Delivery Devices Market Forecast by End-User, 2022-2032 (US$ Million, AGR%, CAGR%): "V" Shaped Recovery
Table 106 North America Liposomal Drug Delivery Devices Market Forecast by End-User, 2022-2032 (US$ Million, AGR%, CAGR%): "U" Shaped Recovery
Table 107 North America Liposomal Drug Delivery Devices Market Forecast by End-User, 2022-2032 (US$ Million, AGR%, CAGR%): "W" Shaped Recovery
Table 108 North America Liposomal Drug Delivery Devices Market Forecast by End-User, 2022-2032 (US$ Million, AGR%, CAGR%): "L" Shaped Recovery
Table 109 U.S. Liposomal Drug Delivery Devices Market Forecast, 2022-2032 (US$ Million, AGR%, CAGR%)
Table 110 U.S. Liposomal Drug Delivery Devices Market Forecast, 2022-2032 (US$ Million, AGR%, CAGR%): "V" Shaped Recovery
Table 111 U.S. Liposomal Drug Delivery Devices Market Forecast, 2022-2032 (US$ Million, AGR%, CAGR%): "U" Shaped Recovery
Table 112 U.S. Liposomal Drug Delivery Devices Market Forecast, 2022-2032 (US$ Million, AGR%, CAGR%): "W" Shaped Recovery
Table 113 U.S. Liposomal Drug Delivery Devices Market Forecast, 2022-2032 (US$ Million, AGR%, CAGR%): "L" Shaped Recovery
Table 114 Canada Liposomal Drug Delivery Devices Market Forecast, 2022-2032 (US$ Million, AGR%, CAGR%)
Table 115 Canada Liposomal Drug Delivery Devices Market Forecast, 2022-2032 (US$ Million, AGR%, CAGR%): "V" Shaped Recovery
Table 116 Canada Liposomal Drug Delivery Devices Market Forecast, 2022-2032 (US$ Million, AGR%, CAGR%): "U" Shaped Recovery
Table 117 Canada Liposomal Drug Delivery Devices Market Forecast, 2022-2032 (US$ Million, AGR%, CAGR%): "W" Shaped Recovery
Table 118 Canada Liposomal Drug Delivery Devices Market Forecast, 2022-2032 (US$ Million, AGR%, CAGR%): "L" Shaped Recovery
Table 119 Europe Liposomal Drug Delivery Devices Market Forecast by Country, 2022-2032 (US$ million, AGR%, CAGR%)
Table 120 Europe Liposomal Drug Delivery Devices Market Forecast by Type, 2022-2032 (US$ million, AGR%, CAGR%)
Table 121 Europe Liposomal Drug Delivery Devices Market Forecast by Type, 2022-2032 (US$ Million, AGR%, CAGR%): "V" Shaped Recovery
Table 122 Europe Liposomal Drug Delivery Devices Market Forecast by Type, 2022-2032 (US$ Million, AGR%, CAGR%): "U" Shaped Recovery
Table 123 Europe Liposomal Drug Delivery Devices Market Forecast by Type, 2022-2032 (US$ Million, AGR%, CAGR%): "W" Shaped Recovery
Table 124 Europe Liposomal Drug Delivery Devices Market Forecast by Type, 2022-2032 (US$ Million, AGR%, CAGR%): "L" Shaped Recovery
Table 125 Europe Liposomal Drug Delivery Devices Market Forecast by Technology, 2022-2032 (US$ million, AGR%, CAGR%)
Table 126 Europe Liposomal Drug Delivery Devices Market Forecast by Technology, 2022-2032 (US$ Million, AGR%, CAGR%): "V" Shaped Recovery
Table 127 Europe Liposomal Drug Delivery Devices Market Forecast by Technology, 2022-2032 (US$ Million, AGR%, CAGR%): "U" Shaped Recovery
Table 128 Europe Liposomal Drug Delivery Devices Market Forecast by Technology, 2022-2032 (US$ Million, AGR%, CAGR%): "W" Shaped Recovery
Table 129 Europe Liposomal Drug Delivery Devices Market Forecast by Technology, 2022-2032 (US$ Million, AGR%, CAGR%): "L" Shaped Recovery
Table 130 Europe Liposomal Drug Delivery Devices Market Forecast by Application, 2022-2032 (US$ million, AGR%, CAGR%)
Table 131 Europe Liposomal Drug Delivery Devices Market Forecast by Application, 2022-2032 (US$ Million, AGR%, CAGR%): "V" Shaped Recovery
Table 132 Europe Liposomal Drug Delivery Devices Market Forecast by Application, 2022-2032 (US$ Million, AGR%, CAGR%): "U" Shaped Recovery
Table 133 Europe Liposomal Drug Delivery Devices Market Forecast by Application, 2022-2032 (US$ Million, AGR%, CAGR%): "W" Shaped Recovery
Table 134 Europe Liposomal Drug Delivery Devices Market Forecast by Application, 2022-2032 (US$ Million, AGR%, CAGR%): "L" Shaped Recovery
Table 135 Europe Liposomal Drug Delivery Devices Market Forecast by End-User, 2022-2032 (US$ million, AGR%, CAGR%)
Table 136 Europe Liposomal Drug Delivery Devices Market Forecast by End-User, 2022-2032 (US$ Million, AGR%, CAGR%): "V" Shaped Recovery
Table 137 Europe Liposomal Drug Delivery Devices Market Forecast by End-User, 2022-2032 (US$ Million, AGR%, CAGR%): "U" Shaped Recovery
Table 138 Europe Liposomal Drug Delivery Devices Market Forecast by End-User, 2022-2032 (US$ Million, AGR%, CAGR%): "W" Shaped Recovery
Table 139 Europe Liposomal Drug Delivery Devices Market Forecast by End-User, 2022-2032 (US$ Million, AGR%, CAGR%): "L" Shaped Recovery
Table 140 Germany Liposomal Drug Delivery Devices Market Forecast, 2022-2032 (US$ Million, AGR%, CAGR%)
Table 141 Germany Liposomal Drug Delivery Devices Market Forecast, 2022-2032 (US$ Million, AGR%, CAGR%): "V" Shaped Recovery
Table 142 Germany Liposomal Drug Delivery Devices Market Forecast, 2022-2032 (US$ Million, AGR%, CAGR%): "U" Shaped Recovery
Table 143 Germany Liposomal Drug Delivery Devices Market Forecast, 2022-2032 (US$ Million, AGR%, CAGR%): "W" Shaped Recovery
Table 144 Germany Liposomal Drug Delivery Devices Market Forecast, 2022-2032 (US$ Million, AGR%, CAGR%): "L" Shaped Recovery
Table 145 UK Liposomal Drug Delivery Devices Market Forecast, 2022-2032 (US$ Million, AGR%, CAGR%)
Table 146 UK Liposomal Drug Delivery Devices Market Forecast, 2022-2032 (US$ Million, AGR%, CAGR%): "V" Shaped Recovery
Table 147 UK Liposomal Drug Delivery Devices Market Forecast, 2022-2032 (US$ Million, AGR%, CAGR%): "U" Shaped Recovery
Table 148 UK Liposomal Drug Delivery Devices Market Forecast, 2022-2032 (US$ Million, AGR%, CAGR%): "W" Shaped Recovery
Table 149 UK Liposomal Drug Delivery Devices Market Forecast, 2022-2032 (US$ Million, AGR%, CAGR%): "L" Shaped Recovery
Table 150 France Liposomal Drug Delivery Devices Market Forecast, 2022-2032 (US$ Million, AGR%, CAGR%)
Table 151 France Liposomal Drug Delivery Devices Market Forecast, 2022-2032 (US$ Million, AGR%, CAGR%): "V" Shaped Recovery
Table 152 France Liposomal Drug Delivery Devices Market Forecast, 2022-2032 (US$ Million, AGR%, CAGR%): "U" Shaped Recovery
Table 153 France Liposomal Drug Delivery Devices Market Forecast, 2022-2032 (US$ Million, AGR%, CAGR%): "W" Shaped Recovery
Table 154 France Liposomal Drug Delivery Devices Market Forecast, 2022-2032 (US$ Million, AGR%, CAGR%): "L" Shaped Recovery
Table 155 Italy Liposomal Drug Delivery Devices Market Forecast, 2022-2032 (US$ Million, AGR%, CAGR%)
Table 156 Italy Liposomal Drug Delivery Devices Market Forecast, 2022-2032 (US$ Million, AGR%, CAGR%): "V" Shaped Recovery
Table 157 Italy Liposomal Drug Delivery Devices Market Forecast, 2022-2032 (US$ Million, AGR%, CAGR%): "U" Shaped Recovery
Table 158 Italy Liposomal Drug Delivery Devices Market Forecast, 2022-2032 (US$ Million, AGR%, CAGR%): "W" Shaped Recovery
Table 159 Italy Liposomal Drug Delivery Devices Market Forecast, 2022-2032 (US$ Million, AGR%, CAGR%): "L" Shaped Recovery
Table 160 Spain Liposomal Drug Delivery Devices Market Forecast, 2022-2032 (US$ Million, AGR%, CAGR%)
Table 161 Spain Liposomal Drug Delivery Devices Market Forecast, 2022-2032 (US$ Million, AGR%, CAGR%): "V" Shaped Recovery
Table 162 Spain Liposomal Drug Delivery Devices Market Forecast, 2022-2032 (US$ Million, AGR%, CAGR%): "U" Shaped Recovery
Table 163 Spain Liposomal Drug Delivery Devices Market Forecast, 2022-2032 (US$ Million, AGR%, CAGR%): "W" Shaped Recovery
Table 164 Spain Liposomal Drug Delivery Devices Market Forecast, 2022-2032 (US$ Million, AGR%, CAGR%): "L" Shaped Recovery
Table 165 Russia Liposomal Drug Delivery Devices Market Forecast, 2022-2032 (US$ Million, AGR%, CAGR%)
Table 166 Russia Liposomal Drug Delivery Devices Market Forecast, 2022-2032 (US$ Million, AGR%, CAGR%): "V" Shaped Recovery
Table 167 Russia Liposomal Drug Delivery Devices Market Forecast, 2022-2032 (US$ Million, AGR%, CAGR%): "U" Shaped Recovery
Table 168 Russia Liposomal Drug Delivery Devices Market Forecast, 2022-2032 (US$ Million, AGR%, CAGR%): "W" Shaped Recovery
Table 169 Russia Liposomal Drug Delivery Devices Market Forecast, 2022-2032 (US$ Million, AGR%, CAGR%): "L" Shaped Recovery
Table 170 Rest of Europe Liposomal Drug Delivery Devices Market Forecast, 2022-2032 (US$ Million, AGR%, CAGR%)
Table 171 Rest of Europe Liposomal Drug Delivery Devices Market Forecast, 2022-2032 (US$ Million, AGR%, CAGR%): "V" Shaped Recovery
Table 172 Rest of Europe Liposomal Drug Delivery Devices Market Forecast, 2022-2032 (US$ Million, AGR%, CAGR%): "U" Shaped Recovery
Table 173 Rest of Europe Liposomal Drug Delivery Devices Market Forecast, 2022-2032 (US$ Million, AGR%, CAGR%): "W" Shaped Recovery
Table 174 Rest of Europe Liposomal Drug Delivery Devices Market Forecast, 2022-2032 (US$ Million, AGR%, CAGR%): "L" Shaped Recovery
Table 175 Asia Pacific Liposomal Drug Delivery Devices Market Forecast by Country, 2022-2032 (US$ million, AGR%, CAGR%)
Table 176 Asia Pacific Liposomal Drug Delivery Devices Market Forecast by Type, 2022-2032 (US$ million, AGR%, CAGR%)
Table 177 Asia Pacific Liposomal Drug Delivery Devices Market Forecast by Type, 2022-2032 (US$ Million, AGR%, CAGR%): "V" Shaped Recovery
Table 178 Asia Pacific Liposomal Drug Delivery Devices Market Forecast by Type, 2022-2032 (US$ Million, AGR%, CAGR%): "U" Shaped Recovery
Table 179 Asia Pacific Liposomal Drug Delivery Devices Market Forecast by Type, 2022-2032 (US$ Million, AGR%, CAGR%): "W" Shaped Recovery
Table 180 Asia Pacific Liposomal Drug Delivery Devices Market Forecast by Type, 2022-2032 (US$ Million, AGR%, CAGR%): "L" Shaped Recovery
Table 181 Asia Pacific Liposomal Drug Delivery Devices Market Forecast by Technology, 2022-2032 (US$ million, AGR%, CAGR%)
Table 182 Asia Pacific Liposomal Drug Delivery Devices Market Forecast by Technology, 2022-2032 (US$ Million, AGR%, CAGR%): "V" Shaped Recovery
Table 183 Asia Pacific Liposomal Drug Delivery Devices Market Forecast by Technology, 2022-2032 (US$ Million, AGR%, CAGR%): "U" Shaped Recovery
Table 184 Asia Pacific Liposomal Drug Delivery Devices Market Forecast by Technology, 2022-2032 (US$ Million, AGR%, CAGR%): "W" Shaped Recovery
Table 185 Asia Pacific Liposomal Drug Delivery Devices Market Forecast by Technology, 2022-2032 (US$ Million, AGR%, CAGR%): "L" Shaped Recovery
Table 186 Asia Pacific Liposomal Drug Delivery Devices Market Forecast by Application, 2022-2032 (US$ million, AGR%, CAGR%)
Table 187 Asia Pacific Liposomal Drug Delivery Devices Market Forecast by Application, 2022-2032 (US$ Million, AGR%, CAGR%): "V" Shaped Recovery
Table 188 Asia Pacific Liposomal Drug Delivery Devices Market Forecast by Application, 2022-2032 (US$ Million, AGR%, CAGR%): "U" Shaped Recovery
Table 189 Asia Pacific Liposomal Drug Delivery Devices Market Forecast by Application, 2022-2032 (US$ Million, AGR%, CAGR%): "W" Shaped Recovery
Table 190 Asia Pacific Liposomal Drug Delivery Devices Market Forecast by Application, 2022-2032 (US$ Million, AGR%, CAGR%): "L" Shaped Recovery
Table 191 Asia Pacific Liposomal Drug Delivery Devices Market Forecast by End-User, 2022-2032 (US$ million, AGR%, CAGR%)
Table 192 Asia Pacific Liposomal Drug Delivery Devices Market Forecast by End-User, 2022-2032 (US$ Million, AGR%, CAGR%): "V" Shaped Recovery
Table 193 Asia Pacific Liposomal Drug Delivery Devices Market Forecast by End-User, 2022-2032 (US$ Million, AGR%, CAGR%): "U" Shaped Recovery
Table 194 Asia Pacific Liposomal Drug Delivery Devices Market Forecast by End-User, 2022-2032 (US$ Million, AGR%, CAGR%): "W" Shaped Recovery
Table 195 Asia Pacific Liposomal Drug Delivery Devices Market Forecast by End-User, 2022-2032 (US$ Million, AGR%, CAGR%): "L" Shaped Recovery
Table 196 Japan Liposomal Drug Delivery Devices Market Forecast, 2022-2032 (US$ Million, AGR%, CAGR%)
Table 197 Japan Liposomal Drug Delivery Devices Market Forecast, 2022-2032 (US$ Million, AGR%, CAGR%): "V" Shaped Recovery
Table 198 Japan Liposomal Drug Delivery Devices Market Forecast, 2022-2032 (US$ Million, AGR%, CAGR%): "U" Shaped Recovery
Table 199 Japan Liposomal Drug Delivery Devices Market Forecast, 2022-2032 (US$ Million, AGR%, CAGR%): "W" Shaped Recovery
Table 200 Japan Liposomal Drug Delivery Devices Market Forecast, 2022-2032 (US$ Million, AGR%, CAGR%): "L" Shaped Recovery
Table 201 China Liposomal Drug Delivery Devices Market Forecast, 2022-2032 (US$ Million, AGR%, CAGR%)
Table 202 China Liposomal Drug Delivery Devices Market Forecast, 2022-2032 (US$ Million, AGR%, CAGR%): "V" Shaped Recovery
Table 203 China Liposomal Drug Delivery Devices Market Forecast, 2022-2032 (US$ Million, AGR%, CAGR%): "U" Shaped Recovery
Table 204 China Liposomal Drug Delivery Devices Market Forecast, 2022-2032 (US$ Million, AGR%, CAGR%): "W" Shaped Recovery
Table 205 China Liposomal Drug Delivery Devices Market Forecast, 2022-2032 (US$ Million, AGR%, CAGR%): "L" Shaped Recovery
Table 206 India Liposomal Drug Delivery Devices Market Forecast, 2022-2032 (US$ Million, AGR%, CAGR%)
Table 207 India Liposomal Drug Delivery Devices Market Forecast, 2022-2032 (US$ Million, AGR%, CAGR%): "V" Shaped Recovery
Table 208 India Liposomal Drug Delivery Devices Market Forecast, 2022-2032 (US$ Million, AGR%, CAGR%): "U" Shaped Recovery
Table 209 India Liposomal Drug Delivery Devices Market Forecast, 2022-2032 (US$ Million, AGR%, CAGR%): "W" Shaped Recovery
Table 210 India Liposomal Drug Delivery Devices Market Forecast, 2022-2032 (US$ Million, AGR%, CAGR%): "L" Shaped Recovery
Table 211 Australia Liposomal Drug Delivery Devices Market Forecast, 2022-2032 (US$ Million, AGR%, CAGR%)
Table 212 Australia Liposomal Drug Delivery Devices Market Forecast, 2022-2032 (US$ Million, AGR%, CAGR%): "V" Shaped Recovery
Table 213 Australia Liposomal Drug Delivery Devices Market Forecast, 2022-2032 (US$ Million, AGR%, CAGR%): "U" Shaped Recovery
Table 214 Australia Liposomal Drug Delivery Devices Market Forecast, 2022-2032 (US$ Million, AGR%, CAGR%): "W" Shaped Recovery
Table 215 Australia Liposomal Drug Delivery Devices Market Forecast, 2022-2032 (US$ Million, AGR%, CAGR%): "L" Shaped Recovery
Table 216 South Korea Liposomal Drug Delivery Devices Market Forecast, 2022-2032 (US$ Million, AGR%, CAGR%)
Table 217 South Korea Liposomal Drug Delivery Devices Market Forecast, 2022-2032 (US$ Million, AGR%, CAGR%): "V" Shaped Recovery
Table 218 South Korea Liposomal Drug Delivery Devices Market Forecast, 2022-2032 (US$ Million, AGR%, CAGR%): "U" Shaped Recovery
Table 219 South Korea Liposomal Drug Delivery Devices Market Forecast, 2022-2032 (US$ Million, AGR%, CAGR%): "W" Shaped Recovery
Table 220 South Korea Liposomal Drug Delivery Devices Market Forecast, 2022-2032 (US$ Million, AGR%, CAGR%): "L" Shaped Recovery
Table 221 Rest of Asia Pacific Liposomal Drug Delivery Devices Market Forecast, 2022-2032 (US$ Million, AGR%, CAGR%)
Table 222 Rest of Asia Pacific Liposomal Drug Delivery Devices Market Forecast, 2022-2032 (US$ Million, AGR%, CAGR%): "V" Shaped Recovery
Table 223 Rest of Asia Pacific Liposomal Drug Delivery Devices Market Forecast, 2022-2032 (US$ Million, AGR%, CAGR%): "U" Shaped Recovery
Table 224 Rest of Asia Pacific Liposomal Drug Delivery Devices Market Forecast, 2022-2032 (US$ Million, AGR%, CAGR%): "W" Shaped Recovery
Table 225 Rest of Asia Pacific Liposomal Drug Delivery Devices Market Forecast, 2022-2032 (US$ Million, AGR%, CAGR%): "L" Shaped Recovery
Table 226 Latin America Liposomal Drug Delivery Devices Market Forecast by Country, 2022-2032 (US$ million, AGR%, CAGR%)
Table 227 Latin America Liposomal Drug Delivery Devices Market Forecast by Type, 2022-2032 (US$ million, AGR%, CAGR%)
Table 228 Latin America Liposomal Drug Delivery Devices Market Forecast by Type, 2022-2032 (US$ Million, AGR%, CAGR%): "V" Shaped Recovery
Table 229 Latin America Liposomal Drug Delivery Devices Market Forecast by Type, 2022-2032 (US$ Million, AGR%, CAGR%): "U" Shaped Recovery
Table 230 Latin America Liposomal Drug Delivery Devices Market Forecast by Type, 2022-2032 (US$ Million, AGR%, CAGR%): "W" Shaped Recovery
Table 231 Latin America Liposomal Drug Delivery Devices Market Forecast by Type, 2022-2032 (US$ Million, AGR%, CAGR%): "L" Shaped Recovery
Table 232 Latin America Liposomal Drug Delivery Devices Market Forecast by Technology, 2022-2032 (US$ million, AGR%, CAGR%)
Table 233 Latin America Liposomal Drug Delivery Devices Market Forecast by Technology, 2022-2032 (US$ Million, AGR%, CAGR%): "V" Shaped Recovery
Table 234 Latin America Liposomal Drug Delivery Devices Market Forecast by Technology, 2022-2032 (US$ Million, AGR%, CAGR%): "U" Shaped Recovery
Table 235 Latin America Liposomal Drug Delivery Devices Market Forecast by Technology, 2022-2032 (US$ Million, AGR%, CAGR%): "W" Shaped Recovery
Table 236 Latin America Liposomal Drug Delivery Devices Market Forecast by Technology, 2022-2032 (US$ Million, AGR%, CAGR%): "L" Shaped Recovery
Table 237 Latin America Liposomal Drug Delivery Devices Market Forecast by Application, 2022-2032 (US$ million, AGR%, CAGR%)
Table 238 Latin America Liposomal Drug Delivery Devices Market Forecast by Application, 2022-2032 (US$ Million, AGR%, CAGR%): "V" Shaped Recovery
Table 239 Latin America Liposomal Drug Delivery Devices Market Forecast by Application, 2022-2032 (US$ Million, AGR%, CAGR%): "U" Shaped Recovery
Table 240 Latin America Liposomal Drug Delivery Devices Market Forecast by Application, 2022-2032 (US$ Million, AGR%, CAGR%): "W" Shaped Recovery
Table 241 Latin America Liposomal Drug Delivery Devices Market Forecast by Application, 2022-2032 (US$ Million, AGR%, CAGR%): "L" Shaped Recovery
Table 242 Latin America Liposomal Drug Delivery Devices Market Forecast by End-User, 2022-2032 (US$ million, AGR%, CAGR%)
Table 243 Latin America Liposomal Drug Delivery Devices Market Forecast by End-User, 2022-2032 (US$ Million, AGR%, CAGR%): "V" Shaped Recovery
Table 244 Latin America Liposomal Drug Delivery Devices Market Forecast by End-User, 2022-2032 (US$ Million, AGR%, CAGR%): "U" Shaped Recovery
Table 245 Latin America Liposomal Drug Delivery Devices Market Forecast by End-User, 2022-2032 (US$ Million, AGR%, CAGR%): "W" Shaped Recovery
Table 246 Latin America Liposomal Drug Delivery Devices Market Forecast by End-User, 2022-2032 (US$ Million, AGR%, CAGR%): "L" Shaped Recovery
Table 247 Brazil Liposomal Drug Delivery Devices Market Forecast, 2022-2032 (US$ Million, AGR%, CAGR%)
Table 248 Brazil Liposomal Drug Delivery Devices Market Forecast, 2022-2032 (US$ Million, AGR%, CAGR%): "V" Shaped Recovery
Table 249 Brazil Liposomal Drug Delivery Devices Market Forecast, 2022-2032 (US$ Million, AGR%, CAGR%): "U" Shaped Recovery
Table 250 Brazil Liposomal Drug Delivery Devices Market Forecast, 2022-2032 (US$ Million, AGR%, CAGR%): "W" Shaped Recovery
Table 251 Brazil Liposomal Drug Delivery Devices Market Forecast, 2022-2032 (US$ Million, AGR%, CAGR%): "L" Shaped Recovery
Table 252 Mexico Liposomal Drug Delivery Devices Market Forecast, 2022-2032 (US$ Million, AGR%, CAGR%)
Table 253 Mexico Liposomal Drug Delivery Devices Market Forecast, 2022-2032 (US$ Million, AGR%, CAGR%): "V" Shaped Recovery
Table 254 Mexico Liposomal Drug Delivery Devices Market Forecast, 2022-2032 (US$ Million, AGR%, CAGR%): "U" Shaped Recovery
Table 255 Mexico Liposomal Drug Delivery Devices Market Forecast, 2022-2032 (US$ Million, AGR%, CAGR%): "W" Shaped Recovery
Table 256 Mexico Liposomal Drug Delivery Devices Market Forecast, 2022-2032 (US$ Million, AGR%, CAGR%): "L" Shaped Recovery
Table 257 Rest of Latin America Liposomal Drug Delivery Devices Market Forecast, 2022-2032 (US$ Million, AGR%, CAGR%)
Table 258 Rest of Latin America Liposomal Drug Delivery Devices Market Forecast, 2022-2032 (US$ Million, AGR%, CAGR%): "V" Shaped Recovery
Table 259 Rest of Latin America Liposomal Drug Delivery Devices Market Forecast, 2022-2032 (US$ Million, AGR%, CAGR%): "U" Shaped Recovery
Table 260 Rest of Latin America Liposomal Drug Delivery Devices Market Forecast, 2022-2032 (US$ Million, AGR%, CAGR%): "W" Shaped Recovery
Table 261 Rest of Latin America Liposomal Drug Delivery Devices Market Forecast, 2022-2032 (US$ Million, AGR%, CAGR%): "L" Shaped Recovery
Table 262 MEA Liposomal Drug Delivery Devices Market Forecast by Country, 2022-2032 (US$ million, AGR%, CAGR%)
Table 263 MEA Liposomal Drug Delivery Devices Market Forecast by Type, 2022-2032 (US$ million, AGR%, CAGR%)
Table 264 MEA Liposomal Drug Delivery Devices Market Forecast by Type, 2022-2032 (US$ Million, AGR%, CAGR%): "V" Shaped Recovery
Table 265 MEA Liposomal Drug Delivery Devices Market Forecast by Type, 2022-2032 (US$ Million, AGR%, CAGR%): "U" Shaped Recovery
Table 266 MEA Liposomal Drug Delivery Devices Market Forecast by Type, 2022-2032 (US$ Million, AGR%, CAGR%): "W" Shaped Recovery
Table 267 MEA Liposomal Drug Delivery Devices Market Forecast by Type, 2022-2032 (US$ Million, AGR%, CAGR%): "L" Shaped Recovery
Table 268 MEA Liposomal Drug Delivery Devices Market Forecast by Technology, 2022-2032 (US$ million, AGR%, CAGR%)
Table 269 MEA Liposomal Drug Delivery Devices Market Forecast by Technology, 2022-2032 (US$ Million, AGR%, CAGR%): "V" Shaped Recovery
Table 270 MEA Liposomal Drug Delivery Devices Market Forecast by Technology, 2022-2032 (US$ Million, AGR%, CAGR%): "U" Shaped Recovery
Table 271 MEA Liposomal Drug Delivery Devices Market Forecast by Technology, 2022-2032 (US$ Million, AGR%, CAGR%): "W" Shaped Recovery
Table 272 MEA Liposomal Drug Delivery Devices Market Forecast by Technology, 2022-2032 (US$ Million, AGR%, CAGR%): "L" Shaped Recovery
Table 273 MEA Liposomal Drug Delivery Devices Market Forecast by Application, 2022-2032 (US$ million, AGR%, CAGR%)
Table 274 MEA Liposomal Drug Delivery Devices Market Forecast by Application, 2022-2032 (US$ Million, AGR%, CAGR%): "V" Shaped Recovery
Table 275 MEA Liposomal Drug Delivery Devices Market Forecast by Application, 2022-2032 (US$ Million, AGR%, CAGR%): "U" Shaped Recovery
Table 276 MEA Liposomal Drug Delivery Devices Market Forecast by Application, 2022-2032 (US$ Million, AGR%, CAGR%): "W" Shaped Recovery
Table 277 MEA Liposomal Drug Delivery Devices Market Forecast by Application, 2022-2032 (US$ Million, AGR%, CAGR%): "L" Shaped Recovery
Table 278 MEA Liposomal Drug Delivery Devices Market Forecast by End-User, 2022-2032 (US$ million, AGR%, CAGR%)
Table 279 MEA Liposomal Drug Delivery Devices Market Forecast by End-User, 2022-2032 (US$ Million, AGR%, CAGR%): "V" Shaped Recovery
Table 280 MEA Liposomal Drug Delivery Devices Market Forecast by End-User, 2022-2032 (US$ Million, AGR%, CAGR%): "U" Shaped Recovery
Table 281 MEA Liposomal Drug Delivery Devices Market Forecast by End-User, 2022-2032 (US$ Million, AGR%, CAGR%): "W" Shaped Recovery
Table 282 MEA Liposomal Drug Delivery Devices Market Forecast by End-User, 2022-2032 (US$ Million, AGR%, CAGR%): "L" Shaped Recovery
Table 283 GCC Liposomal Drug Delivery Devices Market Forecast, 2022-2032 (US$ Million, AGR%, CAGR%)
Table 284 GCC Liposomal Drug Delivery Devices Market Forecast, 2022-2032 (US$ Million, AGR%, CAGR%): "V" Shaped Recovery
Table 285 GCC Liposomal Drug Delivery Devices Market Forecast, 2022-2032 (US$ Million, AGR%, CAGR%): "U" Shaped Recovery
Table 286 GCC Liposomal Drug Delivery Devices Market Forecast, 2022-2032 (US$ Million, AGR%, CAGR%): "W" Shaped Recovery
Table 287 GCC Liposomal Drug Delivery Devices Market Forecast, 2022-2032 (US$ Million, AGR%, CAGR%): "L" Shaped Recovery
Table 288 South Africa Liposomal Drug Delivery Devices Market Forecast, 2022-2032 (US$ Million, AGR%, CAGR%)
Table 289 South Africa Liposomal Drug Delivery Devices Market Forecast, 2022-2032 (US$ Million, AGR%, CAGR%): "V" Shaped Recovery
Table 290 South Africa Liposomal Drug Delivery Devices Market Forecast, 2022-2032 (US$ Million, AGR%, CAGR%): "U" Shaped Recovery
Table 291 South Africa Liposomal Drug Delivery Devices Market Forecast, 2022-2032 (US$ Million, AGR%, CAGR%): "W" Shaped Recovery
Table 292 South Africa Liposomal Drug Delivery Devices Market Forecast, 2022-2032 (US$ Million, AGR%, CAGR%): "L" Shaped Recovery
Table 293 Rest of MEA Liposomal Drug Delivery Devices Market Forecast, 2022-2032 (US$ Million, AGR%, CAGR%)
Table 294 Rest of MEA Liposomal Drug Delivery Devices Market Forecast, 2022-2032 (US$ Million, AGR%, CAGR%): "V" Shaped Recovery
Table 295 Rest of MEA Liposomal Drug Delivery Devices Market Forecast, 2022-2032 (US$ Million, AGR%, CAGR%): "U" Shaped Recovery
Table 296 Rest of MEA Liposomal Drug Delivery Devices Market Forecast, 2022-2032 (US$ Million, AGR%, CAGR%): "W" Shaped Recovery
Table 297 Rest of MEA Liposomal Drug Delivery Devices Market Forecast, 2022-2032 (US$ Million, AGR%, CAGR%): "L" Shaped Recovery
Table 298 Company Ranking, 2021
Table 299 Recent Developments: Liposomal Drug Delivery Devices Market
Table 300 Takeda Pharmaceutical Company Limited: Key Details, (CEO, HQ, Revenue, Founded, No. of Employees, Company Type, Website, Business Segment)
Table 301 Takeda Pharmaceutical Company Limited: Product Benchmarking
Table 302 Novartis AG: Key Details, (CEO, HQ, Revenue, Founded, No. of Employees, Company Type, Website, Business Segment)
Table 303 Novartis AG: Product Benchmarking
Table 304 Novartis AG: Recent Developments
Table 305 Luye Pharma Group: Key Details, (CEO, HQ, Revenue, Founded, No. of Employees, Company Type, Website, Business Segment)
Table 306 Luye Pharma Group: Product Benchmarking
Table 307 Luye Pharma Group: Recent Developments
Table 308 Ipsen Pharma: Key Details, (CEO, HQ, Revenue, Founded, No. of Employees, Company Type, Website, Business Segment)
Table 309 Ipsen Pharma: Product Benchmarking
Table 310 Ipsen Pharma: Recent Developments
Table 311 Celsion, Inc.: Key Details, (CEO, HQ, Revenue, Founded, No. of Employees, Company Type, Website, Business Segment)
Table 312 Celsion, Inc.: Product Benchmarking
Table 313 Celsion, Inc.: Recent Developments
Table 314 Galen Limited: Key Details, (CEO, HQ, Revenue, Founded, No. of Employees, Company Type, Website, Business Segment)
Table 315 Galen Limited: Product Benchmarking
Table 316 Astellas Pharma, Inc.: Key Details, (CEO, HQ, Revenue, Founded, No. of Employees, Company Type, Website, Business Segment)
Table 317 Astellas Pharma, Inc.: Product Benchmarking
Table 318 Astellas Pharma, Inc.: Recent Developments
Table 319 Acrotech Biopharma, Inc.: Key Details, (CEO, HQ, Revenue, Founded, No. of Employees, Company Type, Website, Business Segment)
Table 320 Acrotech Biopharma, Inc.: Product Benchmarking
Table 321 Fudan-Zhangjiang: Key Details, (CEO, HQ, Revenue, Founded, No. of Employees, Company Type, Website, Business Segment)
Table 322 Fudan-Zhangjiang: Product Benchmarking
Table 323 Pacira: Key Details, (CEO, HQ, Revenue, Founded, No. of Employees, Company Type, Website, Business Segment)
Table 324 Pacira: Product Benchmarking
Table 325 Pacira: Recent Developments
Table 326 Creative Biolabs: Key Details, (CEO, HQ, Revenue, Founded, No. of Employees, Company Type, Website, Business Segment)
Table 327 Creative Biolabs: Product Benchmarking
Table 328 Precision NanoSystems Inc.: Key Details, (CEO, HQ, Revenue, Founded, No. of Employees, Company Type, Website, Business Segment)
Table 329 Precision NanoSystems Inc.: Product Benchmarking
Table 330 Encapsula NanoSciences LLC: Key Details, (CEO, HQ, Revenue, Founded, No. of Employees, Company Type, Website, Business Segment)
Table 331 Encapsula NanoSciences LLC.: Product Benchmarking
Table 332 Avanti Polar Lipids, Inc.: Key Details, (CEO, HQ, Revenue, Founded, No. of Employees, Company Type, Website, Business Segment)
Table 333 Avanti Polar Lipids, Inc.: Product Benchmarking
Table 334 Viatris Inc.: Key Details, (CEO, HQ, Revenue, Founded, No. of Employees, Company Type, Website, Business Segment)
Table 335 Viatris Inc.: Product Benchmarking
Table 336 Merrimack Pharmaceuticals, Inc.: Key Details, (CEO, HQ, Revenue, Founded, No. of Employees, Company Type, Website, Business Segment)
Table 337 Merrimack Pharmaceuticals, Inc.: Product Benchmarking
List of Figures
Figure 1 Global Liposomal Drug Delivery Devices Market: Market Segmentation
Figure 2 Global Liposomal Drug Delivery Devices Market Trends
Figure 3 Global Liposomal Drug Delivery Devices Market Forecast by Type, 2022-2032 (US$ million, AGR %)
Figure 4 Global Liposomal Drug Delivery Devices Market Share Forecast by Type, 2022, 2027, 2032 (%)
Figure 5 Global Liposomal Drug Delivery Devices Market for Liposomal Doxorubicin Segment: Revenue Forecast 2022-2032 (US$ million, AGR%)
Figure 6 Global Liposomal Drug Delivery Devices Market for Liposomal Doxorubicin Segment, Revenue Forecast 2022-2032 (US$ million, AGR%): “V” Shaped Recovery
Figure 7 Global Liposomal Drug Delivery Devices Market for Liposomal Doxorubicin Segment, Revenue Forecast 2022-2032 (US$ million, AGR%): “U” Shaped Recovery
Figure 8 Global Liposomal Drug Delivery Devices Market for Liposomal Doxorubicin Segment, Revenue Forecast 2022-2032 (US$ million, AGR%): “W” Shaped Recovery
Figure 9 Global Liposomal Drug Delivery Devices Market for Liposomal Doxorubicin Segment, Revenue Forecast 2022-2032 (US$ million, AGR%): “L” Shaped Recovery
Figure 10 Global Liposomal Drug Delivery Devices Market for Liposomal Paclitaxel Segment: Revenue Forecast 2022-2032 (US$ million, AGR%)
Figure 11 Global Liposomal Drug Delivery Devices Market for Liposomal Paclitaxel Segment, Revenue Forecast 2022-2032 (US$ million, AGR%): “V” Shaped Recovery
Figure 12 Global Liposomal Drug Delivery Devices Market for Liposomal Paclitaxel Segment, Revenue Forecast 2022-2032 (US$ million, AGR%): “U” Shaped Recovery
Figure 13 Global Liposomal Drug Delivery Devices Market for Liposomal Paclitaxel Segment, Revenue Forecast 2022-2032 (US$ million, AGR%): “W” Shaped Recovery
Figure 14 Global Liposomal Drug Delivery Devices Market for Liposomal Paclitaxel Segment, Revenue Forecast 2022-2032 (US$ million, AGR%): “L” Shaped Recovery
Figure 15 Global Liposomal Drug Delivery Devices Market for Liposomal Amphotericin B Segment: Revenue Forecast 2022-2032 (US$ million, AGR%)
Figure 16 Global Liposomal Drug Delivery Devices Market for Liposomal Amphotericin B Segment, Revenue Forecast 2022-2032 (US$ million, AGR%): “V” Shaped Recovery
Figure 17 Global Liposomal Drug Delivery Devices Market for Liposomal Amphotericin B Segment, Revenue Forecast 2022-2032 (US$ million, AGR%): “U” Shaped Recovery
Figure 18 Global Liposomal Drug Delivery Devices Market for Liposomal Amphotericin B Segment, Revenue Forecast 2022-2032 (US$ million, AGR%): “W” Shaped Recovery
Figure 19 Global Liposomal Drug Delivery Devices Market for Liposomal Amphotericin B Segment, Revenue Forecast 2022-2032 (US$ million, AGR%): “L” Shaped Recovery
Figure 20 Global Liposomal Drug Delivery Devices Market Forecast by Technology, 2022-2032 (US$ million, AGR %)
Figure 21 Global Liposomal Drug Delivery Devices Market Share Forecast by Technology, 2022, 2027, 2032 (%)
Figure 22 Global Liposomal Drug Delivery Devices Market for Stealth Liposome Technology Segment: Revenue Forecast 2022-2032 (US$ million, AGR%)
Figure 23 Global Liposomal Drug Delivery Devices Market for Stealth Liposome Technology Segment, Revenue Forecast 2022-2032 (US$ million, AGR%): “V” Shaped Recovery
Figure 24 Global Liposomal Drug Delivery Devices Market for Stealth Liposome Technology Segment, Revenue Forecast 2022-2032 (US$ million, AGR%): “U” Shaped Recovery
Figure 25 Global Liposomal Drug Delivery Devices Market for Stealth Liposome Technology Segment, Revenue Forecast 2022-2032 (US$ million, AGR%): “W” Shaped Recovery
Figure 26 Global Liposomal Drug Delivery Devices Market for Stealth Liposome Technology Segment, Revenue Forecast 2022-2032 (US$ million, AGR%): “L” Shaped Recovery
Figure 27 Global Liposomal Drug Delivery Devices Market for Non-PEGylated Liposome Technology Segment: Revenue Forecast 2022-2032 (US$ million, AGR%)
Figure 28 Global Liposomal Drug Delivery Devices Market for Non-PEGylated Liposome Technology Segment, Revenue Forecast 2022-2032 (US$ million, AGR%): “V” Shaped Recovery
Figure 29 Global Liposomal Drug Delivery Devices Market for Non-PEGylated Liposome Technology Segment, Revenue Forecast 2022-2032 (US$ million, AGR%): “U” Shaped Recovery
Figure 30 Global Liposomal Drug Delivery Devices Market for Non-PEGylated Liposome Technology Segment, Revenue Forecast 2022-2032 (US$ million, AGR%): “W” Shaped Recovery
Figure 31 Global Liposomal Drug Delivery Devices Market for Non-PEGylated Liposome Technology Segment, Revenue Forecast 2022-2032 (US$ million, AGR%): “L” Shaped Recovery
Figure 32 Global Liposomal Drug Delivery Devices Market for DepoFoam Liposome Technology Segment: Revenue Forecast 2022-2032 (US$ million, AGR%)
Figure 33 Global Liposomal Drug Delivery Devices Market for DepoFoam Liposome Technology Segment, Revenue Forecast 2022-2032 (US$ million, AGR%): “V” Shaped Recovery
Figure 34 Global Liposomal Drug Delivery Devices Market for DepoFoam Liposome Technology Segment, Revenue Forecast 2022-2032 (US$ million, AGR%): “U” Shaped Recovery
Figure 35 Global Liposomal Drug Delivery Devices Market for DepoFoam Liposome Technology Segment, Revenue Forecast 2022-2032 (US$ million, AGR%): “W” Shaped Recovery
Figure 36 Global Liposomal Drug Delivery Devices Market for DepoFoam Liposome Technology Segment, Revenue Forecast 2022-2032 (US$ million, AGR%): “L” Shaped Recovery
Figure 37 Global Liposomal Drug Delivery Devices Market Forecast by Application, 2022-2032 (US$ million, AGR %)
Figure 38 Global Liposomal Drug Delivery Devices Market Share Forecast by Application, 2022, 2027, 2032 (%)
Figure 39 Global Liposomal Drug Delivery Devices Market for Fungal Diseases Segment: Revenue Forecast 2022-2032 (US$ million, AGR%)
Figure 40 Global Liposomal Drug Delivery Devices Market for Fungal Diseases Segment, Revenue Forecast 2022-2032 (US$ million, AGR%): “V” Shaped Recovery
Figure 41 Global Liposomal Drug Delivery Devices Market for Fungal Diseases Segment, Revenue Forecast 2022-2032 (US$ million, AGR%): “U” Shaped Recovery
Figure 42 Global Liposomal Drug Delivery Devices Market for Fungal Diseases Segment, Revenue Forecast 2022-2032 (US$ million, AGR%): “W” Shaped Recovery
Figure 43 Global Liposomal Drug Delivery Devices Market for Fungal Diseases Segment, Revenue Forecast 2022-2032 (US$ million, AGR%): “L” Shaped Recovery
Figure 44 Global Liposomal Drug Delivery Devices Market for Cancer Therapy Segment: Revenue Forecast 2022-2032 (US$ million, AGR%)
Figure 45 Global Liposomal Drug Delivery Devices Market for Cancer Therapy Segment, Revenue Forecast 2022-2032 (US$ million, AGR%): “V” Shaped Recovery
Figure 46 Global Liposomal Drug Delivery Devices Market for Cancer Therapy Segment, Revenue Forecast 2022-2032 (US$ million, AGR%): “U” Shaped Recovery
Figure 47 Global Liposomal Drug Delivery Devices Market for Cancer Therapy Segment, Revenue Forecast 2022-2032 (US$ million, AGR%): “W” Shaped Recovery
Figure 48 Global Liposomal Drug Delivery Devices Market for Cancer Therapy Segment, Revenue Forecast 2022-2032 (US$ million, AGR%): “L” Shaped Recovery
Figure 49 Global Liposomal Drug Delivery Devices Market for Pain Management Segment: Revenue Forecast 2022-2032 (US$ million, AGR%)
Figure 50 Global Liposomal Drug Delivery Devices Market for Pain Management Segment, Revenue Forecast 2022-2032 (US$ million, AGR%): “V” Shaped Recovery
Figure 51 Global Liposomal Drug Delivery Devices Market for Pain Management Segment, Revenue Forecast 2022-2032 (US$ million, AGR%): “U” Shaped Recovery
Figure 52 Global Liposomal Drug Delivery Devices Market for Pain Management Segment, Revenue Forecast 2022-2032 (US$ million, AGR%): “W” Shaped Recovery
Figure 53 Global Liposomal Drug Delivery Devices Market for Pain Management Segment, Revenue Forecast 2022-2032 (US$ million, AGR%): “L” Shaped Recovery
Figure 54 Global Liposomal Drug Delivery Devices Market for Viral Vaccines Segment: Revenue Forecast 2022-2032 (US$ million, AGR%)
Figure 55 Global Liposomal Drug Delivery Devices Market for Viral Vaccines Segment, Revenue Forecast 2022-2032 (US$ million, AGR%): “V” Shaped Recovery
Figure 56 Global Liposomal Drug Delivery Devices Market for Viral Vaccines Segment, Revenue Forecast 2022-2032 (US$ million, AGR%): “U” Shaped Recovery
Figure 57 Global Liposomal Drug Delivery Devices Market for Viral Vaccines Segment, Revenue Forecast 2022-2032 (US$ million, AGR%): “W” Shaped Recovery
Figure 58 Global Liposomal Drug Delivery Devices Market for Viral Vaccines Segment, Revenue Forecast 2022-2032 (US$ million, AGR%): “L” Shaped Recovery
Figure 59 Global Liposomal Drug Delivery Devices Market for Photodynamic Therapy Segment: Revenue Forecast 2022-2032 (US$ million, AGR%)
Figure 60 Global Liposomal Drug Delivery Devices Market for Photodynamic Therapy Segment, Revenue Forecast 2022-2032 (US$ million, AGR%): “V” Shaped Recovery
Figure 61 Global Liposomal Drug Delivery Devices Market for Photodynamic Therapy Segment, Revenue Forecast 2022-2032 (US$ million, AGR%): “U” Shaped Recovery
Figure 62 Global Liposomal Drug Delivery Devices Market for Photodynamic Therapy Segment, Revenue Forecast 2022-2032 (US$ million, AGR%): “W” Shaped Recovery
Figure 63 Global Liposomal Drug Delivery Devices Market for Photodynamic Therapy Segment, Revenue Forecast 2022-2032 (US$ million, AGR%): “L” Shaped Recovery
Figure 64 Global Liposomal Drug Delivery Devices Market Forecast by End-User, 2022-2032 (US$ million, AGR %)
Figure 65 Global Liposomal Drug Delivery Devices Market Share Forecast by End-User, 2022, 2027, 2032 (%)
Figure 66 Global Liposomal Drug Delivery Devices Market for Hospitals Segment: Revenue Forecast 2022-2032 (US$ million, AGR%)
Figure 67 Global Liposomal Drug Delivery Devices Market for Hospitals Segment, Revenue Forecast 2022-2032 (US$ million, AGR%): “V” Shaped Recovery
Figure 68 Global Liposomal Drug Delivery Devices Market for Hospitals Segment, Revenue Forecast 2022-2032 (US$ million, AGR%): “U” Shaped Recovery
Figure 69 Global Liposomal Drug Delivery Devices Market for Hospitals Segment, Revenue Forecast 2022-2032 (US$ million, AGR%): “W” Shaped Recovery
Figure 70 Global Liposomal Drug Delivery Devices Market for Hospitals Segment, Revenue Forecast 2022-2032 (US$ million, AGR%): “L” Shaped Recovery
Figure 71 Global Liposomal Drug Delivery Devices Market for Diagnostic Centers Segment: Revenue Forecast 2022-2032 (US$ million, AGR%)
Figure 72 Global Liposomal Drug Delivery Devices Market for Diagnostic Centers Segment, Revenue Forecast 2022-2032 (US$ million, AGR%): “V” Shaped Recovery
Figure 73 Global Liposomal Drug Delivery Devices Market for Diagnostic Centers Segment, Revenue Forecast 2022-2032 (US$ million, AGR%): “U” Shaped Recovery
Figure 74 Global Liposomal Drug Delivery Devices Market for Diagnostic Centers Segment, Revenue Forecast 2022-2032 (US$ million, AGR%): “W” Shaped Recovery
Figure 75 Global Liposomal Drug Delivery Devices Market for Diagnostic Centers Segment, Revenue Forecast 2022-2032 (US$ million, AGR%): “L” Shaped Recovery
Figure 76 Global Liposomal Drug Delivery Devices Market for Ambulatory Surgery Centers/Clinics Segment: Revenue Forecast 2022-2032 (US$ million, AGR%)
Figure 77 Global Liposomal Drug Delivery Devices Market for Ambulatory Surgery Centers/Clinics Segment, Revenue Forecast 2022-2032 (US$ million, AGR%): “V” Shaped Recovery
Figure 78 Global Liposomal Drug Delivery Devices Market for Ambulatory Surgery Centers/Clinics Segment, Revenue Forecast 2022-2032 (US$ million, AGR%): “U” Shaped Recovery
Figure 79 Global Liposomal Drug Delivery Devices Market for Ambulatory Surgery Centers/Clinics Segment, Revenue Forecast 2022-2032 (US$ million, AGR%): “W” Shaped Recovery
Figure 80 Global Liposomal Drug Delivery Devices Market for Ambulatory Surgery Centers/Clinics Segment, Revenue Forecast 2022-2032 (US$ million, AGR%): “L” Shaped Recovery
Figure 81 Global Liposomal Drug Delivery Devices Market Forecast by Region 2022-2032 (US$ million)
Figure 82 Global Liposomal Drug Delivery Devices Market Share Forecast by Region 2022, 2027, 2032 (%)
Figure 83 Global Liposomal Drug Delivery Devices Market Forecast, 2022-2032 (US$ million, AGR%): “V” Shaped Recovery
Figure 84 Global Liposomal Drug Delivery Devices Market Forecast, 2022-2032 (US$ million, AGR%): “U” Shaped Recovery
Figure 85 Global Liposomal Drug Delivery Devices Market Forecast, 2022-2032 (US$ million, AGR%): “W” Shaped Recovery
Figure 86 Global Liposomal Drug Delivery Devices Market Forecast, 2022-2032 (US$ million, AGR%): “L” Shaped Recovery
Figure 87 North America Liposomal Drug Delivery Devices Market Forecast by Country 2022-2032 (US$ million)
Figure 88 North America Liposomal Drug Delivery Devices Market Share Forecast by Country 2022, 2027, 2032 (%)
Figure 89 North America Liposomal Drug Delivery Devices Market Forecast by Type, 2022-2032 (US$ million, AGR%)
Figure 90 North America Liposomal Drug Delivery Devices Market Forecast by Type, 2022-2032 (US$ million, AGR%): “V” Shaped Recovery
Figure 91 North America Liposomal Drug Delivery Devices Market Forecast by Type, 2022-2032 (US$ million, AGR%): “U” Shaped Recovery
Figure 92 North America Liposomal Drug Delivery Devices Market Forecast by Type, 2022-2032 (US$ million, AGR%): “W” Shaped Recovery
Figure 93 North America Liposomal Drug Delivery Devices Market Forecast by Type, 2022-2032 (US$ million, AGR%): “L” Shaped Recovery
Figure 94 North America Liposomal Drug Delivery Devices Market Forecast by Technology, 2022-2032 (US$ million, AGR%)
Figure 95 North America Liposomal Drug Delivery Devices Market Forecast by Technology, 2022-2032 (US$ million, AGR%): “V” Shaped Recovery
Figure 96 North America Liposomal Drug Delivery Devices Market Forecast by Technology, 2022-2032 (US$ million, AGR%): “U” Shaped Recovery
Figure 97 North America Liposomal Drug Delivery Devices Market Forecast by Technology, 2022-2032 (US$ million, AGR%): “W” Shaped Recovery
Figure 98 North America Liposomal Drug Delivery Devices Market Forecast by Technology, 2022-2032 (US$ million, AGR%): “L” Shaped Recovery
Figure 99 North America Liposomal Drug Delivery Devices Market Forecast by Application, 2022-2032 (US$ million, AGR%)
Figure 100 North America Liposomal Drug Delivery Devices Market Forecast by Application, 2022-2032 (US$ million, AGR%): “V” Shaped Recovery
Figure 101 North America Liposomal Drug Delivery Devices Market Forecast by Application, 2022-2032 (US$ million, AGR%): “U” Shaped Recovery
Figure 102 North America Liposomal Drug Delivery Devices Market Forecast by Application, 2022-2032 (US$ million, AGR%): “W” Shaped Recovery
Figure 103 North America Liposomal Drug Delivery Devices Market Forecast by Application, 2022-2032 (US$ million, AGR%): “L” Shaped Recovery
Figure 104 North America Liposomal Drug Delivery Devices Market Forecast by End-User, 2022-2032 (US$ million, AGR%)
Figure 105 North America Liposomal Drug Delivery Devices Market Forecast by End-User, 2022-2032 (US$ million, AGR%): “V” Shaped Recovery
Figure 106 North America Liposomal Drug Delivery Devices Market Forecast by End-User, 2022-2032 (US$ million, AGR%): “U” Shaped Recovery
Figure 107 North America Liposomal Drug Delivery Devices Market Forecast by End-User, 2022-2032 (US$ million, AGR%): “W” Shaped Recovery
Figure 108 North America Liposomal Drug Delivery Devices Market Forecast by End-User, 2022-2032 (US$ million, AGR%): “L” Shaped Recovery
Figure 109 U.S. Liposomal Drug Delivery Devices Market Forecast, 2022-2032 (US$ million, AGR %)
Figure 110 U.S. Liposomal Drug Delivery Devices Market Forecast, 2022-2032 (US$ million, AGR%): “V” Shaped Recovery
Figure 111 U.S. Liposomal Drug Delivery Devices Market Forecast, 2022-2032 (US$ million, AGR%): “U” Shaped Recovery
Figure 112 U.S. Liposomal Drug Delivery Devices Market Forecast, 2022-2032 (US$ million, AGR%): “W” Shaped Recovery
Figure 113 U.S. Liposomal Drug Delivery Devices Market Forecast, 2022-2032 (US$ million, AGR%): “L” Shaped Recovery
Figure 114 Canada Liposomal Drug Delivery Devices Market Forecast, 2022-2032 (US$ million, AGR %)
Figure 115 Canada Liposomal Drug Delivery Devices Market Forecast, 2022-2032 (US$ million, AGR%): “V” Shaped Recovery
Figure 116 Canada Liposomal Drug Delivery Devices Market Forecast, 2022-2032 (US$ million, AGR%): “U” Shaped Recovery
Figure 117 Canada Liposomal Drug Delivery Devices Market Forecast, 2022-2032 (US$ million, AGR%): “W” Shaped Recovery
Figure 118 Canada Liposomal Drug Delivery Devices Market Forecast, 2022-2032 (US$ million, AGR%): “L” Shaped Recovery
Figure 119 Europe Liposomal Drug Delivery Devices Market Forecast by Country 2022-2032 (US$ million)
Figure 120 Europe Liposomal Drug Delivery Devices Market Share Forecast by Country 2022, 2027, 2032 (%)
Figure 121 Europe Liposomal Drug Delivery Devices Market Forecast by Type, 2022-2032 (US$ million, AGR%)
Figure 122 Europe Liposomal Drug Delivery Devices Market Forecast by Type, 2022-2032 (US$ million, AGR%): “V” Shaped Recovery
Figure 123 Europe Liposomal Drug Delivery Devices Market Forecast by Type, 2022-2032 (US$ million, AGR%): “U” Shaped Recovery
Figure 124 Europe Liposomal Drug Delivery Devices Market Forecast by Type, 2022-2032 (US$ million, AGR%): “W” Shaped Recovery
Figure 125 Europe Liposomal Drug Delivery Devices Market Forecast by Type, 2022-2032 (US$ million, AGR%): “L” Shaped Recovery
Figure 126 Europe Liposomal Drug Delivery Devices Market Forecast by Technology, 2022-2032 (US$ million, AGR%)
Figure 127 Europe Liposomal Drug Delivery Devices Market Forecast by Technology, 2022-2032 (US$ million, AGR%): “V” Shaped Recovery
Figure 128 Europe Liposomal Drug Delivery Devices Market Forecast by Technology, 2022-2032 (US$ million, AGR%): “U” Shaped Recovery
Figure 129 Europe Liposomal Drug Delivery Devices Market Forecast by Technology, 2022-2032 (US$ million, AGR%): “W” Shaped Recovery
Figure 130 Europe Liposomal Drug Delivery Devices Market Forecast by Technology, 2022-2032 (US$ million, AGR%): “L” Shaped Recovery
Figure 131 Europe Liposomal Drug Delivery Devices Market Forecast by Application, 2022-2032 (US$ million, AGR%)
Figure 132 Europe Liposomal Drug Delivery Devices Market Forecast by Application, 2022-2032 (US$ million, AGR%): “V” Shaped Recovery
Figure 133 Europe Liposomal Drug Delivery Devices Market Forecast by Application, 2022-2032 (US$ million, AGR%): “U” Shaped Recovery
Figure 134 Europe Liposomal Drug Delivery Devices Market Forecast by Application, 2022-2032 (US$ million, AGR%): “W” Shaped Recovery
Figure 135 Europe Liposomal Drug Delivery Devices Market Forecast by Application, 2022-2032 (US$ million, AGR%): “L” Shaped Recovery
Figure 136 Europe Liposomal Drug Delivery Devices Market Forecast by End-User, 2022-2032 (US$ million, AGR%)
Figure 137 Europe Liposomal Drug Delivery Devices Market Forecast by End-User, 2022-2032 (US$ million, AGR%): “V” Shaped Recovery
Figure 138 Europe Liposomal Drug Delivery Devices Market Forecast by End-User, 2022-2032 (US$ million, AGR%): “U” Shaped Recovery
Figure 139 Europe Liposomal Drug Delivery Devices Market Forecast by End-User, 2022-2032 (US$ million, AGR%): “W” Shaped Recovery
Figure 140 Europe Liposomal Drug Delivery Devices Market Forecast by End-User, 2022-2032 (US$ million, AGR%): “L” Shaped Recovery
Figure 141 Germany Liposomal Drug Delivery Devices Market Forecast, 2022-2032 (US$ million, AGR %)
Figure 142 Germany Liposomal Drug Delivery Devices Market Forecast, 2022-2032 (US$ million, AGR%): “V” Shaped Recovery
Figure 143 Germany Liposomal Drug Delivery Devices Market Forecast, 2022-2032 (US$ million, AGR%): “U” Shaped Recovery
Figure 144 Germany Liposomal Drug Delivery Devices Market Forecast, 2022-2032 (US$ million, AGR%): “W” Shaped Recovery
Figure 145 Germany Liposomal Drug Delivery Devices Market Forecast, 2022-2032 (US$ million, AGR%): “L” Shaped Recovery
Figure 146 UK Liposomal Drug Delivery Devices Market Forecast, 2022-2032 (US$ million, AGR %)
Figure 147 UK Liposomal Drug Delivery Devices Market Forecast, 2022-2032 (US$ million, AGR%): “V” Shaped Recovery
Figure 148 UK Liposomal Drug Delivery Devices Market Forecast, 2022-2032 (US$ million, AGR%): “U” Shaped Recovery
Figure 149 UK Liposomal Drug Delivery Devices Market Forecast, 2022-2032 (US$ million, AGR%): “W” Shaped Recovery
Figure 150 UK Liposomal Drug Delivery Devices Market Forecast, 2022-2032 (US$ million, AGR%): “L” Shaped Recovery
Figure 151 France Liposomal Drug Delivery Devices Market Forecast, 2022-2032 (US$ million, AGR %)
Figure 152 France Liposomal Drug Delivery Devices Market Forecast, 2022-2032 (US$ million, AGR%): “V” Shaped Recovery
Figure 153 France Liposomal Drug Delivery Devices Market Forecast, 2022-2032 (US$ million, AGR%): “U” Shaped Recovery
Figure 154 France Liposomal Drug Delivery Devices Market Forecast, 2022-2032 (US$ million, AGR%): “W” Shaped Recovery
Figure 155 France Liposomal Drug Delivery Devices Market Forecast, 2022-2032 (US$ million, AGR%): “L” Shaped Recovery
Figure 156 Italy Liposomal Drug Delivery Devices Market Forecast, 2022-2032 (US$ million, AGR %)
Figure 157 Italy Liposomal Drug Delivery Devices Market Forecast, 2022-2032 (US$ million, AGR%): “V” Shaped Recovery
Figure 158 Italy Liposomal Drug Delivery Devices Market Forecast, 2022-2032 (US$ million, AGR%): “U” Shaped Recovery
Figure 159 Italy Liposomal Drug Delivery Devices Market Forecast, 2022-2032 (US$ million, AGR%): “W” Shaped Recovery
Figure 160 Italy Liposomal Drug Delivery Devices Market Forecast, 2022-2032 (US$ million, AGR%): “L” Shaped Recovery
Figure 161 Spain Liposomal Drug Delivery Devices Market Forecast, 2022-2032 (US$ million, AGR %)
Figure 162 Spain Liposomal Drug Delivery Devices Market Forecast, 2022-2032 (US$ million, AGR%): “V” Shaped Recovery
Figure 163 Spain Liposomal Drug Delivery Devices Market Forecast, 2022-2032 (US$ million, AGR%): “U” Shaped Recovery
Figure 164 Spain Liposomal Drug Delivery Devices Market Forecast, 2022-2032 (US$ million, AGR%): “W” Shaped Recovery
Figure 165 Spain Liposomal Drug Delivery Devices Market Forecast, 2022-2032 (US$ million, AGR%): “L” Shaped Recovery
Figure 166 Russia Liposomal Drug Delivery Devices Market Forecast, 2022-2032 (US$ million, AGR %)
Figure 167 Russia Liposomal Drug Delivery Devices Market Forecast, 2022-2032 (US$ million, AGR%): “V” Shaped Recovery
Figure 168 Russia Liposomal Drug Delivery Devices Market Forecast, 2022-2032 (US$ million, AGR%): “U” Shaped Recovery
Figure 169 Russia Liposomal Drug Delivery Devices Market Forecast, 2022-2032 (US$ million, AGR%): “W” Shaped Recovery
Figure 170 Russia Liposomal Drug Delivery Devices Market Forecast, 2022-2032 (US$ million, AGR%): “L” Shaped Recovery
Figure 171 Rest of Europe Liposomal Drug Delivery Devices Market Forecast, 2022-2032 (US$ million, AGR %)
Figure 172 Rest of Europe Liposomal Drug Delivery Devices Market Forecast, 2022-2032 (US$ million, AGR%): “V” Shaped Recovery
Figure 173 Rest of Europe Liposomal Drug Delivery Devices Market Forecast, 2022-2032 (US$ million, AGR%): “U” Shaped Recovery
Figure 174 Rest of Europe Liposomal Drug Delivery Devices Market Forecast, 2022-2032 (US$ million, AGR%): “W” Shaped Recovery
Figure 175 Rest of Europe Liposomal Drug Delivery Devices Market Forecast, 2022-2032 (US$ million, AGR%): “L” Shaped Recovery
Figure 176 Asia Pacific Liposomal Drug Delivery Devices Market Forecast by Country 2022-2032 (US$ million)
Figure 177 Asia Pacific Liposomal Drug Delivery Devices Market Share Forecast by Country 2022, 2027, 2032 (%)
Figure 178 Asia Pacific Liposomal Drug Delivery Devices Market Forecast by Type, 2022-2032 (US$ million, AGR%)
Figure 179 Asia Pacific Liposomal Drug Delivery Devices Market Forecast by Type, 2022-2032 (US$ million, AGR%): “V” Shaped Recovery
Figure 180 Asia Pacific Liposomal Drug Delivery Devices Market Forecast by Type, 2022-2032 (US$ million, AGR%): “U” Shaped Recovery
Figure 181 Asia Pacific Liposomal Drug Delivery Devices Market Forecast by Type, 2022-2032 (US$ million, AGR%): “W” Shaped Recovery
Figure 182 Asia Pacific Liposomal Drug Delivery Devices Market Forecast by Type, 2022-2032 (US$ million, AGR%): “L” Shaped Recovery
Figure 183 Asia Pacific Liposomal Drug Delivery Devices Market Forecast by Technology, 2022-2032 (US$ million, AGR%)
Figure 184 Asia Pacific Liposomal Drug Delivery Devices Market Forecast by Technology, 2022-2032 (US$ million, AGR%): “V” Shaped Recovery
Figure 185 Asia Pacific Liposomal Drug Delivery Devices Market Forecast by Technology, 2022-2032 (US$ million, AGR%): “U” Shaped Recovery
Figure 186 Asia Pacific Liposomal Drug Delivery Devices Market Forecast by Technology, 2022-2032 (US$ million, AGR%): “W” Shaped Recovery
Figure 187 Asia Pacific Liposomal Drug Delivery Devices Market Forecast by Technology, 2022-2032 (US$ million, AGR%): “L” Shaped Recovery
Figure 188 Asia Pacific Liposomal Drug Delivery Devices Market Forecast by Application, 2022-2032 (US$ million, AGR%)
Figure 189 Asia Pacific Liposomal Drug Delivery Devices Market Forecast by Application, 2022-2032 (US$ million, AGR%): “V” Shaped Recovery
Figure 190 Asia Pacific Liposomal Drug Delivery Devices Market Forecast by Application, 2022-2032 (US$ million, AGR%): “U” Shaped Recovery
Figure 191 Asia Pacific Liposomal Drug Delivery Devices Market Forecast by Application, 2022-2032 (US$ million, AGR%): “W” Shaped Recovery
Figure 192 Asia Pacific Liposomal Drug Delivery Devices Market Forecast by Application, 2022-2032 (US$ million, AGR%): “L” Shaped Recovery
Figure 193 Asia Pacific Liposomal Drug Delivery Devices Market Forecast by End-User, 2022-2032 (US$ million, AGR%)
Figure 194 Asia Pacific Liposomal Drug Delivery Devices Market Forecast by End-User, 2022-2032 (US$ million, AGR%): “V” Shaped Recovery
Figure 195 Asia Pacific Liposomal Drug Delivery Devices Market Forecast by End-User, 2022-2032 (US$ million, AGR%): “U” Shaped Recovery
Figure 196 Asia Pacific Liposomal Drug Delivery Devices Market Forecast by End-User, 2022-2032 (US$ million, AGR%): “W” Shaped Recovery
Figure 197 Asia Pacific Liposomal Drug Delivery Devices Market Forecast by End-User, 2022-2032 (US$ million, AGR%): “L” Shaped Recovery
Figure 198 Japan Liposomal Drug Delivery Devices Market Forecast, 2022-2032 (US$ million, AGR %)
Figure 199 Japan Liposomal Drug Delivery Devices Market Forecast, 2022-2032 (US$ million, AGR%): “V” Shaped Recovery
Figure 200 Japan Liposomal Drug Delivery Devices Market Forecast, 2022-2032 (US$ million, AGR%): “U” Shaped Recovery
Figure 201 Japan Liposomal Drug Delivery Devices Market Forecast, 2022-2032 (US$ million, AGR%): “W” Shaped Recovery
Figure 202 Japan Liposomal Drug Delivery Devices Market Forecast, 2022-2032 (US$ million, AGR%): “L” Shaped Recovery
Figure 203 China Liposomal Drug Delivery Devices Market Forecast, 2022-2032 (US$ million, AGR %)
Figure 204 China Liposomal Drug Delivery Devices Market Forecast, 2022-2032 (US$ million, AGR%): “V” Shaped Recovery
Figure 205 China Liposomal Drug Delivery Devices Market Forecast, 2022-2032 (US$ million, AGR%): “U” Shaped Recovery
Figure 206 China Liposomal Drug Delivery Devices Market Forecast, 2022-2032 (US$ million, AGR%): “W” Shaped Recovery
Figure 207 China Liposomal Drug Delivery Devices Market Forecast, 2022-2032 (US$ million, AGR%): “L” Shaped Recovery
Figure 208 India Liposomal Drug Delivery Devices Market Forecast, 2022-2032 (US$ million, AGR %)
Figure 209 India Liposomal Drug Delivery Devices Market Forecast, 2022-2032 (US$ million, AGR%): “V” Shaped Recovery
Figure 210 India Liposomal Drug Delivery Devices Market Forecast, 2022-2032 (US$ million, AGR%): “U” Shaped Recovery
Figure 211 India Liposomal Drug Delivery Devices Market Forecast, 2022-2032 (US$ million, AGR%): “W” Shaped Recovery
Figure 212 India Liposomal Drug Delivery Devices Market Forecast, 2022-2032 (US$ million, AGR%): “L” Shaped Recovery
Figure 213 Australia Liposomal Drug Delivery Devices Market Forecast, 2022-2032 (US$ million, AGR %)
Figure 214 Australia Liposomal Drug Delivery Devices Market Forecast, 2022-2032 (US$ million, AGR%): “V” Shaped Recovery
Figure 215 Australia Liposomal Drug Delivery Devices Market Forecast, 2022-2032 (US$ million, AGR%): “U” Shaped Recovery
Figure 216 Australia Liposomal Drug Delivery Devices Market Forecast, 2022-2032 (US$ million, AGR%): “W” Shaped Recovery
Figure 217 Australia Liposomal Drug Delivery Devices Market Forecast, 2022-2032 (US$ million, AGR%): “L” Shaped Recovery
Figure 218 South Korea Liposomal Drug Delivery Devices Market Forecast, 2022-2032 (US$ million, AGR %)
Figure 219 South Korea Liposomal Drug Delivery Devices Market Forecast, 2022-2032 (US$ million, AGR%): “V” Shaped Recovery
Figure 220 South Korea Liposomal Drug Delivery Devices Market Forecast, 2022-2032 (US$ million, AGR%): “U” Shaped Recovery
Figure 221 South Korea Liposomal Drug Delivery Devices Market Forecast, 2022-2032 (US$ million, AGR%): “W” Shaped Recovery
Figure 222 South Korea Liposomal Drug Delivery Devices Market Forecast, 2022-2032 (US$ million, AGR%): “L” Shaped Recovery
Figure 223 Rest of Asia Pacific Liposomal Drug Delivery Devices Market Forecast, 2022-2032 (US$ million, AGR %)
Figure 224 Rest of Asia Pacific Liposomal Drug Delivery Devices Market Forecast, 2022-2032 (US$ million, AGR%): “V” Shaped Recovery
Figure 225 Rest of Asia Pacific Liposomal Drug Delivery Devices Market Forecast, 2022-2032 (US$ million, AGR%): “U” Shaped Recovery
Figure 226 Rest of Asia Pacific Liposomal Drug Delivery Devices Market Forecast, 2022-2032 (US$ million, AGR%): “W” Shaped Recovery
Figure 227 Rest of Asia Pacific Liposomal Drug Delivery Devices Market Forecast, 2022-2032 (US$ million, AGR%): “L” Shaped Recovery
Figure 228 Latin America Liposomal Drug Delivery Devices Market Forecast by Country 2022-2032 (US$ million)
Figure 229 Latin America Liposomal Drug Delivery Devices Market Share Forecast by Country 2022, 2027, 2032 (%)
Figure 230 Latin America Liposomal Drug Delivery Devices Market Forecast by Type, 2022-2032 (US$ million, AGR%)
Figure 231 Latin America Liposomal Drug Delivery Devices Market Forecast by Type, 2022-2032 (US$ million, AGR%): “V” Shaped Recovery
Figure 232 Latin America Liposomal Drug Delivery Devices Market Forecast by Type, 2022-2032 (US$ million, AGR%): “U” Shaped Recovery
Figure 233 Latin America Liposomal Drug Delivery Devices Market Forecast by Type, 2022-2032 (US$ million, AGR%): “W” Shaped Recovery
Figure 234 Latin America Liposomal Drug Delivery Devices Market Forecast by Type, 2022-2032 (US$ million, AGR%): “L” Shaped Recovery
Figure 235 Latin America Liposomal Drug Delivery Devices Market Forecast by Technology, 2022-2032 (US$ million, AGR%)
Figure 236 Latin America Liposomal Drug Delivery Devices Market Forecast by Technology, 2022-2032 (US$ million, AGR%): “V” Shaped Recovery
Figure 237 Latin America Liposomal Drug Delivery Devices Market Forecast by Technology, 2022-2032 (US$ million, AGR%): “U” Shaped Recovery
Figure 238 Latin America Liposomal Drug Delivery Devices Market Forecast by Technology, 2022-2032 (US$ million, AGR%): “W” Shaped Recovery
Figure 239 Latin America Liposomal Drug Delivery Devices Market Forecast by Technology, 2022-2032 (US$ million, AGR%): “L” Shaped Recovery
Figure 240 Latin America Liposomal Drug Delivery Devices Market Forecast by Application, 2022-2032 (US$ million, AGR%)
Figure 241 Latin America Liposomal Drug Delivery Devices Market Forecast by Application, 2022-2032 (US$ million, AGR%): “V” Shaped Recovery
Figure 242 Latin America Liposomal Drug Delivery Devices Market Forecast by Application, 2022-2032 (US$ million, AGR%): “U” Shaped Recovery
Figure 243 Latin America Liposomal Drug Delivery Devices Market Forecast by Application, 2022-2032 (US$ million, AGR%): “W” Shaped Recovery
Figure 244 Latin America Liposomal Drug Delivery Devices Market Forecast by Application, 2022-2032 (US$ million, AGR%): “L” Shaped Recovery
Figure 245 Latin America Liposomal Drug Delivery Devices Market Forecast by End-User, 2022-2032 (US$ million, AGR%)
Figure 246 Latin America Liposomal Drug Delivery Devices Market Forecast by End-User, 2022-2032 (US$ million, AGR%): “V” Shaped Recovery
Figure 247 Latin America Liposomal Drug Delivery Devices Market Forecast by End-User, 2022-2032 (US$ million, AGR%): “U” Shaped Recovery
Figure 248 Latin America Liposomal Drug Delivery Devices Market Forecast by End-User, 2022-2032 (US$ million, AGR%): “W” Shaped Recovery
Figure 249 Latin America Liposomal Drug Delivery Devices Market Forecast by End-User, 2022-2032 (US$ million, AGR%): “L” Shaped Recovery
Figure 250 Brazil Liposomal Drug Delivery Devices Market Forecast, 2022-2032 (US$ million, AGR %)
Figure 251 Brazil Liposomal Drug Delivery Devices Market Forecast, 2022-2032 (US$ million, AGR%): “V” Shaped Recovery
Figure 252 Brazil Liposomal Drug Delivery Devices Market Forecast, 2022-2032 (US$ million, AGR%): “U” Shaped Recovery
Figure 253 Brazil Liposomal Drug Delivery Devices Market Forecast, 2022-2032 (US$ million, AGR%): “W” Shaped Recovery
Figure 254 Brazil Liposomal Drug Delivery Devices Market Forecast, 2022-2032 (US$ million, AGR%): “L” Shaped Recovery
Figure 255 Mexico Liposomal Drug Delivery Devices Market Forecast, 2022-2032 (US$ million, AGR %)
Figure 256 Mexico Liposomal Drug Delivery Devices Market Forecast, 2022-2032 (US$ million, AGR%): “V” Shaped Recovery
Figure 257 Mexico Liposomal Drug Delivery Devices Market Forecast, 2022-2032 (US$ million, AGR%): “U” Shaped Recovery
Figure 258 Mexico Liposomal Drug Delivery Devices Market Forecast, 2022-2032 (US$ million, AGR%): “W” Shaped Recovery
Figure 259 Mexico Liposomal Drug Delivery Devices Market Forecast, 2022-2032 (US$ million, AGR%): “L” Shaped Recovery
Figure 260 Rest of Latin America Liposomal Drug Delivery Devices Market Forecast, 2022-2032 (US$ million, AGR %)
Figure 261 Rest of Latin America Liposomal Drug Delivery Devices Market Forecast, 2022-2032 (US$ million, AGR%): “V” Shaped Recovery
Figure 262 Rest of Latin America Liposomal Drug Delivery Devices Market Forecast, 2022-2032 (US$ million, AGR%): “U” Shaped Recovery
Figure 263 Rest of Latin America Liposomal Drug Delivery Devices Market Forecast, 2022-2032 (US$ million, AGR%): “W” Shaped Recovery
Figure 264 Rest of Latin America Liposomal Drug Delivery Devices Market Forecast, 2022-2032 (US$ million, AGR%): “L” Shaped Recovery
Figure 265 Middle East and Africa Liposomal Drug Delivery Devices Market Forecast by Country 2022-2032 (US$ million)
Figure 266 Middle East and Africa Liposomal Drug Delivery Devices Market Share Forecast by Country 2022, 2027, 2032 (%)
Figure 267 Middle East and Africa Liposomal Drug Delivery Devices Market Forecast by Type, 2022-2032 (US$ million, AGR%)
Figure 268 Middle East and Africa Liposomal Drug Delivery Devices Market Forecast by Type, 2022-2032 (US$ million, AGR%): “V” Shaped Recovery
Figure 269 Middle East and Africa Liposomal Drug Delivery Devices Market Forecast by Type, 2022-2032 (US$ million, AGR%): “U” Shaped Recovery2
Figure 270 Middle East and Africa Liposomal Drug Delivery Devices Market Forecast by Type, 2022-2032 (US$ million, AGR%): “W” Shaped Recovery
Figure 271 Middle East and Africa Liposomal Drug Delivery Devices Market Forecast by Type, 2022-2032 (US$ million, AGR%): “L” Shaped Recovery
Figure 272 Middle East and Africa Liposomal Drug Delivery Devices Market Forecast by Technology, 2022-2032 (US$ million, AGR%)
Figure 273 Middle East and Africa Liposomal Drug Delivery Devices Market Forecast by Technology, 2022-2032 (US$ million, AGR%): “V” Shaped Recovery
Figure 274 Middle East and Africa Liposomal Drug Delivery Devices Market Forecast by Technology, 2022-2032 (US$ million, AGR%): “U” Shaped Recovery
Figure 275 Middle East and Africa Liposomal Drug Delivery Devices Market Forecast by Technology, 2022-2032 (US$ million, AGR%): “W” Shaped Recovery
Figure 276 Middle East and Africa Liposomal Drug Delivery Devices Market Forecast by Technology, 2022-2032 (US$ million, AGR%): “L” Shaped Recovery
Figure 277 Middle East and Africa Liposomal Drug Delivery Devices Market Forecast by Application, 2022-2032 (US$ million, AGR%)
Figure 278 Middle East and Africa Liposomal Drug Delivery Devices Market Forecast by Application, 2022-2032 (US$ million, AGR%): “V” Shaped Recovery
Figure 279 Middle East and Africa Liposomal Drug Delivery Devices Market Forecast by Application, 2022-2032 (US$ million, AGR%): “U” Shaped Recovery
Figure 280 Middle East and Africa Liposomal Drug Delivery Devices Market Forecast by Application, 2022-2032 (US$ million, AGR%): “W” Shaped Recovery
Figure 281 Middle East and Africa Liposomal Drug Delivery Devices Market Forecast by Application, 2022-2032 (US$ million, AGR%): “L” Shaped Recovery
Figure 282 Middle East and Africa Liposomal Drug Delivery Devices Market Forecast by End-User, 2022-2032 (US$ million, AGR%)
Figure 283 Middle East and Africa Liposomal Drug Delivery Devices Market Forecast by End-User, 2022-2032 (US$ million, AGR%): “V” Shaped Recovery
Figure 284 Middle East and Africa Liposomal Drug Delivery Devices Market Forecast by End-User, 2022-2032 (US$ million, AGR%): “U” Shaped Recovery
Figure 285 Middle East and Africa Liposomal Drug Delivery Devices Market Forecast by End-User, 2022-2032 (US$ million, AGR%): “W” Shaped Recovery
Figure 286 Middle East and Africa Liposomal Drug Delivery Devices Market Forecast by End-User, 2022-2032 (US$ million, AGR%): “L” Shaped Recovery
Figure 287 GCC Liposomal Drug Delivery Devices Market Forecast, 2022-2032 (US$ million, AGR %)
Figure 288 GCC Liposomal Drug Delivery Devices Market Forecast, 2022-2032 (US$ million, AGR%): “V” Shaped Recovery
Figure 289 GCC Liposomal Drug Delivery Devices Market Forecast, 2022-2032 (US$ million, AGR%): “U” Shaped Recovery
Figure 290 GCC Liposomal Drug Delivery Devices Market Forecast, 2022-2032 (US$ million, AGR%): “W” Shaped Recovery
Figure 291 GCC Liposomal Drug Delivery Devices Market Forecast, 2022-2032 (US$ million, AGR%): “L” Shaped Recovery
Figure 292 South Africa Liposomal Drug Delivery Devices Market Forecast, 2022-2032 (US$ million, AGR %)
Figure 293 South Africa Liposomal Drug Delivery Devices Market Forecast, 2022-2032 (US$ million, AGR%): “V” Shaped Recovery
Figure 294 South Africa Liposomal Drug Delivery Devices Market Forecast, 2022-2032 (US$ million, AGR%): “U” Shaped Recovery
Figure 295 South Africa Liposomal Drug Delivery Devices Market Forecast, 2022-2032 (US$ million, AGR%): “W” Shaped Recovery
Figure 296 South Africa Liposomal Drug Delivery Devices Market Forecast, 2022-2032 (US$ million, AGR%): “L” Shaped Recovery
Figure 297 Rest of Middle East and Africa Liposomal Drug Delivery Devices Market Forecast, 2022-2032 (US$ million, AGR %)
Figure 298 Rest of Middle East and Africa Liposomal Drug Delivery Devices Market Forecast, 2022-2032 (US$ million, AGR%): “V” Shaped Recovery
Figure 299 Rest of Middle East and Africa Liposomal Drug Delivery Devices Market Forecast, 2022-2032 (US$ million, AGR%): “U” Shaped Recovery
Figure 300 Rest of Middle East and Africa Liposomal Drug Delivery Devices Market Forecast, 2022-2032 (US$ million, AGR%): “W” Shaped Recovery
Figure 301 Rest of Middle East and Africa Liposomal Drug Delivery Devices Market Forecast, 2022-2032 (US$ million, AGR%): “L” Shaped Recovery
Figure 302 Takeda Pharmaceutical Company Limited: Net Revenue, 2015-2021 (US$ million, AGR%)
Figure 303 Takeda Pharmaceutical Company Limited: R&D Expenses, 2015-2021 (US$ million, AGR%)
Figure 304 Takeda Pharmaceutical Company Limited: Gross Profit, 2015-2021 (US$ million, AGR%)
Figure 305 Novartis AG: Net Revenue, 2015-2021 (US$ million, AGR%)
Figure 306 Novartis AG: R&D Expenses, 2015-2021 (US$ million, AGR%)
Figure 307 Novartis AG: Gross Profit, 2015-2021 (US$ million, AGR%)
Figure 308 Ipsen Pharma: Net Revenue, 2015-2021 (US$ million, AGR%)
Figure 309 Ipsen Pharma: R&D Expenses, 2015-2021 (US$ million, AGR%)
Figure 310 Ipsen Pharma: Gross Profit, 2015-2021 (US$ million, AGR%)
Figure 311 Astellas Pharma, Inc.: Net Revenue, 2015-2021 (US$ million, AGR%)
Figure 312 Astellas Pharma, Inc.: R&D Expenses, 2015-2021 (US$ million, AGR%)
Figure 313 Astellas Pharma, Inc.: Gross Profit, 2015-2021 (US$ million, AGR%)
Figure 314 Pacira: Net Revenue, 2015-2021 (US$ million, AGR%)
Figure 315 Pacira: R&D Expenses, 2015-2021 (US$ million, AGR%)
Figure 316 Pacira: Gross Profit, 2015-2021 (US$ million, AGR%)
Figure 317 Viatris Inc.: Net Revenue, 2015-2021 (US$ million, AGR%)
Figure 318 Viatris Inc.: R&D Expenses, 2015-2021 (US$ million, AGR%)
Figure 319 Viatris Inc.: Gross Profit, 2015-2021 (US$ million, AGR%)
Figure 320 Global Liposomal Drug Delivery Devices Market Share Forecast by Region 2022, 2027, 2032 (%)
ページTOPに戻る
Summary
この調査レポートは世界のゲノム編集技術市場を調査し、タイプ別、用途別、エンドユーザー別、地域別に2022年から2032年までの予測結果を掲載しています。また関連企業情報を提供しています。
主な掲載内容(目次より抜粋)
-
レポート概要
-
エグゼクティブサマリー
-
プレミアムインサイト
-
市場概要
-
世界のゲノム編集技術市場分析:タイプ別
-
世界のゲノム編集技術市場分析:用途別
-
世界のゲノム編集技術市場分析:エンドユーザー別
-
北米のゲノム編集技術市場分析
-
欧州のゲノム編集技術市場分析
-
アジア太平洋地域のゲノム編集技術市場分析
-
ラテンアメリカのゲノム編集技術市場分析
-
中東・アフリカのゲノム編集技術市場分析
-
競争状況
-
主要企業のプロフィール
Report Details
The Genome Editing Technologies Market Report 2022-2032: This report will prove invaluable to leading firms striving for new revenue pockets if they wish to understand the industry and its underlying dynamics better. It will be useful for companies that would like to expand into different industries or to expand their existing operations in a new region.
The rise in chronic illnesses and infectious diseases is a primary driver of the genome editing technologies market
Cancer is one of the world’s leading health problems, affecting millions of people of all ages and genders and having a significant influence on the quality of life. The cancer incidence rate was 20 million new in 2020 and is expected to reach 30 million new cases per year by 2040. Genome editing technologies provide new opportunities in fundamental cancer research and diagnostics, with advantages such as simple design, rapid operation, low cost, and robust scaling. CRISPR/Cas is a rapidly evolving editing technique that is been applied to almost all genomic targets. Several genome editing techniques, including zinc finger endonuclease (ZFN), transcription activator-like effector nuclease (TALEN), and the clustered regularly interspaced short palindromic repeats/CRISPR associated nuclease (CRISPR/Cas) system, have been developed to provide efficient gene editing for the treatment of cancers, infectious diseases, and genetic disorders. Furthermore, CRISPR gene editing is becoming an increasingly significant technique in the field of infectious disease research.
CRISPR has the potential to treat a wide range of infectious diseases, including viruses, bacteria, and fungi. CRISPR has a wide range of applications in the research of viral diseases and the creation of new therapies, and the discovery of RNA-targeting Cas nucleases has opened up new avenues for targeting RNA viruses, including SARS-CoV-2 vaccines.
Personalization of gene therapy faces a significant barrier in genome editing technologies
Personalization is the most significant barrier to autologous therapies since it introduces unpredictability into the process, both qualitatively and quantitatively (e.g., the number of cells harvested from each patient). It complicates scaling the procedure and necessitates the development of flexible cell culture platforms to accommodate the variety in the kind and number of cells taken from patients. It implies that several platforms must be run in parallel using a scale-out method rather than a scale-up approach. Some contract development and manufacturing organizations (CDMOs) have already penetrated this market to serve this need.
What Questions Should You Ask before Buying a Market Research Report?
• How is the Genome Editing Technologies market evolving?
• What is driving and restraining the Genome Editing Technologies market?
• How will each Genome Editing Technologies submarket segment grow over the forecast period and how much revenue will these submarkets account for in 2032?
• How will the market shares for each Genome Editing Technologies submarket develop from 2022 to 2032?
• What will be the main driver for the overall market from 2022 to 2032?
• Will leading Genome Editing Technologies markets broadly follow the macroeconomic dynamics, or will individual national markets outperform others?
• How will the market shares of the national markets change by 2032 and which geographical region will lead the market in 2032?
• Who are the leading players and what are their prospects over the forecast period?
• What are the Genome Editing Technologies projects for these leading companies?
• How will the industry evolve during the period between 2020 and 2032? What are the implications of Genome Editing Technologies projects taking place now and over the next 10 years?
• Is there a greater need for product commercialization to further scale the Genome Editing Technologies market?
• Where is the Genome Editing Technologies market heading and how can you ensure you are at the forefront of the market?
• What are the best investment options for new product and service lines?
• What are the key prospects for moving companies into a new growth path and C-suite?
You need to discover how this will impact the Genome Editing Technologies market today, and over the next 10 years:
• Our 416-page report provides 154 tables and 279 charts/graphs exclusively to you.
• The report highlights key lucrative areas in the industry so you can target them – NOW.
• It contains in-depth analysis of global, regional and national sales and growth.
• It highlights for you the key successful trends, changes and revenue projections made by your competitors.
This report tells you TODAY how the Genome Editing Technologies market will develop in the next 10 years, and in line with the variations in COVID-19 economic recession and bounce. This market is more critical now than at any point over the last 10 years.
The report delivers exclusive COVID-19 variations and economic data specific to your market.
Forecasts to 2032 and other analyses reveal commercial prospects
• In addition to revenue forecasting to 2032, our new study provides you with recent results, growth rates, and market shares.
• You will find original analyses, with business outlooks and developments.
• Discover qualitative analyses (including market dynamics, drivers, opportunities, restraints and challenges), cost structure, impact of rising Genome Editing Technologies prices and recent developments.
This report includes data analysis and invaluable insight into how COVID-19 will affect the industry and your company. Four COVID-19 recovery patterns and their impact, namely, “V”, “L”, “W” and “U” are discussed in this report.
Segments Covered in the Report
Type
• CRISPR
• TALEN
• ZFN
• Antisense
• Others
Application
• Cell Line Engineering
• Genetic Engineering
• Diagnostic applications
• Drug discovery & development
• Others
End-user
• Biotechnology companies
• Pharmaceutical companies
• Academic & Government Research Institutes
• Others
In addition to the revenue predictions for the overall world market and segments, you will also find revenue forecasts for four regional and 20 leading national markets:
North America
• U.S.
• Canada
• Mexico
Europe
• Germany
• Spain
• United Kingdom
• France
• Italy
• Rest of Europe
Asia Pacific
• China
• Japan
• India
• Australia
• South Korea
• Rest of Asia Pacific
LAMEA
• Brazil
• Turkey
• Saudi Arabia
• South Africa
• UAE
• Rest of Latin America
The report also includes profiles and for some of the leading companies in the Genome Editing Technologies Market, 2022 to 2032, with a focus on this segment of these companies’ operations.
Leading companies and the potential for market growth
• Agilent Technologies Inc.
• CRISPR Therapeutics AG
• Editas Medicine
• GenScript
• Lonza
• Merck KGaA
• Precision Biosciences
• Sangamo Therapeutics Inc.
• Tecan Life Sciences
• Thermo Fisher Scientific Inc.
Overall world revenue for Genome Editing Technologies Market, 2022 to 2032 in terms of value the market will surpass US$ 4,225.48 million in 2022, our work calculates. We predict strong revenue growth through to 2032. Our work identifies which organizations hold the greatest potential. Discover their capabilities, progress, and commercial prospects, helping you stay ahead.
How will the Genome Editing Technologies Market, 2022 to 2032 report help you?
In summary, our 410+ page report provides you with the following knowledge:
• Revenue forecasts to 2032 for Genome Editing Technologies Market, 2022 to 2032 Market, with forecasts market by techniques and company size, each forecast at a global and regional level – discover the industry’s prospects, finding the most lucrative places for investments and revenues.
• Revenue forecasts to 2032 for four regional and 17 key national markets – See forecasts for the Genome Editing Technologies Market, 2022 to 2032 market in North America, Europe, Asia-Pacific and LAMEA. Also forecasted is the market in the US, Canada, Mexico, Brazil, Germany, France, UK, Italy, China, India, Japan, and Australia among other prominent economies.
• Prospects for established firms and those seeking to enter the market – including company profiles for 12 of the major companies involved in the Genome Editing Technologies Market, 2022 to 2032.
Find quantitative and qualitative analyses with independent predictions. Receive information that only our report contains, staying informed with invaluable business intelligence.
Information found nowhere else
With our new report, you are less likely to fall behind in knowledge or miss out on opportunities. See how our work could benefit your research, analyses, and decisions. Visiongain’s study is for everybody needing commercial analyses for the Genome Editing Technologies Market, 2022 to 2032, market-leading companies. You will find data, trends and predictions.
ページTOPに戻る
Table of Contents
Table of Contents
1. Report Overview
1.1 Objectives of the Study
1.2 Introduction to Genome editing technologies Market
1.3 What This Report Delivers
1.4 Why You Should Read This Report
1.5 Key Questions Answered By This Analytical Report Include:
1.6 Who is This Report For?
1.7 Methodology
1.7.1 Market Definitions
1.7.2 Market Evaluation & Forecasting Methodology
1.7.3 Data Validation
1.8 Frequently Asked Questions (FAQs)
1.9 Associated Visiongain Reports
1.10 About Visiongain
2 Executive Summary
3 Premium Insights
3.1 Geographical Snapshot: Global Genome editing technologies Market
3.2 Type Segment: Market Attractiveness Index
3.3 Application Segment: Market Attractiveness Index
3.4 End-users Segment: Market Attractiveness Index
4 Market Overview
4.1 Key Findings
4.2 Market Dynamics
4.2.1 Market Driving Factors
4.2.2 Market Restraining Factors
4.2.3 Market Opportunities
4.2.4 Market Challenges
4.3 COVID-19 Impact Analysis
4.4 Porter’s Five Forces Analysis
4.4.1 Supplier Power (Medium to High)
4.4.2 Buyer Power (Low to Medium)
4.4.3 Competitive Rivalry (Medium to High)
4.4.4 Threat from Substitutes (Low to Medium)
4.4.5 Threat of New Entrants (Low to Medium)
4.5 PESTLE Analysis
4.5.1 Political
4.5.2 Economical
4.5.3 Environment
4.5.4 Social
4.5.5 Technology
4.5.6 Legal
5 Global Genome Editing Technologies Market Analysis by Type
5.1 Key Findings
5.2 Type Segment Growth Prospects
5.3 CRISPR
5.3.1 Key Statistics for Leading CRISPR-Based Therapeutic Companies and Agents in Clinical Development, 2021
5.3.2 Top 15 CRISPR Start-up Companies Shaping Biotech and Medicine's Future, 2022
5.3.3 CRISPR-Cas CLINICAL TRIALS, 2022
5.3.4 Emerging CRISPR Therapies, 2022
5.3.5 CRISPR Market Forecast by Region, 2022-2032 (US$ Bn)
5.3.6 CRISPR Market Share by Region, 2022-2032 (%)
5.3.7 Key CRISPR-Based Findings
5.4 TALEN
5.4.1 TALEN Clinical Trials
5.4.2 TALEN Market Forecast by Region, 2022-2032 (US$ Bn)
5.4.3 TALEN Market Share by Region, 2022-2032 (%)
5.5 ZFN
5.5.1 ZINC FINGER NUCLEASE (ZFN) Clinical Trials, 2022
5.5.2 ZFN Market Forecast by Region, 2022-2032 (US$ Bn)
5.5.3 ZFN Market Share by Region, 2022-2032 (%)
5.6 Antisense
5.6.1 Clinical development activities of antisense medicines
5.6.2 Antisense Market Forecast by Region, 2022-2032 (US$ Bn)
5.6.3 Antisense Market Share by Region, 2022-2032 (%)
5.7 Others
5.7.1 Others Market Forecast by Region, 2022-2032 (US$ Bn)
5.7.2 Others Market Share by Region, 2022-2032 (%)
5.8 Global Genome editing technologies Market Size Estimation and Forecast by Type
6 Global Genome editing technologies Market Analysis by Application
6.1 Key Findings
6.2 Application Segment Growth Prospects
6.3 Cell Line Engineering
6.3.1 Cell Line Engineering Market Forecast by Region, 2022-2032 (US$ Bn)
6.3.2 Cell Line Engineering Market Share by Region, 2022-2032 (%)
6.4 Genetic Engineering
6.4.1 Genetic Engineering Market Forecast by Region, 2022-2032 (US$ Bn)
6.4.2 Genetic Engineering Market Share by Region, 2022-2032 (%)
6.5 Diagnostic applications
6.5.1 Diagnostic applications Market Forecast by Region, 2022-2032 (US$ Bn)
6.5.2 Diagnostic Applications Market Share by Region, 2022-2032 (%)
6.6 Drug discovery & development
6.6.1 RNA drugs approvals
6.6.2 Notable drug approvals
6.6.3 Notable clinical trial results (3Q21)
6.6.4 Drug Discovery & Development Market Forecast by Region, 2022-2032 (US$ Bn)
6.6.5 Drug Discovery & Development Applications Market Share by Region, 2022-2032 (%)
6.7 Others
6.7.1 Others Market Forecast by Region, 2022-2032 (US$ Bn)
6.7.2 Other Applications Market Share by Region, 2022-2032 (%)
6.8 Global Genome editing technologies Market Size Estimation and Forecast by Application
7 Global Genome editing technologies Market Analysis by End-user
7.1 Key Findings
7.2 End-user Segment Growth Prospects
7.3 Biotechnology companies
7.3.1 Biotechnology Companies Market Forecast by Region, 2022-2032 (US$ Bn)
7.3.2 Biotechnology companies Market Share by Region, 2022-2032 (%)
7.4 Pharmaceutical companies
7.4.1 Pharmaceutical Companies Market Forecast by Region, 2022-2032 (US$ Bn)
7.4.2 Pharmaceutical companies Market Share by Region, 2022-2032 (%)
7.5 Academic & Government Research Institutes
7.5.1 Academic & Government Research Institutes Market Forecast by Region, 2022-2032 (US$ Bn)
7.5.2 Academic & Government Research Institutes Market Share by Region, 2022-2032 (%)
7.6 Others
7.6.1 Others Market Forecast by Region, 2022-2032 (US$ Bn)
7.6.2 Others Market Share by Region, 2022-2032 (%)
7.7 Global Genome editing technologies Market Size Estimation and Forecast by End-User
8 North America Genome editing technologies Market Analysis
8.1 Key Findings
8.2 North America Genome editing technologies Market Attractiveness Index
8.3 North America Genome editing technologies Market by Country, 2022, 2027 & 2032 (US$ Mn)
8.4 North America Genome Editing Technologies Market Size Estimation and Forecast by Country
8.5 North America Genome editing technologies Market Size Estimation and Forecast by Type
8.6 North America Genome editing technologies Market Size Estimation and Forecast by Application
8.7 North America Genome editing technologies Market Size Estimation and Forecast by End-users
8.8 U. S.
8.8.1 U.S. Genome editing technologies Market by Type
8.8.2 US Genome editing technologies Market Size Estimation and Forecast by Application
8.8.3 US Genome editing technologies Market Size Estimation and Forecast by End-users
8.9 Canada
8.9.1 Canada Genome editing technologies Market by Type
8.9.2 Canada Genome editing technologies Market Size Estimation and Forecast by Application
8.9.3 Canada Genome editing technologies Market Size Estimation and Forecast by End-users
9 Europe Genome editing technologies Market Analysis
9.1 Key Findings
9.2 Europe Genome editing technologies Market Attractiveness Index
9.3 Europe Genome editing technologies Market by Country, 2022, 2027 & 2032 (US$ Mn)
9.4 Europe Genome editing technologies Market Size Estimation and Forecast by Country
9.5 Europe Genome editing technologies Market Size Estimation and Forecast by Type
9.6 Europe Genome editing technologies Market Size Estimation and Forecast by Application
9.7 Europe Genome editing technologies Market Size Estimation and Forecast by End-users
9.8 Germany
9.8.1 Germany Genome editing technologies Market by Type
9.8.2 Germany Genome editing technologies Market Size Estimation and Forecast by Application
9.8.3 Germany Genome editing technologies Market Size Estimation and Forecast by End-users
9.9 UK
9.9.1 UK Genome editing technologies Market by Type
9.9.2 UK Genome editing technologies Market Size Estimation and Forecast by Application
9.9.3 UK Genome editing technologies Market Size Estimation and Forecast by End-users
9.10 France
9.10.1 France Genome editing technologies Market by Type
9.10.2 France Genome editing technologies Market Size Estimation and Forecast by Application
9.10.3 France Genome editing technologies Market Size Estimation and Forecast by End-users
9.11 Italy
9.11.1 Italy Genome editing technologies Market by Type
9.11.2 Italy Genome editing technologies Market Size Estimation and Forecast by Application
9.11.3 Italy Genome editing technologies Market Size Estimation and Forecast by End-users
9.12 Spain
9.12.1 Spain Genome editing technologies Market by Type
9.12.2 Spain Genome editing technologies Market Size Estimation and Forecast by Application
9.12.3 Spain Genome editing technologies Market Size Estimation and Forecast by End-users
9.13 Russia
9.13.1 Russia Genome editing technologies Market by Type
9.13.2 Russia Genome editing technologies Market Size Estimation and Forecast by Application
9.13.3 Russia Genome editing technologies Market Size Estimation and Forecast by End-users
9.14 Rest of Europe
9.14.1 Rest of Europe Genome editing technologies Market by Type
9.14.2 Rest of Europe Genome editing technologies Market Size Estimation and Forecast by Application
9.14.3 Rest of Europe Genome editing technologies Market Size Estimation and Forecast by End-users
10 Asia Pacific Genome editing technologies Market Analysis
10.1 Key Findings
10.2 Asia Pacific Genome editing technologies Market Attractiveness Index
10.3 Asia Pacific Genome editing technologies Market by Country, 2022, 2027 & 2032 (US$ Mn)
10.4 Asia Pacific Genome editing technologies Market Size Estimation and Forecast by Country
10.5 Asia Pacific Genome editing technologies Market Size Estimation and Forecast by Type
10.6 Asia Pacific Genome editing technologies Market Size Estimation and Forecast by Application
10.7 Asia Pacific Genome editing technologies Market Size Estimation and Forecast by End-users
10.8 China
10.8.1 China Genome editing technologies Market by Type
10.8.2 China Genome editing technologies Market Size Estimation and Forecast by Application
10.8.3 China Genome editing technologies Market Size Estimation and Forecast by End-users
10.9 Japan
10.9.1 Japan Genome editing technologies Market by Type
10.9.2 Japan Genome editing technologies Market Size Estimation and Forecast by Application
10.9.3 Japan Genome editing technologies Market Size Estimation and Forecast by End-users
10.10 India
10.10.1 India Genome editing technologies Market by Type
10.10.2 India Genome editing technologies Market Size Estimation and Forecast by Application
10.10.3 India Genome editing technologies Market Size Estimation and Forecast by End-users
10.11 Philippines
10.11.1 Philippines Genome editing technologies Market by Type
10.11.2 Philippines Genome editing technologies Market Size Estimation and Forecast by Application
10.11.3 Philippines Genome editing technologies Market Size Estimation and Forecast by End-users
10.12 South Korea
10.12.1 South Korea Genome editing technologies Market by Type
10.12.2 South Korea Genome editing technologies Market Size Estimation and Forecast by Application
10.12.3 South Korea Genome editing technologies Market Size Estimation and Forecast by End-users
10.13 Rest of Asia Pacific
10.13.1 Rest of Asia Pacific Genome editing technologies Market by Type
10.13.2 Rest of Asia Pacific Genome editing technologies Market Size Estimation and Forecast by Application
10.13.3 Rest of Asia Pacific Genome editing technologies Market Size Estimation and Forecast by End-users
11 Latin America Genome editing technologies Market Analysis
11.1 Key Findings
11.2 Latin America Genome editing technologies Market Attractiveness Index
11.3 Latin America Genome editing technologies Market by Country, 2022, 2027 & 2032 (US$ bn)
11.4 Latin America Genome editing technologies Market Size Estimation and Forecast by Country
11.5 Latin America Genome editing technologies Market Size Estimation and Forecast by Type
11.6 Latin America Genome editing technologies Market Size Estimation and Forecast by Application
11.7 Latin America Genome editing technologies Market Size Estimation and Forecast by End-users
11.8 Brazil
11.8.1 Brazil Genome editing technologies Market by Type
11.8.2 Brazil Genome editing technologies Market Size Estimation and Forecast by Application
11.8.3 Brazil Genome editing technologies Market Size Estimation and Forecast by End-users
11.9 Argentina
11.9.1 Argentina Genome editing technologies Market by Type
11.9.2 Argentina Genome editing technologies Market Size Estimation and Forecast by End-users
11.10 Rest of Latin America
11.10.1 Rest of Latin America Genome editing technologies Market by Type
11.10.2 Rest of Latin America Genome editing technologies Market Size Estimation and Forecast by Application
11.10.3 Rest of Latin America Genome editing technologies Market Size Estimation and Forecast by End-users
12 Middle East & Africa Genome editing technologies Market Analysis
12.1 Key Findings
12.2 Middle East & Africa Genome editing technologies Market Attractiveness Index
12.3 Middle East & Africa Genome editing technologies Market by Country, 2022, 2027 & 2032 (US$ bn)
12.4 Middle East & Africa Genome editing technologies Market Size Estimation and Forecast by Country
12.5 Middle East & Africa Genome editing technologies Market Size Estimation and Forecast by Type
12.6 Middle East & Africa Genome editing technologies Market Size Estimation and Forecast by Application
12.7 Middle East & Africa Genome editing technologies Market Size Estimation and Forecast by End-users
12.8 GCC
12.8.1 GCC Genome editing technologies Market by Type
12.8.2 GCC Genome editing technologies Market Size Estimation and Forecast by Application
12.8.3 GCC Genome editing technologies Market Size Estimation and Forecast by End-users
12.9 South Africa
12.9.1 South Africa Genome editing technologies Market by Type
12.9.2 South Africa Genome editing technologies Market Size Estimation and Forecast by Application
12.9.3 South Africa Genome editing technologies Market Size Estimation and Forecast by End-users
12.10 Rest of Middle East & Africa
12.10.1 Rest of Middle East & Africa Genome editing technologies Market by Type
12.10.2 Rest of Middle East & Africa Genome editing technologies Market Size Estimation and Forecast by Application
12.10.3 Rest of Middle East & Africa Genome editing technologies Market Size Estimation and Forecast by End-users
13 Competitive Landscape
13.1 Company Ranking
13.2 Key Business Strategy Analysis
13.3 Thermo Fisher Scientific Inc
13.3.1 Company Snapshot
13.3.2 Company Overview
13.3.3 Financial Analysis
13.3.4 Product Benchmarking
13.3.5 Strategic Outlook
13.4 Merck KGaA
13.4.1 Company Snapshot
13.4.2 Company Overview
13.4.3 Financial Analysis
13.4.4 Product Benchmarking
13.4.5 Strategic Outlook
13.5 GenScript
13.5.1 Company Snapshot
13.5.2 Company Overview
13.5.3 Financial Analysis
13.5.4 Product Benchmarking
13.5.5 Strategic Outlook
13.6 Sangamo Therapeutics Inc.
13.6.1 Company Snapshot
13.6.2 Company Overview
13.6.3 Financial Analysis
13.6.4 Product Benchmarking
13.6.5 Strategic Outlook
13.7 Lonza
13.7.1 Company Snapshot
13.7.2 Company Overview
13.7.3 Financial Analysis
13.7.4 Product Benchmarking
13.7.5 Strategic Outlook
13.8 Editas Medicine
13.8.1 Company Snapshot
13.8.2 Company Overview
13.8.3 Financial Analysis
13.8.4 Product Benchmarking
13.8.5 Strategic Outlook
13.9 CRISPR Therapeutics AG
13.9.1 Company Snapshot
13.9.2 Company Overview
13.9.3 Financial Analysis
13.9.4 Product Benchmarking
13.9.5 Strategic Outlook
13.10 Agilent Technologies Inc.
13.10.1 Company Snapshot
13.10.2 Company Overview
13.10.3 Financial Analysis
13.10.4 Product Benchmarking
13.10.5 Strategic Outlook
13.11 Precision Biosciences
13.11.1 Company Snapshot
13.11.2 Company Overview
13.11.3 Financial Analysis
13.11.4 Product Benchmarking
13.11.5 Strategic Outlook
13.12 Tecan Life Sciences
13.12.1 Company Snapshot
13.12.2 Company Overview
13.12.3 Financial Analysis
13.12.4 Product Benchmarking
13.12.5 Strategic Outlook
14 Conclusion and Recommendations
14.1 Concluding Remarks from Visiongain
14.2 Recommendations for Market Players
List of Tables
Table 1 Global Genome Editing Technologies Market Snapshot, 2022 & 2032 (US$ million, CAGR %)
Table 2 Approved Cellular and Gene Therapy Products, 2022
Table 3 Global Genome editing technologies Market by Region, 2022-2032 (US$ Mn, AGR (%), CAGR (%)): “V” Shaped Recovery Scenario
Table 4 Global Genome editing technologies Market by Region, 2022-2032 (US$ Mn, AGR (%), CAGR (%)): “U” Shaped Recovery Scenario
Table 5 Global Genome editing technologies Market by Region, 2022-2032 (US$ Mn, AGR (%), CAGR (%)): “W” Shaped Recovery Scenario
Table 6 Global Genome editing technologies Market by Region, 2022-2032 (US$ Mn, AGR (%), CAGR(%)): “L” Shaped Recovery Scenario
Table 7 CRISPR Market Forecast by Region, 2022-2032 (US$ million, AGR%, CAGR %)
Table 8 CRISPR Market Forecast by Region, 2022-2032 (US$ million, AGR%, CAGR %)
Table 9 TALEN Market Forecast by Region, 2022-2032 (US$ million, AGR%, CAGR %)
Table 10 ZFN Market Forecast by Region, 2022-2032 (US$ million, AGR%, CAGR%)
Table 11 Antisense Market Forecast by Region, 2022-2032 (US$ million, AGR%, CAGR %)
Table 12 Others Market Forecast by Region, 2022-2032 (US$ million, AGR%, CAGR %)
Table 13 Global Genome editing technologies Market Forecast by Type, 2022-2032 (US$ million, AGR%, CAGR %)
Table 14 Thermo Fischer Cell Line Services
Table 15 CRISPR Market Forecast by Region, 2022-2032 (US$ million, AGR%, CAGR %)
Table 16 Genetic Engineering Market Forecast by Region, 2022-2032 (US$ million, AGR%, CAGR %)
Table 17 Diagnostic applications Market Forecast by Region, 2022-2032 (US$ million, AGR%, CAGR %)
Table 18 RNA Drugs Approvals
Table 19 Drugs Approvals
Table 20 Notable Clinical Trials Results
Table 21 Drug Discovery & Development Market Forecast by Region, 2022-2032 (US$ million, AGR%, CAGR %)
Table 22 Others Market Forecast by Region, 2022-2032 (US$ million, AGR%, CAGR %)
Table 23 Global Genome editing technologies Market Forecast by Application, 2022-2032 (US$ million, AGR%, CAGR %)
Table 24 Biotechnology Companies Market Forecast by Region, 2022-2032 (US$ million, AGR%, CAGR %)
Table 25 Pharmaceutical Companies Market Forecast by Region, 2022-2032 (US$ million, AGR%, CAGR %)
Table 26 Academic & Government Research Institutes Market Forecast by Region, 2022-2032 (US$ million, AGR%, CAGR %)
Table 27 Others Market Forecast by Region, 2022-2032 (US$ million, AGR%, CAGR %)
Table 28 Global Genome editing technologies Market Forecast by End-User, 2022-2032 (US$ million, AGR%, CAGR %)
Table 29 North America Genome editing technologies Market Forecast by Country, 2022-2032 (US$ million, AGR%, CAGR %)
Table 30 North America Genome editing technologies Market Forecast by Type, 2022-2032 (US$ million, AGR%, CAGR %)
Table 31 North America Genome editing technologies Market Forecast by Application, 2022-2032 (US$ million, AGR%, CAGR %)
Table 32 North America Genome editing technologies Market Forecast by End-users, 2022-2032 (US$ million, AGR%, CAGR %)
Table 33 U.S. Genome editing technologies Market Forecast, 2022-2032 (US$ million, AGR%, CAGR %)
Table 34 US Genome editing technologies Market Forecast by Type, 2022-2032 (US$ million, AGR%, CAGR %)
Table 35 US Genome editing technologies Market Forecast by Application, 2022-2032 (US$ million, AGR%, CAGR %)
Table 36 US Genome editing technologies Market Forecast by End-users, 2022-2032 (US$ million, AGR%, CAGR %)
Table 37 Canada Genome editing technologies Market Forecast, 2022-2032 (US$ million, AGR%, CAGR %)
Table 38 Canada Genome editing technologies Market Forecast by Type, 2022-2032 (US$ million, AGR%, CAGR %)
Table 39 Canada Genome editing technologies Market Forecast by Application, 2022-2032 (US$ million, AGR%, CAGR %)
Table 40 Canada Genome editing technologies Market Forecast by End-users, 2022-2032 (US$ million, AGR%, CAGR %)
Table 41 Europe Genome editing technologies Market Forecast by Country, 2022-2032 (US$ million, AGR%, CAGR %)
Table 42 Europe Genome editing technologies Market Forecast by Type, 2022-2032 (US$ million, AGR%, CAGR %)
Table 43 Europe Genome editing technologies Market Forecast by Application, 2022-2032 (US$ million, AGR%, CAGR %)
Table 44 Europe Genome editing technologies Market Forecast by End-users, 2022-2032 (US$ million, AGR%, CAGR %)
Table 45 Germany Genome editing technologies Market Forecast, 2022-2032 (US$ million, AGR%, CAGR %)
Table 46 Germany Genome editing technologies Market Forecast by Type, 2022-2032 (US$ million, AGR%, CAGR %)
Table 47 Germany Genome editing technologies Market Forecast by Application, 2022-2032 (US$ million, AGR%, CAGR %)
Table 48 Germany Genome editing technologies Market Forecast by End-users, 2022-2032 (US$ million, AGR%, CAGR %)
Table 49 UK Genome editing technologies Market Forecast, 2022-2032 (US$ million, AGR%, CAGR %)
Table 50 UK Genome editing technologies Market Forecast by Type, 2022-2032 (US$ million, AGR%, CAGR %)
Table 51 UK Genome editing technologies Market Forecast by Application, 2022-2032 (US$ million, AGR%, CAGR %)
Table 52 UK Genome editing technologies Market Forecast by End-users, 2022-2032 (US$ million, AGR%, CAGR %)
Table 53 France Genome editing technologies Market Forecast, 2022-2032 (US$ million, AGR%, CAGR %)
Table 54 France Genome editing technologies Market Forecast by Type, 2022-2032 (US$ million, AGR%, CAGR %)
Table 55 France Genome editing technologies Market Forecast by Application, 2022-2032 (US$ million, AGR%, CAGR %)
Table 56 France Genome editing technologies Market Forecast by End-users, 2022-2032 (US$ million, AGR%, CAGR %)
Table 57 Italy Genome editing technologies Market Forecast, 2022-2032 (US$ million, AGR%, CAGR %)
Table 58 Italy Genome editing technologies Market Forecast by Type, 2022-2032 (US$ million, AGR%, CAGR %)
Table 59 Italy Genome editing technologies Market Forecast by Application, 2022-2032 (US$ million, AGR%, CAGR %)
Table 60 Italy Genome editing technologies Market Forecast by End-users, 2022-2032 (US$ million, AGR%, CAGR %)
Table 61 Spain Genome editing technologies Market Forecast, 2022-2032 (US$ million, AGR%, CAGR %)
Table 62 Spain Genome editing technologies Market Forecast by Type, 2022-2032 (US$ million, AGR%, CAGR %)
Table 63 Spain Genome editing technologies Market Forecast by Application, 2022-2032 (US$ million, AGR%, CAGR %)
Table 64 Spain Genome editing technologies Market Forecast by End-users, 2022-2032 (US$ million, AGR%, CAGR %)
Table 65 Russia Genome editing technologies Market Forecast, 2022-2032 (US$ million, AGR%, CAGR %)
Table 66 Russia Genome editing technologies Market Forecast by Type, 2022-2032 (US$ million, AGR%, CAGR %)
Table 67 Russia Genome editing technologies Market Forecast by Application, 2022-2032 (US$ million, AGR%, CAGR %)
Table 68 Russia Genome editing technologies Market Forecast by End-users, 2022-2032 (US$ million, AGR%, CAGR %)
Table 69 Rest of Europe Genome editing technologies Market Forecast, 2022-2032 (US$ million, AGR%, CAGR %)
Table 70 Rest of Europe Genome editing technologies Market Forecast by Type, 2022-2032 (US$ million, AGR%, CAGR %)
Table 71 Rest of Europe Genome editing technologies Market Forecast by Application, 2022-2032 (US$ million, AGR%, CAGR %)
Table 72 Rest of Europe Genome editing technologies Market Forecast by End-users, 2022-2032 (US$ million, AGR%, CAGR %)
Table 73 Asia Pacific Genome editing technologies Market Forecast by Country, 2022-2032 (US$ million, AGR%, CAGR %)
Table 74 Asia Pacific Genome editing technologies Market Forecast by Type, 2022-2032 (US$ million, AGR%, CAGR %)
Table 75 Asia Pacific Genome editing technologies Market Forecast by Application, 2022-2032 (US$ million, AGR%, CAGR %)
Table 76 Asia Pacific Genome editing technologies Market Forecast by End-users, 2022-2032 (US$ million, AGR%, CAGR %)
Table 77 China Genome editing technologies Market Forecast, 2022-2032 (US$ million, AGR%, CAGR %)
Table 78 China Genome editing technologies Market Forecast by Type, 2022-2032 (US$ million, AGR%, CAGR %)
Table 79 China Genome editing technologies Market Forecast by Application, 2022-2032 (US$ million, AGR%, CAGR %)
Table 80 China Genome editing technologies Market Forecast by End-users, 2022-2032 (US$ million, AGR%, CAGR %)
Table 81 Japan Genome editing technologies Market Forecast, 2022-2032 (US$ million, AGR%, CAGR %)
Table 82 Japan Genome editing technologies Market Forecast by Type, 2022-2032 (US$ million, AGR%, CAGR %)
Table 83 Japan Genome editing technologies Market Forecast by Application, 2022-2032 (US$ million, AGR%, CAGR %)
Table 84 Japan Genome editing technologies Market Forecast by End-users, 2022-2032 (US$ million, AGR%, CAGR %)
Table 85 India Genome editing technologies Market Forecast, 2022-2032 (US$ million, AGR%, CAGR %)
Table 86 India Genome editing technologies Market Forecast by Type, 2022-2032 (US$ million, AGR%, CAGR %)
Table 87 India Genome editing technologies Market Forecast by Application, 2022-2032 (US$ million, AGR%, CAGR %)
Table 88 India Genome editing technologies Market Forecast by End-users, 2022-2032 (US$ million, AGR%, CAGR %)
Table 89 Philippines Genome editing technologies Market Forecast, 2022-2032 (US$ million, AGR%, CAGR %)
Table 90 Philippines Genome editing technologies Market Forecast by Type, 2022-2032 (US$ million, AGR%, CAGR %)
Table 91 Philippines Genome editing technologies Market Forecast by Application, 2022-2032 (US$ million, AGR%, CAGR %)
Table 92 Philippines Genome editing technologies Market Forecast by End-users, 2022- 2032 (US$ million, AGR%, CAGR %)
Table 93 South Korea Genome editing technologies Market Forecast, 2022-2032 (US$ million, AGR%, CAGR %)
Table 94 South Korea Genome editing technologies Market Forecast by Type, 2022-2032 (US$ million, AGR%, CAGR %)
Table 95 South Korea Genome editing technologies Market Forecast by Application, 2022-2032 (US$ million, AGR%, CAGR %)
Table 96 South Korea Genome editing technologies Market Forecast by End-users, 2022-2032 (US$ million, AGR%, CAGR %)
Table 97 Rest of Asia Pacific Genome editing technologies Market Forecast, 2022-2032 (US$ million, AGR%, CAGR %)
Table 98 Rest of Asia Pacific Genome editing technologies Market Forecast by Type, 2022-2032 (US$ million, AGR%, CAGR %)
Table 99 Rest of Asia Pacific Genome editing technologies Market Forecast by Application, 2022-2032 (US$ million, AGR%, CAGR %)
Table 100 Rest of Asia Pacific Genome editing technologies Market Forecast by End-users, 2022-2032 (US$ million, AGR%, CAGR %)
Table 101 Latin America Genome editing technologies Market Forecast by Country, 2022-2032 (US$ million, AGR%, CAGR %)
Table 102 Latin America Genome editing technologies Market Forecast by Type, 2022-2032 (US$ million, AGR%, CAGR %)
Table 103 Latin America Genome editing technologies Market Forecast by Application, 2022-2032 (US$ million, AGR%, CAGR %)
Table 104 Latin America Genome editing technologies Market Forecast by End-users, 2022-2032 (US$ million, AGR%, CAGR %)
Table 105 Brazil Genome editing technologies Market Forecast, 2022-2032 (US$ million, AGR%, CAGR %)
Table 106 Brazil Genome editing technologies Market Forecast by Type, 2022-2032 (US$ million, AGR%, CAGR %)
Table 107 Brazil Genome editing technologies Market Forecast by Application, 2022-2032 (US$ million, AGR%, CAGR %)
Table 108 Brazil Genome editing technologies Market Forecast by End-users, 2022-2032 (US$ million, AGR%, CAGR %)
Table 109 Argentina Genome editing technologies Market Forecast, 2022-2032 (US$ million, AGR%, CAGR %)
Table 110 Argentina Genome editing technologies Market Forecast by Type, 2022-2032 (US$ million, AGR%, CAGR %)
Table 111 Argentina Genome editing technologies Market Forecast by Application, 2022-2032 (US$ million, AGR%, CAGR %)
Table 112 Argentina Genome editing technologies Market Forecast by End-users, 2022-2032 (US$ million, AGR%, CAGR %)
Table 113 Rest of Latin America Genome editing technologies Market Forecast, 2022-2032 (US$ million, AGR%, CAGR %)
Table 114 Rest of Latin America Genome editing technologies Market Forecast by Type, 2022-2032 (US$ million, AGR%, CAGR %)
Table 115 Rest of Latin America Genome editing technologies Market Forecast by Application, 2022-2032 (US$ million, AGR%, CAGR %)
Table 116 Rest of Latin America Genome editing technologies Market Forecast by End-users, 2022-2032 (US$ million, AGR%, CAGR %)
Table 117 Middle East & Africa Genome editing technologies Market Forecast by Country, 2022-2032 (US$ million, AGR%, CAGR %)
Table 118 Middle East & Africa Genome editing technologies Market Forecast by Type, 2022-2032 (US$ million, AGR%, CAGR %)
Table 119 Middle East & Africa Genome editing technologies Market Forecast by Application, 2022-2032 (US$ million, AGR%, CAGR %)
Table 120 Middle East & Africa Genome editing technologies Market Forecast by End-users, 2022-2032 (US$ million, AGR%, CAGR%)
Table 121 GCC Genome editing technologies Market Forecast, 2022-2032 (US$ million, AGR%, CAGR %)
Table 122 GCC Genome editing technologies Market Forecast by Type, 2022-2032 (US$ million, AGR%, CAGR %)
Table 123 GCC Genome editing technologies Market Forecast by Application, 2022-2032 (US$ million, AGR%, CAGR %)
Table 124 GCC Genome editing technologies Market Forecast by End-users, 2022-2032 (US$ million, AGR%, CAGR %)
Table 125 South Africa Genome editing technologies Market Forecast, 2022-2032 (US$ million, AGR%, CAGR %)
Table 126 South Africa Genome editing technologies Market Forecast by Type, 2022-2032 (US$ million, AGR%, CAGR %)
Table 127 South Africa Genome editing technologies Market Forecast by Application, 2022-2032 (US$ million, AGR%, CAGR %)
Table 128 South Africa Genome editing technologies Market Forecast by End-users, 2022-2032 (US$ million, AGR%, CAGR %)
Table 129 Rest of Middle East & Africa Genome editing technologies Market Forecast, 2022-2032 (US$ million, AGR%, CAGR%)
Table 130 Rest of Middle East & Africa Genome editing technologies Market Forecast by Type, 2022-2032 (US$ million, AGR%, CAGR%)
Table 131 Rest of Middle East & Africa Genome editing technologies Market Forecast by Application, 2022-2032 (US$ million, AGR%, CAGR%)
Table 132 Rest of Middle East & Africa Genome editing technologies Market Forecast by End-users, 2022-2032 (US$ million, AGR%, CAGR%)
Table 133 Top 10 Ranking of Key Vendors in Genome Editing Technologies Market, 2021
Table 134 Key Business Strategies Adopted by Key Players in Global Genome editing technologies Market
Table 135 Thermo Fisher Scientific Inc: Key Details, (CEO, HQ, Revenue, Founded, No. of Employees, Company Type, Website, Business Segment)
Table 136 Thermo Fisher Scientific Inc.: Product Benchmarking
Table 137 Merck KGaA: Key Details, (CEO, HQ, Revenue, Founded, No. of Employees, Company Type, Website, Business Segment)
Table 138 Merck KGaA: Product Benchmarking
Table 139 GenScript: Key Details, (CEO, HQ, Revenue, Founded, No. of Employees, Company Type, Website, Business Segment)
Table 140 GenScript: Product Benchmarking
Table 141 Sangamo Therapeutics Inc.: Key Details, (CEO, HQ, Revenue, Founded, No. of Employees, Company Type, Website, Business Segment)
Table 142 Sangamo Therapeutics Inc.: Product Benchmarking
Table 143 Lonza: Key Details, (CEO, HQ, Revenue, Founded, No. of Employees, Company Type, Website, Business Segment)
Table 144 Lonza: Product Benchmarking
Table 145 Editas Medicine: Key Details, (CEO, HQ, Revenue, Founded, No. of Employees, Company Type, Website, Business Segment)
Table 146 Editas Medicine: Product Benchmarking
Table 147 CRISPR Therapeutics AG: Key Details, (CEO, HQ, Revenue, Founded, No. of Employees, Company Type, Website, Business Segment)
Table 148 CRISPR Therapeutics AG: Product Benchmarking
Table 149 Agilent Technologies Inc.: Key Details, (CEO, HQ, Revenue, Founded, No. of Employees, Company Type, Website, Business Segment)
Table 150 Agilent Technologies Inc.: Product Benchmarking
Table 151 Precision Biosciences: Key Details, (CEO, HQ, Revenue, Founded, No. of Employees, Company Type, Website, Business Segment)
Table 152 Precision Biosciences: Product Benchmarking
Table 153 Tecan Life Sciences: Key Details, (CEO, HQ, Revenue, Founded, No. of Employees, Company Type, Website, Business Segment)
Table 154 Tecan Life Sciences: Product Benchmarking
List of Figures
Figure 1 Global Genome editing technologies Market Segmentation
Figure 2 Breakdown of Primary Interviews: By Company Type, Designation, & Region
Figure 3 Global Genome editing technologies Market Forecast by Region: Market Attractiveness Index
Figure 4 Global Genome editing technologies Market by Type: Market Attractiveness Index
Figure 5 Global Genome editing technologies Market by Application: Market Attractiveness Index
Figure 6 Global Genome editing technologies Market by End-users: Market Attractiveness Index
Figure 7 Global Precision Medicine Market: Market Dynamics
Figure 8 Global COVID Impact Analysis: Genome editing technologies Market Recovery Scenarios
Figure 9 Global Genome editing technologies Market by Region, 2022-2032 (US$ Mn, AGR (%), CAGR (%)): “V” Shaped Recovery
Figure 10 Global Genome editing technologies Market by Region, 2022-2032 (US$ Mn, AGR (%), CAGR (%)): “U” Shaped Recovery
Figure 11 Global Genome editing technologies Market by Region, 2022-2032 (US$ Mn, AGR (%), CAGR (%)): “W” Shaped Recovery
Figure 12 Global Genome editing technologies Market by Region, 2022-2032 (US$ Mn, AGR (%), CAGR (%)): “L” Shaped Recovery
Figure 13 Global Precision Medicine Market: Porter’s Five Forces Analysis
Figure 14 Global Genome editing technologies Market Share Forecast by Type, 2022, 2027, 2032 (%)
Figure 15 CRISPR Market Forecast by Region, 2022-2032 (US$ million)
Figure 16 CRISPR Market Share Forecast by Region, 2022-2032 (%)
Figure 17 TALEN Market Forecast by Region, 2022-2032 (US$ million)
Figure 18 TALEN Market Share Forecast by Region, 2022-2032 (%)
Figure 19 ZFN Market Forecast by Region, 2022-2032 (US$ million)
Figure 20 ZFN Market Share Forecast by Region, 2022-2032 (%)
Figure 21 Antisense Market Forecast by Region, 2022-2032 (US$ million)
Figure 22 Antisense Market Share Forecast by Region, 2022-2032 (%)
Figure 23 CVDs Market Forecast by Region, 2022-2032 (US$ million)
Figure 24 Others Market Share Forecast by Region, 2022-2032 (%)
Figure 25 Global Genome editing technologies Market Forecast by Type, 2022-2032 (US$ million, AGR %)
Figure 26 Global Genome editing technologies Market Share Forecast by Type, 2022, 2027, 2032 (%)
Figure 27 Global Genome editing technologies Market Forecast by Application 2022, 2027, 2032 (Revenue, CAGR %)
Figure 28 Cell Line Engineering Market Forecast by Region, 2022-2032 (US$ million)
Figure 29 Cell Line Engineering Market Share Forecast by Region, 2022-2032 (%)
Figure 30 Genetic Engineering Market Forecast by Region, 2022-2032 (US$ million)
Figure 31 Genetic Engineering Market Share Forecast by Region, 2022-2032 (%)
Figure 32 Diagnostic Applications Market Forecast by Region, 2022-2032 (US$ million)
Figure 33 Genetic Engineering Market Share Forecast by Region, 2022-2032 (%)
Figure 34 Drug Discovery & Development Applications Market Forecast by Region, 2022-2032 (US$ million)
Figure 35 Drug Discovery & Development Market Share Forecast by Region, 2022-2032 (%)
Figure 36 Other Applications Market Forecast by Region, 2022-2032 (US$ million)
Figure 37 Other Market Share Forecast by Region, 2022-2032 (%)
Figure 38 Global Genome editing technologies Market Forecast by Type, 2022-2032 (US$ million, AGR %)
Figure 39 Global Genome editing technologies Market Forecast by Application 2022, 2027, 2032 (Revenue, CAGR %)
Figure 40 Global Genome editing technologies Market Forecast by End-User 2022, 2027, 2032 (%)
Figure 41 Biotechnology Companies Market Forecast by Region, 2022-2032 (US$ million)
Figure 42 Biotechnology Companies Market Share Forecast by Region, 2022-2032 (%)
Figure 43 Pharmaceutical Companies Market Forecast by Region, 2022-2032 (US$ million)
Figure 44 Biotechnology Companies Market Share Forecast by Region, 2022-2032 (%)
Figure 45 Academic & Government Research Institutes Market Forecast by Region, 2022-2032 (US$ million)
Figure 46 Academic & Government Research Institutes Market Share Forecast by Region, 2022-2032 (%)
Figure 47 Others Market Forecast by Region, 2022-2032 (US$ million)
Figure 48 Others Market Share Forecast by Region, 2022-2032 (%)
Figure 49 Global Genome editing technologies Market Forecast by Type, 2022-2032 (US$ million, AGR %)
Figure 50 Global Genome editing technologies Market Forecast by End-User 2022, 2027, 2032 (Revenue, CAGR %)
Figure 51 North America Genome editing technologies Market Attractiveness Index
Figure 52 North America Genome editing technologies Market by Region, 2022, 2027 & 2032 (US$ million)
Figure 53 North America Genome editing technologies Market Forecast by Country, 2022-2032 (US$ million, AGR %)
Figure 54 North America Genome editing technologies Market Share Forecast by Country, 2022 & 2032 (%)
Figure 55 North America Genome editing technologies Market Forecast by Type, 2022-2032 (US$ million, AGR %)
Figure 56 North America Genome editing technologies Market Share Forecast by Type, 2022 & 2032 (%)
Figure 57 North America Genome editing technologies Market Forecast by Application, 2022-2032 (US$ million, AGR %)
Figure 58 North America Genome editing technologies Market Share Forecast by Application, 2022 & 2032 (%)
Figure 59 North America Genome editing technologies Market Forecast by End-users, 2022-2032 (US$ million, AGR %)
Figure 60 North America Genome editing technologies Market Share Forecast by End-users, 2022 & 2032 (%)
Figure 61 U.S. Genome editing technologies Market Forecast, 2022-2032 (US$ million, AGR %)
Figure 62 U.S. Genome editing technologies Market Forecast by Type, 2022-2032 (US$ million, AGR %)
Figure 63 U.S. Genome editing technologies Market Share Forecast by Type, 2022 & 2032 (%)
Figure 64 US Genome editing technologies Market Forecast by Application, 2022-2032 (US$ million, AGR %)
Figure 65 US Genome editing technologies Market Share Forecast by Application, 2022 & 2032 (%)
Figure 66 US Genome editing technologies Market Forecast by End-users, 2022-2032 (US$ million, AGR %)
Figure 67 US Genome editing technologies Market Share Forecast by End-users, 2022 & 2032 (%)
Figure 68 Canada Genome editing technologies Market Forecast, 2022-2032 (US$ million, AGR %)
Figure 69 Canada Genome editing technologies Market Forecast by Type, 2022-2032 (US$ million, AGR %)
Figure 70 Canada Genome editing technologies Market Share Forecast by Type, 2022 & 2032 (%)
Figure 71 Canada Genome editing technologies Market Forecast by Application, 2022-2032 (US$ million, AGR %)
Figure 72 Canada Genome editing technologies Market Share Forecast by Application, 2022 & 2032 (%)
Figure 73 Canada Genome editing technologies Market Forecast by End-users, 2022-2032 (US$ million, AGR %)
Figure 74 Canada Genome editing technologies Market Share Forecast by End-users, 2022 & 2032 (%)
Figure 75 Europe Genome editing technologies Market Attractiveness Index
Figure 76 Europe Genome editing technologies Market by Region, 2022, 2027 & 2032 (US$ million)
Figure 77 Europe Genome editing technologies Market Forecast by Country, 2022-2032 (US$ million, AGR %)
Figure 78 Europe Genome editing technologies Market Share Forecast by Country, 2022 & 2032 (%)
Figure 79 Europe Genome editing technologies Market Forecast by Type, 2022-2032 (US$ million, AGR %)
Figure 80 Europe Genome editing technologies Market Share Forecast by Type, 2022 & 2032 (%)
Figure 81 Europe Genome editing technologies Market Forecast by Application, 2022-2032 (US$ million, AGR %)
Figure 82 Europe Genome editing technologies Market Share Forecast by Application, 2022 & 2032 (%)
Figure 83 Europe Genome editing technologies Market Forecast by End-users, 2022-2032 (US$ million, AGR %)
Figure 84 Europe Genome editing technologies Market Share Forecast by End-users, 2022 & 2032 (%)
Figure 85 Germany Genome editing technologies Market Forecast, 2022-2032 (US$ million, AGR %)
Figure 86 Germany Genome editing technologies Market Forecast by Type, 2022-2032 (US$ million, AGR %)
Figure 87 Germany Genome editing technologies Market Share Forecast by Type, 2022 & 2032 (%)
Figure 88 Germany Genome editing technologies Market Forecast by Application, 2022-2032 (US$ million, AGR %)
Figure 89 Germany Genome editing technologies Market Share Forecast by Application, 2022 & 2032 (%)
Figure 90 Germany Genome editing technologies Market Forecast by End-users, 2022-2032 (US$ million, AGR %)
Figure 91 Germany Genome editing technologies Market Share Forecast by End-users, 2022 & 2032 (%)
Figure 92 UK Genome editing technologies Market Forecast, 2022-2032 (US$ million, AGR %)
Figure 93 UK Genome editing technologies Market Forecast by Type, 2022-2032 (US$ million, AGR %)
Figure 94 UK Genome editing technologies Market Share Forecast by Type, 2022 & 2032 (%)
Figure 95 UK Genome editing technologies Market Forecast by Application, 2022-2032 (US$ million, AGR %)
Figure 96 UK Genome editing technologies Market Share Forecast by Application, 2022 & 2032 (%)
Figure 97 UK Genome editing technologies Market Forecast by End-users, 2022-2032 (US$ million, AGR %)
Figure 98 UK Genome editing technologies Market Share Forecast by End-users, 2022 & 2032 (%)
Figure 99 France Genome editing technologies Market Forecast, 2022-2032 (US$ million, AGR %)
Figure 100 France Genome editing technologies Market Forecast by Type, 2022-2032 (US$ million, AGR %)
Figure 101 France Genome editing technologies Market Share Forecast by Type, 2022 & 2032 (%)
Figure 102 France Genome editing technologies Market Forecast by Application, 2022-2032 (US$ million, AGR %)
Figure 103 France Genome editing technologies Market Share Forecast by Application, 2022 & 2032 (%)
Figure 104 France Genome editing technologies Market Forecast by End-users, 2022-2032 (US$ million, AGR %)
Figure 105 France Genome editing technologies Market Share Forecast by End-users, 2022 & 2032 (%)
Figure 106 Italy Genome editing technologies Market Forecast, 2022-2032 (US$ million, AGR %)
Figure 107 Italy Genome editing technologies Market Forecast by Type, 2022-2032 (US$ million, AGR %)
Figure 108 Italy Genome editing technologies Market Share Forecast by Type, 2022 & 2032 (%)
Figure 109 Italy Genome editing technologies Market Forecast by Application, 2022-2032 (US$ million, AGR %)
Figure 110 Italy Genome editing technologies Market Share Forecast by Application, 2022 & 2032 (%)
Figure 111 Italy Genome editing technologies Market Forecast by End-users, 2022-2032 (US$ million, AGR %)
Figure 112 Italy Genome editing technologies Market Share Forecast by End-users, 2022 & 2032 (%)
Figure 113 Spain Genome editing technologies Market Forecast, 2022-2032 (US$ million, AGR %)
Figure 114 Spain Genome editing technologies Market Forecast by Type, 2022-2032 (US$ million, AGR %)
Figure 115 Spain Genome editing technologies Market Share Forecast by Type, 2022 & 2032 (%)
Figure 116 Spain Genome editing technologies Market Forecast by Application, 2022-2032 (US$ million, AGR %)
Figure 117 Spain Genome editing technologies Market Share Forecast by Application, 2022 & 2032 (%)
Figure 118 Spain Genome editing technologies Market Forecast by End-users, 2022-2032 (US$ million, AGR %)
Figure 119 Spain Genome editing technologies Market Share Forecast by End-users, 2022 & 2032 (%)
Figure 120 Russia Genome editing technologies Market Forecast, 2022-2032 (US$ million, AGR %)
Figure 121 Russia Genome editing technologies Market Forecast by Type, 2022-2032 (US$ million, AGR %)
Figure 122 Russia Genome editing technologies Market Share Forecast by Type, 2022 & 2032 (%)
Figure 123 Russia Genome editing technologies Market Forecast by Application, 2022-2032 (US$ million, AGR %)
Figure 124 Russia Genome editing technologies Market Share Forecast by Application, 2022 & 2032 (%)
Figure 125 Russia Genome editing technologies Market Forecast by End-users, 2022-2032 (US$ million, AGR %)
Figure 126 Russia Genome editing technologies Market Share Forecast by End-users, 2022 & 2032 (%)
Figure 127 Rest of Europe Genome editing technologies Market Forecast, 2022-2032 (US$ million, AGR %)
Figure 128 Rest of Europe Genome editing technologies Market Forecast by Type, 2022-2032 (US$ million, AGR %)
Figure 129 Rest of Europe Genome editing technologies Market Share Forecast by Type, 2022 & 2032 (%)
Figure 130 Rest of Europe Genome editing technologies Market Forecast by Application, 2022-2032 (US$ million, AGR %)
Figure 131 Rest of Europe Genome editing technologies Market Share Forecast by Application, 2022 & 2032 (%)
Figure 132 Rest of Europe Genome editing technologies Market Forecast by End-users, 2022-2032 (US$ million, AGR %)
Figure 133 Rest of Europe Genome editing technologies Market Share Forecast by End-users, 2022 & 2032 (%)
Figure 134 Asia Pacific Genome editing technologies Market Attractiveness Index
Figure 135 Asia Pacific Genome editing technologies Market by Region, 2022, 2027 & 2032 (US$ million)
Figure 136 Asia Pacific Genome editing technologies Market Forecast by Country, 2022-2032 (US$ million, AGR %)
Figure 137 Asia Pacific Genome editing technologies Market Share Forecast by Country, 2022 & 2032 (%)
Figure 138 Asia Pacific Genome editing technologies Market Forecast by Type, 2022-2032 (US$ million, AGR %)
Figure 139 Asia Pacific Genome editing technologies Market Share Forecast by Type, 2022 & 2032 (%)
Figure 140 Asia Pacific Genome editing technologies Market Forecast by Application, 2022-2032 (US$ million, AGR %)
Figure 141 Asia Pacific Genome editing technologies Market Share Forecast by Application, 2022 & 2032 (%)
Figure 142 Asia Pacific Genome editing technologies Market Forecast by End-users, 2022-2032 (US$ million, AGR %)
Figure 143 Asia Pacific Genome editing technologies Market Share Forecast by End-users, 2022 & 2032 (%)
Figure 144 China Genome editing technologies Market Forecast, 2022-2032 (US$ million, AGR %)
Figure 145 China Genome editing technologies Market Forecast by Type, 2022-2032 (US$ million, AGR %)
Figure 146 China Genome editing technologies Market Share Forecast by Type, 2022 & 2032 (%)
Figure 147 China Genome editing technologies Market Forecast by Application, 2022-2032 (US$ million, AGR %)
Figure 148 China Genome editing technologies Market Share Forecast by Application, 2022 & 2032 (%)
Figure 149 China Genome editing technologies Market Forecast by End-users, 2022-2032 (US$ million, AGR %)
Figure 150 China Genome editing technologies Market Share Forecast by End-users, 2022 & 2032 (%)
Figure 151 Japan Genome editing technologies Market Forecast, 2022-2032 (US$ million, AGR %)
Figure 152 Japan Genome editing technologies Market Forecast by Type, 2022-2032 (US$ million, AGR %)
Figure 153 Japan Genome editing technologies Market Share Forecast by Type, 2022 & 2032 (%)
Figure 154 Japan Genome editing technologies Market Forecast by Application, 2022-2032 (US$ million, AGR %)
Figure 155 Japan Genome editing technologies Market Share Forecast by Application, 2022 & 2032 (%)
Figure 156 Japan Genome editing technologies Market Forecast by End-users, 2022-2032 (US$ million, AGR %)
Figure 157 Japan Genome editing technologies Market Share Forecast by End-users, 2022 & 2032 (%)
Figure 158 India Genome editing technologies Market Forecast, 2022-2032 (US$ million, AGR %)
Figure 159 India Genome editing technologies Market Forecast by Type, 2022-2032 (US$ million, AGR %)
Figure 160 India Genome editing technologies Market Share Forecast by Type, 2022 & 2032 (%)
Figure 161 India Genome editing technologies Market Forecast by Application, 2022-2032 (US$ million, AGR %)
Figure 162 India Genome editing technologies Market Share Forecast by Application, 2022 & 2032 (%)
Figure 163 India Genome editing technologies Market Forecast by End-users, 2022-2032 (US$ million, AGR %)
Figure 164 India Genome editing technologies Market Share Forecast by End-users, 2022 & 2032 (%)
Figure 165 Philippines Genome editing technologies Market Forecast, 2022-2032 (US$ million, AGR %)
Figure 166 Philippines Genome editing technologies Market Forecast by Type, 2022-2032 (US$ million, AGR %)
Figure 167 Philippines Genome editing technologies Market Share Forecast by Type, 2022 & 2032 (%)
Figure 168 Philippines Genome editing technologies Market Forecast by Application, 2022-2032 (US$ million, AGR %)
Figure 169 Philippines Genome editing technologies Market Share Forecast by Application, 2022 & 2032 (%)
Figure 170 Philippines Genome editing technologies Market Forecast by End-users, 2022-2032 (US$ million, AGR %)
Figure 171 Philippines Genome editing technologies Market Share Forecast by End-users, 2022 & 2032 (%)
Figure 172 South Korea Genome editing technologies Market Forecast, 2022-2032 (US$ million, AGR %)
Figure 173 South Korea Genome editing technologies Market Forecast by Type, 2022-2032 (US$ million, AGR %)
Figure 174 South Korea Genome editing technologies Market Share Forecast by Type, 2022 & 2032 (%)
Figure 175 South Korea Genome editing technologies Market Forecast by Application, 2022-2032 (US$ million, AGR %)
Figure 176 South Korea Genome editing technologies Market Share Forecast by Application, 2022 & 2032 (%)
Figure 177 South Korea Genome editing technologies Market Forecast by End-users, 2022-2032 (US$ million, AGR %)
Figure 178 South Korea Genome editing technologies Market Share Forecast by End-users, 2022 & 2032 (%)
Figure 179 Rest of Asia Pacific Genome editing technologies Market Forecast, 2022-2032 (US$ million, AGR %)
Figure 180 Rest of Asia Pacific Genome editing technologies Market Forecast by Type, 2022-2032 (US$ million, AGR %)
Figure 181 Rest of Asia Pacific Genome editing technologies Market Share Forecast by Type, 2022 & 2032 (%)
Figure 182 Rest of Asia Pacific Genome editing technologies Market Forecast by Application, 2022-2032 (US$ million, AGR %)
Figure 183 Rest of Asia Pacific Genome editing technologies Market Share Forecast by Application, 2022 & 2032 (%)
Figure 184 Rest of Asia Pacific Genome editing technologies Market Forecast by End-users, 2022-2032 (US$ million, AGR %)
Figure 185 Rest of Asia Pacific Genome editing technologies Market Share Forecast by End-users, 2022 & 2032 (%)
Figure 186 Latin America Genome editing technologies Market Attractiveness Index
Figure 187 Latin America Genome editing technologies Market by Region, 2022, 2027 & 2032 (US$ million)
Figure 188 Latin America Genome editing technologies Market Forecast by Country, 2022-2032 (US$ million, AGR %)
Figure 189 Latin America Genome editing technologies Market Share Forecast by Country, 2022 & 2032 (%)
Figure 190 Latin America Genome editing technologies Market Forecast by Type, 2022-2032 (US$ million, AGR %)
Figure 191 Latin America Genome editing technologies Market Share Forecast by Type, 2022 & 2032 (%)
Figure 192 Latin America Genome editing technologies Market Forecast by Application, 2022-2032 (US$ million, AGR %)
Figure 193 Latin America Genome editing technologies Market Share Forecast by Application, 2022 & 2032 (%)
Figure 194 Latin America Genome editing technologies Market Forecast by End-users, 2022-2032 (US$ million, AGR %)
Figure 195 Latin America Genome editing technologies Market Share Forecast by End-users, 2022 & 2032 (%)
Figure 196 Brazil Genome editing technologies Market Forecast, 2022-2032 (US$ million, AGR %)
Figure 197 Brazil Genome editing technologies Market Forecast by Type, 2022-2032 (US$ million, AGR %)
Figure 198 Brazil Genome editing technologies Market Share Forecast by Type, 2022 & 2032 (%)
Figure 199 Brazil Genome editing technologies Market Forecast by Application, 2022-2032 (US$ million, AGR %)
Figure 200 Brazil Genome editing technologies Market Share Forecast by Application, 2022 & 2032 (%)
Figure 201 Brazil Genome editing technologies Market Forecast by End-users, 2022-2032 (US$ million, AGR %)
Figure 202 Brazil Genome editing technologies Market Share Forecast by End-users, 2022 & 2032 (%)
Figure 203 Argentina Genome editing technologies Market Forecast, 2022-2032 (US$ million, AGR %)
Figure 204 Argentina Genome editing technologies Market Forecast by Type, 2022-2032 (US$ million, AGR %)
Figure 205 Argentina Genome editing technologies Market Share Forecast by Type, 2022 & 2032 (%)
Figure 206 Argentina Genome editing technologies Market Forecast by Application, 2022-2032 (US$ million, AGR %)
Figure 207 Argentina Genome editing technologies Market Share Forecast by Application, 2022 & 2032 (%)
Figure 208 Argentina Genome editing technologies Market Forecast by End-users, 2022-2032 (US$ million, AGR %)
Figure 209 Argentina Genome editing technologies Market Share Forecast by End-users, 2022 & 2032 (%)
Figure 210 Rest of Latin America Genome editing technologies Market Forecast, 2022-2032 (US$ million, AGR %)
Figure 211 Rest of Latin America Genome editing technologies Market Forecast by Type, 2022-2032 (US$ million, AGR %)
Figure 212 Rest of Latin America Genome editing technologies Market Share Forecast by Type, 2022 & 2032 (%)
Figure 213 Rest of Latin America Genome editing technologies Market Forecast by Application, 2022-2032 (US$ million, AGR %)
Figure 214 Rest of Latin America Genome editing technologies Market Share Forecast by Application, 2022 & 2032 (%)
Figure 215 Rest of Latin America Genome editing technologies Market Forecast by End-users, 2022-2032 (US$ million, AGR %)
Figure 216 Rest of Latin America Genome editing technologies Market Share Forecast by End-users, 2022 & 2032 (%)
Figure 217 Middle East & Africa Genome editing technologies Market Attractiveness Index
Figure 218 Middle East & Africa Genome editing technologies Market by Region, 2022, 2027 & 2032 (US$ million)
Figure 219 Middle East & Africa Genome editing technologies Market Forecast by Country, 2022-2032 (US$ million, AGR %)
Figure 220 Middle East & Africa Genome editing technologies Market Share Forecast by Country, 2022 & 2032 (%)
Figure 221 Middle East & Africa Genome editing technologies Market Forecast by Type, 2022-2032 (US$ million, AGR %)
Figure 222 Middle East & Africa Genome editing technologies Market Share Forecast by Type, 2022 & 2032 (%)
Figure 223 Middle East & Africa Genome editing technologies Market Forecast by Application, 2022-2032 (US$ million, AGR %)
Figure 224 Middle East & Africa Genome editing technologies Market Share Forecast by Application, 2022 & 2032 (%)
Figure 225 Middle East & Africa Genome editing technologies Market Forecast by End-users, 2022-2032 (US$ million, AGR %)
Figure 226 Middle East & Africa Genome editing technologies Market Share Forecast by End-users, 2022 & 2032 (%)
Figure 227 GCC Genome editing technologies Market Forecast, 2022-2032 (US$ million, AGR %)
Figure 228 GCC Genome editing technologies Market Forecast by Type, 2022-2032 (US$ million, AGR %)
Figure 229 GCC Genome editing technologies Market Share Forecast by Type, 2022 & 2032 (%)
Figure 230 GCC Genome editing technologies Market Forecast by Application, 2022-2032 (US$ million, AGR %)
Figure 231 GCC Genome editing technologies Market Share Forecast by Application, 2022 & 2032 (%)
Figure 232 GCC Genome editing technologies Market Forecast by End-users, 2022-2032 (US$ million, AGR %)
Figure 233 GCC Genome editing technologies Market Share Forecast by End-users, 2022 & 2032 (%)
Figure 234 South Africa Genome editing technologies Market Forecast, 2022-2032 (US$ million, AGR %)
Figure 235 South Africa Genome editing technologies Market Forecast by Type, 2022-2032 (US$ million, AGR %)
Figure 236 South Africa Genome editing technologies Market Share Forecast by Type, 2022 & 2032 (%)
Figure 237 South Africa Genome editing technologies Market Forecast by Application, 2022-2032 (US$ million, AGR %)
Figure 238 South Africa Genome editing technologies Market Share Forecast by Application, 2022 & 2032 (%)
Figure 239 South Africa Genome editing technologies Market Forecast by End-users, 2022-2032 (US$ million, AGR %)
Figure 240 South Africa Genome editing technologies Market Share Forecast by End-users, 2022 & 2032 (%)
Figure 241 Rest of Middle East & Africa Genome editing technologies Market Forecast, 2022-2032 (US$ million, AGR %)
Figure 242 Rest of Middle East & Africa Genome editing technologies Market Forecast by Type, 2022-2032 (US$ million, AGR %)
Figure 243 Rest of Middle East & Africa Genome editing technologies Market Share Forecast by Type, 2022 & 2032 (%)
Figure 244 Rest of Middle East & Africa Genome editing technologies Market Forecast by Application, 2022-2032 (US$ million, AGR %)
Figure 245 Rest of Middle East & Africa Genome editing technologies Market Share Forecast by Application, 2022 & 2032 (%)
Figure 246 Rest of Middle East & Africa Genome editing technologies Market Forecast by End-users, 2022-2032 (US$ million, AGR %)
Figure 247 Rest of Middle East & Africa Genome editing technologies Market Share Forecast by End-users, 2022 & 2032 (%)
Figure 248 Thermo Fisher Scientific Inc.: Net Revenue, 2019-2021 (US$ Billion, AGR %)
Figure 249 Thermo Fisher Scientific Inc.: Regional Market Shares, 2021
Figure 250 Thermo Fisher Scientific Inc.: Gross Profit, 2019-2021 (US$ Billion, AGR %)
Figure 251 Thermo Fisher Scientific Inc.: R&D, 2019-2021 (US$ Billion, AGR %)
Figure 252 Merck KGaA: Net Revenue, 2019-2021 (US$ Billion, AGR %)
Figure 253 Merck KGaA: Regional Market Shares, 2021
Figure 254 Merck KGaA: Gross Profit, 2019-2021 (US$ Billion, AGR %)
Figure 255 Merck KGaA: R&D, 2019-2021 (US$ Billion, AGR %)
Figure 256 GenScript: Net Revenue, 2019-2021 (US$ Billion, AGR %)
Figure 257 GenScript: Regional Market Shares, 2021
Figure 258 GenScript: Gross Profit, 2019-2021 (US$ Billion, AGR %)
Figure 259 GenScript: R&D, 2019-2021 (US$ Billion, AGR %)
Figure 260 Sangamo Therapeutics Inc.: Net Revenue, 2019-2021 (US$ Billion, AGR %)
Figure 261 Sangamo Therapeutics Inc.: R&D, 2019-2021 (US$ Billion, AGR %)
Figure 262 Lonza: Net Revenue, 2019-2021 (US$ Billion, AGR %)
Figure 263 Lonza: Gross Profit, 2019-2021 (US$ Billion, AGR %)
Figure 264 Lonza: R&D, 2019-2021 (US$ Billion, AGR %)
Figure 265 Editas Medicine: Net Revenue, 2019-2021 (US$ Billion, AGR %)
Figure 266 Editas Medicine: Gross Profit, 2019-2021 (US$ Billion, AGR %)
Figure 267 Editas Medicine: R&D, 2019-2021 (US$ Billion, AGR %)
Figure 268 CRISPR Therapeutics AG: Net Revenue, 2019-2021 (US$ Billion, AGR %)
Figure 269 CRISPR Therapeutics AG: R&D, 2019-2021 (US$ Billion, AGR %)
Figure 270 Agilent Technologies Inc.: Net Revenue, 2019-2021 (US$ Billion, AGR %)
Figure 271 Agilent Technologies Inc.: Regional Market Shares, 2021
Figure 272 Agilent Technologies Inc.: Gross Profit, 2019-2021 (US$ Billion, AGR %)
Figure 273 Agilent Technologies Inc.: R&D, 2019-2021 (US$ Billion, AGR %)
Figure 274 Precision Biosciences: Net Revenue, 2019-2021 (US$ Billion, AGR %)
Figure 275 Precision Biosciences: R&D, 2019-2021 (US$ Billion, AGR %)
Figure 276 Tecan Life Sciences: Net Revenue, 2019-2021 (US$ Billion, AGR %)
Figure 277 Tecan Life Sciences: Regional Market Shares, 2021
Figure 278 Tecan Life Sciences: Gross Profit, 2019-2021 (US$ Billion, AGR %)
Figure 279 Tecan Life Sciences: R&D, 2019-2021 (US$ Billion, AGR %)
List of Tables
Table 1 Global Liposomal Drug Delivery Devices Market Snapshot, 2022 & 2032 (US$ million, CAGR %)
Table 2 Candidate Liposomal Vaccine Formulations
Table 3 List of Clinically Approved Nanomedicines for Cancer Treatment
Table 4 Global Liposomal Drug Delivery Devices Market Forecast by Type, 2022-2032 (US$ million, AGR%, CAGR%)
Table 5 Liposome-based Drugs on Market
Table 6 Liposome-based Drugs in Clinical Trails
Table 7 Global Liposomal Drug Delivery Devices Market Forecast for Liposomal Doxorubicin Segment, 2022-2032 (US$ Million, AGR%, CAGR%)
Table 8 Global Liposomal Drug Delivery Devices Market Forecast for Liposomal Doxorubicin Segment, 2022-2032 (US$ Million, AGR%, CAGR%): "V" Shaped Recovery
Table 9 Global Liposomal Drug Delivery Devices Market Forecast for Liposomal Doxorubicin Segment, 2022-2032 (US$ Million, AGR%, CAGR%): "U" Shaped Recovery
Table 10 Global Liposomal Drug Delivery Devices Market Forecast for Liposomal Doxorubicin Segment, 2022-2032 (US$ Million, AGR%, CAGR%): "W" Shaped Recovery
Table 11 Global Liposomal Drug Delivery Devices Market Forecast for Liposomal Doxorubicin Segment, 2022-2032 (US$ Million, AGR%, CAGR%): "L" Shaped Recovery
Table 12 Global Liposomal Drug Delivery Devices Market Forecast for Liposomal Paclitaxel Segment, 2022-2032 (US$ Million, AGR%, CAGR%)
Table 13 Global Liposomal Drug Delivery Devices Market Forecast for Liposomal Paclitaxel Segment, 2022-2032 (US$ Million, AGR%, CAGR%): "V" Shaped Recovery
Table 14 Global Liposomal Drug Delivery Devices Market Forecast for Liposomal Paclitaxel Segment, 2022-2032 (US$ Million, AGR%, CAGR%): "U" Shaped Recovery
Table 15 Global Liposomal Drug Delivery Devices Market Forecast for Liposomal Paclitaxel Segment, 2022-2032 (US$ Million, AGR%, CAGR%): "W" Shaped Recovery
Table 16 Global Liposomal Drug Delivery Devices Market Forecast for Liposomal Paclitaxel Segment, 2022-2032 (US$ Million, AGR%, CAGR%): "L" Shaped Recovery
Table 17 Global Liposomal Drug Delivery Devices Market Forecast for Liposomal Amphotericin B Segment, 2022-2032 (US$ Million, AGR%, CAGR%)
Table 18 Global Liposomal Drug Delivery Devices Market Forecast for Liposomal Amphotericin B Segment, 2022-2032 (US$ Million, AGR%, CAGR%): "V" Shaped Recovery
Table 19 Global Liposomal Drug Delivery Devices Market Forecast for Liposomal Amphotericin B Segment, 2022-2032 (US$ Million, AGR%, CAGR%): "U" Shaped Recovery
Table 20 Global Liposomal Drug Delivery Devices Market Forecast for Liposomal Amphotericin B Segment, 2022-2032 (US$ Million, AGR%, CAGR%): "W" Shaped Recovery
Table 21 Global Liposomal Drug Delivery Devices Market Forecast for Liposomal Amphotericin B Segment, 2022-2032 (US$ Million, AGR%, CAGR%): "L" Shaped Recovery
Table 22 Global Liposomal Drug Delivery Devices Market Forecast by Technology, 2022-2032 (US$ million, AGR%, CAGR%)
Table 23 Global Liposomal Drug Delivery Devices Market Forecast for Stealth Liposome Technology Segment, 2022-2032 (US$ Million, AGR%, CAGR%)
Table 24 Global Liposomal Drug Delivery Devices Market Forecast for Stealth Liposome Technology Segment, 2022-2032 (US$ Million, AGR%, CAGR%): "V" Shaped Recovery
Table 25 Global Liposomal Drug Delivery Devices Market Forecast for Stealth Liposome Technology Segment, 2022-2032 (US$ Million, AGR%, CAGR%): "U" Shaped Recovery
Table 26 Global Liposomal Drug Delivery Devices Market Forecast for Stealth Liposome Technology Segment, 2022-2032 (US$ Million, AGR%, CAGR%): "W" Shaped Recovery
Table 27 Global Liposomal Drug Delivery Devices Market Forecast for Stealth Liposome Technology Segment, 2022-2032 (US$ Million, AGR%, CAGR%): "L" Shaped Recovery
Table 28 Global Liposomal Drug Delivery Devices Market Forecast for Non-PEGylated Liposome Technology Segment, 2022-2032 (US$ Million, AGR%, CAGR%)
Table 29 Global Liposomal Drug Delivery Devices Market Forecast for Non-PEGylated Liposome Technology Segment, 2022-2032 (US$ Million, AGR%, CAGR%): "V" Shaped Recovery
Table 30 Global Liposomal Drug Delivery Devices Market Forecast for Non-PEGylated Liposome Technology Segment, 2022-2032 (US$ Million, AGR%, CAGR%): "U" Shaped Recovery
Table 31 Global Liposomal Drug Delivery Devices Market Forecast for Non-PEGylated Liposome Technology Segment, 2022-2032 (US$ Million, AGR%, CAGR%): "W" Shaped Recovery
Table 32 Global Liposomal Drug Delivery Devices Market Forecast for Non-PEGylated Liposome Technology Segment, 2022-2032 (US$ Million, AGR%, CAGR%): "L" Shaped Recovery
Table 33 Global Liposomal Drug Delivery Devices Market Forecast for DepoFoam Liposome Technology Segment, 2022-2032 (US$ Million, AGR%, CAGR%)
Table 34 Global Liposomal Drug Delivery Devices Market Forecast for DepoFoam Liposome Technology Segment, 2022-2032 (US$ Million, AGR%, CAGR%): "V" Shaped Recovery
Table 35 Global Liposomal Drug Delivery Devices Market Forecast for DepoFoam Liposome Technology Segment, 2022-2032 (US$ Million, AGR%, CAGR%): "U" Shaped Recovery
Table 36 Global Liposomal Drug Delivery Devices Market Forecast for DepoFoam Liposome Technology Segment, 2022-2032 (US$ Million, AGR%, CAGR%): "W" Shaped Recovery
Table 37 Global Liposomal Drug Delivery Devices Market Forecast for DepoFoam Liposome Technology Segment, 2022-2032 (US$ Million, AGR%, CAGR%): "L" Shaped Recovery
Table 38 Global Liposomal Drug Delivery Devices Market Forecast by Application, 2022-2032 (US$ million, AGR%, CAGR%)
Table 39 Global Liposomal Drug Delivery Devices Market Forecast for Fungal Diseases Segment, 2022-2032 (US$ Million, AGR%, CAGR%)
Table 40 Global Liposomal Drug Delivery Devices Market Forecast for Fungal Diseases Segment, 2022-2032 (US$ Million, AGR%, CAGR%): "V" Shaped Recovery
Table 41 Global Liposomal Drug Delivery Devices Market Forecast for Fungal Diseases Segment, 2022-2032 (US$ Million, AGR%, CAGR%): "U" Shaped Recovery
Table 42 Global Liposomal Drug Delivery Devices Market Forecast for Fungal Diseases Segment, 2022-2032 (US$ Million, AGR%, CAGR%): "W" Shaped Recovery
Table 43 Global Liposomal Drug Delivery Devices Market Forecast for Fungal Diseases Segment, 2022-2032 (US$ Million, AGR%, CAGR%): "L" Shaped Recovery
Table 44 FDA-approval drug products of injection delivery based on liposome technology (liposome, nanoparticle, nanosuspension, microemulsion, microsphere)
Table 45 Global Liposomal Drug Delivery Devices Market Forecast for Cancer Therapy Segment, 2022-2032 (US$ Million, AGR%, CAGR%)
Table 46 Global Liposomal Drug Delivery Devices Market Forecast for Cancer Therapy Segment, 2022-2032 (US$ Million, AGR%, CAGR%): "V" Shaped Recovery
Table 47 Global Liposomal Drug Delivery Devices Market Forecast for Cancer Therapy Segment, 2022-2032 (US$ Million, AGR%, CAGR%): "U" Shaped Recovery
Table 48 Global Liposomal Drug Delivery Devices Market Forecast for Cancer Therapy Segment, 2022-2032 (US$ Million, AGR%, CAGR%): "W" Shaped Recovery
Table 49 Global Liposomal Drug Delivery Devices Market Forecast for Cancer Therapy Segment, 2022-2032 (US$ Million, AGR%, CAGR%): "L" Shaped Recovery
Table 50 Global Liposomal Drug Delivery Devices Market Forecast for Pain Management Segment, 2022-2032 (US$ Million, AGR%, CAGR%)
Table 51 Global Liposomal Drug Delivery Devices Market Forecast for Pain Management Segment, 2022-2032 (US$ Million, AGR%, CAGR%): "V" Shaped Recovery
Table 52 Global Liposomal Drug Delivery Devices Market Forecast for Pain Management Segment, 2022-2032 (US$ Million, AGR%, CAGR%): "U" Shaped Recovery
Table 53 Global Liposomal Drug Delivery Devices Market Forecast for Pain Management Segment, 2022-2032 (US$ Million, AGR%, CAGR%): "W" Shaped Recovery
Table 54 Global Liposomal Drug Delivery Devices Market Forecast for Pain Management Segment, 2022-2032 (US$ Million, AGR%, CAGR%): "L" Shaped Recovery
Table 55 List of Pipeline Candidate Vaccine Formulations
Table 56 Global Liposomal Drug Delivery Devices Market Forecast for Viral Vaccines Segment, 2022-2032 (US$ Million, AGR%, CAGR%)
Table 57 Global Liposomal Drug Delivery Devices Market Forecast for Viral Vaccines Segment, 2022-2032 (US$ Million, AGR%, CAGR%): "V" Shaped Recovery
Table 58 Global Liposomal Drug Delivery Devices Market Forecast for Viral Vaccines Segment, 2022-2032 (US$ Million, AGR%, CAGR%): "U" Shaped Recovery
Table 59 Global Liposomal Drug Delivery Devices Market Forecast for Viral Vaccines Segment, 2022-2032 (US$ Million, AGR%, CAGR%): "W" Shaped Recovery
Table 60 Global Liposomal Drug Delivery Devices Market Forecast for Viral Vaccines Segment, 2022-2032 (US$ Million, AGR%, CAGR%): "L" Shaped Recovery
Table 61 Encapsulation of Photosensitizers (PSs) into Liposomes in Cancer PDT
Table 62 Global Liposomal Drug Delivery Devices Market Forecast for Photodynamic Therapy Segment, 2022-2032 (US$ Million, AGR%, CAGR%)
Table 63 Global Liposomal Drug Delivery Devices Market Forecast for Photodynamic Therapy Segment, 2022-2032 (US$ Million, AGR%, CAGR%): "V" Shaped Recovery
Table 64 Global Liposomal Drug Delivery Devices Market Forecast for Photodynamic Therapy Segment, 2022-2032 (US$ Million, AGR%, CAGR%): "U" Shaped Recovery
Table 65 Global Liposomal Drug Delivery Devices Market Forecast for Photodynamic Therapy Segment, 2022-2032 (US$ Million, AGR%, CAGR%): "W" Shaped Recovery
Table 66 Global Liposomal Drug Delivery Devices Market Forecast for Photodynamic Therapy Segment, 2022-2032 (US$ Million, AGR%, CAGR%): "L" Shaped Recovery
Table 67 Global Liposomal Drug Delivery Devices Market Forecast by End-User, 2022-2032 (US$ million, AGR%, CAGR%)
Table 68 Global Liposomal Drug Delivery Devices Market Forecast for Hospitals Segment, 2022-2032 (US$ Million, AGR%, CAGR%)
Table 69 Global Liposomal Drug Delivery Devices Market Forecast for Hospitals Segment, 2022-2032 (US$ Million, AGR%, CAGR%): "V" Shaped Recovery
Table 70 Global Liposomal Drug Delivery Devices Market Forecast for Hospitals Segment, 2022-2032 (US$ Million, AGR%, CAGR%): "U" Shaped Recovery
Table 71 Global Liposomal Drug Delivery Devices Market Forecast for Hospitals Segment, 2022-2032 (US$ Million, AGR%, CAGR%): "W" Shaped Recovery
Table 72 Global Liposomal Drug Delivery Devices Market Forecast for Hospitals Segment, 2022-2032 (US$ Million, AGR%, CAGR%): "L" Shaped Recovery
Table 73 Global Liposomal Drug Delivery Devices Market Forecast for Diagnostic Centers Segment, 2022-2032 (US$ Million, AGR%, CAGR%)
Table 74 Global Liposomal Drug Delivery Devices Market Forecast for Diagnostic Centers Segment, 2022-2032 (US$ Million, AGR%, CAGR%): "V" Shaped Recovery
Table 75 Global Liposomal Drug Delivery Devices Market Forecast for Diagnostic Centers Segment, 2022-2032 (US$ Million, AGR%, CAGR%): "U" Shaped Recovery
Table 76 Global Liposomal Drug Delivery Devices Market Forecast for Diagnostic Centers Segment, 2022-2032 (US$ Million, AGR%, CAGR%): "W" Shaped Recovery
Table 77 Global Liposomal Drug Delivery Devices Market Forecast for Diagnostic Centers Segment, 2022-2032 (US$ Million, AGR%, CAGR%): "L" Shaped Recovery
Table 78 Global Liposomal Drug Delivery Devices Market Forecast for Ambulatory Surgery Centers/Clinics Segment, 2022-2032 (US$ Million, AGR%, CAGR%)
Table 79 Global Liposomal Drug Delivery Devices Market Forecast for Ambulatory Surgery Centers/Clinics Segment, 2022-2032 (US$ Million, AGR%, CAGR%): "V" Shaped Recovery
Table 80 Global Liposomal Drug Delivery Devices Market Forecast for Ambulatory Surgery Centers/Clinics Segment, 2022-2032 (US$ Million, AGR%, CAGR%): "U" Shaped Recovery
Table 81 Global Liposomal Drug Delivery Devices Market Forecast for Ambulatory Surgery Centers/Clinics Segment, 2022-2032 (US$ Million, AGR%, CAGR%): "W" Shaped Recovery
Table 82 Global Liposomal Drug Delivery Devices Market Forecast for Ambulatory Surgery Centers/Clinics Segment, 2022-2032 (US$ Million, AGR%, CAGR%): "L" Shaped Recovery
Table 83 Global Liposomal Drug Delivery Devices Market Forecast by Region, 2022-2032 (US$ million, AGR%, CAGR%)
Table 84 Global Liposomal Drug Delivery Devices Market Forecast by Region, 2022-2032 (US$ Million, AGR%, CAGR%): "V" Shaped Recovery
Table 85 Global Liposomal Drug Delivery Devices Market Forecast by Region, 2022-2032 (US$ Million, AGR%, CAGR%): "U" Shaped Recovery
Table 86 Global Liposomal Drug Delivery Devices Market Forecast by Region, 2022-2032 (US$ Million, AGR%, CAGR%): "W" Shaped Recovery
Table 87 Global Liposomal Drug Delivery Devices Market Forecast by Region, 2022-2032 (US$ Million, AGR%, CAGR%): "L" Shaped Recovery
Table 88 North America Liposomal Drug Delivery Devices Market Forecast by Country, 2022-2032 (US$ million, AGR%, CAGR%)
Table 89 North America Liposomal Drug Delivery Devices Market Forecast by Type, 2022-2032 (US$ million, AGR%, CAGR%)
Table 90 North America Liposomal Drug Delivery Devices Market Forecast by Type, 2022-2032 (US$ Million, AGR%, CAGR%): "V" Shaped Recovery
Table 91 North America Liposomal Drug Delivery Devices Market Forecast by Type, 2022-2032 (US$ Million, AGR%, CAGR%): "U" Shaped Recovery
Table 92 North America Liposomal Drug Delivery Devices Market Forecast by Type, 2022-2032 (US$ Million, AGR%, CAGR%): "W" Shaped Recovery
Table 93 North America Liposomal Drug Delivery Devices Market Forecast by Type, 2022-2032 (US$ Million, AGR%, CAGR%): "L" Shaped Recovery
Table 94 North America Liposomal Drug Delivery Devices Market Forecast by Technology, 2022-2032 (US$ million, AGR%, CAGR%)
Table 95 North America Liposomal Drug Delivery Devices Market Forecast by Technology, 2022-2032 (US$ Million, AGR%, CAGR%): "V" Shaped Recovery
Table 96 North America Liposomal Drug Delivery Devices Market Forecast by Technology, 2022-2032 (US$ Million, AGR%, CAGR%): "U" Shaped Recovery
Table 97 North America Liposomal Drug Delivery Devices Market Forecast by Technology, 2022-2032 (US$ Million, AGR%, CAGR%): "W" Shaped Recovery
Table 98 North America Liposomal Drug Delivery Devices Market Forecast by Technology, 2022-2032 (US$ Million, AGR%, CAGR%): "L" Shaped Recovery
Table 99 North America Liposomal Drug Delivery Devices Market Forecast by Application, 2022-2032 (US$ million, AGR%, CAGR%)
Table 100 North America Liposomal Drug Delivery Devices Market Forecast by Application, 2022-2032 (US$ Million, AGR%, CAGR%): "V" Shaped Recovery
Table 101 North America Liposomal Drug Delivery Devices Market Forecast by Application, 2022-2032 (US$ Million, AGR%, CAGR%): "U" Shaped Recovery
Table 102 North America Liposomal Drug Delivery Devices Market Forecast by Application, 2022-2032 (US$ Million, AGR%, CAGR%): "W" Shaped Recovery
Table 103 North America Liposomal Drug Delivery Devices Market Forecast by Application, 2022-2032 (US$ Million, AGR%, CAGR%): "L" Shaped Recovery
Table 104 North America Liposomal Drug Delivery Devices Market Forecast by End-User, 2022-2032 (US$ million, AGR%, CAGR%)
Table 105 North America Liposomal Drug Delivery Devices Market Forecast by End-User, 2022-2032 (US$ Million, AGR%, CAGR%): "V" Shaped Recovery
Table 106 North America Liposomal Drug Delivery Devices Market Forecast by End-User, 2022-2032 (US$ Million, AGR%, CAGR%): "U" Shaped Recovery
Table 107 North America Liposomal Drug Delivery Devices Market Forecast by End-User, 2022-2032 (US$ Million, AGR%, CAGR%): "W" Shaped Recovery
Table 108 North America Liposomal Drug Delivery Devices Market Forecast by End-User, 2022-2032 (US$ Million, AGR%, CAGR%): "L" Shaped Recovery
Table 109 U.S. Liposomal Drug Delivery Devices Market Forecast, 2022-2032 (US$ Million, AGR%, CAGR%)
Table 110 U.S. Liposomal Drug Delivery Devices Market Forecast, 2022-2032 (US$ Million, AGR%, CAGR%): "V" Shaped Recovery
Table 111 U.S. Liposomal Drug Delivery Devices Market Forecast, 2022-2032 (US$ Million, AGR%, CAGR%): "U" Shaped Recovery
Table 112 U.S. Liposomal Drug Delivery Devices Market Forecast, 2022-2032 (US$ Million, AGR%, CAGR%): "W" Shaped Recovery
Table 113 U.S. Liposomal Drug Delivery Devices Market Forecast, 2022-2032 (US$ Million, AGR%, CAGR%): "L" Shaped Recovery
Table 114 Canada Liposomal Drug Delivery Devices Market Forecast, 2022-2032 (US$ Million, AGR%, CAGR%)
Table 115 Canada Liposomal Drug Delivery Devices Market Forecast, 2022-2032 (US$ Million, AGR%, CAGR%): "V" Shaped Recovery
Table 116 Canada Liposomal Drug Delivery Devices Market Forecast, 2022-2032 (US$ Million, AGR%, CAGR%): "U" Shaped Recovery
Table 117 Canada Liposomal Drug Delivery Devices Market Forecast, 2022-2032 (US$ Million, AGR%, CAGR%): "W" Shaped Recovery
Table 118 Canada Liposomal Drug Delivery Devices Market Forecast, 2022-2032 (US$ Million, AGR%, CAGR%): "L" Shaped Recovery
Table 119 Europe Liposomal Drug Delivery Devices Market Forecast by Country, 2022-2032 (US$ million, AGR%, CAGR%)
Table 120 Europe Liposomal Drug Delivery Devices Market Forecast by Type, 2022-2032 (US$ million, AGR%, CAGR%)
Table 121 Europe Liposomal Drug Delivery Devices Market Forecast by Type, 2022-2032 (US$ Million, AGR%, CAGR%): "V" Shaped Recovery
Table 122 Europe Liposomal Drug Delivery Devices Market Forecast by Type, 2022-2032 (US$ Million, AGR%, CAGR%): "U" Shaped Recovery
Table 123 Europe Liposomal Drug Delivery Devices Market Forecast by Type, 2022-2032 (US$ Million, AGR%, CAGR%): "W" Shaped Recovery
Table 124 Europe Liposomal Drug Delivery Devices Market Forecast by Type, 2022-2032 (US$ Million, AGR%, CAGR%): "L" Shaped Recovery
Table 125 Europe Liposomal Drug Delivery Devices Market Forecast by Technology, 2022-2032 (US$ million, AGR%, CAGR%)
Table 126 Europe Liposomal Drug Delivery Devices Market Forecast by Technology, 2022-2032 (US$ Million, AGR%, CAGR%): "V" Shaped Recovery
Table 127 Europe Liposomal Drug Delivery Devices Market Forecast by Technology, 2022-2032 (US$ Million, AGR%, CAGR%): "U" Shaped Recovery
Table 128 Europe Liposomal Drug Delivery Devices Market Forecast by Technology, 2022-2032 (US$ Million, AGR%, CAGR%): "W" Shaped Recovery
Table 129 Europe Liposomal Drug Delivery Devices Market Forecast by Technology, 2022-2032 (US$ Million, AGR%, CAGR%): "L" Shaped Recovery
Table 130 Europe Liposomal Drug Delivery Devices Market Forecast by Application, 2022-2032 (US$ million, AGR%, CAGR%)
Table 131 Europe Liposomal Drug Delivery Devices Market Forecast by Application, 2022-2032 (US$ Million, AGR%, CAGR%): "V" Shaped Recovery
Table 132 Europe Liposomal Drug Delivery Devices Market Forecast by Application, 2022-2032 (US$ Million, AGR%, CAGR%): "U" Shaped Recovery
Table 133 Europe Liposomal Drug Delivery Devices Market Forecast by Application, 2022-2032 (US$ Million, AGR%, CAGR%): "W" Shaped Recovery
Table 134 Europe Liposomal Drug Delivery Devices Market Forecast by Application, 2022-2032 (US$ Million, AGR%, CAGR%): "L" Shaped Recovery
Table 135 Europe Liposomal Drug Delivery Devices Market Forecast by End-User, 2022-2032 (US$ million, AGR%, CAGR%)
Table 136 Europe Liposomal Drug Delivery Devices Market Forecast by End-User, 2022-2032 (US$ Million, AGR%, CAGR%): "V" Shaped Recovery
Table 137 Europe Liposomal Drug Delivery Devices Market Forecast by End-User, 2022-2032 (US$ Million, AGR%, CAGR%): "U" Shaped Recovery
Table 138 Europe Liposomal Drug Delivery Devices Market Forecast by End-User, 2022-2032 (US$ Million, AGR%, CAGR%): "W" Shaped Recovery
Table 139 Europe Liposomal Drug Delivery Devices Market Forecast by End-User, 2022-2032 (US$ Million, AGR%, CAGR%): "L" Shaped Recovery
Table 140 Germany Liposomal Drug Delivery Devices Market Forecast, 2022-2032 (US$ Million, AGR%, CAGR%)
Table 141 Germany Liposomal Drug Delivery Devices Market Forecast, 2022-2032 (US$ Million, AGR%, CAGR%): "V" Shaped Recovery
Table 142 Germany Liposomal Drug Delivery Devices Market Forecast, 2022-2032 (US$ Million, AGR%, CAGR%): "U" Shaped Recovery
Table 143 Germany Liposomal Drug Delivery Devices Market Forecast, 2022-2032 (US$ Million, AGR%, CAGR%): "W" Shaped Recovery
Table 144 Germany Liposomal Drug Delivery Devices Market Forecast, 2022-2032 (US$ Million, AGR%, CAGR%): "L" Shaped Recovery
Table 145 UK Liposomal Drug Delivery Devices Market Forecast, 2022-2032 (US$ Million, AGR%, CAGR%)
Table 146 UK Liposomal Drug Delivery Devices Market Forecast, 2022-2032 (US$ Million, AGR%, CAGR%): "V" Shaped Recovery
Table 147 UK Liposomal Drug Delivery Devices Market Forecast, 2022-2032 (US$ Million, AGR%, CAGR%): "U" Shaped Recovery
Table 148 UK Liposomal Drug Delivery Devices Market Forecast, 2022-2032 (US$ Million, AGR%, CAGR%): "W" Shaped Recovery
Table 149 UK Liposomal Drug Delivery Devices Market Forecast, 2022-2032 (US$ Million, AGR%, CAGR%): "L" Shaped Recovery
Table 150 France Liposomal Drug Delivery Devices Market Forecast, 2022-2032 (US$ Million, AGR%, CAGR%)
Table 151 France Liposomal Drug Delivery Devices Market Forecast, 2022-2032 (US$ Million, AGR%, CAGR%): "V" Shaped Recovery
Table 152 France Liposomal Drug Delivery Devices Market Forecast, 2022-2032 (US$ Million, AGR%, CAGR%): "U" Shaped Recovery
Table 153 France Liposomal Drug Delivery Devices Market Forecast, 2022-2032 (US$ Million, AGR%, CAGR%): "W" Shaped Recovery
Table 154 France Liposomal Drug Delivery Devices Market Forecast, 2022-2032 (US$ Million, AGR%, CAGR%): "L" Shaped Recovery
Table 155 Italy Liposomal Drug Delivery Devices Market Forecast, 2022-2032 (US$ Million, AGR%, CAGR%)
Table 156 Italy Liposomal Drug Delivery Devices Market Forecast, 2022-2032 (US$ Million, AGR%, CAGR%): "V" Shaped Recovery
Table 157 Italy Liposomal Drug Delivery Devices Market Forecast, 2022-2032 (US$ Million, AGR%, CAGR%): "U" Shaped Recovery
Table 158 Italy Liposomal Drug Delivery Devices Market Forecast, 2022-2032 (US$ Million, AGR%, CAGR%): "W" Shaped Recovery
Table 159 Italy Liposomal Drug Delivery Devices Market Forecast, 2022-2032 (US$ Million, AGR%, CAGR%): "L" Shaped Recovery
Table 160 Spain Liposomal Drug Delivery Devices Market Forecast, 2022-2032 (US$ Million, AGR%, CAGR%)
Table 161 Spain Liposomal Drug Delivery Devices Market Forecast, 2022-2032 (US$ Million, AGR%, CAGR%): "V" Shaped Recovery
Table 162 Spain Liposomal Drug Delivery Devices Market Forecast, 2022-2032 (US$ Million, AGR%, CAGR%): "U" Shaped Recovery
Table 163 Spain Liposomal Drug Delivery Devices Market Forecast, 2022-2032 (US$ Million, AGR%, CAGR%): "W" Shaped Recovery
Table 164 Spain Liposomal Drug Delivery Devices Market Forecast, 2022-2032 (US$ Million, AGR%, CAGR%): "L" Shaped Recovery
Table 165 Russia Liposomal Drug Delivery Devices Market Forecast, 2022-2032 (US$ Million, AGR%, CAGR%)
Table 166 Russia Liposomal Drug Delivery Devices Market Forecast, 2022-2032 (US$ Million, AGR%, CAGR%): "V" Shaped Recovery
Table 167 Russia Liposomal Drug Delivery Devices Market Forecast, 2022-2032 (US$ Million, AGR%, CAGR%): "U" Shaped Recovery
Table 168 Russia Liposomal Drug Delivery Devices Market Forecast, 2022-2032 (US$ Million, AGR%, CAGR%): "W" Shaped Recovery
Table 169 Russia Liposomal Drug Delivery Devices Market Forecast, 2022-2032 (US$ Million, AGR%, CAGR%): "L" Shaped Recovery
Table 170 Rest of Europe Liposomal Drug Delivery Devices Market Forecast, 2022-2032 (US$ Million, AGR%, CAGR%)
Table 171 Rest of Europe Liposomal Drug Delivery Devices Market Forecast, 2022-2032 (US$ Million, AGR%, CAGR%): "V" Shaped Recovery
Table 172 Rest of Europe Liposomal Drug Delivery Devices Market Forecast, 2022-2032 (US$ Million, AGR%, CAGR%): "U" Shaped Recovery
Table 173 Rest of Europe Liposomal Drug Delivery Devices Market Forecast, 2022-2032 (US$ Million, AGR%, CAGR%): "W" Shaped Recovery
Table 174 Rest of Europe Liposomal Drug Delivery Devices Market Forecast, 2022-2032 (US$ Million, AGR%, CAGR%): "L" Shaped Recovery
Table 175 Asia Pacific Liposomal Drug Delivery Devices Market Forecast by Country, 2022-2032 (US$ million, AGR%, CAGR%)
Table 176 Asia Pacific Liposomal Drug Delivery Devices Market Forecast by Type, 2022-2032 (US$ million, AGR%, CAGR%)
Table 177 Asia Pacific Liposomal Drug Delivery Devices Market Forecast by Type, 2022-2032 (US$ Million, AGR%, CAGR%): "V" Shaped Recovery
Table 178 Asia Pacific Liposomal Drug Delivery Devices Market Forecast by Type, 2022-2032 (US$ Million, AGR%, CAGR%): "U" Shaped Recovery
Table 179 Asia Pacific Liposomal Drug Delivery Devices Market Forecast by Type, 2022-2032 (US$ Million, AGR%, CAGR%): "W" Shaped Recovery
Table 180 Asia Pacific Liposomal Drug Delivery Devices Market Forecast by Type, 2022-2032 (US$ Million, AGR%, CAGR%): "L" Shaped Recovery
Table 181 Asia Pacific Liposomal Drug Delivery Devices Market Forecast by Technology, 2022-2032 (US$ million, AGR%, CAGR%)
Table 182 Asia Pacific Liposomal Drug Delivery Devices Market Forecast by Technology, 2022-2032 (US$ Million, AGR%, CAGR%): "V" Shaped Recovery
Table 183 Asia Pacific Liposomal Drug Delivery Devices Market Forecast by Technology, 2022-2032 (US$ Million, AGR%, CAGR%): "U" Shaped Recovery
Table 184 Asia Pacific Liposomal Drug Delivery Devices Market Forecast by Technology, 2022-2032 (US$ Million, AGR%, CAGR%): "W" Shaped Recovery
Table 185 Asia Pacific Liposomal Drug Delivery Devices Market Forecast by Technology, 2022-2032 (US$ Million, AGR%, CAGR%): "L" Shaped Recovery
Table 186 Asia Pacific Liposomal Drug Delivery Devices Market Forecast by Application, 2022-2032 (US$ million, AGR%, CAGR%)
Table 187 Asia Pacific Liposomal Drug Delivery Devices Market Forecast by Application, 2022-2032 (US$ Million, AGR%, CAGR%): "V" Shaped Recovery
Table 188 Asia Pacific Liposomal Drug Delivery Devices Market Forecast by Application, 2022-2032 (US$ Million, AGR%, CAGR%): "U" Shaped Recovery
Table 189 Asia Pacific Liposomal Drug Delivery Devices Market Forecast by Application, 2022-2032 (US$ Million, AGR%, CAGR%): "W" Shaped Recovery
Table 190 Asia Pacific Liposomal Drug Delivery Devices Market Forecast by Application, 2022-2032 (US$ Million, AGR%, CAGR%): "L" Shaped Recovery
Table 191 Asia Pacific Liposomal Drug Delivery Devices Market Forecast by End-User, 2022-2032 (US$ million, AGR%, CAGR%)
Table 192 Asia Pacific Liposomal Drug Delivery Devices Market Forecast by End-User, 2022-2032 (US$ Million, AGR%, CAGR%): "V" Shaped Recovery
Table 193 Asia Pacific Liposomal Drug Delivery Devices Market Forecast by End-User, 2022-2032 (US$ Million, AGR%, CAGR%): "U" Shaped Recovery
Table 194 Asia Pacific Liposomal Drug Delivery Devices Market Forecast by End-User, 2022-2032 (US$ Million, AGR%, CAGR%): "W" Shaped Recovery
Table 195 Asia Pacific Liposomal Drug Delivery Devices Market Forecast by End-User, 2022-2032 (US$ Million, AGR%, CAGR%): "L" Shaped Recovery
Table 196 Japan Liposomal Drug Delivery Devices Market Forecast, 2022-2032 (US$ Million, AGR%, CAGR%)
Table 197 Japan Liposomal Drug Delivery Devices Market Forecast, 2022-2032 (US$ Million, AGR%, CAGR%): "V" Shaped Recovery
Table 198 Japan Liposomal Drug Delivery Devices Market Forecast, 2022-2032 (US$ Million, AGR%, CAGR%): "U" Shaped Recovery
Table 199 Japan Liposomal Drug Delivery Devices Market Forecast, 2022-2032 (US$ Million, AGR%, CAGR%): "W" Shaped Recovery
Table 200 Japan Liposomal Drug Delivery Devices Market Forecast, 2022-2032 (US$ Million, AGR%, CAGR%): "L" Shaped Recovery
Table 201 China Liposomal Drug Delivery Devices Market Forecast, 2022-2032 (US$ Million, AGR%, CAGR%)
Table 202 China Liposomal Drug Delivery Devices Market Forecast, 2022-2032 (US$ Million, AGR%, CAGR%): "V" Shaped Recovery
Table 203 China Liposomal Drug Delivery Devices Market Forecast, 2022-2032 (US$ Million, AGR%, CAGR%): "U" Shaped Recovery
Table 204 China Liposomal Drug Delivery Devices Market Forecast, 2022-2032 (US$ Million, AGR%, CAGR%): "W" Shaped Recovery
Table 205 China Liposomal Drug Delivery Devices Market Forecast, 2022-2032 (US$ Million, AGR%, CAGR%): "L" Shaped Recovery
Table 206 India Liposomal Drug Delivery Devices Market Forecast, 2022-2032 (US$ Million, AGR%, CAGR%)
Table 207 India Liposomal Drug Delivery Devices Market Forecast, 2022-2032 (US$ Million, AGR%, CAGR%): "V" Shaped Recovery
Table 208 India Liposomal Drug Delivery Devices Market Forecast, 2022-2032 (US$ Million, AGR%, CAGR%): "U" Shaped Recovery
Table 209 India Liposomal Drug Delivery Devices Market Forecast, 2022-2032 (US$ Million, AGR%, CAGR%): "W" Shaped Recovery
Table 210 India Liposomal Drug Delivery Devices Market Forecast, 2022-2032 (US$ Million, AGR%, CAGR%): "L" Shaped Recovery
Table 211 Australia Liposomal Drug Delivery Devices Market Forecast, 2022-2032 (US$ Million, AGR%, CAGR%)
Table 212 Australia Liposomal Drug Delivery Devices Market Forecast, 2022-2032 (US$ Million, AGR%, CAGR%): "V" Shaped Recovery
Table 213 Australia Liposomal Drug Delivery Devices Market Forecast, 2022-2032 (US$ Million, AGR%, CAGR%): "U" Shaped Recovery
Table 214 Australia Liposomal Drug Delivery Devices Market Forecast, 2022-2032 (US$ Million, AGR%, CAGR%): "W" Shaped Recovery
Table 215 Australia Liposomal Drug Delivery Devices Market Forecast, 2022-2032 (US$ Million, AGR%, CAGR%): "L" Shaped Recovery
Table 216 South Korea Liposomal Drug Delivery Devices Market Forecast, 2022-2032 (US$ Million, AGR%, CAGR%)
Table 217 South Korea Liposomal Drug Delivery Devices Market Forecast, 2022-2032 (US$ Million, AGR%, CAGR%): "V" Shaped Recovery
Table 218 South Korea Liposomal Drug Delivery Devices Market Forecast, 2022-2032 (US$ Million, AGR%, CAGR%): "U" Shaped Recovery
Table 219 South Korea Liposomal Drug Delivery Devices Market Forecast, 2022-2032 (US$ Million, AGR%, CAGR%): "W" Shaped Recovery
Table 220 South Korea Liposomal Drug Delivery Devices Market Forecast, 2022-2032 (US$ Million, AGR%, CAGR%): "L" Shaped Recovery
Table 221 Rest of Asia Pacific Liposomal Drug Delivery Devices Market Forecast, 2022-2032 (US$ Million, AGR%, CAGR%)
Table 222 Rest of Asia Pacific Liposomal Drug Delivery Devices Market Forecast, 2022-2032 (US$ Million, AGR%, CAGR%): "V" Shaped Recovery
Table 223 Rest of Asia Pacific Liposomal Drug Delivery Devices Market Forecast, 2022-2032 (US$ Million, AGR%, CAGR%): "U" Shaped Recovery
Table 224 Rest of Asia Pacific Liposomal Drug Delivery Devices Market Forecast, 2022-2032 (US$ Million, AGR%, CAGR%): "W" Shaped Recovery
Table 225 Rest of Asia Pacific Liposomal Drug Delivery Devices Market Forecast, 2022-2032 (US$ Million, AGR%, CAGR%): "L" Shaped Recovery
Table 226 Latin America Liposomal Drug Delivery Devices Market Forecast by Country, 2022-2032 (US$ million, AGR%, CAGR%)
Table 227 Latin America Liposomal Drug Delivery Devices Market Forecast by Type, 2022-2032 (US$ million, AGR%, CAGR%)
Table 228 Latin America Liposomal Drug Delivery Devices Market Forecast by Type, 2022-2032 (US$ Million, AGR%, CAGR%): "V" Shaped Recovery
Table 229 Latin America Liposomal Drug Delivery Devices Market Forecast by Type, 2022-2032 (US$ Million, AGR%, CAGR%): "U" Shaped Recovery
Table 230 Latin America Liposomal Drug Delivery Devices Market Forecast by Type, 2022-2032 (US$ Million, AGR%, CAGR%): "W" Shaped Recovery
Table 231 Latin America Liposomal Drug Delivery Devices Market Forecast by Type, 2022-2032 (US$ Million, AGR%, CAGR%): "L" Shaped Recovery
Table 232 Latin America Liposomal Drug Delivery Devices Market Forecast by Technology, 2022-2032 (US$ million, AGR%, CAGR%)
Table 233 Latin America Liposomal Drug Delivery Devices Market Forecast by Technology, 2022-2032 (US$ Million, AGR%, CAGR%): "V" Shaped Recovery
Table 234 Latin America Liposomal Drug Delivery Devices Market Forecast by Technology, 2022-2032 (US$ Million, AGR%, CAGR%): "U" Shaped Recovery
Table 235 Latin America Liposomal Drug Delivery Devices Market Forecast by Technology, 2022-2032 (US$ Million, AGR%, CAGR%): "W" Shaped Recovery
Table 236 Latin America Liposomal Drug Delivery Devices Market Forecast by Technology, 2022-2032 (US$ Million, AGR%, CAGR%): "L" Shaped Recovery
Table 237 Latin America Liposomal Drug Delivery Devices Market Forecast by Application, 2022-2032 (US$ million, AGR%, CAGR%)
Table 238 Latin America Liposomal Drug Delivery Devices Market Forecast by Application, 2022-2032 (US$ Million, AGR%, CAGR%): "V" Shaped Recovery
Table 239 Latin America Liposomal Drug Delivery Devices Market Forecast by Application, 2022-2032 (US$ Million, AGR%, CAGR%): "U" Shaped Recovery
Table 240 Latin America Liposomal Drug Delivery Devices Market Forecast by Application, 2022-2032 (US$ Million, AGR%, CAGR%): "W" Shaped Recovery
Table 241 Latin America Liposomal Drug Delivery Devices Market Forecast by Application, 2022-2032 (US$ Million, AGR%, CAGR%): "L" Shaped Recovery
Table 242 Latin America Liposomal Drug Delivery Devices Market Forecast by End-User, 2022-2032 (US$ million, AGR%, CAGR%)
Table 243 Latin America Liposomal Drug Delivery Devices Market Forecast by End-User, 2022-2032 (US$ Million, AGR%, CAGR%): "V" Shaped Recovery
Table 244 Latin America Liposomal Drug Delivery Devices Market Forecast by End-User, 2022-2032 (US$ Million, AGR%, CAGR%): "U" Shaped Recovery
Table 245 Latin America Liposomal Drug Delivery Devices Market Forecast by End-User, 2022-2032 (US$ Million, AGR%, CAGR%): "W" Shaped Recovery
Table 246 Latin America Liposomal Drug Delivery Devices Market Forecast by End-User, 2022-2032 (US$ Million, AGR%, CAGR%): "L" Shaped Recovery
Table 247 Brazil Liposomal Drug Delivery Devices Market Forecast, 2022-2032 (US$ Million, AGR%, CAGR%)
Table 248 Brazil Liposomal Drug Delivery Devices Market Forecast, 2022-2032 (US$ Million, AGR%, CAGR%): "V" Shaped Recovery
Table 249 Brazil Liposomal Drug Delivery Devices Market Forecast, 2022-2032 (US$ Million, AGR%, CAGR%): "U" Shaped Recovery
Table 250 Brazil Liposomal Drug Delivery Devices Market Forecast, 2022-2032 (US$ Million, AGR%, CAGR%): "W" Shaped Recovery
Table 251 Brazil Liposomal Drug Delivery Devices Market Forecast, 2022-2032 (US$ Million, AGR%, CAGR%): "L" Shaped Recovery
Table 252 Mexico Liposomal Drug Delivery Devices Market Forecast, 2022-2032 (US$ Million, AGR%, CAGR%)
Table 253 Mexico Liposomal Drug Delivery Devices Market Forecast, 2022-2032 (US$ Million, AGR%, CAGR%): "V" Shaped Recovery
Table 254 Mexico Liposomal Drug Delivery Devices Market Forecast, 2022-2032 (US$ Million, AGR%, CAGR%): "U" Shaped Recovery
Table 255 Mexico Liposomal Drug Delivery Devices Market Forecast, 2022-2032 (US$ Million, AGR%, CAGR%): "W" Shaped Recovery
Table 256 Mexico Liposomal Drug Delivery Devices Market Forecast, 2022-2032 (US$ Million, AGR%, CAGR%): "L" Shaped Recovery
Table 257 Rest of Latin America Liposomal Drug Delivery Devices Market Forecast, 2022-2032 (US$ Million, AGR%, CAGR%)
Table 258 Rest of Latin America Liposomal Drug Delivery Devices Market Forecast, 2022-2032 (US$ Million, AGR%, CAGR%): "V" Shaped Recovery
Table 259 Rest of Latin America Liposomal Drug Delivery Devices Market Forecast, 2022-2032 (US$ Million, AGR%, CAGR%): "U" Shaped Recovery
Table 260 Rest of Latin America Liposomal Drug Delivery Devices Market Forecast, 2022-2032 (US$ Million, AGR%, CAGR%): "W" Shaped Recovery
Table 261 Rest of Latin America Liposomal Drug Delivery Devices Market Forecast, 2022-2032 (US$ Million, AGR%, CAGR%): "L" Shaped Recovery
Table 262 MEA Liposomal Drug Delivery Devices Market Forecast by Country, 2022-2032 (US$ million, AGR%, CAGR%)
Table 263 MEA Liposomal Drug Delivery Devices Market Forecast by Type, 2022-2032 (US$ million, AGR%, CAGR%)
Table 264 MEA Liposomal Drug Delivery Devices Market Forecast by Type, 2022-2032 (US$ Million, AGR%, CAGR%): "V" Shaped Recovery
Table 265 MEA Liposomal Drug Delivery Devices Market Forecast by Type, 2022-2032 (US$ Million, AGR%, CAGR%): "U" Shaped Recovery
Table 266 MEA Liposomal Drug Delivery Devices Market Forecast by Type, 2022-2032 (US$ Million, AGR%, CAGR%): "W" Shaped Recovery
Table 267 MEA Liposomal Drug Delivery Devices Market Forecast by Type, 2022-2032 (US$ Million, AGR%, CAGR%): "L" Shaped Recovery
Table 268 MEA Liposomal Drug Delivery Devices Market Forecast by Technology, 2022-2032 (US$ million, AGR%, CAGR%)
Table 269 MEA Liposomal Drug Delivery Devices Market Forecast by Technology, 2022-2032 (US$ Million, AGR%, CAGR%): "V" Shaped Recovery
Table 270 MEA Liposomal Drug Delivery Devices Market Forecast by Technology, 2022-2032 (US$ Million, AGR%, CAGR%): "U" Shaped Recovery
Table 271 MEA Liposomal Drug Delivery Devices Market Forecast by Technology, 2022-2032 (US$ Million, AGR%, CAGR%): "W" Shaped Recovery
Table 272 MEA Liposomal Drug Delivery Devices Market Forecast by Technology, 2022-2032 (US$ Million, AGR%, CAGR%): "L" Shaped Recovery
Table 273 MEA Liposomal Drug Delivery Devices Market Forecast by Application, 2022-2032 (US$ million, AGR%, CAGR%)
Table 274 MEA Liposomal Drug Delivery Devices Market Forecast by Application, 2022-2032 (US$ Million, AGR%, CAGR%): "V" Shaped Recovery
Table 275 MEA Liposomal Drug Delivery Devices Market Forecast by Application, 2022-2032 (US$ Million, AGR%, CAGR%): "U" Shaped Recovery
Table 276 MEA Liposomal Drug Delivery Devices Market Forecast by Application, 2022-2032 (US$ Million, AGR%, CAGR%): "W" Shaped Recovery
Table 277 MEA Liposomal Drug Delivery Devices Market Forecast by Application, 2022-2032 (US$ Million, AGR%, CAGR%): "L" Shaped Recovery
Table 278 MEA Liposomal Drug Delivery Devices Market Forecast by End-User, 2022-2032 (US$ million, AGR%, CAGR%)
Table 279 MEA Liposomal Drug Delivery Devices Market Forecast by End-User, 2022-2032 (US$ Million, AGR%, CAGR%): "V" Shaped Recovery
Table 280 MEA Liposomal Drug Delivery Devices Market Forecast by End-User, 2022-2032 (US$ Million, AGR%, CAGR%): "U" Shaped Recovery
Table 281 MEA Liposomal Drug Delivery Devices Market Forecast by End-User, 2022-2032 (US$ Million, AGR%, CAGR%): "W" Shaped Recovery
Table 282 MEA Liposomal Drug Delivery Devices Market Forecast by End-User, 2022-2032 (US$ Million, AGR%, CAGR%): "L" Shaped Recovery
Table 283 GCC Liposomal Drug Delivery Devices Market Forecast, 2022-2032 (US$ Million, AGR%, CAGR%)
Table 284 GCC Liposomal Drug Delivery Devices Market Forecast, 2022-2032 (US$ Million, AGR%, CAGR%): "V" Shaped Recovery
Table 285 GCC Liposomal Drug Delivery Devices Market Forecast, 2022-2032 (US$ Million, AGR%, CAGR%): "U" Shaped Recovery
Table 286 GCC Liposomal Drug Delivery Devices Market Forecast, 2022-2032 (US$ Million, AGR%, CAGR%): "W" Shaped Recovery
Table 287 GCC Liposomal Drug Delivery Devices Market Forecast, 2022-2032 (US$ Million, AGR%, CAGR%): "L" Shaped Recovery
Table 288 South Africa Liposomal Drug Delivery Devices Market Forecast, 2022-2032 (US$ Million, AGR%, CAGR%)
Table 289 South Africa Liposomal Drug Delivery Devices Market Forecast, 2022-2032 (US$ Million, AGR%, CAGR%): "V" Shaped Recovery
Table 290 South Africa Liposomal Drug Delivery Devices Market Forecast, 2022-2032 (US$ Million, AGR%, CAGR%): "U" Shaped Recovery
Table 291 South Africa Liposomal Drug Delivery Devices Market Forecast, 2022-2032 (US$ Million, AGR%, CAGR%): "W" Shaped Recovery
Table 292 South Africa Liposomal Drug Delivery Devices Market Forecast, 2022-2032 (US$ Million, AGR%, CAGR%): "L" Shaped Recovery
Table 293 Rest of MEA Liposomal Drug Delivery Devices Market Forecast, 2022-2032 (US$ Million, AGR%, CAGR%)
Table 294 Rest of MEA Liposomal Drug Delivery Devices Market Forecast, 2022-2032 (US$ Million, AGR%, CAGR%): "V" Shaped Recovery
Table 295 Rest of MEA Liposomal Drug Delivery Devices Market Forecast, 2022-2032 (US$ Million, AGR%, CAGR%): "U" Shaped Recovery
Table 296 Rest of MEA Liposomal Drug Delivery Devices Market Forecast, 2022-2032 (US$ Million, AGR%, CAGR%): "W" Shaped Recovery
Table 297 Rest of MEA Liposomal Drug Delivery Devices Market Forecast, 2022-2032 (US$ Million, AGR%, CAGR%): "L" Shaped Recovery
Table 298 Company Ranking, 2021
Table 299 Recent Developments: Liposomal Drug Delivery Devices Market
Table 300 Takeda Pharmaceutical Company Limited: Key Details, (CEO, HQ, Revenue, Founded, No. of Employees, Company Type, Website, Business Segment)
Table 301 Takeda Pharmaceutical Company Limited: Product Benchmarking
Table 302 Novartis AG: Key Details, (CEO, HQ, Revenue, Founded, No. of Employees, Company Type, Website, Business Segment)
Table 303 Novartis AG: Product Benchmarking
Table 304 Novartis AG: Recent Developments
Table 305 Luye Pharma Group: Key Details, (CEO, HQ, Revenue, Founded, No. of Employees, Company Type, Website, Business Segment)
Table 306 Luye Pharma Group: Product Benchmarking
Table 307 Luye Pharma Group: Recent Developments
Table 308 Ipsen Pharma: Key Details, (CEO, HQ, Revenue, Founded, No. of Employees, Company Type, Website, Business Segment)
Table 309 Ipsen Pharma: Product Benchmarking
Table 310 Ipsen Pharma: Recent Developments
Table 311 Celsion, Inc.: Key Details, (CEO, HQ, Revenue, Founded, No. of Employees, Company Type, Website, Business Segment)
Table 312 Celsion, Inc.: Product Benchmarking
Table 313 Celsion, Inc.: Recent Developments
Table 314 Galen Limited: Key Details, (CEO, HQ, Revenue, Founded, No. of Employees, Company Type, Website, Business Segment)
Table 315 Galen Limited: Product Benchmarking
Table 316 Astellas Pharma, Inc.: Key Details, (CEO, HQ, Revenue, Founded, No. of Employees, Company Type, Website, Business Segment)
Table 317 Astellas Pharma, Inc.: Product Benchmarking
Table 318 Astellas Pharma, Inc.: Recent Developments
Table 319 Acrotech Biopharma, Inc.: Key Details, (CEO, HQ, Revenue, Founded, No. of Employees, Company Type, Website, Business Segment)
Table 320 Acrotech Biopharma, Inc.: Product Benchmarking
Table 321 Fudan-Zhangjiang: Key Details, (CEO, HQ, Revenue, Founded, No. of Employees, Company Type, Website, Business Segment)
Table 322 Fudan-Zhangjiang: Product Benchmarking
Table 323 Pacira: Key Details, (CEO, HQ, Revenue, Founded, No. of Employees, Company Type, Website, Business Segment)
Table 324 Pacira: Product Benchmarking
Table 325 Pacira: Recent Developments
Table 326 Creative Biolabs: Key Details, (CEO, HQ, Revenue, Founded, No. of Employees, Company Type, Website, Business Segment)
Table 327 Creative Biolabs: Product Benchmarking
Table 328 Precision NanoSystems Inc.: Key Details, (CEO, HQ, Revenue, Founded, No. of Employees, Company Type, Website, Business Segment)
Table 329 Precision NanoSystems Inc.: Product Benchmarking
Table 330 Encapsula NanoSciences LLC: Key Details, (CEO, HQ, Revenue, Founded, No. of Employees, Company Type, Website, Business Segment)
Table 331 Encapsula NanoSciences LLC.: Product Benchmarking
Table 332 Avanti Polar Lipids, Inc.: Key Details, (CEO, HQ, Revenue, Founded, No. of Employees, Company Type, Website, Business Segment)
Table 333 Avanti Polar Lipids, Inc.: Product Benchmarking
Table 334 Viatris Inc.: Key Details, (CEO, HQ, Revenue, Founded, No. of Employees, Company Type, Website, Business Segment)
Table 335 Viatris Inc.: Product Benchmarking
Table 336 Merrimack Pharmaceuticals, Inc.: Key Details, (CEO, HQ, Revenue, Founded, No. of Employees, Company Type, Website, Business Segment)
Table 337 Merrimack Pharmaceuticals, Inc.: Product Benchmarking
List of Figures
Figure 1 Global Liposomal Drug Delivery Devices Market: Market Segmentation
Figure 2 Global Liposomal Drug Delivery Devices Market Trends
Figure 3 Global Liposomal Drug Delivery Devices Market Forecast by Type, 2022-2032 (US$ million, AGR %)
Figure 4 Global Liposomal Drug Delivery Devices Market Share Forecast by Type, 2022, 2027, 2032 (%)
Figure 5 Global Liposomal Drug Delivery Devices Market for Liposomal Doxorubicin Segment: Revenue Forecast 2022-2032 (US$ million, AGR%)
Figure 6 Global Liposomal Drug Delivery Devices Market for Liposomal Doxorubicin Segment, Revenue Forecast 2022-2032 (US$ million, AGR%): “V” Shaped Recovery
Figure 7 Global Liposomal Drug Delivery Devices Market for Liposomal Doxorubicin Segment, Revenue Forecast 2022-2032 (US$ million, AGR%): “U” Shaped Recovery
Figure 8 Global Liposomal Drug Delivery Devices Market for Liposomal Doxorubicin Segment, Revenue Forecast 2022-2032 (US$ million, AGR%): “W” Shaped Recovery
Figure 9 Global Liposomal Drug Delivery Devices Market for Liposomal Doxorubicin Segment, Revenue Forecast 2022-2032 (US$ million, AGR%): “L” Shaped Recovery
Figure 10 Global Liposomal Drug Delivery Devices Market for Liposomal Paclitaxel Segment: Revenue Forecast 2022-2032 (US$ million, AGR%)
Figure 11 Global Liposomal Drug Delivery Devices Market for Liposomal Paclitaxel Segment, Revenue Forecast 2022-2032 (US$ million, AGR%): “V” Shaped Recovery
Figure 12 Global Liposomal Drug Delivery Devices Market for Liposomal Paclitaxel Segment, Revenue Forecast 2022-2032 (US$ million, AGR%): “U” Shaped Recovery
Figure 13 Global Liposomal Drug Delivery Devices Market for Liposomal Paclitaxel Segment, Revenue Forecast 2022-2032 (US$ million, AGR%): “W” Shaped Recovery
Figure 14 Global Liposomal Drug Delivery Devices Market for Liposomal Paclitaxel Segment, Revenue Forecast 2022-2032 (US$ million, AGR%): “L” Shaped Recovery
Figure 15 Global Liposomal Drug Delivery Devices Market for Liposomal Amphotericin B Segment: Revenue Forecast 2022-2032 (US$ million, AGR%)
Figure 16 Global Liposomal Drug Delivery Devices Market for Liposomal Amphotericin B Segment, Revenue Forecast 2022-2032 (US$ million, AGR%): “V” Shaped Recovery
Figure 17 Global Liposomal Drug Delivery Devices Market for Liposomal Amphotericin B Segment, Revenue Forecast 2022-2032 (US$ million, AGR%): “U” Shaped Recovery
Figure 18 Global Liposomal Drug Delivery Devices Market for Liposomal Amphotericin B Segment, Revenue Forecast 2022-2032 (US$ million, AGR%): “W” Shaped Recovery
Figure 19 Global Liposomal Drug Delivery Devices Market for Liposomal Amphotericin B Segment, Revenue Forecast 2022-2032 (US$ million, AGR%): “L” Shaped Recovery
Figure 20 Global Liposomal Drug Delivery Devices Market Forecast by Technology, 2022-2032 (US$ million, AGR %)
Figure 21 Global Liposomal Drug Delivery Devices Market Share Forecast by Technology, 2022, 2027, 2032 (%)
Figure 22 Global Liposomal Drug Delivery Devices Market for Stealth Liposome Technology Segment: Revenue Forecast 2022-2032 (US$ million, AGR%)
Figure 23 Global Liposomal Drug Delivery Devices Market for Stealth Liposome Technology Segment, Revenue Forecast 2022-2032 (US$ million, AGR%): “V” Shaped Recovery
Figure 24 Global Liposomal Drug Delivery Devices Market for Stealth Liposome Technology Segment, Revenue Forecast 2022-2032 (US$ million, AGR%): “U” Shaped Recovery
Figure 25 Global Liposomal Drug Delivery Devices Market for Stealth Liposome Technology Segment, Revenue Forecast 2022-2032 (US$ million, AGR%): “W” Shaped Recovery
Figure 26 Global Liposomal Drug Delivery Devices Market for Stealth Liposome Technology Segment, Revenue Forecast 2022-2032 (US$ million, AGR%): “L” Shaped Recovery
Figure 27 Global Liposomal Drug Delivery Devices Market for Non-PEGylated Liposome Technology Segment: Revenue Forecast 2022-2032 (US$ million, AGR%)
Figure 28 Global Liposomal Drug Delivery Devices Market for Non-PEGylated Liposome Technology Segment, Revenue Forecast 2022-2032 (US$ million, AGR%): “V” Shaped Recovery
Figure 29 Global Liposomal Drug Delivery Devices Market for Non-PEGylated Liposome Technology Segment, Revenue Forecast 2022-2032 (US$ million, AGR%): “U” Shaped Recovery
Figure 30 Global Liposomal Drug Delivery Devices Market for Non-PEGylated Liposome Technology Segment, Revenue Forecast 2022-2032 (US$ million, AGR%): “W” Shaped Recovery
Figure 31 Global Liposomal Drug Delivery Devices Market for Non-PEGylated Liposome Technology Segment, Revenue Forecast 2022-2032 (US$ million, AGR%): “L” Shaped Recovery
Figure 32 Global Liposomal Drug Delivery Devices Market for DepoFoam Liposome Technology Segment: Revenue Forecast 2022-2032 (US$ million, AGR%)
Figure 33 Global Liposomal Drug Delivery Devices Market for DepoFoam Liposome Technology Segment, Revenue Forecast 2022-2032 (US$ million, AGR%): “V” Shaped Recovery
Figure 34 Global Liposomal Drug Delivery Devices Market for DepoFoam Liposome Technology Segment, Revenue Forecast 2022-2032 (US$ million, AGR%): “U” Shaped Recovery
Figure 35 Global Liposomal Drug Delivery Devices Market for DepoFoam Liposome Technology Segment, Revenue Forecast 2022-2032 (US$ million, AGR%): “W” Shaped Recovery
Figure 36 Global Liposomal Drug Delivery Devices Market for DepoFoam Liposome Technology Segment, Revenue Forecast 2022-2032 (US$ million, AGR%): “L” Shaped Recovery
Figure 37 Global Liposomal Drug Delivery Devices Market Forecast by Application, 2022-2032 (US$ million, AGR %)
Figure 38 Global Liposomal Drug Delivery Devices Market Share Forecast by Application, 2022, 2027, 2032 (%)
Figure 39 Global Liposomal Drug Delivery Devices Market for Fungal Diseases Segment: Revenue Forecast 2022-2032 (US$ million, AGR%)
Figure 40 Global Liposomal Drug Delivery Devices Market for Fungal Diseases Segment, Revenue Forecast 2022-2032 (US$ million, AGR%): “V” Shaped Recovery
Figure 41 Global Liposomal Drug Delivery Devices Market for Fungal Diseases Segment, Revenue Forecast 2022-2032 (US$ million, AGR%): “U” Shaped Recovery
Figure 42 Global Liposomal Drug Delivery Devices Market for Fungal Diseases Segment, Revenue Forecast 2022-2032 (US$ million, AGR%): “W” Shaped Recovery
Figure 43 Global Liposomal Drug Delivery Devices Market for Fungal Diseases Segment, Revenue Forecast 2022-2032 (US$ million, AGR%): “L” Shaped Recovery
Figure 44 Global Liposomal Drug Delivery Devices Market for Cancer Therapy Segment: Revenue Forecast 2022-2032 (US$ million, AGR%)
Figure 45 Global Liposomal Drug Delivery Devices Market for Cancer Therapy Segment, Revenue Forecast 2022-2032 (US$ million, AGR%): “V” Shaped Recovery
Figure 46 Global Liposomal Drug Delivery Devices Market for Cancer Therapy Segment, Revenue Forecast 2022-2032 (US$ million, AGR%): “U” Shaped Recovery
Figure 47 Global Liposomal Drug Delivery Devices Market for Cancer Therapy Segment, Revenue Forecast 2022-2032 (US$ million, AGR%): “W” Shaped Recovery
Figure 48 Global Liposomal Drug Delivery Devices Market for Cancer Therapy Segment, Revenue Forecast 2022-2032 (US$ million, AGR%): “L” Shaped Recovery
Figure 49 Global Liposomal Drug Delivery Devices Market for Pain Management Segment: Revenue Forecast 2022-2032 (US$ million, AGR%)
Figure 50 Global Liposomal Drug Delivery Devices Market for Pain Management Segment, Revenue Forecast 2022-2032 (US$ million, AGR%): “V” Shaped Recovery
Figure 51 Global Liposomal Drug Delivery Devices Market for Pain Management Segment, Revenue Forecast 2022-2032 (US$ million, AGR%): “U” Shaped Recovery
Figure 52 Global Liposomal Drug Delivery Devices Market for Pain Management Segment, Revenue Forecast 2022-2032 (US$ million, AGR%): “W” Shaped Recovery
Figure 53 Global Liposomal Drug Delivery Devices Market for Pain Management Segment, Revenue Forecast 2022-2032 (US$ million, AGR%): “L” Shaped Recovery
Figure 54 Global Liposomal Drug Delivery Devices Market for Viral Vaccines Segment: Revenue Forecast 2022-2032 (US$ million, AGR%)
Figure 55 Global Liposomal Drug Delivery Devices Market for Viral Vaccines Segment, Revenue Forecast 2022-2032 (US$ million, AGR%): “V” Shaped Recovery
Figure 56 Global Liposomal Drug Delivery Devices Market for Viral Vaccines Segment, Revenue Forecast 2022-2032 (US$ million, AGR%): “U” Shaped Recovery
Figure 57 Global Liposomal Drug Delivery Devices Market for Viral Vaccines Segment, Revenue Forecast 2022-2032 (US$ million, AGR%): “W” Shaped Recovery
Figure 58 Global Liposomal Drug Delivery Devices Market for Viral Vaccines Segment, Revenue Forecast 2022-2032 (US$ million, AGR%): “L” Shaped Recovery
Figure 59 Global Liposomal Drug Delivery Devices Market for Photodynamic Therapy Segment: Revenue Forecast 2022-2032 (US$ million, AGR%)
Figure 60 Global Liposomal Drug Delivery Devices Market for Photodynamic Therapy Segment, Revenue Forecast 2022-2032 (US$ million, AGR%): “V” Shaped Recovery
Figure 61 Global Liposomal Drug Delivery Devices Market for Photodynamic Therapy Segment, Revenue Forecast 2022-2032 (US$ million, AGR%): “U” Shaped Recovery
Figure 62 Global Liposomal Drug Delivery Devices Market for Photodynamic Therapy Segment, Revenue Forecast 2022-2032 (US$ million, AGR%): “W” Shaped Recovery
Figure 63 Global Liposomal Drug Delivery Devices Market for Photodynamic Therapy Segment, Revenue Forecast 2022-2032 (US$ million, AGR%): “L” Shaped Recovery
Figure 64 Global Liposomal Drug Delivery Devices Market Forecast by End-User, 2022-2032 (US$ million, AGR %)
Figure 65 Global Liposomal Drug Delivery Devices Market Share Forecast by End-User, 2022, 2027, 2032 (%)
Figure 66 Global Liposomal Drug Delivery Devices Market for Hospitals Segment: Revenue Forecast 2022-2032 (US$ million, AGR%)
Figure 67 Global Liposomal Drug Delivery Devices Market for Hospitals Segment, Revenue Forecast 2022-2032 (US$ million, AGR%): “V” Shaped Recovery
Figure 68 Global Liposomal Drug Delivery Devices Market for Hospitals Segment, Revenue Forecast 2022-2032 (US$ million, AGR%): “U” Shaped Recovery
Figure 69 Global Liposomal Drug Delivery Devices Market for Hospitals Segment, Revenue Forecast 2022-2032 (US$ million, AGR%): “W” Shaped Recovery
Figure 70 Global Liposomal Drug Delivery Devices Market for Hospitals Segment, Revenue Forecast 2022-2032 (US$ million, AGR%): “L” Shaped Recovery
Figure 71 Global Liposomal Drug Delivery Devices Market for Diagnostic Centers Segment: Revenue Forecast 2022-2032 (US$ million, AGR%)
Figure 72 Global Liposomal Drug Delivery Devices Market for Diagnostic Centers Segment, Revenue Forecast 2022-2032 (US$ million, AGR%): “V” Shaped Recovery
Figure 73 Global Liposomal Drug Delivery Devices Market for Diagnostic Centers Segment, Revenue Forecast 2022-2032 (US$ million, AGR%): “U” Shaped Recovery
Figure 74 Global Liposomal Drug Delivery Devices Market for Diagnostic Centers Segment, Revenue Forecast 2022-2032 (US$ million, AGR%): “W” Shaped Recovery
Figure 75 Global Liposomal Drug Delivery Devices Market for Diagnostic Centers Segment, Revenue Forecast 2022-2032 (US$ million, AGR%): “L” Shaped Recovery
Figure 76 Global Liposomal Drug Delivery Devices Market for Ambulatory Surgery Centers/Clinics Segment: Revenue Forecast 2022-2032 (US$ million, AGR%)
Figure 77 Global Liposomal Drug Delivery Devices Market for Ambulatory Surgery Centers/Clinics Segment, Revenue Forecast 2022-2032 (US$ million, AGR%): “V” Shaped Recovery
Figure 78 Global Liposomal Drug Delivery Devices Market for Ambulatory Surgery Centers/Clinics Segment, Revenue Forecast 2022-2032 (US$ million, AGR%): “U” Shaped Recovery
Figure 79 Global Liposomal Drug Delivery Devices Market for Ambulatory Surgery Centers/Clinics Segment, Revenue Forecast 2022-2032 (US$ million, AGR%): “W” Shaped Recovery
Figure 80 Global Liposomal Drug Delivery Devices Market for Ambulatory Surgery Centers/Clinics Segment, Revenue Forecast 2022-2032 (US$ million, AGR%): “L” Shaped Recovery
Figure 81 Global Liposomal Drug Delivery Devices Market Forecast by Region 2022-2032 (US$ million)
Figure 82 Global Liposomal Drug Delivery Devices Market Share Forecast by Region 2022, 2027, 2032 (%)
Figure 83 Global Liposomal Drug Delivery Devices Market Forecast, 2022-2032 (US$ million, AGR%): “V” Shaped Recovery
Figure 84 Global Liposomal Drug Delivery Devices Market Forecast, 2022-2032 (US$ million, AGR%): “U” Shaped Recovery
Figure 85 Global Liposomal Drug Delivery Devices Market Forecast, 2022-2032 (US$ million, AGR%): “W” Shaped Recovery
Figure 86 Global Liposomal Drug Delivery Devices Market Forecast, 2022-2032 (US$ million, AGR%): “L” Shaped Recovery
Figure 87 North America Liposomal Drug Delivery Devices Market Forecast by Country 2022-2032 (US$ million)
Figure 88 North America Liposomal Drug Delivery Devices Market Share Forecast by Country 2022, 2027, 2032 (%)
Figure 89 North America Liposomal Drug Delivery Devices Market Forecast by Type, 2022-2032 (US$ million, AGR%)
Figure 90 North America Liposomal Drug Delivery Devices Market Forecast by Type, 2022-2032 (US$ million, AGR%): “V” Shaped Recovery
Figure 91 North America Liposomal Drug Delivery Devices Market Forecast by Type, 2022-2032 (US$ million, AGR%): “U” Shaped Recovery
Figure 92 North America Liposomal Drug Delivery Devices Market Forecast by Type, 2022-2032 (US$ million, AGR%): “W” Shaped Recovery
Figure 93 North America Liposomal Drug Delivery Devices Market Forecast by Type, 2022-2032 (US$ million, AGR%): “L” Shaped Recovery
Figure 94 North America Liposomal Drug Delivery Devices Market Forecast by Technology, 2022-2032 (US$ million, AGR%)
Figure 95 North America Liposomal Drug Delivery Devices Market Forecast by Technology, 2022-2032 (US$ million, AGR%): “V” Shaped Recovery
Figure 96 North America Liposomal Drug Delivery Devices Market Forecast by Technology, 2022-2032 (US$ million, AGR%): “U” Shaped Recovery
Figure 97 North America Liposomal Drug Delivery Devices Market Forecast by Technology, 2022-2032 (US$ million, AGR%): “W” Shaped Recovery
Figure 98 North America Liposomal Drug Delivery Devices Market Forecast by Technology, 2022-2032 (US$ million, AGR%): “L” Shaped Recovery
Figure 99 North America Liposomal Drug Delivery Devices Market Forecast by Application, 2022-2032 (US$ million, AGR%)
Figure 100 North America Liposomal Drug Delivery Devices Market Forecast by Application, 2022-2032 (US$ million, AGR%): “V” Shaped Recovery
Figure 101 North America Liposomal Drug Delivery Devices Market Forecast by Application, 2022-2032 (US$ million, AGR%): “U” Shaped Recovery
Figure 102 North America Liposomal Drug Delivery Devices Market Forecast by Application, 2022-2032 (US$ million, AGR%): “W” Shaped Recovery
Figure 103 North America Liposomal Drug Delivery Devices Market Forecast by Application, 2022-2032 (US$ million, AGR%): “L” Shaped Recovery
Figure 104 North America Liposomal Drug Delivery Devices Market Forecast by End-User, 2022-2032 (US$ million, AGR%)
Figure 105 North America Liposomal Drug Delivery Devices Market Forecast by End-User, 2022-2032 (US$ million, AGR%): “V” Shaped Recovery
Figure 106 North America Liposomal Drug Delivery Devices Market Forecast by End-User, 2022-2032 (US$ million, AGR%): “U” Shaped Recovery
Figure 107 North America Liposomal Drug Delivery Devices Market Forecast by End-User, 2022-2032 (US$ million, AGR%): “W” Shaped Recovery
Figure 108 North America Liposomal Drug Delivery Devices Market Forecast by End-User, 2022-2032 (US$ million, AGR%): “L” Shaped Recovery
Figure 109 U.S. Liposomal Drug Delivery Devices Market Forecast, 2022-2032 (US$ million, AGR %)
Figure 110 U.S. Liposomal Drug Delivery Devices Market Forecast, 2022-2032 (US$ million, AGR%): “V” Shaped Recovery
Figure 111 U.S. Liposomal Drug Delivery Devices Market Forecast, 2022-2032 (US$ million, AGR%): “U” Shaped Recovery
Figure 112 U.S. Liposomal Drug Delivery Devices Market Forecast, 2022-2032 (US$ million, AGR%): “W” Shaped Recovery
Figure 113 U.S. Liposomal Drug Delivery Devices Market Forecast, 2022-2032 (US$ million, AGR%): “L” Shaped Recovery
Figure 114 Canada Liposomal Drug Delivery Devices Market Forecast, 2022-2032 (US$ million, AGR %)
Figure 115 Canada Liposomal Drug Delivery Devices Market Forecast, 2022-2032 (US$ million, AGR%): “V” Shaped Recovery
Figure 116 Canada Liposomal Drug Delivery Devices Market Forecast, 2022-2032 (US$ million, AGR%): “U” Shaped Recovery
Figure 117 Canada Liposomal Drug Delivery Devices Market Forecast, 2022-2032 (US$ million, AGR%): “W” Shaped Recovery
Figure 118 Canada Liposomal Drug Delivery Devices Market Forecast, 2022-2032 (US$ million, AGR%): “L” Shaped Recovery
Figure 119 Europe Liposomal Drug Delivery Devices Market Forecast by Country 2022-2032 (US$ million)
Figure 120 Europe Liposomal Drug Delivery Devices Market Share Forecast by Country 2022, 2027, 2032 (%)
Figure 121 Europe Liposomal Drug Delivery Devices Market Forecast by Type, 2022-2032 (US$ million, AGR%)
Figure 122 Europe Liposomal Drug Delivery Devices Market Forecast by Type, 2022-2032 (US$ million, AGR%): “V” Shaped Recovery
Figure 123 Europe Liposomal Drug Delivery Devices Market Forecast by Type, 2022-2032 (US$ million, AGR%): “U” Shaped Recovery
Figure 124 Europe Liposomal Drug Delivery Devices Market Forecast by Type, 2022-2032 (US$ million, AGR%): “W” Shaped Recovery
Figure 125 Europe Liposomal Drug Delivery Devices Market Forecast by Type, 2022-2032 (US$ million, AGR%): “L” Shaped Recovery
Figure 126 Europe Liposomal Drug Delivery Devices Market Forecast by Technology, 2022-2032 (US$ million, AGR%)
Figure 127 Europe Liposomal Drug Delivery Devices Market Forecast by Technology, 2022-2032 (US$ million, AGR%): “V” Shaped Recovery
Figure 128 Europe Liposomal Drug Delivery Devices Market Forecast by Technology, 2022-2032 (US$ million, AGR%): “U” Shaped Recovery
Figure 129 Europe Liposomal Drug Delivery Devices Market Forecast by Technology, 2022-2032 (US$ million, AGR%): “W” Shaped Recovery
Figure 130 Europe Liposomal Drug Delivery Devices Market Forecast by Technology, 2022-2032 (US$ million, AGR%): “L” Shaped Recovery
Figure 131 Europe Liposomal Drug Delivery Devices Market Forecast by Application, 2022-2032 (US$ million, AGR%)
Figure 132 Europe Liposomal Drug Delivery Devices Market Forecast by Application, 2022-2032 (US$ million, AGR%): “V” Shaped Recovery
Figure 133 Europe Liposomal Drug Delivery Devices Market Forecast by Application, 2022-2032 (US$ million, AGR%): “U” Shaped Recovery
Figure 134 Europe Liposomal Drug Delivery Devices Market Forecast by Application, 2022-2032 (US$ million, AGR%): “W” Shaped Recovery
Figure 135 Europe Liposomal Drug Delivery Devices Market Forecast by Application, 2022-2032 (US$ million, AGR%): “L” Shaped Recovery
Figure 136 Europe Liposomal Drug Delivery Devices Market Forecast by End-User, 2022-2032 (US$ million, AGR%)
Figure 137 Europe Liposomal Drug Delivery Devices Market Forecast by End-User, 2022-2032 (US$ million, AGR%): “V” Shaped Recovery
Figure 138 Europe Liposomal Drug Delivery Devices Market Forecast by End-User, 2022-2032 (US$ million, AGR%): “U” Shaped Recovery
Figure 139 Europe Liposomal Drug Delivery Devices Market Forecast by End-User, 2022-2032 (US$ million, AGR%): “W” Shaped Recovery
Figure 140 Europe Liposomal Drug Delivery Devices Market Forecast by End-User, 2022-2032 (US$ million, AGR%): “L” Shaped Recovery
Figure 141 Germany Liposomal Drug Delivery Devices Market Forecast, 2022-2032 (US$ million, AGR %)
Figure 142 Germany Liposomal Drug Delivery Devices Market Forecast, 2022-2032 (US$ million, AGR%): “V” Shaped Recovery
Figure 143 Germany Liposomal Drug Delivery Devices Market Forecast, 2022-2032 (US$ million, AGR%): “U” Shaped Recovery
Figure 144 Germany Liposomal Drug Delivery Devices Market Forecast, 2022-2032 (US$ million, AGR%): “W” Shaped Recovery
Figure 145 Germany Liposomal Drug Delivery Devices Market Forecast, 2022-2032 (US$ million, AGR%): “L” Shaped Recovery
Figure 146 UK Liposomal Drug Delivery Devices Market Forecast, 2022-2032 (US$ million, AGR %)
Figure 147 UK Liposomal Drug Delivery Devices Market Forecast, 2022-2032 (US$ million, AGR%): “V” Shaped Recovery
Figure 148 UK Liposomal Drug Delivery Devices Market Forecast, 2022-2032 (US$ million, AGR%): “U” Shaped Recovery
Figure 149 UK Liposomal Drug Delivery Devices Market Forecast, 2022-2032 (US$ million, AGR%): “W” Shaped Recovery
Figure 150 UK Liposomal Drug Delivery Devices Market Forecast, 2022-2032 (US$ million, AGR%): “L” Shaped Recovery
Figure 151 France Liposomal Drug Delivery Devices Market Forecast, 2022-2032 (US$ million, AGR %)
Figure 152 France Liposomal Drug Delivery Devices Market Forecast, 2022-2032 (US$ million, AGR%): “V” Shaped Recovery
Figure 153 France Liposomal Drug Delivery Devices Market Forecast, 2022-2032 (US$ million, AGR%): “U” Shaped Recovery
Figure 154 France Liposomal Drug Delivery Devices Market Forecast, 2022-2032 (US$ million, AGR%): “W” Shaped Recovery
Figure 155 France Liposomal Drug Delivery Devices Market Forecast, 2022-2032 (US$ million, AGR%): “L” Shaped Recovery
Figure 156 Italy Liposomal Drug Delivery Devices Market Forecast, 2022-2032 (US$ million, AGR %)
Figure 157 Italy Liposomal Drug Delivery Devices Market Forecast, 2022-2032 (US$ million, AGR%): “V” Shaped Recovery
Figure 158 Italy Liposomal Drug Delivery Devices Market Forecast, 2022-2032 (US$ million, AGR%): “U” Shaped Recovery
Figure 159 Italy Liposomal Drug Delivery Devices Market Forecast, 2022-2032 (US$ million, AGR%): “W” Shaped Recovery
Figure 160 Italy Liposomal Drug Delivery Devices Market Forecast, 2022-2032 (US$ million, AGR%): “L” Shaped Recovery
Figure 161 Spain Liposomal Drug Delivery Devices Market Forecast, 2022-2032 (US$ million, AGR %)
Figure 162 Spain Liposomal Drug Delivery Devices Market Forecast, 2022-2032 (US$ million, AGR%): “V” Shaped Recovery
Figure 163 Spain Liposomal Drug Delivery Devices Market Forecast, 2022-2032 (US$ million, AGR%): “U” Shaped Recovery
Figure 164 Spain Liposomal Drug Delivery Devices Market Forecast, 2022-2032 (US$ million, AGR%): “W” Shaped Recovery
Figure 165 Spain Liposomal Drug Delivery Devices Market Forecast, 2022-2032 (US$ million, AGR%): “L” Shaped Recovery
Figure 166 Russia Liposomal Drug Delivery Devices Market Forecast, 2022-2032 (US$ million, AGR %)
Figure 167 Russia Liposomal Drug Delivery Devices Market Forecast, 2022-2032 (US$ million, AGR%): “V” Shaped Recovery
Figure 168 Russia Liposomal Drug Delivery Devices Market Forecast, 2022-2032 (US$ million, AGR%): “U” Shaped Recovery
Figure 169 Russia Liposomal Drug Delivery Devices Market Forecast, 2022-2032 (US$ million, AGR%): “W” Shaped Recovery
Figure 170 Russia Liposomal Drug Delivery Devices Market Forecast, 2022-2032 (US$ million, AGR%): “L” Shaped Recovery
Figure 171 Rest of Europe Liposomal Drug Delivery Devices Market Forecast, 2022-2032 (US$ million, AGR %)
Figure 172 Rest of Europe Liposomal Drug Delivery Devices Market Forecast, 2022-2032 (US$ million, AGR%): “V” Shaped Recovery
Figure 173 Rest of Europe Liposomal Drug Delivery Devices Market Forecast, 2022-2032 (US$ million, AGR%): “U” Shaped Recovery
Figure 174 Rest of Europe Liposomal Drug Delivery Devices Market Forecast, 2022-2032 (US$ million, AGR%): “W” Shaped Recovery
Figure 175 Rest of Europe Liposomal Drug Delivery Devices Market Forecast, 2022-2032 (US$ million, AGR%): “L” Shaped Recovery
Figure 176 Asia Pacific Liposomal Drug Delivery Devices Market Forecast by Country 2022-2032 (US$ million)
Figure 177 Asia Pacific Liposomal Drug Delivery Devices Market Share Forecast by Country 2022, 2027, 2032 (%)
Figure 178 Asia Pacific Liposomal Drug Delivery Devices Market Forecast by Type, 2022-2032 (US$ million, AGR%)
Figure 179 Asia Pacific Liposomal Drug Delivery Devices Market Forecast by Type, 2022-2032 (US$ million, AGR%): “V” Shaped Recovery
Figure 180 Asia Pacific Liposomal Drug Delivery Devices Market Forecast by Type, 2022-2032 (US$ million, AGR%): “U” Shaped Recovery
Figure 181 Asia Pacific Liposomal Drug Delivery Devices Market Forecast by Type, 2022-2032 (US$ million, AGR%): “W” Shaped Recovery
Figure 182 Asia Pacific Liposomal Drug Delivery Devices Market Forecast by Type, 2022-2032 (US$ million, AGR%): “L” Shaped Recovery
Figure 183 Asia Pacific Liposomal Drug Delivery Devices Market Forecast by Technology, 2022-2032 (US$ million, AGR%)
Figure 184 Asia Pacific Liposomal Drug Delivery Devices Market Forecast by Technology, 2022-2032 (US$ million, AGR%): “V” Shaped Recovery
Figure 185 Asia Pacific Liposomal Drug Delivery Devices Market Forecast by Technology, 2022-2032 (US$ million, AGR%): “U” Shaped Recovery
Figure 186 Asia Pacific Liposomal Drug Delivery Devices Market Forecast by Technology, 2022-2032 (US$ million, AGR%): “W” Shaped Recovery
Figure 187 Asia Pacific Liposomal Drug Delivery Devices Market Forecast by Technology, 2022-2032 (US$ million, AGR%): “L” Shaped Recovery
Figure 188 Asia Pacific Liposomal Drug Delivery Devices Market Forecast by Application, 2022-2032 (US$ million, AGR%)
Figure 189 Asia Pacific Liposomal Drug Delivery Devices Market Forecast by Application, 2022-2032 (US$ million, AGR%): “V” Shaped Recovery
Figure 190 Asia Pacific Liposomal Drug Delivery Devices Market Forecast by Application, 2022-2032 (US$ million, AGR%): “U” Shaped Recovery
Figure 191 Asia Pacific Liposomal Drug Delivery Devices Market Forecast by Application, 2022-2032 (US$ million, AGR%): “W” Shaped Recovery
Figure 192 Asia Pacific Liposomal Drug Delivery Devices Market Forecast by Application, 2022-2032 (US$ million, AGR%): “L” Shaped Recovery
Figure 193 Asia Pacific Liposomal Drug Delivery Devices Market Forecast by End-User, 2022-2032 (US$ million, AGR%)
Figure 194 Asia Pacific Liposomal Drug Delivery Devices Market Forecast by End-User, 2022-2032 (US$ million, AGR%): “V” Shaped Recovery
Figure 195 Asia Pacific Liposomal Drug Delivery Devices Market Forecast by End-User, 2022-2032 (US$ million, AGR%): “U” Shaped Recovery
Figure 196 Asia Pacific Liposomal Drug Delivery Devices Market Forecast by End-User, 2022-2032 (US$ million, AGR%): “W” Shaped Recovery
Figure 197 Asia Pacific Liposomal Drug Delivery Devices Market Forecast by End-User, 2022-2032 (US$ million, AGR%): “L” Shaped Recovery
Figure 198 Japan Liposomal Drug Delivery Devices Market Forecast, 2022-2032 (US$ million, AGR %)
Figure 199 Japan Liposomal Drug Delivery Devices Market Forecast, 2022-2032 (US$ million, AGR%): “V” Shaped Recovery
Figure 200 Japan Liposomal Drug Delivery Devices Market Forecast, 2022-2032 (US$ million, AGR%): “U” Shaped Recovery
Figure 201 Japan Liposomal Drug Delivery Devices Market Forecast, 2022-2032 (US$ million, AGR%): “W” Shaped Recovery
Figure 202 Japan Liposomal Drug Delivery Devices Market Forecast, 2022-2032 (US$ million, AGR%): “L” Shaped Recovery
Figure 203 China Liposomal Drug Delivery Devices Market Forecast, 2022-2032 (US$ million, AGR %)
Figure 204 China Liposomal Drug Delivery Devices Market Forecast, 2022-2032 (US$ million, AGR%): “V” Shaped Recovery
Figure 205 China Liposomal Drug Delivery Devices Market Forecast, 2022-2032 (US$ million, AGR%): “U” Shaped Recovery
Figure 206 China Liposomal Drug Delivery Devices Market Forecast, 2022-2032 (US$ million, AGR%): “W” Shaped Recovery
Figure 207 China Liposomal Drug Delivery Devices Market Forecast, 2022-2032 (US$ million, AGR%): “L” Shaped Recovery
Figure 208 India Liposomal Drug Delivery Devices Market Forecast, 2022-2032 (US$ million, AGR %)
Figure 209 India Liposomal Drug Delivery Devices Market Forecast, 2022-2032 (US$ million, AGR%): “V” Shaped Recovery
Figure 210 India Liposomal Drug Delivery Devices Market Forecast, 2022-2032 (US$ million, AGR%): “U” Shaped Recovery
Figure 211 India Liposomal Drug Delivery Devices Market Forecast, 2022-2032 (US$ million, AGR%): “W” Shaped Recovery
Figure 212 India Liposomal Drug Delivery Devices Market Forecast, 2022-2032 (US$ million, AGR%): “L” Shaped Recovery
Figure 213 Australia Liposomal Drug Delivery Devices Market Forecast, 2022-2032 (US$ million, AGR %)
Figure 214 Australia Liposomal Drug Delivery Devices Market Forecast, 2022-2032 (US$ million, AGR%): “V” Shaped Recovery
Figure 215 Australia Liposomal Drug Delivery Devices Market Forecast, 2022-2032 (US$ million, AGR%): “U” Shaped Recovery
Figure 216 Australia Liposomal Drug Delivery Devices Market Forecast, 2022-2032 (US$ million, AGR%): “W” Shaped Recovery
Figure 217 Australia Liposomal Drug Delivery Devices Market Forecast, 2022-2032 (US$ million, AGR%): “L” Shaped Recovery
Figure 218 South Korea Liposomal Drug Delivery Devices Market Forecast, 2022-2032 (US$ million, AGR %)
Figure 219 South Korea Liposomal Drug Delivery Devices Market Forecast, 2022-2032 (US$ million, AGR%): “V” Shaped Recovery
Figure 220 South Korea Liposomal Drug Delivery Devices Market Forecast, 2022-2032 (US$ million, AGR%): “U” Shaped Recovery
Figure 221 South Korea Liposomal Drug Delivery Devices Market Forecast, 2022-2032 (US$ million, AGR%): “W” Shaped Recovery
Figure 222 South Korea Liposomal Drug Delivery Devices Market Forecast, 2022-2032 (US$ million, AGR%): “L” Shaped Recovery
Figure 223 Rest of Asia Pacific Liposomal Drug Delivery Devices Market Forecast, 2022-2032 (US$ million, AGR %)
Figure 224 Rest of Asia Pacific Liposomal Drug Delivery Devices Market Forecast, 2022-2032 (US$ million, AGR%): “V” Shaped Recovery
Figure 225 Rest of Asia Pacific Liposomal Drug Delivery Devices Market Forecast, 2022-2032 (US$ million, AGR%): “U” Shaped Recovery
Figure 226 Rest of Asia Pacific Liposomal Drug Delivery Devices Market Forecast, 2022-2032 (US$ million, AGR%): “W” Shaped Recovery
Figure 227 Rest of Asia Pacific Liposomal Drug Delivery Devices Market Forecast, 2022-2032 (US$ million, AGR%): “L” Shaped Recovery
Figure 228 Latin America Liposomal Drug Delivery Devices Market Forecast by Country 2022-2032 (US$ million)
Figure 229 Latin America Liposomal Drug Delivery Devices Market Share Forecast by Country 2022, 2027, 2032 (%)
Figure 230 Latin America Liposomal Drug Delivery Devices Market Forecast by Type, 2022-2032 (US$ million, AGR%)
Figure 231 Latin America Liposomal Drug Delivery Devices Market Forecast by Type, 2022-2032 (US$ million, AGR%): “V” Shaped Recovery
Figure 232 Latin America Liposomal Drug Delivery Devices Market Forecast by Type, 2022-2032 (US$ million, AGR%): “U” Shaped Recovery
Figure 233 Latin America Liposomal Drug Delivery Devices Market Forecast by Type, 2022-2032 (US$ million, AGR%): “W” Shaped Recovery
Figure 234 Latin America Liposomal Drug Delivery Devices Market Forecast by Type, 2022-2032 (US$ million, AGR%): “L” Shaped Recovery
Figure 235 Latin America Liposomal Drug Delivery Devices Market Forecast by Technology, 2022-2032 (US$ million, AGR%)
Figure 236 Latin America Liposomal Drug Delivery Devices Market Forecast by Technology, 2022-2032 (US$ million, AGR%): “V” Shaped Recovery
Figure 237 Latin America Liposomal Drug Delivery Devices Market Forecast by Technology, 2022-2032 (US$ million, AGR%): “U” Shaped Recovery
Figure 238 Latin America Liposomal Drug Delivery Devices Market Forecast by Technology, 2022-2032 (US$ million, AGR%): “W” Shaped Recovery
Figure 239 Latin America Liposomal Drug Delivery Devices Market Forecast by Technology, 2022-2032 (US$ million, AGR%): “L” Shaped Recovery
Figure 240 Latin America Liposomal Drug Delivery Devices Market Forecast by Application, 2022-2032 (US$ million, AGR%)
Figure 241 Latin America Liposomal Drug Delivery Devices Market Forecast by Application, 2022-2032 (US$ million, AGR%): “V” Shaped Recovery
Figure 242 Latin America Liposomal Drug Delivery Devices Market Forecast by Application, 2022-2032 (US$ million, AGR%): “U” Shaped Recovery
Figure 243 Latin America Liposomal Drug Delivery Devices Market Forecast by Application, 2022-2032 (US$ million, AGR%): “W” Shaped Recovery
Figure 244 Latin America Liposomal Drug Delivery Devices Market Forecast by Application, 2022-2032 (US$ million, AGR%): “L” Shaped Recovery
Figure 245 Latin America Liposomal Drug Delivery Devices Market Forecast by End-User, 2022-2032 (US$ million, AGR%)
Figure 246 Latin America Liposomal Drug Delivery Devices Market Forecast by End-User, 2022-2032 (US$ million, AGR%): “V” Shaped Recovery
Figure 247 Latin America Liposomal Drug Delivery Devices Market Forecast by End-User, 2022-2032 (US$ million, AGR%): “U” Shaped Recovery
Figure 248 Latin America Liposomal Drug Delivery Devices Market Forecast by End-User, 2022-2032 (US$ million, AGR%): “W” Shaped Recovery
Figure 249 Latin America Liposomal Drug Delivery Devices Market Forecast by End-User, 2022-2032 (US$ million, AGR%): “L” Shaped Recovery
Figure 250 Brazil Liposomal Drug Delivery Devices Market Forecast, 2022-2032 (US$ million, AGR %)
Figure 251 Brazil Liposomal Drug Delivery Devices Market Forecast, 2022-2032 (US$ million, AGR%): “V” Shaped Recovery
Figure 252 Brazil Liposomal Drug Delivery Devices Market Forecast, 2022-2032 (US$ million, AGR%): “U” Shaped Recovery
Figure 253 Brazil Liposomal Drug Delivery Devices Market Forecast, 2022-2032 (US$ million, AGR%): “W” Shaped Recovery
Figure 254 Brazil Liposomal Drug Delivery Devices Market Forecast, 2022-2032 (US$ million, AGR%): “L” Shaped Recovery
Figure 255 Mexico Liposomal Drug Delivery Devices Market Forecast, 2022-2032 (US$ million, AGR %)
Figure 256 Mexico Liposomal Drug Delivery Devices Market Forecast, 2022-2032 (US$ million, AGR%): “V” Shaped Recovery
Figure 257 Mexico Liposomal Drug Delivery Devices Market Forecast, 2022-2032 (US$ million, AGR%): “U” Shaped Recovery
Figure 258 Mexico Liposomal Drug Delivery Devices Market Forecast, 2022-2032 (US$ million, AGR%): “W” Shaped Recovery
Figure 259 Mexico Liposomal Drug Delivery Devices Market Forecast, 2022-2032 (US$ million, AGR%): “L” Shaped Recovery
Figure 260 Rest of Latin America Liposomal Drug Delivery Devices Market Forecast, 2022-2032 (US$ million, AGR %)
Figure 261 Rest of Latin America Liposomal Drug Delivery Devices Market Forecast, 2022-2032 (US$ million, AGR%): “V” Shaped Recovery
Figure 262 Rest of Latin America Liposomal Drug Delivery Devices Market Forecast, 2022-2032 (US$ million, AGR%): “U” Shaped Recovery
Figure 263 Rest of Latin America Liposomal Drug Delivery Devices Market Forecast, 2022-2032 (US$ million, AGR%): “W” Shaped Recovery
Figure 264 Rest of Latin America Liposomal Drug Delivery Devices Market Forecast, 2022-2032 (US$ million, AGR%): “L” Shaped Recovery
Figure 265 Middle East and Africa Liposomal Drug Delivery Devices Market Forecast by Country 2022-2032 (US$ million)
Figure 266 Middle East and Africa Liposomal Drug Delivery Devices Market Share Forecast by Country 2022, 2027, 2032 (%)
Figure 267 Middle East and Africa Liposomal Drug Delivery Devices Market Forecast by Type, 2022-2032 (US$ million, AGR%)
Figure 268 Middle East and Africa Liposomal Drug Delivery Devices Market Forecast by Type, 2022-2032 (US$ million, AGR%): “V” Shaped Recovery
Figure 269 Middle East and Africa Liposomal Drug Delivery Devices Market Forecast by Type, 2022-2032 (US$ million, AGR%): “U” Shaped Recovery2
Figure 270 Middle East and Africa Liposomal Drug Delivery Devices Market Forecast by Type, 2022-2032 (US$ million, AGR%): “W” Shaped Recovery
Figure 271 Middle East and Africa Liposomal Drug Delivery Devices Market Forecast by Type, 2022-2032 (US$ million, AGR%): “L” Shaped Recovery
Figure 272 Middle East and Africa Liposomal Drug Delivery Devices Market Forecast by Technology, 2022-2032 (US$ million, AGR%)
Figure 273 Middle East and Africa Liposomal Drug Delivery Devices Market Forecast by Technology, 2022-2032 (US$ million, AGR%): “V” Shaped Recovery
Figure 274 Middle East and Africa Liposomal Drug Delivery Devices Market Forecast by Technology, 2022-2032 (US$ million, AGR%): “U” Shaped Recovery
Figure 275 Middle East and Africa Liposomal Drug Delivery Devices Market Forecast by Technology, 2022-2032 (US$ million, AGR%): “W” Shaped Recovery
Figure 276 Middle East and Africa Liposomal Drug Delivery Devices Market Forecast by Technology, 2022-2032 (US$ million, AGR%): “L” Shaped Recovery
Figure 277 Middle East and Africa Liposomal Drug Delivery Devices Market Forecast by Application, 2022-2032 (US$ million, AGR%)
Figure 278 Middle East and Africa Liposomal Drug Delivery Devices Market Forecast by Application, 2022-2032 (US$ million, AGR%): “V” Shaped Recovery
Figure 279 Middle East and Africa Liposomal Drug Delivery Devices Market Forecast by Application, 2022-2032 (US$ million, AGR%): “U” Shaped Recovery
Figure 280 Middle East and Africa Liposomal Drug Delivery Devices Market Forecast by Application, 2022-2032 (US$ million, AGR%): “W” Shaped Recovery
Figure 281 Middle East and Africa Liposomal Drug Delivery Devices Market Forecast by Application, 2022-2032 (US$ million, AGR%): “L” Shaped Recovery
Figure 282 Middle East and Africa Liposomal Drug Delivery Devices Market Forecast by End-User, 2022-2032 (US$ million, AGR%)
Figure 283 Middle East and Africa Liposomal Drug Delivery Devices Market Forecast by End-User, 2022-2032 (US$ million, AGR%): “V” Shaped Recovery
Figure 284 Middle East and Africa Liposomal Drug Delivery Devices Market Forecast by End-User, 2022-2032 (US$ million, AGR%): “U” Shaped Recovery
Figure 285 Middle East and Africa Liposomal Drug Delivery Devices Market Forecast by End-User, 2022-2032 (US$ million, AGR%): “W” Shaped Recovery
Figure 286 Middle East and Africa Liposomal Drug Delivery Devices Market Forecast by End-User, 2022-2032 (US$ million, AGR%): “L” Shaped Recovery
Figure 287 GCC Liposomal Drug Delivery Devices Market Forecast, 2022-2032 (US$ million, AGR %)
Figure 288 GCC Liposomal Drug Delivery Devices Market Forecast, 2022-2032 (US$ million, AGR%): “V” Shaped Recovery
Figure 289 GCC Liposomal Drug Delivery Devices Market Forecast, 2022-2032 (US$ million, AGR%): “U” Shaped Recovery
Figure 290 GCC Liposomal Drug Delivery Devices Market Forecast, 2022-2032 (US$ million, AGR%): “W” Shaped Recovery
Figure 291 GCC Liposomal Drug Delivery Devices Market Forecast, 2022-2032 (US$ million, AGR%): “L” Shaped Recovery
Figure 292 South Africa Liposomal Drug Delivery Devices Market Forecast, 2022-2032 (US$ million, AGR %)
Figure 293 South Africa Liposomal Drug Delivery Devices Market Forecast, 2022-2032 (US$ million, AGR%): “V” Shaped Recovery
Figure 294 South Africa Liposomal Drug Delivery Devices Market Forecast, 2022-2032 (US$ million, AGR%): “U” Shaped Recovery
Figure 295 South Africa Liposomal Drug Delivery Devices Market Forecast, 2022-2032 (US$ million, AGR%): “W” Shaped Recovery
Figure 296 South Africa Liposomal Drug Delivery Devices Market Forecast, 2022-2032 (US$ million, AGR%): “L” Shaped Recovery
Figure 297 Rest of Middle East and Africa Liposomal Drug Delivery Devices Market Forecast, 2022-2032 (US$ million, AGR %)
Figure 298 Rest of Middle East and Africa Liposomal Drug Delivery Devices Market Forecast, 2022-2032 (US$ million, AGR%): “V” Shaped Recovery
Figure 299 Rest of Middle East and Africa Liposomal Drug Delivery Devices Market Forecast, 2022-2032 (US$ million, AGR%): “U” Shaped Recovery
Figure 300 Rest of Middle East and Africa Liposomal Drug Delivery Devices Market Forecast, 2022-2032 (US$ million, AGR%): “W” Shaped Recovery
Figure 301 Rest of Middle East and Africa Liposomal Drug Delivery Devices Market Forecast, 2022-2032 (US$ million, AGR%): “L” Shaped Recovery
Figure 302 Takeda Pharmaceutical Company Limited: Net Revenue, 2015-2021 (US$ million, AGR%)
Figure 303 Takeda Pharmaceutical Company Limited: R&D Expenses, 2015-2021 (US$ million, AGR%)
Figure 304 Takeda Pharmaceutical Company Limited: Gross Profit, 2015-2021 (US$ million, AGR%)
Figure 305 Novartis AG: Net Revenue, 2015-2021 (US$ million, AGR%)
Figure 306 Novartis AG: R&D Expenses, 2015-2021 (US$ million, AGR%)
Figure 307 Novartis AG: Gross Profit, 2015-2021 (US$ million, AGR%)
Figure 308 Ipsen Pharma: Net Revenue, 2015-2021 (US$ million, AGR%)
Figure 309 Ipsen Pharma: R&D Expenses, 2015-2021 (US$ million, AGR%)
Figure 310 Ipsen Pharma: Gross Profit, 2015-2021 (US$ million, AGR%)
Figure 311 Astellas Pharma, Inc.: Net Revenue, 2015-2021 (US$ million, AGR%)
Figure 312 Astellas Pharma, Inc.: R&D Expenses, 2015-2021 (US$ million, AGR%)
Figure 313 Astellas Pharma, Inc.: Gross Profit, 2015-2021 (US$ million, AGR%)
Figure 314 Pacira: Net Revenue, 2015-2021 (US$ million, AGR%)
Figure 315 Pacira: R&D Expenses, 2015-2021 (US$ million, AGR%)
Figure 316 Pacira: Gross Profit, 2015-2021 (US$ million, AGR%)
Figure 317 Viatris Inc.: Net Revenue, 2015-2021 (US$ million, AGR%)
Figure 318 Viatris Inc.: R&D Expenses, 2015-2021 (US$ million, AGR%)
Figure 319 Viatris Inc.: Gross Profit, 2015-2021 (US$ million, AGR%)
Figure 320 Global Liposomal Drug Delivery Devices Market Share Forecast by Region 2022, 2027, 2032 (%)
ページTOPに戻る
よくあるご質問
Visiongain社はどのような調査会社ですか?
英国の調査会社ヴィジョンゲイン社(Visiongain)は、通信とエネルギーのほか、自動車や化学・医薬品、金属など、広範な市場を対象に調査を行っています。自動車市場については、市場全般に関する調査のほ... もっと見る
調査レポートの納品までの日数はどの程度ですか?
在庫のあるものは速納となりますが、平均的には 3-4日と見て下さい。
但し、一部の調査レポートでは、発注を受けた段階で内容更新をして納品をする場合もあります。
発注をする前のお問合せをお願いします。
注文の手続きはどのようになっていますか?
1)お客様からの御問い合わせをいただきます。
2)見積書やサンプルの提示をいたします。
3)お客様指定、もしくは弊社の発注書をメール添付にて発送してください。
4)データリソース社からレポート発行元の調査会社へ納品手配します。
5) 調査会社からお客様へ納品されます。最近は、pdfにてのメール納品が大半です。
お支払方法の方法はどのようになっていますか?
納品と同時にデータリソース社よりお客様へ請求書(必要に応じて納品書も)を発送いたします。
お客様よりデータリソース社へ(通常は円払い)の御振り込みをお願いします。
請求書は、納品日の日付で発行しますので、翌月最終営業日までの当社指定口座への振込みをお願いします。振込み手数料は御社負担にてお願いします。
お客様の御支払い条件が60日以上の場合は御相談ください。
尚、初めてのお取引先や個人の場合、前払いをお願いすることもあります。ご了承のほど、お願いします。
データリソース社はどのような会社ですか?
当社は、世界各国の主要調査会社・レポート出版社と提携し、世界各国の市場調査レポートや技術動向レポートなどを日本国内の企業・公官庁及び教育研究機関に提供しております。
世界各国の「市場・技術・法規制などの」実情を調査・収集される時には、データリソース社にご相談ください。
お客様の御要望にあったデータや情報を抽出する為のレポート紹介や調査のアドバイスも致します。
|
|


