農薬市場レポート:2024-2034
Agrochemicals Market Report 2024-2034
レポート詳細
農薬市場レポート 2024-2034 :本レポートは、業界とその根底にあるダイナミクスをよりよく理解したいと望むなら、新たな収益ポケットを目指す大手企業にとって貴重なものとなるであろ... もっと見る
※上記価格は部署ライセンス(Departmental licence)価格です。
その他の価格についてはデータリソースまでお問合せください。
日本語のページは自動翻訳を利用し作成しています。
実際のレポートは英文のみでご納品いたします。

|

|
サマリー
レポート詳細
農薬市場レポート 2024-2034:本レポートは、業界とその根底にあるダイナミクスをよりよく理解したいと望むなら、新たな収益ポケットを目指す大手企業にとって貴重なものとなるであろう。異業種への進出や新地域での既存事業の拡大を希望する企業にも有用です。
世界人口と食糧需要の増加が農薬需要を牽引する
増え続ける世界人口は、農薬市場にとって最も重要な原動力のひとつである。2050年までに世界人口は97億人に達すると予測され、食糧需要が大幅に増加する。この需要を満たすためには、農業生産性を大幅に向上させる必要があり、肥料や殺虫剤などの農薬の使用が必要となる。例えば、インドや中国のように人口が膨大で、なおかつ増え続けている国では、農薬への依存は食料安全保障を達成する上で極めて重要である。このような食料需要の増大は、農家が近代的な農法を採用することを後押しし、作物の収量を高め、病害虫から守るために農薬を多用することも多い。
合成農薬をめぐる厳しい規制と環境問題
欧州連合(EU)は、農薬の使用とリスクの低減を目的とした厳しい新規制を提案し、Farm to Fork戦略で概説された目標の達成に向けた重要な一歩を踏み出した。この規則は、公正で健康的、かつ環境に配慮した食品システムを促進することを目的としている。この提案の中心となるのは、2030年までに化学農薬の使用とリスクを50%削減するという法的拘束力のあるEUレベルの目標であり、より危険な農薬の使用も削減される。加盟国には、指定されたパラメータの範囲内で独自の削減目標を設定し、EU全体の目標を達成するための戦略を策定することが義務付けられている。
EUは、環境にやさしい害虫防除を実施するために、総合的害虫管理(IPM)を義務づける強固な枠組みを導入している。このアプローチは、農家が最後の手段として化学農薬に頼る前に、代替の害虫駆除方法を優先することを求めている。さらに、公共の公園、庭園、運動場、生態学的に脆弱な地帯など、影響を受けやすい場所での農薬使用を全面的に禁止し、これらの区域の周囲に3メートルの緩衝地帯を設けるという規制も盛り込まれている。この移行期間中、農家を支援するため、EUの共通農業政策(CAP)は、5年間、これらの新しい要件を遵守するための費用を負担する。
市場調査レポートを購入する前にすべき質問とは?
-
農薬市場はどのように進化しているのか?
-
何が農薬市場を牽引し、阻害しているのか?
-
農薬サブマーケットの各セグメントは予測期間中にどのように成長し、2034年にはどれくらいの売上を占めるようになるのか?
-
2024年から2034年にかけて、各農薬サブマーケットの市場シェアはどのように推移するのか?
-
2024年から2034年にかけて、市場全体を牽引する主な要因は何か?
-
主要な農薬市場はマクロ経済の動きに幅広く追随するのか、それとも個々の国の市場が他を凌駕するのか。
-
2034年までに各国市場のシェアはどのように変化し、どの地域が2034年の市場をリードするのか。
-
主要プレーヤーと予測期間中の見通しは?
-
これらの大手企業にとっての農薬プロジェクトとは?
-
2024年から2034年の間に、業界はどのように発展するのか?現在および今後10年間に実施される農薬プロジェクトにはどのような意味があるのか?
-
農薬市場をさらに拡大するためには、製品の商業化がより必要なのでしょうか?
-
農薬市場はどこに向かっているのか、そしてどのようにすれば市場の最前線に立てるのか。
-
新商品や新サービスに最適な投資方法とは?
-
企業を新たな成長軌道に乗せ、C-suiteに移行させるための重要な展望とは?
このことが現在、そして今後10年間の農薬市場にどのような影響を与えるかを見極める必要がある:
-
406ページに及ぶレポートには、120の表と212の図表が掲載されている。
-
本レポートでは、業界における主要な有利分野を取り上げているため、今すぐターゲットを絞ることができる。
-
世界、地域、国の売上高と成長に関する詳細な分析が含まれている。
-
競合他社が成功した主なトレンド、変化、収益予測をハイライトします。
2034年までの予測やその他の分析から、商業的な展望が明らかになる
-
2034年までの収益予測に加え、最近の実績、成長率、市場シェアも提供している。
-
ビジネスの展望や展開など、独自の分析が掲載されている。
-
定性的分析(市場ダイナミクス、促進要因、機会、阻害要因、課題を含む)、コスト構造、農薬価格上昇の影響、最近の動向をご覧いただけます。
レポート対象セグメント
製剤
農薬タイプ
肥料タイプ
-
窒素
-
ホスファティック
-
ポタシック
-
その他肥料の種類s
製品タイプ
-
農薬
-
肥料
-
植物成長調節剤
-
土壌コンディショナー
-
その他製品タイプ
作物タイプ
-
穀物・穀類
-
油糧種子と豆類
-
果物と野菜
-
芝と観葉植物
-
綿花とサトウキビ
-
その他作物の種類
世界市場全体とセグメント別の収益予測に加え、5つの地域と20の主要国市場の収益予測も掲載しています:
北米
欧州
-
ドイツ
-
英国
-
フランス
-
ロシア
-
イタリア
-
その他の欧州地域
アジア太平洋
-
中国
-
日本
-
インド
-
オーストラリア
-
東南アジア
-
その他のアジア太平洋地域
ラテンアメリカ
中東
-
サウジアラビア
-
イスラエル
-
トルコ
-
その他の中東地域
アフリカ
-
エジプト
-
南アフリカ
-
ナイジェリア
-
その他のアフリカ地域
また、2024年から2034年までの農薬市場における主要企業のプロファイルも掲載している。
報告書に掲載されている主要企業
-
Adama Ltd,
-
BASF SE
-
Bayer AG
-
Compass Minerals International, Inc.
-
Corteva, Inc.
-
EuroChem Group AG
-
Isagro SpA
-
K+S AG,
-
Nufarm Limited
-
Nutrien Ltd.
-
Sociedad Química y Minera de Chile S.A. (SQM)
-
Sumitomo Chemical Co., Ltd.
-
Syngenta Group
-
UPL Limited.
2024年から2034年までの世界の農薬市場全体の売上高(金額ベース)は、2024年に2,454億米ドルを突破する。2034年まで力強い収益成長を予測。当調査では、最も大きな可能性を秘めた組織を特定しています。彼らの能力、進歩、商業的展望を発見し、一歩先を行くお手伝いをします。
農薬市場、2024-2034年レポートはどのように役立つのか?
要約すると、400ページを超えるこのレポートは、以下の知識を提供する:
-
農薬市場、2024年から2034年までの収益予測 農薬市場、2024年から2034年までの収益予測 製剤、農薬タイプ、肥料タイプ、製品タイプ、作物タイプの各予測を世界レベルと地域レベルで掲載 - 業界の将来性を発見し、投資と収益に最も有利な場所を見つけることができます。
-
5つの地域と25の主要国市場の2034年までの収益予測 - 北米、欧州、アジア太平洋、中南米、中東、アフリカの農薬市場2024年から2034年までの市場予測をご覧ください。また、米国、カナダ、メキシコ、ブラジル、ドイツ、フランス、英国、イタリア、中国、インド、日本、オーストラリアなどの著名経済圏の市場も予測しています。
-
2024年から2034年までの農薬市場に関わる主要企業14社の企業プロファイルを含む。
独自の予測による定量的・定性的分析をご覧ください。私たちのレポートだけに含まれる情報を入手し、貴重なビジネスインテリジェンスで情報を得ることができます。
他にはない情報
私たちの新しいレポートがあれば、知識に遅れをとったり、チャンスを逃したりする可能性が低くなります。Visiongainのレポートが貴社の調査、分析、意思決定にどのように役立つかをご覧ください。Visiongainの調査は、農薬市場、2024年から2034年、市場をリードする企業の商業分析を必要とするすべての人のためのものです。データ、トレンド、予測をご覧いただけます。
ページTOPに戻る
目次
1 レポート概要
1.1 研究の目的
1.2 農薬市場の紹介
1.3 本レポートの内容
1.4 本レポートを読むべき理由
1.5 本分析レポートが回答する主な質問
1.6 本レポートは誰のためのものか?
1.7 方法論
1.7.1 市場の定義
1.7.2 市場評価・予測手法
1.7.3 データの検証
1.7.3.1 一次調査
1.7.3.2 セカンダリーリサーチ
1.8 よくある質問(FAQ)
1.9 Visiongainの関連レポート
1.10 Visiongainについて
2 エグゼクティブ・サマリー
3 市場概要
3.1 主要な調査結果
3.2 市場ダイナミクス
3.3 影響分析
3.3.1 市場促進要因
3.3.1.1 気候パターンの変化が病害虫の発生を増加させ、効果的な農薬の必要性を高める
3.3.1.2 世界人口の増加とそれに伴う農業生産性向上の必要性
3.3.1.3 スマート農業との融合が農薬市場を牽引
3.3.2 市場抑制要因
3.3.2.1 合成農薬に関する厳しい規制と環境への懸念
3.3.2.2 合成農薬に関連する潜在的な健康リスクに対する懸念がその使用を妨げる可能性がある
3.3.3 市場機会
3.3.3.1 政府の農業への取り組みと補助金による市場機会
3.3.3.2 新地域への投資と市場拡大 市場の機会
3.3.3.3 より広範な農薬と関連製品を含む製品提供の多様化はより大きな市場シェアを獲得できる
3.4 サプライチェーン分析
3.5 規制の枠組み
3.6 新興市場とメガトレンド
3.7 ポーターのファイブフォース分析
3.7.1 サプライヤーの交渉力(高い)
3.7.2 買い手の交渉力(中)
3.7.3 競争力(中~高)
3.7.4 代替品の脅威(中)
3.7.5 新規参入企業の脅威(中~高)
3.8 PEST分析
4 農薬市場分析:製剤別
4.1 主要な調査結果
4.2 製剤セグメント 市場魅力度指数
4.3 製剤別農薬市場規模の推定と予測
4.4 液剤
4.4.1 2024〜2034年の地域別市場規模(US$ Billion)
4.4.2 地域別市場シェア、2024年・2034年(%)
4.5 顆粒/粉末
4.5.1 2024〜2034年の地域別市場規模(US$ Billion)
4.5.2 地域別市場シェア、2024年・2034年(%)
5 農薬市場分析:農薬タイプ別
5.1 主要な調査結果
5.2 農薬タイプ別セグメント 市場魅力度指数
5.3 農薬タイプ別農薬市場規模の推定と予測
5.4 除草剤
5.4.1 2024〜2034年の地域別市場規模(US$ Billion)
5.4.2 地域別市場シェア、2024年・2034年(%)
5.5 殺虫剤
5.5.1 2024〜2034年の地域別市場規模(US$ Billion)
5.5.2 地域別市場シェア、2024年・2034年(%)
5.6 殺菌剤
5.6.1 2024〜2034年の地域別市場規模(US$ Billion)
5.6.2 地域別市場シェア、2024年・2034年(%)
6 農薬市場分析:肥料タイプ別
6.1 主要な調査結果
6.2 肥料タイプ別セグメント 市場魅力度指数
6.3 肥料タイプ別農薬市場規模の推定と予測
6.4 窒素系
6.4.1 2024〜2034年の地域別市場規模(US$ Billion)
6.4.2 地域別市場シェア、2024年・2034年(%)
6.5 リン系
6.5.1 2024〜2034年の地域別市場規模(US$ Billion)
6.5.2 地域別市場シェア、2024年・2034年(%)
6.6 ポタシック
6.6.1 2024〜2034年の地域別市場規模(US$ Billion)
6.6.2 地域別市場シェア、2024年・2034年(%)
6.7 その他の肥料タイプ
6.7.1 2024〜2034年の地域別市場規模(US$ Billion)
6.7.2 地域別市場シェア、2024年・2034年(%)
7 農薬市場分析:製品タイプ別
7.1 主要な調査結果
7.2 製品タイプ別セグメント 市場魅力度指数
7.3 製品タイプ別農薬市場規模の推定と予測
7.4 農薬
7.4.1 2024〜2034年の地域別市場規模(US$ Billion)
7.4.2 地域別市場シェア、2024年・2034年(%)
7.5 肥料
7.5.1 2024〜2034年の地域別市場規模(US$ Billion)
7.5.2 地域別市場シェア、2024年・2034年(%)
7.6 植物成長調節剤
7.6.1 2024〜2034年の地域別市場規模(US$ Billion)
7.6.2 地域別市場シェア、2024年・2034年(%)
7.7 土壌改良剤
7.7.1 2024〜2034年の地域別市場規模(US$ Billion)
7.7.2 地域別市場シェア、2024年・2034年(%)
7.8 その他の製品タイプ
7.8.1 2024〜2034年の地域別市場規模(US$ Billion)
7.8.2 地域別市場シェア、2024年・2034年(%)
8 農薬市場分析:作物タイプ別
8.1 主要な調査結果
8.2 作物タイプ別セグメント 市場魅力度指数
8.3 作物タイプ別農薬市場規模の推定と予測
8.4 穀物・穀類
8.4.1 2024〜2034年の地域別市場規模(US$ Billion)
8.4.2 地域別市場シェア、2024年・2034年(%)
8.5 油糧種子と豆類
8.5.1 2024年~2034年の地域別市場規模(US$ Billion)
8.5.2 地域別市場シェア、2024年・2034年(%)
8.6 果物・野菜
8.6.1 2024〜2034年の地域別市場規模(US$ Billion)
8.6.2 地域別市場シェア、2024年・2034年(%)
8.7 芝および観葉植物
8.7.1 2024〜2034年の地域別市場規模(US$ Billion)
8.7.2 地域別市場シェア、2024年・2034年(%)
8.8 綿花とサトウキビ
8.8.1 2024年~2034年の地域別市場規模(US$ Billion)
8.8.2 地域別市場シェア、2024年・2034年(%)
8.9 その他の作物タイプ
8.9.1 2024〜2034年の地域別市場規模(US$ Billion)
8.9.2 地域別市場シェア、2024年・2034年(%)
9 農薬市場分析:地域別
9.1 主要な調査結果
9.2 地域別市場規模の推定と予測
10 北米の農薬市場の分析
10.1 主要な調査結果
10.2 北米の農薬市場魅力度指数
10.3 北米の農薬市場の国別市場規模、2024年、2029年、2034年(US$ Billion)
10.4 北米の農薬市場規模推定と予測:国別
10.5 北米の農薬市場規模推定と予測:製剤別
10.6 北米の農薬市場規模推定と予測:農薬タイプ別
10.7 北米の農薬市場規模推定と予測:肥料タイプ別
10.8 北米の農薬市場規模推定と予測:製品タイプ別
10.9 北米の農薬市場規模推定と予測:作物タイプ別
10.10 アメリカの農薬市場分析
10.11 カナダの農薬市場分析
11 欧州の農薬市場分析
11.1 主要な調査結果
11.2 欧州の農薬市場魅力度指数
11.3 欧州の農薬市場の国別推移、2024年、2029年、2034年(US$ Billion)
11.4 欧州の農薬市場規模推定と予測:国別
11.5 欧州の農薬市場規模推定と予測:製剤別
11.6 欧州の農薬市場規模推定と予測:農薬タイプ別
11.7 欧州の農薬市場規模推定と予測:肥料タイプ別
11.8 欧州の農薬市場規模推定と予測:製品タイプ別
11.9 欧州の農薬市場規模推定と予測:作物タイプ別
11.10 ドイツの農薬市場分析
11.11 イギリスの農薬市場分析
11.12 フランスの農薬市場分析
11.13 イタリアの農薬市場分析
11.14 ロシアの農薬市場分析
11.15 その他の欧州の農薬市場分析
12 アジア太平洋地域の農薬市場分析
12.1 主要な調査結果
12.2 アジア太平洋地域の農薬市場魅力度指数
12.3 アジア太平洋地域の国別農薬市場、2024年、2029年、2034年(US$ Billion)
12.4 アジア太平洋地域の農薬市場規模推定と予測:国別
12.5 アジア太平洋地域の農薬市場規模推定と予測:製剤別
12.6 アジア太平洋地域の農薬市場規模推定と予測:農薬タイプ別
12.7 アジア太平洋地域の農薬市場規模推定と予測:肥料タイプ別
12.8 アジア太平洋地域の農薬市場規模推定と予測:製品タイプ別
12.9 アジア太平洋地域の農薬市場規模推定と予測:作物タイプ別
12.10 中国の農薬市場分析
12.11 インドの農薬市場分析
12.12 日本の農薬市場分析
12.13 東南アジアの農薬市場分析
12.14 オーストラリアの農薬市場分析
12.15 その他のアジア太平洋地域の農薬市場分析
13 中東・アフリカの農薬市場分析
13.1 主要な調査結果
13.2 中東・アフリカの農薬市場魅力度指数
13.3 中東・アフリカの農薬市場の国別市場規模、2024年、2029年、2034年(US$ Billion)
13.4 中東・アフリカの農薬の国別市場規模推定と予測
13.5 中東の農薬市場規模推定と予測:国別
13.6 アフリカの農薬市場規模推定と予測:国別
13.7 中東・アフリカの農薬市場規模推定と予測:製剤別
13.8 中東・アフリカの農薬市場規模推定と予測:農薬タイプ別
13.9 中東・アフリカの農薬市場規模推定と予測:肥料タイプ別
13.10 中東・アフリカの農薬市場規模推定と予測:製品タイプ別
13.11 中東・アフリカの農薬市場規模推定と予測:作物タイプ別
13.12 サウジアラビアの農薬市場分析
13.13 イスラエルの農薬市場分析
13.14 トルコの農薬市場分析
13.15 その他の中東地域の農薬市場分析
13.16 エジプトの農薬市場分析
13.17 南アフリカの農薬市場分析
13.18 ナイジェリアの農薬市場分析
13.19 その他のアフリカの農薬市場
14 ラテンアメリカの農薬市場分析
14.1 主要な調査結果
14.2 ラテンアメリカ農薬市場魅力度指数
14.3 ラテンアメリカの農薬市場(国別、2024年、2029年、2034年)(US$ Billion
14.4 ラテンアメリカの農薬市場規模推定と予測:国別
14.5 ラテンアメリカの農薬市場規模推定と予測:製剤別
14.6 ラテンアメリカの農薬市場規模推定と予測:農薬タイプ別
14.7 ラテンアメリカの農薬市場規模推定と予測:肥料タイプ別
14.8 ラテンアメリカの農薬市場規模推定と予測:製品タイプ別
14.9 ラテンアメリカの農薬市場規模推定と予測:作物タイプ別
14.10 ブラジルの農薬市場分析
14.11 メキシコの農薬市場分析
14.12 その他のラテンアメリカの農薬市場分析
15 会社概要
15.1 競争環境、2023年
15.2 戦略的展望
15.3 Bayer AG
15.3.1 会社概要
15.3.2 会社概要
15.3.3 財務分析
15.3.3.1 純収入(2019-2023年
15.3.3.2 売上高、2019-2023年
15.3.3.3 地域別市場シェア、2023年
15.3.3.4 事業セグメント市場シェア(2023年
15.3.4 製品ベンチマーク
15.3.5 SWOT分析
15.4 BASF SE
15.4.1 会社概要
15.4.2 会社概要
15.4.3 財務分析
15.4.3.1 純収入、2019-2023年
15.4.3.2 売上高、2019-2023年
15.4.3.3 事業セグメント市場シェア、2023年
15.4.4 製品ベンチマーク
15.4.5 戦略的展望
15.4.6 SWOT分析
15.5 Syngenta
15.5.1 会社概要
15.5.2 会社概要
15.5.3 製品ベンチマーク
15.5.4 戦略的展望
15.5.5 SWOT分析
15.6 EuroChem Group AG
15.6.1 会社概要
15.6.2 会社概要
15.6.3 製品ベンチマーク
15.7 Corteva, Inc.
15.7.1 会社概要
15.7.2 会社概要
15.7.3 財務分析
15.7.3.1 純収入、2019-2023年
15.7.3.2 R&D、2019-2023年
15.7.3.3 地域別市場シェア(2023年
15.7.3.4 事業セグメント市場シェア(2023年
15.7.4 製品ベンチマーク
15.8 Compass Minerals International, Inc.
15.8.1 会社概要
15.8.2 会社概要
15.8.3 財務分析
15.8.3.1 純収入、2019-2023年
15.8.3.2 地域別市場シェア、2023年
15.8.3.3 事業セグメント市場シェア(2023年
15.8.4 製品ベンチマーク
15.9 K+S AG
15.9.1 会社概要
15.9.2 会社概要
15.9.3 財務分析
15.9.3.1 純収入、2019-2023年
15.9.3.2 R&D、2019-2023年
15.9.3.3 事業セグメント市場シェア、2023年
15.9.4 製品ベンチマーク
15.10 Sociedad Química y Minera de Chile
15.10.1 会社概要
15.10.2 会社概要
15.10.3 財務分析
15.10.3.1 純収入、2019-2023年
15.10.3.2 地域市場シェア(2023年
15.10.3.3 事業セグメント市場シェア(2023年
15.10.4 製品ベンチマーク
15.10.5 SWOT分析
15.11 Sumitomo Chemical Co., Ltd
15.11.1 会社概要
15.11.2 会社概要
15.11.3 財務分析
15.11.3.1 純収入、2019-2023年
15.11.3.2 売上高、2019-2023年
15.11.4 製品ベンチマーク
15.11.5 戦略的展望
15.12 Adama Ltd,
15.12.1 会社概要
15.12.2 会社概要
15.12.3 財務分析
15.12.3.1 純収入、2019-2023年
15.12.3.2 R&D、2019-2023年
15.12.3.3 地域別市場シェア、2023年
15.12.3.4 事業セグメントの市場シェア(2023年
15.12.4 製品ベンチマーク
15.12.5 戦略的展望
15.13 Nufarm Limited
15.13.1 会社概要
15.13.2 会社概要
15.13.3 財務分析
15.13.3.1 純収入、2019-2023年
15.13.3.2 R&D、2019-2023年
15.13.3.3 地域別市場シェア、2023年
15.13.3.4 事業セグメント市場シェア(2023年
15.13.4 製品ベンチマーク
15.13.5 戦略的展望
15.14 UPL Limited
15.14.1 会社概要
15.14.2 会社概要
15.14.3 財務分析
15.14.3.1 純収入、2019-2023年
15.14.3.2 R&D、2019-2023年
15.14.3.3 地域別市場シェア、2023年
15.14.3.4 事業セグメント市場シェア(2023年
15.14.4 製品ベンチマーク
15.14.5 戦略的展望
15.15 Nutrien Ltd.
15.15.1 会社概要
15.15.2 会社概要
15.15.3 財務分析
15.15.3.1 純収入、2019-2023年
15.15.3.2 事業セグメント市場シェア、2023年
15.15.4 製品ベンチマーク
15.15.5 SWOT分析
15.16 Isagro SpA
15.16.1 会社概要
15.16.2 会社概要
15.16.3 製品ベンチマーク
16 結論と提言
16.1 Visiongainからの結びの言葉
16.2 市場プレイヤーへの提言
ページTOPに戻る
図表リスト
表の一覧
表1 農薬市場のスナップショット、2024年~2034年(10億米ドル、CAGR %)
表2 世界の人口 2020-2024
表3 農薬の製剤別世界市場、2024-2034年(10億米ドル、AGR (%)、CAGR (%)
表4 液剤の地域別市場:2024-2034年(億米ドル、AGR (%)、CAGR (%)
表5 粒状/粉末の地域別市場、2024-2034年 (億米ドル、AGR (%)、CAGR (%))
表6 農薬の種類別世界市場、2024-2034年(億米ドル、AGR (%)、CAGR (%)
表7 除草剤の地域別市場:2024-2034年(億米ドル、AGR (%)、CAGR (%)
表8 殺虫剤地域別市場:2024-2034年(億米ドル、AGR (%)、CAGR (%)
表9 殺菌剤の地域別市場、2024-2034年(億米ドル、AGR (%)、CAGR (%)
表10 農薬の世界市場:肥料タイプ別、2024-2034年(億米ドル、AGR (%)、CAGR (%)
表11 窒素系地域別市場:2024-2034年(億米ドル、AGR (%)、CAGR (%)
表12 リン酸塩の地域別市場:2024-2034年(億米ドル、AGR (%)、CAGR (%)
表13 ポタシックの地域別市場、2024-2034年(億米ドル、AGR (%)、CAGR (%)
表14 その他の肥料タイプ地域別市場、2024-2034年(億米ドル、AGR (%)、CAGR (%)
表15 農薬の世界市場:製品タイプ別、2024-2034年(億米ドル、AGR (%)、CAGR (%)
表16 農薬の地域別市場:2024-2034年(億米ドル、AGR (%)、CAGR (%)
表17 肥料市場:地域別、2024-2034年(億米ドル、AGR (%)、CAGR (%)
表18 植物成長調整剤市場:地域別、2024-2034年(億米ドル、AGR (%)、CAGR (%)
表19 土壌改良剤の地域別市場:2024-2034年(億米ドル、AGR (%)、CAGR (%)
表20 その他の製品タイプ地域別市場、2024-2034年(億米ドル、AGR (%)、CAGR (%)
表21 農薬の世界市場:作物タイプ別、2024-2034年(億米ドル、AGR (%)、CAGR (%)
表22 穀物と穀物の地域別市場:2024-2034年(億米ドル、AGR (%)、CAGR (%)
表23 油糧種子と豆類の地域別市場、2024-2034年(億米ドル、AGR (%)、CAGR (%)
表24 果物・野菜地域別市場:2024-2034年(億米ドル、AGR (%)、CAGR (%)
表25 芝・観葉植物地域別市場:2024-2034年(億米ドル、AGR (%)、CAGR (%)
表26 綿花とサトウキビの地域別市場:2024-2034年(億米ドル、AGR (%)、CAGR (%)
表27 その他の作物タイプ地域別市場:2024-2034年(億米ドル、AGR (%)、CAGR (%)
表28 農薬の世界地域別市場、2024-2034年(億米ドル、AGR (%)、CAGR (%)
表29 北米の農薬市場:国別、2024-2034年 (億米ドル、AGR (%)、CAGR (%))
表30 北米農薬市場:製剤別、2024-2034年(億米ドル、AGR (%)、CAGR (%)
表31 北米農薬市場:農薬タイプ別、2024-2034年(億米ドル、AGR (%)、CAGR (%)
表32 北米農薬市場:肥料タイプ別、2024-2034年(億米ドル、AGR (%)、CAGR (%)
表33 北米農薬市場:製品タイプ別、2024-2034年(億米ドル、AGR (%)、CAGR (%)
表34 北米農薬市場:作物タイプ別、2024-2034年(億米ドル、AGR (%)、CAGR (%)
表35 米国の農薬市場:金額ベース、2024-2034年(億米ドル、AGR (%)、CAGR (%)
表36 カナダの農薬市場:金額ベース、2024-2034年(億米ドル、AGR (%)、CAGR (%)
表37 欧州農薬市場:国別、2024-2034年(億米ドル、AGR (%)、CAGR (%)
表38 欧州の農薬市場:製剤別、2024-2034年(億米ドル、AGR (%)、CAGR (%)
表39 農薬タイプ別欧州農薬市場:2024-2034年(億米ドル、AGR (%)、CAGR (%)
表40 欧州農薬市場:肥料タイプ別、2024-2034年(億米ドル、AGR (%)、CAGR (%)
表41 欧州農薬市場:製品タイプ別、2024-2034年(億米ドル、AGR (%)、CAGR (%)
表42 欧州農薬市場:作物タイプ別、2024-2034年(億米ドル、AGR (%)、CAGR (%)
表43 ドイツ農薬市場:金額ベース、2024-2034年(億米ドル、AGR (%)、CAGR (%)
表44 イギリス農薬市場:金額ベース、2024-2034年(億米ドル、AGR (%)、CAGR (%)
表45 フランス農薬市場:金額ベース、2024-2034年(億米ドル、AGR (%)、CAGR (%)
表46 イタリア農薬市場の金額:2024-2034年(億米ドル、AGR (%)、CAGR (%)
表47 ロシアの農薬市場:2024-2034年(億米ドル、AGR (%)、CAGR (%)
表48 残りのヨーロッパの農薬市場:金額ベース、2024-2034年(億米ドル、AGR (%)、CAGR (%)
表49 アジア太平洋地域の農薬市場:国別、2024-2034年(億米ドル、AGR (%)、CAGR (%)
表50 アジア太平洋地域の農薬市場:製剤別、2024-2034年(億米ドル、AGR (%)、CAGR (%)
表51 アジア太平洋地域の農薬市場:農薬タイプ別、2024-2034年(億米ドル、AGR (%)、CAGR (%)
表52 アジア太平洋地域の農薬市場:肥料タイプ別、2024-2034年(億米ドル、AGR (%)、CAGR (%)
表53 アジア太平洋地域の農薬市場:製品タイプ別、2024-2034年(億米ドル、AGR (%)、CAGR (%)
表54 アジア太平洋地域の農薬市場:作物タイプ別(2024-2034年、10億米ドル、AGR (%)、CAGR (%)
表55 中国の農薬市場:金額ベース、2024-2034年(億米ドル、AGR (%)、CAGR (%)
表56 インド農薬市場:金額ベース、2024-2034年(億米ドル、AGR (%)、CAGR (%)
表57 日本の農薬市場:金額ベース、2024-2034年(億米ドル、AGR (%)、CAGR (%)
表58 東南アジア農薬市場:金額ベース、2024-2034年(億米ドル、AGR (%)、CAGR (%)
表59 オーストラリア農薬市場:2024-2034年(億米ドル、AGR (%)、CAGR (%)
表60 その他のアジア太平洋地域の農薬市場:金額ベース、2024-2034年(億米ドル、AGR (%)、CAGR (%)
表61 中東・アフリカ農薬市場:2024-2034年(億米ドル、AGR (%)、CAGR (%)
表62 中東農薬市場:金額ベース、2024-2034年(億米ドル、AGR (%)、CAGR (%)
表63 アフリカ農薬市場:金額ベース、2024-2034年(億米ドル、AGR (%)、CAGR (%)
表64 中東・アフリカ農薬市場:製剤別、2024-2034年 (億米ドル、AGR (%)、CAGR (%))
表65 中東・アフリカ農薬市場:農薬タイプ別、2024-2034年 (億米ドル、AGR (%)、CAGR (%))
表66 中東・アフリカ農薬市場:肥料タイプ別(2024-2034年:億米ドル、AGR (%)、CAGR (%)
表67 中東・アフリカ農薬市場:製品タイプ別(2024-2034年:億米ドル、AGR (%)、CAGR (%)
表68 中東・アフリカ農薬市場:作物タイプ別(2024-2034年:億米ドル、AGR (%)、CAGR (%)
表69 サウジアラビアの農薬市場:金額ベース、2024-2034年 (億米ドル、AGR (%)、CAGR (%))
表70 イスラエルの農薬市場:金額 2024-2034 (億米ドル、AGR (%)、CAGR (%))
表71 トルコの農薬市場:金額(2024-2034年) (億米ドル、AGR (%)、CAGR (%))
表72 その他の中東農薬市場:金額ベース、2024-2034年(億米ドル、AGR (%)、CAGR (%)
表73 エジプトの農薬市場:2024-2034年(億米ドル、AGR (%)、CAGR (%)
表74 南アフリカの農薬市場:金額ベース、2024-2034年 (億米ドル、AGR (%)、CAGR (%))
表75 ナイジェリアの農薬市場:金額(2024-2034年) (億米ドル、AGR (%)、CAGR (%))
表76 残りのアフリカ農薬市場:金額 2024-2034年 (億米ドル、AGR (%)、CAGR (%))
表77 ラテンアメリカの農薬市場:国別、2024-2034年 (億米ドル、AGR (%)、CAGR (%))
表78 中南米の農薬市場:剤形別(2024-2034年:億米ドル、AGR (%)、CAGR (%)
表79 中南米の農薬市場:農薬タイプ別、2024-2034年 (億米ドル、AGR (%)、CAGR (%))
表80 中南米農薬市場:肥料タイプ別、2024-2034年(億米ドル、AGR (%)、CAGR (%)
表81 ラテンアメリカの農薬市場:製品タイプ別(2024-2034年:億米ドル、AGR (%)、CAGR (%)
表82 ラテンアメリカ農薬市場:作物タイプ別(2024-2034年、10億米ドル、AGR (%)、CAGR (%)
表83 ブラジル農薬市場:金額ベース、2024-2034年(億米ドル、AGR (%)、CAGR (%)
表84 メキシコ農薬市場:金額ベース、2024-2034年(億米ドル、AGR (%)、CAGR (%)
表85 ラテンアメリカの残りの農薬市場:金額ベース、2024-2034年(億米ドル、AGR (%)、CAGR (%)
表86 戦略的展望
表87 バイエルAG:主要詳細(CEO、本社、売上高、設立、従業員数、企業タイプ、ウェブサイト、事業セグメント)
表88 バイエルAG:製品ベンチマーク
表89 BASF SE: 主要企業詳細(CEO, 本社, 売上高, 設立, 従業員数, 企業タイプ, ウェブサイト, 事業セグメント)
表90 BASF SE: 製品ベンチマーク
表91 BASF SE:戦略的展望
表92 シンジェンタ主な詳細(CEO、本社、売上高、設立、従業員数、企業タイプ、ウェブサイト、事業セグメント)
表93 シンジェンタ製品のベンチマーク
表94 シンジェンタ:戦略的展望戦略的展望
表95 ユーロケムグループAG:主な詳細(CEO、本社所在地、売上高、設立、従業員数、企業タイプ、ウェブサイト、事業セグメント)
表96 ユーロケムグループAG:製品ベンチマーク
表97 コルテバ社主な詳細(CEO, 本社, 売上高, 設立, 従業員数, 企業タイプ, ウェブサイト, 事業セグメント)
表98 コルテバ社製品ベンチマーク
表99 Compass Minerals International, Inc:主な詳細(CEO, 本社, 売上高, 設立, 従業員数, 企業タイプ, ウェブサイト, 事業セグメント)
表100 Compass Minerals International, Inc:製品ベンチマーク
表101 K+S AG: 主要詳細(CEO, 本社, 売上高, 設立, 従業員数, 企業タイプ, ウェブサイト, 事業セグメント)
表102 K+S AG: 製品ベンチマーク
表103 チリ鉱山会社(Sociedad Química y Minera de Chile):主な詳細(CEO, 本社, 売上高, 設立, 従業員数, 企業タイプ, ウェブサイト, 事業セグメント)
表 104 ソシエダ・クワイアクテ・マイカ・イ・ミネラ・デ・チレ:主要詳細(CEO、本社、売上高、設立、従業員数、会社タイプ、ウェブサイト、事業セグメント製品ベンチマーク
表105 住友化学株式会社:主要詳細(CEO、本社、売上高、設立、従業員数、企業タイプ、ウェブサイト、事業セグメント)
表106 住友化学:製品ベンチマーク
表 107 住友化学:戦略的展望
表 108 アダマ社:主要詳細(CEO、本社、売上高、設立、従業員数、企業タイプ、ウェブサイト、事業セグメント)
表 109 アダマ社製品ベンチマーク
表110 アダマ社戦略的展望
表111 ヌファーム社主な詳細(CEO, 本社, 売上高, 設立, 従業員数, 企業タイプ, ウェブサイト, 事業セグメント)
表112 Nufarm Limited:製品のベンチマーク
表 113 Nufarm Limited:戦略的展望
表114 UPL Limited, 主要業績(CEO, 本社, 売上高, 設立, 従業員数, 企業タイプ, ウェブサイト, 事業セグメント)
表 115 UPL Limited:製品ベンチマーク
表116 UPL Limited:戦略的展望
表117 Nutrien Ltd.:主要業績(CEO、本社所在地、売上高、設立、従業員数、企業タイプ、ウェブサイト、事業セグメント)
表 118 Nutrien Ltd:製品ベンチマーク
表119 Isagro SpA: 主要詳細(CEO, 本社, 売上高, 設立, 従業員数, 企業タイプ, ウェブサイト, 事業セグメント)
表120 Isagro SpA: 製品ベンチマーク
図の一覧
図1 農薬市場のセグメンテーション
図2 製剤別農薬市場:市場魅力度指数
図3 農薬タイプ別農薬市場:市場魅力度指数市場魅力度指数
図4 肥料タイプ別農薬市場:市場魅力度指数市場魅力度指数
図5 製品タイプ別農薬市場:市場魅力度指数市場魅力度指数
図6 作物タイプ別農薬市場:市場魅力度指数市場魅力度指数
図7 農薬市場:地域別魅力度指数
図8 農薬市場市場ダイナミクス
図9 農薬市場:市場ダイナミクス影響分析
図10 農薬サプライチェーン分析
図11 農薬市場ポーターのファイブフォース分析
図12 農薬市場PEST分析
図13 農薬市場:製剤別:市場魅力度指数
図14 農薬の製剤別世界市場、2024年~2034年(10億米ドル、AGR (%)
図15 農薬の製剤別市場シェア予測(2024年、2029年、2034年)
図 16 液剤の地域別市場規模予測(2024~2034年、10億米ドル、AGR (%)
図 17 地域別液体セグメント市場シェア予測、2024 年& 2034 年(%)
図18 粒状/粉末の地域別市場:2024~2034年(億米ドル、AGR (%)
図 19 2024-2034 年における粒剤/粉末剤セグメントの地域別市場シェア予測 (%)
図 20 農薬タイプ別農薬市場:市場魅力度指数
図 21 農薬タイプ別農薬世界市場:2024 年~2034 年(10 億米ドル、AGR (%)
図 22 農薬タイプ別農薬市場シェア予測(2024 年、2029 年、2034 年) (%)
図23 除草剤の地域別市場予測、2024年~2034年(億米ドル、AGR (%)
図 24 地域別除草剤セグメント市場シェア予測、2024 年& 2034 年(%)
図25 殺虫剤地域別市場:2024〜2034年(10億米ドル、AGR (%)
図 26 殺虫剤セグメントの地域別市場シェア予測、2024 年 & 2034 年 (%)
図27 殺菌剤市場の地域別予測(2024年~2034年、10億米ドル、AGR (%)
図 28 殺菌剤セグメントの地域別市場シェア予測、2024 年 & 2034 年 (%)
図 29 肥料タイプ別農薬市場:市場魅力度指数
図 30 肥料タイプ別農薬世界市場:2024 年~2034 年(10 億米ドル、AGR (%)
図31 肥料タイプ別農薬市場シェア予測:2024年、2029年、2034年(%)
図 32 窒素質市場の地域別市場規模予測(2024~2034 年、10 億米ドル、AGR (%)
図 33 窒素質セグメントの地域別市場シェア予測、2024 年~2034 年(%)
図 34 リン酸塩の地域別市場:2024~2034 年(10 億米ドル、AGR (%)
図 35 リン酸塩セグメントの地域別市場シェア予測、2024 年~2034 年(%)
図 36 ポタシックの地域別市場規模(2024~2034 年、10 億米ドル、AGR (%)
図 37 2024-2034 年の地域別ポタシキセグメント市場シェア予測 (%)
図 38 その他の肥料タイプ地域別市場:2024~2034年(10億米ドル、AGR (%)
図 39 その他の肥料タイプ地域別市場シェア予測、2024 年~2034 年 (%)
図40 製品タイプ別農薬市場:市場魅力度指数
図 41 製品タイプ別農薬世界市場 2024-2034 (億米ドル、AGR (%))
図 42 製品タイプ別農薬市場シェア予測(2024 年、2029 年、2034 年) (%)
図 43 農薬の地域別市場予測(2024~2034 年、10 億米ドル、AGR (%)
図 44 農薬セグメントの地域別市場シェア予測、2024 年& 2034 年(%)
図45 肥料市場の地域別予測(2024~2034年、10億米ドル、AGR (%)
図 46 肥料セグメントの地域別市場シェア予測、2024 年/2034 年(%)
図 47 植物成長調整剤地域別市場:2024-2034 年(億米ドル、AGR (%)
図 48 植物成長調整剤の地域別市場シェア予測、2024 年~2034 年(%)
図 49 2024-2034 年土壌改良剤地域別市場予測(億米ドル、AGR (%)
図 50 ソイルコンディショナー地域別市場シェア予測、2024 年/2034 年 (%)
図 51 その他の製品タイプ地域別市場:2024~2034年(億米ドル、AGR (%)
図 52 その他の製品タイプ地域別市場シェア予測、2024 年~2034 年 (%)
図53 作物タイプ別農薬市場:市場魅力度指数
図 54 世界の農薬市場:作物タイプ別、2024年~2034年(10億米ドル、AGR (%)
図 55 作物タイプ別農薬市場シェア予測(2024年、2029年、2034年) (%)
図 56 穀物と穀物の地域別市場予測(2024~2034年、10億米ドル、AGR (%)
図 57 地域別穀物・穀物セグメント市場シェア予測、2024 年~2034 年(%)
図 58 油糧種子と豆類の地域別市場規模予測(2024~2034年、10億米ドル、AGR (%)
図 59 油糧種子と豆類の地域別市場シェア予測、2024 年~2034 年 (%)
図60 果物・野菜地域別市場規模予測(2024~2034年、10億米ドル、AGR (%)
図 61 果物・野菜セグメントの地域別市場シェア予測、2024 年~2034 年(%)
図62 芝と観葉植物の地域別市場規模予測(2024~2034年、10億米ドル、AGR (%)
図 63 芝と観葉植物の地域別市場シェア予測、2024 年~2034 年 (%)
図 64 綿花とサトウキビの地域別市場規模予測、2024~2034年(億米ドル、AGR (%)
図 65 綿花とサトウキビの地域別市場シェア予測、2024 年~2034 年 (%)
図 66 その他の作物タイプ地域別市場:2024~2034年(10億米ドル、AGR (%)
図 67 その他の作物タイプの地域別市場シェア予測、2024 年~2034 年 (%)
図 68 2024年と2034年の地域別農薬市場予測(売上高、CAGR)
図 69 2024年、2029年、2034年の地域別農薬市場シェア予測(%)
図 70 農薬の世界地域別市場予測(2024年~2034年、10億米ドル、AGR (%)
図 71 北米農薬市場魅力度指数
図72 北米農薬地域別市場(2024年、2029年&2034年)(億米ドル
図73 北米農薬市場の国別推移(2024~2034年、10億米ドル、AGR (%)
図74 北米農薬市場の国別シェア予測、2024年&2034年(%)
図75 北米の農薬市場:製剤別(2024~2034年、10億米ドル、AGR (%)
図 76 北米農薬市場の剤形別シェア予測、2024 年~2034 年 (%)
図77 北米農薬市場:農薬タイプ別、2024年~2034年(億米ドル、AGR (%)
図 78 北米農薬市場:農薬タイプ別シェア予測、2024 年~2034 年 (%)
図 79 北米農薬市場:肥料タイプ別、2024~2034年(億米ドル、AGR (%)
図 80 北米農薬市場:肥料タイプ別シェア予測、2024~2034 年 (%)
図81 北米農薬市場:製品タイプ別、2024年~2034年(億米ドル、AGR (%)
図 82 北米農薬市場の製品タイプ別シェア予測、2024 年~2034 年 (%)
図83 北米農薬市場:作物タイプ別(2024~2034年、10億米ドル、AGR (%)
図 84 北米農薬市場の作物タイプ別シェア予測、2024 年~2034 年 (%)
図 85 米国の農薬市場規模別予測(2024~2034 年)(億米ドル、AGR (%)
図 86 カナダ農薬市場:金額 2024-2034 (US$ Bn, AGR (%))
図 87 欧州農薬市場魅力度指数
図88 欧州農薬市場の地域別市場規模(2024年、2029年、2034年)(億米ドル
図89 欧州農薬市場の国別推移(2024~2034年、10億米ドル、AGR (%)
図 90 欧州農薬市場の国別シェア予測、2024 年~2034 年 (%)
図91 欧州の農薬市場:製剤別(2024~2034年、10億米ドル、AGR (%)
図 92 欧州農薬市場の剤形別シェア予測、2024年~2034年 (%)
図 93 欧州農薬市場:農薬タイプ別、2024~2034年(億米ドル、AGR (%)
図 94 農薬タイプ別欧州農薬市場シェア予測、2024 年~2034 年 (%)
図95 肥料タイプ別欧州農薬市場予測:2024~2034年(億米ドル、AGR (%)
図 96 2024-2034 肥料タイプ別欧州農薬市場シェア予測 (%)
図 97 欧州農薬市場:製品タイプ別予測(2024~2034年、10億米ドル、AGR (%)
図 98 製品タイプ別欧州農薬市場シェア予測、2024年~2034年 (%)
図99 欧州農薬市場:作物タイプ別、2024-2034年(億米ドル、AGR (%)
図 100 作物タイプ別欧州農薬市場シェア予測、2024 年~2034 年 (%)
図101 ドイツ農薬市場:金額ベース、2024-2034年(億米ドル、AGR (%)
図 102 イギリス農薬市場:金額ベース、2024年~2034年(億米ドル、AGR (%)
図 103 フランス農薬市場:金額ベース、2024-2034年(億米ドル、AGR (%)
図 104 イタリア農薬市場の金額:2024-2034年(億米ドル、AGR (%)
図 105 ロシアの農薬市場:金額ベース、2024-2034年 (億米ドル、AGR (%))
図 106 残りのヨーロッパの農薬市場:金額ベース、2024-2034年(億米ドル、AGR (%)
図 107 アジア太平洋地域の農薬市場魅力度指数
図108 アジア太平洋農薬地域別市場(2024年、2029年、2034年)(億米ドル
図109 アジア太平洋地域の農薬市場:国別(2024年~2034年、10億米ドル、AGR (%)
図110 アジア太平洋農薬市場の国別シェア予測、2024年&2034年(%)
図111 アジア太平洋地域の農薬市場:製剤別(2024年~2034年、10億米ドル、AGR (%)
図112 アジア太平洋地域の農薬製剤別市場シェア予測、2024年~2034年 (%)
図113 アジア太平洋地域の農薬市場:農薬タイプ別、2024年~2034年(億米ドル、AGR (%)
図 114 アジア太平洋地域の農薬タイプ別市場シェア予測、2024 年~2034 年 (%)
図115 アジア太平洋地域の農薬市場:肥料タイプ別予測(2024年~2034年、10億米ドル、AGR (%)
図116 アジア太平洋地域の農薬市場:肥料タイプ別シェア予測(2024年~2034年)
図117 アジア太平洋地域の農薬市場:製品タイプ別予測(2024~2034年、10億米ドル、AGR (%)
図 118 アジア太平洋地域の農薬市場:製品タイプ別シェア予測、2024年~2034年 (%)
図119 アジア太平洋地域の農薬市場:作物タイプ別(2024~2034年、10億米ドル、AGR (%)
図 120 アジア太平洋農薬市場作物タイプ別シェア予測、2024 年~2034 年 (%)
図121 中国農薬市場:金額ベース、2024年~2034年(億米ドル、AGR (%)
図 122 インド農薬市場:金額ベース、2024-2034 年(億米ドル、AGR (%)
図 123 日本の農薬市場:金額ベース、2024-2034 年(億米ドル、AGR (%)
図 124 2024-2034 年の東南アジア農薬市場:金額(億米ドル、AGR (%)
図 125 オーストラリア農薬市場:金額ベース、2024-2034 年(億米ドル、AGR (%)
図 126 その他のアジア太平洋地域の農薬市場:金額ベース(2024-2034 年)(億米ドル、AGR (%)
図 127 中東・アフリカ農薬市場魅力度指数
図128 中東・アフリカ農薬地域別市場(2024年、2029年、2034年)(10億米ドル
図 129 中東・アフリカ農薬市場:金額ベース(2024~2034年、10億ドル、AGR (%)
図 130 中東・アフリカ農薬市場の国別シェア予測、2024 年~2034 年 (%)
図 131 中東農薬市場:金額ベース、2024~2034年(10億米ドル、AGR (%)
図 132 中東・アフリカ農薬市場の国別シェア予測、2024 年~2034 年 (%)
図 133 2024-2034 年のアフリカ農薬市場規模別シェア(億米ドル、AGR (%)
図 134 中東・アフリカ農薬市場の国別シェア予測、2024 年~2034 年 (%)
図 135 製剤別中東・アフリカ農薬市場 2024-2034 (億米ドル、AGR (%))
図 136 製剤別中東・アフリカ農薬市場シェア予測、2024~2034 年 (%)
図 137 中東・アフリカ農薬市場:農薬タイプ別、2024~2034年 (億米ドル、AGR (%))
図 138 中東・アフリカ農薬市場:農薬タイプ別シェア予測、2024~2034 年 (%)
図 139 中東・アフリカ農薬市場:肥料タイプ別予測(2024~2034年、10億米ドル、AGR (%)
図 140 2024-2034 年肥料タイプ別中東・アフリカ農薬市場シェア予測 (%)
図141 中東・アフリカ農薬市場:製品タイプ別予測(2024年~2034年、10億米ドル、AGR (%)
図142 中東・アフリカ農薬市場:製品タイプ別シェア予測、2024~2034年 (%)
図 143 中東・アフリカ農薬市場:作物タイプ別予測(2024~2034年、10億米ドル、AGR (%)
図 144 作物タイプ別中東・アフリカ農薬市場シェア予測、2024~2034 年 (%)
図 145 サウジアラビアの農薬市場規模別予測(2024~2034 年:億米ドル、AGR (%)
図 146 イスラエルの農薬市場:金額(億米ドル、AGR (%)
図 147 トルコの農薬市場:金額(2024-2034 年)(億米ドル、AGR (%))
図 148 中東の残りの地域の農薬市場:金額ベース(2024-2034 年)(億米ドル、AGR (%))
図 149 エジプト農薬市場:金額ベース、2024-2034年(億米ドル、AGR (%)
図 150 南アフリカの農薬市場:金額ベース、2024-2034年 (億米ドル、AGR (%))
図 151 ナイジェリア農薬市場の金額:2024-2034年 (億米ドル、AGR (%))
図 152 その他のアフリカの農薬市場:金額ベース、2024-2034年 (億米ドル、AGR (%))
図 153 中南米農薬市場魅力度指数
図154 中南米農薬市場(地域別):2024年、2029年&2034年(10億米ドル
図155 中南米農薬市場の国別推移(2024~2034年、10億米ドル、AGR (%)
図156 中南米農薬市場の国別シェア予測、2024年~2034年(%)
図157 ラテンアメリカの農薬市場:製剤別(2024~2034年、10億米ドル、AGR (%)
図 158 ラテンアメリカの農薬市場:剤形別シェア予測、2024~2034年 (%)
図159 中南米農薬市場:農薬タイプ別、2024~2034年 (億米ドル、AGR (%))
図 160 中南米農薬市場:農薬タイプ別シェア予測、2024~2034 年 (%)
図161 中南米農薬市場:肥料タイプ別、2024~2034年 (億米ドル、AGR (%))
図 162 中南米農薬市場:肥料タイプ別シェア予測、2024年~2034年 (%)
図163 ラテンアメリカの農薬市場:製品タイプ別(2024~2034年、10億米ドル、AGR (%)
図 164 中南米農薬市場の製品タイプ別シェア予測、2024~2034 年 (%)
図165 中南米農薬市場:作物タイプ別(2024~2034年、10億米ドル、AGR (%)
図 166 中南米農薬市場の作物タイプ別シェア予測、2024 年~2034 年 (%)
図 167 ブラジル農薬市場:金額ベース(2024-2034 年)(億米ドル、AGR (%)
図 168 メキシコ農薬市場:金額 2024-2034 (億米ドル、AGR (%))
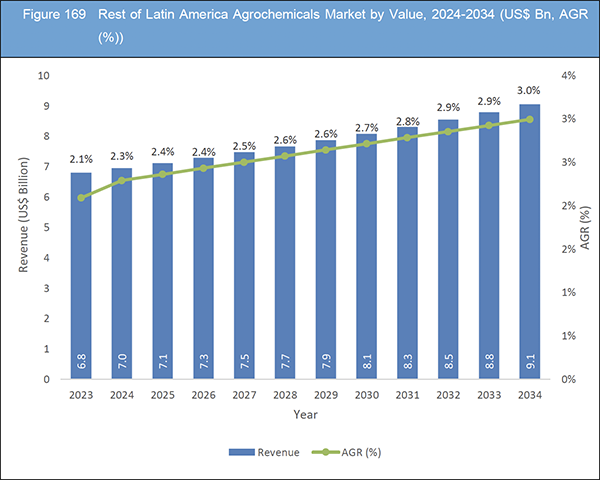
図 169 その他の中南米農薬市場:金額ベース、2024-2034年(億米ドル、AGR (%)
図 170 農薬市場:企業シェア(2023年
図 171 バイエルAG:純収入、2019-2023年(10億米ドル、AGR)
図172 バイエルAG:研究開発費、2019-2023年(10億米ドル、AGR)
図173 バイエルAG:地域別市場シェア(2023年
図174 バイエルAG:事業セグメント別市場シェア(2023年
図 175 バイエル:SWOT 分析
図 176 BASF SE:純収入、2019 年~2023 年(10 億米ドル、AGR)
図 177 BASF SE:研究開発費(億米ドル、AGR)
図 178 BASF SE:事業セグメントの市場シェア(2023 年
図 179 BASF SE:SWOT 分析
図 180 シンジェンタ:SWOT 分析
図 181 Corteva, Inc:純収入、2019 年~2023 年(10 億米ドル、AGR)
図 182 Corteva, Inc:R&D, 2019-2023 (10億米ドル, AGR%)
図 183 Corteva, Inc:地域別市場シェア、2023年
図 184 Corteva, Inc:事業セグメント別市場シェア(2023
図 185 Compass Minerals International, Inc:純収入、2019年~2023年(10億米ドル、AGR)
図 186 Compass Minerals International, Inc:地域別市場シェア、2023年
図 187 コンパスミネラルズ・インターナショナル, Inc:事業セグメント別市場シェア(2023
図 188 K+S AG:純収入、2019年~2023年(10億米ドル、AGR)
図 189 K+S AG:研究開発費、2019年~2023年(10億米ドル、AGR)
図 190 K+S AG:事業セグメントの市場シェア(2023年
図 191 ソシエダ・クアイアクテ・マイカ・イ・ミネラ・デ・チリ:純収入、2019年~2023年(10億米ドル、AGR)
図 192 ソシエダ・クアイアクテ・マイカ・イ・ミネラ・デ・チリ:地域別市場シェア(2023年
図 193 ソシエダ・クアイアクテ・マイカ・イ・ミネラ・デ・チリ:事業セグメント別市場シェア(2023
図 194 ソシエダ・クイアクテ・マイカ・イ・ミネラ・デ・チリ:事業セグメント別市場シェア(2023 年SWOT分析
図195 住友化学:純収入、2019年〜2023年(10億米ドル、AGR)
図 196 住友化学:研究開発費、2019-2023 年(10 億米ドル、AGR)
図 197 アダマ社純収入, 2019-2023 (10億米ドル, AGR%)
図 198 アダマ社R&D, 2019-2023 (10億米ドル, AGR%)
図 199 Adama Ltd,:地域別市場シェア、2023年
図 200 Adama Ltd:事業セグメント別市場シェア、2023年
図 201 ヌファーム社純収入、2019年~2023年(10億米ドル、AGR)
図 202 Nufarm Limited:R&D、2019年~2023年(10億米ドル、AGR)
図 203 ヌファーム社地域別市場シェア(2023年
図 204 ヌファーム社:事業セグメント別市場シェア(2023
図 205 UPL Limited:純収入、2019年~2023年(10億米ドル、AGR)
図 206 UPL Limited:R&D、2019年~2023年(10億米ドル、AGR)
図 207 UPL Limited:地域別市場シェア(2023年
図 208 UPL Limited:事業セグメント別市場シェア(2023年
図 209 Nutrien Ltd.:純収入、2019年~2023年(10億米ドル、AGR)
図 210 Nutrien Ltd.:事業セグメント別市場シェア、2023年
図 211 Nutrien Ltd.:SWOT分析
ページTOPに戻る
Summary
Report Details
The Agrochemicals Market Report 2024-2034: This report will prove invaluable to leading firms striving for new revenue pockets if they wish to better understand the industry and its underlying dynamics. It will be useful for companies that would like to expand into different industries or to expand their existing operations in a new region.
Growing Global Population and Food Demand Driving the Demand for Agrochemicals
The ever-increasing global population is one of the most significant drivers for the agrochemicals market. By 2050, the world’s population is projected to reach 9.7 billion, substantially increasing the demand for food. To meet this demand, agricultural productivity must rise significantly, necessitating the use of agrochemicals such as fertilisers and pesticides. For instance, in countries like India and China, where the population is vast and still growing, the reliance on agrochemicals is crucial to achieving food security. This increased demand for food pushes farmers to adopt modern agricultural practices that often involve the extensive use of agrochemicals to enhance crop yields and protect against pests and diseases.
Stringent Regulations and Environmental Concerns Regarding Synthetic Agrochemicals
The European Union (EU) has proposed stringent new regulations aimed at reducing the use and risk of pesticides, marking a significant step towards achieving the objectives outlined in the Farm to Fork Strategy. These rules are designed to foster a fair, healthy, and environmentally respectful food system. Central to the proposal are legally binding EU-level targets to cut the use and risk of chemical pesticides by 50% by 2030, alongside reducing the use of more hazardous pesticides. Member States are mandated to establish their own reduction targets within specified parameters and develop strategies to collectively achieve the EU-wide goals.
In enforcing environmentally friendly pest control practices, the EU introduces a robust framework mandating Integrated Pest Management (IPM). This approach requires that farmers prioritize alternative pest control methods before resorting to chemical pesticides as a last resort. Additionally, the regulations include a blanket ban on pesticide use in sensitive areas such as public parks, gardens, playgrounds, and ecologically fragile zones, with a buffer zone of 3 meters around these areas. To support farmers during this transition, the EU’s Common Agricultural Policy (CAP) will cover the costs of compliance with these new requirements for a period of 5 years.
What Questions Should You Ask before Buying a Market Research Report?
-
How is the agrochemicals market evolving?
-
What is driving and restraining the agrochemicals market?
-
How will each agrochemicals submarket segment grow over the forecast period and how much revenue will these submarkets account for in 2034?
-
How will the market shares for each agrochemicals submarket develop from 2024 to 2034?
-
What will be the main driver for the overall market from 2024 to 2034?
-
Will leading agrochemicals markets broadly follow the macroeconomic dynamics, or will individual national markets outperform others?
-
How will the market shares of the national markets change by 2034 and which geographical region will lead the market in 2034?
-
Who are the leading players and what are their prospects over the forecast period?
-
What are the agrochemicals projects for these leading companies?
-
How will the industry evolve during the period between 2024 and 2034? What are the implications of agrochemicals projects taking place now and over the next 10 years?
-
Is there a greater need for product commercialisation to further scale the agrochemicals market?
-
Where is the agrochemicals market heading and how can you ensure you are at the forefront of the market?
-
What are the best investment options for new product and service lines?
-
What are the key prospects for moving companies into a new growth path and C-suite?
You need to discover how this will impact the agrochemicals market today, and over the next 10 years:
-
Our 406-page report provides 120 tables and 212 charts/graphs exclusively to you.
-
The report highlights key lucrative areas in the industry so you can target them – NOW.
-
It contains in-depth analysis of global, regional and national sales and growth.
-
It highlights for you the key successful trends, changes and revenue projections made by your competitors.
Forecasts to 2034 and other analyses reveal commercial prospects
-
In addition to revenue forecasting to 2034, our new study provides you with recent results, growth rates, and market shares.
-
You will find original analyses, with business outlooks and developments.
-
Discover qualitative analyses (including market dynamics, drivers, opportunities, restraints and challenges), cost structure, impact of rising agrochemicals prices and recent developments.
Segments Covered in the Report
Formulation
Pesticide Type
-
Herbicides
-
Insecticides
-
Fungicides
Fertilizer Type
-
Nitrogenous
-
Phosphatic
-
Potassic
-
Other Fertilizer Types
Product Type
-
Pesticides
-
Fertilizers
-
Plant Growth Regulators
-
Soil Conditioners
-
Other Product Type
Crop Type
-
Cereals and Grains
-
Oilseeds and Pulses
-
Fruits and Vegetables
-
Turf and Ornamentals
-
Cotton and Sugarcane
-
Other Crop Type
In addition to the revenue predictions for the overall world market and segments, you will also find revenue forecasts for five regional and 20 leading national markets:
North America
Europe
-
Germany
-
UK
-
France
-
Russia
-
Italy
-
Rest of Europe
Asia Pacific
-
China
-
Japan
-
India
-
Australia
-
Southeast Asia
-
Rest of Asia Pacific
Latin America
-
Brazil
-
Mexico
-
Rest of Latin America
Middle East
-
Saudi Arabia
-
Israel
-
Turkey
-
Rest of Middle East
Africa
-
Egypt
-
South Africa
-
Nigeria
-
Rest of Africa
The report also includes profiles and for some of the leading companies in the Agrochemicals Market, 2024 to 2034, with a focus on this segment of these companies’ operations.
Leading companies profiled in the report
-
Adama Ltd,
-
BASF SE
-
Bayer AG
-
Compass Minerals International, Inc.
-
Corteva, Inc.
-
EuroChem Group AG
-
Isagro SpA
-
K+S AG,
-
Nufarm Limited
-
Nutrien Ltd.
-
Sociedad Química y Minera de Chile S.A. (SQM)
-
Sumitomo Chemical Co., Ltd.
-
Syngenta Group
-
UPL Limited.
Overall world revenue for Agrochemicals Market, 2024 to 2034 in terms of value the market will surpass US$245.4 billion in 2024, our work calculates. We predict strong revenue growth through to 2034. Our work identifies which organizations hold the greatest potential. Discover their capabilities, progress, and commercial prospects, helping you stay ahead.
How will the Agrochemicals Market, 2024 to 2034 report help you?
In summary, our 400+ page report provides you with the following knowledge:
-
Revenue forecasts to 2034 for Agrochemicals Market, 2024 to 2034 Market, with forecasts for formulation, pesticide type, fertilizer type, product type, and crop type, each forecast at a global and regional level – discover the industry’s prospects, finding the most lucrative places for investments and revenues.
-
Revenue forecasts to 2034 for five regional and 25 key national markets – See forecasts for the Agrochemicals Market, 2024 to 2034 market in North America, Europe, Asia-Pacific, Latin America, Middle East, and Africa. Also forecasted is the market in the US, Canada, Mexico, Brazil, Germany, France, UK, Italy, China, India, Japan, and Australia among other prominent economies.
-
Prospects for established firms and those seeking to enter the market – including company profiles for 14 of the major companies involved in the Agrochemicals Market, 2024 to 2034.
Find quantitative and qualitative analyses with independent predictions. Receive information that only our report contains, staying informed with invaluable business intelligence.
Information found nowhere else
With our new report, you are less likely to fall behind in knowledge or miss out on opportunities. See how our work could benefit your research, analyses, and decisions. Visiongain’s study is for everybody needing commercial analyses for the Agrochemicals Market, 2024 to 2034, market-leading companies. You will find data, trends and predictions.
ページTOPに戻る
Table of Contents
1 Report Overview
1.1 Objectives of the Study
1.2 Introduction to Agrochemicals Market
1.3 What This Report Delivers
1.4 Why You Should Read This Report
1.5 Key Questions Answered by This Analytical Report
1.6 Who is This Report for?
1.7 Methodology
1.7.1 Market Definitions
1.7.2 Market Evaluation & Forecasting Methodology
1.7.3 Data Validation
1.7.3.1 Primary Research
1.7.3.2 Secondary Research
1.8 Frequently Asked Questions (FAQs)
1.9 Associated Visiongain Reports
1.10 About Visiongain
2 Executive Summary
3 Market Overview
3.1 Key Findings
3.2 Market Dynamics
3.3 Impact Analysis
3.3.1 Market Driving Factors
3.3.1.1 Changes in Climate Patterns Increase the Incidence of Pests and Diseases, Driving the Need for Effective Agrochemicals
3.3.1.2 Increasing Global Population and the Consequent Need for Higher Agricultural Productivity
3.3.1.3 Integration with Smart Farming Driving the Agrochemicals Market
3.3.2 Market Restraining Factors
3.3.2.1 Stringent Regulations and Environmental Concerns Regarding Synthetic Agrochemicals
3.3.2.2 Concerns Over the Potential Health Risks Associated with Synthetic Agrochemicals can Prevent their Use
3.3.3 Market Opportunities
3.3.3.1 Government Initiatives and Subsidies for Agriculture Opportunities for the Market
3.3.3.2 Investment and Expansion of Market in New Geographical Region Opportunities for the Market
3.3.3.3 Diversifying Product Offerings to Include a Wider Range of Agrochemicals and Related Products can Capture a Larger Market Share
3.4 Supply Chain Analysis
3.5 Regulatory Framework
3.6 Emerging Markets and Megatrends
3.7 Porter’s Five Forces Analysis
3.7.1 Bargaining Power of Suppliers (High)
3.7.2 Bargaining Power of Buyers (Medium)
3.7.3 Competitive Rivalry (Medium to High)
3.7.4 Threat of Substitutes (Medium)
3.7.5 Threat of New Entrants (Medium to High)
3.8 PEST Analysis
4 Agrochemicals Market Analysis by Formulation
4.1 Key Findings
4.2 Formulation Segment: Market Attractiveness Index
4.3 Agrochemicals Market Size Estimation and Forecast by Formulation
4.4 Liquid
4.4.1 Market Size by Region, 2024-2034 (US$ Billion)
4.4.2 Market Share by Region, 2024 & 2034 (%)
4.5 Granular/ Powder
4.5.1 Market Size by Region, 2024-2034 (US$ Billion)
4.5.2 Market Share by Region, 2024 & 2034 (%)
5 Agrochemicals Market Analysis by Pesticide Type
5.1 Key Findings
5.2 Pesticide Type Segment: Market Attractiveness Index
5.3 Agrochemicals Market Size Estimation and Forecast by Pesticide Type
5.4 Herbicides
5.4.1 Market Size by Region, 2024-2034 (US$ Billion)
5.4.2 Market Share by Region, 2024 & 2034 (%)
5.5 Insecticides
5.5.1 Market Size by Region, 2024-2034 (US$ Billion)
5.5.2 Market Share by Region, 2024 & 2034 (%)
5.6 Fungicides
5.6.1 Market Size by Region, 2024-2034 (US$ Billion)
5.6.2 Market Share by Region, 2024 & 2034 (%)
6 Agrochemicals Market Analysis by Fertilizer Type
6.1 Key Findings
6.2 Fertilizer Type Segment: Market Attractiveness Index
6.3 Agrochemicals Market Size Estimation and Forecast by Fertilizer Type
6.4 Nitrogenous
6.4.1 Market Size by Region, 2024-2034 (US$ Billion)
6.4.2 Market Share by Region, 2024 & 2034 (%)
6.5 Phosphatic
6.5.1 Market Size by Region, 2024-2034 (US$ Billion)
6.5.2 Market Share by Region, 2024 & 2034 (%)
6.6 Potassic
6.6.1 Market Size by Region, 2024-2034 (US$ Billion)
6.6.2 Market Share by Region, 2024 & 2034 (%)
6.7 Other Fertilizer Types
6.7.1 Market Size by Region, 2024-2034 (US$ Billion)
6.7.2 Market Share by Region, 2024 & 2034 (%)
7 Agrochemicals Market Analysis by Product Type
7.1 Key Findings
7.2 Product Type Segment: Market Attractiveness Index
7.3 Agrochemicals Market Size Estimation and Forecast by Product Type
7.4 Pesticides
7.4.1 Market Size by Region, 2024-2034 (US$ Billion)
7.4.2 Market Share by Region, 2024 & 2034 (%)
7.5 Fertilizers
7.5.1 Market Size by Region, 2024-2034 (US$ Billion)
7.5.2 Market Share by Region, 2024 & 2034 (%)
7.6 Plant Growth Regulators
7.6.1 Market Size by Region, 2024-2034 (US$ Billion)
7.6.2 Market Share by Region, 2024 & 2034 (%)
7.7 Soil Conditioners
7.7.1 Market Size by Region, 2024-2034 (US$ Billion)
7.7.2 Market Share by Region, 2024 & 2034 (%)
7.8 Other Product Type
7.8.1 Market Size by Region, 2024-2034 (US$ Billion)
7.8.2 Market Share by Region, 2024 & 2034 (%)
8 Agrochemicals Market Analysis by Crop Type
8.1 Key Findings
8.2 Crop Type Segment: Market Attractiveness Index
8.3 Agrochemicals Market Size Estimation and Forecast by Crop Type
8.4 Cereals and Grains
8.4.1 Market Size by Region, 2024-2034 (US$ Billion)
8.4.2 Market Share by Region, 2024 & 2034 (%)
8.5 Oilseeds and Pulses
8.5.1 Market Size by Region, 2024-2034 (US$ Billion)
8.5.2 Market Share by Region, 2024 & 2034 (%)
8.6 Fruits and Vegetables
8.6.1 Market Size by Region, 2024-2034 (US$ Billion)
8.6.2 Market Share by Region, 2024 & 2034 (%)
8.7 Turf and Ornamentals
8.7.1 Market Size by Region, 2024-2034 (US$ Billion)
8.7.2 Market Share by Region, 2024 & 2034 (%)
8.8 Cotton and Sugarcane
8.8.1 Market Size by Region, 2024-2034 (US$ Billion)
8.8.2 Market Share by Region, 2024 & 2034 (%)
8.9 Other Crop Type
8.9.1 Market Size by Region, 2024-2034 (US$ Billion)
8.9.2 Market Share by Region, 2024 & 2034 (%)
9 Agrochemicals Market Analysis by Region
9.1 Key Findings
9.2 Regional Market Size Estimation and Forecast
10 North America Agrochemicals Market Analysis
10.1 Key Findings
10.2 North America Agrochemicals Market Attractiveness Index
10.3 North America Agrochemicals Market by Country, 2024, 2029 & 2034 (US$ Billion)
10.4 North America Agrochemicals Market Size Estimation and Forecast by Country
10.5 North America Agrochemicals Market Size Estimation and Forecast by Formulation
10.6 North America Agrochemicals Market Size Estimation and Forecast by Pesticide Type
10.7 North America Agrochemicals Market Size Estimation and Forecast by Fertilizer Type
10.8 North America Agrochemicals Market Size Estimation and Forecast by Product Type
10.9 North America Agrochemicals Market Size Estimation and Forecast by Crop Type
10.10 U.S. Agrochemicals Market Analysis
10.11 Canada Agrochemicals Market Analysis
11 Europe Agrochemicals Market Analysis
11.1 Key Findings
11.2 Europe Agrochemicals Market Attractiveness Index
11.3 Europe Agrochemicals Market by Country, 2024, 2029 & 2034 (US$ Billion)
11.4 Europe Agrochemicals Market Size Estimation and Forecast by Country
11.5 Europe Agrochemicals Market Size Estimation and Forecast by Formulation
11.6 Europe Agrochemicals Market Size Estimation and Forecast by Pesticide Type
11.7 Europe Agrochemicals Market Size Estimation and Forecast by Fertilizer Type
11.8 Europe Agrochemicals Market Size Estimation and Forecast by Product Type
11.9 Europe Agrochemicals Market Size Estimation and Forecast by Crop Type
11.10 Germany Agrochemicals Market Analysis
11.11 UK Agrochemicals Market Analysis
11.12 France Agrochemicals Market Analysis
11.13 Italy Agrochemicals Market Analysis
11.14 Russia Agrochemicals Market Analysis
11.15 Rest of Europe Agrochemicals Market Analysis
12 Asia-Pacific Agrochemicals Market Analysis
12.1 Key Findings
12.2 Asia-Pacific Agrochemicals Market Attractiveness Index
12.3 Asia-Pacific Agrochemicals Market by Country, 2024, 2029 & 2034 (US$ Billion)
12.4 Asia-Pacific Agrochemicals Market Size Estimation and Forecast by Country
12.5 Asia-Pacific Agrochemicals Market Size Estimation and Forecast by Formulation
12.6 Asia-Pacific Agrochemicals Market Size Estimation and Forecast by Pesticide Type
12.7 Asia-Pacific Agrochemicals Market Size Estimation and Forecast by Fertilizer Type
12.8 Asia-Pacific Agrochemicals Market Size Estimation and Forecast by Product Type
12.9 Asia-Pacific Agrochemicals Market Size Estimation and Forecast by Crop Type
12.10 China Agrochemicals Market Analysis
12.11 India Agrochemicals Market Analysis
12.12 Japan Agrochemicals Market Analysis
12.13 Southeast Asia Agrochemicals Market Analysis
12.14 Australia Agrochemicals Market Analysis
12.15 Rest of Asia-Pacific Agrochemicals Market Analysis
13 Middle East and Africa Agrochemicals Market Analysis
13.1 Key Findings
13.2 Middle East and Africa Agrochemicals Market Attractiveness Index
13.3 Middle East and Africa Agrochemicals Market by Country, 2024, 2029 & 2034 (US$ Billion)
13.4 Middle East and Africa Agrochemicals Market Size Estimation and Forecast by Country
13.5 Middle East Agrochemicals Market Size Estimation and Forecast by Country
13.6 Africa Agrochemicals Market Size Estimation and Forecast by Country
13.7 Middle East and Africa Agrochemicals Market Size Estimation and Forecast by Formulation
13.8 Middle East and Africa Agrochemicals Market Size Estimation and Forecast by Pesticide Type
13.9 Middle East and Africa Agrochemicals Market Size Estimation and Forecast by Fertilizer Type
13.10 Middle East and Africa Agrochemicals Market Size Estimation and Forecast by Product Type
13.11 Middle East and Africa Agrochemicals Market Size Estimation and Forecast by Crop Type
13.12 Saudi Arabia Agrochemicals Market Analysis
13.13 Israel Agrochemicals Market Analysis
13.14 Turkey Agrochemicals Market Analysis
13.15 Rest of Middle East Agrochemicals Market Analysis
13.16 Egypt Agrochemicals Market Analysis
13.17 South Africa Agrochemicals Market Analysis
13.18 Nigeria Agrochemicals Market Analysis
13.19 Rest of Africa Agrochemicals Market
14 Latin America Agrochemicals Market Analysis
14.1 Key Findings
14.2 Latin America Agrochemicals Market Attractiveness Index
14.3 Latin America Agrochemicals Market by Country, 2024, 2029 & 2034 (US$ Billion)
14.4 Latin America Agrochemicals Market Size Estimation and Forecast by Country
14.5 Latin America Agrochemicals Market Size Estimation and Forecast by Formulation
14.6 Latin America Agrochemicals Market Size Estimation and Forecast by Pesticide Type
14.7 Latin America Agrochemicals Market Size Estimation and Forecast by Fertilizer Type
14.8 Latin America Agrochemicals Market Size Estimation and Forecast by Product Type
14.9 Latin America Agrochemicals Market Size Estimation and Forecast by Crop Type
14.10 Brazil Agrochemicals Market Analysis
14.11 Mexico Agrochemicals Market Analysis
14.12 Rest of Latin America Agrochemicals Market Analysis
15 Company Profiles
15.1 Competitive Landscape, 2023
15.2 Strategic Outlook
15.3 Bayer AG
15.3.1 Company Snapshot
15.3.2 Company Overview
15.3.3 Financial Analysis
15.3.3.1 Net Revenue, 2019-2023
15.3.3.2 R&D, 2019-2023
15.3.3.3 Regional Market Shares, 2023
15.3.3.4 Business Segment Market Shares, 2023
15.3.4 Product Benchmarking
15.3.5 SWOT Analysis
15.4 BASF SE
15.4.1 Company Snapshot
15.4.2 Company Overview
15.4.3 Financial Analysis
15.4.3.1 Net Revenue, 2019-2023
15.4.3.2 R&D, 2019-2023
15.4.3.3 Business Segment Market Shares, 2023
15.4.4 Product Benchmarking
15.4.5 Strategic Outlook
15.4.6 SWOT Analysis
15.5 Syngenta
15.5.1 Company Snapshot
15.5.2 Company Overview
15.5.3 Product Benchmarking
15.5.4 Strategic Outlook
15.5.5 SWOT Analysis
15.6 EuroChem Group AG
15.6.1 Company Snapshot
15.6.2 Company Overview
15.6.3 Product Benchmarking
15.7 Corteva, Inc.
15.7.1 Company Snapshot
15.7.2 Company Overview
15.7.3 Financial Analysis
15.7.3.1 Net Revenue, 2019-2023
15.7.3.2 R&D, 2019-2023
15.7.3.3 Regional Market Shares, 2023
15.7.3.4 Business Segment Market Shares, 2023
15.7.4 Product Benchmarking
15.8 Compass Minerals International, Inc.
15.8.1 Company Snapshot
15.8.2 Company Overview
15.8.3 Financial Analysis
15.8.3.1 Net Revenue, 2019-2023
15.8.3.2 Regional Market Shares, 2023
15.8.3.3 Business Segment Market Shares, 2023
15.8.4 Product Benchmarking
15.9 K+S AG
15.9.1 Company Snapshot
15.9.2 Company Overview
15.9.3 Financial Analysis
15.9.3.1 Net Revenue, 2019-2023
15.9.3.2 R&D, 2019-2023
15.9.3.3 Business Segment Market Shares, 2023
15.9.4 Product Benchmarking
15.10 Sociedad Química y Minera de Chile
15.10.1 Company Snapshot
15.10.2 Company Overview
15.10.3 Financial Analysis
15.10.3.1 Net Revenue, 2019-2023
15.10.3.2 Regional Market Shares, 2023
15.10.3.3 Business Segment Market Shares, 2023
15.10.4 Product Benchmarking
15.10.5 SWOT Analysis
15.11 Sumitomo Chemical Co., Ltd
15.11.1 Company Snapshot
15.11.2 Company Overview
15.11.3 Financial Analysis
15.11.3.1 Net Revenue, 2019-2023
15.11.3.2 R&D, 2019-2023
15.11.4 Product Benchmarking
15.11.5 Strategic Outlook
15.12 Adama Ltd,
15.12.1 Company Snapshot
15.12.2 Company Overview
15.12.3 Financial Analysis
15.12.3.1 Net Revenue, 2019-2023
15.12.3.2 R&D, 2019-2023
15.12.3.3 Regional Market Shares, 2023
15.12.3.4 Business Segment Market Shares, 2023
15.12.4 Product Benchmarking
15.12.5 Strategic Outlook
15.13 Nufarm Limited
15.13.1 Company Snapshot
15.13.2 Company Overview
15.13.3 Financial Analysis
15.13.3.1 Net Revenue, 2019-2023
15.13.3.2 R&D, 2019-2023
15.13.3.3 Regional Market Shares, 2023
15.13.3.4 Business Segment Market Shares, 2023
15.13.4 Product Benchmarking
15.13.5 Strategic Outlook
15.14 UPL Limited
15.14.1 Company Snapshot
15.14.2 Company Overview
15.14.3 Financial Analysis
15.14.3.1 Net Revenue, 2019-2023
15.14.3.2 R&D, 2019-2023
15.14.3.3 Regional Market Shares, 2023
15.14.3.4 Business Segment Market Shares, 2023
15.14.4 Product Benchmarking
15.14.5 Strategic Outlook
15.15 Nutrien Ltd.
15.15.1 Company Snapshot
15.15.2 Company Overview
15.15.3 Financial Analysis
15.15.3.1 Net Revenue, 2019-2023
15.15.3.2 Business Segment Market Shares, 2023
15.15.4 Product Benchmarking
15.15.5 SWOT Analysis
15.16 Isagro SpA
15.16.1 Company Snapshot
15.16.2 Company Overview
15.16.3 Product Benchmarking
16 Conclusion and Recommendations
16.1 Concluding Remarks from Visiongain
16.2 Recommendations for Market Players
ページTOPに戻る
List of Tables/Graphs
List of Tables
Table 1 Agrochemicals Market Snapshot, 2024 & 2034 (US$ Billion, CAGR %)
Table 2 Global Population 2020-2024
Table 3 Global Agrochemicals Market by Formulation, 2024-2034 (US$ Bn, AGR (%), CAGR (%))
Table 4 Liquid Market by Region, 2024-2034 (US$ Bn, AGR (%), CAGR (%))
Table 5 Granular/ Powder Market by Region, 2024-2034 (US$ Bn, AGR (%), CAGR (%))
Table 6 Global Agrochemicals Market by Pesticide Type, 2024-2034 (US$ Bn, AGR (%), CAGR (%))
Table 7 Herbicides Market by Region, 2024-2034 (US$ Bn, AGR (%), CAGR (%))
Table 8 Insecticides Market by Region, 2024-2034 (US$ Bn, AGR (%), CAGR (%))
Table 9 Fungicides Market by Region, 2024-2034 (US$ Bn, AGR (%), CAGR (%))
Table 10 Global Agrochemicals Market by Fertilizer Type, 2024-2034 (US$ Bn, AGR (%), CAGR (%))
Table 11 Nitrogenous Market by Region, 2024-2034 (US$ Bn, AGR (%), CAGR (%))
Table 12 Phosphatic Market by Region, 2024-2034 (US$ Bn, AGR (%), CAGR (%))
Table 13 Potassic Market by Region, 2024-2034 (US$ Bn, AGR (%), CAGR (%))
Table 14 Other Fertilizer Types Market by Region, 2024-2034 (US$ Bn, AGR (%), CAGR (%))
Table 15 Global Agrochemicals Market by Product Type, 2024-2034 (US$ Bn, AGR (%), CAGR (%))
Table 16 Pesticides Market by Region, 2024-2034 (US$ Bn, AGR (%), CAGR (%))
Table 17 Fertilizers Market by Region, 2024-2034 (US$ Bn, AGR (%), CAGR (%))
Table 18 Plant Growth Regulators Market by Region, 2024-2034 (US$ Bn, AGR (%), CAGR (%))
Table 19 Soil Conditioners Market by Region, 2024-2034 (US$ Bn, AGR (%), CAGR (%))
Table 20 Other Product Type Market by Region, 2024-2034 (US$ Bn, AGR (%), CAGR (%))
Table 21 Global Agrochemicals Market by Crop Type, 2024-2034 (US$ Bn, AGR (%), CAGR (%))
Table 22 Cereals and Grains Market by Region, 2024-2034 (US$ Bn, AGR (%), CAGR (%))
Table 23 Oilseeds and Pulses Market by Region, 2024-2034 (US$ Bn, AGR (%), CAGR (%))
Table 24 Fruits and Vegetables Market by Region, 2024-2034 (US$ Bn, AGR (%), CAGR (%))
Table 25 Turf and Ornamentals Market by Region, 2024-2034 (US$ Bn, AGR (%), CAGR (%))
Table 26 Cotton and Sugarcane Market by Region, 2024-2034 (US$ Bn, AGR (%), CAGR (%))
Table 27 Other Crop Type Market by Region, 2024-2034 (US$ Bn, AGR (%), CAGR (%))
Table 28 Global Agrochemicals Market by Region, 2024-2034 (US$ Bn, AGR (%), CAGR (%))
Table 29 North America Agrochemicals Market by Country, 2024-2034 (US$ Bn, AGR (%), CAGR (%))
Table 30 North America Agrochemicals Market by Formulation, 2024-2034 (US$ Bn, AGR (%), CAGR (%))
Table 31 North America Agrochemicals Market by Pesticide Type, 2024-2034 (US$ Bn, AGR (%), CAGR (%))
Table 32 North America Agrochemicals Market by Fertilizer Type, 2024-2034 (US$ Bn, AGR (%), CAGR (%))
Table 33 North America Agrochemicals Market by Product Type, 2024-2034 (US$ Bn, AGR (%), CAGR (%))
Table 34 North America Agrochemicals Market by Crop Type, 2024-2034 (US$ Bn, AGR (%), CAGR (%))
Table 35 US Agrochemicals Market by Value, 2024-2034 (US$ Bn, AGR (%), CAGR (%))
Table 36 Canada Agrochemicals Market by Value, 2024-2034 (US$ Bn, AGR (%), CAGR (%))
Table 37 Europe Agrochemicals Market by Country, 2024-2034 (US$ Bn, AGR (%), CAGR (%))
Table 38 Europe Agrochemicals Market by Formulation, 2024-2034 (US$ Bn, AGR (%), CAGR (%))
Table 39 Europe Agrochemicals Market by Pesticide Type, 2024-2034 (US$ Bn, AGR (%), CAGR (%))
Table 40 Europe Agrochemicals Market by Fertilizer Type, 2024-2034 (US$ Bn, AGR (%), CAGR (%))
Table 41 Europe Agrochemicals Market by Product Type, 2024-2034 (US$ Bn, AGR (%), CAGR (%))
Table 42 Europe Agrochemicals Market by Crop Type, 2024-2034 (US$ Bn, AGR (%), CAGR (%))
Table 43 Germany Agrochemicals Market by Value, 2024-2034 (US$ Bn, AGR (%), CAGR (%))
Table 44 UK Agrochemicals Market by Value, 2024-2034 (US$ Bn, AGR (%), CAGR (%))
Table 45 France Agrochemicals Market by Value, 2024-2034 (US$ Bn, AGR (%), CAGR (%))
Table 46 Italy Agrochemicals Market by Value, 2024-2034 (US$ Bn, AGR (%), CAGR (%))
Table 47 Russia Agrochemicals Market by Value, 2024-2034 (US$ Bn, AGR (%), CAGR (%))
Table 48 Rest of Europe Agrochemicals Market by Value, 2024-2034 (US$ Bn, AGR (%), CAGR (%))
Table 49 Asia-Pacific Agrochemicals Market by Country, 2024-2034 (US$ Bn, AGR (%), CAGR (%))
Table 50 Asia-Pacific Agrochemicals Market by Formulation, 2024-2034 (US$ Bn, AGR (%), CAGR (%))
Table 51 Asia-Pacific Agrochemicals Market by Pesticide Type, 2024-2034 (US$ Bn, AGR (%), CAGR (%))
Table 52 Asia-Pacific Agrochemicals Market by Fertilizer Type, 2024-2034 (US$ Bn, AGR (%), CAGR (%))
Table 53 Asia-Pacific Agrochemicals Market by Product Type, 2024-2034 (US$ Bn, AGR (%), CAGR (%))
Table 54 Asia-Pacific Agrochemicals Market by Crop Type, 2024-2034 (US$ Bn, AGR (%), CAGR (%))
Table 55 China Agrochemicals Market by Value, 2024-2034 (US$ Bn, AGR (%), CAGR (%))
Table 56 India Agrochemicals Market by Value, 2024-2034 (US$ Bn, AGR (%), CAGR (%))
Table 57 Japan Agrochemicals Market by Value, 2024-2034 (US$ Bn, AGR (%), CAGR (%))
Table 58 Southeast Asia Agrochemicals Market by Value, 2024-2034 (US$ Bn, AGR (%), CAGR (%))
Table 59 Australia Agrochemicals Market by Value, 2024-2034 (US$ Bn, AGR (%), CAGR (%))
Table 60 Rest of Asia-Pacific Agrochemicals Market by Value, 2024-2034 (US$ Bn, AGR (%), CAGR (%))
Table 61 Middle East & Africa Agrochemicals Market by Value, 2024-2034 (US$ Bn, AGR (%), CAGR (%))
Table 62 Middle East Agrochemicals Market by Value, 2024-2034 (US$ Bn, AGR (%), CAGR (%))
Table 63 Africa Agrochemicals Market by Value, 2024-2034 (US$ Bn, AGR (%), CAGR (%))
Table 64 Middle East & Africa Agrochemicals Market by Formulation, 2024-2034 (US$ Bn, AGR (%), CAGR (%))
Table 65 Middle East & Africa Agrochemicals Market by Pesticide Type, 2024-2034 (US$ Bn, AGR (%), CAGR (%))
Table 66 Middle East & Africa Agrochemicals Market by Fertilizer Type, 2024-2034 (US$ Bn, AGR (%), CAGR (%))
Table 67 Middle East & Africa Agrochemicals Market by Product Type, 2024-2034 (US$ Bn, AGR (%), CAGR (%))
Table 68 Middle East & Africa Agrochemicals Market by Crop Type, 2024-2034 (US$ Bn, AGR (%), CAGR (%))
Table 69 Saudi Arabia Agrochemicals Market by Value, 2024-2034 (US$ Bn, AGR (%), CAGR (%))
Table 70 Israel Agrochemicals Market by Value, 2024-2034 (US$ Bn, AGR (%), CAGR (%))
Table 71 Turkey Agrochemicals Market by Value, 2024-2034 (US$ Bn, AGR (%), CAGR (%))
Table 72 Rest of Middle East Agrochemicals Market by Value, 2024-2034 (US$ Bn, AGR (%), CAGR (%))
Table 73 Egypt Agrochemicals Market by Value, 2024-2034 (US$ Bn, AGR (%), CAGR (%))
Table 74 South Africa Agrochemicals Market by Value, 2024-2034 (US$ Bn, AGR (%), CAGR (%))
Table 75 Nigeria Agrochemicals Market by Value, 2024-2034 (US$ Bn, AGR (%), CAGR (%))
Table 76 Rest of Africa Agrochemicals Market by Value, 2024-2034 (US$ Bn, AGR (%), CAGR (%))
Table 77 Latin America Agrochemicals Market by Country, 2024-2034 (US$ Bn, AGR (%), CAGR (%))
Table 78 Latin America Agrochemicals Market by Formulation, 2024-2034 (US$ Bn, AGR (%), CAGR (%))
Table 79 Latin America Agrochemicals Market by Pesticide Type, 2024-2034 (US$ Bn, AGR (%), CAGR (%))
Table 80 Latin America Agrochemicals Market by Fertilizer Type, 2024-2034 (US$ Bn, AGR (%), CAGR (%))
Table 81 Latin America Agrochemicals Market by Product Type, 2024-2034 (US$ Bn, AGR (%), CAGR (%))
Table 82 Latin America Agrochemicals Market by Crop Type, 2024-2034 (US$ Bn, AGR (%), CAGR (%))
Table 83 Brazil Agrochemicals Market by Value, 2024-2034 (US$ Bn, AGR (%), CAGR (%))
Table 84 Mexico Agrochemicals Market by Value, 2024-2034 (US$ Bn, AGR (%), CAGR (%))
Table 85 Rest of Latin America Agrochemicals Market by Value, 2024-2034 (US$ Bn, AGR (%), CAGR (%))
Table 86 Strategic Outlook
Table 87 Bayer AG: Key Details, (CEO, HQ, Revenue, Founded, No. of Employees, Company Type, Website, Business Segment)
Table 88 Bayer AG: Product Benchmarking
Table 89 BASF SE: Key Details, (CEO, HQ, Revenue, Founded, No. of Employees, Company Type, Website, Business Segment)
Table 90 BASF SE: Product Benchmarking
Table 91 BASF SE: Strategic Outlook
Table 92 Syngenta: Key Details, (CEO, HQ, Revenue, Founded, No. of Employees, Company Type, Website, Business Segment)
Table 93 Syngenta: Product Benchmarking
Table 94 Syngenta: Strategic Outlook
Table 95 EuroChem Group AG: Key Details, (CEO, HQ, Revenue, Founded, No. of Employees, Company Type, Website, Business Segment)
Table 96 EuroChem Group AG: Product Benchmarking
Table 97 Corteva, Inc: Key Details, (CEO, HQ, Revenue, Founded, No. of Employees, Company Type, Website, Business Segment)
Table 98 Corteva, Inc: Product Benchmarking
Table 99 Compass Minerals International, Inc: Key Details, (CEO, HQ, Revenue, Founded, No. of Employees, Company Type, Website, Business Segment)
Table 100 Compass Minerals International, Inc: Product Benchmarking
Table 101 K+S AG: Key Details, (CEO, HQ, Revenue, Founded, No. of Employees, Company Type, Website, Business Segment)
Table 102 K+S AG: Product Benchmarking
Table 103 Sociedad Química y Minera de Chile: Key Details, (CEO, HQ, Revenue, Founded, No. of Employees, Company Type, Website, Business Segment)
Table 104 Sociedad Química y Minera de Chile: Product Benchmarking
Table 105 Sumitomo Chemical Co., Ltd: Key Details, (CEO, HQ, Revenue, Founded, No. of Employees, Company Type, Website, Business Segment)
Table 106 Sumitomo Chemical Co., Ltd: Product Benchmarking
Table 107 Sumitomo Chemical Co., Ltd: Strategic Outlook
Table 108 Adama Ltd, Key Details, (CEO, HQ, Revenue, Founded, No. of Employees, Company Type, Website, Business Segment)
Table 109 Adama Ltd,: Product Benchmarking
Table 110 Adama Ltd,: Strategic Outlook
Table 111 Nufarm Limited: Key Details, (CEO, HQ, Revenue, Founded, No. of Employees, Company Type, Website, Business Segment)
Table 112 Nufarm Limited: Product Benchmarking
Table 113 Nufarm Limited: Strategic Outlook
Table 114 UPL Limited, Key Details, (CEO, HQ, Revenue, Founded, No. of Employees, Company Type, Website, Business Segment)
Table 115 UPL Limited: Product Benchmarking
Table 116 UPL Limited: Strategic Outlook
Table 117 Nutrien Ltd.: Key Details, (CEO, HQ, Revenue, Founded, No. of Employees, Company Type, Website, Business Segment)
Table 118 Nutrien Ltd.: Product Benchmarking
Table 119 Isagro SpA: Key Details, (CEO, HQ, Revenue, Founded, No. of Employees, Company Type, Website, Business Segment)
Table 120 Isagro SpA: Product Benchmarking
List of Figures
Figure 1 Agrochemicals Market Segmentation
Figure 2 Agrochemicals Market by Formulation: Market Attractiveness Index
Figure 3 Agrochemicals Market by Pesticide Type: Market Attractiveness Index
Figure 4 Agrochemicals Market by Fertilizer Type: Market Attractiveness Index
Figure 5 Agrochemicals Market by Product Type: Market Attractiveness Index
Figure 6 Agrochemicals Market by Crop Type: Market Attractiveness Index
Figure 7 Agrochemicals Market Attractiveness Index by Region
Figure 8 Agrochemicals Market: Market Dynamics
Figure 9 Agrochemicals Market: Impact Analysis
Figure 10 Agrochemicals: Supply Chain Analysis
Figure 11 Agrochemicals Market: Porter’s Five Forces Analysis
Figure 12 Agrochemicals Market: PEST Analysis
Figure 13 Agrochemicals Market by Formulation: Market Attractiveness Index
Figure 14 Global Agrochemicals Market by Formulation, 2024-2034 (US$ Bn, AGR (%))
Figure 15 Agrochemicals Market Share Forecast by Formulation, 2024, 2029, 2034 (%)
Figure 16 Liquid Market by Region, 2024-2034 (US$ Bn, AGR (%))
Figure 17 Liquid Segment Market Share Forecast by Region, 2024 & 2034 (%)
Figure 18 Granular/ Powder Market by Region, 2024-2034 (US$ Bn, AGR (%))
Figure 19 Granular/ Powder Segment Market Share Forecast by Region, 2024 & 2034 (%)
Figure 20 Agrochemicals Market by Pesticide Type: Market Attractiveness Index
Figure 21 Global Agrochemicals Market by Pesticide Type, 2024-2034 (US$ Bn, AGR (%))
Figure 22 Agrochemicals Market Share Forecast by Pesticide Type, 2024, 2029, 2034 (%)
Figure 23 Herbicides Market by Region, 2024-2034 (US$ Bn, AGR (%))
Figure 24 Herbicides Segment Market Share Forecast by Region, 2024 & 2034 (%)
Figure 25 Insecticides Market by Region, 2024-2034 (US$ Bn, AGR (%))
Figure 26 Insecticides Segment Market Share Forecast by Region, 2024 & 2034 (%)
Figure 27 Fungicides Market by Region, 2024-2034 (US$ Bn, AGR (%))
Figure 28 Fungicides Segment Market Share Forecast by Region, 2024 & 2034 (%)
Figure 29 Agrochemicals Market by Fertilizer Type: Market Attractiveness Index
Figure 30 Global Agrochemicals Market by Fertilizer Type, 2024-2034 (US$ Bn, AGR (%))
Figure 31 Agrochemicals Market Share Forecast by Fertilizer Type, 2024, 2029, 2034 (%)
Figure 32 Nitrogenous Market by Region, 2024-2034 (US$ Bn, AGR (%))
Figure 33 Nitrogenous Segment Market Share Forecast by Region, 2024 & 2034 (%)
Figure 34 Phosphatic Market by Region, 2024-2034 (US$ Bn, AGR (%))
Figure 35 Phosphatic Segment Market Share Forecast by Region, 2024 & 2034 (%)
Figure 36 Potassic Market by Region, 2024-2034 (US$ Bn, AGR (%))
Figure 37 Potassic Segment Market Share Forecast by Region, 2024 & 2034 (%)
Figure 38 Other Fertilizer Types Market by Region, 2024-2034 (US$ Bn, AGR (%))
Figure 39 Other Fertilizer Types Segment Market Share Forecast by Region, 2024 & 2034 (%)
Figure 40 Agrochemicals Market by Product Type: Market Attractiveness Index
Figure 41 Global Agrochemicals Market by Product Type, 2024-2034 (US$ Bn, AGR (%))
Figure 42 Agrochemicals Market Share Forecast by Product Type, 2024, 2029, 2034 (%)
Figure 43 Pesticides Market by Region, 2024-2034 (US$ Bn, AGR (%))
Figure 44 Pesticides Segment Market Share Forecast by Region, 2024 & 2034 (%)
Figure 45 Fertilizers Market by Region, 2024-2034 (US$ Bn, AGR (%))
Figure 46 Fertilizers Segment Market Share Forecast by Region, 2024 & 2034 (%)
Figure 47 Plant Growth Regulators Market by Region, 2024-2034 (US$ Bn, AGR (%))
Figure 48 Plant Growth Regulators Segment Market Share Forecast by Region, 2024 & 2034 (%)
Figure 49 Soil Conditioners Market by Region, 2024-2034 (US$ Bn, AGR (%))
Figure 50 Soil Conditioners Segment Market Share Forecast by Region, 2024 & 2034 (%)
Figure 51 Other Product Type Market by Region, 2024-2034 (US$ Bn, AGR (%))
Figure 52 Other Product Type Segment Market Share Forecast by Region, 2024 & 2034 (%)
Figure 53 Agrochemicals Market by Crop Type: Market Attractiveness Index
Figure 54 Global Agrochemicals Market by Crop Type, 2024-2034 (US$ Bn, AGR (%))
Figure 55 Agrochemicals Market Share Forecast by Crop Type, 2024, 2029, 2034 (%)
Figure 56 Cereals and Grains Market by Region, 2024-2034 (US$ Bn, AGR (%))
Figure 57 Cereals and Grains Segment Market Share Forecast by Region, 2024 & 2034 (%)
Figure 58 Oilseeds and Pulses Market by Region, 2024-2034 (US$ Bn, AGR (%))
Figure 59 Oilseeds and Pulses Segment Market Share Forecast by Region, 2024 & 2034 (%)
Figure 60 Fruits and Vegetables Market by Region, 2024-2034 (US$ Bn, AGR (%))
Figure 61 Fruits and Vegetables Segment Market Share Forecast by Region, 2024 & 2034 (%)
Figure 62 Turf and Ornamentals Market by Region, 2024-2034 (US$ Bn, AGR (%))
Figure 63 Turf and Ornamentals Segment Market Share Forecast by Region, 2024 & 2034 (%)
Figure 64 Cotton and Sugarcane Market by Region, 2024-2034 (US$ Bn, AGR (%))
Figure 65 Cotton and Sugarcane Segment Market Share Forecast by Region, 2024 & 2034 (%)
Figure 66 Other Crop Type Market by Region, 2024-2034 (US$ Bn, AGR (%))
Figure 67 Other Crop Type Segment Market Share Forecast by Region, 2024 & 2034 (%)
Figure 68 Agrochemicals Market Forecast by Region 2024 and 2034 (Revenue, CAGR%)
Figure 69 Agrochemicals Market Share Forecast by Region 2024, 2029, 2034 (%)
Figure 70 Global Agrochemicals Market by Region, 2024-2034 (US$ Bn, AGR (%))
Figure 71 North America Agrochemicals Market Attractiveness Index
Figure 72 North America Agrochemicals Market by Region, 2024, 2029 & 2034 (US$ Billion)
Figure 73 North America Agrochemicals Market by Country, 2024-2034 (US$ Bn, AGR (%))
Figure 74 North America Agrochemicals Market Share Forecast by Country, 2024 & 2034 (%)
Figure 75 North America Agrochemicals Market by Formulation, 2024-2034 (US$ Bn, AGR (%))
Figure 76 North America Agrochemicals Market Share Forecast by Formulation, 2024 & 2034 (%)
Figure 77 North America Agrochemicals Market by Pesticide Type, 2024-2034 (US$ Bn, AGR (%))
Figure 78 North America Agrochemicals Market Share Forecast by Pesticide Type, 2024 & 2034 (%)
Figure 79 North America Agrochemicals Market by Fertilizer Type, 2024-2034 (US$ Bn, AGR (%))
Figure 80 North America Agrochemicals Market Share Forecast by Fertilizer Type, 2024 & 2034 (%)
Figure 81 North America Agrochemicals Market by Product Type, 2024-2034 (US$ Bn, AGR (%))
Figure 82 North America Agrochemicals Market Share Forecast by Product Type, 2024 & 2034 (%)
Figure 83 North America Agrochemicals Market by Crop Type, 2024-2034 (US$ Bn, AGR (%))
Figure 84 North America Agrochemicals Market Share Forecast by Crop Type, 2024 & 2034 (%)
Figure 85 US Agrochemicals Market by Value, 2024-2034 (US$ Bn, AGR (%))
Figure 86 Canada Agrochemicals Market by Value, 2024-2034 (US$ Bn, AGR (%))
Figure 87 Europe Agrochemicals Market Attractiveness Index
Figure 88 Europe Agrochemicals Market by Region, 2024, 2029 & 2034 (US$ Billion)
Figure 89 Europe Agrochemicals Market by Country, 2024-2034 (US$ Bn, AGR (%))
Figure 90 Europe Agrochemicals Market Share Forecast by Country, 2024 & 2034 (%)
Figure 91 Europe Agrochemicals Market by Formulation, 2024-2034 (US$ Bn, AGR (%))
Figure 92 Europe Agrochemicals Market Share Forecast by Formulation, 2024 & 2034 (%)
Figure 93 Europe Agrochemicals Market by Pesticide Type, 2024-2034 (US$ Bn, AGR (%))
Figure 94 Europe Agrochemicals Market Share Forecast by Pesticide Type, 2024 & 2034 (%)
Figure 95 Europe Agrochemicals Market by Fertilizer Type, 2024-2034 (US$ Bn, AGR (%))
Figure 96 Europe Agrochemicals Market Share Forecast by Fertilizer Type, 2024 & 2034 (%)
Figure 97 Europe Agrochemicals Market by Product Type, 2024-2034 (US$ Bn, AGR (%))
Figure 98 Europe Agrochemicals Market Share Forecast by Product Type, 2024 & 2034 (%)
Figure 99 Europe Agrochemicals Market by Crop Type, 2024-2034 (US$ Bn, AGR (%))
Figure 100 Europe Agrochemicals Market Share Forecast by Crop Type, 2024 & 2034 (%)
Figure 101 Germany Agrochemicals Market by Value, 2024-2034 (US$ Bn, AGR (%))
Figure 102 UK Agrochemicals Market by Value, 2024-2034 (US$ Bn, AGR (%))
Figure 103 France Agrochemicals Market by Value, 2024-2034 (US$ Bn, AGR (%))
Figure 104 Italy Agrochemicals Market by Value, 2024-2034 (US$ Bn, AGR (%))
Figure 105 Russia Agrochemicals Market by Value, 2024-2034 (US$ Bn, AGR (%))
Figure 106 Rest of Europe Agrochemicals Market by Value, 2024-2034 (US$ Bn, AGR (%))
Figure 107 Asia-Pacific Agrochemicals Market Attractiveness Index
Figure 108 Asia-Pacific Agrochemicals Market by Region, 2024, 2029 & 2034 (US$ Billion)
Figure 109 Asia-Pacific Agrochemicals Market by Country, 2024-2034 (US$ Bn, AGR (%))
Figure 110 Asia-Pacific Agrochemicals Market Share Forecast by Country, 2024 & 2034 (%)
Figure 111 Asia-Pacific Agrochemicals Market by Formulation, 2024-2034 (US$ Bn, AGR (%))
Figure 112 Asia-Pacific Agrochemicals Market Share Forecast by Formulation, 2024 & 2034 (%)
Figure 113 Asia-Pacific Agrochemicals Market by Pesticide Type, 2024-2034 (US$ Bn, AGR (%))
Figure 114 Asia-Pacific Agrochemicals Market Share Forecast by Pesticide Type, 2024 & 2034 (%)
Figure 115 Asia-Pacific Agrochemicals Market by Fertilizer Type, 2024-2034 (US$ Bn, AGR (%))
Figure 116 Asia-Pacific Agrochemicals Market Share Forecast by Fertilizer Type, 2024 & 2034 (%)
Figure 117 Asia-Pacific Agrochemicals Market by Product Type, 2024-2034 (US$ Bn, AGR (%))
Figure 118 Asia-Pacific Agrochemicals Market Share Forecast by Product Type, 2024 & 2034 (%)
Figure 119 Asia-Pacific Agrochemicals Market by Crop Type, 2024-2034 (US$ Bn, AGR (%))
Figure 120 Asia-Pacific Agrochemicals Market Share Forecast by Crop Type, 2024 & 2034 (%)
Figure 121 China Agrochemicals Market by Value, 2024-2034 (US$ Bn, AGR (%))
Figure 122 India Agrochemicals Market by Value, 2024-2034 (US$ Bn, AGR (%))
Figure 123 Japan Agrochemicals Market by Value, 2024-2034 (US$ Bn, AGR (%))
Figure 124 Southeast Asia Agrochemicals Market by Value, 2024-2034 (US$ Bn, AGR (%))
Figure 125 Australia Agrochemicals Market by Value, 2024-2034 (US$ Bn, AGR (%))
Figure 126 Rest of Asia-Pacific Agrochemicals Market by Value, 2024-2034 (US$ Bn, AGR (%))
Figure 127 Middle East and Africa Agrochemicals Market Attractiveness Index
Figure 128 Middle East and Africa Agrochemicals Market by Region, 2024, 2029 & 2034 (US$ Billion)
Figure 129 Middle East & Africa Agrochemicals Market by Value, 2024-2034 (US$ Bn, AGR (%))
Figure 130 Middle East and Africa Agrochemicals Market Share Forecast by Country, 2024 & 2034 (%)
Figure 131 Middle East Agrochemicals Market by Value, 2024-2034 (US$ Bn, AGR (%))
Figure 132 Middle East and Africa Agrochemicals Market Share Forecast by Country, 2024 & 2034 (%)
Figure 133 Africa Agrochemicals Market by Value, 2024-2034 (US$ Bn, AGR (%))
Figure 134 Middle East and Africa Agrochemicals Market Share Forecast by Country, 2024 & 2034 (%)
Figure 135 Middle East & Africa Agrochemicals Market by Formulation, 2024-2034 (US$ Bn, AGR (%))
Figure 136 Middle East and Africa Agrochemicals Market Share Forecast by Formulation, 2024 & 2034 (%)
Figure 137 Middle East & Africa Agrochemicals Market by Pesticide Type, 2024-2034 (US$ Bn, AGR (%))
Figure 138 Middle East and Africa Agrochemicals Market Share Forecast by Pesticide Type, 2024 & 2034 (%)
Figure 139 Middle East & Africa Agrochemicals Market by Fertilizer Type, 2024-2034 (US$ Bn, AGR (%))
Figure 140 Middle East and Africa Agrochemicals Market Share Forecast by Fertilizer Type, 2024 & 2034 (%)
Figure 141 Middle East & Africa Agrochemicals Market by Product Type, 2024-2034 (US$ Bn, AGR (%))
Figure 142 Middle East and Africa Agrochemicals Market Share Forecast by Product Type, 2024 & 2034 (%)
Figure 143 Middle East & Africa Agrochemicals Market by Crop Type, 2024-2034 (US$ Bn, AGR (%))
Figure 144 Middle East and Africa Agrochemicals Market Share Forecast by Crop Type, 2024 & 2034 (%)
Figure 145 Saudi Arabia Agrochemicals Market by Value, 2024-2034 (US$ Bn, AGR (%))
Figure 146 Israel Agrochemicals Market by Value, 2024-2034 (US$ Bn, AGR (%))
Figure 147 Turkey Agrochemicals Market by Value, 2024-2034 (US$ Bn, AGR (%))
Figure 148 Rest of Middle East Agrochemicals Market by Value, 2024-2034 (US$ Bn, AGR (%))
Figure 149 Egypt Agrochemicals Market by Value, 2024-2034 (US$ Bn, AGR (%))
Figure 150 South Africa Agrochemicals Market by Value, 2024-2034 (US$ Bn, AGR (%))
Figure 151 Nigeria Agrochemicals Market by Value, 2024-2034 (US$ Bn, AGR (%))
Figure 152 Rest of Africa Agrochemicals Market by Value, 2024-2034 (US$ Bn, AGR (%))
Figure 153 Latin America Agrochemicals Market Attractiveness Index
Figure 154 Latin America Agrochemicals Market by Region, 2024, 2029 & 2034 (US$ Billion)
Figure 155 Latin America Agrochemicals Market by Country, 2024-2034 (US$ Bn, AGR (%))
Figure 156 Latin America Agrochemicals Market Share Forecast by Country, 2024 & 2034 (%)
Figure 157 Latin America Agrochemicals Market by Formulation, 2024-2034 (US$ Bn, AGR (%))
Figure 158 Latin America Agrochemicals Market Share Forecast by Formulation, 2024 & 2034 (%)
Figure 159 Latin America Agrochemicals Market by Pesticide Type, 2024-2034 (US$ Bn, AGR (%))
Figure 160 Latin America Agrochemicals Market Share Forecast by Pesticide Type, 2024 & 2034 (%)
Figure 161 Latin America Agrochemicals Market by Fertilizer Type, 2024-2034 (US$ Bn, AGR (%))
Figure 162 Latin America Agrochemicals Market Share Forecast by Fertilizer Type, 2024 & 2034 (%)
Figure 163 Latin America Agrochemicals Market by Product Type, 2024-2034 (US$ Bn, AGR (%))
Figure 164 Latin America Agrochemicals Market Share Forecast by Product Type, 2024 & 2034 (%)
Figure 165 Latin America Agrochemicals Market by Crop Type, 2024-2034 (US$ Bn, AGR (%))
Figure 166 Latin America Agrochemicals Market Share Forecast by Crop Type, 2024 & 2034 (%)
Figure 167 Brazil Agrochemicals Market by Value, 2024-2034 (US$ Bn, AGR (%))
Figure 168 Mexico Agrochemicals Market by Value, 2024-2034 (US$ Bn, AGR (%))
Figure 169 Rest of Latin America Agrochemicals Market by Value, 2024-2034 (US$ Bn, AGR (%))
Figure 170 Agrochemicals Market: Company Share, 2023
Figure 171 Bayer AG: Net Revenue, 2019-2023 (US$ Billion, AGR%)
Figure 172 Bayer AG: R&D, 2019-2023 (US$ Billion, AGR%)
Figure 173 Bayer AG: Regional Market Shares, 2023
Figure 174 Bayer AG: Business Segment Market Shares, 2023
Figure 175 Bayer AG: SWOT Analysis
Figure 176 BASF SE: Net Revenue, 2019-2023 (US$ Billion, AGR%)
Figure 177 BASF SE: R&D, 2019-2023 (US$ Billion, AGR%)
Figure 178 BASF SE: Business Segment Market Shares, 2023
Figure 179 BASF SE: SWOT Analysis
Figure 180 Syngenta: SWOT Analysis
Figure 181 Corteva, Inc: Net Revenue, 2019-2023 (US$ Billion, AGR%)
Figure 182 Corteva, Inc: R&D, 2019-2023 (US$ Billion, AGR%)
Figure 183 Corteva, Inc: Regional Market Shares, 2023
Figure 184 Corteva, Inc: Business Segment Market Shares, 2023
Figure 185 Compass Minerals International, Inc: Net Revenue, 2019-2023 (US$ Billion, AGR%)
Figure 186 Compass Minerals International, Inc: Regional Market Shares, 2023
Figure 187 Compass Minerals International, Inc: Business Segment Market Shares, 2023
Figure 188 K+S AG: Net Revenue, 2019-2023 (US$ Billion, AGR%)
Figure 189 K+S AG: R&D, 2019-2023 (US$ Billion, AGR%)
Figure 190 K+S AG: Business Segment Market Shares, 2023
Figure 191 Sociedad Química y Minera de Chile: Net Revenue, 2019-2023 (US$ Billion, AGR%)
Figure 192 Sociedad Química y Minera de Chile: Regional Market Shares, 2023
Figure 193 Sociedad Química y Minera de Chile: Business Segment Market Shares, 2023
Figure 194 Sociedad Química y Minera de Chile: SWOT Analysis
Figure 195 Sumitomo Chemical Co., Ltd: Net Revenue, 2019-2023 (US$ Billion, AGR%)
Figure 196 Sumitomo Chemical Co., Ltd: R&D, 2019-2023 (US$ Billion, AGR%)
Figure 197 Adama Ltd,: Net Revenue, 2019-2023 (US$ Billion, AGR%)
Figure 198 Adama Ltd,: R&D, 2019-2023 (US$ Billion, AGR%)
Figure 199 Adama Ltd,: Regional Market Shares, 2023
Figure 200 Adama Ltd,: Business Segment Market Shares, 2023
Figure 201 Nufarm Limited: Net Revenue, 2019-2023 (US$ Billion, AGR%)
Figure 202 Nufarm Limited: R&D, 2019-2023 (US$ Billion, AGR%)
Figure 203 Nufarm Limited: Regional Market Shares, 2023
Figure 204 Nufarm Limited: Business Segment Market Shares, 2023
Figure 205 UPL Limited: Net Revenue, 2019-2023 (US$ Billion, AGR%)
Figure 206 UPL Limited: R&D, 2019-2023 (US$ Billion, AGR%)
Figure 207 UPL Limited: Regional Market Shares, 2023
Figure 208 UPL Limited: Business Segment Market Shares, 2023
Figure 209 Nutrien Ltd.: Net Revenue, 2019-2023 (US$ Billion, AGR%)
Figure 210 Nutrien Ltd.: Business Segment Market Shares, 2023
Figure 211 Nutrien Ltd.: SWOT Analysis
ページTOPに戻る
よくあるご質問
Visiongain社はどのような調査会社ですか?
英国の調査会社ヴィジョンゲイン社(Visiongain)は、通信とエネルギーのほか、自動車や化学・医薬品、金属など、広範な市場を対象に調査を行っています。自動車市場については、市場全般に関する調査のほ... もっと見る
調査レポートの納品までの日数はどの程度ですか?
在庫のあるものは速納となりますが、平均的には 3-4日と見て下さい。
但し、一部の調査レポートでは、発注を受けた段階で内容更新をして納品をする場合もあります。
発注をする前のお問合せをお願いします。
注文の手続きはどのようになっていますか?
1)お客様からの御問い合わせをいただきます。
2)見積書やサンプルの提示をいたします。
3)お客様指定、もしくは弊社の発注書をメール添付にて発送してください。
4)データリソース社からレポート発行元の調査会社へ納品手配します。
5) 調査会社からお客様へ納品されます。最近は、pdfにてのメール納品が大半です。
お支払方法の方法はどのようになっていますか?
納品と同時にデータリソース社よりお客様へ請求書(必要に応じて納品書も)を発送いたします。
お客様よりデータリソース社へ(通常は円払い)の御振り込みをお願いします。
請求書は、納品日の日付で発行しますので、翌月最終営業日までの当社指定口座への振込みをお願いします。振込み手数料は御社負担にてお願いします。
お客様の御支払い条件が60日以上の場合は御相談ください。
尚、初めてのお取引先や個人の場合、前払いをお願いすることもあります。ご了承のほど、お願いします。
データリソース社はどのような会社ですか?
当社は、世界各国の主要調査会社・レポート出版社と提携し、世界各国の市場調査レポートや技術動向レポートなどを日本国内の企業・公官庁及び教育研究機関に提供しております。
世界各国の「市場・技術・法規制などの」実情を調査・収集される時には、データリソース社にご相談ください。
お客様の御要望にあったデータや情報を抽出する為のレポート紹介や調査のアドバイスも致します。
|
|


