末梢血管機器市場レポート:2024-2034
Peripheral Vascular Device Market Report 2024-2034
レポート詳細
末梢血管機器市場レポート 2024-2034年 :この調査レポートは、業界とその基礎となるダイナミクスをより良く理解することを望むなら、新たな収益ポケットを目指す大手企業にとって貴重... もっと見る
※上記価格は部署ライセンス(Departmental licence)価格です。
その他の価格についてはデータリソースまでお問合せください。
日本語のページは自動翻訳を利用し作成しています。
実際のレポートは英文のみでご納品いたします。

|

|
サマリー
レポート詳細
末梢血管機器市場レポート 2024-2034年:この調査レポートは、業界とその基礎となるダイナミクスをより良く理解することを望むなら、新たな収益ポケットを目指す大手企業にとって貴重なものとなるでしょう。異業種への進出や新地域での既存事業の拡大を目指す企業にも有用です。。
R&D投資が業界の成長を牽引すると予測
市場参加者は、革新的な末梢血管機器を製造するための研究開発投資に取り組んでおり、その有効性と安全性を高めると同時に、新しい技術や治療法の導入を通じて人々の意識を高めることを目指している。例えば、メドトロニックは2024年3月、5年間で3億5,000万ドル以上を投資するというコミットメントの一環として、ハイデラバードにあるメドトロニック・エンジニアリング&イノベーション・センター(MEIC)を拡張した。この投資は、同センターの研究開発能力を強化し、従業員数を約950人から1,500人に増やすことを目的としている。2023年12月1日、BIOTRONIKは最新のアジア太平洋製造・研究ハブの落成式を行いました。20,000m²の敷地を持つこの施設は、BIOTRONIKのアジア太平洋地域における製造、研究開発、販売・マーケティングを含む事業の主要拠点に指定されています。この新しい施設は、インターベンショナル・カーディオロジー、末梢インターベンション、心調律管理、内視鏡、神経調節、泌尿器と骨盤の健康など、さまざまな治療領域にわたる専門知識を提供し、インドにおけるボストン・サイエンティフィックの存在感と能力を強化します。
製品リコールが業界の成長を脅かす
末梢血管機器の市場成長は、製品リコール、消費者の信頼の低下、規制当局の監視の強化、メーカーへの財務的負担の賦課、市場競争の激化によって著しく阻害されている。2023年にはCordis US CorpがINFINITI Angiographic Catheterを適切な滅菌手順を経ずに出荷したためリコールし、Terumo AorticはTREO Abdominal Stent-Graft Systemsの特定ロットをグラフトサイズに潜在的な問題があるとしてリコールした。同様に2024年4月、FDAはテレフレックスとアロー・インターナショナルが製造した橈骨動脈カテーテルキット33万個に対してクラスIリコールを発令した。2021年12月から2024年1月の間に、合計334,995個の影響を受けた器具が配布された。
このようなリコールは、影響を受けるブランドや製品カテゴリーに対する信頼を損ない、患者や医療従事者の間で需要が減少したり、同様の器具の使用に消極的になったりする。規制機関がより厳しい承認要件を課す可能性があり、新製品の市場参入が遅れる。メーカーは、リコール、調査、影響を受けた人々への補償に関連する多額の費用を負担し、収益性や研究開発投資に影響を与える。競合他社が、より安全だと思われる代替製品を提供することで市場シェアを獲得する機会をつかみ、末梢血管機器市場における競争を激化させる可能性があります。
市場調査レポートを購入する前にすべき質問とは?
-
末梢血管機器市場はどのように進化しているのか?
-
末梢血管機器市場の推進要因と抑制要因は何か?
-
各末梢血管機器サブマーケットセグメントは予測期間中にどのように成長し、2034年にはどれくらいの売上を占めるようになるのか?
-
2024年から2034年にかけて、各末梢血管機器サブマーケットの市場シェアはどのように推移するのか?
-
2024年から2034年にかけて市場全体を牽引する主な要因は何か?
-
主要な末梢血管機器市場はマクロ経済の動きに幅広く追随するのか、それとも個々の国市場が他を凌駕するのか?
-
2034年までに各国市場のシェアはどのように変化し、2034年にはどの地域が市場をリードするのか?
-
主要プレイヤーは誰で、予測期間中の見通しは?
-
これら大手企業の末梢血管機器プロジェクトは?
-
2024年から2034年の間に業界はどのように発展していくのか?現在および今後10年間に行われる末梢血管機器プロジェクトにはどのような意味があるのでしょうか?
-
末梢血管機器市場をさらに拡大するために、製品化の必要性は高まっていますか?
-
末梢血管機器市場はどこに向かっているのか、そしてどのようにすれば市場の最前線に立てるのか?
-
新製品やサービスラインに対する最良の投資オプションは何か?
-
企業を新たな成長軌道に乗せ、C-suiteに移行させるための重要な展望とは?
このことが、現在、そして今後10年間の末梢血管機器市場にどのような影響を与えるかを見極める必要がある:
-
325ページにわたるレポートでは、150の表と240の図表を掲載している。
-
本レポートでは、業界における主要な有利分野を取り上げているため、今すぐターゲットを絞ることができる。
-
世界、地域、国の売上高と成長に関する詳細な分析が含まれている。
-
競合他社が成功した主なトレンド、変化、収益予測をハイライトします。
本レポートは、COVID-19の景気後退と好転の変動に合わせて、末梢血管機器市場が今後10年間にどのように発展するかをTODAYでお伝えします。この市場は過去10年間のどの時点よりも今が重要である。
2034年までの予測やその他の分析から、商業的な展望が明らかになる
-
2034年までの収益予測に加え、最近の実績、成長率、市場シェアも提供している。
-
ビジネスの展望や展開など、独自の分析が掲載されている。
-
定性的分析(市場ダイナミクス、促進要因、機会、阻害要因、課題を含む)、コスト構造、末梢血管機器の価格上昇の影響、最近の動向をご覧いただけます。
このレポートには、COVID-19が業界と貴社にどのような影響を与えるかについてのデータ分析と貴重な洞察が含まれています。COVID-19の4つの回収パターンとその影響、すなわち "V"、"L"、"W"、"U"については本レポートで触れている。
レポート対象セグメント
製品
-
ステントベアメタルステント、薬剤溶出ステント
-
PTA風船
-
カテーテル血管造影カテーテル、IVUS/OCTカテーテル、ガイディングカテーテル
-
血管内動脈瘤修復ステントグラフト:胸部血管内動脈瘤ステントグラフト、腹部血管内動脈瘤ステントグラフト
-
プラーク修正デバイスアテレクトミー装置、血栓除去装置
-
下大静脈フィルター:永久フィルター、回収可能フィルター
-
血行動態改善デバイス慢性完全閉塞装置、塞栓防止装置
-
その他ガイドワイヤー、血管閉鎖器具、バルーン拡張器具、イントロデューサーシース
エンドユーザー
世界市場全体と各分野の収益予測に加え、5つの地域と22の主要国市場の収益予測も掲載している:
北米
欧州
-
ドイツ
-
英国
-
フランス
-
スペイン
-
イタリア
-
ロシア
-
その他の欧州
アジア太平洋
-
中国
-
日本
-
インド
-
オーストラリア
-
韓国
-
その他のアジア太平洋
ラテンアメリカ
-
ブラジル
-
メキシコ
-
アルゼンチン
-
その他のラテンアメリカ
MEA
本レポートには、2024年から2034年までの末梢血管機器市場における主要企業のプロファイルも含まれており、これらの企業の事業のこのセグメントに焦点を当てている。
主要企業と市場成長の可能性
-
Abbott Laboratories
-
B. Braun SE
-
Becton, Dickinson and Company
-
Biotronik SE & Co KG
-
Boston Scientific Corporation
-
Cardinal Health, Inc.
-
Cook Group, Inc.
-
Cordis Corp.
-
Getinge AB
-
Koninklijke Philips N.V.
-
Kyoto Medical Planning Co., Ltd.
-
Medtronic plc
-
Merit Medical Systems, Inc.
-
Penumbra Inc.
-
Terumo Corporation
2024年から2034年にかけての末梢血管機器市場全体の世界売上高は、金額ベースで2024年に120億米ドルを突破する。2034年まで力強い収益成長を予測。当調査では、最も大きな可能性を秘めた企業を特定しています。彼らの能力、進歩、商業的展望を発見し、あなたが一歩先を行くのを支援します。
末梢血管機器市場、2024-2034年レポートはどのようにお役に立つでしょうか?
要約すると、320ページを超えるこのレポートは、以下の知識を提供する:
-
末梢血管機器市場の2024年から2034年までの収益予測、製品別およびエンドユーザー別の予測、世界および地域レベルでの各予測 - 業界の展望を発見し、投資と収益に最も有利な場所を見つけることができます。
-
5つの地域と22の主要国市場の2034年までの収益予測 - 北米、欧州、アジア太平洋、ラテンアメリカ、MEAの末梢血管機器市場の2024年から2034年までの予測をご覧ください。また、米国、カナダ、メキシコ、ブラジル、ドイツ、フランス、英国、イタリア、中国、インド、日本、オーストラリアなど著名な経済圏の市場予測も掲載しています。
-
2024年から2034年までの末梢血管機器市場に関与する主要企業15社の企業プロファイルを含む。
独自の予測による定量的・定性的分析をご覧ください。私たちのレポートだけに含まれる情報を入手し、貴重なビジネスインテリジェンスで情報を得ることができます。
他にはない情報
私たちの新しいレポートがあれば、知識に遅れをとったり、チャンスを逃したりする可能性が低くなります。弊社の調査レポートが貴社の調査、分析、意思決定にどのように役立つかをご覧ください。Visiongainの調査は、2024年から2034年までの末梢血管機器市場の商業分析を必要とするすべての人、市場をリードする企業のためのものです。データ、トレンド、予測をご覧いただけます。
ページTOPに戻る
目次
1 レポート概要
1.1 研究の目的
1.2 末梢血管機器市場の紹介
1.3 本レポートの内容
1.4 本レポートを読むべき理由
1.5 本分析レポートが回答する主な質問
1.6 本レポートの対象者
1.7 方法論
1.7.1 市場の定義
1.7.2 市場評価・予測手法
1.7.3 データの検証
1.7.3.1 一次調査
1.7.3.2 セカンダリーリサーチ
1.8 よくある質問(FAQ)
1.9 Visiongainの関連レポート
1.10 Visiongainについて
2 エグゼクティブ・サマリー
3 市場概要
3.1 主要な調査結果
3.2 市場ダイナミクス
3.2.1 市場促進要因
3.2.1.1 末梢血管手技に対する保険償還
3.2.1.2 糖尿病人口と肥満人口の増加が市場を牽引している
3.2.1.3 低侵襲手技に対する需要の増加
3.2.1.4 老年人口の増加
3.2.2 市場抑制要因
3.2.2.1 製品リコールが業界の成長を抑制する可能性が高い
3.2.2.2 厳しい規制が市場成長を制限する
3.2.2.3 末梢血管デバイスの高コストが市場成長を抑制する
3.2.2.4 代替治療の入手可能性
3.2.3 市場機会
3.2.3.1 技術的進歩
3.2.3.2 近い将来、新製品の発売が市場を牽引すると予想される
3.2.3.3 新規デバイス上市に向けたR&D活動の活発化
3.2.3.4 医療に対する意識とアクセスの高まり
3.3 COVID-19の影響分析
3.4 ポーターのファイブフォース分析
3.4.1 サプライヤーの交渉力
3.4.2 バイヤーの交渉力
3.4.3 競争上のライバル
3.4.4 代替品の脅威
3.4.5 新規参入企業の脅威
3.5 PEST分析
4 末梢血管機器市場分析:製品別
4.1 主要な調査結果
4.2 製品セグメント 市場魅力度指数
4.3 製品別末梢血管機器市場規模の推定と予測
4.4 ステント
4.4.1 2024〜2034年の地域別市場規模(US$ Billion)
4.4.2 地域別市場シェア、2024年・2034年(%)
4.4.3 ベアメタルステント
4.4.3.1 2024〜2034年の地域別市場規模(US$ Billion)
4.4.3.2 地域別市場シェア、2024年・2034年(%)
4.4.4 薬剤溶出ステント
4.4.4.1 2024〜2034年の地域別市場規模(US$ Billion)
4.4.4.2 地域別市場シェア、2024年・2034年(%)
4.5 PTAバルーン
4.5.1 2024〜2034年の地域別市場規模(US$ Billion)
4.5.2 地域別市場シェア、2024年・2034年(%)
4.6 カテーテル
4.6.1 2024〜2034年の地域別市場規模(US$ Billion)
4.6.2 地域別市場シェア、2024年・2034年(%)
4.6.3 血管造影カテーテル
4.6.3.1 2024〜2034年の地域別市場規模(US$ Billion)
4.6.3.2 地域別市場シェア、2024年・2034年(%)
4.6.4 IVUS/OCTカテーテル
4.6.4.1 2024〜2034年の地域別市場規模(US$ Billion)
4.6.4.2 地域別市場シェア、2024年・2034年(%)
4.6.5 ガイドカテーテル
4.6.5.1 2024〜2034年の地域別市場規模(US$ Billion)
4.6.5.2 地域別市場シェア、2024年・2034年(%)
4.7 血管内動脈瘤修復ステントグラフト
4.7.1 2024〜2034年の地域別市場規模(US$ Billion)
4.7.2 地域別市場シェア、2024年・2034年(%)
4.7.3 胸部血管内動脈瘤ステントグラフト
4.7.3.1 2024〜2034年の地域別市場規模(US$ Billion)
4.7.3.2 地域別市場シェア、2024年・2034年(%)
4.7.4 腹部血管内動脈瘤ステントグラフト
4.7.4.1 2024〜2034年の地域別市場規模(US$ Billion)
4.7.4.2 地域別市場シェア、2024年・2034年(%)
4.8 プラーク修正デバイス
4.8.1 2024〜2034年の地域別市場規模(US$ Billion)
4.8.2 地域別市場シェア、2024年・2034年(%)
4.8.3 アセレクトミーデバイス
4.8.3.1 2024~2034年の地域別市場規模(US$ Billion)
4.8.3.2 地域別市場シェア、2024年・2034年(%)
4.8.4 血栓除去装置
4.8.4.1 2024~2034年の地域別市場規模(US$ Billion)
4.8.4.2 地域別市場シェア、2024年・2034年(%)
4.9 下大静脈フィルター
4.9.1 2024〜2034年の地域別市場規模(US$ Billion)
4.9.2 地域別市場シェア、2024年・2034年(%)
4.9.3 永久フィルター
4.9.3.1 2024〜2034年の地域別市場規模(US$ Billion)
4.9.3.2 地域別市場シェア、2024年・2034年(%)
4.9.4 取出し可能フィルター
4.9.4.1 2024〜2034年の地域別市場規模(US$ Billion)
4.9.4.2 地域別市場シェア、2024年・2034年(%)
4.10 血行動態改善装置
4.10.1 2024〜2034年の地域別市場規模(US$ Billion)
4.10.2 地域別市場シェア、2024年・2034年(%)
4.10.3 慢性完全閉塞デバイス
4.10.3.1 2024〜2034年の地域別市場規模(US$ Billion)
4.10.3.2 地域別市場シェア、2024年・2034年(%)
4.10.4 塞栓防止デバイス
4.10.4.1 2024〜2034年の地域別市場規模(US$ Billion)
4.10.4.2 地域別市場シェア、2024年・2034年(%)
4.11 その他
4.11.1 2024〜2034年の地域別市場規模(US$ Billion)
4.11.2 地域別市場シェア、2024年・2034年(%)
4.11.3 ガイドワイヤー
4.11.3.1 2024~2034年の地域別市場規模(US$ Billion)
4.11.3.2 地域別市場シェア、2024年・2034年(%)
4.11.4 血管閉鎖器具
4.11.4.1 2024~2034年の地域別市場規模(US$ Billion)
4.11.4.2 地域別市場シェア、2024年・2034年(%)
4.11.5 バルーン注入装置
4.11.5.1 2024〜2034年の地域別市場規模(US$ Billion)
4.11.5.2 地域別市場シェア、2024年・2034年(%)
4.11.6 イントロデューサー用シース
4.11.6.1 2024~2034年の地域別市場規模(US$ Billion)
4.11.6.2 地域別市場シェア、2024年・2034年(%)
5 末梢血管機器市場分析:エンドユーザー別
5.1 主要調査結果
5.2 エンドユーザーセグメント: 市場魅力度指数
5.3 エンドユーザー別末梢血管機器市場規模推定と予測
5.4 病院
5.4.1 2024〜2034年の地域別市場規模(US$ Billion)
5.4.2 地域別市場シェア、2024年・2034年(%)
5.5 外来手術センター(ASCs)
5.5.1 2024〜2034年の地域別市場規模(US$ Billion)
5.5.2 地域別市場シェア、2024年・2034年(%)
5.6 その他
5.6.1 2024〜2034年の地域別市場規模(US$ Billion)
5.6.2 地域別市場シェア、2024年・2034年(%)
6 末梢血管機器市場分析:地域別
6.1 主要な調査結果
6.2 地域別市場規模の推定と予測
7 北米の末梢血管機器市場分析
7.1 主要な調査結果
7.2 北米の末梢血管機器市場魅力度指数
7.3 北米の末梢血管機器国別市場、2024年、2029年、2034年(US$ Billion)
7.4 北米の末梢血管機器市場規模推定と予測:国別
7.5 北米の末梢血管機器市場規模推定と予測:製品別
7.5.1 北米のステント市場規模推定と予測:タイプ別
7.5.2 北米のカテーテル市場規模推定と予測:タイプ別
7.5.3 北米の血管内動脈瘤修復ステントグラフト市場規模推定と予測:タイプ別
7.5.4 北米のプラーク修正デバイス市場規模推定と予測:タイプ別
7.5.5 北米の下大静脈フィルター市場規模推定と予測:タイプ別
7.5.6 北米の血行動態改善装置市場規模推定と予測:タイプ別
7.5.7 北米のその他の市場規模推定と予測:タイプ別
7.6 北米の末梢血管機器市場規模推定と予測:エンドユーザー別
7.7 アメリカの末梢血管機器市場分析
7.8 カナダの末梢血管機器市場分析
8 欧州の末梢血管機器市場分析
8.1 主要な調査結果
8.2 欧州の末梢血管機器市場魅力度指数
8.3 欧州の末梢血管機器国別市場、2024年、2029年、2034年(US$ Billion)
8.4 欧州の末梢血管機器市場規模推定と予測:国別
8.5 欧州の末梢血管機器市場規模推定と予測:製品別
8.5.1 欧州のステント市場規模推定と予測:タイプ別
8.5.2 欧州のカテーテル市場規模推定と予測:タイプ別
8.5.3 欧州の血管内動脈瘤修復ステントグラフト市場規模推定と予測:タイプ別
8.5.4 欧州のプラーク修正デバイス市場規模推定と予測:タイプ別
8.5.5 欧州の下大静脈フィルター市場規模推定と予測:タイプ別
8.5.6 欧州の血行動態改善デバイス市場規模推定と予測:タイプ別
8.5.7 欧州のその他の市場規模推定と予測:タイプ別
8.6 欧州の末梢血管機器の市場規模推定と予測:エンドユーザー別
8.7 ドイツの末梢血管機器市場分析
8.8 イギリスの末梢血管機器市場分析
8.9 フランスの末梢血管機器市場分析
8.10 イタリアの末梢血管機器市場分析
8.11 スペインの末梢血管機器市場分析
8.12 ロシアの末梢血管機器市場分析
8.13 その他の欧州末梢血管機器市場分析
9 アジアの末梢血管機器市場分析
9.1 主要な調査結果
9.2 アジアの末梢血管機器市場魅力度指数
9.3 アジアの末梢血管機器国別市場、2024年、2029年、2034年(US$ Billion)
9.4 アジアの末梢血管機器市場規模推定と予測:国別
9.5 アジア太平洋地域の末梢血管機器市場:製品別規模推定と予測
9.5.1 アジア太平洋地域のステント市場規模推定と予測:タイプ別
9.5.2 アジア太平洋地域のカテーテル市場規模推定と予測:タイプ別
9.5.3 アジア太平洋地域の血管内動脈瘤修復ステントグラフト市場規模推定と予測:タイプ別
9.5.4 アジア太平洋地域のプラーク修正デバイス市場規模推定と予測:タイプ別
9.5.5 アジア太平洋地域の下大静脈フィルター市場規模推定と予測:タイプ別
9.5.6 アジア太平洋地域の血行動態改善装置市場規模推定と予測:タイプ別
9.5.7 アジア太平洋地域のその他の市場規模推定と予測:タイプ別
9.6 アジアの太平洋地域の末梢血管機器市場規模推定と予測:エンドユーザー別
9.7 日本の末梢血管機器市場分析
9.8 中国の末梢血管機器市場分析
9.9 インドの末梢血管機器市場分析
9.10 オーストラリアの末梢血管機器市場分析
9.11 韓国の末梢血管機器市場分析
9.12 その他のアジアの末梢血管機器市場分析
10 ラテンアメリカの末梢血管機器市場分析
10.1 主要な調査結果
10.2 ラテンアメリカの末梢血管機器市場魅力度指数
10.3 ラテンアメリカの末梢血管機器国別市場、2024年、2029年、2034年(US$ Billion)
10.4 ラテンアメリカの末梢血管機器市場規模推定と予測:国別
10.5 ラテンアメリカの末梢血管機器市場規模推定と予測:製品別
10.5.1 ラテンアメリカのステント市場規模推定と予測:タイプ別
10.5.2 ラテンアメリカのカテーテル市場規模推定と予測:タイプ別
10.5.3 ラテンアメリカの血管内動脈瘤修復ステントグラフト市場規模推定と予測:タイプ別
10.5.4 ラテンアメリカのプラーク修正デバイス市場規模推定と予測:タイプ別
10.5.5 ラテンアメリカの下大静脈フィルター市場規模推定と予測:タイプ別
10.5.6 ラテンアメリカの血行動態改善装置市場規模推定と予測:タイプ別
10.5.7 ラテンアメリカのその他市場規模推定と予測:タイプ別
10.6 ラテンアメリカ:末梢血管機器市場規模推定と予測:エンドユーザー別
10.7 ブラジルの末梢血管機器市場分析
10.8 メキシコの末梢血管機器市場分析
10.9 アルゼンチンの末梢血管機器市場分析
10.10 その他のラテンアメリカ末梢血管機器市場分析
11 MEAの末梢血管機器市場の分析
11.1 主要な調査結果
11.2 MEAの末梢血管機器市場魅力度指数
11.3 MEAの末梢血管機器市場の国別市場規模、2024年、2029年、2034年(US$ Billion)
11.4 MEAの末梢血管機器市場規模推定と予測:国別
11.5 MEAの末梢血管機器市場規模推定と予測:製品別
11.5.1 MEAのステント市場規模推定と予測:タイプ別
11.5.2 MEAのカテーテル市場規模推定と予測:タイプ別
11.5.3 MEAの血管内動脈瘤修復ステントグラフト市場規模推定と予測:タイプ別
11.5.4 MEAのプラーク修正デバイス市場規模推定と予測:タイプ別
11.5.5 MEAの下大静脈フィルター市場規模推定と予測:タイプ別
11.5.6 MEAの血行動態改善装置市場規模推定と予測:タイプ別
11.5.7 MEAのその他市場規模推定と予測:タイプ別
11.6 MEAの末梢血管機器市場規模推定と予測:エンドユーザー別
11.7 GCCの末梢血管機器市場分析
11.8 南アフリカの末梢血管機器市場分析
11.9 その他のMEA末梢血管機器市場分析
12 企業プロフィール
12.1 競争環境、2023年
12.2 戦略的展望
12.3 Becton Dickinson and Co. (BD)
12.3.1 会社概要
12.3.2 会社概要
12.3.3 財務分析
12.3.3.1 純収入、2018-2023年
12.3.3.2 R&D、2018年~2023年
12.3.3.3 地域市場シェア、2023年
12.3.4 製品ベンチマーク
12.3.5 戦略的展望
12.4 Cook Group, Inc.
12.4.1 会社概要
12.4.2 会社概要
12.4.3 製品ベンチマーク
12.4.4 戦略的展望
12.5 Boston Scientific Corporation
12.5.1 会社概要
12.5.2 会社概要
12.5.3 財務分析
12.5.3.1 純収入、2018-2023年
12.5.3.2 R&D、2018年~2023年
12.5.3.3 地域市場シェア、2023年
12.5.4 製品ベンチマーク
12.5.5 戦略的展望
12.6 Abbott Laboratories
12.6.1 会社概要
12.6.2 会社概要
12.6.3 財務分析
12.6.3.1 純収入、2018-2023年
12.6.3.2 R&D、2018年〜2023年
12.6.3.3 地域市場シェア、2023年
12.6.4 製品ベンチマーク
12.6.5 戦略的展望
12.7 Medtronic Plc
12.7.1 会社概要
12.7.2 会社概要
12.7.3 財務分析
12.7.3.1 純収入、2018-2023年
12.7.3.2 R&D、2018年〜2023年
12.7.3.3 地域市場シェア、2023年
12.7.4 製品ベンチマーク
12.7.5 戦略的展望
12.8 Getinge AB
12.8.1 会社概要
12.8.2 会社概要
12.8.3 財務分析
12.8.3.1 純収入、2018-2023年
12.8.3.2 R&D、2018年~2023年
12.8.3.3 地域市場シェア、2023年
12.8.4 製品ベンチマーク
12.8.5 戦略的展望
12.9 Cardinal Health, Inc.
12.9.1 会社概要
12.9.2 会社概要
12.9.3 財務分析
12.9.3.1 純収入、2018年〜2023年
12.9.3.2 地域市場シェア、2023年
12.9.4 製品ベンチマーク
12.10 Terumo Corporation
12.10.1 会社概要
12.10.2 会社概要
12.10.3 財務分析
12.10.3.1 純収入、2018年~2023年
12.10.3.2 地域市場シェア、2023年
12.10.4 製品ベンチマーク
12.10.5 戦略的展望
12.11 Biotronik SE & Co.KG
12.11.1 会社概要
12.11.2 会社概要
12.11.3 製品ベンチマーク
12.11.4 戦略的展望
12.12 Kyoto Medical Planning Co. Ltd.
12.12.1 会社概要
12.12.2 会社概要
12.12.3 製品ベンチマーク
12.13 Koninklijke Philips N.V.
12.13.1 会社概要
12.13.2 会社概要
12.13.3 財務分析
12.13.3.1 純収入(2018年~2023年
12.13.3.2 R&D、2018年〜2023年
12.13.3.3 地域市場シェア、2023年
12.13.4 製品ベンチマーク
12.13.5 戦略的展望
12.14 B. Braun SE
12.14.1 会社概要
12.14.2 会社概要
12.14.3 財務分析
12.14.3.1 純収入、2018-2023年
12.14.3.2 R&D、2018年〜2023年
12.14.3.3 地域市場シェア、2023年
12.14.4 製品ベンチマーク
12.15 Penumbra Inc.
12.15.1 会社概要
12.15.2 会社概要
12.15.3 財務分析
12.15.3.1 純収入、2018-2023年
12.15.3.2 R&D、2018年〜2023年
12.15.3.3 地域市場シェア、2023年
12.15.4 製品ベンチマーク
12.15.5 戦略的展望
12.16 Merit Medical Systems, Inc.
12.16.1 会社概要
12.16.2 会社概要
12.16.3 財務分析
12.16.3.1 純収入、2018-2023年
12.16.3.2 R&D、2018年〜2023年
12.16.3.3 地域市場シェア、2023年
12.16.4 製品ベンチマーク
12.17 Cordis Corporation
12.17.1 会社概要
12.17.2 会社概要
12.17.3 製品ベンチマーク
12.17.4 戦略的展望
13 結論と提言
13.1 Visiongainからの結びの言葉
13.2 市場プレイヤーへの提言
ページTOPに戻る
図表リスト
表の一覧
表1 末梢血管機器市場スナップショット、2024年&2034年(10億米ドル、CAGR)
表2 2024~2034年の地域別末梢血管機器市場予測(10億米ドル、AGR%、CAGR%):「V字型回復
表3 2024-2034年の地域別末梢血管機器市場予測(10億米ドル、AGR%、CAGR%):「U」字型回復「U字型回復
表4 2024~2034年の地域別末梢血管機器市場予測(10億米ドル、AGR%、CAGR%):「U」字型回復「W字型回復
表5 2024~2034年の地域別末梢血管機器市場予測(10億米ドル、AGR%、CAGR%):「L」字型回復「L字型回復
表6 製品別末梢血管デバイス市場予測:2024-2034年(10億米ドル、AGR%、CAGR)
表7 ステントセグメントの地域別市場予測、2024-2034年(10億米ドル、AGR%、CAGR)
表8 ベアメタルステントセグメントの地域別市場予測、2024~2034年(10億米ドル、AGR%、CAGR)
表9 薬剤溶出ステントセグメント地域別市場予測、2024-2034年(10億米ドル、AGR%、CAGR)
表10 PTAバルーンセグメント地域別市場予測、2024-2034年(10億米ドル、AGR%、CAGR)
表11 カテーテルセグメント地域別市場予測、2024-2034年 (10億米ドル、AGR%、CAGR%)
表12 血管造影カテーテルセグメント地域別市場予測、2024-2034年(10億米ドル、AGR%、CAGR)
表13 IVUS/OCTカテーテルセグメント地域別市場予測、2024-2034年(10億米ドル、AGR%、CAGR)
表14 ガイディングカテーテルセグメント地域別市場予測、2024-2034年(10億米ドル、AGR%、CAGR)
表15 血管内動脈瘤修復ステントグラフトセグメント地域別市場予測、2024-2034年(10億米ドル、AGR%、CAGR)
表16 胸部血管内動脈瘤修復ステントグラフトの地域別市場予測、2024〜2034年(10億米ドル、AGR%、CAGR)
表17 腹部血管内動脈瘤ステントグラフトセグメント地域別市場予測、2024-2034年(10億米ドル、AGR%、CAGR)
表18 プラーク修正デバイスセグメント地域別市場予測、2024-2034年(10億米ドル、AGR%、CAGR)
表19 アテレクトミー装置セグメント地域別市場予測、2024-2034年(10億米ドル、AGR%、CAGR)
表20 血栓除去装置セグメントの地域別市場予測、2024~2034年(10億米ドル、AGR%、CAGR)
表21 下大静脈フィルターセグメント地域別市場予測、2024-2034年(10億米ドル、AGR%、CAGR)
表22 2024-2034年地域別永久フィルター市場予測(10億米ドル、AGR%、CAGR)
表23 回収可能フィルターセグメント地域別市場予測、2024-2034年(10億米ドル、AGR%、CAGR)
表24 血行動態改善デバイスセグメント地域別市場予測、2024-2034年(10億米ドル、AGR%、CAGR)
表25 慢性完全閉塞デバイスセグメント地域別市場予測:2024〜2034年(10億米ドル、AGR%、CAGR)
表26 塞栓防止装置セグメントの地域別市場展望、2024〜2034年(10億米ドル、AGR%、CAGR)
表27 その他セグメントの地域別市場予測、2024-2034年(10億米ドル、AGR%、CAGR)
表28 ガイドワイヤセグメント地域別市場予測、2024-2034年(10億米ドル、AGR%、CAGR)
表29 血管閉鎖装置セグメント地域別市場予測、2024-2034年(10億米ドル、AGR%、CAGR)
表30 バルーン拡張器具セグメント地域別市場予測、2024-2034年 (10億米ドル、AGR%、CAGR%)
表31 イントロデューサーシースセグメント地域別市場予測、2024-2034年 (10億米ドル、AGR%、CAGR%)
表32 末端ユーザー別末梢血管デバイス市場予測:2024-2034年(10億米ドル、AGR%、CAGR)
表33 病院セグメントの地域別市場予測、2024〜2034年(10億米ドル、AGR%、CAGR)
表34 外来手術センター(ASC)セグメントの地域別市場予測、2024〜2034年(10億米ドル、AGR%、CAGR)
表35 その他セグメントの地域別市場予測、2024〜2034年(10億米ドル、AGR%、CAGR)
表36 末梢血管デバイスの地域別市場展望、2024~2034年(10億米ドル、AGR%、CAGR)
表37 北米末梢血管機器市場の国別予測、2024-2034年 (10億米ドル、AGR%、CAGR%)
表38 北米末梢血管デバイスの製品別市場予測、2024-2034年 (10億米ドル、AGR%、CAGR%)
表39 北米のステント市場タイプ別予測:2024-2034年(10億米ドル、AGR%、CAGR)
表40 北米カテーテル市場のタイプ別予測、2024-2034年(10億米ドル、AGR%、CAGR)
表41 北米血管内動脈瘤修復ステントグラフトのタイプ別市場予測:2024-2034年(10億米ドル、AGR%、CAGR)
表42 北米プラーク修正デバイスのタイプ別市場予測:2024〜2034年(10億米ドル、AGR%、CAGR)
表43 北米下大静脈フィルターのタイプ別市場予測:2024〜2034年(10億米ドル、AGR%、CAGR)
表44 北米血行動態改善装置のタイプ別市場予測:2024〜2034年(10億米ドル、AGR%、CAGR)
表45 北米のその他の市場タイプ別予測、2024〜2034年 (10億米ドル、AGR%、CAGR%)
表46 北米末梢血管機器市場のエンドユーザー別予測:2024〜2034年(10億米ドル、AGR%、CAGR)
表47 米国末梢血管機器市場予測、2024~2034年 (10億米ドル、AGR%、CAGR%)
表48 カナダ末梢血管デバイス市場予測、2024~2034年 (10億米ドル、AGR%、CAGR%)
表49 欧州末梢血管機器市場の国別予測、2024~2034年(10億米ドル、AGR%、CAGR)
表50 欧州末梢血管用デバイスの製品別市場予測、2024-2034年 (10億米ドル、AGR%、CAGR%)
表51 欧州のステント市場タイプ別予測:2024-2034年(10億米ドル、AGR%、CAGR)
表52 欧州のカテーテル市場タイプ別予測、2024-2034年 (10億米ドル、AGR%、CAGR%)
表53 欧州血管内動脈瘤修復ステントグラフトのタイプ別市場予測:2024〜2034年(10億米ドル、AGR%、CAGR)
表54 欧州プラーク修正デバイスのタイプ別市場予測:2024〜2034年(10億米ドル、AGR%、CAGR)
表55 欧州下大静脈フィルターのタイプ別市場予測:2024〜2034年(10億米ドル、AGR%、CAGR)
表56 欧州血行動態改善装置のタイプ別市場予測:2024〜2034年(10億米ドル、AGR%、CAGR)
表57 欧州その他のタイプ別市場予測:2024〜2034年(10億米ドル、AGR%、CAGR)
表58 欧州末梢血管機器市場のエンドユーザー別予測:2024-2034年(10億米ドル、AGR%、CAGR)
表59 ドイツ末梢血管機器市場予測、2024~2034年(10億米ドル、AGR%、CAGR)
表60 英国末梢血管機器市場の予測、2024~2034年(10億米ドル、AGR%、CAGR)
表61 フランス末梢血管機器市場の予測、2024-2034年 (10億米ドル、AGR%、CAGR%)
表62 イタリア末梢血管機器市場の予測、2024-2034年(10億米ドル、AGR%、CAGR)
表63 スペイン末梢血管機器市場の予測、2024~2034年(10億米ドル、AGR%、CAGR)
表64 ロシア末梢血管機器市場の予測、2024-2034年 (10億米ドル、AGR%、CAGR%)
表65 その他のヨーロッパの末梢血管機器市場予測、2024-2034年 (10億米ドル、AGR%、CAGR%)
表66 アジアの末梢血管用デバイスの国別市場予測、2024~2034年(10億米ドル、AGR%、CAGR)
表67 アジア太平洋地域の末梢血管用デバイスの製品別市場予測、2024〜2034年 (10億米ドル、AGR%、CAGR%)
表68 アジア太平洋地域のステント市場タイプ別予測:2024-2034年(10億米ドル、AGR%、CAGR)
表69 アジア太平洋地域のカテーテル市場タイプ別予測、2024〜2034年(10億米ドル、AGR%、CAGR)
表70 アジア太平洋地域の血管内動脈瘤修復ステントグラフトのタイプ別市場予測:2024〜2034年(10億米ドル、AGR%、CAGR)
表71 アジア太平洋地域のプラーク修正デバイスのタイプ別市場予測:2024-2034年(10億米ドル、AGR%、CAGR)
表72 アジア太平洋地域の下大静脈フィルターのタイプ別市場予測:2024〜2034年(10億米ドル、AGR%、CAGR)
表73 アジア太平洋地域の血行動態改善装置のタイプ別市場予測:2024〜2034年(10億米ドル、AGR%、CAGR)
表74 アジア太平洋地域のその他の市場タイプ別予測、2024〜2034年 (10億米ドル、AGR%、CAGR%)
表75 アジア太平洋地域の末梢血管デバイス市場:エンドユーザー別予測、2024年~2034年(10億米ドル、AGR%、CAGR)
表76 日本末梢血管機器市場予測、2024-2034年 (10億米ドル、AGR%、CAGR%)
表77 中国末梢血管デバイス市場予測、2024-2034年 (10億米ドル、AGR%、CAGR%)
表78 インド末梢血管機器市場の予測、2024~2034年 (10億米ドル、AGR%、CAGR%)
表79 オーストラリア末梢血管機器市場の予測、2024~2034年(10億米ドル、AGR%、CAGR)
表80 韓国末梢血管機器市場の予測、2024~2034年(10億米ドル、AGR%、CAGR)
表81 その他のアジアの末梢血管機器市場予測、2024~2034年 (10億米ドル、AGR%、CAGR%)
表82 ラテンアメリカの末梢血管用デバイスの国別市場予測、2024-2034年 (10億米ドル、AGR%、CAGR%)
表83 ラテンアメリカの末梢血管用デバイスの製品別市場予測、2024-2034年 (10億米ドル、AGR%、CAGR%)
表84 ラテンアメリカのステント市場タイプ別予測、2024-2034年 (10億米ドル、AGR%、CAGR%)
表85 ラテンアメリカのカテーテル市場タイプ別予測、2024-2034年 (10億米ドル, AGR%, CAGR%)
表86 中南米の血管内動脈瘤修復ステントグラフト市場タイプ別予測:2024-2034年(10億米ドル、AGR%、CAGR)
表87 ラテンアメリカのプラーク修正デバイスのタイプ別市場予測:2024〜2034年(10億米ドル、AGR%、CAGR)
表88 中南米の下大静脈フィルターのタイプ別市場予測:2024〜2034年(10億米ドル、AGR%、CAGR)
表89 中南米の血行動態改善装置のタイプ別市場予測:2024〜2034年(10億米ドル、AGR%、CAGR)
表90 中南米のその他の市場タイプ別予測、2024〜2034年 (10億米ドル、AGR%、CAGR%)
表91 ラテンアメリカの末梢血管機器市場:エンドユーザー別予測、2024-2034年 (10億米ドル、AGR%、CAGR%)
表92 ブラジル末梢血管機器市場予測、2024~2034年 (10億米ドル、AGR%、CAGR%)
表93 メキシコ末梢血管機器市場の予測、2024~2034年(10億米ドル、AGR%、CAGR)
表94 アルゼンチン末梢血管機器市場の予測、2024~2034年(10億米ドル、AGR%、CAGR)
表95 その他のラテンアメリカの末梢血管機器市場予測、2024-2034年 (10億米ドル、AGR%、CAGR%)
表96 MEAの末梢血管用デバイスの国別市場予測、2024-2034年 (10億米ドル、AGR%、CAGR%)
表97 MEAの末梢血管用デバイスの製品別市場予測、2024-2034年 (10億米ドル、AGR%、CAGR%)
表98 MEAのステント市場タイプ別予測:2024-2034年(10億米ドル、AGR%、CAGR)
表99 MEAのカテーテル市場タイプ別予測、2024-2034年 (10億米ドル, AGR%, CAGR%)
表100 MEA血管内動脈瘤修復ステントグラフトのタイプ別市場予測、2024-2034年 (10億米ドル, AGR%, CAGR%)
表101 MEAプラーク修正デバイスのタイプ別市場予測:2024-2034年(10億米ドル、AGR%、CAGR)
表102 MEA下大静脈フィルターのタイプ別市場予測:2024-2034年(10億米ドル、AGR%、CAGR)
表103 MEA血行動態改善装置のタイプ別市場予測:2024-2034年(10億米ドル、AGR%、CAGR)
表104 MEAその他の市場タイプ別予測、2024-2034年 (10億米ドル、AGR%、CAGR%)
表105 MEAの末梢血管デバイス市場予測:エンドユーザー別、2024-2034年(10億米ドル、AGR%、CAGR)
表106 GCCの末梢血管機器市場予測、2024-2034年 (10億米ドル、AGR%、CAGR%)
表107 南アフリカの末梢血管デバイス市場予測、2024-2034年(10億米ドル、AGR%、CAGR)
表108 その他のMEAの末梢血管機器市場予測、2024-2034年(10億米ドル、AGR%、CAGR)
表109 戦略的展望
表110 Becton Dickinson and Co:主な詳細(CEO, 本社, 売上高, 設立, 従業員数, 企業タイプ, ウェブサイト, 事業セグメント)
表111 ベクトン・ディッキンソン アンド カンパニー(BD):製品ベンチマーク
表112 ベクトン・ディッキンソン アンド カンパニー(BD):戦略的展望
表113 クックグループ主な詳細(CEO, 本社, 売上高, 設立, 従業員数, 企業タイプ, ウェブサイト, 事業セグメント)
表 114 クックグループInc:製品ベンチマーク
表115 クックグループInc:戦略的展望
表116 ボストン・サイエンティフィック社主な詳細(CEO, 本社, 売上高, 設立, 従業員数, 企業タイプ, ウェブサイト, 事業セグメント)
表117 ボストン・サイエンティフィック・コーポレーション製品ベンチマーク
表 118 ボストン・サイエンティフィック コーポレーション戦略的展望
表119 アボット・ラボラトリーズ主な詳細(CEO, 本社, 売上高, 設立, 従業員数, 企業タイプ, ウェブサイト, 事業セグメント)
表120 アボット・ラボラトリーズ製品ベンチマーク
表121 アボット・ラボラトリーズ戦略的展望
表122 メドトロニックPlc:主な詳細(CEO, 本社, 売上高, 設立, 従業員数, 企業タイプ, ウェブサイト, 事業セグメント)
表 123 メドトロニック plc:製品ベンチマーク
表 124 メドトロニック plc:戦略的展望
表125 ゲティンゲAB:主な詳細(CEO、本社、売上高、設立、従業員数、企業タイプ、ウェブサイト、事業セグメント)
表126 Getinge AB:製品ベンチマーク
表127 Getinge AB:戦略的展望
表128 カーディナル・ヘルス社主な詳細(CEO、本社、売上高、設立、従業員数、企業タイプ、ウェブサイト、事業セグメント)
表129 カーディナル・ヘルスInc:製品ベンチマーク
表130 テルモ株式会社主な詳細(CEO, 本社, 収入, 設立, 従業員数, 企業タイプ, ウェブサイト, 事業セグメント)
表131 テルモ株式会社製品ベンチマーク
表132 テルモ株式会社戦略的展望
表133 Biotronik SE & Co.KG:主要詳細(CEO, 本社, 売上高, 設立, 従業員数, 企業タイプ, ウェブサイト, 事業セグメント)
表 134 Biotronik SE & Co.KG:製品ベンチマーク
表 135 Biotronik SE & Co.KG:戦略的展望
表 136 京都医療企画株式会社京都メディカルプランニング: 主要詳細(CEO, 本社, 売上高, 設立, 従業員数, 企業タイプ, ウェブサイト, 事業セグメント)
表 137 京都メディカルプランニング京都メディカルプランニング製品ベンチマーク
表138 Koninklijke Philips N.V.:主な詳細(CEO, 本社, 売上高, 設立, 従業員数, 企業タイプ, ウェブサイト, 事業セグメント)
表139 Koninklijke Philips N.V:製品ベンチマーク
表140 Koninklijke Philips N.V.:戦略的展望
表141 B. Braun SE: 主要企業詳細(CEO, 本社, 売上高, 設立, 従業員数, 企業タイプ, ウェブサイト, 事業セグメント)
表142 B. Braun SE: 製品ベンチマーク
表143 ペナンブラ社主な詳細(CEO, 本社, 売上高, 設立, 従業員数, 企業タイプ, ウェブサイト, 事業セグメント)
表144 ペナンブラ社製品ベンチマーク
表 145 ペナンブラ社戦略的展望
表146 メリット・メディカル・システムズ社:戦略的展望主な詳細(CEO, 本社, 売上高, 設立, 従業員数, 企業タイプ, ウェブサイト, 事業セグメント)
表 147 Merit Medical Systems, Inc:製品ベンチマーク
表148 コーディス・コーポレーション主な詳細(CEO, 本社, 売上高, 設立, 従業員数, 企業タイプ, ウェブサイト, 事業セグメント)
表149 コーディス・コーポレーション製品ベンチマーク
表150 コーディス・コーポレーション戦略的展望
図の一覧
図 1 臨床試験用品市場のセグメンテーション
図2 製品別末梢血管機器市場:市場魅力度指数
図3 エンドユーザー別末梢血管機器市場:市場魅力度指数市場魅力度指数
図4 末梢血管機器市場:地域別市場魅力度指数
図5 末梢血管機器市場:市場魅力度指数市場ダイナミクス
図6 2024~2034年の地域別末梢血管機器市場(10億米ドル、AGR %):「V字回復
図7 2024-2034年の地域別末梢血管機器市場(10億米ドル、AGR %):「V」字型回復「U字型回復
図8 2024-2034年地域別末梢血管機器市場(10億米ドル、AGR %):「W」字型回復「W字型回復
図9 2024-2034年地域別末梢血管機器市場(10億米ドル、AGR %):L字型回復「L字型回復
図10 末梢血管機器市場:ポーターのファイブフォース分析
図11 末梢血管機器市場:PEST分析PEST分析
図12 製品別末梢血管機器市場:PEST分析市場魅力度指数
図13 2024~2034年の製品別末梢血管機器市場予測(10億米ドル、AGR)
図14 2024年、2029年、2034年の製品別末梢血管機器シェア予測(%)
図15 ステントセグメントの地域別市場予測、2024~2034年(10億米ドル、AGR)
図16 地域別ステントセグメント市場予測、2024年&2034年(%)
図 17 2024-2034 年地域別ベアメタルステントセグメント市場予測(10 億米ドル, AGR)
図 18 2024-2034 年地域別ベアメタルステントセグメント市場シェア予測 (%)
図19 薬剤溶出ステントセグメントの地域別市場予測、2024~2034年 (10億米ドル、AGR %)
図20 薬剤溶出ステントセグメント地域別市場シェア予測、2024年〜2034年(%)
図21 PTAバルーンセグメントの地域別市場予測、2024~2034年 (10億米ドル、AGR %)
図22 PTAバルーンセグメント地域別市場シェア予測、2024年&2034年(%)
図23 カテーテルセグメント地域別市場予測、2024~2034年 (10億米ドル, AGR %)
図24 カテーテルセグメント地域別市場シェア予測、2024年&2034年(%)
図25 血管造影カテーテル地域別市場予測、2024~2034年 (10億米ドル、AGR %)
図26 血管造影カテーテル地域別市場シェア予測、2024年~2034年(%)
図27 IVUS/OCTカテーテルセグメント地域別市場予測、2024~2034年 (10億米ドル、AGR %)
図 28 IVUS/OCT カテーテル地域別市場シェア予測、2024 年~2034 年 (%)
図29 ガイディングカテーテルセグメント地域別市場予測、2024~2034年 (10億米ドル、AGR %)
図 30 2024-2034 地域別ガイディングカテーテルセグメント市場シェア予測 (%)
図31 血管内動脈瘤修復ステントグラフトの地域別市場予測、2024~2034年 (10億米ドル、AGR %)
図32 血管内動脈瘤修復ステントグラフトの地域別市場シェア予測、2024年〜2034年 (%)
図33 胸部血管内動脈瘤修復ステントグラフトの地域別市場予測、2024~2034年 (10億米ドル、AGR %)
図 34 胸部血管内動脈瘤ステントグラフトセグメント地域別市場シェア予測、2024 年&2034 年 (%)
図 35 腹部血管内動脈瘤ステントグラフトセグメント地域別市場予測、2024~2034 年 (10 億米ドル、AGR)
図 36 腹部血管内動脈瘤ステントグラフトセグメント地域別市場シェア予測、2024 年/2034 年 (%)
図 37 プラーク修正装置セグメントの地域別市場予測、2024~2034 年(10 億米ドル、AGR)
図 38 2024-2034 プラーク修正デバイス地域別市場シェア予測 (%)
図39 2024~2034年アテレクトミー装置セグメント地域別市場予測(10億米ドル、AGR)
図40 2024~2034年アテレクトミーデバイス地域別市場シェア予測 (%)
図41 血栓除去装置セグメントの地域別市場予測、2024~2034年 (10億米ドル、AGR %)
図42 血栓除去装置セグメントの地域別市場シェア予測、2024年~2034年(%)
図43 下大静脈フィルター地域別市場予測、2024~2034年 (10億米ドル、AGR %)
図 44 2024-2034 年の下大静脈フィルター地域別市場シェア予測 (%)
図45 2024~2034年の地域別永久フィルター市場予測 (10億米ドル, AGR %)
図 46 2024-2034 年地域別永久フィルター市場シェア予測 (%)
図 47 2024-2034 年における回収可能フィルターセグメントの地域別市場予測 (10 億米ドル, AGR %)
図 48 2024-2034 年における回収可能フィルターの地域別市場シェア予測 (%)
図 49 血行動態改善装置セグメントの地域別市場予測、2024~2034 年 (億米ドル、AGR %)
図 50 血行動態改善機器セグメントの地域別市場予測、2024~2034 年 (%)
図51 慢性完全閉塞装置セグメントの地域別市場予測、2024~2034年 (10億米ドル、AGR %)
図52 慢性閉塞性動脈硬化症治療機器セグメント地域別市場予測、2024年~2034年 (%)
図53 塞栓防止デバイスの地域別市場予測、2024~2034年 (10億米ドル、AGR %)
図54 塞栓防止デバイスの地域別市場シェア予測、2024~2034年 (%)
図55 その他セグメントの地域別市場展望、2024~2034年 (10億米ドル, AGR %)
図56 その他セグメントの地域別市場シェア予測、2024年&2034年(%)
図 57 2024-2034 地域別ガイドワイヤセグメント市場予測 (億米ドル, AGR %)
図58 ガイドワイヤセグメント地域別市場シェア予測、2024年&2034年(%)
図59 血管閉鎖装置セグメントの地域別市場展望、2024~2034年 (10億米ドル、AGR %)
図60 血管閉鎖装置セグメント地域別市場シェア予測、2024年&2034年(%)
図61 バルーン拡張装置セグメントの地域別市場予測、2024~2034年 (10億米ドル、AGR %)
図 62 バルーン拡張器具セグメント地域別市場シェア予測、2024 & 2034 (%)
図63 2024~2034年のイントロデューサーシース地域別市場予測 (10億米ドル, AGR %)
図64 2024~2034年地域別イントロデューサーシース市場シェア予測 (%)
図65 エンドユーザー別末梢血管機器市場市場魅力度指数
図66 エンドユーザー別末梢血管機器市場予測(2024~2034年、10億米ドル、AGR)
図67 エンドユーザー別末梢血管機器シェア予測(2024年、2029年、2034年)
図68 病院セグメントの地域別市場予測、2024~2034年(10億米ドル、AGR)
図69 地域別病院セグメント市場予測、2024年&2034年(%)
図70 外来手術センター(ASC)セグメント地域別市場予測、2024~2034年(10億米ドル、AGR)
図71 外来手術センター(ASCs)地域別市場シェア予測、2024年〜2034年 (%)
図72 その他セグメントの地域別市場予測、2024〜2034年 (10億米ドル、AGR %)
図73 その他セグメントの地域別市場シェア予測、2024年&2034年(%)
図74 2024年および2034年の臨床試験用品地域別市場予測(売上高, CAGR%)
図 75 2024年、2029年、2034年の末梢血管デバイス地域別市場シェア予測(%)
図76 2024年~2034年の地域別末梢血管機器市場予測(億米ドル, AGR%)
図77 北米末梢血管機器市場魅力度指数
図78 北米末梢血管機器地域別市場(2024年、2029年&2034年)(10億米ドル
図79 北米末梢血管機器市場の国別予測(2024~2034年、10億米ドル、AGR)
図80 北米末梢血管機器市場国別シェア予測、2024年&2034年(%)
図81 北米末梢血管デバイス製品別市場予測、2024~2034年 (10億米ドル、AGR %)
図82 北米末梢血管デバイス製品別市場展望、2024年&2034年(%)
図83 北米のステント市場タイプ別予測、2024~2034年 (10億米ドル、AGR %)
図84 北米のステント市場タイプ別シェア予測、2024年&2034年(%)
図85 北米のカテーテル市場タイプ別予測、2024~2034年 (10億米ドル、AGR %)
図86 北米カテーテル市場タイプ別シェア予測、2024年&2034年(%)
図87 北米の血管内動脈瘤修復ステントグラフト市場タイプ別予測、2024~2034年 (10億米ドル、AGR %)
図 88 北米の血管内動脈瘤修復ステントグラフト市場タイプ別シェア予測、2024 年&2034 年 (%)
図89 北米のプラーク修正デバイス市場タイプ別予測、2024~2034年 (10億米ドル、AGR %)
図90 北米のプラーク修正デバイス市場タイプ別シェア予測、2024年~2034年 (%)
図91 北米下大静脈フィルターのタイプ別市場予測、2024~2034年 (10億米ドル、AGR %)
図92 北米の下大静脈フィルター市場タイプ別シェア予測、2024年~2034年 (%)
図93 北米の血行動態改善装置市場タイプ別予測、2024~2034年 (10億米ドル、AGR %)
図94 北米血行動態改善装置市場タイプ別シェア予測、2024年~2034年 (%)
図95 北米のその他市場タイプ別予測、2024〜2034年 (10億米ドル, AGR %)
図96 北米のその他市場タイプ別シェア予測、2024年 & 2034年 (%)
図97 北米の末梢血管デバイス市場:エンドユーザー別予測、2024〜2034年 (10億米ドル、AGR %)
図98 北米末梢血管機器市場のエンドユーザー別予測、2024年~2034年(%)
図99 米国末梢血管機器市場予測、2024~2034年 (10億米ドル、AGR %)
図100 カナダ末梢血管機器市場予測、2024~2034年 (10億米ドル、AGR %)
図101 欧州末梢血管機器市場魅力度指数
図102 欧州末梢血管機器地域別市場(2024年、2029年&2034年)(10億米ドル
図103 欧州末梢血管機器市場の国別予測(2024~2034年、10億米ドル、AGR)
図104 欧州末梢血管機器市場国別シェア予測、2024年&2034年(%)
図105 欧州末梢血管デバイス製品別市場予測、2024~2034年 (10億米ドル、AGR %)
図106 欧州末梢血管用デバイスの製品別市場展望、2024年~2034年 (%)
図107 欧州のステント市場タイプ別予測、2024~2034年 (10億米ドル, AGR %)
図108 欧州ステント市場タイプ別シェア予測、2024年~2034年 (%)
図109 欧州カテーテル市場タイプ別予測、2024~2034年 (10億米ドル、AGR %)
図110 欧州カテーテル市場タイプ別シェア予測、2024年~2034年 (%)
図111 欧州血管内動脈瘤修復ステントグラフト市場タイプ別予測、2024~2034年 (10億米ドル、AGR %)
図112 欧州血管内動脈瘤修復ステントグラフト市場タイプ別シェア予測、2024年&2034年 (%)
図113 欧州プラーク修正デバイス市場タイプ別予測、2024~2034年 (10億米ドル、AGR %)
図114 欧州プラーク修正デバイス市場タイプ別シェア予測、2024年~2034年 (%)
図115 欧州下大静脈フィルターのタイプ別市場予測、2024~2034年 (10億米ドル、AGR %)
図 116 欧州下大静脈フィルター市場タイプ別シェア予測、2024年~2034年 (%)
図117 欧州血行動態改善装置市場タイプ別予測、2024~2034年 (10億米ドル、AGR %)
図 118 欧州血行動態改善装置のタイプ別市場展望 2024-2034 (%)
図119 欧州その他市場タイプ別予測、2024〜2034年 (10億米ドル、AGR %)
図120 欧州その他市場タイプ別シェア予測、2024年〜2034年 (%)
図121 欧州末梢血管デバイス市場エンドユーザー別予測、2024〜2034年 (10億米ドル、AGR %)
図122 欧州末梢血管機器市場エンドユーザー別シェア予測、2024年~2034年 (%)
図123 ドイツ末梢血管機器市場予測、2024~2034年 (10億米ドル、AGR %)
図124 イギリス末梢血管機器市場予測、2024~2034年 (10億米ドル, AGR %)
図125 フランス末梢血管デバイス市場予測、2024~2034年 (10億米ドル, AGR %)
図126 イタリア末梢血管デバイス市場予測、2024~2034年 (10億米ドル、AGR %)
図127 スペイン末梢血管機器市場の予測、2024~2034年 (10億米ドル, AGR %)
図128 ロシア末梢血管機器市場予測、2024~2034年 (10億米ドル、AGR %)
図129 その他のヨーロッパの末梢血管機器市場予測、2024~2034年 (10億米ドル、AGR %)
図130 アジア末梢血管機器市場魅力度指数
図131 アジアの末梢血管機器市場(地域別):2024年、2029年&2034年(10億米ドル
図132 アジア末梢血管機器市場の国別予測(2024~2034年、10億米ドル、AGR)
図133 アジア末梢血管機器市場国別シェア予測、2024年~2034年(%)
図134 アジア太平洋地域の末梢血管用デバイスの製品別市場予測、2024~2034年 (10億米ドル、AGR %)
図135 アジア太平洋地域の末梢血管用デバイスの製品別市場展望、2024年~2034年 (%)
図136 アジア太平洋地域のステント市場タイプ別予測、2024~2034年 (10億米ドル、AGR %)
図137 アジア太平洋地域のステント市場タイプ別シェア予測、2024年~2034年 (%)
図138 アジア太平洋地域のカテーテル市場タイプ別予測、2024~2034年 (10億米ドル、AGR %)
図139 アジア太平洋地域のカテーテル市場タイプ別シェア予測、2024年~2034年(%)
図140 アジア太平洋地域の血管内動脈瘤修復ステントグラフトのタイプ別市場予測、2024~2034年 (10億米ドル、AGR %)
図141 アジア太平洋地域の血管内動脈瘤修復ステントグラフト市場タイプ別シェア予測、2024年〜2034年 (%)
図142 アジア太平洋地域のプラーク修正デバイスのタイプ別市場予測、2024~2034年 (10億米ドル、AGR %)
図143 アジア太平洋地域のプラーク修正装置市場タイプ別シェア予測、2024年~2034年 (%)
図144 アジア太平洋地域の下大静脈フィルターのタイプ別市場予測、2024~2034年 (10億米ドル、AGR %)
図145 アジア太平洋地域の下大静脈フィルター市場タイプ別シェア予測、2024年 & 2034年 (%)
図146 アジア太平洋地域の血行動態改善装置市場タイプ別予測、2024~2034年 (10億米ドル、AGR %)
図147 アジア太平洋地域の血行動態改善装置市場タイプ別シェア予測、2024年~2034年 (%)
図148 アジア太平洋地域のその他市場タイプ別予測、2024〜2034年 (10億米ドル、AGR %)
図149 アジア太平洋地域のその他市場タイプ別シェア予測、2024年 & 2034年 (%)
図150 アジア太平洋地域の末梢血管デバイス市場:エンドユーザー別予測(2024-2034年) (10億米ドル、AGR %)
図151 アジア太平洋地域の末梢血管機器市場エンドユーザー別シェア予測、2024年~2034年 (%)
図152 日本末梢血管機器市場予測、2024~2034年 (10億米ドル、AGR %)
図153 中国末梢血管機器市場予測、2024~2034年 (10億米ドル、AGR %)
図154 インド末梢血管機器市場の予測、2024~2034年 (10億米ドル, AGR %)
図155 オーストラリア末梢血管機器市場の予測、2024~2034年 (10億米ドル, AGR %)
図156 韓国末梢血管デバイス市場予測、2024~2034年 (10億米ドル、AGR %)
図 157 その他のアジアの末梢血管機器市場予測、2024~2034年 (10億米ドル、AGR %)
図158 中南米末梢血管機器市場魅力度指数
図159 中南米の地域別末梢血管機器市場(2024年、2029年&2034年)(10億米ドル
図160 ラテンアメリカの末梢血管機器国別市場予測(2024~2034年、10億米ドル、AGR)
図161 中南米末梢血管機器市場国別シェア予測、2024年&2034年(%)
図162 中南米末梢血管用デバイスの製品別市場予測、2024~2034年 (10億米ドル、AGR %)
図163 中南米の末梢血管用デバイス市場製品別シェア予測、2024年~2034年 (%)
図164 中南米のステント市場タイプ別予測、2024~2034年 (10億米ドル, AGR %)
図165 中南米のステント市場タイプ別シェア予測、2024年&2034年(%)
図166 中南米のカテーテル市場タイプ別予測、2024~2034年 (10億米ドル, AGR %)
図167 中南米のカテーテル市場タイプ別シェア予測、2024年~2034年 (%)
図168 中南米の血管内動脈瘤修復ステントグラフト市場タイプ別予測、2024~2034年 (10億米ドル, AGR %)
図169 中南米の血管内動脈瘤修復ステントグラフト市場タイプ別シェア予測、2024年・2034年 (%)
図170 中南米のプラーク修正デバイス市場タイプ別予測、2024~2034年 (10億米ドル、AGR %)
図171 中南米のプラーク修正装置市場タイプ別シェア予測、2024年~2034年 (%)
図172 中南米の下大静脈フィルター市場タイプ別予測、2024~2034年 (10億米ドル, AGR %)
図173 中南米の下大静脈フィルター市場タイプ別シェア予測、2024年~2034年 (%)
図174 中南米の血行動態改善装置市場タイプ別予測、2024~2034年 (10億米ドル、AGR %)
図175 中南米の血行動態改善装置市場タイプ別シェア予測、2024年~2034年 (%)
図176 中南米のその他市場タイプ別予測、2024〜2034年 (10億米ドル, AGR %)
図177 中南米のその他市場タイプ別シェア予測、2024年 & 2034年 (%)
図178 中南米の末梢血管デバイス市場:エンドユーザー別予測(2024-2034) (10億米ドル, AGR %)
図179 中南米末梢血管機器市場のエンドユーザー別予測、2024年~2034年(%)
図180 ブラジル末梢血管機器市場予測、2024~2034年 (10億米ドル、AGR %)
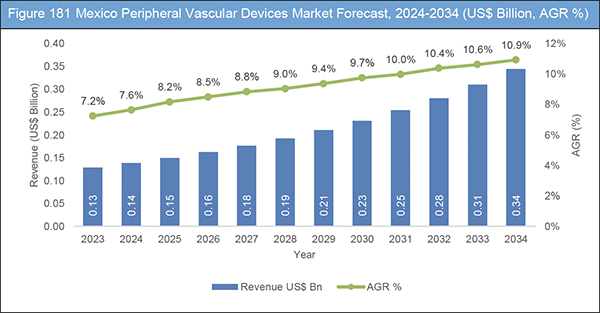
図181 メキシコ末梢血管機器市場予測、2024~2034年 (10億米ドル、AGR %)
図182 アルゼンチン末梢血管機器市場予測、2024~2034年 (10億米ドル、AGR %)
図183 その他の中南米末梢血管機器市場予測、2024~2034年 (10億米ドル、AGR %)
図184 MEA末梢血管機器市場魅力度指数
図185 MEA末梢血管機器地域別市場(2024年、2029年&2034年)(10億米ドル
図186 MEA末梢血管機器市場の国別予測:2024~2034年(10億米ドル、AGR)
図187 MEA末梢血管用デバイスの国別市場予測、2024年~2034年(%)
図188 MEA末梢血管用デバイスの製品別市場予測、2024~2034年 (10億米ドル、AGR %)
図189 MEAの末梢血管用デバイス市場製品別シェア予測、2024年~2034年 (%)
図190 MEAのステント市場タイプ別予測、2024~2034年 (10億米ドル, AGR %)
図191 MEAのステント市場タイプ別シェア予測、2024年~2034年 (%)
図192 MEAカテーテル市場のタイプ別予測、2024~2034年 (10億米ドル, AGR %)
図193 MEAカテーテル市場タイプ別シェア予測、2024年~2034年(%)
図194 MEA血管内動脈瘤修復ステントグラフトのタイプ別市場予測、2024~2034年 (10億米ドル, AGR %)
図195 MEA血管内動脈瘤修復ステントグラフトのタイプ別市場シェア予測、2024年・2034年 (%)
図196 MEAプラーク修正デバイスのタイプ別市場予測、2024~2034年 (10億米ドル、AGR %)
図197 MEAプラーク修正装置のタイプ別市場予測、2024年~2034年 (%)
図198 MEA下大静脈フィルターのタイプ別市場予測(2024~2034年) (10億米ドル, AGR %)
図199 MEA下大静脈フィルターのタイプ別市場シェア予測、2024年~2034年 (%)
図200 MEA血行動態改善装置のタイプ別市場予測、2024~2034年 (10億米ドル、AGR %)
図201 MEA血行動態改善装置市場タイプ別シェア予測、2024年~2034年 (%)
図202 MEAその他の市場タイプ別予測、2024-2034年 (10億米ドル, AGR %)
図203 MEAその他の市場タイプ別シェア予測、2024年 & 2034年 (%)
図204 MEAの末梢血管用デバイス市場:エンドユーザー別予測(2024-2034年) (10億米ドル, AGR %)
図205 MEA末梢血管機器市場のエンドユーザー別予測、2024年~2034年 (%)
図206 GCC周辺血管機器市場予測、2024~2034年 (10億米ドル、AGR %)
図207 南アフリカの末梢血管機器市場予測、2024~2034年 (10億米ドル、AGR %)
図208 MEA残りの地域の末梢血管機器市場予測、2024-2034年 (10億米ドル、AGR %)
図209 末梢血管機器市場:企業シェア(2023年
図210 ベクトン・ディッキンソン・アンド・カンパニー(BD):純収入、2018年~2023年(百万米ドル、AGR)
図211 ベクトン・ディッキンソン アンド カンパニー(BD):R&D、2018年~2023年(百万米ドル、AGR)
図 212 ベクトン・ディッキンソン アンド カンパニー(BD):地域別市場シェア(2023年
図 213 ボストン・サイエンティフィック・コーポレーション純収入、2018年~2023年(百万米ドル、AGR)
図 214 ボストン・サイエンティフィック・コーポレーションR&D、2018年~2023年(百万米ドル、AGR)
図 215 ボストン・サイエンティフィック・コーポレーション地域別市場シェア(2023年
図 216 アボット・ラボラトリーズ:純収入、2018年~2023年(百万米ドル、AGR)
図 217 アボット・ラボラトリーズ研究開発費、2018年~2023年(百万米ドル、AGR)
図218 アボット・ラボラトリーズ:地域別市場シェア(2023年
図 219 メドトロニック Plc:純収入、2018年~2023年(百万米ドル、AGR)
図 220 メドトロニック Plc:R&D、2018年~2023年(百万米ドル、AGR)
図 221 メドトロニック Plc:地域別市場シェア(2023年
図222 ゲティンゲAB:純収入、2018年~2023年(百万米ドル、AGR)
図223 ゲティンゲAB:R&D、2018-2023年(百万米ドル、AGR)
図224 ゲティンゲAB:地域別市場シェア、2023年
図 225 カーディナル・ヘルス社純収入、2018年~2023年(百万米ドル、AGR)
図 226 Cardinal Health, Inc:地域別市場シェア、2023年
図 227 テルモ・コーポレーション純収入、2018年~2023年(百万米ドル、AGR)
図 228 テルモ・コーポレーション地域別市場シェア、2023年
図 229 Koninklijke Philips N.V.:純収入、2018年~2023年(百万米ドル、AGR)
図 230 Koninklijke Philips N.V:R&D、2018年~2023年(百万米ドル、AGR)
図 231 Koninklijke Philips N.V:地域別市場シェア(2023年
図232 B. Braun SE:純収入、2018年~2023年(百万米ドル、AGR)
図233 B. Braun SE: R&D, 2018-2023 (US$ Million, AGR%)
図234 B. Braun SE:地域別市場シェア(2023年
図 235 ペナンブラ社純収入、2018年~2023年(百万米ドル、AGR)
図 236 Penumbra Inc:R&D、2018年~2023年(百万米ドル、AGR)
図 237 Penumbra Inc:地域別市場シェア、2023年
図 238 Merit Medical Systems, Inc:純収入、2018年~2023年(百万米ドル、AGR)
図 239 Merit Medical Systems, Inc:R&D、2018年-2023年(百万米ドル、AGR)
図 240 Merit Medical Systems, Inc:地域別市場シェア、2023年
ページTOPに戻る
Summary
Report Details
The Peripheral Vascular Devices Market Report 2024-2034: This report will prove invaluable to leading firms striving for new revenue pockets if they wish to better understand the industry and its underlying dynamics. It will be useful for companies that would like to expand into different industries or to expand their existing operations in a new region.
R&D Investments Projected to Drive Industry Growth
Market participants are engaging in R&D investment to manufacture innovative peripheral vascular devices, aiming to enhance their effectiveness and safety while also raising public awareness through the introduction of new technologies and treatments. For instance, in March 2024, Medtronic expanded its Medtronic Engineering and Innovation Center (MEIC) in Hyderabad as part of its commitment to invest over $350 million over five years. This investment is intended to bolster the research and development capabilities of the center and increase its workforce from approximately 950 employees to 1,500. On 1st December 2023, BIOTRONIK unveiled the inauguration of its latest Asia Pacific Manufacturing and Research Hub. Spanning 20,000 m², the site is designated as the primary center for BIOTRONIK’s operations including manufacturing, R&D, and sales & marketing in the Asia Pacific region. This new facility will contribute expertise across various therapy domains, including interventional cardiology, peripheral interventions, cardiac rhythm management, endoscopy, neuromodulation, and urology and pelvic health, thereby strengthening Boston Scientific’s presence and capabilities in India.
Product Recall Likely to Challenge Industry Growth
The market growth of peripheral vascular devices has been significantly hampered by product recalls, eroding consumer trust, heightening regulatory scrutiny, imposing financial burdens on manufacturers, and intensifying market competition. In 2023, Cordis US Corp recalled the INFINITI Angiographic Catheter due to shipment without proper sterilization procedures, while Terumo Aortic recalled specific lots of the TREO Abdominal Stent-Graft Systems due to potential issues with graft sizes. Similarly, in April 2024, the FDA issued a Class I Recall for 330,000 Radial Artery Catheterization Kits manufactured by Teleflex and Arrow International. A total of 334,995 affected devices were distributed between December 2021 and January 2024.
These recalls undermine confidence in affected brands or product categories, leading to decreased demand and reluctance to use similar devices among patients and healthcare providers. Regulatory agencies may impose stricter approval requirements, slowing down the entry of new products into the market. Manufacturers incur significant costs related to recalls, investigations, and compensating affected individuals, impacting profitability and research and development investments. Competitors may seize the opportunity to gain market share by offering perceived safer alternatives, heightening competition within the peripheral vascular devices market.
What Questions Should You Ask before Buying a Market Research Report?
-
How is the peripheral vascular devices market evolving?
-
What is driving and restraining the peripheral vascular devices market?
-
How will each peripheral vascular devices submarket segment grow over the forecast period and how much revenue will these submarkets account for in 2034?
-
How will the market shares for each peripheral vascular devices submarket develop from 2024 to 2034?
-
What will be the main driver for the overall market from 2024 to 2034?
-
Will leading peripheral vascular devices markets broadly follow the macroeconomic dynamics, or will individual national markets outperform others?
-
How will the market shares of the national markets change by 2034 and which geographical region will lead the market in 2034?
-
Who are the leading players and what are their prospects over the forecast period?
-
What are the peripheral vascular devices projects for these leading companies?
-
How will the industry evolve during the period between 2024 and 2034? What are the implications of peripheral vascular devices projects taking place now and over the next 10 years?
-
Is there a greater need for product commercialisation to further scale the peripheral vascular devices market?
-
Where is the peripheral vascular devices market heading and how can you ensure you are at the forefront of the market?
-
What are the best investment options for new product and service lines?
-
What are the key prospects for moving companies into a new growth path and C-suite?
You need to discover how this will impact the peripheral vascular devices market today, and over the next 10 years:
-
Our 325-page report provides 150 tables and 240 charts/graphs exclusively to you.
-
The report highlights key lucrative areas in the industry so you can target them – NOW.
-
It contains in-depth analysis of global, regional and national sales and growth.
-
It highlights for you the key successful trends, changes and revenue projections made by your competitors.
This report tells you TODAY how the peripheral vascular devices market will develop in the next 10 years, and in line with the variations in COVID-19 economic recession and bounce. This market is more critical now than at any point over the last 10 years.
Forecasts to 2034 and other analyses reveal commercial prospects
-
In addition to revenue forecasting to 2034, our new study provides you with recent results, growth rates, and market shares.
-
You will find original analyses, with business outlooks and developments.
-
Discover qualitative analyses (including market dynamics, drivers, opportunities, restraints and challenges), cost structure, impact of rising peripheral vascular devices prices and recent developments.
This report includes data analysis and invaluable insight into how COVID-19 will affect the industry and your company. Four COVID-19 recovery patterns and their impact, namely, “V”, “L”, “W” and “U” are discussed in this report.
Segments Covered in the Report
Product
-
Stents: Bare Metal Stents, Drug-eluting Stents
-
PTA Balloons
-
Catheters: Angiography Catheters, IVUS/OCT Catheters, Guiding Catheters
-
Endovascular Aneurysm Repair Stent Grafts: Thoracic Endovascular Aneurysm Stent Grafts, Abdominal Endovascular Aneurysm Stent Grafts
-
Plaque Modification Devices: Atherectomy Devices, Thrombectomy Devices
-
Inferior Vena Cava Filters: Permanent Filters, Retrievable Filters
-
Hemodynamic Flow Alteration Devices: Chronic Total Occlusion Devices, Embolic Protection Devices
-
Others: Guidewires, Vascular Closure Devices, Balloon Inflation Devices, Introducer Sheaths
End-users
-
Hospitals
-
Ambulatory Surgical Centers (ASCs)
-
Others
In addition to the revenue predictions for the overall world market and segments, you will also find revenue forecasts for five regional and 22 leading national markets:
North America
Europe
-
Germany
-
UK
-
France
-
Spain
-
Italy
-
Russia
-
Rest of Europe
Asia Pacific
-
China
-
Japan
-
India
-
Australia
-
South Korea
-
Rest of Asia Pacific
Latin America
-
Brazil
-
Mexico
-
Argentina
-
Rest of Latin America
MEA
-
GCC
-
South Africa
-
Rest of MEA
The report also includes profiles and for some of the leading companies in the Peripheral Vascular Devices Market, 2024 to 2034, with a focus on this segment of these companies’ operations.
Leading companies and the potential for market growth
-
Abbott Laboratories
-
B. Braun SE
-
Becton, Dickinson and Company
-
Biotronik SE & Co KG
-
Boston Scientific Corporation
-
Cardinal Health, Inc.
-
Cook Group, Inc.
-
Cordis Corp.
-
Getinge AB
-
Koninklijke Philips N.V.
-
Kyoto Medical Planning Co., Ltd.
-
Medtronic plc
-
Merit Medical Systems, Inc.
-
Penumbra Inc.
-
Terumo Corporation
Overall world revenue for Peripheral Vascular Devices Market, 2024 to 2034 in terms of value the market will surpass US$12.0 billion in 2024, our work calculates. We predict strong revenue growth through to 2034. Our work identifies which organizations hold the greatest potential. Discover their capabilities, progress, and commercial prospects, helping you stay ahead.
How will the Peripheral Vascular Devices Market, 2024 to 2034 report help you?
In summary, our 320+ page report provides you with the following knowledge:
-
Revenue forecasts to 2034 for Peripheral Vascular Devices Market, 2024 to 2034, with forecasts for product and end-users, each forecast at a global and regional level – discover the industry’s prospects, finding the most lucrative places for investments and revenues.
-
Revenue forecasts to 2034 for five regional and 22 key national markets – See forecasts for the Peripheral Vascular Devices Market, 2024 to 2034 market in North America, Europe, Asia Pacific, Latin America, and MEA. Also includes forecast for the market in the U.S., Canada, Mexico, Brazil, Germany, France, UK, Italy, China, India, Japan, and Australia among other prominent economies.
-
Prospects for established firms and those seeking to enter the market – including company profiles for 15 of the major companies involved in the Peripheral Vascular Devices Market, 2024 to 2034.
Find quantitative and qualitative analyses with independent predictions. Receive information that only our report contains, staying informed with invaluable business intelligence.
Information found nowhere else
With our new report, you are less likely to fall behind in knowledge or miss out on opportunities. See how our work could benefit your research, analyses, and decisions. Visiongain’s study is for everybody needing commercial analyses for the Peripheral Vascular Devices Market, 2024 to 2034, market-leading companies. You will find data, trends and predictions.
ページTOPに戻る
Table of Contents
1 Report Overview
1.1 Objectives of the Study
1.2 Introduction to Peripheral Vascular Devices Market
1.3 What This Report Delivers
1.4 Why You Should Read This Report
1.5 Key Questions Answered by This Analytical Report
1.6 Who is This Report for?
1.7 Methodology
1.7.1 Market Definitions
1.7.2 Market Evaluation & Forecasting Methodology
1.7.3 Data Validation
1.7.3.1 Primary Research
1.7.3.2 Secondary Research
1.8 Frequently Asked Questions (FAQs)
1.9 Associated Visiongain Reports
1.10 About Visiongain
2 Executive Summary
3 Market Overview
3.1 Key Findings
3.2 Market Dynamics
3.2.1 Market Driving Factors
3.2.1.1 Reimbursement for Peripheral Vascular Procedures
3.2.1.2 Rising Prevalence of Diabetic and Obesity Population is Driving the Market
3.2.1.3 Increasing Demand for Minimally Invasive Procedures
3.2.1.4 Rising Geriatric Population
3.2.2 Market Restraining Factors
3.2.2.1 Product Recalls Likely to Restrain Industry Growth
3.2.2.2 Stringent Regulations Limit the Market Growth
3.2.2.3 High Cost of Peripheral Vascular Devices Restraining the Market Growth
3.2.2.4 Availability of Substitute Treatments
3.2.3 Market Opportunities
3.2.3.1 Technological Advancements
3.2.3.2 New Product Launches is Expected to Drive the Market in Near Future
3.2.3.3 Increasing R&D Activities for Novel Device Launch
3.2.3.4 Growing Awareness and Access to Healthcare
3.3 COVID-19 Impact Analysis
3.4 Porter’s Five Forces Analysis
3.4.1 Bargaining Power of Suppliers
3.4.2 Bargaining Power of Buyers
3.4.3 Competitive Rivalry
3.4.4 Threat of Substitutes
3.4.5 Threat of New Entrants
3.5 PEST Analysis
4 Peripheral Vascular Devices Market Analysis by Product
4.1 Key Findings
4.2 Product Segment: Market Attractiveness Index
4.3 Peripheral Vascular Devices Market Size Estimation and Forecast by Product
4.4 Stents
4.4.1 Market Size by Region, 2024-2034 (US$ Billion)
4.4.2 Market Share by Region, 2024 & 2034 (%)
4.4.3 Bare Metal Stents
4.4.3.1 Market Size by Region, 2024-2034 (US$ Billion)
4.4.3.2 Market Share by Region, 2024 & 2034 (%)
4.4.4 Drug-eluting Stents
4.4.4.1 Market Size by Region, 2024-2034 (US$ Billion)
4.4.4.2 Market Share by Region, 2024 & 2034 (%)
4.5 PTA Balloons
4.5.1 Market Size by Region, 2024-2034 (US$ Billion)
4.5.2 Market Share by Region, 2024 & 2034 (%)
4.6 Catheters
4.6.1 Market Size by Region, 2024-2034 (US$ Billion)
4.6.2 Market Share by Region, 2024 & 2034 (%)
4.6.3 Angiography Catheters
4.6.3.1 Market Size by Region, 2024-2034 (US$ Billion)
4.6.3.2 Market Share by Region, 2024 & 2034 (%)
4.6.4 IVUS/OCT Catheters
4.6.4.1 Market Size by Region, 2024-2034 (US$ Billion)
4.6.4.2 Market Share by Region, 2024 & 2034 (%)
4.6.5 Guiding Catheters
4.6.5.1 Market Size by Region, 2024-2034 (US$ Billion)
4.6.5.2 Market Share by Region, 2024 & 2034 (%)
4.7 Endovascular Aneurysm Repair Stent Grafts
4.7.1 Market Size by Region, 2024-2034 (US$ Billion)
4.7.2 Market Share by Region, 2024 & 2034 (%)
4.7.3 Thoracic Endovascular Aneurysm Stent Grafts
4.7.3.1 Market Size by Region, 2024-2034 (US$ Billion)
4.7.3.2 Market Share by Region, 2024 & 2034 (%)
4.7.4 Abdominal Endovascular Aneurysm Stent Grafts
4.7.4.1 Market Size by Region, 2024-2034 (US$ Billion)
4.7.4.2 Market Share by Region, 2024 & 2034 (%)
4.8 Plaque Modification Devices
4.8.1 Market Size by Region, 2024-2034 (US$ Billion)
4.8.2 Market Share by Region, 2024 & 2034 (%)
4.8.3 Atherectomy Devices
4.8.3.1 Market Size by Region, 2024-2034 (US$ Billion)
4.8.3.2 Market Share by Region, 2024 & 2034 (%)
4.8.4 Thrombectomy Devices
4.8.4.1 Market Size by Region, 2024-2034 (US$ Billion)
4.8.4.2 Market Share by Region, 2024 & 2034 (%)
4.9 Inferior Vena Cava Filters
4.9.1 Market Size by Region, 2024-2034 (US$ Billion)
4.9.2 Market Share by Region, 2024 & 2034 (%)
4.9.3 Permanent Filters
4.9.3.1 Market Size by Region, 2024-2034 (US$ Billion)
4.9.3.2 Market Share by Region, 2024 & 2034 (%)
4.9.4 Retrievable Filters
4.9.4.1 Market Size by Region, 2024-2034 (US$ Billion)
4.9.4.2 Market Share by Region, 2024 & 2034 (%)
4.10 Hemodynamic Flow Alteration Devices
4.10.1 Market Size by Region, 2024-2034 (US$ Billion)
4.10.2 Market Share by Region, 2024 & 2034 (%)
4.10.3 Chronic Total Occlusion Devices
4.10.3.1 Market Size by Region, 2024-2034 (US$ Billion)
4.10.3.2 Market Share by Region, 2024 & 2034 (%)
4.10.4 Embolic Protection Devices
4.10.4.1 Market Size by Region, 2024-2034 (US$ Billion)
4.10.4.2 Market Share by Region, 2024 & 2034 (%)
4.11 Others
4.11.1 Market Size by Region, 2024-2034 (US$ Billion)
4.11.2 Market Share by Region, 2024 & 2034 (%)
4.11.3 Guidewires
4.11.3.1 Market Size by Region, 2024-2034 (US$ Billion)
4.11.3.2 Market Share by Region, 2024 & 2034 (%)
4.11.4 Vascular Closure Devices
4.11.4.1 Market Size by Region, 2024-2034 (US$ Billion)
4.11.4.2 Market Share by Region, 2024 & 2034 (%)
4.11.5 Balloon Inflation Devices
4.11.5.1 Market Size by Region, 2024-2034 (US$ Billion)
4.11.5.2 Market Share by Region, 2024 & 2034 (%)
4.11.6 Introducer Sheaths
4.11.6.1 Market Size by Region, 2024-2034 (US$ Billion)
4.11.6.2 Market Share by Region, 2024 & 2034 (%)
5 Peripheral Vascular Devices Market Analysis by End-users
5.1 Key Findings
5.2 End-user Segment: Market Attractiveness Index
5.3 Peripheral Vascular Devices Market Size Estimation and Forecast by End-users
5.4 Hospitals
5.4.1 Market Size by Region, 2024-2034 (US$ Billion)
5.4.2 Market Share by Region, 2024 & 2034 (%)
5.5 Ambulatory Surgical Centers (ASCs)
5.5.1 Market Size by Region, 2024-2034 (US$ Billion)
5.5.2 Market Share by Region, 2024 & 2034 (%)
5.6 Others
5.6.1 Market Size by Region, 2024-2034 (US$ Billion)
5.6.2 Market Share by Region, 2024 & 2034 (%)
6 Peripheral Vascular Devices Market Analysis by Region
6.1 Key Findings
6.2 Regional Market Size Estimation and Forecast
7 North America Peripheral Vascular Devices Market Analysis
7.1 Key Findings
7.2 North America Peripheral Vascular Devices Market Attractiveness Index
7.3 North America Peripheral Vascular Devices Market by Country, 2024, 2029 & 2034 (US$ Billion)
7.4 North America Peripheral Vascular Devices Market Size Estimation and Forecast by Country
7.5 North America Peripheral Vascular Devices Market Size Estimation and Forecast by Product
7.5.1 North America Stents Market Size Estimation and Forecast by Type
7.5.2 North America Catheters Market Size Estimation and Forecast by Type
7.5.3 North America Endovascular Aneurysm Repair Stent Grafts Market Size Estimation and Forecast by Type
7.5.4 North America Plaque Modification Devices Market Size Estimation and Forecast by Type
7.5.5 North America Inferior Vena Cava Filters Market Size Estimation and Forecast by Type
7.5.6 North America Hemodynamic Flow Alteration Devices Market Size Estimation and Forecast by Type
7.5.7 North America Others Market Size Estimation and Forecast by Type
7.6 North America Peripheral Vascular Devices Market Size Estimation and Forecast by End-users
7.7 U.S. Peripheral Vascular Devices Market Analysis
7.8 Canada Peripheral Vascular Devices Market Analysis
8 Europe Peripheral Vascular Devices Market Analysis
8.1 Key Findings
8.2 Europe Peripheral Vascular Devices Market Attractiveness Index
8.3 Europe Peripheral Vascular Devices Market by Country, 2024, 2029 & 2034 (US$ Billion)
8.4 Europe Peripheral Vascular Devices Market Size Estimation and Forecast by Country
8.5 Europe Peripheral Vascular Devices Market Size Estimation and Forecast by Product
8.5.1 Europe Stents Market Size Estimation and Forecast by Type
8.5.2 Europe Catheters Market Size Estimation and Forecast by Type
8.5.3 Europe Endovascular Aneurysm Repair Stent Grafts Market Size Estimation and Forecast by Type
8.5.4 Europe Plaque Modification Devices Market Size Estimation and Forecast by Type
8.5.5 Europe Inferior Vena Cava Filters Market Size Estimation and Forecast by Type
8.5.6 Europe Hemodynamic Flow Alteration Devices Market Size Estimation and Forecast by Type
8.5.7 Europe Others Market Size Estimation and Forecast by Type
8.6 Europe Peripheral Vascular Devices Market Size Estimation and Forecast by End-users
8.7 Germany Peripheral Vascular Devices Market Analysis
8.8 UK Peripheral Vascular Devices Market Analysis
8.9 France Peripheral Vascular Devices Market Analysis
8.10 Italy Peripheral Vascular Devices Market Analysis
8.11 Spain Peripheral Vascular Devices Market Analysis
8.12 Russia Peripheral Vascular Devices Market Analysis
8.13 Rest of Europe Peripheral Vascular Devices Market Analysis
9 Asia Peripheral Vascular Devices Market Analysis
9.1 Key Findings
9.2 Asia Peripheral Vascular Devices Market Attractiveness Index
9.3 Asia Peripheral Vascular Devices Market by Country, 2024, 2029 & 2034 (US$ Billion)
9.4 Asia Peripheral Vascular Devices Market Size Estimation and Forecast by Country
9.5 Asia Pacific Peripheral Vascular Devices Market Size Estimation and Forecast by Product
9.5.1 Asia Pacific Stents Market Size Estimation and Forecast by Type
9.5.2 Asia Pacific Catheters Market Size Estimation and Forecast by Type
9.5.3 Asia Pacific Endovascular Aneurysm Repair Stent Grafts Market Size Estimation and Forecast by Type
9.5.4 Asia Pacific Plaque Modification Devices Market Size Estimation and Forecast by Type
9.5.5 Asia Pacific Inferior Vena Cava Filters Market Size Estimation and Forecast by Type
9.5.6 Asia Pacific Hemodynamic Flow Alteration Devices Market Size Estimation and Forecast by Type
9.5.7 Asia Pacific Others Market Size Estimation and Forecast by Type
9.6 Asia Pacific Peripheral Vascular Devices Market Size Estimation and Forecast by End-users
9.7 Japan Peripheral Vascular Devices Market Analysis
9.8 China Peripheral Vascular Devices Market Analysis
9.9 India Peripheral Vascular Devices Market Analysis
9.10 Australia Peripheral Vascular Devices Market Analysis
9.11 South Korea Peripheral Vascular Devices Market Analysis
9.12 Rest of Asia Peripheral Vascular Devices Market Analysis
10 Latin America Peripheral Vascular Devices Market Analysis
10.1 Key Findings
10.2 Latin America Peripheral Vascular Devices Market Attractiveness Index
10.3 Latin America Peripheral Vascular Devices Market by Country, 2024, 2029 & 2034 (US$ Billion)
10.4 Latin America Peripheral Vascular Devices Market Size Estimation and Forecast by Country
10.5 Latin America Peripheral Vascular Devices Market Size Estimation and Forecast by Product
10.5.1 Latin America Stents Market Size Estimation and Forecast by Type
10.5.2 Latin America Catheters Market Size Estimation and Forecast by Type
10.5.3 Latin America Endovascular Aneurysm Repair Stent Grafts Market Size Estimation and Forecast by Type
10.5.4 Latin America Plaque Modification Devices Market Size Estimation and Forecast by Type
10.5.5 Latin America Inferior Vena Cava Filters Market Size Estimation and Forecast by Type
10.5.6 Latin America Hemodynamic Flow Alteration Devices Market Size Estimation and Forecast by Type
10.5.7 Latin America Others Market Size Estimation and Forecast by Type
10.6 Latin America Peripheral Vascular Devices Market Size Estimation and Forecast by End-users
10.7 Brazil Peripheral Vascular Devices Market Analysis
10.8 Mexico Peripheral Vascular Devices Market Analysis
10.9 Argentina Peripheral Vascular Devices Market Analysis
10.10 Rest of Latin America Peripheral Vascular Devices Market Analysis
11 MEA Peripheral Vascular Devices Market Analysis
11.1 Key Findings
11.2 MEA Peripheral Vascular Devices Market Attractiveness Index
11.3 MEA Peripheral Vascular Devices Market by Country, 2024, 2029 & 2034 (US$ Billion)
11.4 MEA Peripheral Vascular Devices Market Size Estimation and Forecast by Country
11.5 MEA Peripheral Vascular Devices Market Size Estimation and Forecast by Product
11.5.1 MEA Stents Market Size Estimation and Forecast by Type
11.5.2 MEA Catheters Market Size Estimation and Forecast by Type
11.5.3 MEA Endovascular Aneurysm Repair Stent Grafts Market Size Estimation and Forecast by Type
11.5.4 MEA Plaque Modification Devices Market Size Estimation and Forecast by Type
11.5.5 MEA Inferior Vena Cava Filters Market Size Estimation and Forecast by Type
11.5.6 MEA Hemodynamic Flow Alteration Devices Market Size Estimation and Forecast by Type
11.5.7 MEA Others Market Size Estimation and Forecast by Type
11.6 MEA Peripheral Vascular Devices Market Size Estimation and Forecast by End-users
11.7 GCC Peripheral Vascular Devices Market Analysis
11.8 South Africa Peripheral Vascular Devices Market Analysis
11.9 Rest of MEA Peripheral Vascular Devices Market Analysis
12 Company Profiles
12.1 Competitive Landscape, 2023
12.2 Strategic Outlook
12.3 Becton Dickinson and Co. (BD)
12.3.1 Company Snapshot
12.3.2 Company Overview
12.3.3 Financial Analysis
12.3.3.1 Net Revenue, 2018-2023
12.3.3.2 R&D, 2018-2023
12.3.3.3 Regional Market Shares, 2023
12.3.4 Product Benchmarking
12.3.5 Strategic Outlook
12.4 Cook Group, Inc.
12.4.1 Company Snapshot
12.4.2 Company Overview
12.4.3 Product Benchmarking
12.4.4 Strategic Outlook
12.5 Boston Scientific Corporation
12.5.1 Company Snapshot
12.5.2 Company Overview
12.5.3 Financial Analysis
12.5.3.1 Net Revenue, 2018-2023
12.5.3.2 R&D, 2018-2023
12.5.3.3 Regional Market Shares, 2023
12.5.4 Product Benchmarking
12.5.5 Strategic Outlook
12.6 Abbott Laboratories
12.6.1 Company Snapshot
12.6.2 Company Overview
12.6.3 Financial Analysis
12.6.3.1 Net Revenue, 2018-2023
12.6.3.2 R&D, 2018-2023
12.6.3.3 Regional Market Shares, 2023
12.6.4 Product Benchmarking
12.6.5 Strategic Outlook
12.7 Medtronic Plc
12.7.1 Company Snapshot
12.7.2 Company Overview
12.7.3 Financial Analysis
12.7.3.1 Net Revenue, 2018-2023
12.7.3.2 R&D, 2018-2023
12.7.3.3 Regional Market Shares, 2023
12.7.4 Product Benchmarking
12.7.5 Strategic Outlook
12.8 Getinge AB
12.8.1 Company Snapshot
12.8.2 Company Overview
12.8.3 Financial Analysis
12.8.3.1 Net Revenue, 2018-2023
12.8.3.2 R&D, 2018-2023
12.8.3.3 Regional Market Shares, 2023
12.8.4 Product Benchmarking
12.8.5 Strategic Outlook
12.9 Cardinal Health, Inc.
12.9.1 Company Snapshot
12.9.2 Company Overview
12.9.3 Financial Analysis
12.9.3.1 Net Revenue, 2018-2023
12.9.3.2 Regional Market Shares, 2023
12.9.4 Product Benchmarking
12.10 Terumo Corporation
12.10.1 Company Snapshot
12.10.2 Company Overview
12.10.3 Financial Analysis
12.10.3.1 Net Revenue, 2018-2023
12.10.3.2 Regional Market Shares, 2023
12.10.4 Product Benchmarking
12.10.5 Strategic Outlook
12.11 Biotronik SE & Co. KG
12.11.1 Company Snapshot
12.11.2 Company Overview
12.11.3 Product Benchmarking
12.11.4 Strategic Outlook
12.12 Kyoto Medical Planning Co. Ltd.
12.12.1 Company Snapshot
12.12.2 Company Overview
12.12.3 Product Benchmarking
12.13 Koninklijke Philips N.V.
12.13.1 Company Snapshot
12.13.2 Company Overview
12.13.3 Financial Analysis
12.13.3.1 Net Revenue, 2018-2023
12.13.3.2 R&D, 2018-2023
12.13.3.3 Regional Market Shares, 2023
12.13.4 Product Benchmarking
12.13.5 Strategic Outlook
12.14 B. Braun SE
12.14.1 Company Snapshot
12.14.2 Company Overview
12.14.3 Financial Analysis
12.14.3.1 Net Revenue, 2018-2023
12.14.3.2 R&D, 2018-2023
12.14.3.3 Regional Market Shares, 2023
12.14.4 Product Benchmarking
12.15 Penumbra Inc.
12.15.1 Company Snapshot
12.15.2 Company Overview
12.15.3 Financial Analysis
12.15.3.1 Net Revenue, 2018-2023
12.15.3.2 R&D, 2018-2023
12.15.3.3 Regional Market Shares, 2023
12.15.4 Product Benchmarking
12.15.5 Strategic Outlook
12.16 Merit Medical Systems, Inc.
12.16.1 Company Snapshot
12.16.2 Company Overview
12.16.3 Financial Analysis
12.16.3.1 Net Revenue, 2018-2023
12.16.3.2 R&D, 2018-2023
12.16.3.3 Regional Market Shares, 2023
12.16.4 Product Benchmarking
12.17 Cordis Corporation
12.17.1 Company Snapshot
12.17.2 Company Overview
12.17.3 Product Benchmarking
12.17.4 Strategic Outlook
13 Conclusion and Recommendations
13.1 Concluding Remarks from Visiongain
13.2 Recommendations for Market Players
ページTOPに戻る
List of Tables/Graphs
List of Tables
Table 1 Peripheral Vascular Devices Market Snapshot, 2024 & 2034 (US$ Billion, CAGR %)
Table 2 Peripheral Vascular Devices Market Forecast by Region, 2024-2034 (US$ Billion, AGR%, CAGR%): “V” Shaped Recovery
Table 3 Peripheral Vascular Devices Market Forecast by Region, 2024-2034 (US$ Billion, AGR%, CAGR%): “U” Shaped Recovery
Table 4 Peripheral Vascular Devices Market Forecast by Region, 2024-2034 (US$ Billion, AGR%, CAGR%): “W” Shaped Recovery
Table 5 Peripheral Vascular Devices Market Forecast by Region, 2024-2034 (US$ Billion, AGR%, CAGR%): “L” Shaped Recovery
Table 6 Peripheral Vascular Devices Market Forecast by Product, 2024-2034 (US$ Billion, AGR%, CAGR%)
Table 7 Stents Segment Market Forecast by Region, 2024-2034 (US$ Billion, AGR%, CAGR%)
Table 8 Bare Metal Stents Segment Market Forecast by Region, 2024-2034 (US$ Billion, AGR%, CAGR%)
Table 9 Drug-eluting Stents Segment Market Forecast by Region, 2024-2034 (US$ Billion, AGR%, CAGR%)
Table 10 PTA Balloons Segment Market Forecast by Region, 2024-2034 (US$ Billion, AGR%, CAGR%)
Table 11 Catheters Segment Market Forecast by Region, 2024-2034 (US$ Billion, AGR%, CAGR%)
Table 12 Angiography Catheters Segment Market Forecast by Region, 2024-2034 (US$ Billion, AGR%, CAGR%)
Table 13 IVUS/OCT Catheters Segment Market Forecast by Region, 2024-2034 (US$ Billion, AGR%, CAGR%)
Table 14 Guiding Catheters Segment Market Forecast by Region, 2024-2034 (US$ Billion, AGR%, CAGR%)
Table 15 Endovascular Aneurysm Repair Stent Grafts Segment Market Forecast by Region, 2024-2034 (US$ Billion, AGR%, CAGR%)
Table 16 Thoracic Endovascular Aneurysm Stent Grafts Segment Market Forecast by Region, 2024-2034 (US$ Billion, AGR%, CAGR%)
Table 17 Abdominal Endovascular Aneurysm Stent Grafts Segment Market Forecast by Region, 2024-2034 (US$ Billion, AGR%, CAGR%)
Table 18 Plaque Modification Devices Segment Market Forecast by Region, 2024-2034 (US$ Billion, AGR%, CAGR%)
Table 19 Atherectomy Devices Segment Market Forecast by Region, 2024-2034 (US$ Billion, AGR%, CAGR%)
Table 20 Thrombectomy Devices Segment Market Forecast by Region, 2024-2034 (US$ Billion, AGR%, CAGR%)
Table 21 Inferior Vena Cava Filters Segment Market Forecast by Region, 2024-2034 (US$ Billion, AGR%, CAGR%)
Table 22 Permanent Filters Segment Market Forecast by Region, 2024-2034 (US$ Billion, AGR%, CAGR%)
Table 23 Retrievable Filters Segment Market Forecast by Region, 2024-2034 (US$ Billion, AGR%, CAGR%)
Table 24 Hemodynamic Flow Alteration Devices Segment Market Forecast by Region, 2024-2034 (US$ Billion, AGR%, CAGR%)
Table 25 Chronic Total Occlusion Devices Segment Market Forecast by Region, 2024-2034 (US$ Billion, AGR%, CAGR%)
Table 26 Embolic Protection Devices Segment Market Forecast by Region, 2024-2034 (US$ Billion, AGR%, CAGR%)
Table 27 Others Segment Market Forecast by Region, 2024-2034 (US$ Billion, AGR%, CAGR%)
Table 28 Guidewires Segment Market Forecast by Region, 2024-2034 (US$ Billion, AGR%, CAGR%)
Table 29 Vascular Closure Devices Segment Market Forecast by Region, 2024-2034 (US$ Billion, AGR%, CAGR%)
Table 30 Balloon Inflation Devices Segment Market Forecast by Region, 2024-2034 (US$ Billion, AGR%, CAGR%)
Table 31 Introducer Sheaths Segment Market Forecast by Region, 2024-2034 (US$ Billion, AGR%, CAGR%)
Table 32 Peripheral Vascular Devices Market Forecast by End-users, 2024-2034 (US$ Billion, AGR%, CAGR%)
Table 33 Hospitals Segment Market Forecast by Region, 2024-2034 (US$ Billion, AGR%, CAGR%)
Table 34 Ambulatory Surgical Centers (ASCs) Segment Market Forecast by Region, 2024-2034 (US$ Billion, AGR%, CAGR%)
Table 35 Others Segment Market Forecast by Region, 2024-2034 (US$ Billion, AGR%, CAGR%)
Table 36 Peripheral Vascular Devices Market Forecast by Region, 2024-2034 (US$ Billion, AGR%, CAGR%)
Table 37 North America Peripheral Vascular Devices Market Forecast by Country, 2024-2034 (US$ Billion, AGR%, CAGR%)
Table 38 North America Peripheral Vascular Devices Market Forecast by Product, 2024-2034 (US$ Billion, AGR%, CAGR%)
Table 39 North America Stents Market Forecast by Type, 2024-2034 (US$ Billion, AGR%, CAGR%)
Table 40 North America Catheters Market Forecast by Type, 2024-2034 (US$ Billion, AGR%, CAGR%)
Table 41 North America Endovascular Aneurysm Repair Stent Grafts Market Forecast by Type, 2024-2034 (US$ Billion, AGR%, CAGR%)
Table 42 North America Plaque Modification Devices Market Forecast by Type, 2024-2034 (US$ Billion, AGR%, CAGR%)
Table 43 North America Inferior Vena Cava Filters Market Forecast by Type, 2024-2034 (US$ Billion, AGR%, CAGR%)
Table 44 North America Hemodynamic Flow Alteration Devices Market Forecast by Type, 2024-2034 (US$ Billion, AGR%, CAGR%)
Table 45 North America Others Market Forecast by Type, 2024-2034 (US$ Billion, AGR%, CAGR%)
Table 46 North America Peripheral Vascular Devices Market Forecast by End-users, 2024-2034 (US$ Billion, AGR%, CAGR%)
Table 47 U.S. Peripheral Vascular Devices Market Forecast, 2024-2034 (US$ Billion, AGR%, CAGR%)
Table 48 Canada Peripheral Vascular Devices Market Forecast, 2024-2034 (US$ Billion, AGR%, CAGR%)
Table 49 Europe Peripheral Vascular Devices Market Forecast by Country, 2024-2034 (US$ Billion, AGR%, CAGR%)
Table 50 Europe Peripheral Vascular Devices Market Forecast by Product, 2024-2034 (US$ Billion, AGR%, CAGR%)
Table 51 Europe Stents Market Forecast by Type, 2024-2034 (US$ Billion, AGR%, CAGR%)
Table 52 Europe Catheters Market Forecast by Type, 2024-2034 (US$ Billion, AGR%, CAGR%)
Table 53 Europe Endovascular Aneurysm Repair Stent Grafts Market Forecast by Type, 2024-2034 (US$ Billion, AGR%, CAGR%)
Table 54 Europe Plaque Modification Devices Market Forecast by Type, 2024-2034 (US$ Billion, AGR%, CAGR%)
Table 55 Europe Inferior Vena Cava Filters Market Forecast by Type, 2024-2034 (US$ Billion, AGR%, CAGR%)
Table 56 Europe Hemodynamic Flow Alteration Devices Market Forecast by Type, 2024-2034 (US$ Billion, AGR%, CAGR%)
Table 57 Europe Others Market Forecast by Type, 2024-2034 (US$ Billion, AGR%, CAGR%)
Table 58 Europe Peripheral Vascular Devices Market Forecast by End-users, 2024-2034 (US$ Billion, AGR%, CAGR%)
Table 59 Germany Peripheral Vascular Devices Market Forecast, 2024-2034 (US$ Billion, AGR%, CAGR%)
Table 60 UK Peripheral Vascular Devices Market Forecast, 2024-2034 (US$ Billion, AGR%, CAGR%)
Table 61 France Peripheral Vascular Devices Market Forecast, 2024-2034 (US$ Billion, AGR%, CAGR%)
Table 62 Italy Peripheral Vascular Devices Market Forecast, 2024-2034 (US$ Billion, AGR%, CAGR%)
Table 63 Spain Peripheral Vascular Devices Market Forecast, 2024-2034 (US$ Billion, AGR%, CAGR%)
Table 64 Russia Peripheral Vascular Devices Market Forecast, 2024-2034 (US$ Billion, AGR%, CAGR%)
Table 65 Rest of Europe Peripheral Vascular Devices Market Forecast, 2024-2034 (US$ Billion, AGR%, CAGR%)
Table 66 Asia Peripheral Vascular Devices Market Forecast by Country, 2024-2034 (US$ Billion, AGR%, CAGR%)
Table 67 Asia Pacific Peripheral Vascular Devices Market Forecast by Product, 2024-2034 (US$ Billion, AGR%, CAGR%)
Table 68 Asia Pacific Stents Market Forecast by Type, 2024-2034 (US$ Billion, AGR%, CAGR%)
Table 69 Asia Pacific Catheters Market Forecast by Type, 2024-2034 (US$ Billion, AGR%, CAGR%)
Table 70 Asia Pacific Endovascular Aneurysm Repair Stent Grafts Market Forecast by Type, 2024-2034 (US$ Billion, AGR%, CAGR%)
Table 71 Asia Pacific Plaque Modification Devices Market Forecast by Type, 2024-2034 (US$ Billion, AGR%, CAGR%)
Table 72 Asia Pacific Inferior Vena Cava Filters Market Forecast by Type, 2024-2034 (US$ Billion, AGR%, CAGR%)
Table 73 Asia Pacific Hemodynamic Flow Alteration Devices Market Forecast by Type, 2024-2034 (US$ Billion, AGR%, CAGR%)
Table 74 Asia Pacific Others Market Forecast by Type, 2024-2034 (US$ Billion, AGR%, CAGR%)
Table 75 Asia Pacific Peripheral Vascular Devices Market Forecast by End-users, 2024-2034 (US$ Billion, AGR%, CAGR%)
Table 76 Japan Peripheral Vascular Devices Market Forecast, 2024-2034 (US$ Billion, AGR%, CAGR%)
Table 77 China Peripheral Vascular Devices Market Forecast, 2024-2034 (US$ Billion, AGR%, CAGR%)
Table 78 India Peripheral Vascular Devices Market Forecast, 2024-2034 (US$ Billion, AGR%, CAGR%)
Table 79 Australia Peripheral Vascular Devices Market Forecast, 2024-2034 (US$ Billion, AGR%, CAGR%)
Table 80 South Korea Peripheral Vascular Devices Market Forecast, 2024-2034 (US$ Billion, AGR%, CAGR%)
Table 81 Rest of Asia Peripheral Vascular Devices Market Forecast, 2024-2034 (US$ Billion, AGR%, CAGR%)
Table 82 Latin America Peripheral Vascular Devices Market Forecast by Country, 2024-2034 (US$ Billion, AGR%, CAGR%)
Table 83 Latin America Peripheral Vascular Devices Market Forecast by Product, 2024-2034 (US$ Billion, AGR%, CAGR%)
Table 84 Latin America Stents Market Forecast by Type, 2024-2034 (US$ Billion, AGR%, CAGR%)
Table 85 Latin America Catheters Market Forecast by Type, 2024-2034 (US$ Billion, AGR%, CAGR%)
Table 86 Latin America Endovascular Aneurysm Repair Stent Grafts Market Forecast by Type, 2024-2034 (US$ Billion, AGR%, CAGR%)
Table 87 Latin America Plaque Modification Devices Market Forecast by Type, 2024-2034 (US$ Billion, AGR%, CAGR%)
Table 88 Latin America Inferior Vena Cava Filters Market Forecast by Type, 2024-2034 (US$ Billion, AGR%, CAGR%)
Table 89 Latin America Hemodynamic Flow Alteration Devices Market Forecast by Type, 2024-2034 (US$ Billion, AGR%, CAGR%)
Table 90 Latin America Others Market Forecast by Type, 2024-2034 (US$ Billion, AGR%, CAGR%)
Table 91 Latin America Peripheral Vascular Devices Market Forecast by End-users, 2024-2034 (US$ Billion, AGR%, CAGR%)
Table 92 Brazil Peripheral Vascular Devices Market Forecast, 2024-2034 (US$ Billion, AGR%, CAGR%)
Table 93 Mexico Peripheral Vascular Devices Market Forecast, 2024-2034 (US$ Billion, AGR%, CAGR%)
Table 94 Argentina Peripheral Vascular Devices Market Forecast, 2024-2034 (US$ Billion, AGR%, CAGR%)
Table 95 Rest of Latin America Peripheral Vascular Devices Market Forecast, 2024-2034 (US$ Billion, AGR%, CAGR%)
Table 96 MEA Peripheral Vascular Devices Market Forecast by Country, 2024-2034 (US$ Billion, AGR%, CAGR%)
Table 97 MEA Peripheral Vascular Devices Market Forecast by Product, 2024-2034 (US$ Billion, AGR%, CAGR%)
Table 98 MEA Stents Market Forecast by Type, 2024-2034 (US$ Billion, AGR%, CAGR%)
Table 99 MEA Catheters Market Forecast by Type, 2024-2034 (US$ Billion, AGR%, CAGR%)
Table 100 MEA Endovascular Aneurysm Repair Stent Grafts Market Forecast by Type, 2024-2034 (US$ Billion, AGR%, CAGR%)
Table 101 MEA Plaque Modification Devices Market Forecast by Type, 2024-2034 (US$ Billion, AGR%, CAGR%)
Table 102 MEA Inferior Vena Cava Filters Market Forecast by Type, 2024-2034 (US$ Billion, AGR%, CAGR%)
Table 103 MEA Hemodynamic Flow Alteration Devices Market Forecast by Type, 2024-2034 (US$ Billion, AGR%, CAGR%)
Table 104 MEA Others Market Forecast by Type, 2024-2034 (US$ Billion, AGR%, CAGR%)
Table 105 MEA Peripheral Vascular Devices Market Forecast by End-users, 2024-2034 (US$ Billion, AGR%, CAGR%)
Table 106 GCC Peripheral Vascular Devices Market Forecast, 2024-2034 (US$ Billion, AGR%, CAGR%)
Table 107 South Africa Peripheral Vascular Devices Market Forecast, 2024-2034 (US$ Billion, AGR%, CAGR%)
Table 108 Rest of MEA Peripheral Vascular Devices Market Forecast, 2024-2034 (US$ Billion, AGR%, CAGR%)
Table 109 Strategic Outlook
Table 110 Becton Dickinson and Co. (BD): Key Details, (CEO, HQ, Revenue, Founded, No. of Employees, Company Type, Website, Business Segment)
Table 111 Becton Dickinson and Co. (BD): Product Benchmarking
Table 112 Becton Dickinson and Co. (BD): Strategic Outlook
Table 113 Cook Group, Inc.: Key Details, (CEO, HQ, Revenue, Founded, No. of Employees, Company Type, Website, Business Segment)
Table 114 Cook Group, Inc.: Product Benchmarking
Table 115 Cook Group, Inc.: Strategic Outlook
Table 116 Boston Scientific Corporation: Key Details, (CEO, HQ, Revenue, Founded, No. of Employees, Company Type, Website, Business Segment)
Table 117 Boston Scientific Corporation: Product Benchmarking
Table 118 Boston Scientific Corporation: Strategic Outlook
Table 119 Abbott Laboratories: Key Details, (CEO, HQ, Revenue, Founded, No. of Employees, Company Type, Website, Business Segment)
Table 120 Abbott Laboratories: Product Benchmarking
Table 121 Abbott Laboratories: Strategic Outlook
Table 122 Medtronic Plc: Key Details, (CEO, HQ, Revenue, Founded, No. of Employees, Company Type, Website, Business Segment)
Table 123 Medtronic Plc: Product Benchmarking
Table 124 Medtronic Plc: Strategic Outlook
Table 125 Getinge AB: Key Details, (CEO, HQ, Revenue, Founded, No. of Employees, Company Type, Website, Business Segment)
Table 126 Getinge AB: Product Benchmarking
Table 127 Getinge AB: Strategic Outlook
Table 128 Cardinal Health, Inc.: Key Details, (CEO, HQ, Revenue, Founded, No. of Employees, Company Type, Website, Business Segment)
Table 129 Cardinal Health, Inc.: Product Benchmarking
Table 130 Terumo Corporation: Key Details, (CEO, HQ, Revenue, Founded, No. of Employees, Company Type, Website, Business Segment)
Table 131 Terumo Corporation: Product Benchmarking
Table 132 Terumo Corporation: Strategic Outlook
Table 133 Biotronik SE & Co. KG: Key Details, (CEO, HQ, Revenue, Founded, No. of Employees, Company Type, Website, Business Segment)
Table 134 Biotronik SE & Co. KG: Product Benchmarking
Table 135 Biotronik SE & Co. KG: Strategic Outlook
Table 136 Kyoto Medical Planning Co. Ltd.: Key Details, (CEO, HQ, Revenue, Founded, No. of Employees, Company Type, Website, Business Segment)
Table 137 Kyoto Medical Planning Co. Ltd.: Product Benchmarking
Table 138 Koninklijke Philips N.V.: Key Details, (CEO, HQ, Revenue, Founded, No. of Employees, Company Type, Website, Business Segment)
Table 139 Koninklijke Philips N.V.: Product Benchmarking
Table 140 Koninklijke Philips N.V.: Strategic Outlook
Table 141 B. Braun SE: Key Details, (CEO, HQ, Revenue, Founded, No. of Employees, Company Type, Website, Business Segment)
Table 142 B. Braun SE: Product Benchmarking
Table 143 Penumbra Inc.: Key Details, (CEO, HQ, Revenue, Founded, No. of Employees, Company Type, Website, Business Segment)
Table 144 Penumbra Inc.: Product Benchmarking
Table 145 Penumbra Inc.: Strategic Outlook
Table 146 Merit Medical Systems, Inc.: Key Details, (CEO, HQ, Revenue, Founded, No. of Employees, Company Type, Website, Business Segment)
Table 147 Merit Medical Systems, Inc.: Product Benchmarking
Table 148 Cordis Corporation: Key Details, (CEO, HQ, Revenue, Founded, No. of Employees, Company Type, Website, Business Segment)
Table 149 Cordis Corporation: Product Benchmarking
Table 150 Cordis Corporation: Strategic Outlook
List of Figures
Figure 1 Clinical Trial Supplies Market Segmentation
Figure 2 Peripheral Vascular Devices Market by Product: Market Attractiveness Index
Figure 3 Peripheral Vascular Devices Market by End-users: Market Attractiveness Index
Figure 4 Peripheral Vascular Devices Market Attractiveness Index by Region
Figure 5 Peripheral Vascular Devices Market: Market Dynamics
Figure 6 Peripheral Vascular Devices Market by Region, 2024-2034 (US$ Billion, AGR %): “V” Shaped Recovery
Figure 7 Peripheral Vascular Devices Market by Region, 2024-2034 (US$ Billion, AGR %): “U” Shaped Recovery
Figure 8 Peripheral Vascular Devices Market by Region, 2024-2034 (US$ Billion, AGR %): “W” Shaped Recovery
Figure 9 Peripheral Vascular Devices Market by Region, 2024-2034 (US$ Billion, AGR %): “L” Shaped Recovery
Figure 10 Peripheral Vascular Devices Market: Porter’s Five Forces Analysis
Figure 11 Peripheral Vascular Devices Market: PEST Analysis
Figure 12 Peripheral Vascular Devices Market by Product: Market Attractiveness Index
Figure 13 Peripheral Vascular Devices Market Forecast by Product, 2024-2034 (US$ Billion, AGR %)
Figure 14 Peripheral Vascular Devices Share Forecast by Product, 2024, 2029, 2034 (%)
Figure 15 Stents Segment Market Forecast by Region, 2024-2034 (US$ Billion, AGR %)
Figure 16 Stents Segment Market Share Forecast by Region, 2024 & 2034 (%)
Figure 17 Bare Metal Stents Segment Market Forecast by Region, 2024-2034 (US$ Billion, AGR %)
Figure 18 Bare Metal Stents Segment Market Share Forecast by Region, 2024 & 2034 (%)
Figure 19 Drug-eluting Stents Segment Market Forecast by Region, 2024-2034 (US$ Billion, AGR %)
Figure 20 Drug-eluting Stents Segment Market Share Forecast by Region, 2024 & 2034 (%)
Figure 21 PTA Balloons Segment Market Forecast by Region, 2024-2034 (US$ Billion, AGR %)
Figure 22 PTA Balloons Segment Market Share Forecast by Region, 2024 & 2034 (%)
Figure 23 Catheters Segment Market Forecast by Region, 2024-2034 (US$ Billion, AGR %)
Figure 24 Catheters Segment Market Share Forecast by Region, 2024 & 2034 (%)
Figure 25 Angiography Catheters Segment Market Forecast by Region, 2024-2034 (US$ Billion, AGR %)
Figure 26 Angiography Catheters Segment Market Share Forecast by Region, 2024 & 2034 (%)
Figure 27 IVUS/OCT Catheters Segment Market Forecast by Region, 2024-2034 (US$ Billion, AGR %)
Figure 28 IVUS/OCT Catheters Segment Market Share Forecast by Region, 2024 & 2034 (%)
Figure 29 Guiding Catheters Segment Market Forecast by Region, 2024-2034 (US$ Billion, AGR %)
Figure 30 Guiding Catheters Segment Market Share Forecast by Region, 2024 & 2034 (%)
Figure 31 Endovascular Aneurysm Repair Stent Grafts Segment Market Forecast by Region, 2024-2034 (US$ Billion, AGR %)
Figure 32 Endovascular Aneurysm Repair Stent Grafts Segment Market Share Forecast by Region, 2024 & 2034 (%)
Figure 33 Thoracic Endovascular Aneurysm Stent Grafts Segment Market Forecast by Region, 2024-2034 (US$ Billion, AGR %)
Figure 34 Thoracic Endovascular Aneurysm Stent Grafts Segment Market Share Forecast by Region, 2024 & 2034 (%)
Figure 35 Abdominal Endovascular Aneurysm Stent Grafts Segment Market Forecast by Region, 2024-2034 (US$ Billion, AGR %)
Figure 36 Abdominal Endovascular Aneurysm Stent Grafts Segment Market Share Forecast by Region, 2024 & 2034 (%)
Figure 37 Plaque Modification Devices Segment Market Forecast by Region, 2024-2034 (US$ Billion, AGR %)
Figure 38 Plaque Modification Devices Segment Market Share Forecast by Region, 2024 & 2034 (%)
Figure 39 Atherectomy Devices Segment Market Forecast by Region, 2024-2034 (US$ Billion, AGR %)
Figure 40 Atherectomy Devices Segment Market Share Forecast by Region, 2024 & 2034 (%)
Figure 41 Thrombectomy Devices Segment Market Forecast by Region, 2024-2034 (US$ Billion, AGR %)
Figure 42 Thrombectomy Devices Segment Market Share Forecast by Region, 2024 & 2034 (%)
Figure 43 Inferior Vena Cava Filters Segment Market Forecast by Region, 2024-2034 (US$ Billion, AGR %)
Figure 44 Inferior Vena Cava Filters Segment Market Share Forecast by Region, 2024 & 2034 (%)
Figure 45 Permanent Filters Segment Market Forecast by Region, 2024-2034 (US$ Billion, AGR %)
Figure 46 Permanent Filters Segment Market Share Forecast by Region, 2024 & 2034 (%)
Figure 47 Retrievable Filters Segment Market Forecast by Region, 2024-2034 (US$ Billion, AGR %)
Figure 48 Retrievable Filters Segment Market Share Forecast by Region, 2024 & 2034 (%)
Figure 49 Hemodynamic Flow Alteration Devices Segment Market Forecast by Region, 2024-2034 (US$ Billion, AGR %)
Figure 50 Hemodynamic Flow Alteration Devices Segment Market Share Forecast by Region, 2024 & 2034 (%)
Figure 51 Chronic Total Occlusion Devices Segment Market Forecast by Region, 2024-2034 (US$ Billion, AGR %)
Figure 52 Chronic Total Occlusion Devices Segment Market Share Forecast by Region, 2024 & 2034 (%)
Figure 53 Embolic Protection Devices Segment Market Forecast by Region, 2024-2034 (US$ Billion, AGR %)
Figure 54 Embolic Protection Devices Segment Market Share Forecast by Region, 2024 & 2034 (%)
Figure 55 Others Segment Market Forecast by Region, 2024-2034 (US$ Billion, AGR %)
Figure 56 Others Segment Market Share Forecast by Region, 2024 & 2034 (%)
Figure 57 Guidewires Segment Market Forecast by Region, 2024-2034 (US$ Billion, AGR %)
Figure 58 Guidewires Segment Market Share Forecast by Region, 2024 & 2034 (%)
Figure 59 Vascular Closure Devices Segment Market Forecast by Region, 2024-2034 (US$ Billion, AGR %)
Figure 60 Vascular Closure Devices Segment Market Share Forecast by Region, 2024 & 2034 (%)
Figure 61 Balloon Inflation Devices Segment Market Forecast by Region, 2024-2034 (US$ Billion, AGR %)
Figure 62 Balloon Inflation Devices Segment Market Share Forecast by Region, 2024 & 2034 (%)
Figure 63 Introducer Sheaths Segment Market Forecast by Region, 2024-2034 (US$ Billion, AGR %)
Figure 64 Introducer Sheaths Segment Market Share Forecast by Region, 2024 & 2034 (%)
Figure 65 Peripheral Vascular Devices Market by End-users: Market Attractiveness Index
Figure 66 Peripheral Vascular Devices Market Forecast by End-users, 2024-2034 (US$ Billion, AGR %)
Figure 67 Peripheral Vascular Devices Share Forecast by End-users, 2024, 2029, 2034 (%)
Figure 68 Hospitals Segment Market Forecast by Region, 2024-2034 (US$ Billion, AGR %)
Figure 69 Hospitals Segment Market Share Forecast by Region, 2024 & 2034 (%)
Figure 70 Ambulatory Surgical Centers (ASCs) Segment Market Forecast by Region, 2024-2034 (US$ Billion, AGR %)
Figure 71 Ambulatory Surgical Centers (ASCs) Segment Market Share Forecast by Region, 2024 & 2034 (%)
Figure 72 Others Segment Market Forecast by Region, 2024-2034 (US$ Billion, AGR %)
Figure 73 Others Segment Market Share Forecast by Region, 2024 & 2034 (%)
Figure 74 Clinical Trial Supplies Market Forecast by Region 2024 and 2034 (Revenue, CAGR%)
Figure 75 Peripheral Vascular Devices Market Share Forecast by Region 2024, 2029, 2034 (%)
Figure 76 Peripheral Vascular Devices Market by Region, 2024-2034 (US$ Billion, AGR %)
Figure 77 North America Peripheral Vascular Devices Market Attractiveness Index
Figure 78 North America Peripheral Vascular Devices Market by Region, 2024, 2029 & 2034 (US$ Billion)
Figure 79 North America Peripheral Vascular Devices Market Forecast by Country, 2024-2034 (US$ Billion, AGR %)
Figure 80 North America Peripheral Vascular Devices Market Share Forecast by Country, 2024 & 2034 (%)
Figure 81 North America Peripheral Vascular Devices Market Forecast by Product, 2024-2034 (US$ Billion, AGR %)
Figure 82 North America Peripheral Vascular Devices Market Share Forecast by Product, 2024 & 2034 (%)
Figure 83 North America Stents Market Forecast by Type, 2024-2034 (US$ Billion, AGR %)
Figure 84 North America Stents Market Share Forecast by Type, 2024 & 2034 (%)
Figure 85 North America Catheters Market Forecast by Type, 2024-2034 (US$ Billion, AGR %)
Figure 86 North America Catheters Market Share Forecast by Type, 2024 & 2034 (%)
Figure 87 North America Endovascular Aneurysm Repair Stent Grafts Market Forecast by Type, 2024-2034 (US$ Billion, AGR %)
Figure 88 North America Endovascular Aneurysm Repair Stent Grafts Market Share Forecast by Type, 2024 & 2034 (%)
Figure 89 North America Plaque Modification Devices Market Forecast by Type, 2024-2034 (US$ Billion, AGR %)
Figure 90 North America Plaque Modification Devices Market Share Forecast by Type, 2024 & 2034 (%)
Figure 91 North America Inferior Vena Cava Filters Market Forecast by Type, 2024-2034 (US$ Billion, AGR %)
Figure 92 North America Inferior Vena Cava Filters Market Share Forecast by Type, 2024 & 2034 (%)
Figure 93 North America Hemodynamic Flow Alteration Devices Market Forecast by Type, 2024-2034 (US$ Billion, AGR %)
Figure 94 North America Hemodynamic Flow Alteration Devices Market Share Forecast by Type, 2024 & 2034 (%)
Figure 95 North America Others Market Forecast by Type, 2024-2034 (US$ Billion, AGR %)
Figure 96 North America Others Market Share Forecast by Type, 2024 & 2034 (%)
Figure 97 North America Peripheral Vascular Devices Market Forecast by End-users, 2024-2034 (US$ Billion, AGR %)
Figure 98 North America Peripheral Vascular Devices Market Share Forecast by End-users, 2024 & 2034 (%)
Figure 99 U.S. Peripheral Vascular Devices Market Forecast, 2024-2034 (US$ Billion, AGR %)
Figure 100 Canada Peripheral Vascular Devices Market Forecast, 2024-2034 (US$ Billion, AGR %)
Figure 101 Europe Peripheral Vascular Devices Market Attractiveness Index
Figure 102 Europe Peripheral Vascular Devices Market by Region, 2024, 2029 & 2034 (US$ Billion)
Figure 103 Europe Peripheral Vascular Devices Market Forecast by Country, 2024-2034 (US$ Billion, AGR %)
Figure 104 Europe Peripheral Vascular Devices Market Share Forecast by Country, 2024 & 2034 (%)
Figure 105 Europe Peripheral Vascular Devices Market Forecast by Product, 2024-2034 (US$ Billion, AGR %)
Figure 106 Europe Peripheral Vascular Devices Market Share Forecast by Product, 2024 & 2034 (%)
Figure 107 Europe Stents Market Forecast by Type, 2024-2034 (US$ Billion, AGR %)
Figure 108 Europe Stents Market Share Forecast by Type, 2024 & 2034 (%)
Figure 109 Europe Catheters Market Forecast by Type, 2024-2034 (US$ Billion, AGR %)
Figure 110 Europe Catheters Market Share Forecast by Type, 2024 & 2034 (%)
Figure 111 Europe Endovascular Aneurysm Repair Stent Grafts Market Forecast by Type, 2024-2034 (US$ Billion, AGR %)
Figure 112 Europe Endovascular Aneurysm Repair Stent Grafts Market Share Forecast by Type, 2024 & 2034 (%)
Figure 113 Europe Plaque Modification Devices Market Forecast by Type, 2024-2034 (US$ Billion, AGR %)
Figure 114 Europe Plaque Modification Devices Market Share Forecast by Type, 2024 & 2034 (%)
Figure 115 Europe Inferior Vena Cava Filters Market Forecast by Type, 2024-2034 (US$ Billion, AGR %)
Figure 116 Europe Inferior Vena Cava Filters Market Share Forecast by Type, 2024 & 2034 (%)
Figure 117 Europe Hemodynamic Flow Alteration Devices Market Forecast by Type, 2024-2034 (US$ Billion, AGR %)
Figure 118 Europe Hemodynamic Flow Alteration Devices Market Share Forecast by Type, 2024 & 2034 (%)
Figure 119 Europe Others Market Forecast by Type, 2024-2034 (US$ Billion, AGR %)
Figure 120 Europe Others Market Share Forecast by Type, 2024 & 2034 (%)
Figure 121 Europe Peripheral Vascular Devices Market Forecast by End-users, 2024-2034 (US$ Billion, AGR %)
Figure 122 Europe Peripheral Vascular Devices Market Share Forecast by End-users, 2024 & 2034 (%)
Figure 123 Germany Peripheral Vascular Devices Market Forecast, 2024-2034 (US$ Billion, AGR %)
Figure 124 UK Peripheral Vascular Devices Market Forecast, 2024-2034 (US$ Billion, AGR %)
Figure 125 France Peripheral Vascular Devices Market Forecast, 2024-2034 (US$ Billion, AGR %)
Figure 126 Italy Peripheral Vascular Devices Market Forecast, 2024-2034 (US$ Billion, AGR %)
Figure 127 Spain Peripheral Vascular Devices Market Forecast, 2024-2034 (US$ Billion, AGR %)
Figure 128 Russia Peripheral Vascular Devices Market Forecast, 2024-2034 (US$ Billion, AGR %)
Figure 129 Rest of Europe Peripheral Vascular Devices Market Forecast, 2024-2034 (US$ Billion, AGR %)
Figure 130 Asia Peripheral Vascular Devices Market Attractiveness Index
Figure 131 Asia Peripheral Vascular Devices Market by Region, 2024, 2029 & 2034 (US$ Billion)
Figure 132 Asia Peripheral Vascular Devices Market Forecast by Country, 2024-2034 (US$ Billion, AGR %)
Figure 133 Asia Peripheral Vascular Devices Market Share Forecast by Country, 2024 & 2034 (%)
Figure 134 Asia Pacific Peripheral Vascular Devices Market Forecast by Product, 2024-2034 (US$ Billion, AGR %)
Figure 135 Asia Pacific Peripheral Vascular Devices Market Share Forecast by Product, 2024 & 2034 (%)
Figure 136 Asia Pacific Stents Market Forecast by Type, 2024-2034 (US$ Billion, AGR %)
Figure 137 Asia Pacific Stents Market Share Forecast by Type, 2024 & 2034 (%)
Figure 138 Asia Pacific Catheters Market Forecast by Type, 2024-2034 (US$ Billion, AGR %)
Figure 139 Asia Pacific Catheters Market Share Forecast by Type, 2024 & 2034 (%)
Figure 140 Asia Pacific Endovascular Aneurysm Repair Stent Grafts Market Forecast by Type, 2024-2034 (US$ Billion, AGR %)
Figure 141 Asia Pacific Endovascular Aneurysm Repair Stent Grafts Market Share Forecast by Type, 2024 & 2034 (%)
Figure 142 Asia Pacific Plaque Modification Devices Market Forecast by Type, 2024-2034 (US$ Billion, AGR %)
Figure 143 Asia Pacific Plaque Modification Devices Market Share Forecast by Type, 2024 & 2034 (%)
Figure 144 Asia Pacific Inferior Vena Cava Filters Market Forecast by Type, 2024-2034 (US$ Billion, AGR %)
Figure 145 Asia Pacific Inferior Vena Cava Filters Market Share Forecast by Type, 2024 & 2034 (%)
Figure 146 Asia Pacific Hemodynamic Flow Alteration Devices Market Forecast by Type, 2024-2034 (US$ Billion, AGR %)
Figure 147 Asia Pacific Hemodynamic Flow Alteration Devices Market Share Forecast by Type, 2024 & 2034 (%)
Figure 148 Asia Pacific Others Market Forecast by Type, 2024-2034 (US$ Billion, AGR %)
Figure 149 Asia Pacific Others Market Share Forecast by Type, 2024 & 2034 (%)
Figure 150 Asia Pacific Peripheral Vascular Devices Market Forecast by End-users, 2024-2034 (US$ Billion, AGR %)
Figure 151 Asia Pacific Peripheral Vascular Devices Market Share Forecast by End-users, 2024 & 2034 (%)
Figure 152 Japan Peripheral Vascular Devices Market Forecast, 2024-2034 (US$ Billion, AGR %)
Figure 153 China Peripheral Vascular Devices Market Forecast, 2024-2034 (US$ Billion, AGR %)
Figure 154 India Peripheral Vascular Devices Market Forecast, 2024-2034 (US$ Billion, AGR %)
Figure 155 Australia Peripheral Vascular Devices Market Forecast, 2024-2034 (US$ Billion, AGR %)
Figure 156 South Korea Peripheral Vascular Devices Market Forecast, 2024-2034 (US$ Billion, AGR %)
Figure 157 Rest of Asia Peripheral Vascular Devices Market Forecast, 2024-2034 (US$ Billion, AGR %)
Figure 158 Latin America Peripheral Vascular Devices Market Attractiveness Index
Figure 159 Latin America Peripheral Vascular Devices Market by Region, 2024, 2029 & 2034 (US$ Billion)
Figure 160 Latin America Peripheral Vascular Devices Market Forecast by Country, 2024-2034 (US$ Billion, AGR %)
Figure 161 Latin America Peripheral Vascular Devices Market Share Forecast by Country, 2024 & 2034 (%)
Figure 162 Latin America Peripheral Vascular Devices Market Forecast by Product, 2024-2034 (US$ Billion, AGR %)
Figure 163 Latin America Peripheral Vascular Devices Market Share Forecast by Product, 2024 & 2034 (%)
Figure 164 Latin America Stents Market Forecast by Type, 2024-2034 (US$ Billion, AGR %)
Figure 165 Latin America Stents Market Share Forecast by Type, 2024 & 2034 (%)
Figure 166 Latin America Catheters Market Forecast by Type, 2024-2034 (US$ Billion, AGR %)
Figure 167 Latin America Catheters Market Share Forecast by Type, 2024 & 2034 (%)
Figure 168 Latin America Endovascular Aneurysm Repair Stent Grafts Market Forecast by Type, 2024-2034 (US$ Billion, AGR %)
Figure 169 Latin America Endovascular Aneurysm Repair Stent Grafts Market Share Forecast by Type, 2024 & 2034 (%)
Figure 170 Latin America Plaque Modification Devices Market Forecast by Type, 2024-2034 (US$ Billion, AGR %)
Figure 171 Latin America Plaque Modification Devices Market Share Forecast by Type, 2024 & 2034 (%)
Figure 172 Latin America Inferior Vena Cava Filters Market Forecast by Type, 2024-2034 (US$ Billion, AGR %)
Figure 173 Latin America Inferior Vena Cava Filters Market Share Forecast by Type, 2024 & 2034 (%)
Figure 174 Latin America Hemodynamic Flow Alteration Devices Market Forecast by Type, 2024-2034 (US$ Billion, AGR %)
Figure 175 Latin America Hemodynamic Flow Alteration Devices Market Share Forecast by Type, 2024 & 2034 (%)
Figure 176 Latin America Others Market Forecast by Type, 2024-2034 (US$ Billion, AGR %)
Figure 177 Latin America Others Market Share Forecast by Type, 2024 & 2034 (%)
Figure 178 Latin America Peripheral Vascular Devices Market Forecast by End-users, 2024-2034 (US$ Billion, AGR %)
Figure 179 Latin America Peripheral Vascular Devices Market Share Forecast by End-users, 2024 & 2034 (%)
Figure 180 Brazil Peripheral Vascular Devices Market Forecast, 2024-2034 (US$ Billion, AGR %)
Figure 181 Mexico Peripheral Vascular Devices Market Forecast, 2024-2034 (US$ Billion, AGR %)
Figure 182 Argentina Peripheral Vascular Devices Market Forecast, 2024-2034 (US$ Billion, AGR %)
Figure 183 Rest of Latin America Peripheral Vascular Devices Market Forecast, 2024-2034 (US$ Billion, AGR %)
Figure 184 MEA Peripheral Vascular Devices Market Attractiveness Index
Figure 185 MEA Peripheral Vascular Devices Market by Region, 2024, 2029 & 2034 (US$ Billion)
Figure 186 MEA Peripheral Vascular Devices Market Forecast by Country, 2024-2034 (US$ Billion, AGR %)
Figure 187 MEA Peripheral Vascular Devices Market Share Forecast by Country, 2024 & 2034 (%)
Figure 188 MEA Peripheral Vascular Devices Market Forecast by Product, 2024-2034 (US$ Billion, AGR %)
Figure 189 MEA Peripheral Vascular Devices Market Share Forecast by Product, 2024 & 2034 (%)
Figure 190 MEA Stents Market Forecast by Type, 2024-2034 (US$ Billion, AGR %)
Figure 191 MEA Stents Market Share Forecast by Type, 2024 & 2034 (%)
Figure 192 MEA Catheters Market Forecast by Type, 2024-2034 (US$ Billion, AGR %)
Figure 193 MEA Catheters Market Share Forecast by Type, 2024 & 2034 (%)
Figure 194 MEA Endovascular Aneurysm Repair Stent Grafts Market Forecast by Type, 2024-2034 (US$ Billion, AGR %)
Figure 195 MEA Endovascular Aneurysm Repair Stent Grafts Market Share Forecast by Type, 2024 & 2034 (%)
Figure 196 MEA Plaque Modification Devices Market Forecast by Type, 2024-2034 (US$ Billion, AGR %)
Figure 197 MEA Plaque Modification Devices Market Share Forecast by Type, 2024 & 2034 (%)
Figure 198 MEA Inferior Vena Cava Filters Market Forecast by Type, 2024-2034 (US$ Billion, AGR %)
Figure 199 MEA Inferior Vena Cava Filters Market Share Forecast by Type, 2024 & 2034 (%)
Figure 200 MEA Hemodynamic Flow Alteration Devices Market Forecast by Type, 2024-2034 (US$ Billion, AGR %)
Figure 201 MEA Hemodynamic Flow Alteration Devices Market Share Forecast by Type, 2024 & 2034 (%)
Figure 202 MEA Others Market Forecast by Type, 2024-2034 (US$ Billion, AGR %)
Figure 203 MEA Others Market Share Forecast by Type, 2024 & 2034 (%)
Figure 204 MEA Peripheral Vascular Devices Market Forecast by End-users, 2024-2034 (US$ Billion, AGR %)
Figure 205 MEA Peripheral Vascular Devices Market Share Forecast by End-users, 2024 & 2034 (%)
Figure 206 GCC Peripheral Vascular Devices Market Forecast, 2024-2034 (US$ Billion, AGR %)
Figure 207 South Africa Peripheral Vascular Devices Market Forecast, 2024-2034 (US$ Billion, AGR %)
Figure 208 Rest of MEA Peripheral Vascular Devices Market Forecast, 2024-2034 (US$ Billion, AGR %)
Figure 209 Peripheral Vascular Devices Market: Company Share, 2023
Figure 210 Becton Dickinson and Co. (BD): Net Revenue, 2018-2023 (US$ Million, AGR%)
Figure 211 Becton Dickinson and Co. (BD): R&D, 2018-2023 (US$ Million, AGR%)
Figure 212 Becton Dickinson and Co. (BD): Regional Market Shares, 2023
Figure 213 Boston Scientific Corporation: Net Revenue, 2018-2023 (US$ Million, AGR%)
Figure 214 Boston Scientific Corporation: R&D, 2018-2023 (US$ Million, AGR%)
Figure 215 Boston Scientific Corporation: Regional Market Shares, 2023
Figure 216 Abbott Laboratories: Net Revenue, 2018-2023 (US$ Million, AGR%)
Figure 217 Abbott Laboratories: R&D, 2018-2023 (US$ Million, AGR%)
Figure 218 Abbott Laboratories: Regional Market Shares, 2023
Figure 219 Medtronic Plc: Net Revenue, 2018-2023 (US$ Million, AGR%)
Figure 220 Medtronic Plc: R&D, 2018-2023 (US$ Million, AGR%)
Figure 221 Medtronic Plc: Regional Market Shares, 2023
Figure 222 Getinge AB: Net Revenue, 2018-2023 (US$ Million, AGR%)
Figure 223 Getinge AB: R&D, 2018-2023 (US$ Million, AGR%)
Figure 224 Getinge AB: Regional Market Shares, 2023
Figure 225 Cardinal Health, Inc.: Net Revenue, 2018-2023 (US$ Million, AGR%)
Figure 226 Cardinal Health, Inc.: Regional Market Shares, 2023
Figure 227 Terumo Corporation: Net Revenue, 2018-2023 (US$ Million, AGR%)
Figure 228 Terumo Corporation: Regional Market Shares, 2023
Figure 229 Koninklijke Philips N.V.: Net Revenue, 2018-2023 (US$ Million, AGR%)
Figure 230 Koninklijke Philips N.V.: R&D, 2018-2023 (US$ Million, AGR%)
Figure 231 Koninklijke Philips N.V.: Regional Market Shares, 2023
Figure 232 B. Braun SE: Net Revenue, 2018-2023 (US$ Million, AGR%)
Figure 233 B. Braun SE: R&D, 2018-2023 (US$ Million, AGR%)
Figure 234 B. Braun SE: Regional Market Shares, 2023
Figure 235 Penumbra Inc.: Net Revenue, 2018-2023 (US$ Million, AGR%)
Figure 236 Penumbra Inc.: R&D, 2018-2023 (US$ Million, AGR%)
Figure 237 Penumbra Inc.: Regional Market Shares, 2023
Figure 238 Merit Medical Systems, Inc.: Net Revenue, 2018-2023 (US$ Million, AGR%)
Figure 239 Merit Medical Systems, Inc.: R&D, 2018-2023 (US$ Million, AGR%)
Figure 240 Merit Medical Systems, Inc.: Regional Market Shares, 2023
ページTOPに戻る
- 本レポートと同じKEY WORDの最新刊レポートはありません。
よくあるご質問
Visiongain社はどのような調査会社ですか?
英国の調査会社ヴィジョンゲイン社(Visiongain)は、通信とエネルギーのほか、自動車や化学・医薬品、金属など、広範な市場を対象に調査を行っています。自動車市場については、市場全般に関する調査のほ... もっと見る
調査レポートの納品までの日数はどの程度ですか?
在庫のあるものは速納となりますが、平均的には 3-4日と見て下さい。
但し、一部の調査レポートでは、発注を受けた段階で内容更新をして納品をする場合もあります。
発注をする前のお問合せをお願いします。
注文の手続きはどのようになっていますか?
1)お客様からの御問い合わせをいただきます。
2)見積書やサンプルの提示をいたします。
3)お客様指定、もしくは弊社の発注書をメール添付にて発送してください。
4)データリソース社からレポート発行元の調査会社へ納品手配します。
5) 調査会社からお客様へ納品されます。最近は、pdfにてのメール納品が大半です。
お支払方法の方法はどのようになっていますか?
納品と同時にデータリソース社よりお客様へ請求書(必要に応じて納品書も)を発送いたします。
お客様よりデータリソース社へ(通常は円払い)の御振り込みをお願いします。
請求書は、納品日の日付で発行しますので、翌月最終営業日までの当社指定口座への振込みをお願いします。振込み手数料は御社負担にてお願いします。
お客様の御支払い条件が60日以上の場合は御相談ください。
尚、初めてのお取引先や個人の場合、前払いをお願いすることもあります。ご了承のほど、お願いします。
データリソース社はどのような会社ですか?
当社は、世界各国の主要調査会社・レポート出版社と提携し、世界各国の市場調査レポートや技術動向レポートなどを日本国内の企業・公官庁及び教育研究機関に提供しております。
世界各国の「市場・技術・法規制などの」実情を調査・収集される時には、データリソース社にご相談ください。
お客様の御要望にあったデータや情報を抽出する為のレポート紹介や調査のアドバイスも致します。
|
|

