バイオ医薬品産業の自動化市場レポート:2024-2034
Automation in Biopharma Industry Market Report 2024-2034
レポート詳細
バイオ医薬品業界の自動化市場レポート 2024-2034年 :この調査レポートは、業界とその基礎となる原動力をより良く理解することを望むなら、新たな収益ポケットを目指す大手企業にとっ... もっと見る
※上記価格は部署ライセンス(Departmental licence)価格です。
その他の価格についてはデータリソースまでお問合せください。
日本語のページは自動翻訳を利用し作成しています。
実際のレポートは英文のみでご納品いたします。

|

|
サマリー
レポート詳細
バイオ医薬品業界の自動化市場レポート 2024-2034年:この調査レポートは、業界とその基礎となる原動力をより良く理解することを望むなら、新たな収益ポケットを目指す大手企業にとって貴重なものとなるでしょう。異業種への進出や新規地域での既存事業の拡大を目指す企業にも有用です。
機械の柔軟性向上と労働力不足が業界の成長を促進
製薬企業は、自動化ソリューションをより頻繁に使用したいという意向を示しており、75%がそのように回答している。その主な原因は、労働力不足に加えて、注射剤やより特殊な医薬品へのシフトである。例えば、注射剤は約100%拡大し、2027年まで非経口容器は年平均成長率(CAGR)5.2%で発展すると予想されている。医薬品製造システムは、プレフィルドシリンジやオーダーメイド投与などのハードルに直面している。そのため、少量のバッチサイズで生成される、より多様なフォーマットに対応するため、メーカーはダウンタイムを制限できるギアを探している。
製造業者は、経験豊富な労働者と未熟練労働者の両方が不足していた。それにもかかわらず、多くの製造業者が認識しているように、状況は過去2年間で大幅に悪化した。2022年、PMMI(包装加工技術協会)はホワイトペーパーを発表し、その中で製薬企業の33%が人員確保に問題を抱えていると述べた。自動化技術とロボット工学は、製薬会社の労働問題を解決できるかもしれない。8,000万人近いベビーブーム世代が退職し、同時に4,000万人しか新規労働者が労働力に加わらないため、今後30年間で深刻な人材不足が生じる。バイオ医薬品業界だけでも、80万人以上の労働者がいるが、6万人以上の未充足のポジションがあり、8%の労働力不足を示している。
市場調査レポートを購入する前にすべき質問とは?
-
バイオ医薬品業界の自動化市場はどのように発展しているのか?
-
バイオ医薬品産業の自動化市場の推進要因と阻害要因は何か?
-
ポイントオブケア診断の各サブマーケットは予測期間中にどのように成長し、2034年にはどれくらいの収益を占めるようになるのか?
-
2024年から2034年にかけて、バイオ医薬品産業の自動化の各サブマーケットの市場シェアはどのように推移するのか?
-
2024年から2034年にかけて、市場全体を牽引する主な要因は何か?
-
バイオ製薬業界をリードするオートメーション市場は、マクロ経済のダイナミクスに広く追随するのか、それとも個々の国内市場が他を凌駕するのか。
-
2034年までに各国市場のシェアはどのように変化し、どの地域が2034年の市場をリードするのか。
-
主要プレーヤーと予測期間中の見通しは?
-
バイオ医薬品業界の自動化プロジェクトとは?
-
2024年から2034年にかけて、業界はどのように進化するのか?オートメーションはどのような意味を持つのか?
-
現在、そして今後10年間に行われるバイオ医薬品業界のプロジェクトは?
-
バイオ医薬品業界の自動化市場をさらに拡大するために、製品の商業化の必要性は高まっていますか?
-
バイオ医薬品業界の自動化市場はどこに向かっているのか、そしてどのようにすれば市場の最前線に立てるのか?
-
新商品や新サービスに最適な投資方法とは?
-
企業を新たな成長軌道に乗せ、C-suiteに移行させるための重要な展望とは?
バイオ医薬品業界の自動化市場が、現在、そして今後10年間でどのような影響を受けるかを知る必要がある:
-
138の表、226のグラフ、そして364ページに及ぶレポート。
-
本レポートでは、業界における主要な有利分野を取り上げているため、今すぐターゲットを絞ることができる。
-
世界、地域、国の売上高と成長に関する詳細な分析が含まれている。
-
競合他社が成功した主なトレンド、変化、収益予測をハイライトします。
本レポートは、バイオ医薬品産業におけるオートメーション市場が今後10年間にどのように発展していくのか、またCOVID-19の景気後退と好転の変動に合わせてどのように発展していくのかをお伝えします。この市場は、過去10年間のどの時点よりも今が重要である。
2034年までの予測やその他の分析から、商業的な展望が明らかになる
-
2034年までの収益予測に加え、最近の実績、成長率、市場シェアも提供している。
-
ビジネスの展望や展開など、独自の分析が掲載されている。
-
定性的分析(市場ダイナミクス、促進要因、機会、阻害要因、課題など)、バイオ医薬品業界の自動化価格上昇の影響、最近の動向をご覧いただけます。
本レポートには、COVID-19が業界と貴社にどのような影響を与えるかについてのデータ分析と貴重な洞察が含まれている。本レポートでは、COVID-19の4つの回収パターンとその影響、すなわち「V」、「L」、「W」、「U」について論じている。
レポート対象セグメント
テクノロジー
-
オートメーションテクノロジー
-
デジタル化テクノロジー
オートメーションテクノロジー
-
監視制御およびデータ収集 (SCADA)
-
分散制御システム(DCS)
-
プログラマブルロジックコントローラ (PLC)
-
製造実行システム(MES)
-
ヒューマン・マシン・インターフェース(HMI)
-
アドバンスド・プロセス・コントロール(APC)
-
エンタープライズ・リソース・プランニング(ERP)
-
臨床検査情報管理システム(LIMS)
-
カスタマー・リレーションシップ・マネジメント(CRM)
-
是正措置および予防措置(CAPA)
-
OtherオートメーションTechnologies
デジタル化テクノロジー
-
モノのインターネット(IoT)
-
人工知能(AI)
-
デジタル・ツインテクノロジー
-
拡張現実(AR)と仮想現実(VR)
-
予測分析
-
クラウド・コンピューティング
用途
コンポーネント
-
オートメーションハードウェア
-
オートメーションソフトウェア
-
サービス プロジェクト段階
-
サービス運営段階
世界市場全体と各分野の売上予測に加え、5つの地域と25の主要国市場の売上予測も掲載しています:
北米
欧州
-
ドイツ
-
英国
-
フランス
-
イタリア
-
スペイン
-
スイス
-
オランダ
-
その他の欧州
アジア太平洋
-
中国
-
日本
-
インド
-
オーストラリア
-
韓国
-
東南アジア
-
その他のアジア太平洋
ラテンアメリカ
-
ブラジル
-
メキシコ
-
アルゼンチン
-
その他のラテンアメリカ
MEA
本レポートには、バイオ医薬品産業の自動化市場の2024年から2034年にかけての主要企業のプロファイルも含まれており、これらの企業の事業のこのセグメントに焦点を当てている。
主要企業と市場成長の可能性
-
ABB
-
Acieta
-
ADLINK Technology Inc.
-
AMETEK, Inc.
-
Baumüller
-
Emerson Electric Co.
-
Revvity Inc.
-
RheoSense Inc.
-
Rockwell Automation
-
Sartorius AG
-
Siemens Healthineers AG
-
TetraScience, Inc.
-
Thermo Fisher Scientific Inc.
2024年から2034年までのバイオ医薬品産業の自動化市場全体の世界売上高は、金額ベースで2024年に19億5,000万米ドルを突破する。我々は、2034年まで力強い収益成長を予測する。当研究所では、最も大きな可能性を秘めた組織を特定しています。彼らの能力、進歩、商業的展望を発見し、一歩先を行くお手伝いをします。
バイオ医薬品産業の自動化市場、2024-2034年レポートはどのように役立つのでしょうか?
要約すると、360ページを超えるレポートでは、以下のような知識を得ることができる:
-
バイオ医薬品産業の自動化市場の2024年から2034年までの収益予測。技術、オートメーション技術、デジタル化技術、アプリケーションコンポーネントの各予測を世界および地域レベルで掲載。
-
5つの地域と25の主要国市場の2034年までの収益予測 - 北米、ヨーロッパ、アジア太平洋、ラテンアメリカ、MEAのバイオ医薬品産業の自動化市場の2024年から2034年までの予測をご覧ください。また、米国、カナダ、メキシコ、ブラジル、ドイツ、フランス、英国、イタリア、スペイン、スイス、オランダ、中国、インド、日本、オーストラリア、韓国、東南アジア、アルゼンチン、GCC、南アフリカ、エジプトなどの主要経済圏の市場も予測しています。
-
2024年から2034年までのバイオ医薬品産業の自動化市場に関わる主要企業15社の企業プロファイルを含む。
独自の予測による定量的・定性的分析をご覧ください。私たちのレポートだけに含まれる情報を入手し、貴重なビジネスインテリジェンスで情報を得ることができます。
他にはない情報
私たちの新しいレポートがあれば、知識に遅れをとったり、チャンスを逃したりする可能性が低くなります。弊社のレポートが貴社の調査、分析、意思決定にどのように役立つかをご覧ください。Visiongainのこの調査レポートは、バイオ医薬品産業の自動化市場(2024年~2034年)の商業分析を必要とする、市場をリードする企業各社を対象としています。データ、トレンド、予測をご覧いただけます。
ページTOPに戻る
目次 目次 1 レポート概要
1.1 研究の目的
1.2 バイオ医薬品産業における自動化市場の紹介
1.3 本レポートの内容
1.4 本レポートを読むべき理由
1.5 本分析レポートが回答する主な質問
1.6 本レポートの対象者
1.7 方法論
1.7.1 市場の定義
1.7.2 市場評価・予測手法
1.7.3 データの検証
1.7.3.1 一次調査
1.7.3.2 セカンダリーリサーチ
1.8 よくある質問(FAQ)
1.9 Visiongainの関連レポート
1.10 Visiongainについて
2 エグゼクティブ・サマリー
3 業界構造
3.1.1 テクノロジーが最前線に
3.1.2 自動化された製造
3.1.3 医薬品製造におけるデジタルツイン
3.1.3.1 PAT手法
3.1.4 プロセスモデリング
3.1.5 高度プロセス制御
3.1.6 バイオ医薬品における規制の進展と動向
3.2 バイオ医薬品業界4.0における自動化の概要
3.2.1 バイオ医薬品における自動化の種類とレベル
3.2.2 バイオ医薬品、デジタルアプリケーション、インダストリー4.0
3.2.2.1 サプライチェーン
3.2.2.2 マーケティング活動の合理化
3.2.2.3 より効率的な人材獲得
3.2.3 製造とサプライチェーン
3.2.4 最近の動向
4 市場概要
4.1 主要な調査結果
4.2 市場ダイナミクス
4.2.1 市場促進要因
4.2.1.1 高技能労働者と低技能労働者の両方からなる労働力不足
4.2.1.2 機械の柔軟性向上へのニーズ
4.2.1.3 製品安全性向上のための技術進歩
4.2.1.4 電子バッチ記録の採用増加
4.2.2 市場抑制要因
4.2.2.1 高額設備投資の必要性が市場拡大を制限している
4.2.2.2 厳しい規制規範が市場成長を阻む
4.2.2.3 データセットの小規模化
4.2.3 市場機会
4.2.3.1 デジタル労働を利用したスマートな働き方
4.2.3.2 ロボティクスが業務に役立つとの評価が高まる
4.2.3.3 仮説から検証までのサイクルの高速化
4.3 COVID-19インパクト分析
4.4 ポーターのファイブフォース分析
4.4.1 新規参入の脅威
4.4.2 代替品の脅威
4.4.3 供給者の交渉力
4.4.4 買い手の交渉力
4.4.5 競争上のライバル関係
4.5 SWOT分析
4.6 PESTLE分析
4.6.1 バイオ医薬品産業の自動化市場に影響を与える政治的要因
4.6.2 バイオ医薬品産業の自動化市場に影響を与える経済的要因
4.6.3 バイオ医薬品産業の自動化市場に影響を与える社会的要因
4.6.4 バイオ医薬品産業の自動化市場に影響を与える技術的要因
4.6.5 バイオ医薬品産業の自動化市場に影響を与える法的要因
4.6.6 バイオ医薬品産業の自動化市場に影響を与える環境要因
4.7 医薬品産業における自動化の意義
4.7.1 充填、検査、包装の自動化
4.7.2 個別化医薬品の実現
4.7.3 研究室におけるロボット工学の活用
4.7.4 連続的で中断のない製造
4.7.5 自動制御
5 バイオ医薬品産業における自動化の技術別市場分析
5.1 主要な調査結果
5.2 技術セグメント市場魅力度指数
5.3 バイオ医薬品産業における自動化の技術別市場規模の推定と予測
5.4 自動化技術
5.4.1 2024〜2034年の地域別市場規模(百万米ドル)
5.4.2 地域別市場シェア、2024年&2034年(%)
5.5 デジタル化技術
5.5.1 地域別市場規模、2024~2034年(百万米ドル)
5.5.2 地域別市場シェア、2024年~2034年 (%)
6 バイオ医薬品産業の自動化市場:自動化技術別
6.1 主要な調査結果
6.2 オートメーション技術セグメント市場魅力度指数
6.3 バイオ医薬品産業におけるオートメーション市場:オートメーション技術別
6.4 監視制御およびデータ収集(SCADA)
6.4.1 地域別市場規模、2024年〜2034年(百万米ドル)
6.4.2 地域別市場シェア、2024年~2034年 (%)
6.5 分散型制御システム(DCS)
6.5.1 2024~2034年の地域別市場規模(百万米ドル)
6.5.2 地域別市場シェア、2024年~2034年 (%)
6.6 プログラマブルロジックコントローラ(PLC)
6.6.1 2024~2034年の地域別市場規模(百万米ドル)
6.6.2 地域別市場シェア、2024年〜2034年 (%)
6.7 製造実行システム(MES)
6.7.1 2024〜2034年の地域別市場規模(百万米ドル)
6.7.2 地域別市場シェア、2024年〜2034年(%)
6.8 ヒューマンマシンインターフェース(HMI)
6.8.1 2024~2034年の地域別市場規模(百万米ドル)
6.8.2 地域別市場シェア、2024年〜2034年 (%)
6.9 先進プロセス制御(APC)
6.9.1 地域別市場規模、2024~2034年(百万米ドル)
6.9.2 地域別市場シェア、2024年〜2034年 (%)
6.10 ERP(企業資源計画)
6.10.1 2024〜2034年地域別市場規模(百万米ドル)
6.10.2 地域別市場シェア、2024年~2034年 (%)
6.11 臨床検査情報管理システム(LIMS)
6.11.1 2024〜2034年の地域別市場規模(百万米ドル)
6.11.2 地域別市場シェア、2024年~2034年 (%)
6.12 顧客関係管理(CRM)
6.12.1 2024~2034年地域別市場規模(百万米ドル)
6.12.2 地域別市場シェア、2024年~2034年 (%)
6.13 是正処置と予防処置(CAPA)
6.13.1 地域別市場規模、2024~2034年(百万米ドル)
6.13.2 地域別市場シェア、2024年~2034年 (%)
6.14 その他の自動化技術
6.14.1 地域別市場規模、2024~2034年(百万米ドル)
6.14.2 地域別市場シェア、2024年~2034年 (%)
7 バイオ医薬品業界の自動化市場:デジタル化技術別
7.1 主要な調査結果
7.2 デジタル化技術セグメント市場魅力度指数
7.3 バイオ医薬品産業の自動化:デジタル化技術別市場規模の推定と予測
7.4 モノのインターネット(IoT)
7.4.1 2024〜2034年の地域別市場規模(百万米ドル)
7.4.2 地域別市場シェア、2024年〜2034年(%)
7.5 人工知能(AI)
7.5.1 2024~2034年の地域別市場規模(百万米ドル)
7.5.2 地域別市場シェア、2024年~2034年 (%)
7.6 デジタルツイン技術
7.6.1 2024〜2034年の地域別市場規模(百万米ドル)
7.6.2 地域別市場シェア、2024年~2034年(%)
7.7 拡張現実(AR)と仮想現実(VR)
7.7.1 拡張現実(AR)技術
7.7.2 バーチャルリアリティ(VR)技術
7.7.3 地域別市場規模、2024年~2034年(百万米ドル)
7.7.4 地域別市場シェア、2024年&2034年(%)
7.8 予測分析
7.8.1 2024〜2034年の地域別市場規模(百万米ドル)
7.8.2 地域別市場シェア、2024年〜2034年 (%)
7.9 クラウドコンピューティング
7.9.1 2024〜2034年の地域別市場規模(百万米ドル)
7.9.2 地域別市場シェア、2024年〜2034年 (%)
8 バイオ医薬品産業の自動化市場:用途別
8.1 主要な調査結果
8.2 アプリケーションタイプセグメント市場魅力度指数
8.3 バイオ医薬品産業における自動化市場:用途別予測、2024-2034年
8.4 臨床フェーズ
8.4.1 地域別市場規模、2024年〜2034年(百万米ドル)
8.4.2 地域別市場シェア、2024年〜2034年(%)
8.5 創薬フェーズ
8.5.1 2024〜2034年地域別市場規模(百万米ドル)
8.5.2 地域別市場シェア、2024年~2034年 (%)
8.6 生産段階
8.6.1 2024〜2034年地域別市場規模(百万米ドル)
8.6.2 地域別市場シェア、2024年~2034年 (%)
9 バイオ医薬品産業の自動化市場:コンポーネント別
9.1 主要な調査結果
9.2 コンポーネントセグメント市場魅力度指数
9.3 バイオ医薬品産業の自動化:コンポーネント別市場規模の推定と予測
9.4 自動化ハードウェア
9.4.1 処理装置
9.4.2 包装機器
9.4.3 地域別市場規模、2024〜2034年(百万米ドル)
9.4.4 地域別市場シェア、2024年&2034年(%)
9.5 オートメーションソフトウェア
9.5.1 地域別市場規模、2024~2034年(百万米ドル)
9.5.2 地域別市場シェア、2024~2034年 (%)
9.6 サービスプロジェクト段階
9.6.1 2024〜2034年地域別市場規模(百万米ドル)
9.6.2 地域別市場シェア、2024~2034年 (%)
9.7 サービス運用フェーズ
9.7.1 2024~2034年地域別市場規模(百万米ドル)
9.7.2 地域別市場シェア、2024年~2034年(%)
10 バイオ医薬品産業におけるオートメーションの地域別市場分析
10.1 主要な調査結果
10.2 地域別市場規模の推定と予測
11 北米バイオ医薬品産業の自動化市場分析
11.1 主要な調査結果
11.2 バイオ医薬品産業におけるオートメーション北米市場魅力度指数
11.3 北米のバイオ医薬品産業における自動化市場の国別推移(2024年、2029年、2034年) (百万米ドル
11.4 北米のバイオ医薬品産業における自動化の国別市場規模予測・展望
11.5 北米のバイオ医薬品産業における自動化の技術別市場規模予測・展望
11.5.1 バイオ医薬品産業におけるオートメーションの北米市場規模予測・自動化技術別予測
11.5.2 バイオ医薬品産業におけるオートメーションの北米市場規模予測・予測:デジタル化技術別
11.6 バイオ医薬品産業におけるオートメーションの北米市場規模予測・用途別予測
11.7 北米バイオ医薬品産業オートメーション市場規模予測・予測:コンポーネント別
11.8 バイオ医薬品産業におけるオートメーションのアメリカ市場分析
11.9 カナダのバイオ医薬品自動化産業の市場分析
12 ヨーロッパのバイオ医薬品産業の自動化市場分析
12.1 主要な調査結果
12.2 バイオ医薬品産業における欧州自動化市場魅力度指数
12.3 バイオ医薬品産業における欧州自動化市場の国別推移(2024年、2029年、2034年) (百万米ドル
12.4 バイオ医薬品産業におけるオートメーションのヨーロッパ市場規模国別推計・予測
12.5 バイオ医薬品産業におけるオートメーションのヨーロッパ市場規模予測・技術別予測
12.5.1 バイオ医薬品産業におけるオートメーションのヨーロッパ市場規模予測・自動化技術別予測
12.5.2 バイオ医薬品におけるオートメーションのヨーロッパ市場規模予測・予測:デジタル化技術別
12.6 バイオ医薬品産業におけるオートメーションのヨーロッパ市場規模予測・用途別予測
12.7 バイオ医薬品産業におけるオートメーションのヨーロッパ市場規模予測・予測:コンポーネント別
12.8 ドイツのバイオ医薬品産業の自動化市場分析
12.9 イギリスのバイオ医薬品自動化産業の市場分析
12.10 フランスのバイオ医薬品自動化産業の市場分析
12.11 イタリアのバイオ医薬品自動化産業の市場分析
12.12 スペインのバイオ医薬品産業の自動化市場の分析
12.13 スイス バイオ医薬品産業のオートメーション市場分析
12.14 オランダのバイオ医薬品産業のオートメーション市場分析
12.15 その他のヨーロッパのバイオ医薬品産業の自動化市場の分析
13 アジア太平洋地域のバイオ医薬品産業の自動化市場分析
13.1 主要な調査結果
13.2 アジア太平洋地域のバイオ医薬品産業における自動化市場魅力度指数
13.3 アジア太平洋地域のバイオ医薬品産業におけるオートメーション市場:国別、2024年、2029年&2034年(百万米ドル)
13.4 アジア太平洋地域のバイオ医薬品における自動化産業の国別市場規模推計・予測
13.5 アジア太平洋地域のバイオ医薬品産業における自動化の技術別市場規模予測・展望
13.5.1 アジア太平洋地域のバイオ医薬品における自動化産業の市場規模予測・展望:自動化技術別
13.5.2 アジア太平洋地域のバイオ医薬品における自動化産業の市場規模予測・予測:デジタル化技術別
13.6 アジア太平洋地域のバイオ医薬品産業におけるオートメーションの市場規模予測・用途別予測
13.7 アジア太平洋地域のバイオ医薬品におけるオートメーション産業の市場規模予測・展望:コンポーネント別
13.8 日本バイオ医薬品オートメーション産業市場分析
13.9 中国バイオ医薬品自動化産業の市場分析
13.10 インドのバイオ医薬品自動化産業の市場分析
13.11 オーストラリア バイオ医薬品オートメーション産業の市場分析
13.12 バイオ医薬品産業におけるオートメーションの韓国市場分析
13.13 東南アジアのバイオ医薬品産業の自動化市場の分析
13.14 その他のアジア太平洋地域のバイオ医薬品産業の自動化市場の分析
14 ラテンアメリカのバイオ医薬品産業の自動化市場分析
14.1 主要な調査結果
14.2 ラテンアメリカのバイオ医薬品産業における自動化市場魅力度指数
14.3 ラテンアメリカのバイオ医薬品産業における自動化市場の国別推移(2024年、2029年、2034年) (百万米ドル
14.4 ラテンアメリカのバイオ医薬品産業における自動化の国別市場規模予測・展望
14.5 ラテンアメリカのバイオ医薬品産業における自動化の市場規模予測・技術別予測
14.5.1 ラテンアメリカのバイオ医薬品産業におけるオートメーション市場規模予測・自動化技術別予測
14.5.2 ラテンアメリカのバイオ医薬品産業における自動化の市場規模予測・予測:デジタル化技術別
14.6 中南米のバイオ医薬品産業におけるオートメーションの市場規模予測・用途別予測
14.7 ラテンアメリカのバイオ医薬品産業におけるオートメーション市場規模予測:コンポーネント別
14.8 ブラジルのバイオ医薬品産業の自動化市場分析
14.9 メキシコのバイオ医薬品自動化産業の市場分析
14.10 アルゼンチンのバイオ医薬品自動化産業の市場分析
14.11 その他のラテンアメリカのバイオ医薬品自動化産業の市場分析
15 MEAバイオ医薬品産業の自動化市場分析
15.1 主要な調査結果
15.2 MEAのバイオ医薬品産業における自動化市場魅力度指数
15.3 MEAのバイオ医薬品産業における自動化市場の国別推移(2024年、2029年、2034年) (百万米ドル
15.4 MEAのバイオ医薬品産業における自動化の国別市場規模予測・展望
15.5 MEAのバイオ医薬品産業におけるオートメーション市場規模予測・技術別予測
15.5.1 バイオ医薬品におけるMEA自動化産業の市場規模予測・自動化技術別予測
15.5.2 MEAのバイオ医薬品産業における自動化の市場規模予測・予測:デジタル化技術別
15.6 バイオ医薬品産業におけるMEA自動化の市場規模予測・用途別予測
15.7 MEAのバイオ医薬品産業におけるオートメーションの市場規模推定と予測:コンポーネント別
15.8 GCCのバイオ医薬品産業におけるオートメーション市場分析
15.9 南アフリカのバイオ医薬品自動化産業の市場分析
15.10 エジプトのバイオ医薬品産業の自動化市場の分析
15.11 その他のMEAバイオ医薬品産業の自動化市場の分析
16 会社概要
16.1 競争環境、2023年
16.2 Revvity Inc.
16.2.1 会社概要
16.2.2 会社概要
16.2.3 財務分析
16.2.3.1 純収入、2019-2023年
16.2.3.2 R&D、2019-2023年
16.2.3.3 セグメント市場シェア、2023年
16.2.3.4 地域市場シェア、2023年
16.2.4 製品ベンチマーク
16.2.5 戦略的展望
16.3 シーメンス・ヘルスィニアースAG
16.3.1 会社概要
16.3.2 会社概要
16.3.3 財務分析
16.3.3.1 純収入、2019-2023年
16.3.3.2 R&D、2019-2023年
16.3.3.3 セグメント市場シェア、2023年
16.3.3.4 地域市場シェア(2023年
16.3.4 製品ベンチマーク
16.3.5 戦略的展望
16.4 ABB
16.4.1 会社概要
16.4.2 会社概要
16.4.3 財務分析
16.4.3.1 純収入(2019-2023年
16.4.3.2 売上高、2019-2023年
16.4.3.3 セグメント市場シェア、2023年
16.4.3.4 地域市場シェア(2023年
16.4.4 製品ベンチマーク
16.4.5 戦略的展望
16.5 ロックウェル・オートメーション
16.5.1 会社概要
16.5.2 会社概要
16.5.3 財務分析
16.5.3.1 純収入、2019-2023年
16.5.3.2 R&D、2019年~2023年
16.5.3.3 セグメント市場シェア、2023年
16.5.3.4 地域市場シェア、2023年
16.5.4 製品ベンチマーク
16.5.5 戦略的展望
16.6 サーモフィッシャーサイエンティフィック
16.6.1 会社概要
16.6.2 会社概要
16.6.3 財務分析
16.6.3.1 純収入、2018-2023年
16.6.3.2 R&D、2019年〜2023年
16.6.3.3 セグメント市場シェア、2023年
16.6.3.4 地域市場シェア、2023年
16.6.4 製品ベンチマーク
16.6.5 戦略的展望
16.7 ザルトリウスAG
16.7.1 会社概要
16.7.2 会社概要
16.7.3 財務分析
16.7.3.1 純収入、2019-2023年
16.7.3.2 R&D、2019-2023年
16.7.3.3 セグメント市場シェア、2023年
16.7.3.4 地域市場シェア(2023年
16.7.4 製品ベンチマーク
16.7.5 戦略的展望
16.8 レオセンス
16.8.1 会社概要
16.8.2 会社概要
16.8.3 製品ベンチマーク
16.8.4 戦略的展望
16.9 エマソン・エレクトリック
16.9.1 会社概要
16.9.2 会社概要
16.9.3 財務分析
16.9.3.1 純収入、2019-2023年
16.9.3.2 R&D(2019年〜2023年
16.9.3.3 セグメント市場シェア、2023年
16.9.3.4 地域市場シェア(2023年
16.9.4 製品ベンチマーク
16.9.5 戦略的展望
16.10 テトラサイエンス社
16.10.1 会社概要
16.10.2 会社概要
16.10.3 製品ベンチマーク
16.10.4 戦略的展望
16.11 ADLINK Technology Inc.
16.11.1 会社概要
16.11.2 会社概要
16.11.3 財務分析
16.11.3.1 純収入、2018-2022年
16.11.3.2 R&D、2018年~2022年
16.11.3.3 セグメント市場シェア、2022年
16.11.3.4 地域市場シェア、2022年
16.11.4 製品ベンチマーク
16.11.5 戦略的展望
16.12 アシエタ
16.12.1 会社概要
16.12.2 会社概要
16.12.3 製品ベンチマーク
16.12.4 戦略的展望
16.13 アメテック
16.13.1 会社概要
16.13.2 会社概要
16.13.3 財務分析
16.13.3.1 純収入、2019-2023年
16.13.3.2 セグメント市場シェア、2022年
16.13.3.3 地域別市場シェア、2022年
16.13.4 製品ベンチマーク
16.13.5 戦略的展望
16.14 Baumüller
16.14.1 会社概要
16.14.2 会社概要
16.14.3 製品ベンチマーク
16.14.4 戦略的展望
17 結論と提言
17.1 ビジョンゲインからの結びの言葉
17.2 市場プレイヤーへの提言
ページTOPに戻る
図表リスト
表の一覧
表1 バイオ医薬品産業の自動化市場スナップショット、2024年〜2034年(百万米ドル、CAGR)
表2 バイオ医薬品産業の自動化市場地域別予測、2024年~2034年(百万米ドル、AGR%、CAGR%):「V字型回復
表3 バイオ医薬品産業の地域別自動化市場予測、2024-2034年 (百万米ドル、AGR%、CAGR%):「U字型回復
表4 バイオ医薬品産業の地域別自動化市場予測、2024-2034年 (百万米ドル、AGR%、CAGR%):「W字型回復
表5 バイオ医薬品産業の地域別自動化市場予測、2024-2034年 (百万米ドル、AGR%、CAGR%):「L字型回復
表6 バイオ医薬品産業におけるオートメーションの技術別市場予測 2024-2034年 (百万米ドル, AGR%, CAGR%)
表7 自動化技術セグメントの地域別市場予測 2024-2034 (百万米ドル, AGR%, CAGR%)
表8 デジタル化技術の地域別市場予測、2024-2034年(百万米ドル、AGR%、CAGR)
表9 バイオ医薬品産業の自動化技術別市場予測:2024-2034年(百万米ドル、AGR%、CAGR)
表10 監視制御およびデータ収集(SCADA)地域別市場予測、2024-2034年(百万米ドル、AGR%、CAGR)
表11 分散型制御システム(DCS)の地域別市場予測、2024~2034年(百万米ドル、AGR%、CAGR)
表12 プログラマブルロジックコントローラ(PLC)の地域別市場予測、2024~2034年(百万米ドル、AGR%、CAGR)
表13 製造実行システム(MES)の地域別市場予測、2024~2034年(百万米ドル、AGR%、CAGR)
表14 ヒューマンマシンインターフェース(HMI)の地域別市場予測、2024~2034年(百万米ドル、AGR%、CAGR)
表15 アドバンスト・プロセス・コントロール(APC)の地域別市場予測、2024~2034年(百万米ドル、AGR%、CAGR)
表16 ERP(企業資源計画)の地域別市場予測、2024~2034年(百万米ドル、AGR%、CAGR)
表17 臨床検査情報管理システム(LIMS)の地域別市場予測、2024~2034年(百万米ドル、AGR%、CAGR)
表18 顧客関係管理(CRM)の地域別市場予測、2024~2034年(百万米ドル、AGR%、CAGR)
表19 是正処置と予防処置(CAPA)の地域別市場予測、2024~2034年(百万米ドル、AGR%、CAGR)
表20 その他のオートメーション技術の地域別市場予測:2024-2034年(百万米ドル、AGR%、CAGR)
表21 デジタル化技術別バイオ医薬品産業の自動化市場予測:2024-2034年(百万米ドル、AGR%、CAGR)
表22 モノのインターネット(IoT)の地域別市場予測、2024-2034年(百万米ドル、AGR%、CAGR)
表23 人工知能(AI)の地域別市場予測、2024~2034年(百万米ドル、AGR%、CAGR)
表24 デジタルツイン技術の地域別市場予測、2024〜2034年(百万米ドル、AGR%、CAGR)
表25 拡張現実(AR)と仮想現実(VR)の地域別市場予測、2024~2034年(百万米ドル、AGR%、CAGR)
表26 予測分析市場の地域別予測:2024〜2034年(百万米ドル、AGR%、CAGR)
表27 クラウドコンピューティングの地域別市場予測、2024-2034年(百万米ドル、AGR%、CAGR)
表28 バイオ医薬品産業の自動化市場:用途別予測:2024-2034年(百万米ドル、AGR%、CAGR)
表29 臨床段階の地域別市場予測、2024-2034年 (百万米ドル、AGR%、CAGR%)
表30 創薬段階の地域別市場予測、2024-2034年(百万米ドル、AGR%、CAGR)
表31 生産段階の地域別市場予測、2024-2034年(百万米ドル、AGR%、CAGR)
表32 バイオ医薬品産業におけるオートメーションの部品別市場予測:2024-2034年(百万米ドル、AGR%、CAGR)
表33 オートメーションハードウェアの地域別市場予測:2024-2034年(百万米ドル、AGR%、CAGR)
表34 オートメーションソフトウェアの地域別市場予測、2024-2034年 (百万米ドル、AGR%、CAGR%)
表35 サービスプロジェクト段階の地域別市場予測、2024年~2034年(百万米ドル、AGR%、CAGR)
表36 サービス運用フェーズの地域別市場予測、2024-2034年(百万米ドル、AGR%、CAGR)
表37 バイオ医薬品産業におけるオートメーションの地域別市場予測、2024-2034年 (百万米ドル、AGR%、CAGR%)
表38 バイオ医薬品産業におけるオートメーションの北米市場予測:国別、2024-2034年 (百万米ドル、AGR%、CAGR%)
表39 バイオ医薬品産業におけるオートメーションの北米市場技術別予測、2024-2034年 (百万米ドル、AGR%、CAGR%)
表40 バイオ医薬品産業におけるオートメーションの北米市場予測:オートメーション技術別、2024-2034年 (百万米ドル、AGR%、CAGR%)
表41 バイオ医薬品産業におけるオートメーションの北米市場予測:デジタル化技術別、2024-2034年 (百万米ドル、AGR%、CAGR%)
表42 バイオ医薬品産業におけるオートメーションの北米市場予測:用途別、2024-2034年 (百万米ドル、AGR%、CAGR%)
表43 バイオ医薬品産業におけるオートメーションの北米市場予測:コンポーネント別、2024-2034年 (百万米ドル、AGR%、CAGR%)
表44 バイオ医薬品産業における米国のオートメーション市場予測、2024-2034年 (百万米ドル、AGR%、CAGR%)
表45 バイオ医薬品産業におけるカナダのオートメーション市場予測、2024-2034年 (百万米ドル、AGR%、CAGR%)
表46 バイオ医薬品産業におけるヨーロッパの自動化市場の国別予測:2024-2034年 (百万米ドル、AGR%、CAGR%)
表47 バイオ医薬品産業におけるオートメーションのヨーロッパ市場予測:技術別、2024-2034年 (百万米ドル、AGR%、CAGR%)
表48 バイオ医薬品産業におけるオートメーションのヨーロッパ市場予測:オートメーション技術別、2024-2034年 (百万米ドル、AGR%、CAGR%)
表49 バイオ医薬品産業におけるオートメーションのヨーロッパ市場予測:デジタル化技術別、2024-2034年 (百万米ドル、AGR%、CAGR%)
表50 バイオ医薬品産業におけるオートメーションのヨーロッパ市場予測:用途別、2024-2034年 (百万米ドル、AGR%、CAGR%)
表51 バイオ医薬品産業におけるオートメーションのヨーロッパ市場予測:コンポーネント別、2024-2034年 (百万米ドル、AGR%、CAGR%)
表52 バイオ医薬品産業におけるドイツのオートメーション市場予測、2024-2034年 (百万米ドル、AGR%、CAGR%)
表 53 バイオ医薬品産業におけるイギリスのオートメーション市場予測、2024-2034 (百万米ドル、AGR%、CAGR%)
表 54 バイオ医薬品産業におけるフランスのオートメーション市場予測、2024-2034 (百万米ドル、AGR%、CAGR%)
表 55 バイオ医薬品産業におけるイタリアのオートメーション市場予測、2024-2034 (百万米ドル、AGR%、CAGR%)
表 56 バイオ医薬品産業におけるスペインのオートメーション市場予測、2024-2034 (百万米ドル、AGR%、CAGR%)
表 57 スイス バイオ医薬品産業のオートメーション市場予測、2024-2034 (百万米ドル、AGR%、CAGR%)
表58 バイオ医薬品産業におけるオランダのオートメーション市場予測、2024-2034年 (百万米ドル、AGR%、CAGR%)
表59 バイオ医薬品産業におけるオートメーションのヨーロッパ以外の地域の市場予測、2024-2034年 (百万米ドル、AGR%、CAGR%)
表60 アジア太平洋地域のバイオ医薬品産業におけるオートメーションの国別市場予測:2024-2034年 (百万米ドル、AGR%、CAGR%)
表61 アジア太平洋地域のバイオ医薬品産業におけるオートメーションの技術別市場予測、2024-2034年 (百万米ドル、AGR%、CAGR%)
表62 アジア太平洋地域のバイオ医薬品産業におけるオートメーションの市場予測:オートメーション技術別、2024-2034年 (百万米ドル、AGR%、CAGR%)
表63 アジア太平洋地域のバイオ医薬品産業におけるオートメーションの市場予測:デジタル化技術別、2024-2034年 (百万米ドル、AGR%、CAGR%)
表64 アジア太平洋地域のバイオ医薬品産業におけるオートメーションの市場予測:用途別、2024-2034年 (百万米ドル、AGR%、CAGR%)
表65 アジア太平洋地域のバイオ医薬品産業におけるオートメーションの市場予測:コンポーネント別、2024-2034年 (百万米ドル、AGR%、CAGR%)
表66 バイオ医薬品産業における日本の自動化市場の予測、2024-2034年 (百万米ドル、AGR%、CAGR%)
表67 バイオ医薬品産業における中国のオートメーション市場予測、2024-2034年 (百万米ドル、AGR%、CAGR%)
表 68 バイオ医薬品産業におけるインドのオートメーション市場予測、2024-2034年 (百万米ドル、AGR%、CAGR%)
表69 オーストラリア バイオ医薬品産業におけるオートメーションの市場予測、2024-2034年 (百万米ドル、AGR%、CAGR%)
表70 韓国 バイオ医薬品産業におけるオートメーションの市場予測、2024-2034年 (百万米ドル、AGR%、CAGR%)
表71 バイオ医薬品産業における東南アジアのオートメーション市場予測、2024-2034年 (百万米ドル、AGR%、CAGR%)
表72 バイオ医薬品産業におけるオートメーションのアジア太平洋地域以外の市場予測、2024-2034年 (百万米ドル、AGR%、CAGR%)
表73 ラテンアメリカのバイオ医薬品産業におけるオートメーションの国別市場予測:2024-2034年 (百万米ドル、AGR%、CAGR%)
表74 ラテンアメリカのバイオ医薬品産業におけるオートメーションの技術別市場予測、2024-2034年 (百万米ドル、AGR%、CAGR%)
表75 ラテンアメリカのバイオ医薬品産業におけるオートメーションの市場予測:オートメーション技術別、2024-2034年 (百万米ドル、AGR%、CAGR%)
表76 中南米のバイオ医薬品産業におけるオートメーションの市場予測:デジタル化技術別、2024-2034年 (百万米ドル、AGR%、CAGR%)
表77 中南米のバイオ医薬品産業における自動化の市場予測:用途別、2024-2034年 (百万米ドル、AGR%、CAGR%)
表78 ラテンアメリカのバイオ医薬品産業におけるオートメーションの市場予測:コンポーネント別、2024-2034年 (百万米ドル、AGR%、CAGR%)
表79 バイオ医薬品産業におけるブラジルのオートメーション市場予測、2024-2034年 (百万米ドル、AGR%、CAGR%)
表 80 バイオ医薬品産業におけるメキシコのオートメーション市場予測、2024-2034 (百万米ドル、AGR%、CAGR%)
表81 バイオ医薬品産業におけるアルゼンチンの自動化市場の予測、2024-2034年 (百万米ドル、AGR%、CAGR%)
表82 ラテンアメリカのバイオ医薬品産業におけるオートメーションの市場予測、2024-2034年 (百万米ドル、AGR%、CAGR%)
表83 MEAのバイオ医薬品産業におけるオートメーションの国別市場予測:2024-2034年 (百万米ドル、AGR%、CAGR%)
表84 MEAのバイオ医薬品産業におけるオートメーションの技術別市場予測、2024-2034年 (百万米ドル、AGR%、CAGR%)
表85 MEAのバイオ医薬品産業におけるオートメーションの市場予測:オートメーション技術別、2024-2034年 (百万米ドル、AGR%、CAGR%)
表86 MEAのバイオ医薬品産業における自動化の市場予測:デジタル化技術別、2024-2034年 (百万米ドル、AGR%、CAGR%)
表87 MEAのバイオ医薬品産業における自動化の市場予測:用途別、2024-2034年 (百万米ドル、AGR%、CAGR%)
表88 MEAのバイオ医薬品産業におけるオートメーションの部品別市場予測:2024-2034年 (百万米ドル、AGR%、CAGR%)
表89 GCCのバイオ医薬品産業におけるオートメーションの市場予測、2024-2034年 (百万米ドル、AGR%、CAGR%)
表90 南アフリカのバイオ医薬品産業におけるオートメーションの市場予測、2024-2034年 (百万米ドル、AGR%、CAGR%)
表91 エジプトのバイオ医薬品産業におけるオートメーションの市場予測、2024-2034年 (百万米ドル、AGR%、CAGR%)
表92 MEAのバイオ医薬品産業におけるオートメーションの市場予測、2024-2034年 (百万米ドル、AGR%、CAGR%)
表93 バイオ医薬品産業の自動化市場企業ランキング(2023年
表94 Revvity Inc:主な詳細(CEO, 本社, 売上高, 設立, 従業員数, 企業タイプ, ウェブサイト, 事業セグメント)
表 95 レヴィティInc:製品ベンチマーク
表96 レヴィティInc:戦略的展望
表 97 シーメンス・ヘルスィニアースAG: 主要詳細(CEO, 本社, 売上高, 設立, 従業員数, 企業タイプ, ウェブサイト, 事業セグメント)
表 98 シーメンス・ヘルスィニアース AG: 製品ベンチマーク
表99 Siemens Healthineers AG: 戦略的展望
表100 ABB: 主要詳細(CEO, 本社, 売上高, 設立, 従業員数, 企業タイプ, ウェブサイト, 事業セグメント)
表101 ABB: 製品ベンチマーク
表102 ABB:戦略的展望
表103 ロックウェル・オートメーション主な詳細(CEO, 本社, 売上高, 設立, 従業員数, 企業タイプ, ウェブサイト, 事業セグメント)
表 104 ロックウェル・オートメーション製品ベンチマーク
表105 ロックウェル・オートメーション戦略的展望
表106 Thermo Fisher Scientific Inc:主な詳細(CEO, 本社, 売上高, 設立, 従業員数, 企業タイプ, ウェブサイト, 事業セグメント)
表 107 Thermo Fisher Scientific Inc:製品ベンチマーク
表108 サーモフィッシャーサイエンティフィックInc:戦略的展望
表109 ザルトリウスAG: 主要詳細(CEO、本社、売上高、設立、従業員数、企業タイプ、ウェブサイト、事業セグメント)
表110 ザルトリウスAG:製品ベンチマーク
表111 ザルトリウスAG:戦略的展望
表112 RheoSense Inc:主な詳細(CEO, 本社, 売上高, 設立, 従業員数, 企業タイプ, ウェブサイト, 事業セグメント)
表 113 RheoSense Inc:製品ベンチマーク
表114 RheoSense Inc:戦略的展望
表115 エマソン・エレクトリック主な詳細(CEO, 本社, 売上高, 設立, 従業員数, 企業タイプ, ウェブサイト, 事業セグメント)
表 116 エマソン・エレクトリック製品のベンチマーク
表 117 エマソン・エレクトリック戦略的展望
表118 テトラサイエンス社:戦略的展望主な詳細(CEO, 本社, 売上高, 設立, 従業員数, 企業タイプ, ウェブサイト, 事業セグメント)
表 119 TetraScience, Inc:製品ベンチマーク
表 120 TetraScience, Inc:戦略的展望
表 121 ADLINK Technology Inc:主な詳細(CEO, 本社, 売上高, 設立, 従業員数, 企業タイプ, ウェブサイト, 事業セグメント)
表 122 ADLINK Technology Inc:製品ベンチマーク
表 123 ADLINK Technology Inc:戦略的展望
表124 アシエタ主な詳細(CEO, 本社, 売上高, 設立, 従業員数, 企業タイプ, ウェブサイト, 事業セグメント)
表 125 アシエタ製品ベンチマーク
表126 アシエタ戦略的展望
表127 AMETEK, Inc:主な詳細(CEO, 本社, 売上高, 設立, 従業員数, 企業タイプ, ウェブサイト, 事業セグメント)
表 128 AMETEK, Inc:製品ベンチマーク
表 129 AMETEK, Inc:戦略的展望
表130 Baumüller:主な詳細(CEO, 本社, 売上高, 設立, 従業員数, 企業タイプ, ウェブサイト, 事業セグメント)
表 131 Baumüller:製品ベンチマーク
表132 Baumüller:戦略的展望
 
図の一覧
図1 バイオ医薬品産業の自動化市場のセグメンテーション
図2 バイオ医薬品産業における自動化市場の地域別魅力度指数
図3 バイオ医薬品産業における自動化の技術別市場市場魅力度指数
図4 バイオ医薬品産業の自動化市場:自動化技術別市場魅力度指数
図5 バイオ医薬品産業の自動化市場:デジタル化技術別市場魅力度指数
図6 バイオ医薬品産業の自動化:用途別市場市場魅力度指数
図7 バイオ医薬品産業の自動化:コンポーネント別市場市場魅力度指数
図8 バイオ医薬品産業の自動化市場:市場魅力度指数市場ダイナミクス
図9 バイオ医薬品産業の自動化市場:地域別、2024-2034年(百万米ドル、AGR %):「V字型回復
図10 バイオ医薬品産業の自動化:地域別市場規模(百万米ドル、AGR %):2024年~2034年「U字型回復
図11 バイオ医薬品産業の自動化:地域別市場規模(百万米ドル、AGR %):2024年~2034年「W字型回復
図12 バイオ医薬品産業の自動化:地域別市場規模(百万米ドル、AGR %):2024年~2034年「L字型回復
図 13 バイオ医薬品産業の自動化市場:ポーターのファイブフォース分析
図14 バイオ医薬品産業の自動化市場:SWOT分析SWOT分析
図 15 バイオ医薬品業界の自動化市場:PEST分析PEST分析
図16 バイオ医薬品産業の自動化市場:技術別市場魅力度指数
図17 バイオ医薬品産業の自動化:技術別市場予測(2024-2034年)(百万米ドル、AGR
図18 バイオ医薬品産業の自動化技術市場:技術別シェア予測(2024年、2029年、2034年)
図19 オートメーション技術セグメントの地域別市場予測、2024-2034年 (百万米ドル, AGR %)
図20 自動化技術セグメントの地域別市場予測、2024年&2034年(%)
図21 デジタル化技術の地域別市場予測、2024~2034年 (百万米ドル)
図22 デジタル化技術の地域別市場シェア予測、2024年~2034年(%)
図23 バイオ医薬品産業の自動化技術別市場市場魅力度指数
図24 バイオ医薬品産業の自動化市場:タイプ別、2024年〜2034年(百万米ドル)
図25 バイオ医薬品産業のオートメーション市場:オートメーション技術別シェア予測、2024年、2029年、2034年(%)
図26 監視制御とデータ収集(SCADA)の地域別市場予測、2024~2034年 (百万米ドル)
図 27 監視制御とデータ収集(SCADA)の地域別市場予測、2024 年~2034 年 (%)
図 28 分散型制御システム(DCS)の地域別市場予測、2024~2034 年 (百万米ドル)
図 29 分散型制御システム(DCS)の地域別市場シェア予測、2024 年~2034 年 (%)
図30 プログラマブルロジックコントローラ(PLC)の地域別市場予測、2024~2034年 (百万米ドル)
図31 プログラマブルロジックコントローラ(PLC)の地域別市場予測、2024年~2034年 (%)
図32 製造実行システム(MES)の地域別市場予測、2024~2034年(百万米ドル)
図33 製造実行システム(MES)地域別市場シェア予測、2024年&2034年(%)
図34 ヒューマンマシンインターフェース(HMI)の地域別市場予測、2024~2034年 (百万米ドル)
図 35 ヒューマンマシンインターフェース(HMI)の地域別市場シェア予測、2024 年~2034 年 (%)
図36 先進プロセス制御(APC)の地域別市場予測、2024~2034年(百万米ドル)
図37 先進プロセス制御(APC)の地域別市場シェア予測、2024年~2034年 (%)
図38 ERP(統合基幹業務)地域別市場予測、2024~2034年 (百万米ドル)
図39 ERP(統合基幹業務システム)地域別市場シェア予測、2024年~2034年 (%)
図40 臨床検査情報管理システム(LIMS)の地域別市場予測、2024~2034年 (百万米ドル)
図 41 臨床検査情報管理システム(LIMS)の地域別市場シェア予測、2024~2034 年 (%)
図 42 顧客関係管理(CRM)地域別市場予測、2024~2034 年 (百万米ドル)
図43 顧客関係管理(CRM)地域別市場シェア予測、2024年~2034年(%)
図44 是正処置と予防処置(CAPA)の地域別市場予測、2024~2034年 (百万米ドル)
図45 是正処置と予防処置(CAPA)の地域別市場予測、2024年~2034年 (%)
図46 その他のオートメーション技術の地域別市場予測、2024~2034年(百万米ドル)
図47 その他の自動化技術の地域別市場シェア予測、2024年&2034年(%)
図48 デジタル化技術別バイオ医薬品産業の自動化市場市場魅力度指数
図49 バイオ医薬品産業における自動化のタイプ別市場予測、2024~2034年 (百万米ドル)
図50 バイオ医薬品産業の自動化市場タイプ別シェア予測、2024年、2029年、2034年(%)
図51 モノのインターネット(IoT)地域別市場予測、2024年~2034年(百万米ドル)
図52 モノのインターネット(IoT)地域別市場シェア予測、2024年&2034年(%)
図53 人工知能(AI)の地域別市場予測、2024~2034年(百万米ドル)
図54 人工知能(AI)市場地域別シェア予測、2024年&2034年(%)
図55 デジタルツイン技術の地域別市場予測、2024年~2034年(百万米ドル)
図56 デジタルツイン技術の地域別市場シェア予測、2024年〜2034年(%)
図57 拡張現実(AR)と仮想現実(VR)の地域別市場予測、2024~2034年(百万米ドル)
図58 拡張現実(AR)と仮想現実(VR)の地域別市場シェア予測、2024年〜2034年(%)
図59 予測分析市場の地域別予測、2024年~2034年(百万米ドル)
図60 予測分析市場地域別シェア予測、2024年〜2034年(%)
図61 クラウドコンピューティングの地域別市場予測、2024~2034年(百万米ドル)
図62 クラウドコンピューティングの地域別市場シェア予測、2024年〜2034年(%)
図63 バイオ医薬品産業におけるアプリケーション別自動化市場市場魅力度指数
図64 バイオ医薬品産業の自動化市場:用途別(2024年~2034年)(百万米ドル
図65 バイオ医薬品産業の自動化市場:アプリケーション別シェア(2024年、2029年、2034年)
図66 臨床段階の地域別市場予測、2024年〜2034年 (百万米ドル)
図67 臨床段階の地域別市場シェア予測、2024年&2034年(%)
図68 創薬段階の地域別市場予測、2024〜2034年(百万米ドル)
図69 創薬段階の地域別市場シェア予測、2024年〜2034年(%)
図70 生産段階の地域別市場展望、2024~2034年(百万米ドル)
図71 生産段階の地域別市場シェア予測、2024年&2034年(%)
図72 バイオ医薬品産業のコンポーネント別自動化市場市場魅力度指数
図73 バイオ医薬品産業の自動化:コンポーネント別市場予測(2024~2034年)(百万米ドル
図74 バイオ医薬品産業の自動化市場:コンポーネント別シェア予測(2024年、2029年、2034年)
図75 オートメーションハードウェアの地域別市場予測、2024年~2034年 (百万米ドル)
図76 自動化ハードウェアの地域別市場シェア予測、2024年&2034年(%)
図77 オートメーションソフトウェアの地域別市場予測、2024~2034年 (百万米ドル)
図78 オートメーションソフトウェアの地域別市場展望、2024年~2034年 (%)
図 79 サービスプロジェクト段階市場の地域別予測:2024~2034年(百万米ドル)
図80 サービスプロジェクトフェーズ市場地域別シェア予測、2024年~2034年(%)
図81 サービス運用フェーズの地域別市場予測、2024~2034年(百万米ドル)
図 82 サービス運用フェーズの地域別市場シェア予測、2024年~2034年(%)
図83 バイオ医薬品産業における自動化の地域別市場予測(売上高、CAGR)
図84 バイオ医薬品産業の自動化:2024年、2029年、2034年の地域別市場シェア予測(%)
図85 バイオ医薬品産業における自動化の地域別市場予測、2024年〜2034年 (百万米ドル, AGR %)
図86 北米のバイオ医薬品産業における自動化市場魅力度指数
図87 北米のバイオ医薬品産業における自動化市場:地域別(2024年、2029年、2034年) (百万米ドル
図88 北米のバイオ医薬品産業における自動化市場の国別予測、2024年~2034年 (百万米ドル、AGR %)
図89 北米のバイオ医薬品自動化産業の国別市場シェア予測、2024年 & 2034年 (%)
図90 北米のバイオ医薬品産業におけるオートメーションの技術別市場予測、2024年~2034年 (百万米ドル, AGR %)
図91 バイオ医薬品産業におけるオートメーションの北米市場技術別シェア予測、2024年 & 2034年 (%)
図92 バイオ医薬品産業におけるオートメーションの北米市場予測:オートメーション技術別、2024-2034年 (百万米ドル、AGR %)
図93 北米のバイオ医薬品自動化産業の技術別市場シェア予測、2024年~2034年 (%)
図94 バイオ医薬品産業における自動化の北米市場予測:デジタル化技術別、2024-2034年 (百万米ドル、AGR %)
図95 北米のバイオ医薬品自動化産業市場:デジタル化技術別シェア予測、2024年~2034年 (%)
図96 北米のバイオ医薬品産業における自動化の用途別市場予測、2024年~2034年 (百万米ドル, AGR %)
図97 バイオ医薬品産業におけるオートメーションの北米市場:用途別シェア予測、2024年・2034年 (%)
図98 バイオ医薬品産業におけるオートメーションの北米市場:コンポーネント別予測(2024-2034) (百万米ドル, AGR %)
図99 バイオ医薬品産業におけるオートメーションの北米市場コンポーネント別シェア予測、2024年〜2034年 (%)
図 100 バイオ医薬品産業における米国の自動化市場予測、2024-2034 (百万米ドル、AGR %)
図 101 バイオ医薬品産業におけるカナダの自動化市場予測、2024-2034 (百万米ドル, AGR %)
図 102 生物製剤産業におけるヨーロッパの自動化市場魅力度指数
図103 バイオ医薬品産業における欧州自動化市場の国別予測(2024年、2029年、2034年) (百万米ドル
図104 バイオ医薬品産業におけるオートメーションのヨーロッパ国別市場予測、2024年~2034年(百万米ドル)
図105 バイオ医薬品産業におけるヨーロッパの自動化市場国別シェア予測、2024年&2034年(%)
図106 バイオ医薬品産業におけるオートメーションのヨーロッパ市場技術別予測、2024-2034年 (百万米ドル)
図107 バイオ医薬品におけるオートメーションのヨーロッパ市場:技術別シェア予測、2024年〜2034年(%)
図108 バイオ医薬品産業におけるオートメーションのヨーロッパ市場予測:オートメーション技術別、2024~2034年 (百万米ドル)
図109 欧州バイオ医薬品オートメーション産業市場:オートメーション技術別シェア予測、2024年~2034年(%)
図110 バイオ医薬品産業における自動化のヨーロッパ市場予測:デジタル化技術別、2024〜2034年 (百万米ドル)
図111 生物製剤産業における自動化のヨーロッパ市場:デジタル化技術別予測、2024年〜2034年(%)
図112 バイオ医薬品産業における自動化のヨーロッパ市場予測:用途別、2024~2034年 (百万米ドル)
図113 バイオ医薬品産業における欧州自動化市場:用途別シェア予測、2024年・2034年(%)
図114 生物製薬産業における自動化のヨーロッパ市場:コンポーネント別予測(2024-2034) (百万米ドル)
図115 バイオ医薬品産業におけるオートメーションのヨーロッパ市場:コンポーネント別シェア予測、2024年・2034年(%)
図 116 バイオ医薬品産業におけるドイツの自動化市場予測、2024-2034 (百万米ドル, AGR %)
図 117 バイオ医薬品産業におけるイギリスのオートメーション市場予測、2024~2034 年 (US$ M, AGR %)
図 118 フランスのバイオ医薬品自動化産業の市場展望、2024~2034 年 (100 万米ドル, AGR %)
図 119 イタリアのバイオ医薬品自動化産業の市場展望、2024-2034 (US $ million, AGR %)
図 120 バイオ医薬品産業におけるスペインのオートメーション市場予測、2024-2034 年 (100 万米ドル, AGR %)
図 121 スイスのバイオ医薬品自動化産業の市場予測、2024-2034 年 (100 万米ドル, AGR %)
図 122 オランダのバイオ医薬品自動化産業の市場予測、2024~2034年 (百万米ドル, AGR %)
図 123 その他のヨーロッパのバイオ医薬品自動化産業の市場予測、2024-2034 (百万米ドル, AGR %)
図 124 生物医薬品産業におけるアジア太平洋地域の自動化市場魅力度指数
図125 アジア太平洋地域のバイオ医薬品産業における自動化市場の地域別予測(2024年、2029年、2034年) (百万米ドル
図126 アジア太平洋地域のバイオ医薬品産業におけるオートメーション市場:国別予測、2024年~2034年(百万米ドル)
図127 アジア太平洋地域のバイオ医薬品産業におけるオートメーション市場国別シェア予測、2024年~2034年(%)
図128 アジア太平洋地域のバイオ医薬品産業におけるオートメーションの技術別市場予測、2024年~2034年 (百万米ドル)
図129 アジア太平洋地域のバイオ医薬品における自動化産業の技術別市場シェア予測、2024年&2034年(%)
図130 アジア太平洋地域のバイオ医薬品産業におけるオートメーションの市場予測:オートメーション技術別、2024年~2034年(百万米ドル)
図131 アジア太平洋地域のバイオ医薬品産業における自動化の市場予測:自動化技術別シェア、2024年~2034年(%)
図132 アジア太平洋地域のバイオ医薬品産業における自動化の市場予測:デジタル化技術別、2024年~2034年 (百万米ドル)
図133 アジア太平洋地域のバイオ医薬品産業における自動化の市場予測:デジタル化技術別、2024年~2034年(%)
図134 アジア太平洋地域のバイオ医薬品産業における自動化の用途別市場予測、2024年~2034年 (百万米ドル)
図135 アジア太平洋地域のバイオ医薬品産業におけるオートメーション市場:用途別シェア予測、2024年〜2034年(%)
図136 アジア太平洋地域のバイオ医薬品産業におけるオートメーションの部品別市場予測:2024年~2034年 (百万米ドル)
図 137 アジア太平洋地域のバイオ医薬品産業におけるオートメーション市場:コンポーネント別シェア予測、2024年〜2034年(%)
図 138 バイオ医薬品産業における日本の自動化市場予測、2024-2034 (百万米ドル、AGR %)
図 139 バイオ医薬品産業における中国の自動化市場予測、2024~2034 年 (US$ Million, AGR %)
図 140 バイオ医薬品産業におけるインドのオートメーション市場予測、2024-2034 年 (US$ Million, AGR %)
図 141 オーストラリアのバイオ医薬品自動化産業の市場予測、2024-2034 年 (100 万米ドル, AGR %)
図 142 バイオ医薬品産業における韓国のオートメーション市場予測、2024-2034 (百万米ドル, AGR %)
図 143 東南アジアのバイオ医薬品オートメーション市場予測、2024-2034 (百万米ドル, AGR %)
図 144 その他のアジア太平洋地域のバイオ医薬品自動化産業の市場予測、2024-2034 (百万米ドル, AGR %)
図 145 バイオ医薬品産業における中南米の自動化市場魅力度指数
図146 ラテンアメリカのバイオ医薬品産業における自動化市場の地域別予測(2024年、2029年、2034年) (百万米ドル
図147 ラテンアメリカのバイオ医薬品産業におけるオートメーション市場予測(国別):2024~2034年(百万米ドル
図148 中南米のバイオ医薬品産業における自動化の国別市場シェア予測、2024年~2034年(%)
図149 中南米のバイオ医薬品産業における自動化の技術別市場展望、2024~2034年 (百万米ドル)
図150 ラテンアメリカのバイオ医薬品自動化産業の技術別市場シェア予測、2024年~2034年(%)
図151 ラテンアメリカのバイオ医薬品産業における自動化の市場予測:自動化技術別、2024~2034年 (百万米ドル)
図152 ラテンアメリカのバイオ医薬品産業における自動化の市場展望:自動化技術別シェア(2024年~2034年)
図153 ラテンアメリカのバイオ医薬品産業における自動化の市場予測:デジタル化技術別、2024~2034年 (百万米ドル)
図154 ラテンアメリカのバイオ医薬品産業における自動化の市場予測:デジタル化技術別、2024年・2034年 (%)
図155 ラテンアメリカのバイオ医薬品産業における自動化の用途別市場予測、2024~2034年 (百万米ドル)
図156 ラテンアメリカのバイオ医薬品産業における自動化の用途別市場展望、2024年 & 2034年 (%)
図157 ラテンアメリカのバイオ医薬品産業におけるオートメーションの市場予測:コンポーネント別(2024~2034年)
図158 ラテンアメリカのバイオ医薬品自動化産業のコンポーネント別市場シェア予測、2024年~2034年 (%)
図159 バイオ医薬品産業におけるブラジルの自動化市場予測、2024~2034年 (百万米ドル, AGR %)
図 160 メキシコのバイオ医薬品自動化産業の市場予測、2024~2034 年 (100 万米ドル, AGR %)
図 161 バイオ医薬品産業におけるアルゼンチンの自動化市場の予測、2024-2034 (百万米ドル, AGR %)
図 162 ラテンアメリカのバイオ医薬品自動化産業の市場予測、2024-2034 (百万米ドル, AGR %)
図 163 MEAバイオ医薬品産業における自動化市場の魅力度指数
図164 MEAバイオ医薬品産業における自動化の地域別市場規模(2024年、2029年&2034年:百万米ドル)
図165 MEAのバイオ医薬品産業における自動化市場の国別予測:2024年~2034年(百万米ドル)
図166 MEAバイオ医薬品産業における自動化の国別市場シェア予測、2024年~2034年(%)
図167 MEAのバイオ医薬品産業における自動化の技術別市場展望、2024~2034年 (百万米ドル)
図168 MEAのバイオ医薬品自動化産業の技術別市場シェア予測、2024年〜2034年(%)
図169 MEAのバイオ医薬品産業における自動化の技術別市場予測(2024~2034年) (百万米ドル)
図170 MEAのバイオ医薬品における自動化産業の市場予測:自動化技術別シェア、2024年~2034年(%)
図171 MEAのバイオ医薬品産業における自動化の市場予測:デジタル化技術別、2024~2034年 (百万米ドル)
図172 MEAのバイオ医薬品産業における自動化の市場予測:デジタル化技術別、2024年・2034年 (%)
図173 MEAのバイオ医薬品産業における自動化の用途別市場予測:2024-2034年 (百万米ドル)
図174 MEAバイオ医薬品オートメーション産業の用途別市場シェア予測、2024年 & 2034年 (%)
図175 MEAのバイオ医薬品産業における自動化の部品別市場予測(2024~2034年) (百万米ドル)
図176 MEAのバイオ医薬品自動化産業のコンポーネント別市場シェア予測、2024年~2034年 (%)
図 177 GCC バイオ医薬品産業における自動化の市場予測、2024~2034 年 (100 万米ドル, AGR %)
図 178 南アフリカのバイオ医薬品自動化産業の市場予測、2024~2034 年 (100 万米ドル, AGR %)
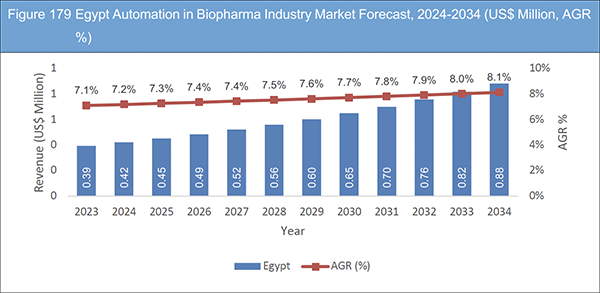
図 179 エジプトのバイオ医薬品自動化産業の市場予測、2024~2034 年 (100 万米ドル, AGR %)
図180 MEAのバイオ医薬品産業におけるオートメーション市場の予測、2024-2034年 (百万米ドル, AGR %)
図 181 Revvity Inc:純収入, 2019-2023 (百万米ドル, AGR %)
図 182 Revvity Inc:R&D, 2019-2023 (百万米ドル, AGR %)
図 183 Revvity Inc:セグメント別市場シェア、2023年
図 184 Revvity Inc:地域別市場シェア、2023年
図 185 シーメンス・ヘルティニアス AG:純収入、2019~2023 年(百万米ドル、AGR)
図 186 シーメンス・ヘルスィニアース AG: R&D, 2019-2023 (百万米ドル, AGR %)
図 187 シーメンス・ヘルティニアス AG:セグメント別市場シェア(2023 年
図 188 シーメンス・ヘルスィニアース AG:地域別市場シェア(2023 年
図 189 ABB:純収入、2019年~2023年(百万米ドル、AGR)
図190 ABB:研究開発費、2019年~2023年(百万米ドル、AGR)
図191 ABB:セグメント別市場シェア、2023年
図 192 ABB:地域別市場シェア、2023 年
図 193 ロックウェル・オートメーション純収入、2019 年~2023 年(百万米ドル、AGR %)
図 194 ロックウェル・オートメーション:R&D, 2019-2023 (百万米ドル, AGR %)
図 195 ロックウェル・オートメーションセグメント別市場シェア、2023 年
図 196 ロックウェル・オートメーション地域別市場シェア、2023年
図 197 サーモフィッシャーサイエンティフィック(Thermo Fisher Scientific Inc:純収入、2019年-2023年 (百万米ドル、AGR (%))
図 198 Thermo Fisher Scientific Inc:R&D, 2019-2023 (百万米ドル, AGR %)
図 199 Thermo Fisher Scientific Inc:セグメント別市場シェア、2023年
図 200 サーモフィッシャーサイエンティフィック社:地域別市場シェア、2023年
図 201 ザルトリウス AG:純収入、2019-2023 年(百万米ドル、AGR (%)
図202 ザルトリウスAG:R&D、2019-2023年(百万米ドル、AGR)
図 203 ザルトリウス AG:セグメント市場シェア(2023 年
図204 ザルトリウスAG:地域別市場シェア(2023年
図 205 エマソン・エレクトリック社純収入、2019 年~2023 年(百万米ドル、AGR %)
図 206 エマソン・エレクトリック社R&D, 2019-2023 (百万米ドル, AGR %)
図 207 エマソン・エレクトリック Co:セグメント別市場シェア(2023 年
図 208 エマソン・エレクトリック Co:地域別市場シェア、2023 年
図 209 ADLINK Technology Inc:純収入、2018 年~2022 年(百万米ドル、AGR %)
図 210 ADLINK Technology Inc:R&D, 2018-2022 (US$ Million, AGR %)
図 211 ADLINK Technology Inc:セグメント別市場シェア、2022 年
図 212 ADLINK Technology Inc:地域別市場シェア、2022 年
図 213 AMETEK, Inc:純収入、2019 年~2023 年 (US$ Million, AGR %)
図 214 AMETEK, Inc:セグメント別市場シェア(2022 年
図 215 AMETEK, Inc:地域別市場シェア、2022 年
ページTOPに戻る
Summary
Report Details
The Automation in Biopharma Industry Market Report 2024-2034: This report will prove invaluable to leading firms striving for new revenue pockets if they wish to better understand the industry and its underlying dynamics. It will be useful for companies that would like to expand into different industries or to expand their existing operations in a new region.
Increased Machine Flexibility and Labour Shortages Driving Industry Growth
Pharmaceutical businesses expressed their desire to use automated solutions more frequently, with 75% stating as much. The primary cause of this, in addition to a labour shortage, is the shift towards injectable and more specialized drugs. Injectable, for instance, have expanded by about 100%, and until 2027, parenteral containers are anticipated to develop at a compound annual growth rate (CAGR) of 5.2%. Pharmaceutical production systems face hurdles from things such as pre-filled syringes and customised doses. So, in order to handle the greater diversity of formats generated in smaller batch sizes, manufacturers are searching for gear that can limit downtime.
Manufacturers were experiencing a shortage of both experienced and unskilled workers; nevertheless, as many producers are aware, conditions have deteriorated significantly in the past two years. In 2022, PMMI, the Packaging and Processing Technologies Association, published a white paper in which it stated that 33% of pharmaceutical businesses were having trouble staffing their operations. Automated technologies and robotics may be able to help pharmaceutical companies with their labour problem. The retirement of almost 80 million baby boomers and the arrival of only 40 million new workers into the labour force at the same time will result in a serious talent deficit over the next 30 years. In the biopharma industry alone, there are over 800,000 workers, but there are over 60,000 unfilled positions, indicating an 8% labour shortage.
What Questions Should You Ask Before Buying a Market Research Report?
-
How is the Automation in Biopharma Industry market evolving?
-
What is driving and restraining the Automation in Biopharma Industry market?
-
How will each point of care diagnostic submarket segment grow over the forecast period and how much revenue will these submarkets account for in 2034?
-
How will the market shares for each Automation in Biopharma Industry submarket develop from 2024 to 2034?
-
What will be the main driver for the overall market from 2024 to 2034?
-
Will leading Automation in Biopharma Industry markets broadly follow the macroeconomic dynamics, or will individual national markets outperform others?
-
How will the market shares of the national markets change by 2034 and which geographical region will lead the market in 2034?
-
Who are the leading players and what are their prospects over the forecast period?
-
What are the Automation in Biopharma Industry projects for these leading companies?
-
How will the industry evolve during the period between 2024 and 2034? What are the implications of Automation in
-
Biopharma Industry projects taking place now and over the next 10 years?
-
Is there a greater need for product commercialisation to further scale the Automation in Biopharma Industry market?
-
Where is the Automation in Biopharma Industry market heading and how can you ensure you are at the forefront of the market?
-
What are the best investment options for new product and service lines?
-
What are the key prospects for moving companies into a new growth path and C-suite?
You need to discover how this will impact the Automation in Biopharma Industry market today, and over the next 10 years:
-
Our 364-page report provides 138 tables, 226 charts, and graphs exclusively to you.
-
The report highlights key lucrative areas in the industry so you can target them – NOW.
-
It contains in-depth analysis of global, regional and national sales and growth.
-
It highlights for you the key successful trends, changes and revenue projections made by your competitors.
This report tells you TODAY how the Automation in Biopharma Industry market will develop in the next 10 years, and in line with the variations in COVID-19 economic recession and bounce. This market is more critical now than at any point over the last 10 years.
Forecasts to 2034 and other analyses reveal commercial prospects
-
In addition to revenue forecasting to 2034, our new study provides you with recent results, growth rates, and market shares.
-
You will find original analyses, with business outlooks and developments.
-
Discover qualitative analyses (including market dynamics, drivers, opportunities, restraints and challenges), impact of rising Automation in Biopharma Industry prices and recent developments.
This report includes data analysis and invaluable insight into how COVID-19 will affect the industry and your company. Four COVID-19 recovery patterns and their impact, namely, “V”, “L”, “W” and “U” are discussed in this report.
Segments Covered in the Report
Technology
-
Automation Technology
-
Digitization Technology
Automation Technology
-
Supervisory Control and Data Acquisition (SCADA)
-
Distributed Control Systems (DCS)
-
Programmable Logic Controllers (PLC)
-
Manufacturing Execution System (MES)
-
Human-machine Interface (HMI)
-
Advanced Process Control (APC)
-
Enterprise Resource Planning (ERP)
-
Laboratory Information Management System (LIMS)
-
Customer Relationship Management (CRM)
-
Corrective and Preventive Actions (CAPA)
-
Other Automation Technologies
Digitization Technology
-
Internet of things (IoT)
-
Artificial Intelligence (AI)
-
Digital Twin Technology
-
Augmented Reality (AR) and Virtual Reality (VR)
-
Predictive Analytics
-
Cloud Computing
Application
-
Clinical Phase
-
Drug Discovery Phase
-
Production Phase
Component
-
Automation Hardware
-
Automation Software
-
Services Project Phase
-
Services Operation Phase
In addition to the revenue predictions for the overall world market and segments, you will also find revenue forecasts for five regional and 25 leading national markets:
North America
Europe
-
Germany
-
UK
-
France
-
Italy
-
Spain
-
Switzerland
-
Netherlands
-
Rest of Europe
Asia Pacific
-
China
-
Japan
-
India
-
Australia
-
South Korea
-
South East Asia
-
Rest of Asia Pacific
Latin America
-
Brazil
-
Mexico
-
Argentina
-
Rest of Latin America
MEA
-
GCC
-
South Africa
-
Egypt
-
Rest of MEA
The report also includes profiles and for some of the leading companies in the Automation in Biopharma Industry Market, 2024 to 2034, with a focus on this segment of these companies’ operations.
Leading companies and the potential for market growth
-
ABB
-
Acieta
-
ADLINK Technology Inc.
-
AMETEK, Inc.
-
Baumüller
-
Emerson Electric Co.
-
Revvity Inc.
-
RheoSense Inc.
-
Rockwell Automation
-
Sartorius AG
-
Siemens Healthineers AG
-
TetraScience, Inc.
-
Thermo Fisher Scientific Inc.
Overall world revenue for automation in biopharma industry market, 2024 to 2034 in terms of value the market will surpass US$1,950 million in 2024, our work calculates. We predict strong revenue growth through to 2034. Our work identifies which organizations hold the greatest potential. Discover their capabilities, progress, and commercial prospects, helping you stay ahead.
How will the Automation in Biopharma Industry Market, 2024 to 2034 report help you?
In summary, our 360+ page report provides you with the following knowledge:
-
Revenue forecasts to 2034 for Automation in Biopharma Industry Market, 2024 to 2034, with forecasts for technology, automation technology, digitization technology, application component, each forecast at a global and regional level – discover the industry’s prospects, finding the most lucrative places for investments and revenues.
-
Revenue forecasts to 2034 for five regional and 25 key national markets – See forecasts for the Automation in Biopharma Industry Market, 2024 to 2034 market in North America, Europe, Asia-Pacific, Latin America, and MEA. Also forecasted is the market in the US, Canada, Mexico, Brazil, Germany, France, UK, Italy, Spain, Switzerland, Netherlands, China, India, Japan, Australia, South Korea, South East Asia, Argentina, GCC, South Africa, and Egypt among other prominent economies.
-
Prospects for established firms and those seeking to enter the market – including company profiles for 15 of the major companies involved in the automation in biopharma industry market, 2024 to 2034.
Find quantitative and qualitative analyses with independent predictions. Receive information that only our report contains, staying informed with invaluable business intelligence.
Information found nowhere else
With our new report, you are less likely to fall behind in knowledge or miss out on opportunities. See how our work could benefit your research, analyses, and decisions. Visiongain’s study is for everybody needing commercial analyses for the Automation in Biopharma Industry Market, 2024 to 2034, market-leading companies. You will find data, trends and predictions.
ページTOPに戻る
Table of Contents
Table of Contents
1 Report Overview
1.1 Objectives of the Study
1.2 Introduction to Automation in Biopharma Industry Market
1.3 What This Report Delivers
1.4 Why You Should Read This Report
1.5 Key Questions Answered by This Analytical Report
1.6 Who is This Report for?
1.7 Methodology
1.7.1 Market Definitions
1.7.2 Market Evaluation & Forecasting Methodology
1.7.3 Data Validation
1.7.3.1 Primary Research
1.7.3.2 Secondary Research
1.8 Frequently Asked Questions (FAQs)
1.9 Associated Visiongain Reports
1.10 About Visiongain
2 Executive Summary
3 Industry Structure
3.1.1 Technology is at the Forefront
3.1.2 Automated Manufacturing
3.1.3 Digital Twin in Pharmaceutical Manufacturing
3.1.3.1 PAT Methods
3.1.4 Process Modelling
3.1.5 Advanced Process Control
3.1.6 Regulatory Developments and Trends in Biopharma
3.2 Overview of Automation in Biopharma Industry 4.0
3.2.1 Types & Levels of Automation in Biopharma
3.2.2 Biopharma, Digital Applications, and Industry 4.0
3.2.2.1 Supply Chain
3.2.2.2 Streamlining Marketing Efforts
3.2.2.3 Acquiring Talent More Efficiently
3.2.3 Manufacturing and Supply Chain
3.2.4 Recent Trends & Developments
4 Market Overview
4.1 Key Findings
4.2 Market Dynamics
4.2.1 Market Driving Factors
4.2.1.1 Labour Shortages Comprising Both High- and Low-Skilled Workers
4.2.1.2 Need for Increased Machine Flexibility
4.2.1.3 Technological Advancements to Improve Product Safety
4.2.1.4 Increased Adoption of Electronic Batch Records
4.2.2 Market Restraining Factors
4.2.2.1 Need for High Capital Investment Limits the Market Expansion
4.2.2.2 Stringent Regulatory Norms to Challenge Market Growth
4.2.2.3 Smaller Datasets
4.2.3 Market Opportunities
4.2.3.1 Working Smarter Using Digital Labour
4.2.3.2 Robotics are Increasingly Regarded as Valuable to Operations
4.2.3.3 Faster Hypothesis to Testing Cycles
4.3 COVID-19 Impact Analysis
4.4 Porter’s Five Forces Analysis
4.4.1 Threat of New Entrants
4.4.2 Threat of Substitutes
4.4.3 Bargaining Power of Suppliers
4.4.4 Bargaining Power of Buyers
4.4.5 Competitive Rivalry
4.5 SWOT Analysis
4.6 PESTLE Analysis
4.6.1 Political Factors Impacting Automation in Biopharma Industry Market
4.6.2 Economic Factors Impacting Automation in Biopharma Industry Market
4.6.3 Social Factors Impacting Automation in Biopharma Industry Market
4.6.4 Technological Factors Impacting Automation in Biopharma Industry Market
4.6.5 Legal Factors Impacting Automation in Biopharma Industry Market
4.6.6 Environmental Factors Impacting Automation in Biopharma Industry Market
4.7 Significance of Automation in the Pharmaceutical Industries
4.7.1 Automated Filling, Inspection, and Packaging
4.7.2 Making Personalised Medicines a Reality
4.7.3 Involving Robotics in the Laboratory
4.7.4 Continuous, Uninterrupted Manufacturing
4.7.5 Automatic Control
5 Automation in Biopharma Industry Market Analysis by Technology
5.1 Key Findings
5.2 Technology Segment: Market Attractiveness Index
5.3 Automation in Biopharma Industry Market Size Estimation and Forecast by Technology
5.4 Automation Technology
5.4.1 Market Size by Region, 2024-2034 (US$ Million)
5.4.2 Market Share by Region, 2024 & 2034 (%)
5.5 Digitization Technology
5.5.1 Market Size by Region, 2024-2034 (US$ Million)
5.5.2 Market Share by Region, 2024 & 2034 (%)
6 Automation in Biopharma Industry Market by Automation Technology
6.1 Key Findings
6.2 Automation Technology Segment: Market Attractiveness Index
6.3 Automation in Biopharma Industry Market, by Automation Technology
6.4 Supervisory Control and Data Acquisition (SCADA)
6.4.1 Market Size by Region, 2024-2034 (US$ Million)
6.4.2 Market Share by Region, 2024 & 2034 (%)
6.5 Distributed Control Systems (DCS)
6.5.1 Market Size by Region, 2024-2034 (US$ Million)
6.5.2 Market Share by Region, 2024 & 2034 (%)
6.6 Programmable Logic Controllers (PLC)
6.6.1 Market Size by Region, 2024-2034 (US$ Million)
6.6.2 Market Share by Region, 2024 & 2034 (%)
6.7 Manufacturing Execution System (MES)
6.7.1 Market Size by Region, 2024-2034 (US$ Million)
6.7.2 Market Share by Region, 2024 & 2034 (%)
6.8 Human-machine Interface (HMI)
6.8.1 Market Size by Region, 2024-2034 (US$ Million)
6.8.2 Market Share by Region, 2024 & 2034 (%)
6.9 Advanced Process Control (APC)
6.9.1 Market Size by Region, 2024-2034 (US$ Million)
6.9.2 Market Share by Region, 2024 & 2034 (%)
6.10 Enterprise Resource Planning (ERP)
6.10.1 Market Size by Region, 2024-2034 (US$ Million)
6.10.2 Market Share by Region, 2024 & 2034 (%)
6.11 Laboratory Information Management System (LIMS)
6.11.1 Market Size by Region, 2024-2034 (US$ Million)
6.11.2 Market Share by Region, 2024 & 2034 (%)
6.12 Customer Relationship Management (CRM)
6.12.1 Market Size by Region, 2024-2034 (US$ Million)
6.12.2 Market Share by Region, 2024 & 2034 (%)
6.13 Corrective and Preventive Actions (CAPA)
6.13.1 Market Size by Region, 2024-2034 (US$ Million)
6.13.2 Market Share by Region, 2024 & 2034 (%)
6.14 Other Automation Technologies
6.14.1 Market Size by Region, 2024-2034 (US$ Million)
6.14.2 Market Share by Region, 2024 & 2034 (%)
7 Automation in Biopharma Industry Market by Digitization Technology
7.1 Key Findings
7.2 Digitization Technology Segment: Market Attractiveness Index
7.3 Automation in Biopharma Industry Market Size Estimation and Forecast by Digitization Technology
7.4 Internet of Things (IoT)
7.4.1 Market Size by Region, 2024-2034 (US$ Million)
7.4.2 Market Share by Region, 2024 & 2034 (%)
7.5 Artificial Intelligence (AI)
7.5.1 Market Size by Region, 2024-2034 (US$ Million)
7.5.2 Market Share by Region, 2024 & 2034 (%)
7.6 Digital Twin Technology
7.6.1 Market Size by Region, 2024-2034 (US$ Million)
7.6.2 Market Share by Region, 2024 & 2034 (%)
7.7 Augmented Reality (AR) and Virtual Reality (VR)
7.7.1 Augmented Reality (AR) Technology
7.7.2 Virtual Reality (VR) Technology
7.7.3 Market Size by Region, 2024-2034 (US$ Million)
7.7.4 Market Share by Region, 2024 & 2034 (%)
7.8 Predictive Analytics
7.8.1 Market Size by Region, 2024-2034 (US$ Million)
7.8.2 Market Share by Region, 2024 & 2034 (%)
7.9 Cloud Computing
7.9.1 Market Size by Region, 2024-2034 (US$ Million)
7.9.2 Market Share by Region, 2024 & 2034 (%)
8 Automation in Biopharma Industry Market by Application
8.1 Key Findings
8.2 Application Type Segment: Market Attractiveness Index
8.3 Automation in Biopharma Industry Market by Application Forecast, 2024-2034
8.4 Clinical Phase
8.4.1 Market Size by Region, 2024-2034 (US$ Million)
8.4.2 Market Share by Region, 2024 & 2034 (%)
8.5 Drug Discovery Phase
8.5.1 Market Size by Region, 2024-2034 (US$ Million)
8.5.2 Market Share by Region, 2024 & 2034 (%)
8.6 Production Phase
8.6.1 Market Size by Region, 2024-2034 (US$ Million)
8.6.2 Market Share by Region, 2024 & 2034 (%)
9 Automation in Biopharma Industry Market by Component
9.1 Key Findings
9.2 Component Segment: Market Attractiveness Index
9.3 Automation in Biopharma Industry Market Size Estimation and Forecast by Component
9.4 Automation Hardware
9.4.1 Processing equipment
9.4.2 Packaging Equipment
9.4.3 Market Size by Region, 2024-2034 (US$ Million)
9.4.4 Market Share by Region, 2024 & 2034 (%)
9.5 Automation Software
9.5.1 Market Size by Region, 2024-2034 (US$ Million)
9.5.2 Market Share by Region, 2024 & 2034 (%)
9.6 Services Project Phase
9.6.1 Market Size by Region, 2024-2034 (US$ Million)
9.6.2 Market Share by Region, 2024 & 2034 (%)
9.7 Services Operation Phase
9.7.1 Market Size by Region, 2024-2034 (US$ Million)
9.7.2 Market Share by Region, 2024 & 2034 (%)
10 Automation in Biopharma Industry Market Analysis by Region
10.1 Key Findings
10.2 Regional Market Size Estimation and Forecast
11 North America Automation in Biopharma Industry Market Analysis
11.1 Key Findings
11.2 North America Automation in Biopharma Industry Market Attractiveness Index
11.3 North America Automation in Biopharma Industry Market by Country, 2024, 2029 & 2034 (US$ Million)
11.4 North America Automation in Biopharma Industry Market Size Estimation and Forecast by Country
11.5 North America Automation in Biopharma Industry Market Size Estimation and Forecast by Technology
11.5.1 North America Automation in Biopharma Industry Market Size Estimation and Forecast by Automation Technology
11.5.2 North America Automation in Biopharma Industry Market Size Estimation and Forecast by Digitization Technology
11.6 North America Automation in Biopharma Industry Market Size Estimation and Forecast by Application
11.7 North America Automation in Biopharma Industry Market Size Estimation and Forecast by Component
11.8 U.S. Automation in Biopharma Industry Market Analysis
11.9 Canada Automation in Biopharma Industry Market Analysis
12 Europe Automation in Biopharma Industry Market Analysis
12.1 Key Findings
12.2 Europe Automation in Biopharma Industry Market Attractiveness Index
12.3 Europe Automation in Biopharma Industry Market by Country, 2024, 2029 & 2034 (US$ Million)
12.4 Europe Automation in Biopharma Industry Market Size Estimation and Forecast by Country
12.5 Europe Automation in Biopharma Industry Market Size Estimation and Forecast by Technology
12.5.1 Europe Automation in Biopharma Industry Market Size Estimation and Forecast by Automation Technology
12.5.2 Europe Automation in Biopharma Industry Market Size Estimation and Forecast by Digitization Technology
12.6 Europe Automation in Biopharma Industry Market Size Estimation and Forecast by Application
12.7 Europe Automation in Biopharma Industry Market Size Estimation and Forecast by Component
12.8 Germany Automation in Biopharma Industry Market Analysis
12.9 UK Automation in Biopharma Industry Market Analysis
12.10 France Automation in Biopharma Industry Market Analysis
12.11 Italy Automation in Biopharma Industry Market Analysis
12.12 Spain Automation in Biopharma Industry Market Analysis
12.13 Switzerland Automation in Biopharma Industry Market Analysis
12.14 Netherlands Automation in Biopharma Industry Market Analysis
12.15 Rest of Europe Automation in Biopharma Industry Market Analysis
13 Asia Pacific Automation in Biopharma Industry Market Analysis
13.1 Key Findings
13.2 Asia Pacific Automation in Biopharma Industry Market Attractiveness Index
13.3 Asia Pacific Automation in Biopharma Industry Market by Country, 2024, 2029 & 2034 (US$ Million)
13.4 Asia Pacific Automation in Biopharma Industry Market Size Estimation and Forecast by Country
13.5 Asia Pacific Automation in Biopharma Industry Market Size Estimation and Forecast by Technology
13.5.1 Asia Pacific Automation in Biopharma Industry Market Size Estimation and Forecast by Automation Technology
13.5.2 Asia Pacific Automation in Biopharma Industry Market Size Estimation and Forecast by Digitization Technology
13.6 Asia Pacific Automation in Biopharma Industry Market Size Estimation and Forecast by Application
13.7 Asia Pacific Automation in Biopharma Industry Market Size Estimation and Forecast by Component
13.8 Japan Automation in Biopharma Industry Market Analysis
13.9 China Automation in Biopharma Industry Market Analysis
13.10 India Automation in Biopharma Industry Market Analysis
13.11 Australia Automation in Biopharma Industry Market Analysis
13.12 South Korea Automation in Biopharma Industry Market Analysis
13.13 South East Asia Automation in Biopharma Industry Market Analysis
13.14 Rest of Asia Pacific Automation in Biopharma Industry Market Analysis
14 Latin America Automation in Biopharma Industry Market Analysis
14.1 Key Findings
14.2 Latin America Automation in Biopharma Industry Market Attractiveness Index
14.3 Latin America Automation in Biopharma Industry Market by Country, 2024, 2029 & 2034 (US$ Million)
14.4 Latin America Automation in Biopharma Industry Market Size Estimation and Forecast by Country
14.5 Latin America Automation in Biopharma Industry Market Size Estimation and Forecast by Technology
14.5.1 Latin America Automation in Biopharma Industry Market Size Estimation and Forecast by Automation Technology
14.5.2 Latin America Automation in Biopharma Industry Market Size Estimation and Forecast by Digitization Technology
14.6 Latin America Automation in Biopharma Industry Market Size Estimation and Forecast by Application
14.7 Latin America Automation in Biopharma Industry Market Size Estimation and Forecast by Component
14.8 Brazil Automation in Biopharma Industry Market Analysis
14.9 Mexico Automation in Biopharma Industry Market Analysis
14.10 Argentina Automation in Biopharma Industry Market Analysis
14.11 Rest of Latin America Automation in Biopharma Industry Market Analysis
15 MEA Automation in Biopharma Industry Market Analysis
15.1 Key Findings
15.2 MEA Automation in Biopharma Industry Market Attractiveness Index
15.3 MEA Automation in Biopharma Industry Market by Country, 2024, 2029 & 2034 (US$ Million)
15.4 MEA Automation in Biopharma Industry Market Size Estimation and Forecast by Country
15.5 MEA Automation in Biopharma Industry Market Size Estimation and Forecast by Technology
15.5.1 MEA Automation in Biopharma Industry Market Size Estimation and Forecast by Automation Technology
15.5.2 MEA Automation in Biopharma Industry Market Size Estimation and Forecast by Digitization Technology
15.6 MEA Automation in Biopharma Industry Market Size Estimation and Forecast by Application
15.7 MEA Automation in Biopharma Industry Market Size Estimation and Forecast by Component
15.8 GCC Automation in Biopharma Industry Market Analysis
15.9 South Africa Automation in Biopharma Industry Market Analysis
15.10 Egypt Automation in Biopharma Industry Market Analysis
15.11 Rest of MEA Automation in Biopharma Industry Market Analysis
16 Company Profiles
16.1 Competitive Landscape, 2023
16.2 Revvity Inc.
16.2.1 Company Snapshot
16.2.2 Company Overview
16.2.3 Financial Analysis
16.2.3.1 Net Revenue, 2019-2023
16.2.3.2 R&D, 2019-2023
16.2.3.3 Segment Market Shares, 2023
16.2.3.4 Regional Market Shares, 2023
16.2.4 Product Benchmarking
16.2.5 Strategic Outlook
16.3 Siemens Healthineers AG
16.3.1 Company Snapshot
16.3.2 Company Overview
16.3.3 Financial Analysis
16.3.3.1 Net Revenue, 2019-2023
16.3.3.2 R&D, 2019-2023
16.3.3.3 Segment Market Shares, 2023
16.3.3.4 Regional Market Shares, 2023
16.3.4 Product Benchmarking
16.3.5 Strategic Outlook
16.4 ABB
16.4.1 Company Snapshot
16.4.2 Company Overview
16.4.3 Financial Analysis
16.4.3.1 Net Revenue, 2019-2023
16.4.3.2 R&D, 2019-2023
16.4.3.3 Segment Market Shares, 2023
16.4.3.4 Regional Market Shares, 2023
16.4.4 Product Benchmarking
16.4.5 Strategic Outlook
16.5 Rockwell Automation
16.5.1 Company Snapshot
16.5.2 Company Overview
16.5.3 Financial Analysis
16.5.3.1 Net Revenue, 2019-2023
16.5.3.2 R&D, 2019-2023
16.5.3.3 Segment Market Shares, 2023
16.5.3.4 Regional Market Shares, 2023
16.5.4 Product Benchmarking
16.5.5 Strategic Outlook
16.6 Thermo Fisher Scientific Inc.
16.6.1 Company Snapshot
16.6.2 Company Overview
16.6.3 Financial Analysis
16.6.3.1 Net Revenue, 2018-2023
16.6.3.2 R&D, 2019-2023
16.6.3.3 Segment Market Shares, 2023
16.6.3.4 Regional Market Shares, 2023
16.6.4 Product Benchmarking
16.6.5 Strategic Outlook
16.7 Sartorius AG
16.7.1 Company Snapshot
16.7.2 Company Overview
16.7.3 Financial Analysis
16.7.3.1 Net Revenue, 2019-2023
16.7.3.2 R&D, 2019-2023
16.7.3.3 Segment Market Shares, 2023
16.7.3.4 Regional Market Shares, 2023
16.7.4 Product Benchmarking
16.7.5 Strategic Outlook
16.8 RheoSense Inc.
16.8.1 Company Snapshot
16.8.2 Company Overview
16.8.3 Product Benchmarking
16.8.4 Strategic Outlook
16.9 Emerson Electric Co.
16.9.1 Company Snapshot
16.9.2 Company Overview
16.9.3 Financial Analysis
16.9.3.1 Net Revenue, 2019-2023
16.9.3.2 R&D, 2019-2023
16.9.3.3 Segment Market Shares, 2023
16.9.3.4 Regional Market Shares, 2023
16.9.4 Product Benchmarking
16.9.5 Strategic Outlook
16.10 TetraScience, Inc.
16.10.1 Company Snapshot
16.10.2 Company Overview
16.10.3 Product Benchmarking
16.10.4 Strategic Outlook
16.11 ADLINK Technology Inc.
16.11.1 Company Snapshot
16.11.2 Company Overview
16.11.3 Financial Analysis
16.11.3.1 Net Revenue, 2018-2022
16.11.3.2 R&D, 2018-2022
16.11.3.3 Segment Market Shares, 2022
16.11.3.4 Regional Market Shares, 2022
16.11.4 Product Benchmarking
16.11.5 Strategic Outlook
16.12 Acieta
16.12.1 Company Snapshot
16.12.2 Company Overview
16.12.3 Product Benchmarking
16.12.4 Strategic Outlook
16.13 AMETEK, Inc.
16.13.1 Company Snapshot
16.13.2 Company Overview
16.13.3 Financial Analysis
16.13.3.1 Net Revenue, 2019-2023
16.13.3.2 Segment Market Shares, 2022
16.13.3.3 Regional Market Shares, 2022
16.13.4 Product Benchmarking
16.13.5 Strategic Outlook
16.14 Baumüller
16.14.1 Company Snapshot
16.14.2 Company Overview
16.14.3 Product Benchmarking
16.14.4 Strategic Outlook
17 Conclusion and Recommendations
17.1 Concluding Remarks from Visiongain
17.2 Recommendations for Market Players
ページTOPに戻る
List of Tables/Graphs
List of Tables
Table 1 Automation in Biopharma Industry Market Snapshot, 2024 & 2034 (US$ Million, CAGR %)
Table 2 Automation in Biopharma Industry Market Forecast by Region, 2024-2034 (US$ Million, AGR%, CAGR%): “V” Shaped Recovery
Table 3 Automation in Biopharma Industry Market Forecast by Region, 2024-2034 (US$ Million, AGR%, CAGR%): “U” Shaped Recovery
Table 4 Automation in Biopharma Industry Market Forecast by Region, 2024-2034 (US$ Million, AGR%, CAGR%): “W” Shaped Recovery
Table 5 Automation in Biopharma Industry Market Forecast by Region, 2024-2034 (US$ Million, AGR%, CAGR%): “L” Shaped Recovery
Table 6 Automation in Biopharma Industry Market Forecast by Technology 2024-2034 (US$ Million, AGR%, CAGR%)
Table 7 Automation Technology Segment Market Forecast by Region, 2024-2034 (US$ Million, AGR%, CAGR%)
Table 8 Digitization Technology Market Forecast by Region, 2024-2034 (US$ Million, AGR%, CAGR%)
Table 9 Automation in Biopharma Industry Market by Automation Technology, 2024-2034 (US$ Million, AGR%, CAGR%)
Table 10 Supervisory Control and Data Acquisition (SCADA) Market Forecast by Region, 2024-2034 (US$ Million, AGR%, CAGR%)
Table 11 Distributed Control Systems (DCS) Market Forecast by Region, 2024-2034 (US$ Million, AGR%, CAGR%)
Table 12 Programmable Logic Controllers (PLC) Market Forecast by Region, 2024-2034 (US$ Million, AGR%, CAGR%)
Table 13 Manufacturing Execution System (MES)Market Forecast by Region, 2024-2034 (US$ Million, AGR%, CAGR%)
Table 14 Human-machine Interface (HMI) Market Forecast by Region, 2024-2034 (US$ Million, AGR%, CAGR%)
Table 15 Advanced Process Control (APC)Market Forecast by Region, 2024-2034 (US$ Million, AGR%, CAGR%)
Table 16 Enterprise Resource Planning (ERP)Market Forecast by Region, 2024-2034 (US$ Million, AGR%, CAGR%)
Table 17 Laboratory Information Management System (LIMS)Market Forecast by Region, 2024-2034 (US$ Million, AGR%, CAGR%)
Table 18 Customer Relationship Management (CRM)Market Forecast by Region, 2024-2034 (US$ Million, AGR%, CAGR%)
Table 19 Corrective and Preventive Actions (CAPA)Market Forecast by Region, 2024-2034 (US$ Million, AGR%, CAGR%)
Table 20 Other Automation Technologies Market Forecast by Region, 2024-2034 (US$ Million, AGR%, CAGR%)
Table 21 Automation in Biopharma Industry Market Forecast by Digitization Technology, 2024-2034 (US$ Million, AGR%, CAGR%)
Table 22 Internet of things (IoT) Market Forecast by Region, 2024-2034 (US$ Million, AGR%, CAGR%)
Table 23 Artificial Intelligence (AI) Market Forecast by Region, 2024-2034 (US$ Million, AGR%, CAGR%)
Table 24 Digital Twin Technology Market Forecast by Region, 2024-2034 (US$ Million, AGR%, CAGR%)
Table 25 Augmented Reality (AR) and Virtual Reality (VR) Market Forecast by Region, 2024-2034 (US$ Million, AGR%, CAGR%)
Table 26 Predictive Analytics Market Forecast by Region, 2024-2034 (US$ Million, AGR%, CAGR%)
Table 27 Cloud Computing Market Forecast by Region, 2024-2034 (US$ Million, AGR%, CAGR%)
Table 28 Automation in Biopharma Industry Market by Application, 2024-2034 (US$ Million, AGR%, CAGR%)
Table 29 Clinical Phase Market Forecast by Region, 2024-2034 (US$ Million, AGR%, CAGR%)
Table 30 Drug Discovery Phase Market Forecast by Region, 2024-2034 (US$ Million, AGR%, CAGR%)
Table 31 Production Phase Market Forecast by Region, 2024-2034 (US$ Million, AGR%, CAGR%)
Table 32 Automation in Biopharma Industry Market Forecast by Component, 2024-2034 (US$ Million, AGR%, CAGR%)
Table 33 Automation Hardware Market Forecast by Region, 2024-2034 (US$ Million, AGR%, CAGR%)
Table 34 Automation Software Market Forecast by Region, 2024-2034 (US$ Million, AGR%, CAGR%)
Table 35 Services Project Phase Market Forecast by Region, 2024-2034 (US$ Million, AGR%, CAGR%)
Table 36 Services Operation Phase Market Forecast by Region, 2024-2034 (US$ Million, AGR%, CAGR%)
Table 37 Automation in Biopharma Industry Market Forecast by Region, 2024-2034 (US$ Million, AGR%, CAGR%)
Table 38 North America Automation in Biopharma Industry Market Forecast by Country, 2024-2034 (US$ Million, AGR%, CAGR%)
Table 39 North America Automation in Biopharma Industry Market Forecast by Technology, 2024-2034 (US$ Million, AGR%, CAGR%)
Table 40 North America Automation in Biopharma Industry Market Forecast by Automation Technology, 2024-2034 (US$ Million, AGR%, CAGR%)
Table 41 North America Automation in Biopharma Industry Market Forecast by Digitization Technology, 2024-2034 (US$ Million, AGR%, CAGR%)
Table 42 North America Automation in Biopharma Industry Market Forecast by Application, 2024-2034 (US$ Million, AGR%, CAGR%)
Table 43 North America Automation in Biopharma Industry Market Forecast by Component, 2024-2034 (US$ Million, AGR%, CAGR%)
Table 44 U.S. Automation in Biopharma Industry Market Forecast, 2024-2034 (US$ Million, AGR%, CAGR%)
Table 45 Canada Automation in Biopharma Industry Market Forecast, 2024-2034 (US$ Million, AGR%, CAGR%)
Table 46 Europe Automation in Biopharma Industry Market Forecast by Country, 2024-2034 (US$ Million, AGR%, CAGR%)
Table 47 Europe Automation in Biopharma Industry Market Forecast by Technology, 2024-2034 (US$ Million, AGR%, CAGR%)
Table 48 Europe Automation in Biopharma Industry Market Forecast by Automation Technology, 2024-2034 (US$ Million, AGR%, CAGR%)
Table 49 Europe Automation in Biopharma Industry Market Forecast by Digitization Technology, 2024-2034 (US$ Million, AGR%, CAGR%)
Table 50 Europe Automation in Biopharma Industry Market Forecast by Application, 2024-2034 (US$ Million, AGR%, CAGR%)
Table 51 Europe Automation in Biopharma Industry Market Forecast by Component, 2024-2034 (US$ Million, AGR%, CAGR%)
Table 52 Germany Automation in Biopharma Industry Market Forecast, 2024-2034 (US$ Million, AGR%, CAGR%)
Table 53 UK Automation in Biopharma Industry Market Forecast, 2024-2034 (US$ Million, AGR%, CAGR%)
Table 54 France Automation in Biopharma Industry Market Forecast, 2024-2034 (US$ Million, AGR%, CAGR%)
Table 55 Italy Automation in Biopharma Industry Market Forecast, 2024-2034 (US$ Million, AGR%, CAGR%)
Table 56 Spain Automation in Biopharma Industry Market Forecast, 2024-2034 (US$ Million, AGR%, CAGR%)
Table 57 Switzerland Automation in Biopharma Industry Market Forecast, 2024-2034 (US$ Million, AGR%, CAGR%)
Table 58 Netherlands Automation in Biopharma Industry Market Forecast, 2024-2034 (US$ Million, AGR%, CAGR%)
Table 59 Rest of Europe Automation in Biopharma Industry Market Forecast, 2024-2034 (US$ Million, AGR%, CAGR%)
Table 60 Asia Pacific Automation in Biopharma Industry Market Forecast by Country, 2024-2034 (US$ Million, AGR%, CAGR%)
Table 61 Asia Pacific Automation in Biopharma Industry Market Forecast by Technology, 2024-2034 (US$ Million, AGR%, CAGR%)
Table 62 Asia Pacific Automation in Biopharma Industry Market Forecast by Automation Technology, 2024-2034 (US$ Million, AGR%, CAGR%)
Table 63 Asia Pacific Automation in Biopharma Industry Market Forecast by Digitization Technology, 2024-2034 (US$ Million, AGR%, CAGR%)
Table 64 Asia Pacific Automation in Biopharma Industry Market Forecast by Application, 2024-2034 (US$ Million, AGR%, CAGR%)
Table 65 Asia Pacific Automation in Biopharma Industry Market Forecast by Component, 2024-2034 (US$ Million, AGR%, CAGR%)
Table 66 Japan Automation in Biopharma Industry Market Forecast, 2024-2034 (US$ Million, AGR%, CAGR%)
Table 67 China Automation in Biopharma Industry Market Forecast, 2024-2034 (US$ Million, AGR%, CAGR%)
Table 68 India Automation in Biopharma Industry Market Forecast, 2024-2034 (US$ Million, AGR%, CAGR%)
Table 69 Australia Automation in Biopharma Industry Market Forecast, 2024-2034 (US$ Million, AGR%, CAGR%)
Table 70 South Korea Automation in Biopharma Industry Market Forecast, 2024-2034 (US$ Million, AGR%, CAGR%)
Table 71 South East Asia Automation in Biopharma Industry Market Forecast, 2024-2034 (US$ Million, AGR%, CAGR%)
Table 72 Rest of Asia Pacific Automation in Biopharma Industry Market Forecast, 2024-2034 (US$ Million, AGR%, CAGR%)
Table 73 Latin America Automation in Biopharma Industry Market Forecast by Country, 2024-2034 (US$ Million, AGR%, CAGR%)
Table 74 Latin America Automation in Biopharma Industry Market Forecast by Technology, 2024-2034 (US$ Million, AGR%, CAGR%)
Table 75 Latin America Automation in Biopharma Industry Market Forecast by Automation Technology, 2024-2034 (US$ Million, AGR%, CAGR%)
Table 76 Latin America Automation in Biopharma Industry Market Forecast by Digitization Technology, 2024-2034 (US$ Million, AGR%, CAGR%)
Table 77 Latin America Automation in Biopharma Industry Market Forecast by Application, 2024-2034 (US$ Million, AGR%, CAGR%)
Table 78 Latin America Automation in Biopharma Industry Market Forecast by Component, 2024-2034 (US$ Million, AGR%, CAGR%)
Table 79 Brazil Automation in Biopharma Industry Market Forecast, 2024-2034 (US$ Million, AGR%, CAGR%)
Table 80 Mexico Automation in Biopharma Industry Market Forecast, 2024-2034 (US$ Million, AGR%, CAGR%)
Table 81 Argentina Automation in Biopharma Industry Market Forecast, 2024-2034 (US$ Million, AGR%, CAGR%)
Table 82 Rest of Latin America Automation in Biopharma Industry Market Forecast, 2024-2034 (US$ Million, AGR%, CAGR%)
Table 83 MEA Automation in Biopharma Industry Market Forecast by Country, 2024-2034 (US$ Million, AGR%, CAGR%)
Table 84 MEA Automation in Biopharma Industry Market Forecast by Technology, 2024-2034 (US$ Million, AGR%, CAGR%)
Table 85 MEA Automation in Biopharma Industry Market Forecast by Automation Technology, 2024-2034 (US$ Million, AGR%, CAGR%)
Table 86 MEA Automation in Biopharma Industry Market Forecast by Digitization Technology, 2024-2034 (US$ Million, AGR%, CAGR%)
Table 87 MEA Automation in Biopharma Industry Market Forecast by Application, 2024-2034 (US$ Million, AGR%, CAGR%)
Table 88 MEA Automation in Biopharma Industry Market Forecast by Component, 2024-2034 (US$ Million, AGR%, CAGR%)
Table 89 GCC Automation in Biopharma Industry Market Forecast, 2024-2034 (US$ Million, AGR%, CAGR%)
Table 90 South Africa Automation in Biopharma Industry Market Forecast, 2024-2034 (US$ Million, AGR%, CAGR%)
Table 91 Egypt Automation in Biopharma Industry Market Forecast, 2024-2034 (US$ Million, AGR%, CAGR%)
Table 92 Rest of MEA Automation in Biopharma Industry Market Forecast, 2024-2034 (US$ Million, AGR%, CAGR%)
Table 93 Automation in Biopharma Industry Market: Company Ranking, 2023
Table 94 Revvity Inc.: Key Details, (CEO, HQ, Revenue, Founded, No. of Employees, Company Type, Website, Business Segment)
Table 95 Revvity Inc.: Product Benchmarking
Table 96 Revvity Inc.: Strategic Outlook
Table 97 Siemens Healthineers AG: Key Details, (CEO, HQ, Revenue, Founded, No. of Employees, Company Type, Website, Business Segment)
Table 98 Siemens Healthineers AG: Product Benchmarking
Table 99 Siemens Healthineers AG: Strategic Outlook
Table 100 ABB: Key Details, (CEO, HQ, Revenue, Founded, No. of Employees, Company Type, Website, Business Segment)
Table 101 ABB: Product Benchmarking
Table 102 ABB: Strategic Outlook
Table 103 Rockwell Automation: Key Details, (CEO, HQ, Revenue, Founded, No. of Employees, Company Type, Website, Business Segment)
Table 104 Rockwell Automation: Product Benchmarking
Table 105 Rockwell Automation: Strategic Outlook
Table 106 Thermo Fisher Scientific Inc.: Key Details, (CEO, HQ, Revenue, Founded, No. of Employees, Company Type, Website, Business Segment)
Table 107 Thermo Fisher Scientific Inc.: Product Benchmarking
Table 108 Thermo Fisher Scientific Inc.: Strategic Outlook
Table 109 Sartorius AG: Key Details, (CEO, HQ, Revenue, Founded, No. of Employees, Company Type, Website, Business Segment)
Table 110 Sartorius AG: Product Benchmarking
Table 111 Sartorius AG: Strategic Outlook
Table 112 RheoSense Inc.: Key Details, (CEO, HQ, Revenue, Founded, No. of Employees, Company Type, Website, Business Segment)
Table 113 RheoSense Inc.: Product Benchmarking
Table 114 RheoSense Inc.: Strategic Outlook
Table 115 Emerson Electric Co.: Key Details, (CEO, HQ, Revenue, Founded, No. of Employees, Company Type, Website, Business Segment)
Table 116 Emerson Electric Co.: Product Benchmarking
Table 117 Emerson Electric Co.: Strategic Outlook
Table 118 TetraScience, Inc.: Key Details, (CEO, HQ, Revenue, Founded, No. of Employees, Company Type, Website, Business Segment)
Table 119 TetraScience, Inc.: Product Benchmarking
Table 120 TetraScience, Inc.: Strategic Outlook
Table 121 ADLINK Technology Inc.: Key Details, (CEO, HQ, Revenue, Founded, No. of Employees, Company Type, Website, Business Segment)
Table 122 ADLINK Technology Inc.: Product Benchmarking
Table 123 ADLINK Technology Inc.: Strategic Outlook
Table 124 Acieta: Key Details, (CEO, HQ, Revenue, Founded, No. of Employees, Company Type, Website, Business Segment)
Table 125 Acieta: Product Benchmarking
Table 126 Acieta: Strategic Outlook
Table 127 AMETEK, Inc.: Key Details, (CEO, HQ, Revenue, Founded, No. of Employees, Company Type, Website, Business Segment)
Table 128 AMETEK, Inc.: Product Benchmarking
Table 129 AMETEK, Inc.: Strategic Outlook
Table 130 Baumüller: Key Details, (CEO, HQ, Revenue, Founded, No. of Employees, Company Type, Website, Business Segment)
Table 131 Baumüller: Product Benchmarking
Table 132 Baumüller: Strategic Outlook
List of Figures
Figure 1 Automation in Biopharma Industry Market Segmentation
Figure 2 Automation in Biopharma Industry Market Attractiveness Index by Region
Figure 3 Automation in Biopharma Industry Market by Technology: Market Attractiveness Index
Figure 4 Automation in Biopharma Industry Market by Automation Technology: Market Attractiveness Index
Figure 5 Automation in Biopharma Industry Market by Digitization Technology: Market Attractiveness Index
Figure 6 Automation in Biopharma Industry Market by Application: Market Attractiveness Index
Figure 7 Automation in Biopharma Industry Market by Component: Market Attractiveness Index
Figure 8 Automation in Biopharma Industry Market: Market Dynamics
Figure 9 Automation in Biopharma Industry Market by Region, 2024-2034 (US$ Million, AGR %): “V” Shaped Recovery
Figure 10 Automation in Biopharma Industry Market by Region, 2024-2034 (US$ Million, AGR %): “U” Shaped Recovery
Figure 11 Automation in Biopharma Industry Market by Region, 2024-2034 (US$ Million, AGR %): “W” Shaped Recovery
Figure 12 Automation in Biopharma Industry Market by Region, 2024-2034 (US$ Million, AGR %): “L” Shaped Recovery
Figure 13 Automation in Biopharma Industry Market: Porter’s Five Forces Analysis
Figure 14 Automation in Biopharma Industry Market: SWOT Analysis
Figure 15 Automation in Biopharma Industry Market: PEST Analysis
Figure 16 Automation in Biopharma Industry Market by Technology: Market Attractiveness Index
Figure 17 Automation in Biopharma Industry Market Forecast by Technology, 2024-2034 (US$ Million, AGR %)
Figure 18 Automation in Biopharma Industry Market Share Forecast by Technology, 2024, 2029, 2034 (%)
Figure 19 Automation Technology Segment Market Forecast by Region, 2024-2034 (US$ Million, AGR %)
Figure 20 Automation Technology Segment Market Share Forecast by Region, 2024 & 2034 (%)
Figure 21 Digitization Technology Market Forecast by Region, 2024-2034 (US$ Million)
Figure 22 Digitization Technology Market Share Forecast by Region, 2024 & 2034 (%)
Figure 23 Automation in Biopharma Industry Market by Automation Technology: Market Attractiveness Index
Figure 24 Automation in Biopharma Industry Market by Type, 2024-2034 (US$ Million)
Figure 25 Automation in Biopharma Industry Market Share Forecast by Automation Technology, 2024, 2029, 2034 (%)
Figure 26 Supervisory Control and Data Acquisition (SCADA) Market Forecast by Region, 2024-2034 (US$ Million)
Figure 27 Supervisory Control and Data Acquisition (SCADA) Market Share Forecast by Region, 2024 & 2034 (%)
Figure 28 Distributed Control Systems (DCS) Market Forecast by Region, 2024-2034 (US$ Million)
Figure 29 Distributed Control Systems (DCS) Market Share Forecast by Region, 2024 & 2034 (%)
Figure 30 Programmable Logic Controllers (PLC) Market Forecast by Region, 2024-2034 (US$ Million)
Figure 31 Programmable Logic Controllers (PLC) Market Share Forecast by Region, 2024 & 2034 (%)
Figure 32 Manufacturing Execution System (MES)Market Forecast by Region, 2024-2034 (US$ Million)
Figure 33 Manufacturing Execution System (MES)Market Share Forecast by Region, 2024 & 2034 (%)
Figure 34 Human-machine Interface (HMI) Market Forecast by Region, 2024-2034 (US$ Million)
Figure 35 Human-machine Interface (HMI) Market Share Forecast by Region, 2024 & 2034 (%)
Figure 36 Advanced Process Control (APC)Market Forecast by Region, 2024-2034 (US$ Million)
Figure 37 Advanced Process Control (APC)Market Share Forecast by Region, 2024 & 2034 (%)
Figure 38 Enterprise Resource Planning (ERP)Market Forecast by Region, 2024-2034 (US$ Million)
Figure 39 Enterprise Resource Planning (ERP)Market Share Forecast by Region, 2024 & 2034 (%)
Figure 40 Laboratory Information Management System (LIMS)Market Forecast by Region, 2024-2034 (US$ Million)
Figure 41 Laboratory Information Management System (LIMS)Market Share Forecast by Region, 2024 & 2034 (%)
Figure 42 Customer Relationship Management (CRM)Market Forecast by Region, 2024-2034 (US$ Million)
Figure 43 Customer Relationship Management (CRM)Market Share Forecast by Region, 2024 & 2034 (%)
Figure 44 Corrective and Preventive Actions (CAPA)Market Forecast by Region, 2024-2034 (US$ Million)
Figure 45 Corrective and Preventive Actions (CAPA)Market Share Forecast by Region, 2024 & 2034 (%)
Figure 46 Other Automation Technologies Market Forecast by Region, 2024-2034 (US$ Million)
Figure 47 Other Automation Technologies Market Share Forecast by Region, 2024 & 2034 (%)
Figure 48 Automation in Biopharma Industry Market by Digitization Technology: Market Attractiveness Index
Figure 49 Automation in Biopharma Industry Market Forecast by Type, 2024-2034 (US$ Million)
Figure 50 Automation in Biopharma Industry Market Share Forecast by Type, 2024, 2029, 2034 (%)
Figure 51 Internet of things (IoT) Market Forecast by Region, 2024-2034 (US$ Million)
Figure 52 Internet of things (IoT) Market Share Forecast by Region, 2024 & 2034 (%)
Figure 53 Artificial Intelligence (AI) Market Forecast by Region, 2024-2034 (US$ Million)
Figure 54 Artificial Intelligence (AI) Market Share Forecast by Region, 2024 & 2034 (%)
Figure 55 Digital Twin Technology Market Forecast by Region, 2024-2034 (US$ Million)
Figure 56 Digital Twin Technology Market Share Forecast by Region, 2024 & 2034 (%)
Figure 57 Augmented Reality (AR) and Virtual Reality (VR) Market Forecast by Region, 2024-2034 (US$ Million)
Figure 58 Augmented Reality (AR) and Virtual Reality (VR) Market Share Forecast by Region, 2024 & 2034 (%)
Figure 59 Predictive Analytics Market Forecast by Region, 2024-2034 (US$ Million)
Figure 60 Predictive Analytics Market Share Forecast by Region, 2024 & 2034 (%)
Figure 61 Cloud Computing Market Forecast by Region, 2024-2034 (US$ Million)
Figure 62 Cloud Computing Market Share Forecast by Region, 2024 & 2034 (%)
Figure 63 Automation in Biopharma Industry Market by Application: Market Attractiveness Index
Figure 64 Automation in Biopharma Industry Market by Application, 2024-2034 (US$ Million)
Figure 65 Automation in Biopharma Industry Market Share by Application, 2024, 2029, 2034 (%)
Figure 66 Clinical Phase Market Forecast by Region, 2024-2034 (US$ Million)
Figure 67 Clinical Phase Market Share Forecast by Region, 2024 & 2034 (%)
Figure 68 Drug Discovery Phase Market Forecast by Region, 2024-2034 (US$ Million)
Figure 69 Drug Discovery Phase Market Share Forecast by Region, 2024 & 2034 (%)
Figure 70 Production Phase Market Forecast by Region, 2024-2034 (US$ Million)
Figure 71 Production Phase Market Share Forecast by Region, 2024 & 2034 (%)
Figure 72 Automation in Biopharma Industry Market by Component: Market Attractiveness Index
Figure 73 Automation in Biopharma Industry Market Forecast by Component, 2024-2034 (US$ Million)
Figure 74 Automation in Biopharma Industry Market Share Forecast by Component, 2024, 2029, 2034 (%)
Figure 75 Automation Hardware Market Forecast by Region, 2024-2034 (US$ Million)
Figure 76 Automation Hardware Market Share Forecast by Region, 2024 & 2034 (%)
Figure 77 Automation Software Market Forecast by Region, 2024-2034 (US$ Million)
Figure 78 Automation Software Market Share Forecast by Region, 2024 & 2034 (%)
Figure 79 Services Project Phase Market Forecast by Region, 2024-2034 (US$ Million)
Figure 80 Services Project Phase Market Share Forecast by Region, 2024 & 2034 (%)
Figure 81 Services Operation Phase Market Forecast by Region, 2024-2034 (US$ Million)
Figure 82 Services Operation Phase Market Share Forecast by Region, 2024 & 2034 (%)
Figure 83 Automation in Biopharma Industry Market Forecast by Region 2024 and 2034 (Revenue, CAGR%)
Figure 84 Automation in Biopharma Industry Market Share Forecast by Region 2024, 2029, 2034 (%)
Figure 85 Automation in Biopharma Industry Market by Region, 2024-2034 (US$ Million, AGR %)
Figure 86 North America Automation in Biopharma Industry Market Attractiveness Index
Figure 87 North America Automation in Biopharma Industry Market by Region, 2024, 2029 & 2034 (US$ Million)
Figure 88 North America Automation in Biopharma Industry Market Forecast by Country, 2024-2034 (US$ Million, AGR %)
Figure 89 North America Automation in Biopharma Industry Market Share Forecast by Country, 2024 & 2034 (%)
Figure 90 North America Automation in Biopharma Industry Market Forecast by Technology, 2024-2034 (US$ Million, AGR %)
Figure 91 North America Automation in Biopharma Industry Market Share Forecast by Technology, 2024 & 2034 (%)
Figure 92 North America Automation in Biopharma Industry Market Forecast by Automation Technology, 2024-2034 (US$ Million, AGR %)
Figure 93 North America Automation in Biopharma Industry Market Share Forecast by Automation Technology, 2024 & 2034 (%)
Figure 94 North America Automation in Biopharma Industry Market Forecast by Digitization Technology, 2024-2034 (US$ Million, AGR %)
Figure 95 North America Automation in Biopharma Industry Market Share Forecast by Digitization Technology, 2024 & 2034 (%)
Figure 96 North America Automation in Biopharma Industry Market Forecast by Application, 2024-2034 (US$ Million, AGR %)
Figure 97 North America Automation in Biopharma Industry Market Share Forecast by Application, 2024 & 2034 (%)
Figure 98 North America Automation in Biopharma Industry Market Forecast by Component, 2024-2034 (US$ Million, AGR %)
Figure 99 North America Automation in Biopharma Industry Market Share Forecast by Component, 2024 & 2034 (%)
Figure 100 U.S. Automation in Biopharma Industry Market Forecast, 2024-2034 (US$ Million, AGR %)
Figure 101 Canada Automation in Biopharma Industry Market Forecast, 2024-2034 (US$ Million, AGR %)
Figure 102 Europe Automation in Biopharma Industry Market Attractiveness Index
Figure 103 Europe Automation in Biopharma Industry Market by Country, 2024, 2029 & 2034 (US$ Million)
Figure 104 Europe Automation in Biopharma Industry Market Forecast by Country, 2024-2034 (US$ Million)
Figure 105 Europe Automation in Biopharma Industry Market Share Forecast by Country, 2024 & 2034 (%)
Figure 106 Europe Automation in Biopharma Industry Market Forecast by Technology, 2024-2034 (US$ Million)
Figure 107 Europe Automation in Biopharma Industry Market Share Forecast by Technology, 2024 & 2034 (%)
Figure 108 Europe Automation in Biopharma Industry Market Forecast by Automation Technology, 2024-2034 (US$ Million)
Figure 109 Europe Automation in Biopharma Industry Market Share Forecast by Automation Technology, 2024 & 2034 (%)
Figure 110 Europe Automation in Biopharma Industry Market Forecast by Digitization Technology, 2024-2034 (US$ Million)
Figure 111 Europe Automation in Biopharma Industry Market Share Forecast by Digitization Technology, 2024 & 2034 (%)
Figure 112 Europe Automation in Biopharma Industry Market Forecast by Application, 2024-2034 (US$ Million)
Figure 113 Europe Automation in Biopharma Industry Market Share Forecast by Application, 2024 & 2034(%)
Figure 114 Europe Automation in Biopharma Industry Market Forecast by Component, 2024-2034 (US$ Million)
Figure 115 Europe Automation in Biopharma Industry Market Share Forecast by Component, 2024 & 2034(%)
Figure 116 Germany Automation in Biopharma Industry Market Forecast, 2024-2034 (US$ Million, AGR %)
Figure 117 UK Automation in Biopharma Industry Market Forecast, 2024-2034 (US$ Million, AGR %)
Figure 118 France Automation in Biopharma Industry Market Forecast, 2024-2034 (US$ Million, AGR %)
Figure 119 Italy Automation in Biopharma Industry Market Forecast, 2024-2034 (US$ Million, AGR %)
Figure 120 Spain Automation in Biopharma Industry Market Forecast, 2024-2034 (US$ Million, AGR %)
Figure 121 Switzerland Automation in Biopharma Industry Market Forecast, 2024-2034 (US$ Million, AGR %)
Figure 122 Netherlands Automation in Biopharma Industry Market Forecast, 2024-2034 (US$ Million, AGR %)
Figure 123 Rest of Europe Automation in Biopharma Industry Market Forecast, 2024-2034 (US$ Million, AGR %)
Figure 124 Asia Pacific Automation in Biopharma Industry Market Attractiveness Index
Figure 125 Asia Pacific Automation in Biopharma Industry Market by Region, 2024, 2029 & 2034 (US$ Million)
Figure 126 Asia Pacific Automation in Biopharma Industry Market Forecast by Country, 2024-2034 (US$ Million)
Figure 127 Asia Pacific Automation in Biopharma Industry Market Share Forecast by Country, 2024 & 2034 (%)
Figure 128 Asia Pacific Automation in Biopharma Industry Market Forecast by Technology, 2024-2034 (US$ Million)
Figure 129 Asia Pacific Automation in Biopharma Industry Market Share Forecast by Technology, 2024 & 2034 (%)
Figure 130 Asia Pacific Automation in Biopharma Industry Market Forecast by Automation Technology, 2024-2034 (US$ Million)
Figure 131 Asia Pacific Automation in Biopharma Industry Market Share Forecast by Automation Technology, 2024 & 2034 (%)
Figure 132 Asia Pacific Automation in Biopharma Industry Market Forecast by Digitization Technology, 2024-2034 (US$ Million)
Figure 133 Asia Pacific Automation in Biopharma Industry Market Share Forecast by Digitization Technology, 2024 & 2034 (%)
Figure 134 Asia Pacific Automation in Biopharma Industry Market Forecast by Application, 2024-2034 (US$ Million)
Figure 135 Asia Pacific Automation in Biopharma Industry Market Share Forecast by Application, 2024 & 2034 (%)
Figure 136 Asia Pacific Automation in Biopharma Industry Market Forecast by Component, 2024-2034 (US$ Million)
Figure 137 Asia Pacific Automation in Biopharma Industry Market Share Forecast by Component, 2024 & 2034 (%)
Figure 138 Japan Automation in Biopharma Industry Market Forecast, 2024-2034 (US$ Million, AGR %)
Figure 139 China Automation in Biopharma Industry Market Forecast, 2024-2034 (US$ Million, AGR %)
Figure 140 India Automation in Biopharma Industry Market Forecast, 2024-2034 (US$ Million, AGR %)
Figure 141 Australia Automation in Biopharma Industry Market Forecast, 2024-2034 (US$ Million, AGR %)
Figure 142 South Korea Automation in Biopharma Industry Market Forecast, 2024-2034 (US$ Million, AGR %)
Figure 143 South East Asia Automation in Biopharma Industry Market Forecast, 2024-2034 (US$ Million, AGR %)
Figure 144 Rest of Asia Pacific Automation in Biopharma Industry Market Forecast, 2024-2034 (US$ Million, AGR %)
Figure 145 Latin America Automation in Biopharma Industry Market Attractiveness Index
Figure 146 Latin America Automation in Biopharma Industry Market by Region, 2024, 2029 & 2034 (US$ Million)
Figure 147 Latin America Automation in Biopharma Industry Market Forecast by Country, 2024-2034 (US$ Million)
Figure 148 Latin America Automation in Biopharma Industry Market Share Forecast by Country, 2024 & 2034 (%)
Figure 149 Latin America Automation in Biopharma Industry Market Forecast by Technology, 2024-2034 (US$ Million)
Figure 150 Latin America Automation in Biopharma Industry Market Share Forecast by Technology, 2024 & 2034 (%)
Figure 151 Latin America Automation in Biopharma Industry Market Forecast by Automation Technology, 2024-2034 (US$ Million)
Figure 152 Latin America Automation in Biopharma Industry Market Share Forecast by Automation Technology, 2024 & 2034 (%)
Figure 153 Latin America Automation in Biopharma Industry Market Forecast by Digitization Technology, 2024-2034 (US$ Million)
Figure 154 Latin America Automation in Biopharma Industry Market Share Forecast by Digitization Technology, 2024 & 2034 (%)
Figure 155 Latin America Automation in Biopharma Industry Market Forecast by Application, 2024-2034 (US$ Million)
Figure 156 Latin America Automation in Biopharma Industry Market Share Forecast by Application, 2024 & 2034 (%)
Figure 157 Latin America Automation in Biopharma Industry Market Forecast by Component, 2024-2034 (US$ Million)
Figure 158 Latin America Automation in Biopharma Industry Market Share Forecast by Component, 2024 & 2034 (%)
Figure 159 Brazil Automation in Biopharma Industry Market Forecast, 2024-2034 (US$ Million, AGR %)
Figure 160 Mexico Automation in Biopharma Industry Market Forecast, 2024-2034 (US$ Million, AGR %)
Figure 161 Argentina Automation in Biopharma Industry Market Forecast, 2024-2034 (US$ Million, AGR %)
Figure 162 Rest of Latin America Automation in Biopharma Industry Market Forecast, 2024-2034 (US$ Million, AGR %)
Figure 163 MEA Automation in Biopharma Industry Market Attractiveness Index
Figure 164 MEA Automation in Biopharma Industry Market by Region, 2024, 2029 & 2034 (US$ Million)
Figure 165 MEA Automation in Biopharma Industry Market Forecast by Country, 2024-2034 (US$ Million)
Figure 166 MEA Automation in Biopharma Industry Market Share Forecast by Country, 2024 & 2034 (%)
Figure 167 MEA Automation in Biopharma Industry Market Forecast by Technology, 2024-2034 (US$ Million)
Figure 168 MEA Automation in Biopharma Industry Market Share Forecast by Technology, 2024 & 2034 (%)
Figure 169 MEA Automation in Biopharma Industry Market Forecast by Automation Technology, 2024-2034 (US$ Million)
Figure 170 MEA Automation in Biopharma Industry Market Share Forecast by Automation Technology, 2024 & 2034 (%)
Figure 171 MEA Automation in Biopharma Industry Market Forecast by Digitization Technology, 2024-2034 (US$ Million)
Figure 172 MEA Automation in Biopharma Industry Market Share Forecast by Digitization Technology, 2024 & 2034 (%)
Figure 173 MEA Automation in Biopharma Industry Market Forecast by Application, 2024-2034 (US$ Million)
Figure 174 MEA Automation in Biopharma Industry Market Share Forecast by Application, 2024 & 2034 (%)
Figure 175 MEA Automation in Biopharma Industry Market Forecast by Component, 2024-2034 (US$ Million)
Figure 176 MEA Automation in Biopharma Industry Market Share Forecast by Component, 2024 & 2034 (%)
Figure 177 GCC Automation in Biopharma Industry Market Forecast, 2024-2034 (US$ Million, AGR %)
Figure 178 South Africa Automation in Biopharma Industry Market Forecast, 2024-2034 (US$ Million, AGR %)
Figure 179 Egypt Automation in Biopharma Industry Market Forecast, 2024-2034 (US$ Million, AGR %)
Figure 180 Rest of MEA Automation in Biopharma Industry Market Forecast, 2024-2034 (US$ Million, AGR %)
Figure 181 Revvity Inc.: Net Revenue, 2019-2023 (US$ Million, AGR %)
Figure 182 Revvity Inc.: R&D, 2019-2023 (US$ Million, AGR %)
Figure 183 Revvity Inc.: Segment Market Shares, 2023
Figure 184 Revvity Inc.: Regional Market Shares, 2023
Figure 185 Siemens Healthineers AG: Net Revenue, 2019-2023 (US$ Million, AGR %)
Figure 186 Siemens Healthineers AG: R&D, 2019-2023 (US$ Million, AGR %)
Figure 187 Siemens Healthineers AG: Segment Market Shares, 2023
Figure 188 Siemens Healthineers AG: Regional Market Shares, 2023
Figure 189 ABB: Net Revenue, 2019-2023 (US$ Million, AGR %)
Figure 190 ABB: R&D, 2019-2023 (US$ Million, AGR %)
Figure 191 ABB: Segment Market Shares, 2023
Figure 192 ABB: Regional Market Shares, 2023
Figure 193 Rockwell Automation: Net Revenue, 2019-2023 (US$ Million, AGR %)
Figure 194 Rockwell Automation : R&D, 2019-2023 (US$ Million, AGR %)
Figure 195 Rockwell Automation: Segment Market Shares, 2023
Figure 196 Rockwell Automation: Regional Market Shares, 2023
Figure 197 Thermo Fisher Scientific Inc.: Net Revenue, 2019-2023 (US$ Million, AGR (%)
Figure 198 Thermo Fisher Scientific Inc.: R&D, 2019-2023 (US$ Million, AGR %)
Figure 199 Thermo Fisher Scientific Inc.: Segment Market Shares, 2023
Figure 200 Thermo Fisher Scientific Inc.: Regional Market Shares, 2023
Figure 201 Sartorius AG: Net Revenue, 2019-2023 (US$ Million, AGR (%)
Figure 202 Sartorius AG: R&D, 2019-2023 (US$ Million, AGR %)
Figure 203 Sartorius AG: Segment Market Shares, 2023
Figure 204 Sartorius AG: Regional Market Shares, 2023
Figure 205 Emerson Electric Co.: Net Revenue, 2019-2023 (US$ Million, AGR %)
Figure 206 Emerson Electric Co.: R&D, 2019-2023 (US$ Million, AGR %)
Figure 207 Emerson Electric Co.: Segment Market Shares, 2023
Figure 208 Emerson Electric Co.: Regional Market Shares, 2023
Figure 209 ADLINK Technology Inc.: Net Revenue, 2018-2022 (US$ Million, AGR %)
Figure 210 ADLINK Technology Inc.: R&D, 2018-2022 (US$ Million, AGR %)
Figure 211 ADLINK Technology Inc.: Segment Market Shares, 2022
Figure 212 ADLINK Technology Inc.: Regional Market Shares, 2022
Figure 213 AMETEK, Inc.: Net Revenue, 2019-2023 (US$ Million, AGR %)
Figure 214 AMETEK, Inc.: Segment Market Shares, 2022
Figure 215 AMETEK, Inc.: Regional Market Shares, 2022
ページTOPに戻る
- 細胞分析市場の規模、シェアおよび動向分析レポート:製品・サービス別(試薬・消耗品、機器)、手法別(フローサイトメトリー、細胞マイクロアレイ)、プロセス別、用途別、地域別、およびセグメント別予測(2026年~2033年)
- 密閉型バイオプロセス市場規模、シェアおよび動向分析レポート:製品別(バイオリアクター、発酵槽、撹拌システム)、用途別(ワクチン製造、細胞・遺伝子治療)、最終用途別(製薬・バイオテクノロジー企業)、地域別、およびセグメント別予測(2026年~2033年)
- 免疫ゲノミクス市場規模、シェアおよび動向分析レポート:タイプ別(機器、消耗品、ソフトウェア)、技術別(ポリメラーゼ連鎖反応、マイクロアレイ)、用途別(臨床用途、研究用途)、エンドユーザー別、地域別、およびセグメント別予測(2026年~2033年)
- 凍結乾燥装置およびサービス市場規模、シェア、動向分析レポート:提供形態別(装置、サービス)、事業規模別(実験室規模、パイロット規模)、用途別(診断・研究、食品産業)、地域別、およびセグメント別予測(2026年~2033年)
- 合成遺伝子回路市場規模、シェアおよび動向分析レポート:製品別(トグルスイッチ回路、発振器)、用途別(研究、治療)、最終用途別(学術・研究機関、バイオテクノロジー・製薬企業)、地域別、およびセグメント別予測(2026年~2033年)
- ウイルスベクターおよびプラスミドDNA製造市場の規模、シェア、動向分析レポート:ベクタータイプ別(レンチウイルス、アデノウイルス、レトロウイルス)、ワークフロー別、用途別(遺伝子治療、細胞治療、ワクチン学)、最終用途別、疾患別(がん、遺伝性疾患)、地域別、およびセグメント別予測(2026年~2033年)
- 血小板濃縮血漿(PRP)市場規模、シェアおよび動向分析レポート:タイプ別(純粋PRP、白血球濃縮PRP)、用途別(整形外科、スポーツ医学、美容外科、皮膚科、眼科手術)、エンドユーザー別、地域別、およびセグメント別予測(2026年~2033年)
- 細胞培養培地および細胞株市場の規模、シェア、動向分析レポート:製品別(従来型細胞株、従来型培地)、用途別(バイオ医薬品製造、診断、研究・学術機関)、最終用途別、地域別、およびセグメント別予測(2026年~2033年)
- 製品別(消耗品(キット・試薬)、機器、ソフトウェア)、技術別(PCR、キャピラリー電気泳動、NGS、マイクロアレイ、迅速DNA分析)、用途別(法医学、親子鑑定)、エンドユーザー別の人類識別市場 ― 2031年までの世界予測
- Next-Generation Sequencing Market by Product Type (Consumables, Platforms, Bioinformatics), Technology (SBS, Nanopore), Workflow (Sequencing, Data Analysis), Services, Application (Drug Discovery, Diagnostic, Agriculture) - Global Forecast to 2030
関連レポート(キーワード「バイオ医薬品」)
よくあるご質問
Visiongain社はどのような調査会社ですか?
英国の調査会社ヴィジョンゲイン社(Visiongain)は、通信とエネルギーのほか、自動車や化学・医薬品、金属など、広範な市場を対象に調査を行っています。自動車市場については、市場全般に関する調査のほ... もっと見る
調査レポートの納品までの日数はどの程度ですか?
在庫のあるものは速納となりますが、平均的には 3-4日と見て下さい。
但し、一部の調査レポートでは、発注を受けた段階で内容更新をして納品をする場合もあります。
発注をする前のお問合せをお願いします。
注文の手続きはどのようになっていますか?
1)お客様からの御問い合わせをいただきます。
2)見積書やサンプルの提示をいたします。
3)お客様指定、もしくは弊社の発注書をメール添付にて発送してください。
4)データリソース社からレポート発行元の調査会社へ納品手配します。
5) 調査会社からお客様へ納品されます。最近は、pdfにてのメール納品が大半です。
お支払方法の方法はどのようになっていますか?
納品と同時にデータリソース社よりお客様へ請求書(必要に応じて納品書も)を発送いたします。
お客様よりデータリソース社へ(通常は円払い)の御振り込みをお願いします。
請求書は、納品日の日付で発行しますので、翌月最終営業日までの当社指定口座への振込みをお願いします。振込み手数料は御社負担にてお願いします。
お客様の御支払い条件が60日以上の場合は御相談ください。
尚、初めてのお取引先や個人の場合、前払いをお願いすることもあります。ご了承のほど、お願いします。
データリソース社はどのような会社ですか?
当社は、世界各国の主要調査会社・レポート出版社と提携し、世界各国の市場調査レポートや技術動向レポートなどを日本国内の企業・公官庁及び教育研究機関に提供しております。
世界各国の「市場・技術・法規制などの」実情を調査・収集される時には、データリソース社にご相談ください。
お客様の御要望にあったデータや情報を抽出する為のレポート紹介や調査のアドバイスも致します。
|
|


