オフショア遠隔操縦無人潜水機(ROV)市場レポート:2024-2034
Offshore Remotely Operated Vehicle (ROV) Market Report 2024-2034
レポート詳細
オフショア遠隔操縦無人潜水機(ROV)市場レポート 2024-2034年 :この調査レポートは、業界とその基礎となる原動力をより良く理解することを望むなら、新たな収益ポケットを目指す大手... もっと見る
※上記価格は部署ライセンス(Departmental licence)価格です。
その他の価格についてはデータリソースまでお問合せください。
日本語のページは自動翻訳を利用し作成しています。
実際のレポートは英文のみでご納品いたします。
サマリー
レポート詳細
オフショア遠隔操縦無人潜水機(ROV)市場レポート 2024-2034年:この調査レポートは、業界とその基礎となる原動力をより良く理解することを望むなら、新たな収益ポケットを目指す大手企業にとって貴重なものとなるでしょう。異業種への進出や新規地域での既存事業の拡大を目指す企業にも有用です。
ダイナミックな情勢の中、オフショア遠隔操縦無人潜水機(ROV)世界市場のプレーヤーに数多くの機会が広がる
世界のオフショア遠隔操縦無人潜水機(ROV)市場は、様々な要因が重なり、力強い成長を続けている。主な促進要因としては、特に石油・ガスセクターにおける海底探査、メンテナンス、介入活動に対する需要の高まりが挙げられる。オフショアROV市場は、複雑な水中作業に効率的に対処し、人的介入を減らし、オフショア要員の安全を確保する必要性の高まりに後押しされている。人工知能や自動化などの先進技術の統合は、困難な水中環境を航行するROVの能力と信頼性をさらに高める。
このようなダイナミックな状況の中、業界関係者には数多くのビジネスチャンスが広がっている。洋上風力発電所を含む再生可能エネルギー源の重視の高まりは、ROVの重要な市場手段を生み出し、従来の石油・ガス用途以外の拡大を促進する。さらに、低コストのROVソリューションの開発と新興市場へのアクセスが、大きな成長機会をもたらしている。新興地域と現地パートナーとの戦略的提携に焦点を当てた地理的拡大は、市場プレーヤーが新たな機会を獲得するための戦略的手段として浮上している。
しかし、オフショアROV市場に課題がないわけではない。機器のメンテナンスや熟練工の訓練を含む高い運用コストが、市場成長に制約を与えている。さらに、複雑な規制の枠組みを乗り越え、厳しい安全基準を遵守することが、業界参加者の課題となっている。また、市場は代替技術や代替手法との競争にも直面しており、価格ダイナミクスや市場シェアに影響を及ぼしている。
市場調査レポートを購入する前にすべき質問とは?
-
オフショア遠隔操縦無人潜水機(ROV)市場はどのように進化しているのか?
-
オフショア遠隔操縦無人潜水機(ROV)市場の促進要因と抑制要因は何か?
-
オフショア遠隔操縦無人潜水機(ROV)の各サブマーケットセグメントは予測期間中にどのように成長し、2034年にどれくらいの収益を占めるのか?
-
各オフショア遠隔操縦無人潜水機の市場シェアは2024年から2034年にかけてどのように推移するのか?
-
2024年から2034年までの市場全体の主な牽引役は何か?
-
オフショア遠隔操縦無人潜水機(ROV)の主要市場はマクロ経済の動きに概ね追随するのか、それとも個々の国市場が他を凌駕するのか?
-
2034年までに各国市場のシェアはどのように変化し、2034年にはどの地域が市場をリードするのか?
-
主要プレーヤーは誰か、また予測期間中の見通しは?
-
これらの大手企業のオフショア遠隔操縦無人潜水機(ROV)プロジェクトは?
-
2024年から2034年の間に産業はどのように発展するのか?現在および今後10年間に実施されるオフショア遠隔操縦無人潜水機(ROV)プロジェクトにはどのような意味があるのか?
-
オフショア遠隔操縦無人潜水機(ROV)市場をさらに拡大するために、製品化の必要性は高まっていますか?
-
オフショア遠隔操縦無人潜水機(ROV)市場はどこに向かっており、どのようにすれば市場の最前線に立てるのか?
-
新製品やサービスラインに対する最適な投資オプションは何か?
-
企業を新たな成長軌道に乗せ、C-suiteに移行させるための重要な展望とは?
このことが、現在、そして今後10年間のオフショア遠隔操縦無人潜水機(ROV)市場にどのような影響を与えるかを見極める必要がある:
-
142の表と179のグラフで構成される421ページのレポート。
-
本レポートでは、業界における主要な有利分野を取り上げているため、今すぐターゲットを絞ることができる。
-
世界、地域、国の売上高と成長に関する詳細な分析が含まれている。
-
競合他社が成功した主なトレンド、変化、収益予測をハイライトします。
本レポートは、オフショア遠隔操縦無人潜水機(ROV)市場が今後10年間、COVID-19の景気後退と好転の変動に合わせてどのように発展するかをTODAYでお伝えします。この市場は、過去10年間のどの時点よりも今が重要である。
2034年までの予測やその他の分析から、商業的な展望が明らかになる
-
2034年までの収益予測に加え、最近の実績、成長率、市場シェアも提供している。
-
ビジネスの展望や展開など、独自の分析が掲載されている。
-
定性的分析(市場力学、促進要因、機会、阻害要因、課題を含む)、コスト構造、オフショア遠隔操縦無人潜水機(ROV)価格上昇の影響、最近の動向をご覧いただけます。
本レポートには、COVID-19が業界と貴社にどのような影響を与えるかについてのデータ分析と貴重な洞察が含まれている。本レポートでは、COVID-19の4つの回収パターンとその影響、すなわち「V」、「L」、「W」、「U」について論じている。
レポート対象セグメント
タイプ/クラス別市場セグメント
産業別市場セグメント
-
石油・ガス
-
洋上風力
-
ディフェンス
-
調査と測量
-
その他
用途別市場セグメント
-
建設サポート
-
掘削サポート
-
検査・修理・メンテナンス(IRM)
-
その他
深さ別市場セグメント
-
5,000フィート以下
-
5,000~10,000フィート
-
10,000フィート以上
ペイロード別市場セグメント
-
200kg未満
-
201~300キロ
-
300kg以上
重量別市場セグメント
-
OCROV(91kgまで)
-
MSROV(91kg〜907kg)
-
WCROV(907kg超過)
機能別市場セグメント
世界市場全体とセグメント別の収益予測に加え、4つの地域と20の主要国市場の収益予測も掲載しています:
北米
欧州
-
ドイツ
-
スペイン
-
イギリス
-
フランス
-
イタリア
-
その他の欧州
アジア太平洋
-
中国
-
日本
-
インド
-
オーストラリア
-
韓国
-
その他のアジア太平洋
ラテンアメリカ
中東・アフリカ
本レポートでは、オフショア遠隔操縦無人潜水機(ROV)市場の2024年から2034年までの主要企業のプロファイルも掲載しており、これらの企業の事業のこのセグメントに焦点を当てている。
報告書に掲載されている主要企業
-
Blue Robotics
-
Deep Trekker Inc.
-
DeepOcean Group
-
DOF Group ASA
-
Forum Energy Technologies, Inc. (FET)
-
Fugro N.V.
-
Helix Energy Solutions
-
Oceaneering International, Inc.
-
Outland Technologies Inc.
-
Saab AB
-
Subsea 7 S.A.
-
TechnipFMC plc
-
VideoRay LLC
2024年から2034年にかけてのオフショア遠隔操縦無人潜水機(ROV)市場全体の世界売上高は、金額ベースで2024年に19億9,120万米ドルを突破するとの試算が発表された。2034年まで力強い収益成長を予測しています。当研究所では、最も大きな可能性を秘めた組織を特定している。彼らの能力、進歩、商業的展望を発見し、一歩先を行くお手伝いをします。
オフショア遠隔操縦無人潜水機(ROV)市場、2024~2034年レポートはどのようにお役に立つでしょうか?
要約すると、420ページを超えるこのレポートは、以下の知識を提供する:
-
オフショア遠隔操縦無人潜水機(ROV)市場の2024年から2034年までの収益予測 世界および地域レベルでのタイプ/クラス、産業、用途、深度、積載量、重量、機能の各予測を掲載 - 業界の将来性を発見し、投資と収益に最も有利な場所を見つけます。
-
4つの地域と20の主要国市場の2034年までの収益予測 - オフショア遠隔操縦無人潜水機(ROV)市場、北米、欧州、アジア太平洋、中南米、中東・アフリカの2024年から2034年までの市場予測をご覧ください。また、米国、カナダ、ブラジル、ドイツ、フランス、英国、イタリア、中国、インド、日本、オーストラリアなどの著名経済圏の市場も予測しています。
-
2024年から2034年までのオフショア遠隔操縦無人潜水機(ROV)市場に関与する主要企業13社の企業プロファイルを含む。
独自の予測による定量的・定性的分析をご覧ください。私たちのレポートだけに含まれる情報を入手し、貴重なビジネスインテリジェンスで情報を得ることができます。
他にはない情報
私たちの新しいレポートがあれば、知識に遅れをとったり、チャンスを逃したりする可能性が低くなります。弊社の調査レポートが貴社の調査、分析、意思決定にどのように役立つかをご覧ください。Visiongainの調査は、オフショア遠隔操縦無人潜水機(ROV)市場、2024年から2034年、市場をリードする企業の商業分析を必要とするすべての人のためのものです。データ、トレンド、予測をご覧いただけます。
ページTOPに戻る
目次
1 レポート概要
1.1 調査の目的
1.2 オフショア遠隔操縦無人潜水機(ROV)市場の紹介
1.3 本レポートの内容
1.4 本レポートを読むべき理由
1.5 本分析レポートが回答する主な質問
1.6 本レポートは誰のためのものか?
1.7 調査方法
1.7.1 市場の定義
1.7.2 市場評価・予測手法
1.7.3 データ検証
1.7.3.1 一次調査
1.7.3.2 セカンダリーリサーチ
1.8 よくある質問(FAQ)
1.9 Visiongainの関連レポート
1.10 Visiongainについて
2 エグゼクティブ・サマリー
3 市場概要
3.1 主要な調査結果
3.2 市場ダイナミクス
3.2.1 市場促進要因
3.2.1.1 アメリカ、アジア太平洋地域、中東・アフリカ地域におけるオフショア石油・ガス探査活動の増加
3.2.1.2 市場成長を牽引するオフショア再生可能技術の成長
3.2.1.3 石油・ガス需要の増加が市場成長を牽引
3.2.2 市場抑制要因
3.2.2.1 多くの地域における海洋探査・生産活動の禁止
3.2.2.2 高い操業リスクが市場成長を妨げる
3.2.2.3 資本集約的な市場が成長を妨げる
3.2.3 市場機会
3.2.3.1 ROV車両の安全性とリスク軽減の機会
3.2.3.2 遠隔操作車両への投資の増加
3.2.3.3 市場プレイヤーにとってのパートナーシップとコラボレーションの機会
3.3 ポーターのファイブフォース分析
3.3.1 サプライヤーの交渉力(中〜高)
3.3.2 買い手の交渉力(中)
3.3.3 競争力(高)
3.3.4 代替品による脅威(低)
3.3.5 新規参入の脅威(低)
3.4 COVID-19の影響分析
3.4.1 "V字型回復"
3.4.2 "U字型回復"
3.4.3 "W字型回復"
3.4.4 "L字型回復"
3.5 PEST分析
4 オフショア遠隔操縦無人潜水機(ROV)市場分析:タイプ・クラス別
4.1 主要な調査結果
4.2 オフショア遠隔操縦無人潜水機(ROV)のタイプ/クラス別市場規模推定と予測
4.3 作業クラス別
4.3.1 2024~2034年の地域別市場規模(US$ Million)
4.4 観測クラス
4.4.1 地域別市場規模、2024年~2034年(US$ Million)
4.5 介入クラス
4.5.1 地域別市場規模、2024~2034年(US$ Million)
5 オフショア遠隔操縦無人潜水機(ROV)市場分析:産業別
5.1 主要調査結果
5.2 オフショア遠隔操縦無人潜水機(ROV)の産業別市場規模推定と予測
5.3 石油・ガスセグメント
5.3.1 2024年~2034年の地域別市場規模(US$ Million)
5.4 洋上風力セグメント
5.4.1 地域別市場規模、2024年~2034年(US$ Million)
5.5 防衛セグメント
5.5.1 地域別市場規模、2024年~2034年(US$ Million)
5.6 調査・測量セグメント
5.6.1 地域別市場規模、2024-2034年(US$ Million)
5.7 その他
5.7.1 地域別市場規模、2024-2034年(US$ Million)
6 オフショア遠隔操縦無人潜水機(ROV)市場分析:用途別
6.1 主要な調査結果
6.2 オフショア遠隔操縦無人潜水機(ROV)の用途別市場規模推定と予測
6.3 建設支援
6.3.1 2024〜2034年の地域別市場規模(US$ Million)
6.4 掘削支援
6.4.1 地域別市場規模、2024~2034年(US$ Million)
6.5 検査・修理・保守(IRM)
6.5.1 地域別市場規模、2024~2034年(US$ Million)
6.6 その他
6.6.1 地域別市場規模、2024~2034年(US$ Million)
7 オフショア遠隔操縦無人潜水機(ROV)市場分析:深度別
7.1 主要調査結果
7.2 オフショア遠隔操縦無人潜水機(ROV)の深度別市場規模推定と予測
7.3 5,000フィート未満
7.3.1 2024~2034年の地域別市場規模(US$ Million)
7.4 5,000〜10,000フィート
7.4.1 地域別市場規模、2024年~2034年(US$ Million)
7.5 10,000フィート以上
7.5.1 地域別市場規模、2024~2034年(US$ Million)
8 オフショア遠隔操縦無人潜水機(ROV)市場分析:ペイロード別
8.1 主要な調査結果
8.2 ペイロード別オフショア遠隔操縦無人潜水機(ROV)市場規模の推定と予測
8.3 200Kg未満
8.3.1 2024~2034年の地域別市場規模(US$ Million)
8.4 201〜300kg
8.4.1 地域別市場規模、2024~2034年(US$ Million)
8.5 300kg以上
8.5.1 地域別市場規模、2024~2034年(US$ Million)
9 オフショア遠隔操縦無人潜水機(ROV)市場分析:重量別
9.1 主要な調査結果
9.2 オフショア遠隔操縦無人潜水機(ROV)の重量別市場規模推定と予測
9.3 OCROV(91kgまで)
9.3.1 2024〜2034年の地域別市場規模(US$ Million)
9.4 MSROV (91kg〜907kg)
9.4.1 地域別市場規模、2024~2034年(US$ Million)
9.5 WCROV(907kg超)
9.5.1 地域別市場規模、2024~2034年(US$ Million)
10 オフショア遠隔操縦無人潜水機(ROV)市場分析:機能別
10.1 主要な調査結果
10.2 オフショア遠隔操縦無人潜水機(ROV)の機能別市場規模の推定と予測
10.3 介入
10.3.1 2024〜2034年の地域別市場規模(US$ Million)
10.4 クローラー
10.4.1 地域別市場規模、2024~2034年(US$ Million)
10.5 パイプライン
10.5.1 地域別市場規模、2024~2034年(US$ Million)
10.6 トレンチ
10.6.1 2024~2034年の地域別市場規模(US$ Million)
10.7 その他
10.7.1 地域別市場規模、2024~2034年(US$ Million)
11 オフショア遠隔操縦無人潜水機(ROV)市場分析:地域別
11.1 主要な調査結果
11.2 地域別市場規模の推定と予測
12 北米のオフショア遠隔操縦無人潜水機(ROV)市場分析
12.1 主要な調査結果
12.2 北米のオフショア遠隔操縦無人潜水機(ROV)国別市場:2024年、2029年、2034年 (US$ Million)
12.3 北米のオフショア遠隔操縦無人潜水機(ROV)市場規模の推定と予測
12.4 北米のオフショア遠隔操縦無人潜水機(ROV)市場規模推定と予測:国別
12.5 北米のオフショア遠隔操縦無人潜水機(ROV)市場規模推定と予測:タイプ・クラス別
12.6 北米のオフショア遠隔操縦無人潜水機(ROV)市場規模推定と予測:産業別
12.7 北米のオフショア遠隔操縦無人潜水機(ROV)市場規模推定と予測:用途別
12.8 北米のオフショア遠隔操縦無人潜水機(ROV)市場規模推定と予測:深度別
12.9 北米のオフショア遠隔操縦無人潜水機(ROV)市場規模推定と予測:ペイロード別
12.10 北米のオフショア遠隔操縦無人潜水機(ROV)市場規模推定と予測:重量別
12.11 北米のオフショア遠隔操縦無人潜水機(ROV)市場規模推定と予測:機能別
12.12 アメリカのオフショア遠隔操縦無人潜水機(ROV)市場分析
12.13 カナダのオフショア遠隔操縦無人潜水機(ROV)市場分析
13 欧州オフショア遠隔操縦無人潜水機(ROV)市場分析
13.1 主要な調査結果
13.2 欧州のオフショア遠隔操縦無人潜水機国別市場:2024年、2029年、2034年 (US$ Million)
13.3 欧州のオフショア遠隔操縦無人潜水機(ROV)市場規模推定と予測
13.4 欧州のオフショア遠隔操縦無人潜水機(ROV)市場規模推定と予測:国別
13.5 欧州のオフショア遠隔操縦無人潜水機(ROV)市場規模推定と予測:タイプ・クラス別
13.6 欧州のオフショア遠隔操縦無人潜水機(ROV)市場規模推定と予測:産業別
13.7 欧州のオフショア遠隔操縦無人潜水機(ROV)市場規模推定と予測:用途別
13.8 欧州のオフショア遠隔操縦無人潜水機(ROV)市場規模推定と予測:深度別
13.9 欧州のオフショア遠隔操縦無人潜水機(ROV)市場規模推定と予測:ペイロード別
13.10 欧州のオフショア遠隔操縦無人潜水機(ROV)市場規模推定と予測:重量別
13.11 欧州のオフショア遠隔操縦無人潜水機(ROV)市場規模推定と予測:機能別
13.12 ドイツのオフショア遠隔操縦無人潜水機(ROV)市場分析
13.13 イギリスのオフショア遠隔操縦無人潜水機(ROV)市場分析
13.14 フランスのオフショア遠隔操縦無人潜水機(ROV)市場分析
13.15 イタリアのオフショア遠隔操縦無人潜水機(ROV)市場分析
13.16 スペインオフショア遠隔操縦無人潜水機(ROV)市場分析
13.17 その他の欧州のオフショア遠隔操縦無人潜水機(ROV)市場分析
14 アジア太平洋地域のオフショア遠隔操縦無人潜水機(ROV)市場分析
14.1 主要な調査結果
14.2 アジア太平洋地域のオフショア遠隔操縦無人潜水機(ROV)国別市場:2024年、2029年、2034年(US$ Million)
14.3 アジア太平洋地域のオフショア遠隔操縦無人潜水機市場規模の推定と予測
14.4 アジア太平洋地域のオフショア遠隔操縦無人潜水機(ROV)市場規模推定と予測:国別
14.5 アジア太平洋地域のオフショア遠隔操縦無人潜水機(ROV)市場規模推定と予測:タイプ・クラス別
14.6 アジア太平洋地域のオフショア遠隔操縦無人潜水機(ROV)市場規模推定と予測:産業別
14.7 アジア太平洋地域のオフショア遠隔操縦無人潜水機(ROV)市場規模推定と予測:用途別
14.8 アジア太平洋地域のオフショア遠隔操縦無人潜水機(ROV)市場規模推定と予測:深度別
14.9 アジア太平洋地域のオフショア遠隔操縦無人潜水機(ROV)市場規模推定と予測:ペイロード別
14.10 アジア太平洋地域のオフショア遠隔操縦無人潜水機(ROV)市場規模推定と予測:重量別
14.11 アジア太平洋地域のオフショア遠隔操縦無人潜水機(ROV)市場規模の推定と予測:機能別
14.12 中国のオフショア遠隔操縦無人潜水機(ROV)市場分析
14.13 インドのオフショア遠隔操縦無人潜水機(ROV)市場分析
14.14 日本のオフショア遠隔操縦無人潜水機(ROV)市場分析
14.15 韓国のオフショア遠隔操縦無人潜水機(ROV)市場分析
14.16 オーストラリアのオフショア遠隔操縦無人潜水機(ROV)市場分析
14.17 その他のアジア太平洋地域のオフショア遠隔操縦無人潜水機(ROV)市場分析
15 中東・アフリカのオフショア遠隔操縦無人潜水機(ROV)市場分析
15.1 主要調査結果
15.2 中東・アフリカのオフショア遠隔操縦無人潜水機(ROV)国別市場:2024年、2029年、2034年 (US$ Million)
15.3 中東・アフリカのオフショア遠隔操縦無人潜水機市場規模推定と予測
15.4 中東・アフリカのオフショア遠隔操縦無人潜水機(ROV)市場規模推定と予測:国別
15.5 中東・アフリカのオフショア遠隔操縦無人潜水機(ROV)市場規模推定と予測:タイプ/クラス別
15.6 中東・アフリカのオフショア遠隔操縦無人潜水機(ROV)市場規模推定と予測:産業別
15.7 中東・アフリカのオフショア遠隔操縦無人潜水機(ROV)市場規模推定と予測:用途別
15.8 中東・アフリカのオフショア遠隔操縦無人潜水機(ROV)市場規模推定と予測:深度別
15.9 中東・アフリカのオフショア遠隔操縦無人潜水機(ROV)市場規模推定と予測:ペイロード別
15.10 中東・アフリカのオフショア遠隔操縦無人潜水機(ROV)市場規模推定と予測:重量別
15.11 中東・アフリカのオフショア遠隔操縦無人潜水機(ROV)市場規模推定と予測:機能別
15.12 GCCのオフショア遠隔操縦無人潜水機(ROV)市場分析
15.13 南アフリカのオフショア遠隔操縦無人潜水機(ROV)市場分析
15.14 その他の中東・アフリカ地域のオフショア遠隔操縦無人潜水機(ROV)市場分析
16 ラ テンアメリカのオフショア遠隔操縦無人潜水機(ROV)市場分析
16.1 主要調査結果
16.2 ラテンアメリカのオフショア遠隔操縦無人潜水機(ROV)国別市場:2024年、2029年、2034年(US$ Million)
16.3 ラテンアメリカのオフショア遠隔操縦無人潜水機(ROV)市場規模推定と予測
16.4 ラテンアメリカのオフショア遠隔操縦無人潜水機(ROV)市場規模推定と予測:国別
16.5 ラテンアメリカのオフショア遠隔操縦無人潜水機(ROV)市場規模推定と予測:タイプ/クラス別
16.6 ラテンアメリカのオフショア遠隔操縦無人潜水機(ROV)市場規模推定と予測:産業別
16.7 ラテンアメリカのオフショア遠隔操縦無人潜水機(ROV)市場規模推定と予測:用途別
16.8 ラテンアメリカのオフショア遠隔操縦無人潜水機(ROV)市場規模推定と予測:深度別
16.9 ラテンアメリカのオフショア遠隔操縦無人潜水機(ROV)市場規模推定と予測:ペイロード別
16.10 ラテンアメリカのオフショア遠隔操縦無人潜水機(ROV)市場規模推定と予測:重量別
16.11 ラテンアメリカのオフショア遠隔操縦無人潜水機(ROV)市場規模推定と予測:機能別
16.12 ブラジルのオフショア遠隔操縦無人潜水機(ROV)市場分析
16.13 メキシコのオフショア遠隔操縦無人潜水機(ROV)市場分析
16.14 その他のラテンアメリカのオフショア遠隔操縦無人潜水機(ROV)市場分析
17 企業プロフィール
17.1 競争環境、2022年
17.2 戦略的展望
17.3 Oceaneering International, Inc
17.3.1 会社概要
17.3.2 会社概要
17.3.3 財務分析
17.3.3.1 純収入、2018-2022年
17.3.3.2 事業セグメント収益シェア、2022年(%)
17.3.4 製品ベンチマーク
17.3.5 戦略的展望
17.4 Subsea 7 S.A
17.4.1 会社概要
17.4.2 会社概要
17.4.3 財務分析
17.4.3.1 純収入、2018-2022年
17.4.3.2 R&D、2018年〜2022年
17.4.4 製品ベンチマーク
17.4.5 戦略的展望
17.5 TechnipFMC plc
17.5.1 会社概要
17.5.2 会社概要
17.5.3 財務分析
17.5.3.1 純収入、2018-2022年
17.5.3.2 R&D、2018年~2022年
17.5.3.3 地域別収益シェア、2022年(%)
17.5.3.4 事業セグメント収益シェア、2022年(%)
17.5.4 製品ベンチマーク
17.5.5 戦略的展望
17.6 Saab AB
17.6.1 会社概要
17.6.2 会社概要
17.6.3 財務分析
17.6.3.1 純収入、2018-2022年
17.6.3.2 R&D、2018年〜2022年
17.6.3.3 地域別収益シェア、2022年(%)
17.6.3.4 事業セグメント収益シェア、2022年(%)
17.6.4 製品ベンチマーク
17.6.5 戦略的展望
17.7 Deep Ocean
17.7.1 会社概要
17.7.2 会社概要
17.7.3 製品ベンチマーク
17.7.4 戦略的展望
17.8 Video Ray
17.8.1 会社概要
17.8.2 会社概要
17.8.3 製品ベンチマーク
17.8.4 戦略的展望
17.9 Blue Robotics
17.9.1 会社概要
17.9.2 会社概要
17.9.3 製品ベンチマーク
17.10 Forum Energy Technologies, Inc. (FET)
17.10.1 会社概要
17.10.2 会社概要
17.10.3 財務分析
17.10.3.1 純収入、2018-2022年
17.10.3.2 事業セグメント収益シェア、2022年(%)
17.10.4 製品ベンチマーク
17.10.5 戦略的展望
17.11 Fugro N.V.
17.11.1 会社概要
17.11.2 会社概要
17.11.3 財務分析
17.11.3.1 純収入、2018-2022年
17.11.3.2 R&D、2018年〜2022年
17.11.3.3 地域別収益シェア、2022年(%)
17.11.3.4 事業セグメント収益シェア、2022年(%)
17.11.4 製品ベンチマーク
17.11.5 戦略的展望
17.12 DOF Group ASA
17.12.1 会社概要
17.12.2 会社概要
17.12.3 財務分析
17.12.3.1 純収入、2018-2022年
17.12.3.2 事業セグメント収益シェア、2022年(%)
17.12.4 製品ベンチマーク
17.12.5 戦略的展望
17.13 Deep Trekker Inc.
17.13.1 会社概要
17.13.2 会社概要
17.13.3 製品ベンチマーク
17.13.4 戦略的展望
17.14 アウトランド・テクノロジーズ
17.14.1 会社概要
17.14.2 会社概要
17.14.3 製品ベンチマーク
17.15 Outland Technologies Inc
17.15.1 会社概要
17.15.2 会社概要
17.15.3 財務分析
17.15.3.1 純収入、2018-2022年
17.15.3.2 地域別収益シェア、2022年(%)
17.15.3.3 事業セグメント別売上高シェア、2022年(%)
17.15.4 製品ベンチマーク
18 結論と提言
18.1 Visiongainからの結びの言葉
18.2 市場プレイヤーへの提言
ページTOPに戻る
図表リスト
表の一覧
Table 1 Offshore Remotely Operated Vehicle (ROV) Market Snapshot, 2024 & 2034 (US$ Million, CAGR %)
Table 2 Total Number of ROVs in the World, 2023 (Company, Units, Category)
Table 3 Global Offshore Remotely Operated Vehicle (ROV) Market by Region, 2024-2034 (US$ Mn, AGR (%), CAGR (%)) (V-Shaped Recovery Scenario)
Table 4 Global Offshore Remotely Operated Vehicle (ROV) Market by Region, 2024-2034 (US$ Mn, AGR (%), CAGR (%)) (U-Shaped Recovery Scenario)
Table 5 Global Offshore Remotely Operated Vehicle (ROV) Market by Region, 2024-2034 (US$ Mn, AGR (%), CAGR (%)) (W-Shaped Recovery Scenario)
Table 6 Global Offshore Remotely Operated Vehicle (ROV) Market by Region, 2024-2034 (US$ Mn, AGR (%), CAGR (%)) (L-Shaped Recovery Scenario)
Table 7 Global Offshore Remotely Operated Vehicle (ROV) Market by Type/Class, 2024-2034 (US$ Mn, AGR (%), CAGR (%))
Table 8 Work-class Market by Region, 2024-2034 (US$ Mn, AGR (%), CAGR (%))
Table 9 Observation-class Market by Region, 2024-2034 (US$ Mn, AGR (%), CAGR (%))
Table 10 Intervention-class Market by Region, 2024-2034 (US$ Mn, AGR (%), CAGR (%))
Table 11 Global Offshore Remotely Operated Vehicle (ROV) Market by Industry, 2024-2034 (US$ Mn, AGR (%), CAGR (%))
Table 12 Oil and Gas Market by Region, 2024-2034 (US$ Mn, AGR (%), CAGR (%))
Table 13 Offshore Wind Market by Region, 2024-2034 (US$ Mn, AGR (%), CAGR (%))
Table 14 Defence Market by Region, 2024-2034 (US$ Mn, AGR (%), CAGR (%))
Table 15 Research and Surveying Market by Region, 2024-2034 (US$ Mn, AGR (%), CAGR (%))
Table 16 Others Market by Region, 2024-2034 (US$ Mn, AGR (%), CAGR (%))
Table 17 Global Offshore Remotely Operated Vehicle (ROV) Market by Application, 2024-2034 (US$ Mn, AGR (%), CAGR (%))
Table 18 Construction Support Market by Region, 2024-2034 (US$ Mn, AGR (%), CAGR (%))
Table 19 Drilling Support Market by Region, 2024-2034 (US$ Mn, AGR (%), CAGR (%))
Table 20 Inspection, Repair, and Maintenance (IRM) Market by Region, 2024-2034 (US$ Mn, AGR (%), CAGR (%))
Table 21 Others Market by Region, 2024-2034 (US$ Mn, AGR (%), CAGR (%))
Table 22 Global Offshore Remotely Operated Vehicle (ROV) Market by Depth, 2024-2034 (US$ Mn, AGR (%), CAGR (%))
Table 23 Less than 5,000 feet Market by Region, 2024-2034 (US$ Mn, AGR (%), CAGR (%))
Table 24 5,000-10,000 feet Market by Region, 2024-2034 (US$ Mn, AGR (%), CAGR (%))
Table 25 Above 10,000 feet Market by Region, 2024-2034 (US$ Mn, AGR (%), CAGR (%))
Table 26 Global Offshore Remotely Operated Vehicle (ROV) Market by Payload, 2024-2034 (US$ Mn, AGR (%), CAGR (%))
Table 27 Less than 200 Kg Market by Region, 2024-2034 (US$ Mn, AGR (%), CAGR (%))
Table 28 201-300kg Market by Region, 2024-2034 (US$ Mn, AGR (%), CAGR (%))
Table 29 Above 300 Kg Market by Region, 2024-2034 (US$ Mn, AGR (%), CAGR (%))
Table 30 Global Offshore Remotely Operated Vehicle (ROV) Market by Weight, 2024-2034 (US$ Mn, AGR (%), CAGR (%))
Table 31 OCROV (up to 91 kg) Market by Region, 2024-2034 (US$ Mn, AGR (%), CAGR (%))
Table 32 MSROV (91 kg to 907 kg) Market by Region, 2024-2034 (US$ Mn, AGR (%), CAGR (%))
Table 33 WCROV (excess 907 kg) Market by Region, 2024-2034 (US$ Mn, AGR (%), CAGR (%))
Table 34 Global Offshore Remotely Operated Vehicle (ROV) Market by Function, 2024-2034 (US$ Mn, AGR (%), CAGR (%))
Table 35 Intervention Market by Region, 2024-2034 (US$ Mn, AGR (%), CAGR (%))
Table 36 Crawler Market by Region, 2024-2034 (US$ Mn, AGR (%), CAGR (%))
Table 37 Pipelay Market by Region, 2024-2034 (US$ Mn, AGR (%), CAGR (%))
Table 38 Trenching Market by Region, 2024-2034 (US$ Mn, AGR (%), CAGR (%))
Table 39 Others Market by Region, 2024-2034 (US$ Mn, AGR (%), CAGR (%))
Table 40 Global Offshore Remotely Operated Vehicle (ROV) Market by Region, 2024-2034 (US$ Mn, AGR (%), CAGR (%))
Table 41 North America Offshore Remotely Operated Vehicle (ROV) Market by Value, 2024-2034 (US$ Mn, AGR (%), CAGR (%))
Table 42 North America Offshore Remotely Operated Vehicle (ROV) Market by Country, 2024-2034 (US$ Mn, AGR (%), CAGR (%))
Table 43 North America Offshore Remotely Operated Vehicle (ROV) Market by Type/Class, 2024-2034 (US$ Mn, AGR (%), CAGR (%))
Table 44 North America Offshore Remotely Operated Vehicle (ROV) Market by Industry, 2024-2034 (US$ Mn, AGR (%), CAGR (%))
Table 45 North America Offshore Remotely Operated Vehicle (ROV) Market by Application, 2024-2034 (US$ Mn, AGR (%), CAGR (%))
Table 46 North America Offshore Remotely Operated Vehicle (ROV) Market by Depth, 2024-2034 (US$ Mn, AGR (%), CAGR (%))
Table 47 North America Offshore Remotely Operated Vehicle (ROV) Market by Payload, 2024-2034 (US$ Mn, AGR (%), CAGR (%))
Table 48 North America Offshore Remotely Operated Vehicle (ROV) Market by Weight, 2024-2034 (US$ Mn, AGR (%), CAGR (%))
Table 49 North America Offshore Remotely Operated Vehicle (ROV) Market by Function, 2024-2034 (US$ Mn, AGR (%), CAGR (%))
Table 50 US Offshore Remotely Operated Vehicle (ROV) Market by Value, 2024-2034 (US$ Mn, AGR (%), CAGR (%))
Table 51 Canada Offshore Remotely Operated Vehicle (ROV) Market by Value, 2024-2034 (US$ Mn, AGR (%), CAGR (%))
Table 52 Europe Offshore Remotely Operated Vehicle (ROV) Market by Value, 2024-2034 (US$ Mn, AGR (%), CAGR (%))
Table 53 Europe Offshore Remotely Operated Vehicle (ROV) Market by Country, 2024-2034 (US$ Mn, AGR (%), CAGR (%))
Table 54 Europe Offshore Remotely Operated Vehicle (ROV) Market by Type/Class, 2024-2034 (US$ Mn, AGR (%), CAGR (%))
Table 55 Europe Offshore Remotely Operated Vehicle (ROV) Market by Industry, 2024-2034 (US$ Mn, AGR (%), CAGR (%))
Table 56 Europe Offshore Remotely Operated Vehicle (ROV) Market by Application, 2024-2034 (US$ Mn, AGR (%), CAGR (%))
Table 57 Europe Offshore Remotely Operated Vehicle (ROV) Market by Depth, 2024-2034 (US$ Mn, AGR (%), CAGR (%))
Table 58 Europe Offshore Remotely Operated Vehicle (ROV) Market by Weight, 2024-2034 (US$ Mn, AGR (%), CAGR (%))
Table 59 Europe Offshore Remotely Operated Vehicle (ROV) Market by Weight, 2024-2034 (US$ Mn, AGR (%), CAGR (%))
Table 60 Europe Offshore Remotely Operated Vehicle (ROV) Market by Function, 2024-2034 (US$ Mn, AGR (%), CAGR (%))
Table 61 Germany Offshore Remotely Operated Vehicle (ROV) Market by Value, 2024-2034 (US$ Mn, AGR (%), CAGR (%))
Table 62 UK Offshore Remotely Operated Vehicle (ROV) Market by Value, 2024-2034 (US$ Mn, AGR (%), CAGR (%))
Table 63 France Offshore Remotely Operated Vehicle (ROV) Market by Value, 2024-2034 (US$ Mn, AGR (%), CAGR (%))
Table 64 Italy Offshore Remotely Operated Vehicle (ROV) Market by Value, 2024-2034 (US$ Mn, AGR (%), CAGR (%))
Table 65 Spain Offshore Remotely Operated Vehicle (ROV) Market by Value, 2024-2034 (US$ Mn, AGR (%), CAGR (%))
Table 66 Rest of Europe Offshore Remotely Operated Vehicle (ROV) Market by Value, 2024-2034 (US$ Mn, AGR (%), CAGR (%))
Table 67 Asia-Pacific Offshore Remotely Operated Vehicle (ROV) Market by Value, 2024-2034 (US$ Mn, AGR (%), CAGR (%))
Table 68 Asia-Pacific Offshore Remotely Operated Vehicle (ROV) Market by Country, 2024-2034 (US$ Mn, AGR (%), CAGR (%))
Table 69 Asia-Pacific Offshore Remotely Operated Vehicle (ROV) Market by Type/Class, 2024-2034 (US$ Mn, AGR (%), CAGR (%))
Table 70 Asia-Pacific Offshore Remotely Operated Vehicle (ROV) Market by Industry, 2024-2034 (US$ Mn, AGR (%), CAGR (%))
Table 71 Asia-Pacific Offshore Remotely Operated Vehicle (ROV) Market by Application, 2024-2034 (US$ Mn, AGR (%), CAGR (%))
Table 72 Asia-Pacific Offshore Remotely Operated Vehicle (ROV) Market by Depth, 2024-2034 (US$ Mn, AGR (%), CAGR (%))
Table 73 Asia-Pacific Offshore Remotely Operated Vehicle (ROV) Market by Payload, 2024-2034 (US$ Mn, AGR (%), CAGR (%))
Table 74 Asia-Pacific Offshore Remotely Operated Vehicle (ROV) Market by Weight, 2024-2034 (US$ Mn, AGR (%), CAGR (%))
Table 75 Asia-Pacific Offshore Remotely Operated Vehicle (ROV) Market by Function, 2024-2034 (US$ Mn, AGR (%), CAGR (%))
Table 76 China Offshore Remotely Operated Vehicle (ROV) Market by Value, 2024-2034 (US$ Mn, AGR (%), CAGR (%))
Table 77 India Offshore Remotely Operated Vehicle (ROV) Market by Value, 2024-2034 (US$ Mn, AGR (%), CAGR (%))
Table 78 Japan Offshore Remotely Operated Vehicle (ROV) Market by Value, 2024-2034 (US$ Mn, AGR (%), CAGR (%))
Table 79 South Korea Offshore Remotely Operated Vehicle (ROV) Market by Value, 2024-2034 (US$ Mn, AGR (%), CAGR (%))
Table 80 Australia Offshore Remotely Operated Vehicle (ROV) Market by Value, 2024-2034 (US$ Mn, AGR (%), CAGR (%))
Table 81 Rest of Asia-Pacific Offshore Remotely Operated Vehicle (ROV) Market by Value, 2024-2034 (US$ Mn, AGR (%), CAGR (%))
Table 82 Middle East & Africa Offshore Remotely Operated Vehicle (ROV) Market by Value, 2024-2034 (US$ Mn, AGR (%), CAGR (%))
Table 83 Middle East & Africa Offshore Remotely Operated Vehicle (ROV) Market by Country, 2024-2034 (US$ Mn, AGR (%), CAGR (%))
Table 84 Middle East & Africa Offshore Remotely Operated Vehicle (ROV) Market by Type/Class, 2024-2034 (US$ Mn, AGR (%), CAGR (%))
Table 85 Middle East & Africa Offshore Remotely Operated Vehicle (ROV) Market by Industry, 2024-2034 (US$ Mn, AGR (%), CAGR (%))
Table 86 Middle East & Africa Offshore Remotely Operated Vehicle (ROV) Market by Application, 2024-2034 (US$ Mn, AGR (%), CAGR (%))
Table 87 Middle East & Africa Offshore Remotely Operated Vehicle (ROV) Market by Depth, 2024-2034 (US$ Mn, AGR (%), CAGR (%))
Table 88 Middle East & Africa Offshore Remotely Operated Vehicle (ROV) Market by Payload, 2024-2034 (US$ Mn, AGR (%), CAGR (%))
Table 89 Middle East & Africa Offshore Remotely Operated Vehicle (ROV) Market by Weight, 2024-2034 (US$ Mn, AGR (%), CAGR (%))
Table 90 Middle East & Africa Offshore Remotely Operated Vehicle (ROV) Market by Function, 2024-2034 (US$ Mn, AGR (%), CAGR (%))
Table 91 GCC Offshore Remotely Operated Vehicle (ROV) Market by Value, 2024-2034 (US$ Mn, AGR (%), CAGR (%))
Table 92 South Africa Offshore Remotely Operated Vehicle (ROV) Market by Value, 2024-2034 (US$ Mn, AGR (%), CAGR (%))
Table 93 Rest of Middle East & Africa Offshore Remotely Operated Vehicle (ROV) Market by Value, 2024-2034 (US$ Mn, AGR (%), CAGR (%))
Table 94 Latin America Offshore Remotely Operated Vehicle (ROV) Market by Value, 2024-2034 (US$ Mn, AGR (%), CAGR (%))
Table 95 Latin America Offshore Remotely Operated Vehicle (ROV) Market by Country, 2024-2034 (US$ Mn, AGR (%), CAGR (%))
Table 96 Latin America Offshore Remotely Operated Vehicle (ROV) Market by Type/Class, 2024-2034 (US$ Mn, AGR (%), CAGR (%))
Table 97 Latin America Offshore Remotely Operated Vehicle (ROV) Market by Industry, 2024-2034 (US$ Mn, AGR (%), CAGR (%))
Table 98 Latin America Offshore Remotely Operated Vehicle (ROV) Market by Application, 2024-2034 (US$ Mn, AGR (%), CAGR (%))
Table 99 Latin America Offshore Remotely Operated Vehicle (ROV) Market by Depth, 2024-2034 (US$ Mn, AGR (%), CAGR (%))
Table 100 Latin America Offshore Remotely Operated Vehicle (ROV) Market by Payload, 2024-2034 (US$ Mn, AGR (%), CAGR (%))
Table 101 Latin America Offshore Remotely Operated Vehicle (ROV) Market by Weight, 2024-2034 (US$ Mn, AGR (%), CAGR (%))
Table 102 Latin America Offshore Remotely Operated Vehicle (ROV) Market by Function, 2024-2034 (US$ Mn, AGR (%), CAGR (%))
Table 103 Brazil Offshore Remotely Operated Vehicle (ROV) Market by Value, 2024-2034 (US$ Mn, AGR (%), CAGR (%))
Table 104 Mexico Offshore Remotely Operated Vehicle (ROV) Market by Value, 2024-2034 (US$ Mn, AGR (%), CAGR (%))
Table 105 Rest of Latin America Offshore Remotely Operated Vehicle (ROV) Market by Value, 2024-2034 (US$ Mn, AGR (%), CAGR (%))
Table 106 Strategic Outlook - Contract
Table 107 Oceaneering International, Inc: Key Details, (CEO, HQ, Revenue, Founded, No. of Employees, Company Type, Website, Business Segment)
Table 108 Oceaneering International, Inc: Product Benchmarking
Table 109 Oceaneering International, Inc: Strategic Outlook
Table 110 Subsea 7 S.A: Key Details, (CEO, HQ, Revenue, Founded, No. of Employees, Company Type, Website, Business Segment)
Table 111 Subsea 7 S.A: Product Benchmarking
Table 112 Subsea 7 S.A: Strategic Outlook
Table 113 TechnipFMC plc: Key Details, (CEO, HQ, Revenue, Founded, No. of Employees, Company Type, Website, Business Segment)
Table 114 TechnipFMC plc: Product Benchmarking
Table 115 TechnipFMC plc: Strategic Outlook
Table 116 Saab AB: Key Details, (CEO, HQ, Revenue, Founded, No. of Employees, Company Type, Website, Business Segment)
Table 117 Saab AB: Product Benchmarking
Table 118 Saab AB: Strategic Outlook
Table 119 Deep Ocean: Key Details, (CEO, HQ, Revenue, Founded, No. of Employees, Company Type, Website, Business Segment)
Table 120 Deep Ocean: Product Benchmarking
Table 121 Deep Ocean: Strategic Outlook
Table 122 Video Ray: Key Details, (CEO, HQ, Revenue, Founded, No. of Employees, Company Type, Website, Business Segment)
Table 123 Video Ray: Product Benchmarking
Table 124 Video Ray: Strategic Outlook
Table 125 Blue Robotics: Key Details, (CEO, HQ, Revenue, Founded, No. of Employees, Company Type, Website, Business Segment)
Table 126 Blue Robotics: Product Benchmarking
Table 127 Forum Energy Technologies, Inc. (FET): Key Details, (CEO, HQ, Revenue, Founded, No. of Employees, Company Type, Website, Business Segment)
Table 128 Forum Energy Technologies, Inc. (FET): Product Benchmarking
Table 129 Forum Energy Technologies, Inc. (FET): Strategic Outlook
Table 130 Fugro N.V.: Key Details, (CEO, HQ, Revenue, Founded, No. of Employees, Company Type, Website, Business Segment)
Table 131 Fugro N.V.: Product Benchmarking
Table 132 Fugro N.V.: Strategic Outlook
Table 133 DOF Group ASA: Key Details, (CEO, HQ, Revenue, Founded, No. of Employees, Company Type, Website, Business Segment)
Table 134 DOF Group ASA: Product Benchmarking
Table 135 DOF Group ASA: Strategic Outlook
Table 136 Deep Trekker Inc.: Key Details, (CEO, HQ, Revenue, Founded, No. of Employees, Company Type, Website, Business Segment)
Table 137 Deep Trekker Inc.: Product Benchmarking
Table 138 Deep Trekker Inc.: Strategic Outlook
Table 139 Outland Technologies Inc: Key Details, (CEO, HQ, Revenue, Founded, No. of Employees, Company Type, Website, Business Segment)
Table 140 Outland Technologies Inc: Product Benchmarking
Table 141 Helix Energy Solutions: Key Details, (CEO, HQ, Revenue, Founded, No. of Employees, Company Type, Website, Business Segment)
Table 142 Helix Energy Solutions: Product Benchmarking
図の一覧
Figure 1 Offshore Remotely Operated Vehicle (ROV) Market Segmentation
Figure 2 Offshore Remotely Operated Vehicle (ROV) Market: Market Dynamics
Figure 3 Crude Oil Production
Figure 4 Offshore Remotely Operated Vehicle (ROV) Market: Porter’s Five Forces Analysis
Figure 5 Global Offshore Remotely Operated Vehicle (ROV) Market Share Forecast by COVID, 2024-2034 (%)
Figure 6 Global Offshore Remotely Operated Vehicle (ROV) Market by Region, 2024-2034 (US$ Mn, AGR (%)) (V-Shaped Recovery Scenario)
Figure 7 Global Offshore Remotely Operated Vehicle (ROV) Market by Region, 2024-2034 (US$ Mn, AGR (%)) (U-Shaped Recovery Scenario)
Figure 8 Global Offshore Remotely Operated Vehicle (ROV) Market by Region, 2024-2034 (US$ Mn, AGR (%)) (W-Shaped Recovery Scenario)
Figure 9 Global Offshore Remotely Operated Vehicle (ROV) Market by Region, 2024-2034 (US$ Mn, AGR (%)) (L-Shaped Recovery Scenario)
Figure 10 Offshore Remotely Operated Vehicle (ROV) Market: PEST Analysis
Figure 11 Global Offshore Remotely Operated Vehicle (ROV) Market by Type/Class, 2024-2034 (US$ Mn, AGR (%))
Figure 12 Work-class Market by Region, 2024-2034 (US$ Mn, AGR (%))
Figure 13 Observation-class Market by Region, 2024-2034 (US$ Mn, AGR (%))
Figure 14 Intervention-class Market by Region, 2024-2034 (US$ Mn, AGR (%))
Figure 15 Global Offshore Remotely Operated Vehicle (ROV) Market by Industry, 2024-2034 (US$ Mn, AGR (%))
Figure 16 Oil and Gas Market by Region, 2024-2034 (US$ Mn, AGR (%))
Figure 17 Offshore Wind Market by Region, 2024-2034 (US$ Mn, AGR (%))
Figure 18 Defence Market by Region, 2024-2034 (US$ Mn, AGR (%))
Figure 19 Research and Surveying Market by Region, 2024-2034 (US$ Mn, AGR (%))
Figure 20 Others Market by Region, 2024-2034 (US$ Mn, AGR (%))
Figure 21 Global Offshore Remotely Operated Vehicle (ROV) Market by Application, 2024-2034 (US$ Mn, AGR (%))
Figure 22 Construction Support Market by Region, 2024-2034 (US$ Mn, AGR (%))
Figure 23 Drilling Support Market by Region, 2024-2034 (US$ Mn, AGR (%))
Figure 24 Inspection, Repair, and Maintenance (IRM) Market by Region, 2024-2034 (US$ Mn, AGR (%))
Figure 25 Others Market by Region, 2024-2034 (US$ Mn, AGR (%))
Figure 26 Global Offshore Remotely Operated Vehicle (ROV) Market by Depth, 2024-2034 (US$ Mn, AGR (%))
Figure 27 Less than 5,000 feet Market by Region, 2024-2034 (US$ Mn, AGR (%))
Figure 28 5,000-10,000 feet Market by Region, 2024-2034 (US$ Mn, AGR (%))
Figure 29 Above 10,000 feet Market by Region, 2024-2034 (US$ Mn, AGR (%))
Figure 30 Global Offshore Remotely Operated Vehicle (ROV) Market by Payload, 2024-2034 (US$ Mn, AGR (%))
Figure 31 Less than 200 Kg Market by Region, 2024-2034 (US$ Mn, AGR (%))
Figure 32 201-300kg Market by Region, 2024-2034 (US$ Mn, AGR (%))
Figure 33 Above 300 Kg Market by Region, 2024-2034 (US$ Mn, AGR (%))
Figure 34 Global Offshore Remotely Operated Vehicle (ROV) Market by Weight, 2024-2034 (US$ Mn, AGR (%))
Figure 35 OCROV (up to 91 kg) Market by Region, 2024-2034 (US$ Mn, AGR (%))
Figure 36 MSROV (91 kg to 907 kg) Market by Region, 2024-2034 (US$ Mn, AGR (%))
Figure 37 WCROV (excess 907 kg) Market by Region, 2024-2034 (US$ Mn, AGR (%))
Figure 38 Global Offshore Remotely Operated Vehicle (ROV) Market by Function, 2024-2034 (US$ Mn, AGR (%))
Figure 39 Intervention Market by Region, 2024-2034 (US$ Mn, AGR (%))
Figure 40 Crawler Market by Region, 2024-2034 (US$ Mn, AGR (%))
Figure 41 Pipelay Market by Region, 2024-2034 (US$ Mn, AGR (%))
Figure 42 Trenching Market by Region, 2024-2034 (US$ Mn, AGR (%))
Figure 43 Others Market by Region, 2024-2034 (US$ Mn, AGR (%))
Figure 44 Offshore Remotely Operated Vehicle (ROV) Market Forecast by Region 2024 and 2034 (Revenue, CAGR%)
Figure 45 Global Offshore Remotely Operated Vehicle (ROV) Market by Region, 2024-2034 (US$ Mn, AGR (%))
Figure 46 North America Offshore Remotely Operated Vehicle (ROV) Market by Country, 2024, 2029 & 2034 (US$ Million)
Figure 47 North America Offshore Remotely Operated Vehicle (ROV) Market by Value, 2024-2034 (US$ Mn, AGR (%))
Figure 48 North America Offshore Remotely Operated Vehicle (ROV) Market by Country, 2024-2034 (US$ Mn, AGR (%))
Figure 49 North America Offshore Remotely Operated Vehicle (ROV) Market Share Forecast by Country, 2024 & 2034 (%)
Figure 50 North America Offshore Remotely Operated Vehicle (ROV) Market by Type/Class, 2024-2034 (US$ Mn, AGR (%))
Figure 51 North America Offshore Remotely Operated Vehicle (ROV) Market Share Forecast Type/Class, 2024 & 2034 (%)
Figure 52 North America Offshore Remotely Operated Vehicle (ROV) Market by Industry, 2024-2034 (US$ Mn, AGR (%))
Figure 53 North America Offshore Remotely Operated Vehicle (ROV) Market Share Forecast by Industry, 2024 & 2034 (%)
Figure 54 North America Offshore Remotely Operated Vehicle (ROV) Market by Application, 2024-2034 (US$ Mn, AGR (%))
Figure 55 North America Offshore Remotely Operated Vehicle (ROV) Market Share Forecast by Application, 2024 & 2034 (%)
Figure 56 North America Offshore Remotely Operated Vehicle (ROV) Market by Depth, 2024-2034 (US$ Mn, AGR (%))
Figure 57 North America Offshore Remotely Operated Vehicle (ROV) Market Share Forecast by Depth, 2024 & 2034 (%)
Figure 58 North America Offshore Remotely Operated Vehicle (ROV) Market by Payload, 2024-2034 (US$ Mn, AGR (%))
Figure 59 North America Offshore Remotely Operated Vehicle (ROV) Market Share Forecast by Payload, 2024 & 2034 (%)
Figure 60 North America Offshore Remotely Operated Vehicle (ROV) Market by Weight, 2024-2034 (US$ Mn, AGR (%))
Figure 61 North America Offshore Remotely Operated Vehicle (ROV) Market Share Forecast by Weight, 2024 & 2034 (%)
Figure 62 North America Offshore Remotely Operated Vehicle (ROV) Market by Function, 2024-2034 (US$ Mn, AGR (%))
Figure 63 North America Offshore Remotely Operated Vehicle (ROV) Market Share Forecast by Function, 2024 & 2034 (%)
Figure 64 US Offshore Remotely Operated Vehicle (ROV) Market by Value, 2024-2034 (US$ Mn, AGR (%))
Figure 65 Canada Offshore Remotely Operated Vehicle (ROV) Market by Value, 2024-2034 (US$ Mn, AGR (%))
Figure 66 Europe Offshore Remotely Operated Vehicle (ROV) Market by Region, 2024, 2029 & 2034 (US$ Million)
Figure 67 Europe Offshore Remotely Operated Vehicle (ROV) Market by Value, 2024-2034 (US$ Mn, AGR (%))
Figure 68 Europe Offshore Remotely Operated Vehicle (ROV) Market by Country, 2024-2034 (US$ Mn, AGR (%))
Figure 69 Europe Offshore Remotely Operated Vehicle (ROV) Market Share Forecast by Country, 2024 & 2034 (%)
Figure 70 Europe Offshore Remotely Operated Vehicle (ROV) Market by Type/Class, 2024-2034 (US$ Mn, AGR (%))
Figure 71 Europe Offshore Remotely Operated Vehicle (ROV) Market Share Forecast Type/Class, 2024 & 2034 (%)
Figure 72 Europe Offshore Remotely Operated Vehicle (ROV) Market by Industry, 2024-2034 (US$ Mn, AGR (%))
Figure 73 Europe Offshore Remotely Operated Vehicle (ROV) Market Share Forecast by Industry, 2024 & 2034 (%)
Figure 74 Europe Offshore Remotely Operated Vehicle (ROV) Market by Application, 2024-2034 (US$ Mn, AGR (%))
Figure 75 Europe Offshore Remotely Operated Vehicle (ROV) Market Share Forecast by Application, 2024 & 2034 (%)
Figure 76 Europe Offshore Remotely Operated Vehicle (ROV) Market by Depth, 2024-2034 (US$ Mn, AGR (%))
Figure 77 Europe Offshore Remotely Operated Vehicle (ROV) Market Share Forecast by Depth, 2024 & 2034 (%)
Figure 78 Europe Offshore Remotely Operated Vehicle (ROV) Market by Weight, 2024-2034 (US$ Mn, AGR (%))
Figure 79 Europe Offshore Remotely Operated Vehicle (ROV) Market Share Forecast by Payload, 2024 & 2034 (%)
Figure 80 Europe Offshore Remotely Operated Vehicle (ROV) Market by Weight, 2024-2034 (US$ Mn, AGR (%))
Figure 81 Europe Offshore Remotely Operated Vehicle (ROV) Market Share Forecast by Weight, 2024 & 2034 (%)
Figure 82 Europe Offshore Remotely Operated Vehicle (ROV) Market by Function, 2024-2034 (US$ Mn, AGR (%))
Figure 83 Europe Offshore Remotely Operated Vehicle (ROV) Market Share Forecast by Function, 2024 & 2034 (%)
Figure 84 Germany Offshore Remotely Operated Vehicle (ROV) Market by Value, 2024-2034 (US$ Mn, AGR (%))
Figure 85 UK Offshore Remotely Operated Vehicle (ROV) Market by Value, 2024-2034 (US$ Mn, AGR (%))
Figure 86 France Offshore Remotely Operated Vehicle (ROV) Market by Value, 2024-2034 (US$ Mn, AGR (%))
Figure 87 Italy Offshore Remotely Operated Vehicle (ROV) Market by Value, 2024-2034 (US$ Mn, AGR (%))
Figure 88 Spain Offshore Remotely Operated Vehicle (ROV) Market by Value, 2024-2034 (US$ Mn, AGR (%))
Figure 89 Rest of Europe Offshore Remotely Operated Vehicle (ROV) Market by Value, 2024-2034 (US$ Mn, AGR (%))
Figure 90 Asia-Pacific Offshore Remotely Operated Vehicle (ROV) Market by Country, 2024, 2029 & 2034 (US$ Million)
Figure 91 Asia-Pacific Offshore Remotely Operated Vehicle (ROV) Market by Value, 2024-2034 (US$ Mn, AGR (%))
Figure 92 Asia-Pacific Offshore Remotely Operated Vehicle (ROV) Market by Country, 2024-2034 (US$ Mn, AGR (%))
Figure 93 Asia-Pacific Offshore Remotely Operated Vehicle (ROV) Market Share Forecast by Country, 2024 & 2034 (%)
Figure 94 Asia-Pacific Offshore Remotely Operated Vehicle (ROV) Market by Type/Class, 2024-2034 (US$ Mn, AGR (%))
Figure 95 Asia-Pacific Offshore Remotely Operated Vehicle (ROV) Market Share Forecast Type/Class, 2024 & 2034 (%)
Figure 96 Asia-Pacific Offshore Remotely Operated Vehicle (ROV) Market by Industry, 2024-2034 (US$ Mn, AGR (%))
Figure 97 Asia-Pacific Offshore Remotely Operated Vehicle (ROV) Market Share Forecast by Industry, 2024 & 2034 (%)
Figure 98 Asia-Pacific Offshore Remotely Operated Vehicle (ROV) Market by Application, 2024-2034 (US$ Mn, AGR (%))
Figure 99 Asia-Pacific Offshore Remotely Operated Vehicle (ROV) Market Share Forecast by Application, 2024 & 2034 (%)
Figure 100 Asia-Pacific Offshore Remotely Operated Vehicle (ROV) Market by Depth, 2024-2034 (US$ Mn, AGR (%))
Figure 101 Asia-Pacific Offshore Remotely Operated Vehicle (ROV) Market Share Forecast by Depth, 2024 & 2034 (%)
Figure 102 Asia-Pacific Offshore Remotely Operated Vehicle (ROV) Market by Payload, 2024-2034 (US$ Mn, AGR (%))
Figure 103 Asia-Pacific Offshore Remotely Operated Vehicle (ROV) Market Share Forecast by Payload, 2024 & 2034 (%)
Figure 104 Asia-Pacific Offshore Remotely Operated Vehicle (ROV) Market by Weight, 2024-2034 (US$ Mn, AGR (%))
Figure 105 Asia-Pacific Offshore Remotely Operated Vehicle (ROV) Market Share Forecast by Weight, 2024 & 2034 (%)
Figure 106 Asia-Pacific Offshore Remotely Operated Vehicle (ROV) Market by Function, 2024-2034 (US$ Mn, AGR (%))
Figure 107 Asia-Pacific Offshore Remotely Operated Vehicle (ROV) Market Share Forecast by Function, 2024 & 2034 (%)
Figure 108 China Offshore Remotely Operated Vehicle (ROV) Market by Value, 2024-2034 (US$ Mn, AGR (%))
Figure 109 India Offshore Remotely Operated Vehicle (ROV) Market by Value, 2024-2034 (US$ Mn, AGR (%))
Figure 110 Japan Offshore Remotely Operated Vehicle (ROV) Market by Value, 2024-2034 (US$ Mn, AGR (%))
Figure 111 South Korea Offshore Remotely Operated Vehicle (ROV) Market by Value, 2024-2034 (US$ Mn, AGR (%))
Figure 112 Australia Offshore Remotely Operated Vehicle (ROV) Market by Value, 2024-2034 (US$ Mn, AGR (%))
Figure 113 Rest of Asia-Pacific Offshore Remotely Operated Vehicle (ROV) Market by Value, 2024-2034 (US$ Mn, AGR (%))
Figure 114 Middle East and Africa Offshore Remotely Operated Vehicle (ROV) Market by Region, 2024, 2029 & 2034 (US$ Million)
Figure 115 Middle East & Africa Offshore Remotely Operated Vehicle (ROV) Market by Value, 2024-2034 (US$ Mn, AGR (%))
Figure 116 Middle East & Africa Offshore Remotely Operated Vehicle (ROV) Market by Country, 2024-2034 (US$ Mn, AGR (%))
Figure 117 Middle East and Africa Offshore Remotely Operated Vehicle (ROV) Market Share Forecast by Country, 2024 & 2034 (%)
Figure 118 Middle East & Africa Offshore Remotely Operated Vehicle (ROV) Market by Type/Class, 2024-2034 (US$ Mn, AGR (%))
Figure 119 Middle East and Africa Offshore Remotely Operated Vehicle (ROV) Market Share Forecast Type/Class, 2024 & 2034 (%)
Figure 120 Middle East & Africa Offshore Remotely Operated Vehicle (ROV) Market by Industry, 2024-2034 (US$ Mn, AGR (%))
Figure 121 Middle East and Africa Offshore Remotely Operated Vehicle (ROV) Market Share Forecast by Industry, 2024 & 2034 (%)
Figure 122 Middle East & Africa Offshore Remotely Operated Vehicle (ROV) Market by Application, 2024-2034 (US$ Mn, AGR (%))
Figure 123 Middle East and Africa Offshore Remotely Operated Vehicle (ROV) Market Share Forecast by Application, 2024 & 2034 (%)
Figure 124 Middle East & Africa Offshore Remotely Operated Vehicle (ROV) Market by Depth, 2024-2034 (US$ Mn, AGR (%))
Figure 125 Middle East and Africa Offshore Remotely Operated Vehicle (ROV) Market Share Forecast by Depth, 2024 & 2034 (%)
Figure 126 Middle East & Africa Offshore Remotely Operated Vehicle (ROV) Market by Payload, 2024-2034 (US$ Mn, AGR (%))
Figure 127 Middle East and Africa Offshore Remotely Operated Vehicle (ROV) Market Share Forecast by Payload, 2024 & 2034 (%)
Figure 128 Middle East & Africa Offshore Remotely Operated Vehicle (ROV) Market by Weight, 2024-2034 (US$ Mn, AGR (%))
Figure 129 Middle East and Africa Offshore Remotely Operated Vehicle (ROV) Market Share Forecast by Weight, 2024 & 2034 (%)
Figure 130 Middle East & Africa Offshore Remotely Operated Vehicle (ROV) Market by Function, 2024-2034 (US$ Mn, AGR (%))
Figure 131 Middle East and Africa Offshore Remotely Operated Vehicle (ROV) Market Share Forecast by Function, 2024 & 2034 (%)
Figure 132 GCC Offshore Remotely Operated Vehicle (ROV) Market by Value, 2024-2034 (US$ Mn, AGR (%))
Figure 133 South Africa Offshore Remotely Operated Vehicle (ROV) Market by Value, 2024-2034 (US$ Mn, AGR (%))
Figure 134 Rest of Middle East & Africa Offshore Remotely Operated Vehicle (ROV) Market by Value, 2024-2034 (US$ Mn, AGR (%))
Figure 135 Latin America Offshore Remotely Operated Vehicle (ROV) Market by Region, 2024, 2029 & 2034 (US$ Million)
Figure 136 Latin America Offshore Remotely Operated Vehicle (ROV) Market by Value, 2024-2034 (US$ Mn, AGR (%))
Figure 137 Latin America Offshore Remotely Operated Vehicle (ROV) Market by Country, 2024-2034 (US$ Mn, AGR (%))
Figure 138 Latin America Offshore Remotely Operated Vehicle (ROV) Market Share Forecast by Country, 2024 & 2034 (%)
Figure 139 Latin America Offshore Remotely Operated Vehicle (ROV) Market by Type/Class, 2024-2034 (US$ Mn, AGR (%))
Figure 140 Latin America Offshore Remotely Operated Vehicle (ROV) Market Share Forecast Type/Class, 2024 & 2034 (%)
Figure 141 Latin America Offshore Remotely Operated Vehicle (ROV) Market by Industry, 2024-2034 (US$ Mn, AGR (%))
Figure 142 Latin America Offshore Remotely Operated Vehicle (ROV) Market Share Forecast by Industry, 2024 & 2034 (%)
Figure 143 Latin America Offshore Remotely Operated Vehicle (ROV) Market by Application, 2024-2034 (US$ Mn, AGR (%))
Figure 144 Latin America Offshore Remotely Operated Vehicle (ROV) Market Share Forecast by Application, 2024 & 2034 (%)
Figure 145 Latin America Offshore Remotely Operated Vehicle (ROV) Market by Depth, 2024-2034 (US$ Mn, AGR (%))
Figure 146 Latin America Offshore Remotely Operated Vehicle (ROV) Market Share Forecast by Depth, 2024 & 2034 (%)
Figure 147 Latin America Offshore Remotely Operated Vehicle (ROV) Market by Payload, 2024-2034 (US$ Mn, AGR (%))
Figure 148 Latin America Offshore Remotely Operated Vehicle (ROV) Market Share Forecast by Payload, 2024 & 2034 (%)
Figure 149 Latin America Offshore Remotely Operated Vehicle (ROV) Market by Weight, 2024-2034 (US$ Mn, AGR (%))
Figure 150 Latin America Offshore Remotely Operated Vehicle (ROV) Market Share Forecast by Weight, 2024 & 2034 (%)
Figure 151 Latin America Offshore Remotely Operated Vehicle (ROV) Market by Function, 2024-2034 (US$ Mn, AGR (%))
Figure 152 Latin America Offshore Remotely Operated Vehicle (ROV) Market Share Forecast by Function, 2024 & 2034 (%)
Figure 153 Brazil Offshore Remotely Operated Vehicle (ROV) Market by Value, 2024-2034 (US$ Mn, AGR (%))
Figure 154 Mexico Offshore Remotely Operated Vehicle (ROV) Market by Value, 2024-2034 (US$ Mn, AGR (%))
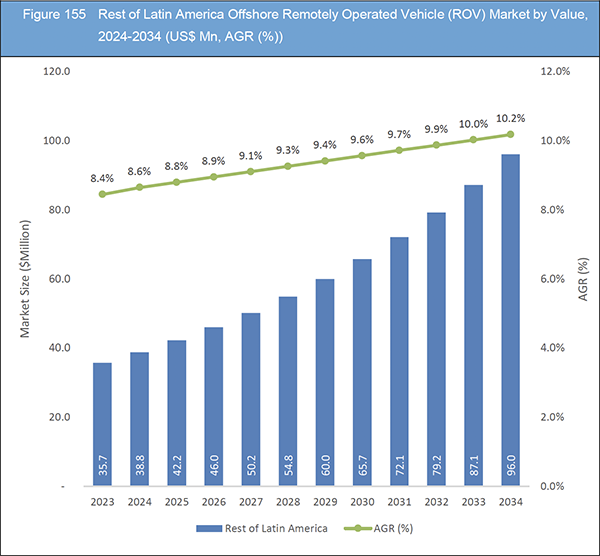
Figure 155 Rest of Latin America Offshore Remotely Operated Vehicle (ROV) Market by Value, 2024-2034 (US$ Mn, AGR (%))
Figure 156 Offshore Remotely Operated Vehicle (ROV) Market: Company Share, 2022
Figure 157 Oceaneering International, Inc.: Net Revenue, 2018-2022 (US$ Million, AGR%)
Figure 158 Oceaneering International, Inc.: Business Segment Revenue Share, 2022 (%)
Figure 159 Subsea 7 S.A.: Net Revenue, 2018-2022 (US$ Million, AGR%)
Figure 160 Subsea 7 S.A.: R&D, 2018-2022 (US$ Million, AGR%)
Figure 161 TechnipFMC plc.: Net Revenue, 2018-2022 (US$ Million, AGR%)
Figure 162 TechnipFMC plc.: R&D, 2018-2022 (US$ Million, AGR%)
Figure 163 TechnipFMC plc.: Regional Revenue Share, 2022 (%)
Figure 164 TechnipFMC plc.: Business Segment Revenue Share, 2022 (%)
Figure 165 Saab AB.: Net Revenue, 2018-2022 (US$ Million, AGR%)
Figure 166 Saab AB.: R&D, 2018-2022 (US$ Million, AGR%)
Figure 167 Saab AB.: Regional Revenue Share, 2022 (%)
Figure 168 Saab AB.: Business Segment Revenue Share, 2022 (%)
Figure 169 Forum Energy Technologies, Inc. (FET).: Net Revenue, 2018-2022 (US$ Million, AGR%)
Figure 170 Forum Energy Technologies, Inc. (FET).: Business Segment Revenue Share, 2022 (%)
Figure 171 Fugro N.V..: Net Revenue, 2018-2022 (US$ Million, AGR%)
Figure 172 Fugro N.V..: R&D, 2018-2022 (US$ Million, AGR%)
Figure 173 Fugro N.V..: Regional Revenue Share, 2022 (%)
Figure 174 Fugro N.V..: Business Segment Revenue Share, 2022 (%)
Figure 175 DOF Group ASA.: Net Revenue, 2018-2022 (US$ Million, AGR%)
Figure 176 DOF Group ASA.: Business Segment Revenue Share, 2022 (%)
Figure 177 Helix Energy Solutions.: Net Revenue, 2018-2022 (US$ Million, AGR%)
Figure 178 Helix Energy Solutions.: Regional Revenue Share, 2022 (%)
Figure 179 Helix Energy Solutions.: Business Segment Revenue Share, 2022 (%)
ページTOPに戻る
Summary
Report Details
The Offshore Remotely Operated Vehicle (ROV) Market Report 2024-2034: This report will prove invaluable to leading firms striving for new revenue pockets if they wish to better understand the industry and its underlying dynamics. It will be useful for companies that would like to expand into different industries or to expand their existing operations in a new region.
Amidst the Dynamic Landscape, Numerous Opportunities Unfold for Players in the Global Offshore Remotely Operated Vehicle (ROV) Market
The global offshore remotely operated vehicle (ROV) market continues to exhibit robust growth driven by a confluence of factors. Key drivers include the escalating demand for subsea exploration, maintenance, and intervention activities, particularly in the oil and gas sector. The offshore ROV market is propelled by the increasing need to address complex underwater operations efficiently, reduce human intervention, and ensure the safety of offshore personnel. The integration of advanced technologies, such as artificial intelligence and automation, further enhances the capabilities and reliability of ROVs in navigating challenging underwater environments.
Amidst the dynamic landscape, numerous opportunities unfold for industry players. The growing emphasis on renewable energy sources, including offshore wind farms, creates a significant market avenue for ROVs, fostering expansion beyond traditional oil and gas applications. Additionally, the development of low-cost ROV solutions and their accessibility to emerging markets present substantial growth opportunities. Geographical expansion, with a focus on emerging regions and strategic collaborations with local partners, emerges as a strategic avenue for market players to tap into new opportunities.
However, the offshore ROV market is not without its challenges. High operational costs, including equipment maintenance and skilled personnel training, pose constraints for market growth. Moreover, navigating complex regulatory frameworks and adhering to stringent safety standards continue to challenge industry participants. The market also faces competition from alternative technologies and methods, influencing pricing dynamics and market share.
What Questions Should You Ask before Buying a Market Research Report?
-
How is the offshore remotely operated vehicle (ROV) market evolving?
-
What is driving and restraining the offshore remotely operated vehicle (ROV) market?
-
How will each offshore remotely operated vehicle (ROV) submarket segment grow over the forecast period and how much revenue will these submarkets account for in 2034?
-
How will the market shares for each offshore remotely operated vehicle (ROV) submarket develop from 2024 to 2034?
-
What will be the main driver for the overall market from 2024 to 2034?
-
Will leading offshore remotely operated vehicle (ROV) markets broadly follow the macroeconomic dynamics, or will individual national markets outperform others?
-
How will the market shares of the national markets change by 2034 and which geographical region will lead the market in 2034?
-
Who are the leading players and what are their prospects over the forecast period?
-
What are the offshore remotely operated vehicle (ROV) projects for these leading companies?
-
How will the industry evolve during the period between 2024 and 2034? What are the implications of offshore remotely operated vehicle (ROV) projects taking place now and over the next 10 years?
-
Is there a greater need for product commercialisation to further scale the offshore remotely operated vehicle (ROV) market?
-
Where is the offshore remotely operated vehicle (ROV) market heading and how can you ensure you are at the forefront of the market?
-
What are the best investment options for new product and service lines?
-
What are the key prospects for moving companies into a new growth path and C-suite?
You need to discover how this will impact the offshore remotely operated vehicle (ROV) market today, and over the next 10 years:
-
Our 421-page report provides 142 tables and 179 charts/graphs exclusively to you.
-
The report highlights key lucrative areas in the industry so you can target them – NOW.
-
It contains in-depth analysis of global, regional and national sales and growth.
-
It highlights for you the key successful trends, changes and revenue projections made by your competitors.
This report tells you TODAY how the offshore remotely operated vehicle (ROV) market will develop in the next 10 years, and in line with the variations in COVID-19 economic recession and bounce. This market is more critical now than at any point over the last 10 years.
Forecasts to 2034 and other analyses reveal commercial prospects
-
In addition to revenue forecasting to 2034, our new study provides you with recent results, growth rates, and market shares.
-
You will find original analyses, with business outlooks and developments.
-
Discover qualitative analyses (including market dynamics, drivers, opportunities, restraints and challenges), cost structure, impact of rising offshore remotely operated vehicle (ROV) prices and recent developments.
This report includes data analysis and invaluable insight into how COVID-19 will affect the industry and your company. Four COVID-19 recovery patterns and their impact, namely, “V”, “L”, “W” and “U” are discussed in this report.
Segments Covered in the Report
Market Segment by Type/Class
-
Work-class
-
Observation-class
-
Intervention-class
Market Segment by Industry
-
Oil and gas
-
Offshore wind
-
Defense
-
Research and surveying
-
Others
Market Segment by Application
-
Construction Support
-
Drilling Support
-
Inspection, Repair, and Maintenance (IRM)
-
Others
Market Segment by Depth
-
Less than 5,000 feet
-
5,000-10,000 feet
-
Above 10,000 feet
Market Segment by Payload
-
Less than 200 kg
-
201-300 kg
-
Above 300 kg
Market Segment by Weight
-
OCROV (up to 91 kg)
-
MSROV (91 kg to 907 kg)
-
WCROV (excess 907 kg)
Market Segment by Function
-
Intervention
-
Crawler
-
Pipelay
-
Trenching
-
Others
In addition to the revenue predictions for the overall world market and segments, you will also find revenue forecasts for four regional and 20 leading national markets:
North America
Europe
-
Germany
-
Spain
-
United Kingdom
-
France
-
Italy
-
Rest of Europe
Asia Pacific
-
China
-
Japan
-
India
-
Australia
-
South Korea
-
Rest of Asia Pacific
Latin America
-
Brazil
-
Mexico
-
Rest of Latin America
Middle East & Africa
-
GCC
-
South Africa
-
Rest of Middle East & Africa
The report also includes profiles and for some of the leading companies in the Offshore Remotely Operated Vehicle (ROV) Market, 2024 to 2034, with a focus on this segment of these companies’ operations.
Leading companies profiled in the report
-
Blue Robotics
-
Deep Trekker Inc.
-
DeepOcean Group
-
DOF Group ASA
-
Forum Energy Technologies, Inc. (FET)
-
Fugro N.V.
-
Helix Energy Solutions
-
Oceaneering International, Inc.
-
Outland Technologies Inc.
-
Saab AB
-
Subsea 7 S.A.
-
TechnipFMC plc
-
VideoRay LLC
Overall world revenue for Offshore Remotely Operated Vehicle (ROV) Market, 2024 to 2034 in terms of value the market will surpass US$1,991.2 million in 2024, our work calculates. We predict strong revenue growth through to 2034. Our work identifies which organizations hold the greatest potential. Discover their capabilities, progress, and commercial prospects, helping you stay ahead.
How will the Offshore Remotely Operated Vehicle (ROV) Market, 2024 to 2034 report help you?
In summary, our 420+ page report provides you with the following knowledge:
-
Revenue forecasts to 2034 for Offshore Remotely Operated Vehicle (ROV) Market, 2024 to 2034 Market, with forecasts for type/class, industry, application, depth, payload, weight, and function, each forecast at a global and regional level – discover the industry’s prospects, finding the most lucrative places for investments and revenues.
-
Revenue forecasts to 2034 for four regional and 20 key national markets – See forecasts for the Offshore Remotely Operated Vehicle (ROV) Market, 2024 to 2034 market in North America, Europe, Asia-Pacific, Latin America and Middle East & Africa. Also forecasted is the market in the US, Canada, Brazil, Germany, France, UK, Italy, China, India, Japan, and Australia among other prominent economies.
-
Prospects for established firms and those seeking to enter the market – including company profiles for 13 of the major companies involved in the Offshore Remotely Operated Vehicle (ROV) Market, 2024 to 2034.
Find quantitative and qualitative analyses with independent predictions. Receive information that only our report contains, staying informed with invaluable business intelligence.
Information found nowhere else
With our new report, you are less likely to fall behind in knowledge or miss out on opportunities. See how our work could benefit your research, analyses, and decisions. Visiongain’s study is for everybody needing commercial analyses for the offshore remotely operated vehicle (ROV) market, 2024 to 2034, market-leading companies. You will find data, trends and predictions.
ページTOPに戻る
Table of Contents
1 Report Overview
1.1 Objectives of the Study
1.2 Introduction to Offshore Remotely Operated Vehicle (ROV) Market
1.3 What This Report Delivers
1.4 Why You Should Read This Report
1.5 Key Questions Answered by This Analytical Report
1.6 Who Is This Report for?
1.7 Research Methodology
1.7.1 Market Definitions
1.7.2 Market Evaluation & Forecasting Methodology
1.7.3 Data Validation
1.7.3.1 Primary Research
1.7.3.2 Secondary Research
1.8 Frequently Asked Questions (FAQs)
1.9 Associated Visiongain Reports
1.10 About Visiongain
2 Executive Summary
3 Market Overview
3.1 Key Findings
3.2 Market Dynamics
3.2.1 Market Driving Factors
3.2.1.1 Increasing Offshore Oil and Gas Exploration Activities in the American, Asia-Pacific, and Middle-East and African Regions
3.2.1.2 Growing Offshore Renewable Technologies Driving the Market Growth
3.2.1.3 Rise in Demand for Oil and Gas Driving the Market Growth
3.2.2 Market Restraining Factors
3.2.2.1 Ban on Offshore Exploration and Production Activities in Many Regions
3.2.2.2 High Operational Risk Hinder the Market Growth
3.2.2.3 Capital Intensive Market Hinder the Growth
3.2.3 Market Opportunities
3.2.3.1 Safety and Risk Mitigation Opportunities for the ROV Vehicle
3.2.3.2 Rising Investments in Remotely Operated Vehicles
3.2.3.3 Partnership and Collaboration Opportunities for the Market Players
3.3 Porter’s Five Forces Analysis
3.3.1 Bargaining Power of Suppliers (Medium to High)
3.3.2 Bargaining Power of Buyers (Medium)
3.3.3 Competitive Rivalry (High)
3.3.4 Threat from Substitutes (Low)
3.3.5 Threat of New Entrants (Low)
3.4 COVID-19 Impact Analysis
3.4.1 “V-Shaped Recovery”
3.4.2 “U-Shaped Recovery”
3.4.3 “W-Shaped Recovery”
3.4.4 “L-Shaped Recovery”
3.5 PEST Analysis
4 Offshore Remotely Operated Vehicle (ROV) Market Analysis by Type/Class
4.1 Key Findings
4.2 Offshore Remotely Operated Vehicle (ROV) Market Size Estimation and Forecast by Type/Class
4.3 Work-class
4.3.1 Market Size by Region, 2024-2034 (US$ Million)
4.4 Observation-class
4.4.1 Market Size by Region, 2024-2034 (US$ Million)
4.5 Intervention-class
4.5.1 Market Size by Region, 2024-2034 (US$ Million)
5 Offshore Remotely Operated Vehicle (ROV) Market Analysis by Industry
5.1 Key Findings
5.2 Offshore Remotely Operated Vehicle (ROV) Market Size Estimation and Forecast by Industry
5.3 Oil and Gas Segment
5.3.1 Market Size by Region, 2024-2034 (US$ Million)
5.4 Offshore Wind Segment
5.4.1 Market Size by Region, 2024-2034 (US$ Million)
5.5 Defence Segment
5.5.1 Market Size by Region, 2024-2034 (US$ Million)
5.6 Research and Surveying Segment
5.6.1 Market Size by Region, 2024-2034 (US$ Million)
5.7 Others
5.7.1 Market Size by Region, 2024-2034 (US$ Million)
6 Offshore Remotely Operated Vehicle (ROV) Market Analysis by Application
6.1 Key Findings
6.2 Offshore Remotely Operated Vehicle (ROV) Market Size Estimation and Forecast by Application
6.3 Construction Support
6.3.1 Market Size by Region, 2024-2034 (US$ Million)
6.4 Drilling Support
6.4.1 Market Size by Region, 2024-2034 (US$ Million)
6.5 Inspection, Repair, and Maintenance (IRM)
6.5.1 Market Size by Region, 2024-2034 (US$ Million)
6.6 Others
6.6.1 Market Size by Region, 2024-2034 (US$ Million)
7 Offshore Remotely Operated Vehicle (ROV) Market Analysis by Depth
7.1 Key Findings
7.2 Offshore Remotely Operated Vehicle (ROV) Market Size Estimation and Forecast by Depth
7.3 Less than 5,000 feet
7.3.1 Market Size by Region, 2024-2034 (US$ Million)
7.4 5,000-10,000 feet
7.4.1 Market Size by Region, 2024-2034 (US$ Million)
7.5 Above 10,000 feet
7.5.1 Market Size by Region, 2024-2034 (US$ Million)
8 Offshore Remotely Operated Vehicle (ROV) Market Analysis by Payload
8.1 Key Findings
8.2 Offshore Remotely Operated Vehicle (ROV) Market Size Estimation and Forecast by Payload
8.3 Less than 200 Kg
8.3.1 Market Size by Region, 2024-2034 (US$ Million)
8.4 201-300kg
8.4.1 Market Size by Region, 2024-2034 (US$ Million)
8.5 Above 300 Kg
8.5.1 Market Size by Region, 2024-2034 (US$ Million)
9 Offshore Remotely Operated Vehicle (ROV) Market Analysis by Weight
9.1 Key Findings
9.2 Offshore Remotely Operated Vehicle (ROV) Market Size Estimation and Forecast by Weight
9.3 OCROV (up to 91 kg)
9.3.1 Market Size by Region, 2024-2034 (US$ Million)
9.4 MSROV (91 kg to 907 kg)
9.4.1 Market Size by Region, 2024-2034 (US$ Million)
9.5 WCROV (excess 907 kg)
9.5.1 Market Size by Region, 2024-2034 (US$ Million)
10 Offshore Remotely Operated Vehicle (ROV) Market Analysis by Function
10.1 Key Findings
10.2 Offshore Remotely Operated Vehicle (ROV) Market Size Estimation and Forecast by Function
10.3 Intervention
10.3.1 Market Size by Region, 2024-2034 (US$ Million)
10.4 Crawler
10.4.1 Market Size by Region, 2024-2034 (US$ Million)
10.5 Pipelay
10.5.1 Market Size by Region, 2024-2034 (US$ Million)
10.6 Trenching
10.6.1 Market Size by Region, 2024-2034 (US$ Million)
10.7 Others
10.7.1 Market Size by Region, 2024-2034 (US$ Million)
11 Offshore Remotely Operated Vehicle (ROV) Market Analysis by Region
11.1 Key Findings
11.2 Regional Market Size Estimation and Forecast
12 North America Offshore Remotely Operated Vehicle (ROV) Market Analysis
12.1 Key Findings
12.2 North America Offshore Remotely Operated Vehicle (ROV) Market by Country, 2024, 2029 & 2034 (US$ Million)
12.3 North America Offshore Remotely Operated Vehicle (ROV) Market Size Estimation and Forecast
12.4 North America Offshore Remotely Operated Vehicle (ROV) Market Size Estimation and Forecast by Country
12.5 North America Offshore Remotely Operated Vehicle (ROV) Market Size Estimation and Forecast by Type/Class
12.6 North America Offshore Remotely Operated Vehicle (ROV) Market Size Estimation and Forecast by Industry
12.7 North America Offshore Remotely Operated Vehicle (ROV) Market Size Estimation and Forecast by Application
12.8 North America Offshore Remotely Operated Vehicle (ROV) Market Size Estimation and Forecast by Depth
12.9 North America Offshore Remotely Operated Vehicle (ROV) Market Size Estimation and Forecast by Payload
12.10 North America Offshore Remotely Operated Vehicle (ROV) Market Size Estimation and Forecast by Weight
12.11 North America Offshore Remotely Operated Vehicle (ROV) Market Size Estimation and Forecast by Function
12.12 U.S. Offshore Remotely Operated Vehicle (ROV) Market Analysis
12.13 Canada Offshore Remotely Operated Vehicle (ROV) Market Analysis
13 Europe Offshore Remotely Operated Vehicle (ROV) Market Analysis
13.1 Key Findings
13.2 Europe Offshore Remotely Operated Vehicle (ROV) Market by Country, 2024, 2029 & 2034 (US$ Million)
13.3 Europe Offshore Remotely Operated Vehicle (ROV) Market Size Estimation and Forecast
13.4 Europe Offshore Remotely Operated Vehicle (ROV) Market Size Estimation and Forecast by Country
13.5 Europe Offshore Remotely Operated Vehicle (ROV) Market Size Estimation and Forecast by Type/Class
13.6 Europe Offshore Remotely Operated Vehicle (ROV) Market Size Estimation and Forecast by Industry
13.7 Europe Offshore Remotely Operated Vehicle (ROV) Market Size Estimation and Forecast by Application
13.8 Europe Offshore Remotely Operated Vehicle (ROV) Market Size Estimation and Forecast by Depth
13.9 Europe Offshore Remotely Operated Vehicle (ROV) Market Size Estimation and Forecast by Payload
13.10 Europe Offshore Remotely Operated Vehicle (ROV) Market Size Estimation and Forecast by Weight
13.11 Europe Offshore Remotely Operated Vehicle (ROV) Market Size Estimation and Forecast by Function
13.12 Germany Offshore Remotely Operated Vehicle (ROV) Market Analysis
13.13 UK Offshore Remotely Operated Vehicle (ROV) Market Analysis
13.14 France Offshore Remotely Operated Vehicle (ROV) Market Analysis
13.15 Italy Offshore Remotely Operated Vehicle (ROV) Market Analysis
13.16 Spain Offshore Remotely Operated Vehicle (ROV) Market Analysis
13.17 Rest of Europe Offshore Remotely Operated Vehicle (ROV) Market Analysis
14 Asia-Pacific Offshore Remotely Operated Vehicle (ROV) Market Analysis
14.1 Key Findings
14.2 Asia-Pacific Offshore Remotely Operated Vehicle (ROV) Market by Country, 2024, 2029 & 2034 (US$ Million)
14.3 Asia-Pacific Offshore Remotely Operated Vehicle (ROV) Market Size Estimation and Forecast
14.4 Asia-Pacific Offshore Remotely Operated Vehicle (ROV) Market Size Estimation and Forecast by Country
14.5 Asia-Pacific Offshore Remotely Operated Vehicle (ROV) Market Size Estimation and Forecast by Type/Class
14.6 Asia-Pacific Offshore Remotely Operated Vehicle (ROV) Market Size Estimation and Forecast by Industry
14.7 Asia-Pacific Offshore Remotely Operated Vehicle (ROV) Market Size Estimation and Forecast by Application
14.8 Asia-Pacific Offshore Remotely Operated Vehicle (ROV) Market Size Estimation and Forecast by Depth
14.9 Asia-Pacific Offshore Remotely Operated Vehicle (ROV) Market Size Estimation and Forecast by Payload
14.10 Asia-Pacific Offshore Remotely Operated Vehicle (ROV) Market Size Estimation and Forecast by Weight
14.11 Asia-Pacific Offshore Remotely Operated Vehicle (ROV) Market Size Estimation and Forecast by Function
14.12 China Offshore Remotely Operated Vehicle (ROV) Market Analysis
14.13 India Offshore Remotely Operated Vehicle (ROV) Market Analysis
14.14 Japan Offshore Remotely Operated Vehicle (ROV) Market Analysis
14.15 South Korea Offshore Remotely Operated Vehicle (ROV) Market Analysis
14.16 Australia Offshore Remotely Operated Vehicle (ROV) Market Analysis
14.17 Rest of Asia-Pacific Offshore Remotely Operated Vehicle (ROV) Market Analysis
15 Middle East and Africa Offshore Remotely Operated Vehicle (ROV) Market Analysis
15.1 Key Findings
15.2 Middle East and Africa Offshore Remotely Operated Vehicle (ROV) Market by Country, 2024, 2029 & 2034 (US$ Million)
15.3 Middle East and Africa Offshore Remotely Operated Vehicle (ROV) Market Size Estimation and Forecast
15.4 Middle East and Africa Offshore Remotely Operated Vehicle (ROV) Market Size Estimation and Forecast by Country
15.5 Middle East and Africa Offshore Remotely Operated Vehicle (ROV) Market Size Estimation and Forecast by Type/Class
15.6 Middle East and Africa Offshore Remotely Operated Vehicle (ROV) Market Size Estimation and Forecast by Industry
15.7 Middle East and Africa Offshore Remotely Operated Vehicle (ROV) Market Size Estimation and Forecast by Application
15.8 Middle East and Africa Offshore Remotely Operated Vehicle (ROV) Market Size Estimation and Forecast by Depth
15.9 Middle East and Africa Offshore Remotely Operated Vehicle (ROV) Market Size Estimation and Forecast by Payload
15.10 Middle East and Africa Offshore Remotely Operated Vehicle (ROV) Market Size Estimation and Forecast by Weight
15.11 Middle East and Africa Offshore Remotely Operated Vehicle (ROV) Market Size Estimation and Forecast by Function
15.12 GCC Offshore Remotely Operated Vehicle (ROV) Market Analysis
15.13 South Africa Offshore Remotely Operated Vehicle (ROV) Market Analysis
15.14 Rest of Middle East & Africa Offshore Remotely Operated Vehicle (ROV) Market Analysis
16 Latin America Offshore Remotely Operated Vehicle (ROV) Market Analysis
16.1 Key Findings
16.2 Latin America Offshore Remotely Operated Vehicle (ROV) Market by Country, 2024, 2029 & 2034 (US$ Million)
16.3 Latin America Offshore Remotely Operated Vehicle (ROV) Market Size Estimation and Forecast
16.4 Latin America Offshore Remotely Operated Vehicle (ROV) Market Size Estimation and Forecast by Country
16.5 Latin America Offshore Remotely Operated Vehicle (ROV) Market Size Estimation and Forecast by Type/Class
16.6 Latin America Offshore Remotely Operated Vehicle (ROV) Market Size Estimation and Forecast by Industry
16.7 Latin America Offshore Remotely Operated Vehicle (ROV) Market Size Estimation and Forecast by Application
16.8 Latin America Offshore Remotely Operated Vehicle (ROV) Market Size Estimation and Forecast by Depth
16.9 Latin America Offshore Remotely Operated Vehicle (ROV) Market Size Estimation and Forecast by Payload
16.10 Latin America Offshore Remotely Operated Vehicle (ROV) Market Size Estimation and Forecast by Weight
16.11 Latin America Offshore Remotely Operated Vehicle (ROV) Market Size Estimation and Forecast by Function
16.12 Brazil Offshore Remotely Operated Vehicle (ROV) Market Analysis
16.13 Mexico Offshore Remotely Operated Vehicle (ROV) Market Analysis
16.14 Rest of Latin America Offshore Remotely Operated Vehicle (ROV) Market Analysis
17 Company Profiles
17.1 Competitive Landscape, 2022
17.2 Strategic Outlook
17.3 Oceaneering International, Inc
17.3.1 Company Snapshot
17.3.2 Company Overview
17.3.3 Financial Analysis
17.3.3.1 Net Revenue, 2018-2022
17.3.3.2 Business Segment Revenue Share, 2022 (%)
17.3.4 Product Benchmarking
17.3.5 Strategic Outlook
17.4 Subsea 7 S.A
17.4.1 Company Snapshot
17.4.2 Company Overview
17.4.3 Financial Analysis
17.4.3.1 Net Revenue, 2018-2022
17.4.3.2 R&D, 2018-2022
17.4.4 Product Benchmarking
17.4.5 Strategic Outlook
17.5 TechnipFMC plc
17.5.1 Company Snapshot
17.5.2 Company Overview
17.5.3 Financial Analysis
17.5.3.1 Net Revenue, 2018-2022
17.5.3.2 R&D, 2018-2022
17.5.3.3 Regional Revenue Share, 2022 (%)
17.5.3.4 Business Segment Revenue Share, 2022 (%)
17.5.4 Product Benchmarking
17.5.5 Strategic Outlook
17.6 Saab AB
17.6.1 Company Snapshot
17.6.2 Company Overview
17.6.3 Financial Analysis
17.6.3.1 Net Revenue, 2018-2022
17.6.3.2 R&D, 2018-2022
17.6.3.3 Regional Revenue Share, 2022 (%)
17.6.3.4 Business Segment Revenue Share, 2022 (%)
17.6.4 Product Benchmarking
17.6.5 Strategic Outlook
17.7 Deep Ocean
17.7.1 Company Snapshot
17.7.2 Company Overview
17.7.3 Product Benchmarking
17.7.4 Strategic Outlook
17.8 Video Ray
17.8.1 Company Snapshot
17.8.2 Company Overview
17.8.3 Product Benchmarking
17.8.4 Strategic Outlook
17.9 Blue Robotics
17.9.1 Company Snapshot
17.9.2 Company Overview
17.9.3 Product Benchmarking
17.10 Forum Energy Technologies, Inc. (FET)
17.10.1 Company Snapshot
17.10.2 Company Overview
17.10.3 Financial Analysis
17.10.3.1 Net Revenue, 2018-2022
17.10.3.2 Business Segment Revenue Share, 2022 (%)
17.10.4 Product Benchmarking
17.10.5 Strategic Outlook
17.11 Fugro N.V.
17.11.1 Company Snapshot
17.11.2 Company Overview
17.11.3 Financial Analysis
17.11.3.1 Net Revenue, 2018-2022
17.11.3.2 R&D, 2018-2022
17.11.3.3 Regional Revenue Share, 2022 (%)
17.11.3.4 Business Segment Revenue Share, 2022 (%)
17.11.4 Product Benchmarking
17.11.5 Strategic Outlook
17.12 DOF Group ASA
17.12.1 Company Snapshot
17.12.2 Company Overview
17.12.3 Financial Analysis
17.12.3.1 Net Revenue, 2018-2022
17.12.3.2 Business Segment Revenue Share, 2022 (%)
17.12.4 Product Benchmarking
17.12.5 Strategic Outlook
17.13 Deep Trekker Inc.
17.13.1 Company Snapshot
17.13.2 Company Overview
17.13.3 Product Benchmarking
17.13.4 Strategic Outlook
17.14 Outland Technologies Inc
17.14.1 Company Snapshot
17.14.2 Company Overview
17.14.3 Product Benchmarking
17.15 Helix Energy Solutions
17.15.1 Company Snapshot
17.15.2 Company Overview
17.15.3 Financial Analysis
17.15.3.1 Net Revenue, 2018-2022
17.15.3.2 Regional Revenue Share, 2022 (%)
17.15.3.3 Business Segment Revenue Share, 2022 (%)
17.15.4 Product Benchmarking
18 Conclusion and Recommendations
18.1 Concluding Remarks from Visiongain
18.2 Recommendations for Market Players
ページTOPに戻る
List of Tables/Graphs
List of Tables
Table 1 Offshore Remotely Operated Vehicle (ROV) Market Snapshot, 2024 & 2034 (US$ Million, CAGR %)
Table 2 Total Number of ROVs in the World, 2023 (Company, Units, Category)
Table 3 Global Offshore Remotely Operated Vehicle (ROV) Market by Region, 2024-2034 (US$ Mn, AGR (%), CAGR (%)) (V-Shaped Recovery Scenario)
Table 4 Global Offshore Remotely Operated Vehicle (ROV) Market by Region, 2024-2034 (US$ Mn, AGR (%), CAGR (%)) (U-Shaped Recovery Scenario)
Table 5 Global Offshore Remotely Operated Vehicle (ROV) Market by Region, 2024-2034 (US$ Mn, AGR (%), CAGR (%)) (W-Shaped Recovery Scenario)
Table 6 Global Offshore Remotely Operated Vehicle (ROV) Market by Region, 2024-2034 (US$ Mn, AGR (%), CAGR (%)) (L-Shaped Recovery Scenario)
Table 7 Global Offshore Remotely Operated Vehicle (ROV) Market by Type/Class, 2024-2034 (US$ Mn, AGR (%), CAGR (%))
Table 8 Work-class Market by Region, 2024-2034 (US$ Mn, AGR (%), CAGR (%))
Table 9 Observation-class Market by Region, 2024-2034 (US$ Mn, AGR (%), CAGR (%))
Table 10 Intervention-class Market by Region, 2024-2034 (US$ Mn, AGR (%), CAGR (%))
Table 11 Global Offshore Remotely Operated Vehicle (ROV) Market by Industry, 2024-2034 (US$ Mn, AGR (%), CAGR (%))
Table 12 Oil and Gas Market by Region, 2024-2034 (US$ Mn, AGR (%), CAGR (%))
Table 13 Offshore Wind Market by Region, 2024-2034 (US$ Mn, AGR (%), CAGR (%))
Table 14 Defence Market by Region, 2024-2034 (US$ Mn, AGR (%), CAGR (%))
Table 15 Research and Surveying Market by Region, 2024-2034 (US$ Mn, AGR (%), CAGR (%))
Table 16 Others Market by Region, 2024-2034 (US$ Mn, AGR (%), CAGR (%))
Table 17 Global Offshore Remotely Operated Vehicle (ROV) Market by Application, 2024-2034 (US$ Mn, AGR (%), CAGR (%))
Table 18 Construction Support Market by Region, 2024-2034 (US$ Mn, AGR (%), CAGR (%))
Table 19 Drilling Support Market by Region, 2024-2034 (US$ Mn, AGR (%), CAGR (%))
Table 20 Inspection, Repair, and Maintenance (IRM) Market by Region, 2024-2034 (US$ Mn, AGR (%), CAGR (%))
Table 21 Others Market by Region, 2024-2034 (US$ Mn, AGR (%), CAGR (%))
Table 22 Global Offshore Remotely Operated Vehicle (ROV) Market by Depth, 2024-2034 (US$ Mn, AGR (%), CAGR (%))
Table 23 Less than 5,000 feet Market by Region, 2024-2034 (US$ Mn, AGR (%), CAGR (%))
Table 24 5,000-10,000 feet Market by Region, 2024-2034 (US$ Mn, AGR (%), CAGR (%))
Table 25 Above 10,000 feet Market by Region, 2024-2034 (US$ Mn, AGR (%), CAGR (%))
Table 26 Global Offshore Remotely Operated Vehicle (ROV) Market by Payload, 2024-2034 (US$ Mn, AGR (%), CAGR (%))
Table 27 Less than 200 Kg Market by Region, 2024-2034 (US$ Mn, AGR (%), CAGR (%))
Table 28 201-300kg Market by Region, 2024-2034 (US$ Mn, AGR (%), CAGR (%))
Table 29 Above 300 Kg Market by Region, 2024-2034 (US$ Mn, AGR (%), CAGR (%))
Table 30 Global Offshore Remotely Operated Vehicle (ROV) Market by Weight, 2024-2034 (US$ Mn, AGR (%), CAGR (%))
Table 31 OCROV (up to 91 kg) Market by Region, 2024-2034 (US$ Mn, AGR (%), CAGR (%))
Table 32 MSROV (91 kg to 907 kg) Market by Region, 2024-2034 (US$ Mn, AGR (%), CAGR (%))
Table 33 WCROV (excess 907 kg) Market by Region, 2024-2034 (US$ Mn, AGR (%), CAGR (%))
Table 34 Global Offshore Remotely Operated Vehicle (ROV) Market by Function, 2024-2034 (US$ Mn, AGR (%), CAGR (%))
Table 35 Intervention Market by Region, 2024-2034 (US$ Mn, AGR (%), CAGR (%))
Table 36 Crawler Market by Region, 2024-2034 (US$ Mn, AGR (%), CAGR (%))
Table 37 Pipelay Market by Region, 2024-2034 (US$ Mn, AGR (%), CAGR (%))
Table 38 Trenching Market by Region, 2024-2034 (US$ Mn, AGR (%), CAGR (%))
Table 39 Others Market by Region, 2024-2034 (US$ Mn, AGR (%), CAGR (%))
Table 40 Global Offshore Remotely Operated Vehicle (ROV) Market by Region, 2024-2034 (US$ Mn, AGR (%), CAGR (%))
Table 41 North America Offshore Remotely Operated Vehicle (ROV) Market by Value, 2024-2034 (US$ Mn, AGR (%), CAGR (%))
Table 42 North America Offshore Remotely Operated Vehicle (ROV) Market by Country, 2024-2034 (US$ Mn, AGR (%), CAGR (%))
Table 43 North America Offshore Remotely Operated Vehicle (ROV) Market by Type/Class, 2024-2034 (US$ Mn, AGR (%), CAGR (%))
Table 44 North America Offshore Remotely Operated Vehicle (ROV) Market by Industry, 2024-2034 (US$ Mn, AGR (%), CAGR (%))
Table 45 North America Offshore Remotely Operated Vehicle (ROV) Market by Application, 2024-2034 (US$ Mn, AGR (%), CAGR (%))
Table 46 North America Offshore Remotely Operated Vehicle (ROV) Market by Depth, 2024-2034 (US$ Mn, AGR (%), CAGR (%))
Table 47 North America Offshore Remotely Operated Vehicle (ROV) Market by Payload, 2024-2034 (US$ Mn, AGR (%), CAGR (%))
Table 48 North America Offshore Remotely Operated Vehicle (ROV) Market by Weight, 2024-2034 (US$ Mn, AGR (%), CAGR (%))
Table 49 North America Offshore Remotely Operated Vehicle (ROV) Market by Function, 2024-2034 (US$ Mn, AGR (%), CAGR (%))
Table 50 US Offshore Remotely Operated Vehicle (ROV) Market by Value, 2024-2034 (US$ Mn, AGR (%), CAGR (%))
Table 51 Canada Offshore Remotely Operated Vehicle (ROV) Market by Value, 2024-2034 (US$ Mn, AGR (%), CAGR (%))
Table 52 Europe Offshore Remotely Operated Vehicle (ROV) Market by Value, 2024-2034 (US$ Mn, AGR (%), CAGR (%))
Table 53 Europe Offshore Remotely Operated Vehicle (ROV) Market by Country, 2024-2034 (US$ Mn, AGR (%), CAGR (%))
Table 54 Europe Offshore Remotely Operated Vehicle (ROV) Market by Type/Class, 2024-2034 (US$ Mn, AGR (%), CAGR (%))
Table 55 Europe Offshore Remotely Operated Vehicle (ROV) Market by Industry, 2024-2034 (US$ Mn, AGR (%), CAGR (%))
Table 56 Europe Offshore Remotely Operated Vehicle (ROV) Market by Application, 2024-2034 (US$ Mn, AGR (%), CAGR (%))
Table 57 Europe Offshore Remotely Operated Vehicle (ROV) Market by Depth, 2024-2034 (US$ Mn, AGR (%), CAGR (%))
Table 58 Europe Offshore Remotely Operated Vehicle (ROV) Market by Weight, 2024-2034 (US$ Mn, AGR (%), CAGR (%))
Table 59 Europe Offshore Remotely Operated Vehicle (ROV) Market by Weight, 2024-2034 (US$ Mn, AGR (%), CAGR (%))
Table 60 Europe Offshore Remotely Operated Vehicle (ROV) Market by Function, 2024-2034 (US$ Mn, AGR (%), CAGR (%))
Table 61 Germany Offshore Remotely Operated Vehicle (ROV) Market by Value, 2024-2034 (US$ Mn, AGR (%), CAGR (%))
Table 62 UK Offshore Remotely Operated Vehicle (ROV) Market by Value, 2024-2034 (US$ Mn, AGR (%), CAGR (%))
Table 63 France Offshore Remotely Operated Vehicle (ROV) Market by Value, 2024-2034 (US$ Mn, AGR (%), CAGR (%))
Table 64 Italy Offshore Remotely Operated Vehicle (ROV) Market by Value, 2024-2034 (US$ Mn, AGR (%), CAGR (%))
Table 65 Spain Offshore Remotely Operated Vehicle (ROV) Market by Value, 2024-2034 (US$ Mn, AGR (%), CAGR (%))
Table 66 Rest of Europe Offshore Remotely Operated Vehicle (ROV) Market by Value, 2024-2034 (US$ Mn, AGR (%), CAGR (%))
Table 67 Asia-Pacific Offshore Remotely Operated Vehicle (ROV) Market by Value, 2024-2034 (US$ Mn, AGR (%), CAGR (%))
Table 68 Asia-Pacific Offshore Remotely Operated Vehicle (ROV) Market by Country, 2024-2034 (US$ Mn, AGR (%), CAGR (%))
Table 69 Asia-Pacific Offshore Remotely Operated Vehicle (ROV) Market by Type/Class, 2024-2034 (US$ Mn, AGR (%), CAGR (%))
Table 70 Asia-Pacific Offshore Remotely Operated Vehicle (ROV) Market by Industry, 2024-2034 (US$ Mn, AGR (%), CAGR (%))
Table 71 Asia-Pacific Offshore Remotely Operated Vehicle (ROV) Market by Application, 2024-2034 (US$ Mn, AGR (%), CAGR (%))
Table 72 Asia-Pacific Offshore Remotely Operated Vehicle (ROV) Market by Depth, 2024-2034 (US$ Mn, AGR (%), CAGR (%))
Table 73 Asia-Pacific Offshore Remotely Operated Vehicle (ROV) Market by Payload, 2024-2034 (US$ Mn, AGR (%), CAGR (%))
Table 74 Asia-Pacific Offshore Remotely Operated Vehicle (ROV) Market by Weight, 2024-2034 (US$ Mn, AGR (%), CAGR (%))
Table 75 Asia-Pacific Offshore Remotely Operated Vehicle (ROV) Market by Function, 2024-2034 (US$ Mn, AGR (%), CAGR (%))
Table 76 China Offshore Remotely Operated Vehicle (ROV) Market by Value, 2024-2034 (US$ Mn, AGR (%), CAGR (%))
Table 77 India Offshore Remotely Operated Vehicle (ROV) Market by Value, 2024-2034 (US$ Mn, AGR (%), CAGR (%))
Table 78 Japan Offshore Remotely Operated Vehicle (ROV) Market by Value, 2024-2034 (US$ Mn, AGR (%), CAGR (%))
Table 79 South Korea Offshore Remotely Operated Vehicle (ROV) Market by Value, 2024-2034 (US$ Mn, AGR (%), CAGR (%))
Table 80 Australia Offshore Remotely Operated Vehicle (ROV) Market by Value, 2024-2034 (US$ Mn, AGR (%), CAGR (%))
Table 81 Rest of Asia-Pacific Offshore Remotely Operated Vehicle (ROV) Market by Value, 2024-2034 (US$ Mn, AGR (%), CAGR (%))
Table 82 Middle East & Africa Offshore Remotely Operated Vehicle (ROV) Market by Value, 2024-2034 (US$ Mn, AGR (%), CAGR (%))
Table 83 Middle East & Africa Offshore Remotely Operated Vehicle (ROV) Market by Country, 2024-2034 (US$ Mn, AGR (%), CAGR (%))
Table 84 Middle East & Africa Offshore Remotely Operated Vehicle (ROV) Market by Type/Class, 2024-2034 (US$ Mn, AGR (%), CAGR (%))
Table 85 Middle East & Africa Offshore Remotely Operated Vehicle (ROV) Market by Industry, 2024-2034 (US$ Mn, AGR (%), CAGR (%))
Table 86 Middle East & Africa Offshore Remotely Operated Vehicle (ROV) Market by Application, 2024-2034 (US$ Mn, AGR (%), CAGR (%))
Table 87 Middle East & Africa Offshore Remotely Operated Vehicle (ROV) Market by Depth, 2024-2034 (US$ Mn, AGR (%), CAGR (%))
Table 88 Middle East & Africa Offshore Remotely Operated Vehicle (ROV) Market by Payload, 2024-2034 (US$ Mn, AGR (%), CAGR (%))
Table 89 Middle East & Africa Offshore Remotely Operated Vehicle (ROV) Market by Weight, 2024-2034 (US$ Mn, AGR (%), CAGR (%))
Table 90 Middle East & Africa Offshore Remotely Operated Vehicle (ROV) Market by Function, 2024-2034 (US$ Mn, AGR (%), CAGR (%))
Table 91 GCC Offshore Remotely Operated Vehicle (ROV) Market by Value, 2024-2034 (US$ Mn, AGR (%), CAGR (%))
Table 92 South Africa Offshore Remotely Operated Vehicle (ROV) Market by Value, 2024-2034 (US$ Mn, AGR (%), CAGR (%))
Table 93 Rest of Middle East & Africa Offshore Remotely Operated Vehicle (ROV) Market by Value, 2024-2034 (US$ Mn, AGR (%), CAGR (%))
Table 94 Latin America Offshore Remotely Operated Vehicle (ROV) Market by Value, 2024-2034 (US$ Mn, AGR (%), CAGR (%))
Table 95 Latin America Offshore Remotely Operated Vehicle (ROV) Market by Country, 2024-2034 (US$ Mn, AGR (%), CAGR (%))
Table 96 Latin America Offshore Remotely Operated Vehicle (ROV) Market by Type/Class, 2024-2034 (US$ Mn, AGR (%), CAGR (%))
Table 97 Latin America Offshore Remotely Operated Vehicle (ROV) Market by Industry, 2024-2034 (US$ Mn, AGR (%), CAGR (%))
Table 98 Latin America Offshore Remotely Operated Vehicle (ROV) Market by Application, 2024-2034 (US$ Mn, AGR (%), CAGR (%))
Table 99 Latin America Offshore Remotely Operated Vehicle (ROV) Market by Depth, 2024-2034 (US$ Mn, AGR (%), CAGR (%))
Table 100 Latin America Offshore Remotely Operated Vehicle (ROV) Market by Payload, 2024-2034 (US$ Mn, AGR (%), CAGR (%))
Table 101 Latin America Offshore Remotely Operated Vehicle (ROV) Market by Weight, 2024-2034 (US$ Mn, AGR (%), CAGR (%))
Table 102 Latin America Offshore Remotely Operated Vehicle (ROV) Market by Function, 2024-2034 (US$ Mn, AGR (%), CAGR (%))
Table 103 Brazil Offshore Remotely Operated Vehicle (ROV) Market by Value, 2024-2034 (US$ Mn, AGR (%), CAGR (%))
Table 104 Mexico Offshore Remotely Operated Vehicle (ROV) Market by Value, 2024-2034 (US$ Mn, AGR (%), CAGR (%))
Table 105 Rest of Latin America Offshore Remotely Operated Vehicle (ROV) Market by Value, 2024-2034 (US$ Mn, AGR (%), CAGR (%))
Table 106 Strategic Outlook - Contract
Table 107 Oceaneering International, Inc: Key Details, (CEO, HQ, Revenue, Founded, No. of Employees, Company Type, Website, Business Segment)
Table 108 Oceaneering International, Inc: Product Benchmarking
Table 109 Oceaneering International, Inc: Strategic Outlook
Table 110 Subsea 7 S.A: Key Details, (CEO, HQ, Revenue, Founded, No. of Employees, Company Type, Website, Business Segment)
Table 111 Subsea 7 S.A: Product Benchmarking
Table 112 Subsea 7 S.A: Strategic Outlook
Table 113 TechnipFMC plc: Key Details, (CEO, HQ, Revenue, Founded, No. of Employees, Company Type, Website, Business Segment)
Table 114 TechnipFMC plc: Product Benchmarking
Table 115 TechnipFMC plc: Strategic Outlook
Table 116 Saab AB: Key Details, (CEO, HQ, Revenue, Founded, No. of Employees, Company Type, Website, Business Segment)
Table 117 Saab AB: Product Benchmarking
Table 118 Saab AB: Strategic Outlook
Table 119 Deep Ocean: Key Details, (CEO, HQ, Revenue, Founded, No. of Employees, Company Type, Website, Business Segment)
Table 120 Deep Ocean: Product Benchmarking
Table 121 Deep Ocean: Strategic Outlook
Table 122 Video Ray: Key Details, (CEO, HQ, Revenue, Founded, No. of Employees, Company Type, Website, Business Segment)
Table 123 Video Ray: Product Benchmarking
Table 124 Video Ray: Strategic Outlook
Table 125 Blue Robotics: Key Details, (CEO, HQ, Revenue, Founded, No. of Employees, Company Type, Website, Business Segment)
Table 126 Blue Robotics: Product Benchmarking
Table 127 Forum Energy Technologies, Inc. (FET): Key Details, (CEO, HQ, Revenue, Founded, No. of Employees, Company Type, Website, Business Segment)
Table 128 Forum Energy Technologies, Inc. (FET): Product Benchmarking
Table 129 Forum Energy Technologies, Inc. (FET): Strategic Outlook
Table 130 Fugro N.V.: Key Details, (CEO, HQ, Revenue, Founded, No. of Employees, Company Type, Website, Business Segment)
Table 131 Fugro N.V.: Product Benchmarking
Table 132 Fugro N.V.: Strategic Outlook
Table 133 DOF Group ASA: Key Details, (CEO, HQ, Revenue, Founded, No. of Employees, Company Type, Website, Business Segment)
Table 134 DOF Group ASA: Product Benchmarking
Table 135 DOF Group ASA: Strategic Outlook
Table 136 Deep Trekker Inc.: Key Details, (CEO, HQ, Revenue, Founded, No. of Employees, Company Type, Website, Business Segment)
Table 137 Deep Trekker Inc.: Product Benchmarking
Table 138 Deep Trekker Inc.: Strategic Outlook
Table 139 Outland Technologies Inc: Key Details, (CEO, HQ, Revenue, Founded, No. of Employees, Company Type, Website, Business Segment)
Table 140 Outland Technologies Inc: Product Benchmarking
Table 141 Helix Energy Solutions: Key Details, (CEO, HQ, Revenue, Founded, No. of Employees, Company Type, Website, Business Segment)
Table 142 Helix Energy Solutions: Product Benchmarking
List of Figures
Figure 1 Offshore Remotely Operated Vehicle (ROV) Market Segmentation
Figure 2 Offshore Remotely Operated Vehicle (ROV) Market: Market Dynamics
Figure 3 Crude Oil Production
Figure 4 Offshore Remotely Operated Vehicle (ROV) Market: Porter’s Five Forces Analysis
Figure 5 Global Offshore Remotely Operated Vehicle (ROV) Market Share Forecast by COVID, 2024-2034 (%)
Figure 6 Global Offshore Remotely Operated Vehicle (ROV) Market by Region, 2024-2034 (US$ Mn, AGR (%)) (V-Shaped Recovery Scenario)
Figure 7 Global Offshore Remotely Operated Vehicle (ROV) Market by Region, 2024-2034 (US$ Mn, AGR (%)) (U-Shaped Recovery Scenario)
Figure 8 Global Offshore Remotely Operated Vehicle (ROV) Market by Region, 2024-2034 (US$ Mn, AGR (%)) (W-Shaped Recovery Scenario)
Figure 9 Global Offshore Remotely Operated Vehicle (ROV) Market by Region, 2024-2034 (US$ Mn, AGR (%)) (L-Shaped Recovery Scenario)
Figure 10 Offshore Remotely Operated Vehicle (ROV) Market: PEST Analysis
Figure 11 Global Offshore Remotely Operated Vehicle (ROV) Market by Type/Class, 2024-2034 (US$ Mn, AGR (%))
Figure 12 Work-class Market by Region, 2024-2034 (US$ Mn, AGR (%))
Figure 13 Observation-class Market by Region, 2024-2034 (US$ Mn, AGR (%))
Figure 14 Intervention-class Market by Region, 2024-2034 (US$ Mn, AGR (%))
Figure 15 Global Offshore Remotely Operated Vehicle (ROV) Market by Industry, 2024-2034 (US$ Mn, AGR (%))
Figure 16 Oil and Gas Market by Region, 2024-2034 (US$ Mn, AGR (%))
Figure 17 Offshore Wind Market by Region, 2024-2034 (US$ Mn, AGR (%))
Figure 18 Defence Market by Region, 2024-2034 (US$ Mn, AGR (%))
Figure 19 Research and Surveying Market by Region, 2024-2034 (US$ Mn, AGR (%))
Figure 20 Others Market by Region, 2024-2034 (US$ Mn, AGR (%))
Figure 21 Global Offshore Remotely Operated Vehicle (ROV) Market by Application, 2024-2034 (US$ Mn, AGR (%))
Figure 22 Construction Support Market by Region, 2024-2034 (US$ Mn, AGR (%))
Figure 23 Drilling Support Market by Region, 2024-2034 (US$ Mn, AGR (%))
Figure 24 Inspection, Repair, and Maintenance (IRM) Market by Region, 2024-2034 (US$ Mn, AGR (%))
Figure 25 Others Market by Region, 2024-2034 (US$ Mn, AGR (%))
Figure 26 Global Offshore Remotely Operated Vehicle (ROV) Market by Depth, 2024-2034 (US$ Mn, AGR (%))
Figure 27 Less than 5,000 feet Market by Region, 2024-2034 (US$ Mn, AGR (%))
Figure 28 5,000-10,000 feet Market by Region, 2024-2034 (US$ Mn, AGR (%))
Figure 29 Above 10,000 feet Market by Region, 2024-2034 (US$ Mn, AGR (%))
Figure 30 Global Offshore Remotely Operated Vehicle (ROV) Market by Payload, 2024-2034 (US$ Mn, AGR (%))
Figure 31 Less than 200 Kg Market by Region, 2024-2034 (US$ Mn, AGR (%))
Figure 32 201-300kg Market by Region, 2024-2034 (US$ Mn, AGR (%))
Figure 33 Above 300 Kg Market by Region, 2024-2034 (US$ Mn, AGR (%))
Figure 34 Global Offshore Remotely Operated Vehicle (ROV) Market by Weight, 2024-2034 (US$ Mn, AGR (%))
Figure 35 OCROV (up to 91 kg) Market by Region, 2024-2034 (US$ Mn, AGR (%))
Figure 36 MSROV (91 kg to 907 kg) Market by Region, 2024-2034 (US$ Mn, AGR (%))
Figure 37 WCROV (excess 907 kg) Market by Region, 2024-2034 (US$ Mn, AGR (%))
Figure 38 Global Offshore Remotely Operated Vehicle (ROV) Market by Function, 2024-2034 (US$ Mn, AGR (%))
Figure 39 Intervention Market by Region, 2024-2034 (US$ Mn, AGR (%))
Figure 40 Crawler Market by Region, 2024-2034 (US$ Mn, AGR (%))
Figure 41 Pipelay Market by Region, 2024-2034 (US$ Mn, AGR (%))
Figure 42 Trenching Market by Region, 2024-2034 (US$ Mn, AGR (%))
Figure 43 Others Market by Region, 2024-2034 (US$ Mn, AGR (%))
Figure 44 Offshore Remotely Operated Vehicle (ROV) Market Forecast by Region 2024 and 2034 (Revenue, CAGR%)
Figure 45 Global Offshore Remotely Operated Vehicle (ROV) Market by Region, 2024-2034 (US$ Mn, AGR (%))
Figure 46 North America Offshore Remotely Operated Vehicle (ROV) Market by Country, 2024, 2029 & 2034 (US$ Million)
Figure 47 North America Offshore Remotely Operated Vehicle (ROV) Market by Value, 2024-2034 (US$ Mn, AGR (%))
Figure 48 North America Offshore Remotely Operated Vehicle (ROV) Market by Country, 2024-2034 (US$ Mn, AGR (%))
Figure 49 North America Offshore Remotely Operated Vehicle (ROV) Market Share Forecast by Country, 2024 & 2034 (%)
Figure 50 North America Offshore Remotely Operated Vehicle (ROV) Market by Type/Class, 2024-2034 (US$ Mn, AGR (%))
Figure 51 North America Offshore Remotely Operated Vehicle (ROV) Market Share Forecast Type/Class, 2024 & 2034 (%)
Figure 52 North America Offshore Remotely Operated Vehicle (ROV) Market by Industry, 2024-2034 (US$ Mn, AGR (%))
Figure 53 North America Offshore Remotely Operated Vehicle (ROV) Market Share Forecast by Industry, 2024 & 2034 (%)
Figure 54 North America Offshore Remotely Operated Vehicle (ROV) Market by Application, 2024-2034 (US$ Mn, AGR (%))
Figure 55 North America Offshore Remotely Operated Vehicle (ROV) Market Share Forecast by Application, 2024 & 2034 (%)
Figure 56 North America Offshore Remotely Operated Vehicle (ROV) Market by Depth, 2024-2034 (US$ Mn, AGR (%))
Figure 57 North America Offshore Remotely Operated Vehicle (ROV) Market Share Forecast by Depth, 2024 & 2034 (%)
Figure 58 North America Offshore Remotely Operated Vehicle (ROV) Market by Payload, 2024-2034 (US$ Mn, AGR (%))
Figure 59 North America Offshore Remotely Operated Vehicle (ROV) Market Share Forecast by Payload, 2024 & 2034 (%)
Figure 60 North America Offshore Remotely Operated Vehicle (ROV) Market by Weight, 2024-2034 (US$ Mn, AGR (%))
Figure 61 North America Offshore Remotely Operated Vehicle (ROV) Market Share Forecast by Weight, 2024 & 2034 (%)
Figure 62 North America Offshore Remotely Operated Vehicle (ROV) Market by Function, 2024-2034 (US$ Mn, AGR (%))
Figure 63 North America Offshore Remotely Operated Vehicle (ROV) Market Share Forecast by Function, 2024 & 2034 (%)
Figure 64 US Offshore Remotely Operated Vehicle (ROV) Market by Value, 2024-2034 (US$ Mn, AGR (%))
Figure 65 Canada Offshore Remotely Operated Vehicle (ROV) Market by Value, 2024-2034 (US$ Mn, AGR (%))
Figure 66 Europe Offshore Remotely Operated Vehicle (ROV) Market by Region, 2024, 2029 & 2034 (US$ Million)
Figure 67 Europe Offshore Remotely Operated Vehicle (ROV) Market by Value, 2024-2034 (US$ Mn, AGR (%))
Figure 68 Europe Offshore Remotely Operated Vehicle (ROV) Market by Country, 2024-2034 (US$ Mn, AGR (%))
Figure 69 Europe Offshore Remotely Operated Vehicle (ROV) Market Share Forecast by Country, 2024 & 2034 (%)
Figure 70 Europe Offshore Remotely Operated Vehicle (ROV) Market by Type/Class, 2024-2034 (US$ Mn, AGR (%))
Figure 71 Europe Offshore Remotely Operated Vehicle (ROV) Market Share Forecast Type/Class, 2024 & 2034 (%)
Figure 72 Europe Offshore Remotely Operated Vehicle (ROV) Market by Industry, 2024-2034 (US$ Mn, AGR (%))
Figure 73 Europe Offshore Remotely Operated Vehicle (ROV) Market Share Forecast by Industry, 2024 & 2034 (%)
Figure 74 Europe Offshore Remotely Operated Vehicle (ROV) Market by Application, 2024-2034 (US$ Mn, AGR (%))
Figure 75 Europe Offshore Remotely Operated Vehicle (ROV) Market Share Forecast by Application, 2024 & 2034 (%)
Figure 76 Europe Offshore Remotely Operated Vehicle (ROV) Market by Depth, 2024-2034 (US$ Mn, AGR (%))
Figure 77 Europe Offshore Remotely Operated Vehicle (ROV) Market Share Forecast by Depth, 2024 & 2034 (%)
Figure 78 Europe Offshore Remotely Operated Vehicle (ROV) Market by Weight, 2024-2034 (US$ Mn, AGR (%))
Figure 79 Europe Offshore Remotely Operated Vehicle (ROV) Market Share Forecast by Payload, 2024 & 2034 (%)
Figure 80 Europe Offshore Remotely Operated Vehicle (ROV) Market by Weight, 2024-2034 (US$ Mn, AGR (%))
Figure 81 Europe Offshore Remotely Operated Vehicle (ROV) Market Share Forecast by Weight, 2024 & 2034 (%)
Figure 82 Europe Offshore Remotely Operated Vehicle (ROV) Market by Function, 2024-2034 (US$ Mn, AGR (%))
Figure 83 Europe Offshore Remotely Operated Vehicle (ROV) Market Share Forecast by Function, 2024 & 2034 (%)
Figure 84 Germany Offshore Remotely Operated Vehicle (ROV) Market by Value, 2024-2034 (US$ Mn, AGR (%))
Figure 85 UK Offshore Remotely Operated Vehicle (ROV) Market by Value, 2024-2034 (US$ Mn, AGR (%))
Figure 86 France Offshore Remotely Operated Vehicle (ROV) Market by Value, 2024-2034 (US$ Mn, AGR (%))
Figure 87 Italy Offshore Remotely Operated Vehicle (ROV) Market by Value, 2024-2034 (US$ Mn, AGR (%))
Figure 88 Spain Offshore Remotely Operated Vehicle (ROV) Market by Value, 2024-2034 (US$ Mn, AGR (%))
Figure 89 Rest of Europe Offshore Remotely Operated Vehicle (ROV) Market by Value, 2024-2034 (US$ Mn, AGR (%))
Figure 90 Asia-Pacific Offshore Remotely Operated Vehicle (ROV) Market by Country, 2024, 2029 & 2034 (US$ Million)
Figure 91 Asia-Pacific Offshore Remotely Operated Vehicle (ROV) Market by Value, 2024-2034 (US$ Mn, AGR (%))
Figure 92 Asia-Pacific Offshore Remotely Operated Vehicle (ROV) Market by Country, 2024-2034 (US$ Mn, AGR (%))
Figure 93 Asia-Pacific Offshore Remotely Operated Vehicle (ROV) Market Share Forecast by Country, 2024 & 2034 (%)
Figure 94 Asia-Pacific Offshore Remotely Operated Vehicle (ROV) Market by Type/Class, 2024-2034 (US$ Mn, AGR (%))
Figure 95 Asia-Pacific Offshore Remotely Operated Vehicle (ROV) Market Share Forecast Type/Class, 2024 & 2034 (%)
Figure 96 Asia-Pacific Offshore Remotely Operated Vehicle (ROV) Market by Industry, 2024-2034 (US$ Mn, AGR (%))
Figure 97 Asia-Pacific Offshore Remotely Operated Vehicle (ROV) Market Share Forecast by Industry, 2024 & 2034 (%)
Figure 98 Asia-Pacific Offshore Remotely Operated Vehicle (ROV) Market by Application, 2024-2034 (US$ Mn, AGR (%))
Figure 99 Asia-Pacific Offshore Remotely Operated Vehicle (ROV) Market Share Forecast by Application, 2024 & 2034 (%)
Figure 100 Asia-Pacific Offshore Remotely Operated Vehicle (ROV) Market by Depth, 2024-2034 (US$ Mn, AGR (%))
Figure 101 Asia-Pacific Offshore Remotely Operated Vehicle (ROV) Market Share Forecast by Depth, 2024 & 2034 (%)
Figure 102 Asia-Pacific Offshore Remotely Operated Vehicle (ROV) Market by Payload, 2024-2034 (US$ Mn, AGR (%))
Figure 103 Asia-Pacific Offshore Remotely Operated Vehicle (ROV) Market Share Forecast by Payload, 2024 & 2034 (%)
Figure 104 Asia-Pacific Offshore Remotely Operated Vehicle (ROV) Market by Weight, 2024-2034 (US$ Mn, AGR (%))
Figure 105 Asia-Pacific Offshore Remotely Operated Vehicle (ROV) Market Share Forecast by Weight, 2024 & 2034 (%)
Figure 106 Asia-Pacific Offshore Remotely Operated Vehicle (ROV) Market by Function, 2024-2034 (US$ Mn, AGR (%))
Figure 107 Asia-Pacific Offshore Remotely Operated Vehicle (ROV) Market Share Forecast by Function, 2024 & 2034 (%)
Figure 108 China Offshore Remotely Operated Vehicle (ROV) Market by Value, 2024-2034 (US$ Mn, AGR (%))
Figure 109 India Offshore Remotely Operated Vehicle (ROV) Market by Value, 2024-2034 (US$ Mn, AGR (%))
Figure 110 Japan Offshore Remotely Operated Vehicle (ROV) Market by Value, 2024-2034 (US$ Mn, AGR (%))
Figure 111 South Korea Offshore Remotely Operated Vehicle (ROV) Market by Value, 2024-2034 (US$ Mn, AGR (%))
Figure 112 Australia Offshore Remotely Operated Vehicle (ROV) Market by Value, 2024-2034 (US$ Mn, AGR (%))
Figure 113 Rest of Asia-Pacific Offshore Remotely Operated Vehicle (ROV) Market by Value, 2024-2034 (US$ Mn, AGR (%))
Figure 114 Middle East and Africa Offshore Remotely Operated Vehicle (ROV) Market by Region, 2024, 2029 & 2034 (US$ Million)
Figure 115 Middle East & Africa Offshore Remotely Operated Vehicle (ROV) Market by Value, 2024-2034 (US$ Mn, AGR (%))
Figure 116 Middle East & Africa Offshore Remotely Operated Vehicle (ROV) Market by Country, 2024-2034 (US$ Mn, AGR (%))
Figure 117 Middle East and Africa Offshore Remotely Operated Vehicle (ROV) Market Share Forecast by Country, 2024 & 2034 (%)
Figure 118 Middle East & Africa Offshore Remotely Operated Vehicle (ROV) Market by Type/Class, 2024-2034 (US$ Mn, AGR (%))
Figure 119 Middle East and Africa Offshore Remotely Operated Vehicle (ROV) Market Share Forecast Type/Class, 2024 & 2034 (%)
Figure 120 Middle East & Africa Offshore Remotely Operated Vehicle (ROV) Market by Industry, 2024-2034 (US$ Mn, AGR (%))
Figure 121 Middle East and Africa Offshore Remotely Operated Vehicle (ROV) Market Share Forecast by Industry, 2024 & 2034 (%)
Figure 122 Middle East & Africa Offshore Remotely Operated Vehicle (ROV) Market by Application, 2024-2034 (US$ Mn, AGR (%))
Figure 123 Middle East and Africa Offshore Remotely Operated Vehicle (ROV) Market Share Forecast by Application, 2024 & 2034 (%)
Figure 124 Middle East & Africa Offshore Remotely Operated Vehicle (ROV) Market by Depth, 2024-2034 (US$ Mn, AGR (%))
Figure 125 Middle East and Africa Offshore Remotely Operated Vehicle (ROV) Market Share Forecast by Depth, 2024 & 2034 (%)
Figure 126 Middle East & Africa Offshore Remotely Operated Vehicle (ROV) Market by Payload, 2024-2034 (US$ Mn, AGR (%))
Figure 127 Middle East and Africa Offshore Remotely Operated Vehicle (ROV) Market Share Forecast by Payload, 2024 & 2034 (%)
Figure 128 Middle East & Africa Offshore Remotely Operated Vehicle (ROV) Market by Weight, 2024-2034 (US$ Mn, AGR (%))
Figure 129 Middle East and Africa Offshore Remotely Operated Vehicle (ROV) Market Share Forecast by Weight, 2024 & 2034 (%)
Figure 130 Middle East & Africa Offshore Remotely Operated Vehicle (ROV) Market by Function, 2024-2034 (US$ Mn, AGR (%))
Figure 131 Middle East and Africa Offshore Remotely Operated Vehicle (ROV) Market Share Forecast by Function, 2024 & 2034 (%)
Figure 132 GCC Offshore Remotely Operated Vehicle (ROV) Market by Value, 2024-2034 (US$ Mn, AGR (%))
Figure 133 South Africa Offshore Remotely Operated Vehicle (ROV) Market by Value, 2024-2034 (US$ Mn, AGR (%))
Figure 134 Rest of Middle East & Africa Offshore Remotely Operated Vehicle (ROV) Market by Value, 2024-2034 (US$ Mn, AGR (%))
Figure 135 Latin America Offshore Remotely Operated Vehicle (ROV) Market by Region, 2024, 2029 & 2034 (US$ Million)
Figure 136 Latin America Offshore Remotely Operated Vehicle (ROV) Market by Value, 2024-2034 (US$ Mn, AGR (%))
Figure 137 Latin America Offshore Remotely Operated Vehicle (ROV) Market by Country, 2024-2034 (US$ Mn, AGR (%))
Figure 138 Latin America Offshore Remotely Operated Vehicle (ROV) Market Share Forecast by Country, 2024 & 2034 (%)
Figure 139 Latin America Offshore Remotely Operated Vehicle (ROV) Market by Type/Class, 2024-2034 (US$ Mn, AGR (%))
Figure 140 Latin America Offshore Remotely Operated Vehicle (ROV) Market Share Forecast Type/Class, 2024 & 2034 (%)
Figure 141 Latin America Offshore Remotely Operated Vehicle (ROV) Market by Industry, 2024-2034 (US$ Mn, AGR (%))
Figure 142 Latin America Offshore Remotely Operated Vehicle (ROV) Market Share Forecast by Industry, 2024 & 2034 (%)
Figure 143 Latin America Offshore Remotely Operated Vehicle (ROV) Market by Application, 2024-2034 (US$ Mn, AGR (%))
Figure 144 Latin America Offshore Remotely Operated Vehicle (ROV) Market Share Forecast by Application, 2024 & 2034 (%)
Figure 145 Latin America Offshore Remotely Operated Vehicle (ROV) Market by Depth, 2024-2034 (US$ Mn, AGR (%))
Figure 146 Latin America Offshore Remotely Operated Vehicle (ROV) Market Share Forecast by Depth, 2024 & 2034 (%)
Figure 147 Latin America Offshore Remotely Operated Vehicle (ROV) Market by Payload, 2024-2034 (US$ Mn, AGR (%))
Figure 148 Latin America Offshore Remotely Operated Vehicle (ROV) Market Share Forecast by Payload, 2024 & 2034 (%)
Figure 149 Latin America Offshore Remotely Operated Vehicle (ROV) Market by Weight, 2024-2034 (US$ Mn, AGR (%))
Figure 150 Latin America Offshore Remotely Operated Vehicle (ROV) Market Share Forecast by Weight, 2024 & 2034 (%)
Figure 151 Latin America Offshore Remotely Operated Vehicle (ROV) Market by Function, 2024-2034 (US$ Mn, AGR (%))
Figure 152 Latin America Offshore Remotely Operated Vehicle (ROV) Market Share Forecast by Function, 2024 & 2034 (%)
Figure 153 Brazil Offshore Remotely Operated Vehicle (ROV) Market by Value, 2024-2034 (US$ Mn, AGR (%))
Figure 154 Mexico Offshore Remotely Operated Vehicle (ROV) Market by Value, 2024-2034 (US$ Mn, AGR (%))
Figure 155 Rest of Latin America Offshore Remotely Operated Vehicle (ROV) Market by Value, 2024-2034 (US$ Mn, AGR (%))
Figure 156 Offshore Remotely Operated Vehicle (ROV) Market: Company Share, 2022
Figure 157 Oceaneering International, Inc.: Net Revenue, 2018-2022 (US$ Million, AGR%)
Figure 158 Oceaneering International, Inc.: Business Segment Revenue Share, 2022 (%)
Figure 159 Subsea 7 S.A.: Net Revenue, 2018-2022 (US$ Million, AGR%)
Figure 160 Subsea 7 S.A.: R&D, 2018-2022 (US$ Million, AGR%)
Figure 161 TechnipFMC plc.: Net Revenue, 2018-2022 (US$ Million, AGR%)
Figure 162 TechnipFMC plc.: R&D, 2018-2022 (US$ Million, AGR%)
Figure 163 TechnipFMC plc.: Regional Revenue Share, 2022 (%)
Figure 164 TechnipFMC plc.: Business Segment Revenue Share, 2022 (%)
Figure 165 Saab AB.: Net Revenue, 2018-2022 (US$ Million, AGR%)
Figure 166 Saab AB.: R&D, 2018-2022 (US$ Million, AGR%)
Figure 167 Saab AB.: Regional Revenue Share, 2022 (%)
Figure 168 Saab AB.: Business Segment Revenue Share, 2022 (%)
Figure 169 Forum Energy Technologies, Inc. (FET).: Net Revenue, 2018-2022 (US$ Million, AGR%)
Figure 170 Forum Energy Technologies, Inc. (FET).: Business Segment Revenue Share, 2022 (%)
Figure 171 Fugro N.V..: Net Revenue, 2018-2022 (US$ Million, AGR%)
Figure 172 Fugro N.V..: R&D, 2018-2022 (US$ Million, AGR%)
Figure 173 Fugro N.V..: Regional Revenue Share, 2022 (%)
Figure 174 Fugro N.V..: Business Segment Revenue Share, 2022 (%)
Figure 175 DOF Group ASA.: Net Revenue, 2018-2022 (US$ Million, AGR%)
Figure 176 DOF Group ASA.: Business Segment Revenue Share, 2022 (%)
Figure 177 Helix Energy Solutions.: Net Revenue, 2018-2022 (US$ Million, AGR%)
Figure 178 Helix Energy Solutions.: Regional Revenue Share, 2022 (%)
Figure 179 Helix Energy Solutions.: Business Segment Revenue Share, 2022 (%)
ページTOPに戻る
本レポートと同分野(環境・エネルギー)の最新刊レポート
Visiongain社のエネルギーと資源分野での最新刊レポート
本レポートと同じKEY WORD(vehicle)の最新刊レポート
よくあるご質問
Visiongain社はどのような調査会社ですか?
英国の調査会社ヴィジョンゲイン社(Visiongain)は、通信とエネルギーのほか、自動車や化学・医薬品、金属など、広範な市場を対象に調査を行っています。自動車市場については、市場全般に関する調査のほ... もっと見る
調査レポートの納品までの日数はどの程度ですか?
在庫のあるものは速納となりますが、平均的には 3-4日と見て下さい。
但し、一部の調査レポートでは、発注を受けた段階で内容更新をして納品をする場合もあります。
発注をする前のお問合せをお願いします。
注文の手続きはどのようになっていますか?
1)お客様からの御問い合わせをいただきます。
2)見積書やサンプルの提示をいたします。
3)お客様指定、もしくは弊社の発注書をメール添付にて発送してください。
4)データリソース社からレポート発行元の調査会社へ納品手配します。
5) 調査会社からお客様へ納品されます。最近は、pdfにてのメール納品が大半です。
お支払方法の方法はどのようになっていますか?
納品と同時にデータリソース社よりお客様へ請求書(必要に応じて納品書も)を発送いたします。
お客様よりデータリソース社へ(通常は円払い)の御振り込みをお願いします。
請求書は、納品日の日付で発行しますので、翌月最終営業日までの当社指定口座への振込みをお願いします。振込み手数料は御社負担にてお願いします。
お客様の御支払い条件が60日以上の場合は御相談ください。
尚、初めてのお取引先や個人の場合、前払いをお願いすることもあります。ご了承のほど、お願いします。
データリソース社はどのような会社ですか?
当社は、世界各国の主要調査会社・レポート出版社と提携し、世界各国の市場調査レポートや技術動向レポートなどを日本国内の企業・公官庁及び教育研究機関に提供しております。
世界各国の「市場・技術・法規制などの」実情を調査・収集される時には、データリソース社にご相談ください。
お客様の御要望にあったデータや情報を抽出する為のレポート紹介や調査のアドバイスも致します。
|
|

