エネルギーセキュリティ市場レポート:2024-2034
Energy Security Market Report 2024-2034
レポート詳細
エネルギーセキュリティ市場レポート 2024-2034年 :本レポートは、業界とその基礎となるダイナミクスをよりよく理解したいと望むなら、新たな収益ポケットを目指す大手企業にとって貴... もっと見る
※上記価格は部署ライセンス(Departmental licence)価格です。
その他の価格についてはデータリソースまでお問合せください。
日本語のページは自動翻訳を利用し作成しています。
実際のレポートは英文のみでご納品いたします。

|

|
サマリー
レポート詳細
エネルギーセキュリティ市場レポート 2024-2034年:本レポートは、業界とその基礎となるダイナミクスをよりよく理解したいと望むなら、新たな収益ポケットを目指す大手企業にとって貴重なものとなるでしょう。異業種への進出や新地域での既存事業の拡大を目指す企業にも有用です。
世界のエネルギー情勢の複雑化と相まって高まるエネルギー需要
世界のエネルギー安全保障市場は、さまざまな脅威や課題に直面する中で、エネルギー資源の中断のない供給、流通、信頼性を守る上で極めて重要な役割を果たしている。各国が経済発展と持続可能性を目指す中、エネルギーインフラの強靭性を確保することは極めて重要な課題となっている。このエグゼクティブサマリーでは、エネルギーセキュリティ市場を形成する主な推進要因、機会、課題、競争環境について概観する。
エネルギー・セキュリティ市場の主な原動力は、世界的なエネルギー情勢の複雑化に伴うエネルギー需要の増大である。急速な都市化、工業化、人口増加がエネルギー消費の急増に寄与しており、強固なセキュリティ対策が必要とされている。地政学的な不確実性、自然災害、サイバー脅威は、包括的なエネルギー安全保障ソリューションの必要性をさらに際立たせている。さらに、再生可能エネルギーへの移行は新たな力学をもたらし、多様で分散化したエネルギー・サプライ・チェーンを確保するための適応戦略を必要とする。
事業者によるセキュリティ導入への不安の欠如
エネルギーセキュリティ市場の重要な阻害要因の一つは、事業者によるセキュリティ導入に対する不安の欠如である。エネルギー分野におけるサイバー脅威や物理的脆弱性の頻度や高度化が進んでいるにもかかわらず、一部の事業者は強固なセキュリティ対策の重要性を十分に理解していない可能性がある。このような事業者の認識不足や緊急性の欠如は、エネルギー・インフラの全体的なセキュリティ態勢に大きなリスクをもたらす。多くの場合、エネルギー事業者は、操業の中断という点でも、国や地域のエネルギーの安定に対するより広範な影響という点でも、セキュリティ侵害の潜在的影響を過小評価している可能性がある。このような不安の欠如は、自分たちの特定の施設が標的になる可能性は低いという認識や、エネルギー産業が直面するセキュリティ脅威の進化する性質に対する一般的な過小評価に起因している可能性がある。
市場調査レポートを購入する前にすべき質問とは?
-
エネルギーセキュリティ市場はどのように進化しているのか?
-
エネルギーセキュリティ市場の推進要因と阻害要因は何か?
-
エネルギーセキュリティの各サブ市場セグメントは予測期間中にどのように成長し、2034年にはどれくらいの売上を占めるようになるのか?
-
2024年から2034年にかけて、エネルギーセキュリティの各サブマーケットの市場シェアはどのように推移するのか?
-
2024年から2034年にかけて、市場全体を牽引する主な要因は何か?
-
主要なエネルギーセキュリティ市場はマクロ経済の動きに概ね追随するのか、それとも個々の国の市場が他を凌駕するのか?
-
2034年までに各国市場のシェアはどのように変化し、2034年にはどの地域が市場をリードするのか?
-
主要プレーヤーは誰で、予測期間中の見通しは?
-
これらの大手企業のエネルギーセキュリティ・プロジェクトは何か?
-
2024年から2034年の間に、業界はどのように発展していくのか?現在および今後10年間のエネルギーセキュリティプロジェクトにはどのような意味があるのか?
-
エネルギーセキュリティ市場をさらに拡大するために、製品の商業化の必要性は高まっているのか?
-
エネルギーセキュリティ市場はどこへ向かっているのか?
-
新製品や新サービスへの最適な投資方法とは?
-
企業を新たな成長軌道に乗せ、C-suiteに移行させるための重要な展望とは?
このことが、現在、そして今後10年間のエネルギーセキュリティ市場にどのような影響を与えるかを見極める必要がある:
-
358ページにわたるレポートには、112の表と179の図表が掲載されている。
-
このレポートでは、業界の主要な収益分野に焦点を当てているため、今すぐそこにターゲットを絞ることができます。
-
世界、地域、国の売上高と成長に関する詳細な分析が含まれている。
-
競合他社が成功した主なトレンド、変化、収益予測をハイライトします。
本レポートは、エネルギーセキュリティ市場が今後10年間にどのように発展していくのか、またCOVID-19の景気後退と好転の変動に合わせてどのように発展していくのかをTODAYでお伝えするものである。この市場は、過去10年間のどの時点よりも今が重要である。
2034年までの予測やその他の分析から、商業的な展望が明らかになる
-
2034年までの収益予測に加え、最近の実績、成長率、市場シェアも提供している。
-
ビジネスの展望や展開など、独自の分析が掲載されている。
-
定性的分析(市場力学、促進要因、機会、阻害要因、課題を含む)、コスト構造、エネルギーセキュリティ価格上昇の影響、最近の動向をご覧ください。
本レポートには、COVID-19が業界と貴社にどのような影響を与えるかについてのデータ分析と貴重な洞察が含まれている。本レポートでは、COVID-19の4つの回収パターンとその影響、すなわち「V」、「L」、「W」、「U」について論じている。
レポート対象セグメント
コンポーネント別市場セグメント
-
監視制御およびデータ収集システム (SCADA)
-
物理的セキュリティ機器
-
サイバーセキュリティ・ハードウェア
インフラタイプ別市場セグメント
-
発電所のセキュリティ
-
トランスミッション・セキュリティー
-
流通ネットワークのセキュリティ
-
石油・ガス・インフラのセキュリティ
ソリューション別市場セグメント
-
物理的セキュリティ・ソリューション
-
サイバーセキュリティ・ソリューション
-
監視システム
-
監視システム
-
その他のソリューション
世界市場全体とセグメント別の収益予測に加え、4つの地域と20の主要国市場の収益予測も掲載しています:
北米
ヨーロッパ
-
ドイツ
-
スペイン
-
イギリス
-
フランス
-
イタリア
-
その他の欧州
アジア太平洋
-
中国
-
日本
-
インド
-
オーストラリア
-
韓国
-
その他のアジア太平洋
ラテンアメリカ
中東・アフリカ
このレポートには、2024年から2034年のエネルギーセキュリティ市場におけるいくつかの主要企業のプロフィールも含まれており、これらの企業の事業のこのセグメントに焦点を当てています。
報告書に掲載されている主要企業
-
ABB Ltd.
-
BAE Systems plc
-
Cisco Systems, Inc.
-
General Electric Company
-
Honeywell International Inc.
-
Huawei Technologies Co., Ltd.
-
International Business Machines Corporation
-
Leidos Holdings, Inc.
-
Lockheed Martin Corporation
-
Northrop Grumman Corporation
-
Raytheon Technologies Corporation
-
Schneider Electric SE
-
Siemens AG
-
Teledyne FLIR LLC
-
Thales Group
エネルギーセキュリティ市場の2024年から2034年までの世界全体の売上高は、金額ベースでは2024年に175億米ドルを突破する。2034年まで収益が大きく伸びると予測。当調査では、最も大きな可能性を秘めた企業を特定しています。彼らの能力、進歩、商業的展望を発見し、あなたが一歩先を行くのを支援します。
エネルギーセキュリティ市場、2024-2034年レポートはどのようにお役に立つでしょうか?
要約すると、350ページを超えるこのレポートは、以下の知識を提供する:
-
エネルギーセキュリティ市場の2024年から2034年までの収益予測 コンポーネント、インフラタイプ、ソリューションの各予測を世界レベルと地域レベルで掲載 - 業界の将来性を発見し、投資と収益に最も有利な場所を見つけます。
-
4つの地域と20の主要国市場の2034年までの収益予測 - 北米、ヨーロッパ、アジア太平洋、ラテンアメリカ、中東・アフリカのエネルギーセキュリティ市場の2024年から2034年までの市場予測をご覧ください。また、米国、カナダ、ブラジル、ドイツ、フランス、英国、イタリア、中国、インド、日本、オーストラリアなど著名な経済圏の市場も予測しています。
-
2024年から2034年までのエネルギーセキュリティ市場に関わる主要企業15社の企業プロファイルを含む。
独自の予測による定量的・定性的分析をご覧ください。私たちのレポートだけに含まれる情報を入手し、貴重なビジネスインテリジェンスで情報を得ることができます。
他にはない情報
私たちの新しいレポートがあれば、知識に遅れをとったり、チャンスを逃したりする可能性が低くなります。私たちのレポートが貴社の調査、分析、意思決定にどのように役立つかをご覧ください。Visiongainの調査は、エネルギーセキュリティ市場、2024年から2034年、市場をリードする企業の商業分析を必要とするすべての人のためのものです。データ、トレンド、予測をご覧いただけます。
ページTOPに戻る
目次
目次
1 レポート概要
1.1 研究の目的
1.2 エネルギーセキュリティ市場の紹介
1.3 本レポートの内容
1.4 本レポートを読むべき理由
1.5 本分析レポートが回答する主な質問
1.6 本レポートの対象者
1.7 方法論
1.7.1 市場の定義
1.7.2 市場評価・予測手法
1.7.3 データの検証
1.7.3.1 一次調査
1.7.3.2 セカンダリーリサーチ
1.8 よくある質問(FAQ)
1.9 Visiongainの関連レポート
1.10 Visiongainについて
2 エグゼクティブ・サマリー
3 市場概要
3.1 主要な調査結果
3.2 市場ダイナミクス
3.2.1 市場牽引要因
3.2.1.1 政府からの圧力とセキュリティコンプライアンスの高まりが市場成長を促進
3.2.1.2 テロやサイバー攻撃による脅威の増加
3.2.1.3 エネルギー分野への投資の増加が市場成長を促進
3.2.2 市場抑制要因
3.2.2.1 事業者のセキュリティ実装に対する不安の欠如
3.2.2.2 国際投資誘致の失敗が市場成長を妨げる
3.2.2.3 在来型・非在来型エネルギー開発のための熟練した人材の不足とインフラの未整備
3.2.3 市場機会
3.2.3.1 市場プレーヤー間のパートナーシップと協力が市場にとっての機会
3.2.3.2 パイプラインインフラの増加 市場にとっての機会
3.2.3.3 エネルギー安全保障の現状と新技術
3.3 ポーターのファイブフォース分析
3.3.1 サプライヤーの交渉力(低~中)
3.3.2 買い手の交渉力(高)
3.3.3 競争力(中~高)
3.3.4 代替品による脅威(低)
3.3.5 新規参入の脅威(低)
3.4 COVID-19の影響分析
3.4.1 "V字型回復"
3.4.2 "U字型回復"
3.4.3 "W字型回復"
3.4.4 "L字型回復"
3.5 PEST分析
4 エネルギーセキュリティ市場分析:コンポーネント別
4.1 主要な調査結果
4.2 コンポーネント・セグメント 市場魅力度指数
4.3 コンポーネント別エネルギーセキュリティ市場規模の推定と予測
4.4 監視制御・データ収集システム(SCADA)
4.4.1 2024〜2034年の地域別市場規模(US$ Billion)
4.4.2 地域別市場シェア、2024年・2034年(%)
4.5 物理的セキュリティ機器
4.5.1 2024〜2034年の地域別市場規模(US$ Billion)
4.5.2 地域別市場シェア、2024年・2034年(%)
4.6 サイバーセキュリティハードウェア
4.6.1 2024〜2034年の地域別市場規模(US$ Billion)
4.6.2 地域別市場シェア、2024年・2034年(%)
5 エネルギーセキュリティ市場のインフラタイプ別分析
5.1 主要調査結果
5.2 インフラタイプ別セグメント 市場魅力度指数
5.3 インフラタイプ別エネルギーセキュリティ市場規模の推定と予測
5.4 発電所のセキュリティ
5.4.1 2024〜2034年の地域別市場規模(US$ Billion)
5.4.2 地域別市場シェア、2024年・2034年(%)
5.5 送電セキュリティ
5.5.1 2024~2034年の地域別市場規模(US$ Billion)
5.5.2 地域別市場シェア、2024年・2034年(%)
5.6 配電網セキュリティ
5.6.1 2024〜2034年の地域別市場規模(US$ Billion)
5.6.2 地域別市場シェア、2024年・2034年(%)
5.7 石油・ガスインフラセキュリティ
5.7.1 2024~2034年の地域別市場規模(US$ Billion)
5.7.2 地域別市場シェア、2024年・2034年(%)
6 エネルギーセキュリティ市場分析:ソリューション別
6.1 主要な調査結果
6.2 ソリューションセグメント 市場魅力度指数
6.3 ソリューション別エネルギーセキュリティ市場規模の推定と予測
6.4 物理セキュリティソリューション
6.4.1 2024〜2034年の地域別市場規模(US$ Billion)
6.4.2 地域別市場シェア、2024年・2034年(%)
6.5 サイバーセキュリティソリューション
6.5.1 2024〜2034年の地域別市場規模(US$ Billion)
6.5.2 地域別市場シェア、2024年・2034年(%)
6.6 監視システム
6.6.1 2024〜2034年の地域別市場規模(US$ Billion)
6.6.2 地域別市場シェア、2024年・2034年(%)
6.7 監視システム
6.7.1 2024〜2034年の地域別市場規模(US$ Billion)
6.7.2 地域別市場シェア、2024年・2034年(%)
6.8 その他のインフラ保護
6.8.1 2024〜2034年の地域別市場規模(US$ Billion)
6.8.2 地域別市場シェア、2024年・2034年(%)
7 エネルギーセキュリティ市場分析:地域別
7.1 主要な調査結果
8 北米のエネルギーセキュリティ市場分析
8.1 主要な調査結果
8.2 北米のエネルギーセキュリティ市場魅力度指数
8.3 北米のエネルギーセキュリティ国別市場、2024年、2029年、2034年(US$ Billion)
8.4 北米のエネルギーセキュリティ市場規模推定と予測
8.5 北米のエネルギーセキュリティ市場規模推定と予測:国別
8.6 北米のエネルギーセキュリティ市場規模推定と予測:コンポーネント別
8.7 北米のエネルギーセキュリティ市場規模推定と予測:インフラタイプ別
8.8 北米のエネルギーセキュリティ市場規模推定と予測:ソリューション別
8.9 アメリカのエネルギーセキュリティ市場分析
8.10 カナダのエネルギーセキュリティ市場分析
9 欧州のエネルギーセキュリティ市場分析
9.1 主要な調査結果
9.2 欧州のエネルギーセキュリティ市場魅力度指数
9.3 欧州のエネルギーセキュリティ国別市場、2024年、2029年、2034年(US$ Billion)
9.4 欧州のエネルギーセキュリティ市場規模推定と予測
9.5 欧州のエネルギーセキュリティ市場規模推定と予測:国別
9.6 欧州のエネルギーセキュリティ市場規模推定と予測:コンポーネント別
9.7 欧州のエネルギーセキュリティ市場規模推定と予測:インフラタイプ別
9.8 欧州のエネルギーセキュリティ市場規模推定と予測:ソリューション別
9.9 ドイツのエネルギーセキュリティ市場分析
9.10 イギリスのエネルギーセキュリティ市場分析
9.11 フランスのエネルギーセキュリティ市場分析
9.12 イタリアのエネルギーセキュリティ市場分析
9.13 スペインのエネルギーセキュリティ市場分析
9.14 その他の欧州のエネルギーセキュリティ市場分析
10 アジア太平洋地域のエネルギー安全保障市場分析
10.1 主要な調査結果
10.2 アジア太平洋地域のエネルギーセキュリティ市場魅力度指数
10.3 アジア太平洋地域のエネルギーセキュリティ市場国別市場規模、2024年、2029年、2034年(US$ Billion)
10.4 アジア太平洋地域のエネルギーセキュリティ市場規模推定と予測
10.5 アジア太平洋地域のエネルギーセキュリティ市場規模推定と予測:国別
10.6 アジア太平洋地域のエネルギーセキュリティ市場規模推定と予測:コンポーネント別
10.7 アジア太平洋地域のエネルギーセキュリティ市場規模推定と予測:インフラタイプ別
10.8 アジア太平洋地域のエネルギーセキュリティ市場規模推定と予測:ソリューション別
10.9 中国のエネルギーセキュリティ市場分析
10.10 インドのエネルギーセキュリティ市場分析
10.11 日本のエネルギーセキュリティ市場分析
10.12 韓国のエネルギーセキュリティ市場分析
10.13 オーストラリアのエネルギーセキュリティ市場分析
10.14 その他のアジア太平洋地域のエネルギーセキュリティ市場分析
11 中東・アフリカのエネルギー安全保障市場分析
11.1 主要な調査結果
11.2 中東・アフリカのエネルギーセキュリティ市場魅力度指数
11.3 中東・アフリカのエネルギーセキュリティ国別市場、2024年、2029年、2034年(US$ Billion)
11.4 中東・アフリカのエネルギーセキュリティ市場規模推定と予測
11.5 中東・アフリカのエネルギーセキュリティ市場規模推定と予測:国別
11.6 中東・アフリカのエネルギーセキュリティ市場規模推定と予測:コンポーネント別
11.7 中東・アフリカのエネルギーセキュリティ市場規模推定と予測:インフラタイプ別
11.8 中東・アフリカのエネルギーセキュリティ市場規模推定と予測:ソリューション別
11.9 GCCのエネルギーセキュリティ市場分析
11.10 南アフリカのエネルギーセキュリティ市場分析
11.11 その他の中東・アフリカ地域のエネルギーセキュリティ市場分析
12 ラテンアメリカのエネルギー安全保障市場分析
12.1 主要な調査結果
12.2 ラテンアメリカのエネルギーセキュリティ市場魅力度指数
12.3 ラテンアメリカのエネルギーセキュリティ国別市場、2024年、2029年、2034年(US$ Billion)
12.4 ラテンアメリカのエネルギーセキュリティ市場規模推定と予測
12.5 ラテンアメリカのエネルギーセキュリティ市場規模推定と予測:国別
12.6 ラテンアメリカのエネルギーセキュリティ市場規模推定と予測:コンポーネント別
12.7 ラテンアメリカのエネルギーセキュリティ市場規模推定と予測:インフラタイプ別
12.8 ラテンアメリカのエネルギーセキュリティ市場規模推定と予測:ソリューション別
12.9 ブラジルのエネルギーセキュリティ市場分析
12.10 メキシコのエネルギーセキュリティ市場分析
12.11 その他のラテンアメリカのエネルギーセキュリティ市場分析
13 企業のプロフィール
13.1 競争環境、2022年
13.2 戦略的展望
13.3 Honeywell International Inc
13.3.1 会社概要
13.3.2 会社概要
13.3.3 財務分析
13.3.3.1 純収入、2019-2023年
13.3.3.2 R&D、2019-2023年
13.3.3.3 地域別収益シェア、2023年(%)
13.3.3.4 事業セグメント収益シェア、2023年(%)
13.3.4 製品ベンチマーク
13.3.5 戦略的展望
13.4 BAE Systems plc
13.4.1 会社概要
13.4.2 会社概要
13.4.3 財務分析
13.4.3.1 純収入、2018-2022年
13.4.3.2 R&D、2018年~2022年
13.4.3.3 地域別収益シェア、2022年(%)
13.4.3.4 事業セグメント収益シェア、2022年(%)
13.4.4 製品ベンチマーク
13.4.5 戦略的展望
13.5 Siemens AG
13.5.1 会社概要
13.5.2 会社概要
13.5.3 財務分析
13.5.3.1 純収入、2019-2023年
13.5.3.2 R&D、2019-2023年
13.5.3.3 地域別収益シェア、2023年(%)
13.5.3.4 事業セグメント収益シェア、2023年(%)
13.5.4 製品ベンチマーク
13.5.5 戦略的展望
13.6 Lockheed Martin Corporation
13.6.1 会社概要
13.6.2 会社概要
13.6.3 財務分析
13.6.3.1 純収入、2018-2022年
13.6.3.2 R&D、2018年〜2022年
13.6.3.3 地域別収益シェア、2022年(%)
13.6.3.4 事業セグメント収益シェア、2022年(%)
13.6.4 製品ベンチマーク
13.6.5 戦略的展望
13.7 ABB Ltd.
13.7.1 会社概要
13.7.2 会社概要
13.7.3 財務分析
13.7.3.1 純収入、2018-2022年
13.7.3.2 R&D、2018年~2022年
13.7.3.3 事業セグメント収益シェア、2022年(%)
13.7.4 製品ベンチマーク
13.7.5 戦略的展望
13.8 Raytheon Technologies Corporation
13.8.1 会社概要
13.8.2 会社概要
13.8.3 財務分析
13.8.3.1 純収入、2018-2022年
13.8.3.2 R&D、2018年~2022年
13.8.3.3 地域別収益シェア、2022年(%)
13.8.3.4 事業セグメント収益シェア、2022年(%)
13.8.4 製品ベンチマーク
13.8.5 戦略的展望
13.9 Schneider Electric SE
13.9.1 会社概要
13.9.2 会社概要
13.9.3 財務分析
13.9.3.1 純収入、2018-2022年
13.9.3.2 R&D、2018年~2022年
13.9.3.3 地域別収益シェア、2022年(%)
13.9.3.4 事業セグメント収益シェア、2022年(%)
13.9.4 製品ベンチマーク
13.9.5 戦略的展望
13.10 Northrop Grumman Corporation
13.10.1 会社概要
13.10.2 会社概要
13.10.3 財務分析
13.10.3.1 純収入、2018年~2022年
13.10.3.2 R&D、2018年〜2022年
13.10.3.3 地域別収益シェア、2022年(%)
13.10.3.4 事業セグメント収益シェア、2022年(%)
13.10.4 製品ベンチマーク
13.10.5 戦略的展望
13.11 Thales Group
13.11.1 会社概要
13.11.2 会社概要
13.11.3 財務分析
13.11.3.1 純収入、2018-2022年
13.11.4 製品ベンチマーク
13.11.5 戦略的展望
13.12 Leidos Holdings, Inc.
13.12.1 会社概要
13.12.2 会社概要
13.12.3 財務分析
13.12.3.1 純収入、2018-2022年
13.12.3.2 R&D、2018年-2022年
13.12.3.3 地域別収入シェア、2022年(%)
13.12.3.4 事業セグメント収益シェア、2022年(%)
13.12.4 製品ベンチマーク
13.12.5 戦略的展望
13.13 Huawei Technologies Co., Ltd.
13.13.1 会社概要
13.13.2 会社概要
13.13.3 財務分析
13.13.3.1 純収入、2018-2022年
13.13.3.2 R&D、2018年~2022年
13.13.3.3 地域別収益シェア、2022年(%)
13.13.3.4 事業セグメント収益シェア、2022年(%)
13.13.4 製品ベンチマーク
13.13.5 戦略的展望
13.14 General Electric Company
13.14.1 会社概要
13.14.2 会社概要
13.14.3 財務分析
13.14.3.1 純収入、2018-2022年
13.14.3.2 R&D、2018年~2022年
13.14.3.3 事業セグメント収益シェア、2022年(%)
13.14.4 製品ベンチマーク
13.14.5 戦略的展望
13.15 Cisco Systems, Inc
13.15.1 会社概要
13.15.2 会社概要
13.15.3 財務分析
13.15.3.1 純収入、2019-2023年
13.15.3.2 R&D、2019-2023年
13.15.3.3 地域別収益シェア、2023年(%)
13.15.3.4 事業セグメント収益シェア、2023年(%)
13.15.4 製品ベンチマーク
13.15.5 戦略的展望
13.16 International Business Machines Corporation
13.16.1 会社概要
13.16.2 会社概要
13.16.3 財務分析
13.16.3.1 純収入、2018-2022年
13.16.3.2 R&D、2018年〜2022年
13.16.3.3 地域別収入シェア、2022年(%)
13.16.3.4 事業セグメント収益シェア、2022年(%)
13.16.4 製品ベンチマーク
13.16.5 戦略的展望
13.17 Teledyne FLIR LLC
13.17.1 会社概要
13.17.2 会社概要
13.17.3 財務分析
13.17.3.1 純売上高、2018-2022年
13.17.3.2 R&D、2018年〜2022年
13.17.3.3 地域別売上シェア、2022年(%)
13.17.3.4 事業セグメント収益シェア、2022年(%)
13.17.4 製品ベンチマーク
13.17.5 戦略的展望
14 結論と提言
14.1 Visiongainからの結びの言葉
14.2 市場プレイヤーへの提言
ページTOPに戻る
図表リスト
表の一覧
Table 1 Energy Security Market Snapshot, 2024 & 2034 (US$ Billion, CAGR %)
Table 2 Global Energy Security Market by Region, 2024-2034 (US$ Bn, AGR (%), CAGR (%)) (V-Shaped Recovery Scenario)
Table 3 Global Energy Security Market by Region, 2024-2034 (US$ Bn, AGR (%), CAGR (%)) (U-Shaped Recovery Scenario)
Table 4 Global Energy Security Market by Region, 2024-2034 (US$ Bn, AGR (%), CAGR (%)) (W-Shaped Recovery Scenario)
Table 5 Global Energy Security Market by Region, 2024-2034 (US$ Bn, AGR (%), CAGR (%)) (L-Shaped Recovery Scenario)
Table 6 Global Energy Security Market by Components, 2024-2034 (US$ Bn, AGR (%), CAGR (%))
Table 7 Supervisory Control and Data Acquisition Systems (SCADA) Market by Region, 2024-2034 (US$ Bn, AGR (%), CAGR (%))
Table 8 Physical Security Devices Market by Region, 2024-2034 (US$ Bn, AGR (%), CAGR (%))
Table 9 Cybersecurity Hardware Market by Region, 2024-2034 (US$ Bn, AGR (%), CAGR (%))
Table 10 Global Energy Security Market by Infrastructure Type, 2024-2034 (US$ Bn, AGR (%), CAGR (%))
Table 11 Power Plants Security Market by Region, 2024-2034 (US$ Bn, AGR (%), CAGR (%))
Table 12 Transmission Security Market by Region, 2024-2034 (US$ Bn, AGR (%), CAGR (%))
Table 13 Distribution Network Security Market by Region, 2024-2034 (US$ Bn, AGR (%), CAGR (%))
Table 14 Cyberattacks on oil and gas infrastructure
Table 15 Oil and Gas Infrastructure Security Market by Region, 2024-2034 (US$ Bn, AGR (%), CAGR (%))
Table 16 Global Energy Security Market by Solutions, 2024-2034 (US$ Bn, AGR (%), CAGR (%))
Table 17 Physical Security Solutions Market by Region, 2024-2034 (US$ Bn, AGR (%), CAGR (%))
Table 18 Cybersecurity Solutions Market by Region, 2024-2034 (US$ Bn, AGR (%), CAGR (%))
Table 19 Surveillance Systems Market by Region, 2024-2034 (US$ Bn, AGR (%), CAGR (%))
Table 20 Monitoring Systems Market by Region, 2024-2034 (US$ Bn, AGR (%), CAGR (%))
Table 21 Other Solutions Market by Region, 2024-2034 (US$ Bn, AGR (%), CAGR (%))
Table 22 North America Energy Security Market by Value, 2024-2034 (US$ Bn, AGR (%), CAGR (%))
Table 23 North America Energy Security Market by Country, 2024-2034 (US$ Bn, AGR (%), CAGR (%))
Table 24 North America Energy Security Market by Components, 2024-2034 (US$ Bn, AGR (%), CAGR (%))
Table 25 North America Energy Security Market by Infrastructure Type, 2024-2034 (US$ Bn, AGR (%), CAGR (%))
Table 26 North America Energy Security Market by Solutions, 2024-2034 (US$ Bn, AGR (%), CAGR (%))
Table 27 US Energy Security Market by Value, 2024-2034 (US$ Bn, AGR (%), CAGR (%))
Table 28 Canada Energy Security Market by Value, 2024-2034 (US$ Bn, AGR (%), CAGR (%))
Table 29 Europe Energy Security Market by Value, 2024-2034 (US$ Bn, AGR (%), CAGR (%))
Table 30 Europe Energy Security Market by Country, 2024-2034 (US$ Bn, AGR (%), CAGR (%))
Table 31 Europe Energy Security Market by Components, 2024-2034 (US$ Bn, AGR (%), CAGR (%))
Table 32 Europe Energy Security Market by Infrastructure Type, 2024-2034 (US$ Bn, AGR (%), CAGR (%))
Table 33 Europe Energy Security Market by Solutions, 2024-2034 (US$ Bn, AGR (%), CAGR (%))
Table 34 Germany Energy Security Market by Value, 2024-2034 (US$ Bn, AGR (%), CAGR (%))
Table 35 UK Energy Security Market by Value, 2024-2034 (US$ Bn, AGR (%), CAGR (%))
Table 36 France Energy Security Market by Value, 2024-2034 (US$ Bn, AGR (%), CAGR (%))
Table 37 Italy Energy Security Market by Value, 2024-2034 (US$ Bn, AGR (%), CAGR (%))
Table 38 Spain Energy Security Market by Value, 2024-2034 (US$ Bn, AGR (%), CAGR (%))
Table 39 Rest of Europe Energy Security Market by Value, 2024-2034 (US$ Bn, AGR (%), CAGR (%))
Table 40 Asia-Pacific Energy Security Market by Value, 2024-2034 (US$ Bn, AGR (%), CAGR (%))
Table 41 Asia-Pacific Energy Security Market by Country, 2024-2034 (US$ Bn, AGR (%), CAGR (%))
Table 42 Asia-Pacific Energy Security Market by Components, 2024-2034 (US$ Bn, AGR (%), CAGR (%))
Table 43 Asia-Pacific Energy Security Market by Infrastructure Type, 2024-2034 (US$ Bn, AGR (%), CAGR (%))
Table 44 Asia-Pacific Energy Security Market by Solutions, 2024-2034 (US$ Bn, AGR (%), CAGR (%))
Table 45 China Energy Security Market by Value, 2024-2034 (US$ Bn, AGR (%), CAGR (%))
Table 46 India Energy Security Market by Value, 2024-2034 (US$ Bn, AGR (%), CAGR (%))
Table 47 Japan Energy Security Market by Value, 2024-2034 (US$ Bn, AGR (%), CAGR (%))
Table 48 South Korea Energy Security Market by Value, 2024-2034 (US$ Bn, AGR (%), CAGR (%))
Table 49 Australia Energy Security Market by Value, 2024-2034 (US$ Bn, AGR (%), CAGR (%))
Table 50 Rest of Asia-Pacific Energy Security Market by Value, 2024-2034 (US$ Bn, AGR (%), CAGR (%))
Table 51 Middle East & Africa Energy Security Market by Value, 2024-2034 (US$ Bn, AGR (%), CAGR (%))
Table 52 Middle East & Africa Energy Security Market by Country, 2024-2034 (US$ Bn, AGR (%), CAGR (%))
Table 53 Middle East & Africa Energy Security Market by Components, 2024-2034 (US$ Bn, AGR (%), CAGR (%))
Table 54 Middle East & Africa Energy Security Market by Infrastructure Type, 2024-2034 (US$ Bn, AGR (%), CAGR (%))
Table 55 Middle East & Africa Energy Security Market by Solutions, 2024-2034 (US$ Bn, AGR (%), CAGR (%))
Table 56 GCC Energy Security Market by Value, 2024-2034 (US$ Bn, AGR (%), CAGR (%))
Table 57 South Africa Energy Security Market by Value, 2024-2034 (US$ Bn, AGR (%), CAGR (%))
Table 58 Rest of Middle East & Africa Energy Security Market by Value, 2024-2034 (US$ Bn, AGR (%), CAGR (%))
Table 59 Latin America Energy Security Market by Value, 2024-2034 (US$ Bn, AGR (%), CAGR (%))
Table 60 Latin America Energy Security Market by Country, 2024-2034 (US$ Bn, AGR (%), CAGR (%))
Table 61 Latin America Energy Security Market by Components, 2024-2034 (US$ Bn, AGR (%), CAGR (%))
Table 62 Latin America Energy Security Market by Infrastructure Type, 2024-2034 (US$ Bn, AGR (%), CAGR (%))
Table 63 Latin America Energy Security Market by Solutions, 2024-2034 (US$ Bn, AGR (%), CAGR (%))
Table 64 Brazil Energy Security Market by Value, 2024-2034 (US$ Bn, AGR (%), CAGR (%))
Table 65 Mexico Energy Security Market by Value, 2024-2034 (US$ Bn, AGR (%), CAGR (%))
Table 66 Rest of Latin America Energy Security Market by Value, 2024-2034 (US$ Bn, AGR (%), CAGR (%))
Table 67 Strategic Outlook - Contract
Table 68 Honeywell International Inc: Key Details, (CEO, HQ, Revenue, Founded, No. of Employees, Company Type, Website, Business Segment)
Table 69 Honeywell International Inc: Product Benchmarking
Table 70 Honeywell International Inc: Strategic Outlook
Table 71 BAE Systems plc: Key Details, (CEO, HQ, Revenue, Founded, No. of Employees, Company Type, Website, Business Segment)
Table 72 BAE Systems plc: Product Benchmarking
Table 73 BAE Systems plc: Strategic Outlook
Table 74 Siemens AG: Key Details, (CEO, HQ, Revenue, Founded, No. of Employees, Company Type, Website, Business Segment)
Table 75 Siemens AG: Product Benchmarking
Table 76 Siemens AG: Strategic Outlook
Table 77 Lockheed Martin Corporation: Key Details, (CEO, HQ, Revenue, Founded, No. of Employees, Company Type, Website, Business Segment)
Table 78 Lockheed Martin Corporation: Product Benchmarking
Table 79 Lockheed Martin Corporation: Strategic Outlook
Table 80 ABB Ltd.: Key Details, (CEO, HQ, Revenue, Founded, No. of Employees, Company Type, Website, Business Segment)
Table 81 ABB Ltd.: Product Benchmarking
Table 82 ABB Ltd.: Strategic Outlook
Table 83 Raytheon Technologies Corporation: Key Details, (CEO, HQ, Revenue, Founded, No. of Employees, Company Type, Website, Business Segment)
Table 84 Raytheon Technologies Corporation: Product Benchmarking
Table 85 Raytheon Technologies Corporation: Strategic Outlook
Table 86 Schneider Electric SE: Key Details, (CEO, HQ, Revenue, Founded, No. of Employees, Company Type, Website, Business Segment)
Table 87 Schneider Electric SE: Product Benchmarking
Table 88 Schneider Electric SE: Strategic Outlook
Table 89 Northrop Grumman Corporation: Key Details, (CEO, HQ, Revenue, Founded, No. of Employees, Company Type, Website, Business Segment)
Table 90 Northrop Grumman Corporation: Product Benchmarking
Table 91 Northrop Grumman Corporation: Strategic Outlook
Table 92 Thales Group: Key Details, (CEO, HQ, Revenue, Founded, No. of Employees, Company Type, Website, Business Segment)
Table 93 Thales Group: Product Benchmarking
Table 94 Thales Group: Strategic Outlook
Table 95 Leidos Holdings, Inc.: Key Details, (CEO, HQ, Revenue, Founded, No. of Employees, Company Type, Website, Business Segment)
Table 96 Leidos Holdings, Inc.: Product Benchmarking
Table 97 Leidos Holdings, Inc.: Strategic Outlook
Table 98 Huawei Technologies Co., Ltd.: Key Details, (CEO, HQ, Revenue, Founded, No. of Employees, Company Type, Website, Business Segment)
Table 99 Huawei Technologies Co., Ltd.: Product Benchmarking
Table 100 Huawei Technologies Co., Ltd.: Strategic Outlook
Table 101 General Electric Company: Key Details, (CEO, HQ, Revenue, Founded, No. of Employees, Company Type, Website, Business Segment)
Table 102 General Electric Company: Product Benchmarking
Table 103 General Electric Company: Strategic Outlook
Table 104 Cisco Systems, Inc: Key Details, (CEO, HQ, Revenue, Founded, No. of Employees, Company Type, Website, Business Segment)
Table 105 Cisco Systems, Inc: Product Benchmarking
Table 106 Cisco Systems, Inc: Strategic Outlook
Table 107 International Business Machines Corporation: Key Details, (CEO, HQ, Revenue, Founded, No. of Employees, Company Type, Website, Business Segment)
Table 108 International Business Machines Corporation: Product Benchmarking
Table 109 International Business Machines Corporation: Strategic Outlook
Table 110 Teledyne FLIR LLC: Key Details, (CEO, HQ, Revenue, Founded, No. of Employees, Company Type, Website, Business Segment)
Table 111 Teledyne FLIR LLC: Product Benchmarking
Table 112 Teledyne FLIR LLC: Strategic Outlook
図の一覧
Figure 1 Energy Security Market Segmentation
Figure 2 Energy Security Market by Component: Market Attractiveness Index
Figure 3 Energy Security Market by Infrastructure Type: Market Attractiveness Index
Figure 4 Energy Security Market by Solutions: Market Attractiveness Index
Figure 5 Energy Security Market Attractiveness Index by Region
Figure 6 Energy Security Market: Market Dynamics
Figure 7 Energy Security Market: Porter’s Five Forces Analysis
Figure 8 Global Energy Security Market Share Forecast by COVID, 2024-2034 (%)
Figure 9 Global Energy Security Market by Region, 2024-2034 (US$ Bn, AGR (%)) (V-Shaped Recovery Scenario)
Figure 10 Global Energy Security Market by Region, 2024-2034 (US$ Bn, AGR (%)) (U-Shaped Recovery Scenario)
Figure 11 Global Energy Security Market by Region, 2024-2034 (US$ Bn, AGR (%)) (W-Shaped Recovery Scenario)
Figure 12 Global Energy Security Market by Region, 2024-2034 (US$ Bn, AGR (%)) (L-Shaped Recovery Scenario)
Figure 13 Energy Security Market: PEST Analysis
Figure 14 Energy Security Market by Component: Market Attractiveness Index
Figure 15 Global Energy Security Market by Components, 2024-2034 (US$ Bn, AGR (%))
Figure 16 Energy Security Market Share Forecast by Component, 2024, 2029, 2034 (%)
Figure 17 Supervisory Control and Data Acquisition Systems (SCADA) Market by Region, 2024-2034 (US$ Bn, AGR (%))
Figure 18 Supervisory Control and Data Acquisition Systems (SCADA) Market Share Forecast by Region, 2024 & 2034 (%)
Figure 19 Physical Security Devices Market by Region, 2024-2034 (US$ Bn, AGR (%))
Figure 20 Physical Security Devices Market Share Forecast by Region, 2024 & 2034 (%)
Figure 21 Cybersecurity Hardware Market by Region, 2024-2034 (US$ Bn, AGR (%))
Figure 22 Cybersecurity Hardware Market Share Forecast by Region, 2024 & 2034 (%)
Figure 23 Energy Security Market by Infrastructure Type: Market Attractiveness Index
Figure 24 Global Energy Security Market by Infrastructure Type, 2024-2034 (US$ Bn, AGR (%))
Figure 25 Energy Security Market Share Forecast by Infrastructure Type, 2024, 2029, 2034 (%)
Figure 26 Power Plants Security Market by Region, 2024-2034 (US$ Bn, AGR (%))
Figure 27 Power Plants Security Market Share Forecast by Region, 2024 & 2034 (%)
Figure 28 Transmission Security Market by Region, 2024-2034 (US$ Bn, AGR (%))
Figure 29 Transmission Security Market Share Forecast by Region, 2024 & 2034 (%)
Figure 30 Distribution Network Security Market by Region, 2024-2034 (US$ Bn, AGR (%))
Figure 31 Distribution Network Security Market Share Forecast by Region, 2024 & 2034 (%)
Figure 32 Oil and Gas Infrastructure Security Market by Region, 2024-2034 (US$ Bn, AGR (%))
Figure 33 Oil and Gas Infrastructure Security Market Share Forecast by Region, 2024 & 2034 (%)
Figure 34 Energy Security Market by Solutions: Market Attractiveness Index
Figure 35 Global Energy Security Market by Solutions, 2024-2034 (US$ Bn, AGR (%))
Figure 36 Energy Security Market Share Forecast by Solutions, 2024, 2029, 2034 (%)
Figure 37 Physical Security Solutions Market by Region, 2024-2034 (US$ Bn, AGR (%))
Figure 38 Physical Security Solutions Market Share Forecast by Region, 2024 & 2034 (%)
Figure 39 Cybersecurity Solutions Market by Region, 2024-2034 (US$ Bn, AGR (%))
Figure 40 CyberSecurity Solutions Market Share Forecast by Region, 2024 & 2034 (%)
Figure 41 Surveillance Systems Market by Region, 2024-2034 (US$ Bn, AGR (%))
Figure 42 Surveillance Systems Market Share Forecast by Region, 2024 & 2034 (%)
Figure 43 Monitoring Systems Market by Region, 2024-2034 (US$ Bn, AGR (%))
Figure 44 Monitoring Systems Market Share Forecast by Region, 2024 & 2034 (%)
Figure 45 Other Solutions Market by Region, 2024-2034 (US$ Bn, AGR (%))
Figure 46 Other Infrastructure Protection Market Share Forecast by Region, 2024 & 2034 (%)
Figure 47 Energy Security Market Forecast by Region 2024 and 2034 (Revenue, CAGR%)
Figure 48 Energy Security Market Share Forecast by Region 2024, 2029, 2034 (%)
Figure 49 North America Energy Security Market Attractiveness Index
Figure 50 North America Energy Security Market by Region, 2024, 2029 & 2034 (US$ Billion)
Figure 51 North America Energy Security Market by Value, 2024-2034 (US$ Bn, AGR (%))
Figure 52 North America Energy Security Market by Country, 2024-2034 (US$ Bn, AGR (%))
Figure 53 North America Energy Security Market Share Forecast by Country, 2024 & 2034 (%)
Figure 54 North America Energy Security Market by Components, 2024-2034 (US$ Bn, AGR (%))
Figure 55 North America Energy Security Market Share Forecast Component, 2024 & 2034 (%)
Figure 56 North America Energy Security Market by Infrastructure Type, 2024-2034 (US$ Bn, AGR (%))
Figure 57 North America Energy Security Market Share Forecast by Infrastructure Type, 2024 & 2034 (%)
Figure 58 North America Energy Security Market by Solutions, 2024-2034 (US$ Bn, AGR (%))
Figure 59 North America Energy Security Market Share Forecast by Solutions, 2024 & 2034 (%)
Figure 60 US Energy Security Market by Value, 2024-2034 (US$ Bn, AGR (%))
Figure 61 Canada Energy Security Market by Value, 2024-2034 (US$ Bn, AGR (%))
Figure 62 Europe Energy Security Market Attractiveness Index
Figure 63 Europe Energy Security Market by Region, 2024, 2029 & 2034 (US$ Billion)
Figure 64 Europe Energy Security Market by Value, 2024-2034 (US$ Bn, AGR (%))
Figure 65 Europe Energy Security Market by Country, 2024-2034 (US$ Bn, AGR (%))
Figure 66 Europe Energy Security Market Share Forecast by Country, 2024 & 2034 (%)
Figure 67 Europe Energy Security Market by Components, 2024-2034 (US$ Bn, AGR (%))
Figure 68 Europe Energy Security Market Share Forecast Component, 2024 & 2034 (%)
Figure 69 Europe Energy Security Market by Infrastructure Type, 2024-2034 (US$ Bn, AGR (%))
Figure 70 Europe Energy Security Market Share Forecast by Infrastructure Type, 2024 & 2034 (%)
Figure 71 Europe Energy Security Market by Solutions, 2024-2034 (US$ Bn, AGR (%))
Figure 72 Europe Energy Security Market Share Forecast by Solutions, 2024 & 2034 (%)
Figure 73 Germany Energy Security Market by Value, 2024-2034 (US$ Bn, AGR (%))
Figure 74 UK Energy Security Market by Value, 2024-2034 (US$ Bn, AGR (%))
Figure 75 France Energy Security Market by Value, 2024-2034 (US$ Bn, AGR (%))
Figure 76 Italy Energy Security Market by Value, 2024-2034 (US$ Bn, AGR (%))
Figure 77 Spain Energy Security Market by Value, 2024-2034 (US$ Bn, AGR (%))
Figure 78 Rest of Europe Energy Security Market by Value, 2024-2034 (US$ Bn, AGR (%))
Figure 79 Asia-Pacific Energy Security Market Attractiveness Index
Figure 80 Asia-Pacific Energy Security Market by Region, 2024, 2029 & 2034 (US$ Billion)
Figure 81 Asia-Pacific Energy Security Market by Value, 2024-2034 (US$ Bn, AGR (%))
Figure 82 Asia-Pacific Energy Security Market by Country, 2024-2034 (US$ Bn, AGR (%))
Figure 83 Asia-Pacific Energy Security Market Share Forecast by Country, 2024 & 2034 (%)
Figure 84 Asia-Pacific Energy Security Market by Components, 2024-2034 (US$ Bn, AGR (%))
Figure 85 Asia-Pacific Energy Security Market Share Forecast Component, 2024 & 2034 (%)
Figure 86 Asia-Pacific Energy Security Market by Infrastructure Type, 2024-2034 (US$ Bn, AGR (%))
Figure 87 Asia-Pacific Energy Security Market Share Forecast by Infrastructure Type, 2024 & 2034 (%)
Figure 88 Asia-Pacific Energy Security Market by Solutions, 2024-2034 (US$ Bn, AGR (%))
Figure 89 Asia-Pacific Energy Security Market Share Forecast by Solutions, 2024 & 2034 (%)
Figure 90 China Energy Security Market by Value, 2024-2034 (US$ Bn, AGR (%))
Figure 91 India Energy Security Market by Value, 2024-2034 (US$ Bn, AGR (%))
Figure 92 Japan Energy Security Market by Value, 2024-2034 (US$ Bn, AGR (%),)
Figure 93 South Korea Energy Security Market by Value, 2024-2034 (US$ Bn, AGR (%))
Figure 94 Australia Energy Security Market by Value, 2024-2034 (US$ Bn, AGR (%))
Figure 95 Rest of Asia-Pacific Energy Security Market by Value, 2024-2034 (US$ Bn, AGR (%))
Figure 96 Middle East and Africa Energy Security Market Attractiveness Index
Figure 97 Middle East and Africa Energy Security Market by Region, 2024, 2029 & 2034 (US$ Billion)
Figure 98 Middle East & Africa Energy Security Market by Value, 2024-2034 (US$ Bn, AGR (%))
Figure 99 Middle East & Africa Energy Security Market by Country, 2024-2034 (US$ Bn, AGR (%))
Figure 100 Middle East and Africa Energy Security Market Share Forecast by Country, 2024 & 2034 (%)
Figure 101 Middle East & Africa Energy Security Market by Components, 2024-2034 (US$ Bn, AGR (%))
Figure 102 Middle East and Africa Energy Security Market Share Forecast Component, 2024 & 2034 (%)
Figure 103 Middle East & Africa Energy Security Market by Infrastructure Type, 2024-2034 (US$ Bn, AGR (%))
Figure 104 Middle East and Africa Energy Security Market Share Forecast by Infrastructure Type, 2024 & 2034 (%)
Figure 105 Middle East & Africa Energy Security Market by Solutions, 2024-2034 (US$ Bn, AGR (%))
Figure 106 Middle East and Africa Energy Security Market Share Forecast by Solutions, 2024 & 2034 (%)
Figure 107 GCC Energy Security Market by Value, 2024-2034 (US$ Bn, AGR (%))
Figure 108 South Africa Energy Security Market by Value, 2024-2034 (US$ Bn, AGR (%))
Figure 109 Rest of Middle East & Africa Energy Security Market by Value, 2024-2034 (US$ Bn, AGR (%))
Figure 110 Latin America Energy Security Market Attractiveness Index
Figure 111 Latin America Energy Security Market by Region, 2024, 2029 & 2034 (US$ Billion)
Figure 112 Latin America Energy Security Market by Value, 2024-2034 (US$ Bn, AGR (%))
Figure 113 Latin America Energy Security Market by Country, 2024-2034 (US$ Bn, AGR (%))
Figure 114 Latin America Energy Security Market Share Forecast by Country, 2024 & 2034 (%)
Figure 115 Latin America Energy Security Market by Components, 2024-2034 (US$ Bn, AGR (%))
Figure 116 Latin America Energy Security Market Share Forecast Component, 2024 & 2034 (%)
Figure 117 Latin America Energy Security Market by Infrastructure Type, 2024-2034 (US$ Bn, AGR (%))
Figure 118 Latin America Energy Security Market Share Forecast by Infrastructure Type, 2024 & 2034 (%)
Figure 119 Latin America Energy Security Market by Solutions, 2024-2034 (US$ Bn, AGR (%))
Figure 120 Latin America Energy Security Market Share Forecast by Solutions, 2024 & 2034 (%)
Figure 121 Brazil Energy Security Market by Value, 2024-2034 (US$ Bn, AGR (%))
Figure 122 Mexico Energy Security Market by Value, 2024-2034 (US$ Bn, AGR (%))
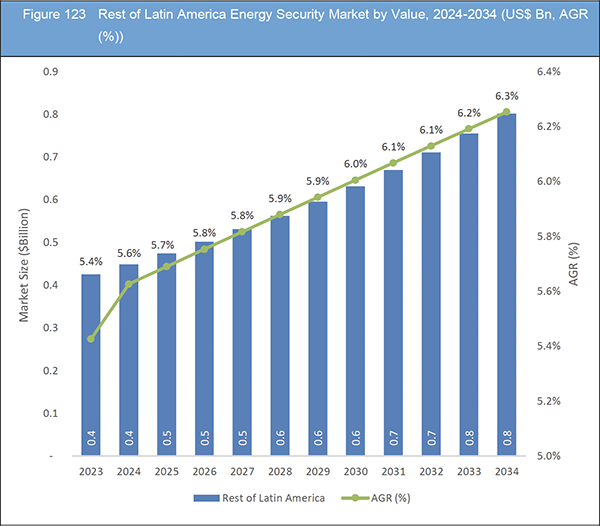
Figure 123 Rest of Latin America Energy Security Market by Value, 2024-2034 (US$ Bn, AGR (%))
Figure 124 Energy Security Market: Company Share, 2022
Figure 125 Honeywell International Inc.: Net Revenue, 2018-2022 (US$ Million, AGR%)
Figure 126 Honeywell International Inc.: R&D, 2019-2023 (US$ Million, AGR%)
Figure 127 Honeywell International Inc.: Regional Revenue Share, 2023 (%)
Figure 128 Honeywell International Inc.: Business Segment Revenue Share, 2023 (%)
Figure 129 BAE Systems plc.: Net Revenue, 2018-2022 (US$ Million, AGR%)
Figure 130 BAE Systems plc.: R&D, 2018-2022 (US$ Million, AGR%)
Figure 131 BAE Systems plc.: Regional Revenue Share, 2022 (%)
Figure 132 BAE Systems plc.: Business Segment Revenue Share, 2022 (%)
Figure 133 Siemens AG.: Net Revenue, 2019-2023 (US$ Million, AGR%)
Figure 134 Siemens AG.: R&D, 2019-2023 (US$ Million, AGR%)
Figure 135 Siemens AG.: Regional Revenue Share, 2023 (%)
Figure 136 Siemens AG.: Business Segment Revenue Share, 2023 (%)
Figure 137 Lockheed Martin Corporation.: Net Revenue, 2018-2022 (US$ Million, AGR%)
Figure 138 Lockheed Martin Corporation.: R&D, 2018-2022 (US$ Million, AGR%)
Figure 139 Lockheed Martin Corporation.: Regional Revenue Share, 2022 (%)
Figure 140 Lockheed Martin Corporation.: Business Segment Revenue Share, 2022 (%)
Figure 141 ABB Ltd..: Net Revenue, 2018-2022 (US$ Million, AGR%)
Figure 142 ABB Ltd..: R&D, 2018-2022 (US$ Million, AGR%)
Figure 143 ABB Ltd..: Business Segment Revenue Share, 2022 (%)
Figure 144 Raytheon Technologies Corporation.: Net Revenue, 2018-2022 (US$ Million, AGR%)
Figure 145 Raytheon Technologies Corporation.: R&D, 2018-2022 (US$ Million, AGR%)
Figure 146 Raytheon Technologies Corporation.: Regional Revenue Share, 2022 (%)
Figure 147 Raytheon Technologies Corporation.: Business Segment Revenue Share, 2022 (%)
Figure 148 Schneider Electric SE.: Net Revenue, 2018-2022 (US$ Million, AGR%)
Figure 149 Schneider Electric SE.: R&D, 2018-2022 (US$ Million, AGR%)
Figure 150 Schneider Electric SE.: Regional Revenue Share, 2022 (%)
Figure 151 Schneider Electric SE.: Business Segment Revenue Share, 2022 (%)
Figure 152 Northrop Grumman Corporation.: Net Revenue, 2018-2022 (US$ Million, AGR%)
Figure 153 Northrop Grumman Corporation.: R&D, 2018-2022 (US$ Million, AGR%)
Figure 154 Northrop Grumman Corporation.: Regional Revenue Share, 2022 (%)
Figure 155 Northrop Grumman Corporation.: Business Segment Revenue Share, 2022 (%)
Figure 156 Thales Group.: Net Revenue, 2018-2022 (US$ Million, AGR%)
Figure 157 Leidos Holdings, Inc..: Net Revenue, 2018-2022 (US$ Million, AGR%)
Figure 158 Leidos Holdings, Inc..: R&D, 2018-2022 (US$ Million, AGR%)
Figure 159 Leidos Holdings, Inc..: Regional Revenue Share, 2022 (%)
Figure 160 Leidos Holdings, Inc..: Business Segment Revenue Share, 2022 (%)
Figure 161 Huawei Technologies Co., Ltd..: Net Revenue, 2018-2022 (US$ Million, AGR%)
Figure 162 Huawei Technologies Co., Ltd..: R&D, 2018-2022 (US$ Million, AGR%)
Figure 163 Huawei Technologies Co., Ltd..: Regional Revenue Share, 2022 (%)
Figure 164 Huawei Technologies Co., Ltd..: Business Segment Revenue Share, 2022 (%)
Figure 165 General Electric Company.: Net Revenue, 2018-2022 (US$ Million, AGR%)
Figure 166 General Electric Company.: R&D, 2018-2022 (US$ Million, AGR%)
Figure 167 General Electric Company.: Business Segment Revenue Share, 2022 (%)
Figure 168 Cisco Systems, Inc.: Net Revenue, 2019-2023 (US$ Million, AGR%)
Figure 169 Cisco Systems, Inc.: R&D, 2019-2023 (US$ Million, AGR%)
Figure 170 Cisco Systems, Inc.: Regional Revenue Share, 2023 (%)
Figure 171 Cisco Systems, Inc.: Business Segment Revenue Share, 2023 (%)
Figure 172 International Business Machines Corporation.: Net Revenue, 2018-2022 (US$ Million, AGR%)
Figure 173 International Business Machines Corporation.: R&D, 2018-2022 (US$ Million, AGR%)
Figure 174 International Business Machines Corporation.: Regional Revenue Share, 2022 (%)
Figure 175 International Business Machines Corporation.: Business Segment Revenue Share, 2022 (%)
Figure 176 Teledyne FLIR LLC.: Net Revenue, 2018-2022 (US$ Million, AGR%)
Figure 177 Teledyne FLIR LLC.: R&D, 2018-2022 (US$ Million, AGR%)
Figure 178 Teledyne FLIR LLC.: Regional Revenue Share, 2022 (%)
Figure 179 Teledyne FLIR LLC.: Business Segment Revenue Share, 2022 (%)
ページTOPに戻る
Summary
Report Details
The Energy Security Market Report 2024-2034: This report will prove invaluable to leading firms striving for new revenue pockets if they wish to better understand the industry and its underlying dynamics. It will be useful for companies that would like to expand into different industries or to expand their existing operations in a new region.
Escalating Demand for Energy Coupled with the Increasing Complexity of the Global Energy Landscape
The global energy security market plays a pivotal role in safeguarding the uninterrupted supply, distribution, and reliability of energy resources in the face of various threats and challenges. As nations strive for economic development and sustainability, ensuring the resilience of energy infrastructure has become a critical imperative. This executive summary provides an overview of the key drivers, opportunities, challenges, and competitive landscape shaping the energy security market.
The energy security market is primarily driven by the escalating demand for energy, coupled with the increasing complexity of the global energy landscape. Rapid urbanization, industrialization, and population growth contribute to the surge in energy consumption, necessitating robust security measures. Geopolitical uncertainties, natural disasters, and cyber threats further underscore the need for comprehensive energy security solutions. Additionally, the transition to renewable energy sources introduces new dynamics, requiring adaptive strategies to secure diverse and decentralized energy supply chains.
Lack of Apprehension about Security Implementation by Operators
One significant restraining factor in the energy security market is the lack of apprehension about security implementation by operators. Despite the increasing frequency and sophistication of cyber threats and physical vulnerabilities in the energy sector, some operators may not fully grasp the importance of robust security measures. This lack of awareness or urgency among operators poses a considerable risk to the overall security posture of energy infrastructure. In many cases, energy operators may underestimate the potential impact of security breaches, both in terms of operational disruptions and the broader consequences for national or regional energy stability. This lack of apprehension could result from a perception that their specific facilities are not likely targets or a general underestimation of the evolving nature of security threats facing the energy industry.
What Questions Should You Ask before Buying a Market Research Report?
-
How is the energy security market evolving?
-
What is driving and restraining the energy security market?
-
How will each energy security submarket segment grow over the forecast period and how much revenue will these submarkets account for in 2034?
-
How will the market shares for each energy security submarket develop from 2024 to 2034?
-
What will be the main driver for the overall market from 2024 to 2034?
-
Will leading energy security markets broadly follow the macroeconomic dynamics, or will individual national markets outperform others?
-
How will the market shares of the national markets change by 2034 and which geographical region will lead the market in 2034?
-
Who are the leading players and what are their prospects over the forecast period?
-
What are the energy security projects for these leading companies?
-
How will the industry evolve during the period between 2024 and 2034? What are the implications of energy security projects taking place now and over the next 10 years?
-
Is there a greater need for product commercialisation to further scale the energy security market?
-
Where is the energy security market heading and how can you ensure you are at the forefront of the market?
-
What are the best investment options for new product and service lines?
-
What are the key prospects for moving companies into a new growth path and C-suite?
You need to discover how this will impact the energy security market today, and over the next 10 years:
-
Our 358-page report provides 112 tables and 179 charts/graphs exclusively to you.
-
The report highlights key lucrative areas in the industry so you can target them – NOW.
-
It contains in-depth analysis of global, regional and national sales and growth.
-
It highlights for you the key successful trends, changes and revenue projections made by your competitors.
This report tells you TODAY how the energy security market will develop in the next 10 years, and in line with the variations in COVID-19 economic recession and bounce. This market is more critical now than at any point over the last 10 years.
Forecasts to 2034 and other analyses reveal commercial prospects
-
In addition to revenue forecasting to 2034, our new study provides you with recent results, growth rates, and market shares.
-
You will find original analyses, with business outlooks and developments.
-
Discover qualitative analyses (including market dynamics, drivers, opportunities, restraints and challenges), cost structure, impact of rising energy security prices and recent developments.
This report includes data analysis and invaluable insight into how COVID-19 will affect the industry and your company. Four COVID-19 recovery patterns and their impact, namely, “V”, “L”, “W” and “U” are discussed in this report.
Segments Covered in the Report
Market Segment by Components
-
Supervisory Control and Data Acquisition Systems (SCADA)
-
Physical Security Devices
-
Cybersecurity Hardware
Market Segment by Infrastructure Type
-
Power Plants Security
-
Transmission Security
-
Distribution Network Security
-
Oil and Gas Infrastructure Security
Market Segment by Solutions
-
Physical Security Solutions
-
Cybersecurity Solutions
-
Surveillance Systems
-
Monitoring Systems
-
Other Solutions
In addition to the revenue predictions for the overall world market and segments, you will also find revenue forecasts for four regional and 20 leading national markets:
North America
Europe
-
Germany
-
Spain
-
United Kingdom
-
France
-
Italy
-
Rest of Europe
Asia Pacific
-
China
-
Japan
-
India
-
Australia
-
South Korea
-
Rest of Asia Pacific
Latin America
-
Brazil
-
Mexico
-
Rest of Latin America
Middle East & Africa
-
GCC
-
South Africa
-
Rest of Middle East & Africa
The report also includes profiles and for some of the leading companies in the Energy Security Market, 2024 to 2034, with a focus on this segment of these companies’ operations.
Leading companies profiled in the report
-
ABB Ltd.
-
BAE Systems plc
-
Cisco Systems, Inc.
-
General Electric Company
-
Honeywell International Inc.
-
Huawei Technologies Co., Ltd.
-
International Business Machines Corporation
-
Leidos Holdings, Inc.
-
Lockheed Martin Corporation
-
Northrop Grumman Corporation
-
Raytheon Technologies Corporation
-
Schneider Electric SE
-
Siemens AG
-
Teledyne FLIR LLC
-
Thales Group
Overall world revenue for Energy Security Market, 2024 to 2034 in terms of value the market will surpass US$17.5 billion in 2024, our work calculates. We predict strong revenue growth through to 2034. Our work identifies which organizations hold the greatest potential. Discover their capabilities, progress, and commercial prospects, helping you stay ahead.
How will the Energy Security Market, 2024 to 2034 report help you?
In summary, our 350+ page report provides you with the following knowledge:
-
Revenue forecasts to 2034 for Energy Security Market, 2024 to 2034 Market, with forecasts for components, infrastructure type, and solutions, each forecast at a global and regional level – discover the industry’s prospects, finding the most lucrative places for investments and revenues.
-
Revenue forecasts to 2034 for four regional and 20 key national markets – See forecasts for the Energy Security Market, 2024 to 2034 market in North America, Europe, Asia-Pacific, Latin America and Middle East & Africa. Also forecasted is the market in the US, Canada, Brazil, Germany, France, UK, Italy, China, India, Japan, and Australia among other prominent economies.
-
Prospects for established firms and those seeking to enter the market – including company profiles for 15 of the major companies involved in the Energy Security Market, 2024 to 2034.
Find quantitative and qualitative analyses with independent predictions. Receive information that only our report contains, staying informed with invaluable business intelligence.
Information found nowhere else
With our new report, you are less likely to fall behind in knowledge or miss out on opportunities. See how our work could benefit your research, analyses, and decisions. Visiongain’s study is for everybody needing commercial analyses for the Energy Security Market, 2024 to 2034, market-leading companies. You will find data, trends and predictions.
ページTOPに戻る
Table of Contents
Table of Contents
1 Report Overview
1.1 Objectives of the Study
1.2 Introduction to Energy Security Market
1.3 What This Report Delivers
1.4 Why You Should Read This Report
1.5 Key Questions Answered by This Analytical Report
1.6 Who Is This Report for?
1.7 Methodology
1.7.1 Market Definitions
1.7.2 Market Evaluation & Forecasting Methodology
1.7.3 Data Validation
1.7.3.1 Primary Research
1.7.3.2 Secondary Research
1.8 Frequently Asked Questions (FAQs)
1.9 Associated Visiongain Reports
1.10 About Visiongain
2 Executive Summary
3 Market Overview
3.1 Key Findings
3.2 Market Dynamics
3.2.1 Market Driving Factors
3.2.1.1 Increased Government Pressure and Security Compliance Driving the Market Growth
3.2.1.2 Increase in Threats from Terrorist and Cyber Attacks
3.2.1.3 Increasing Investment in Energy Sector driving the Market Growth
3.2.2 Market Restraining Factors
3.2.2.1 Lack of Apprehension about Security Implementation by Operators
3.2.2.2 Failure to Attract International Investment Hinder the Market Growth
3.2.2.3 Lack of Skilled Manpower and Poorly Developed Infrastructure for Developing Conventional and Unconventional Energy
3.2.3 Market Opportunities
3.2.3.1 Partnership and Collaboration between Market Players Opportunity for the Market
3.2.3.2 Increasing Pipeline infrastructure Opportunities for the Market
3.2.3.3 The Current and Emerging Technologies in Energy Security
3.3 Porter’s Five Forces Analysis
3.3.1 Bargaining Power of Suppliers (Low to Medium)
3.3.2 Bargaining Power of Buyers (High)
3.3.3 Competitive Rivalry (Medium to High)
3.3.4 Threat from Substitutes (Low)
3.3.5 Threat of New Entrants (Low)
3.4 COVID-19 Impact Analysis
3.4.1 “V-Shaped Recovery”
3.4.2 “U-Shaped Recovery”
3.4.3 “W-Shaped Recovery”
3.4.4 “L-Shaped Recovery”
3.5 PEST Analysis
4 Energy Security Market Analysis by Component
4.1 Key Findings
4.2 Component Segment: Market Attractiveness Index
4.3 Energy Security Market Size Estimation and Forecast by Component
4.4 Supervisory Control and Data Acquisition Systems (SCADA)
4.4.1 Market Size by Region, 2024-2034 (US$ Billion)
4.4.2 Market Share by Region, 2024 & 2034 (%)
4.5 Physical Security Devices
4.5.1 Market Size by Region, 2024-2034 (US$ Billion)
4.5.2 Market Share by Region, 2024 & 2034 (%)
4.6 Cybersecurity Hardware
4.6.1 Market Size by Region, 2024-2034 (US$ Billion)
4.6.2 Market Share by Region, 2024 & 2034 (%)
5 Energy Security Market Analysis by Infrastructure Type
5.1 Key Findings
5.2 Infrastructure Type Segment: Market Attractiveness Index
5.3 Energy Security Market Size Estimation and Forecast by Infrastructure Type
5.4 Power Plants Security
5.4.1 Market Size by Region, 2024-2034 (US$ Billion)
5.4.2 Market Share by Region, 2024 & 2034 (%)
5.5 Transmission Security
5.5.1 Market Size by Region, 2024-2034 (US$ Billion)
5.5.2 Market Share by Region, 2024 & 2034 (%)
5.6 Distribution Network Security
5.6.1 Market Size by Region, 2024-2034 (US$ Billion)
5.6.2 Market Share by Region, 2024 & 2034 (%)
5.7 Oil and Gas Infrastructure Security
5.7.1 Market Size by Region, 2024-2034 (US$ Billion)
5.7.2 Market Share by Region, 2024 & 2034 (%)
6 Energy Security Market Analysis by Solutions
6.1 Key Findings
6.2 Solutions Segment: Market Attractiveness Index
6.3 Energy Security Market Size Estimation and Forecast by Solutions
6.4 Physical Security Solutions
6.4.1 Market Size by Region, 2024-2034 (US$ Billion)
6.4.2 Market Share by Region, 2024 & 2034 (%)
6.5 Cyber Security Solutions
6.5.1 Market Size by Region, 2024-2034 (US$ Billion)
6.5.2 Market Share by Region, 2024 & 2034 (%)
6.6 Surveillance Systems
6.6.1 Market Size by Region, 2024-2034 (US$ Billion)
6.6.2 Market Share by Region, 2024 & 2034 (%)
6.7 Monitoring Systems
6.7.1 Market Size by Region, 2024-2034 (US$ Billion)
6.7.2 Market Share by Region, 2024 & 2034 (%)
6.8 Other Infrastructure Protection
6.8.1 Market Size by Region, 2024-2034 (US$ Billion)
6.8.2 Market Share by Region, 2024 & 2034 (%)
7 Energy Security Market Analysis by Region
7.1 Key Findings
8 North America Energy Security Market Analysis
8.1 Key Findings
8.2 North America Energy Security Market Attractiveness Index
8.3 North America Energy Security Market by Country, 2024, 2029 & 2034 (US$ Billion)
8.4 North America Energy Security Market Size Estimation and Forecast
8.5 North America Energy Security Market Size Estimation and Forecast by Country
8.6 North America Energy Security Market Size Estimation and Forecast by Component
8.7 North America Energy Security Market Size Estimation and Forecast by Infrastructure Type
8.8 North America Energy Security Market Size Estimation and Forecast by Solutions
8.9 U.S. Energy Security Market Analysis
8.10 Canada Energy Security Market Analysis
9 Europe Energy Security Market Analysis
9.1 Key Findings
9.2 Europe Energy Security Market Attractiveness Index
9.3 Europe Energy Security Market by Country, 2024, 2029 & 2034 (US$ Billion)
9.4 Europe Energy Security Market Size Estimation and Forecast
9.5 Europe Energy Security Market Size Estimation and Forecast by Country
9.6 Europe Energy Security Market Size Estimation and Forecast by Component
9.7 Europe Energy Security Market Size Estimation and Forecast by Infrastructure Type
9.8 Europe Energy Security Market Size Estimation and Forecast by Solutions
9.9 Germany Energy Security Market Analysis
9.10 UK Energy Security Market Analysis
9.11 France Energy Security Market Analysis
9.12 Italy Energy Security Market Analysis
9.13 Spain Energy Security Market Analysis
9.14 Rest of Europe Energy Security Market Analysis
10 Asia-Pacific Energy Security Market Analysis
10.1 Key Findings
10.2 Asia-Pacific Energy Security Market Attractiveness Index
10.3 Asia-Pacific Energy Security Market by Country, 2024, 2029 & 2034 (US$ Billion)
10.4 Asia-Pacific Energy Security Market Size Estimation and Forecast
10.5 Asia-Pacific Energy Security Market Size Estimation and Forecast by Country
10.6 Asia-Pacific Energy Security Market Size Estimation and Forecast by Component
10.7 Asia-Pacific Energy Security Market Size Estimation and Forecast by Infrastructure Type
10.8 Asia-Pacific Energy Security Market Size Estimation and Forecast by Solutions
10.9 China Energy Security Market Analysis
10.10 India Energy Security Market Analysis
10.11 Japan Energy Security Market Analysis
10.12 South Korea Energy Security Market Analysis
10.13 Australia Energy Security Market Analysis
10.14 Rest of Asia-Pacific Energy Security Market Analysis
11 Middle East and Africa Energy Security Market Analysis
11.1 Key Findings
11.2 Middle East and Africa Energy Security Market Attractiveness Index
11.3 Middle East and Africa Energy Security Market by Country, 2024, 2029 & 2034 (US$ Billion)
11.4 Middle East and Africa Energy Security Market Size Estimation and Forecast
11.5 Middle East and Africa Energy Security Market Size Estimation and Forecast by Country
11.6 Middle East and Africa Energy Security Market Size Estimation and Forecast by Component
11.7 Middle East and Africa Energy Security Market Size Estimation and Forecast by Infrastructure Type
11.8 Middle East and Africa Energy Security Market Size Estimation and Forecast by Solutions
11.9 GCC Energy Security Market Analysis
11.10 South Africa Energy Security Market Analysis
11.11 Rest of Middle East & Africa Energy Security Market Analysis
12 Latin America Energy Security Market Analysis
12.1 Key Findings
12.2 Latin America Energy Security Market Attractiveness Index
12.3 Latin America Energy Security Market by Country, 2024, 2029 & 2034 (US$ Billion)
12.4 Latin America Energy Security Market Size Estimation and Forecast
12.5 Latin America Energy Security Market Size Estimation and Forecast by Country
12.6 Latin America Energy Security Market Size Estimation and Forecast by Component
12.7 Latin America Energy Security Market Size Estimation and Forecast by Infrastructure Type
12.8 Latin America Energy Security Market Size Estimation and Forecast by Solutions
12.9 Brazil Energy Security Market Analysis
12.10 Mexico Energy Security Market Analysis
12.11 Rest of Latin America Energy Security Market Analysis
13 Company Profiles
13.1 Competitive Landscape, 2022
13.2 Strategic Outlook
13.3 Honeywell International Inc
13.3.1 Company Snapshot
13.3.2 Company Overview
13.3.3 Financial Analysis
13.3.3.1 Net Revenue, 2019-2023
13.3.3.2 R&D, 2019-2023
13.3.3.3 Regional Revenue Share, 2023 (%)
13.3.3.4 Business Segment Revenue Share, 2023 (%)
13.3.4 Product Benchmarking
13.3.5 Strategic Outlook
13.4 BAE Systems plc
13.4.1 Company Snapshot
13.4.2 Company Overview
13.4.3 Financial Analysis
13.4.3.1 Net Revenue, 2018-2022
13.4.3.2 R&D, 2018-2022
13.4.3.3 Regional Revenue Share, 2022 (%)
13.4.3.4 Business Segment Revenue Share, 2022 (%)
13.4.4 Product Benchmarking
13.4.5 Strategic Outlook
13.5 Siemens AG
13.5.1 Company Snapshot
13.5.2 Company Overview
13.5.3 Financial Analysis
13.5.3.1 Net Revenue, 2019-2023
13.5.3.2 R&D, 2019-2023
13.5.3.3 Regional Revenue Share, 2023 (%)
13.5.3.4 Business Segment Revenue Share, 2023 (%)
13.5.4 Product Benchmarking
13.5.5 Strategic Outlook
13.6 Lockheed Martin Corporation
13.6.1 Company Snapshot
13.6.2 Company Overview
13.6.3 Financial Analysis
13.6.3.1 Net Revenue, 2018-2022
13.6.3.2 R&D, 2018-2022
13.6.3.3 Regional Revenue Share, 2022 (%)
13.6.3.4 Business Segment Revenue Share, 2022 (%)
13.6.4 Product Benchmarking
13.6.5 Strategic Outlook
13.7 ABB Ltd.
13.7.1 Company Snapshot
13.7.2 Company Overview
13.7.3 Financial Analysis
13.7.3.1 Net Revenue, 2018-2022
13.7.3.2 R&D, 2018-2022
13.7.3.3 Business Segment Revenue Share, 2022 (%)
13.7.4 Product Benchmarking
13.7.5 Strategic Outlook
13.8 Raytheon Technologies Corporation
13.8.1 Company Snapshot
13.8.2 Company Overview
13.8.3 Financial Analysis
13.8.3.1 Net Revenue, 2018-2022
13.8.3.2 R&D, 2018-2022
13.8.3.3 Regional Revenue Share, 2022 (%)
13.8.3.4 Business Segment Revenue Share, 2022 (%)
13.8.4 Product Benchmarking
13.8.5 Strategic Outlook
13.9 Schneider Electric SE
13.9.1 Company Snapshot
13.9.2 Company Overview
13.9.3 Financial Analysis
13.9.3.1 Net Revenue, 2018-2022
13.9.3.2 R&D, 2018-2022
13.9.3.3 Regional Revenue Share, 2022 (%)
13.9.3.4 Business Segment Revenue Share, 2022 (%)
13.9.4 Product Benchmarking
13.9.5 Strategic Outlook
13.10 Northrop Grumman Corporation
13.10.1 Company Snapshot
13.10.2 Company Overview
13.10.3 Financial Analysis
13.10.3.1 Net Revenue, 2018-2022
13.10.3.2 R&D, 2018-2022
13.10.3.3 Regional Revenue Share, 2022 (%)
13.10.3.4 Business Segment Revenue Share, 2022 (%)
13.10.4 Product Benchmarking
13.10.5 Strategic Outlook
13.11 Thales Group
13.11.1 Company Snapshot
13.11.2 Company Overview
13.11.3 Financial Analysis
13.11.3.1 Net Revenue, 2018-2022
13.11.4 Product Benchmarking
13.11.5 Strategic Outlook
13.12 Leidos Holdings, Inc.
13.12.1 Company Snapshot
13.12.2 Company Overview
13.12.3 Financial Analysis
13.12.3.1 Net Revenue, 2018-2022
13.12.3.2 R&D, 2018-2022
13.12.3.3 Regional Revenue Share, 2022 (%)
13.12.3.4 Business Segment Revenue Share, 2022 (%)
13.12.4 Product Benchmarking
13.12.5 Strategic Outlook
13.13 Huawei Technologies Co., Ltd.
13.13.1 Company Snapshot
13.13.2 Company Overview
13.13.3 Financial Analysis
13.13.3.1 Net Revenue, 2018-2022
13.13.3.2 R&D, 2018-2022
13.13.3.3 Regional Revenue Share, 2022 (%)
13.13.3.4 Business Segment Revenue Share, 2022 (%)
13.13.4 Product Benchmarking
13.13.5 Strategic Outlook
13.14 General Electric Company
13.14.1 Company Snapshot
13.14.2 Company Overview
13.14.3 Financial Analysis
13.14.3.1 Net Revenue, 2018-2022
13.14.3.2 R&D, 2018-2022
13.14.3.3 Business Segment Revenue Share, 2022 (%)
13.14.4 Product Benchmarking
13.14.5 Strategic Outlook
13.15 Cisco Systems, Inc
13.15.1 Company Snapshot
13.15.2 Company Overview
13.15.3 Financial Analysis
13.15.3.1 Net Revenue, 2019-2023
13.15.3.2 R&D, 2019-2023
13.15.3.3 Regional Revenue Share, 2023 (%)
13.15.3.4 Business Segment Revenue Share, 2023 (%)
13.15.4 Product Benchmarking
13.15.5 Strategic Outlook
13.16 International Business Machines Corporation
13.16.1 Company Snapshot
13.16.2 Company Overview
13.16.3 Financial Analysis
13.16.3.1 Net Revenue, 2018-2022
13.16.3.2 R&D, 2018-2022
13.16.3.3 Regional Revenue Share, 2022 (%)
13.16.3.4 Business Segment Revenue Share, 2022 (%)
13.16.4 Product Benchmarking
13.16.5 Strategic Outlook
13.17 Teledyne FLIR LLC
13.17.1 Company Snapshot
13.17.2 Company Overview
13.17.3 Financial Analysis
13.17.3.1 Net Revenue, 2018-2022
13.17.3.2 R&D, 2018-2022
13.17.3.3 Regional Revenue Share, 2022 (%)
13.17.3.4 Business Segment Revenue Share, 2022 (%)
13.17.4 Product Benchmarking
13.17.5 Strategic Outlook
14 Conclusion and Recommendations
14.1 Concluding Remarks from Visiongain
14.2 Recommendations for Market Players
ページTOPに戻る
List of Tables/Graphs
List of Tables
Table 1 Energy Security Market Snapshot, 2024 & 2034 (US$ Billion, CAGR %)
Table 2 Global Energy Security Market by Region, 2024-2034 (US$ Bn, AGR (%), CAGR (%)) (V-Shaped Recovery Scenario)
Table 3 Global Energy Security Market by Region, 2024-2034 (US$ Bn, AGR (%), CAGR (%)) (U-Shaped Recovery Scenario)
Table 4 Global Energy Security Market by Region, 2024-2034 (US$ Bn, AGR (%), CAGR (%)) (W-Shaped Recovery Scenario)
Table 5 Global Energy Security Market by Region, 2024-2034 (US$ Bn, AGR (%), CAGR (%)) (L-Shaped Recovery Scenario)
Table 6 Global Energy Security Market by Components, 2024-2034 (US$ Bn, AGR (%), CAGR (%))
Table 7 Supervisory Control and Data Acquisition Systems (SCADA) Market by Region, 2024-2034 (US$ Bn, AGR (%), CAGR (%))
Table 8 Physical Security Devices Market by Region, 2024-2034 (US$ Bn, AGR (%), CAGR (%))
Table 9 Cybersecurity Hardware Market by Region, 2024-2034 (US$ Bn, AGR (%), CAGR (%))
Table 10 Global Energy Security Market by Infrastructure Type, 2024-2034 (US$ Bn, AGR (%), CAGR (%))
Table 11 Power Plants Security Market by Region, 2024-2034 (US$ Bn, AGR (%), CAGR (%))
Table 12 Transmission Security Market by Region, 2024-2034 (US$ Bn, AGR (%), CAGR (%))
Table 13 Distribution Network Security Market by Region, 2024-2034 (US$ Bn, AGR (%), CAGR (%))
Table 14 Cyberattacks on oil and gas infrastructure
Table 15 Oil and Gas Infrastructure Security Market by Region, 2024-2034 (US$ Bn, AGR (%), CAGR (%))
Table 16 Global Energy Security Market by Solutions, 2024-2034 (US$ Bn, AGR (%), CAGR (%))
Table 17 Physical Security Solutions Market by Region, 2024-2034 (US$ Bn, AGR (%), CAGR (%))
Table 18 Cybersecurity Solutions Market by Region, 2024-2034 (US$ Bn, AGR (%), CAGR (%))
Table 19 Surveillance Systems Market by Region, 2024-2034 (US$ Bn, AGR (%), CAGR (%))
Table 20 Monitoring Systems Market by Region, 2024-2034 (US$ Bn, AGR (%), CAGR (%))
Table 21 Other Solutions Market by Region, 2024-2034 (US$ Bn, AGR (%), CAGR (%))
Table 22 North America Energy Security Market by Value, 2024-2034 (US$ Bn, AGR (%), CAGR (%))
Table 23 North America Energy Security Market by Country, 2024-2034 (US$ Bn, AGR (%), CAGR (%))
Table 24 North America Energy Security Market by Components, 2024-2034 (US$ Bn, AGR (%), CAGR (%))
Table 25 North America Energy Security Market by Infrastructure Type, 2024-2034 (US$ Bn, AGR (%), CAGR (%))
Table 26 North America Energy Security Market by Solutions, 2024-2034 (US$ Bn, AGR (%), CAGR (%))
Table 27 US Energy Security Market by Value, 2024-2034 (US$ Bn, AGR (%), CAGR (%))
Table 28 Canada Energy Security Market by Value, 2024-2034 (US$ Bn, AGR (%), CAGR (%))
Table 29 Europe Energy Security Market by Value, 2024-2034 (US$ Bn, AGR (%), CAGR (%))
Table 30 Europe Energy Security Market by Country, 2024-2034 (US$ Bn, AGR (%), CAGR (%))
Table 31 Europe Energy Security Market by Components, 2024-2034 (US$ Bn, AGR (%), CAGR (%))
Table 32 Europe Energy Security Market by Infrastructure Type, 2024-2034 (US$ Bn, AGR (%), CAGR (%))
Table 33 Europe Energy Security Market by Solutions, 2024-2034 (US$ Bn, AGR (%), CAGR (%))
Table 34 Germany Energy Security Market by Value, 2024-2034 (US$ Bn, AGR (%), CAGR (%))
Table 35 UK Energy Security Market by Value, 2024-2034 (US$ Bn, AGR (%), CAGR (%))
Table 36 France Energy Security Market by Value, 2024-2034 (US$ Bn, AGR (%), CAGR (%))
Table 37 Italy Energy Security Market by Value, 2024-2034 (US$ Bn, AGR (%), CAGR (%))
Table 38 Spain Energy Security Market by Value, 2024-2034 (US$ Bn, AGR (%), CAGR (%))
Table 39 Rest of Europe Energy Security Market by Value, 2024-2034 (US$ Bn, AGR (%), CAGR (%))
Table 40 Asia-Pacific Energy Security Market by Value, 2024-2034 (US$ Bn, AGR (%), CAGR (%))
Table 41 Asia-Pacific Energy Security Market by Country, 2024-2034 (US$ Bn, AGR (%), CAGR (%))
Table 42 Asia-Pacific Energy Security Market by Components, 2024-2034 (US$ Bn, AGR (%), CAGR (%))
Table 43 Asia-Pacific Energy Security Market by Infrastructure Type, 2024-2034 (US$ Bn, AGR (%), CAGR (%))
Table 44 Asia-Pacific Energy Security Market by Solutions, 2024-2034 (US$ Bn, AGR (%), CAGR (%))
Table 45 China Energy Security Market by Value, 2024-2034 (US$ Bn, AGR (%), CAGR (%))
Table 46 India Energy Security Market by Value, 2024-2034 (US$ Bn, AGR (%), CAGR (%))
Table 47 Japan Energy Security Market by Value, 2024-2034 (US$ Bn, AGR (%), CAGR (%))
Table 48 South Korea Energy Security Market by Value, 2024-2034 (US$ Bn, AGR (%), CAGR (%))
Table 49 Australia Energy Security Market by Value, 2024-2034 (US$ Bn, AGR (%), CAGR (%))
Table 50 Rest of Asia-Pacific Energy Security Market by Value, 2024-2034 (US$ Bn, AGR (%), CAGR (%))
Table 51 Middle East & Africa Energy Security Market by Value, 2024-2034 (US$ Bn, AGR (%), CAGR (%))
Table 52 Middle East & Africa Energy Security Market by Country, 2024-2034 (US$ Bn, AGR (%), CAGR (%))
Table 53 Middle East & Africa Energy Security Market by Components, 2024-2034 (US$ Bn, AGR (%), CAGR (%))
Table 54 Middle East & Africa Energy Security Market by Infrastructure Type, 2024-2034 (US$ Bn, AGR (%), CAGR (%))
Table 55 Middle East & Africa Energy Security Market by Solutions, 2024-2034 (US$ Bn, AGR (%), CAGR (%))
Table 56 GCC Energy Security Market by Value, 2024-2034 (US$ Bn, AGR (%), CAGR (%))
Table 57 South Africa Energy Security Market by Value, 2024-2034 (US$ Bn, AGR (%), CAGR (%))
Table 58 Rest of Middle East & Africa Energy Security Market by Value, 2024-2034 (US$ Bn, AGR (%), CAGR (%))
Table 59 Latin America Energy Security Market by Value, 2024-2034 (US$ Bn, AGR (%), CAGR (%))
Table 60 Latin America Energy Security Market by Country, 2024-2034 (US$ Bn, AGR (%), CAGR (%))
Table 61 Latin America Energy Security Market by Components, 2024-2034 (US$ Bn, AGR (%), CAGR (%))
Table 62 Latin America Energy Security Market by Infrastructure Type, 2024-2034 (US$ Bn, AGR (%), CAGR (%))
Table 63 Latin America Energy Security Market by Solutions, 2024-2034 (US$ Bn, AGR (%), CAGR (%))
Table 64 Brazil Energy Security Market by Value, 2024-2034 (US$ Bn, AGR (%), CAGR (%))
Table 65 Mexico Energy Security Market by Value, 2024-2034 (US$ Bn, AGR (%), CAGR (%))
Table 66 Rest of Latin America Energy Security Market by Value, 2024-2034 (US$ Bn, AGR (%), CAGR (%))
Table 67 Strategic Outlook - Contract
Table 68 Honeywell International Inc: Key Details, (CEO, HQ, Revenue, Founded, No. of Employees, Company Type, Website, Business Segment)
Table 69 Honeywell International Inc: Product Benchmarking
Table 70 Honeywell International Inc: Strategic Outlook
Table 71 BAE Systems plc: Key Details, (CEO, HQ, Revenue, Founded, No. of Employees, Company Type, Website, Business Segment)
Table 72 BAE Systems plc: Product Benchmarking
Table 73 BAE Systems plc: Strategic Outlook
Table 74 Siemens AG: Key Details, (CEO, HQ, Revenue, Founded, No. of Employees, Company Type, Website, Business Segment)
Table 75 Siemens AG: Product Benchmarking
Table 76 Siemens AG: Strategic Outlook
Table 77 Lockheed Martin Corporation: Key Details, (CEO, HQ, Revenue, Founded, No. of Employees, Company Type, Website, Business Segment)
Table 78 Lockheed Martin Corporation: Product Benchmarking
Table 79 Lockheed Martin Corporation: Strategic Outlook
Table 80 ABB Ltd.: Key Details, (CEO, HQ, Revenue, Founded, No. of Employees, Company Type, Website, Business Segment)
Table 81 ABB Ltd.: Product Benchmarking
Table 82 ABB Ltd.: Strategic Outlook
Table 83 Raytheon Technologies Corporation: Key Details, (CEO, HQ, Revenue, Founded, No. of Employees, Company Type, Website, Business Segment)
Table 84 Raytheon Technologies Corporation: Product Benchmarking
Table 85 Raytheon Technologies Corporation: Strategic Outlook
Table 86 Schneider Electric SE: Key Details, (CEO, HQ, Revenue, Founded, No. of Employees, Company Type, Website, Business Segment)
Table 87 Schneider Electric SE: Product Benchmarking
Table 88 Schneider Electric SE: Strategic Outlook
Table 89 Northrop Grumman Corporation: Key Details, (CEO, HQ, Revenue, Founded, No. of Employees, Company Type, Website, Business Segment)
Table 90 Northrop Grumman Corporation: Product Benchmarking
Table 91 Northrop Grumman Corporation: Strategic Outlook
Table 92 Thales Group: Key Details, (CEO, HQ, Revenue, Founded, No. of Employees, Company Type, Website, Business Segment)
Table 93 Thales Group: Product Benchmarking
Table 94 Thales Group: Strategic Outlook
Table 95 Leidos Holdings, Inc.: Key Details, (CEO, HQ, Revenue, Founded, No. of Employees, Company Type, Website, Business Segment)
Table 96 Leidos Holdings, Inc.: Product Benchmarking
Table 97 Leidos Holdings, Inc.: Strategic Outlook
Table 98 Huawei Technologies Co., Ltd.: Key Details, (CEO, HQ, Revenue, Founded, No. of Employees, Company Type, Website, Business Segment)
Table 99 Huawei Technologies Co., Ltd.: Product Benchmarking
Table 100 Huawei Technologies Co., Ltd.: Strategic Outlook
Table 101 General Electric Company: Key Details, (CEO, HQ, Revenue, Founded, No. of Employees, Company Type, Website, Business Segment)
Table 102 General Electric Company: Product Benchmarking
Table 103 General Electric Company: Strategic Outlook
Table 104 Cisco Systems, Inc: Key Details, (CEO, HQ, Revenue, Founded, No. of Employees, Company Type, Website, Business Segment)
Table 105 Cisco Systems, Inc: Product Benchmarking
Table 106 Cisco Systems, Inc: Strategic Outlook
Table 107 International Business Machines Corporation: Key Details, (CEO, HQ, Revenue, Founded, No. of Employees, Company Type, Website, Business Segment)
Table 108 International Business Machines Corporation: Product Benchmarking
Table 109 International Business Machines Corporation: Strategic Outlook
Table 110 Teledyne FLIR LLC: Key Details, (CEO, HQ, Revenue, Founded, No. of Employees, Company Type, Website, Business Segment)
Table 111 Teledyne FLIR LLC: Product Benchmarking
Table 112 Teledyne FLIR LLC: Strategic Outlook
List of Figures
Figure 1 Energy Security Market Segmentation
Figure 2 Energy Security Market by Component: Market Attractiveness Index
Figure 3 Energy Security Market by Infrastructure Type: Market Attractiveness Index
Figure 4 Energy Security Market by Solutions: Market Attractiveness Index
Figure 5 Energy Security Market Attractiveness Index by Region
Figure 6 Energy Security Market: Market Dynamics
Figure 7 Energy Security Market: Porter’s Five Forces Analysis
Figure 8 Global Energy Security Market Share Forecast by COVID, 2024-2034 (%)
Figure 9 Global Energy Security Market by Region, 2024-2034 (US$ Bn, AGR (%)) (V-Shaped Recovery Scenario)
Figure 10 Global Energy Security Market by Region, 2024-2034 (US$ Bn, AGR (%)) (U-Shaped Recovery Scenario)
Figure 11 Global Energy Security Market by Region, 2024-2034 (US$ Bn, AGR (%)) (W-Shaped Recovery Scenario)
Figure 12 Global Energy Security Market by Region, 2024-2034 (US$ Bn, AGR (%)) (L-Shaped Recovery Scenario)
Figure 13 Energy Security Market: PEST Analysis
Figure 14 Energy Security Market by Component: Market Attractiveness Index
Figure 15 Global Energy Security Market by Components, 2024-2034 (US$ Bn, AGR (%))
Figure 16 Energy Security Market Share Forecast by Component, 2024, 2029, 2034 (%)
Figure 17 Supervisory Control and Data Acquisition Systems (SCADA) Market by Region, 2024-2034 (US$ Bn, AGR (%))
Figure 18 Supervisory Control and Data Acquisition Systems (SCADA) Market Share Forecast by Region, 2024 & 2034 (%)
Figure 19 Physical Security Devices Market by Region, 2024-2034 (US$ Bn, AGR (%))
Figure 20 Physical Security Devices Market Share Forecast by Region, 2024 & 2034 (%)
Figure 21 Cybersecurity Hardware Market by Region, 2024-2034 (US$ Bn, AGR (%))
Figure 22 Cybersecurity Hardware Market Share Forecast by Region, 2024 & 2034 (%)
Figure 23 Energy Security Market by Infrastructure Type: Market Attractiveness Index
Figure 24 Global Energy Security Market by Infrastructure Type, 2024-2034 (US$ Bn, AGR (%))
Figure 25 Energy Security Market Share Forecast by Infrastructure Type, 2024, 2029, 2034 (%)
Figure 26 Power Plants Security Market by Region, 2024-2034 (US$ Bn, AGR (%))
Figure 27 Power Plants Security Market Share Forecast by Region, 2024 & 2034 (%)
Figure 28 Transmission Security Market by Region, 2024-2034 (US$ Bn, AGR (%))
Figure 29 Transmission Security Market Share Forecast by Region, 2024 & 2034 (%)
Figure 30 Distribution Network Security Market by Region, 2024-2034 (US$ Bn, AGR (%))
Figure 31 Distribution Network Security Market Share Forecast by Region, 2024 & 2034 (%)
Figure 32 Oil and Gas Infrastructure Security Market by Region, 2024-2034 (US$ Bn, AGR (%))
Figure 33 Oil and Gas Infrastructure Security Market Share Forecast by Region, 2024 & 2034 (%)
Figure 34 Energy Security Market by Solutions: Market Attractiveness Index
Figure 35 Global Energy Security Market by Solutions, 2024-2034 (US$ Bn, AGR (%))
Figure 36 Energy Security Market Share Forecast by Solutions, 2024, 2029, 2034 (%)
Figure 37 Physical Security Solutions Market by Region, 2024-2034 (US$ Bn, AGR (%))
Figure 38 Physical Security Solutions Market Share Forecast by Region, 2024 & 2034 (%)
Figure 39 Cybersecurity Solutions Market by Region, 2024-2034 (US$ Bn, AGR (%))
Figure 40 CyberSecurity Solutions Market Share Forecast by Region, 2024 & 2034 (%)
Figure 41 Surveillance Systems Market by Region, 2024-2034 (US$ Bn, AGR (%))
Figure 42 Surveillance Systems Market Share Forecast by Region, 2024 & 2034 (%)
Figure 43 Monitoring Systems Market by Region, 2024-2034 (US$ Bn, AGR (%))
Figure 44 Monitoring Systems Market Share Forecast by Region, 2024 & 2034 (%)
Figure 45 Other Solutions Market by Region, 2024-2034 (US$ Bn, AGR (%))
Figure 46 Other Infrastructure Protection Market Share Forecast by Region, 2024 & 2034 (%)
Figure 47 Energy Security Market Forecast by Region 2024 and 2034 (Revenue, CAGR%)
Figure 48 Energy Security Market Share Forecast by Region 2024, 2029, 2034 (%)
Figure 49 North America Energy Security Market Attractiveness Index
Figure 50 North America Energy Security Market by Region, 2024, 2029 & 2034 (US$ Billion)
Figure 51 North America Energy Security Market by Value, 2024-2034 (US$ Bn, AGR (%))
Figure 52 North America Energy Security Market by Country, 2024-2034 (US$ Bn, AGR (%))
Figure 53 North America Energy Security Market Share Forecast by Country, 2024 & 2034 (%)
Figure 54 North America Energy Security Market by Components, 2024-2034 (US$ Bn, AGR (%))
Figure 55 North America Energy Security Market Share Forecast Component, 2024 & 2034 (%)
Figure 56 North America Energy Security Market by Infrastructure Type, 2024-2034 (US$ Bn, AGR (%))
Figure 57 North America Energy Security Market Share Forecast by Infrastructure Type, 2024 & 2034 (%)
Figure 58 North America Energy Security Market by Solutions, 2024-2034 (US$ Bn, AGR (%))
Figure 59 North America Energy Security Market Share Forecast by Solutions, 2024 & 2034 (%)
Figure 60 US Energy Security Market by Value, 2024-2034 (US$ Bn, AGR (%))
Figure 61 Canada Energy Security Market by Value, 2024-2034 (US$ Bn, AGR (%))
Figure 62 Europe Energy Security Market Attractiveness Index
Figure 63 Europe Energy Security Market by Region, 2024, 2029 & 2034 (US$ Billion)
Figure 64 Europe Energy Security Market by Value, 2024-2034 (US$ Bn, AGR (%))
Figure 65 Europe Energy Security Market by Country, 2024-2034 (US$ Bn, AGR (%))
Figure 66 Europe Energy Security Market Share Forecast by Country, 2024 & 2034 (%)
Figure 67 Europe Energy Security Market by Components, 2024-2034 (US$ Bn, AGR (%))
Figure 68 Europe Energy Security Market Share Forecast Component, 2024 & 2034 (%)
Figure 69 Europe Energy Security Market by Infrastructure Type, 2024-2034 (US$ Bn, AGR (%))
Figure 70 Europe Energy Security Market Share Forecast by Infrastructure Type, 2024 & 2034 (%)
Figure 71 Europe Energy Security Market by Solutions, 2024-2034 (US$ Bn, AGR (%))
Figure 72 Europe Energy Security Market Share Forecast by Solutions, 2024 & 2034 (%)
Figure 73 Germany Energy Security Market by Value, 2024-2034 (US$ Bn, AGR (%))
Figure 74 UK Energy Security Market by Value, 2024-2034 (US$ Bn, AGR (%))
Figure 75 France Energy Security Market by Value, 2024-2034 (US$ Bn, AGR (%))
Figure 76 Italy Energy Security Market by Value, 2024-2034 (US$ Bn, AGR (%))
Figure 77 Spain Energy Security Market by Value, 2024-2034 (US$ Bn, AGR (%))
Figure 78 Rest of Europe Energy Security Market by Value, 2024-2034 (US$ Bn, AGR (%))
Figure 79 Asia-Pacific Energy Security Market Attractiveness Index
Figure 80 Asia-Pacific Energy Security Market by Region, 2024, 2029 & 2034 (US$ Billion)
Figure 81 Asia-Pacific Energy Security Market by Value, 2024-2034 (US$ Bn, AGR (%))
Figure 82 Asia-Pacific Energy Security Market by Country, 2024-2034 (US$ Bn, AGR (%))
Figure 83 Asia-Pacific Energy Security Market Share Forecast by Country, 2024 & 2034 (%)
Figure 84 Asia-Pacific Energy Security Market by Components, 2024-2034 (US$ Bn, AGR (%))
Figure 85 Asia-Pacific Energy Security Market Share Forecast Component, 2024 & 2034 (%)
Figure 86 Asia-Pacific Energy Security Market by Infrastructure Type, 2024-2034 (US$ Bn, AGR (%))
Figure 87 Asia-Pacific Energy Security Market Share Forecast by Infrastructure Type, 2024 & 2034 (%)
Figure 88 Asia-Pacific Energy Security Market by Solutions, 2024-2034 (US$ Bn, AGR (%))
Figure 89 Asia-Pacific Energy Security Market Share Forecast by Solutions, 2024 & 2034 (%)
Figure 90 China Energy Security Market by Value, 2024-2034 (US$ Bn, AGR (%))
Figure 91 India Energy Security Market by Value, 2024-2034 (US$ Bn, AGR (%))
Figure 92 Japan Energy Security Market by Value, 2024-2034 (US$ Bn, AGR (%),)
Figure 93 South Korea Energy Security Market by Value, 2024-2034 (US$ Bn, AGR (%))
Figure 94 Australia Energy Security Market by Value, 2024-2034 (US$ Bn, AGR (%))
Figure 95 Rest of Asia-Pacific Energy Security Market by Value, 2024-2034 (US$ Bn, AGR (%))
Figure 96 Middle East and Africa Energy Security Market Attractiveness Index
Figure 97 Middle East and Africa Energy Security Market by Region, 2024, 2029 & 2034 (US$ Billion)
Figure 98 Middle East & Africa Energy Security Market by Value, 2024-2034 (US$ Bn, AGR (%))
Figure 99 Middle East & Africa Energy Security Market by Country, 2024-2034 (US$ Bn, AGR (%))
Figure 100 Middle East and Africa Energy Security Market Share Forecast by Country, 2024 & 2034 (%)
Figure 101 Middle East & Africa Energy Security Market by Components, 2024-2034 (US$ Bn, AGR (%))
Figure 102 Middle East and Africa Energy Security Market Share Forecast Component, 2024 & 2034 (%)
Figure 103 Middle East & Africa Energy Security Market by Infrastructure Type, 2024-2034 (US$ Bn, AGR (%))
Figure 104 Middle East and Africa Energy Security Market Share Forecast by Infrastructure Type, 2024 & 2034 (%)
Figure 105 Middle East & Africa Energy Security Market by Solutions, 2024-2034 (US$ Bn, AGR (%))
Figure 106 Middle East and Africa Energy Security Market Share Forecast by Solutions, 2024 & 2034 (%)
Figure 107 GCC Energy Security Market by Value, 2024-2034 (US$ Bn, AGR (%))
Figure 108 South Africa Energy Security Market by Value, 2024-2034 (US$ Bn, AGR (%))
Figure 109 Rest of Middle East & Africa Energy Security Market by Value, 2024-2034 (US$ Bn, AGR (%))
Figure 110 Latin America Energy Security Market Attractiveness Index
Figure 111 Latin America Energy Security Market by Region, 2024, 2029 & 2034 (US$ Billion)
Figure 112 Latin America Energy Security Market by Value, 2024-2034 (US$ Bn, AGR (%))
Figure 113 Latin America Energy Security Market by Country, 2024-2034 (US$ Bn, AGR (%))
Figure 114 Latin America Energy Security Market Share Forecast by Country, 2024 & 2034 (%)
Figure 115 Latin America Energy Security Market by Components, 2024-2034 (US$ Bn, AGR (%))
Figure 116 Latin America Energy Security Market Share Forecast Component, 2024 & 2034 (%)
Figure 117 Latin America Energy Security Market by Infrastructure Type, 2024-2034 (US$ Bn, AGR (%))
Figure 118 Latin America Energy Security Market Share Forecast by Infrastructure Type, 2024 & 2034 (%)
Figure 119 Latin America Energy Security Market by Solutions, 2024-2034 (US$ Bn, AGR (%))
Figure 120 Latin America Energy Security Market Share Forecast by Solutions, 2024 & 2034 (%)
Figure 121 Brazil Energy Security Market by Value, 2024-2034 (US$ Bn, AGR (%))
Figure 122 Mexico Energy Security Market by Value, 2024-2034 (US$ Bn, AGR (%))
Figure 123 Rest of Latin America Energy Security Market by Value, 2024-2034 (US$ Bn, AGR (%))
Figure 124 Energy Security Market: Company Share, 2022
Figure 125 Honeywell International Inc.: Net Revenue, 2018-2022 (US$ Million, AGR%)
Figure 126 Honeywell International Inc.: R&D, 2019-2023 (US$ Million, AGR%)
Figure 127 Honeywell International Inc.: Regional Revenue Share, 2023 (%)
Figure 128 Honeywell International Inc.: Business Segment Revenue Share, 2023 (%)
Figure 129 BAE Systems plc.: Net Revenue, 2018-2022 (US$ Million, AGR%)
Figure 130 BAE Systems plc.: R&D, 2018-2022 (US$ Million, AGR%)
Figure 131 BAE Systems plc.: Regional Revenue Share, 2022 (%)
Figure 132 BAE Systems plc.: Business Segment Revenue Share, 2022 (%)
Figure 133 Siemens AG.: Net Revenue, 2019-2023 (US$ Million, AGR%)
Figure 134 Siemens AG.: R&D, 2019-2023 (US$ Million, AGR%)
Figure 135 Siemens AG.: Regional Revenue Share, 2023 (%)
Figure 136 Siemens AG.: Business Segment Revenue Share, 2023 (%)
Figure 137 Lockheed Martin Corporation.: Net Revenue, 2018-2022 (US$ Million, AGR%)
Figure 138 Lockheed Martin Corporation.: R&D, 2018-2022 (US$ Million, AGR%)
Figure 139 Lockheed Martin Corporation.: Regional Revenue Share, 2022 (%)
Figure 140 Lockheed Martin Corporation.: Business Segment Revenue Share, 2022 (%)
Figure 141 ABB Ltd..: Net Revenue, 2018-2022 (US$ Million, AGR%)
Figure 142 ABB Ltd..: R&D, 2018-2022 (US$ Million, AGR%)
Figure 143 ABB Ltd..: Business Segment Revenue Share, 2022 (%)
Figure 144 Raytheon Technologies Corporation.: Net Revenue, 2018-2022 (US$ Million, AGR%)
Figure 145 Raytheon Technologies Corporation.: R&D, 2018-2022 (US$ Million, AGR%)
Figure 146 Raytheon Technologies Corporation.: Regional Revenue Share, 2022 (%)
Figure 147 Raytheon Technologies Corporation.: Business Segment Revenue Share, 2022 (%)
Figure 148 Schneider Electric SE.: Net Revenue, 2018-2022 (US$ Million, AGR%)
Figure 149 Schneider Electric SE.: R&D, 2018-2022 (US$ Million, AGR%)
Figure 150 Schneider Electric SE.: Regional Revenue Share, 2022 (%)
Figure 151 Schneider Electric SE.: Business Segment Revenue Share, 2022 (%)
Figure 152 Northrop Grumman Corporation.: Net Revenue, 2018-2022 (US$ Million, AGR%)
Figure 153 Northrop Grumman Corporation.: R&D, 2018-2022 (US$ Million, AGR%)
Figure 154 Northrop Grumman Corporation.: Regional Revenue Share, 2022 (%)
Figure 155 Northrop Grumman Corporation.: Business Segment Revenue Share, 2022 (%)
Figure 156 Thales Group.: Net Revenue, 2018-2022 (US$ Million, AGR%)
Figure 157 Leidos Holdings, Inc..: Net Revenue, 2018-2022 (US$ Million, AGR%)
Figure 158 Leidos Holdings, Inc..: R&D, 2018-2022 (US$ Million, AGR%)
Figure 159 Leidos Holdings, Inc..: Regional Revenue Share, 2022 (%)
Figure 160 Leidos Holdings, Inc..: Business Segment Revenue Share, 2022 (%)
Figure 161 Huawei Technologies Co., Ltd..: Net Revenue, 2018-2022 (US$ Million, AGR%)
Figure 162 Huawei Technologies Co., Ltd..: R&D, 2018-2022 (US$ Million, AGR%)
Figure 163 Huawei Technologies Co., Ltd..: Regional Revenue Share, 2022 (%)
Figure 164 Huawei Technologies Co., Ltd..: Business Segment Revenue Share, 2022 (%)
Figure 165 General Electric Company.: Net Revenue, 2018-2022 (US$ Million, AGR%)
Figure 166 General Electric Company.: R&D, 2018-2022 (US$ Million, AGR%)
Figure 167 General Electric Company.: Business Segment Revenue Share, 2022 (%)
Figure 168 Cisco Systems, Inc.: Net Revenue, 2019-2023 (US$ Million, AGR%)
Figure 169 Cisco Systems, Inc.: R&D, 2019-2023 (US$ Million, AGR%)
Figure 170 Cisco Systems, Inc.: Regional Revenue Share, 2023 (%)
Figure 171 Cisco Systems, Inc.: Business Segment Revenue Share, 2023 (%)
Figure 172 International Business Machines Corporation.: Net Revenue, 2018-2022 (US$ Million, AGR%)
Figure 173 International Business Machines Corporation.: R&D, 2018-2022 (US$ Million, AGR%)
Figure 174 International Business Machines Corporation.: Regional Revenue Share, 2022 (%)
Figure 175 International Business Machines Corporation.: Business Segment Revenue Share, 2022 (%)
Figure 176 Teledyne FLIR LLC.: Net Revenue, 2018-2022 (US$ Million, AGR%)
Figure 177 Teledyne FLIR LLC.: R&D, 2018-2022 (US$ Million, AGR%)
Figure 178 Teledyne FLIR LLC.: Regional Revenue Share, 2022 (%)
Figure 179 Teledyne FLIR LLC.: Business Segment Revenue Share, 2022 (%)
ページTOPに戻る
本レポートと同じKEY WORD(energy)の最新刊レポート
よくあるご質問
Visiongain社はどのような調査会社ですか?
英国の調査会社ヴィジョンゲイン社(Visiongain)は、通信とエネルギーのほか、自動車や化学・医薬品、金属など、広範な市場を対象に調査を行っています。自動車市場については、市場全般に関する調査のほ... もっと見る
調査レポートの納品までの日数はどの程度ですか?
在庫のあるものは速納となりますが、平均的には 3-4日と見て下さい。
但し、一部の調査レポートでは、発注を受けた段階で内容更新をして納品をする場合もあります。
発注をする前のお問合せをお願いします。
注文の手続きはどのようになっていますか?
1)お客様からの御問い合わせをいただきます。
2)見積書やサンプルの提示をいたします。
3)お客様指定、もしくは弊社の発注書をメール添付にて発送してください。
4)データリソース社からレポート発行元の調査会社へ納品手配します。
5) 調査会社からお客様へ納品されます。最近は、pdfにてのメール納品が大半です。
お支払方法の方法はどのようになっていますか?
納品と同時にデータリソース社よりお客様へ請求書(必要に応じて納品書も)を発送いたします。
お客様よりデータリソース社へ(通常は円払い)の御振り込みをお願いします。
請求書は、納品日の日付で発行しますので、翌月最終営業日までの当社指定口座への振込みをお願いします。振込み手数料は御社負担にてお願いします。
お客様の御支払い条件が60日以上の場合は御相談ください。
尚、初めてのお取引先や個人の場合、前払いをお願いすることもあります。ご了承のほど、お願いします。
データリソース社はどのような会社ですか?
当社は、世界各国の主要調査会社・レポート出版社と提携し、世界各国の市場調査レポートや技術動向レポートなどを日本国内の企業・公官庁及び教育研究機関に提供しております。
世界各国の「市場・技術・法規制などの」実情を調査・収集される時には、データリソース社にご相談ください。
お客様の御要望にあったデータや情報を抽出する為のレポート紹介や調査のアドバイスも致します。
|
|


