プレフィルドシリンジ市場レポート:2024-2034
Pre-Filled Syringes Market Report 2024-2034
レポート詳細
プレフィルドシリンジ市場レポート 2024-2034年 :この調査レポートは、業界とその基礎となる原動力をより良く理解することを望むなら、新たな収益ポケットを目指す大手企業にとって貴... もっと見る
※上記価格は部署ライセンス(Departmental licence)価格です。
その他の価格についてはデータリソースまでお問合せください。
日本語のページは自動翻訳を利用し作成しています。
実際のレポートは英文のみでご納品いたします。

|

|
サマリー
レポート詳細
プレフィルドシリンジ市場レポート 2024-2034年:この調査レポートは、業界とその基礎となる原動力をより良く理解することを望むなら、新たな収益ポケットを目指す大手企業にとって貴重なものとなるでしょう。異業種への進出や新規地域での既存事業の拡大を目指す企業にも有用です。
プレフィルド注射器の技術的進歩
プレフィルド注射器は、主に病院の救急部や特定の慢性疾患の管理に使用されている。これらの薬剤は、関節リウマチ、糖尿病、癌、自己免疫疾患などの慢性疾患の治療に使用されることが多い。この傾向は予測期間中の市場成長に寄与すると思われ、バイオテクノロジー医薬品に対する需要の増加がバイオテクノロジー産業の成長機会を拡大することも含まれる。正確な投与と厳格な安全対策を必要とすることが多い先端療法は、プレフィルドシリンジに理想的な適合性を見出す。これらのシリンジは、利便性、正確性、無菌性を提供し、患者が汚染のリスクを減らしながら正しい投与量を受け取ることを保証する。慢性疾患を管理するための生物製剤の需要が高まる中、プレフィルドシリンジは好ましい送達方法として台頭し、患者のアドヒアランスと治療成果を高めると同時に、廃棄物を最小限に抑え、医療全体の効率を向上させます。
患者の利便性とコンプライアンスの向上
患者の利便性とコンプライアンスは、プレフィルドシリンジの採用と使用を促進する上で極めて重要な役割を果たす。プレフィルドシリンジは、従来のバイアルやアンプルと比較して、特に患者の利便性と使いやすさの点で大きな利点があります。プレフィルドシリンジを使用することで、患者は手作業で薬剤を抽出する必要がなくなり、準備時間の短縮と投与の簡素化が可能になります。この合理化されたプロセスは、利便性を高めるだけでなく、処方された治療レジメンを患者が遵守することを促します。複雑な投与手順や注射針の取り扱いに対する恐怖感など、服薬遵守に対する潜在的な障壁を排除することで、プレフィルドシリンジは治療成績の向上と患者満足度の向上に貢献します。全体として、患者の利便性とコンプライアンスへの注目は、医療現場におけるプレフィルドシリンジの継続的な成長と採用の主要な推進力となっています。
市場調査レポートを購入する前にすべき質問とは?
-
プレフィルドシリンジ市場はどのように進化しているのか?
-
何がプレフィルドシリンジ市場を牽引し、阻害しているのか?
-
プレフィルドシリンジの各サブマーケットセグメントは予測期間中にどのように成長し、2034年にはどれくらいの収益を占めるようになるのか?
-
2024年から2034年にかけて、プレフィルドシリンジの各サブマーケットの市場シェアはどのように推移するのか?
-
2024年から2034年にかけて、市場全体を牽引する主な要因は何か?
-
主要なプレフィルドシリンジ市場はマクロ経済の動きに幅広く追随するのか、それとも個々の国市場が他を凌駕するのか?
-
2034年までに各国市場のシェアはどのように変化し、どの地域が2034年の市場をリードするのか。
-
主要プレーヤーと予測期間中の見通しは?
-
これらの大手企業のプレフィルドシリンジプロジェクトとは?
-
2024年から2034年の間に、業界はどのように進化するのか?現在および今後10年間に行われるプレフィルドシリンジのプロジェクトにはどのような意味があるのか?
-
プレフィルドシリンジ市場をさらに拡大するために、製品化の必要性は高まっていますか?
-
プレフィルドシリンジ市場はどこへ向かっているのか、そしてどのようにすれば市場の最前線に立てるのか?
-
新商品や新サービスに最適な投資方法とは?
-
企業を新たな成長軌道に乗せ、C-suiteに移行させるための重要な展望とは?
このことがプレフィルドシリンジ市場に現在、そして今後10年間でどのような影響を与えるかを知る必要がある:
-
329ページにわたるレポートには、143の表と200の図表が掲載されている。
-
本レポートでは、業界における主要な有利分野を取り上げているため、今すぐターゲットを絞ることができる。
-
世界、地域、国の売上高と成長に関する詳細な分析が含まれている。
-
競合他社が成功した主なトレンド、変化、収益予測をハイライトします。
このレポートは、プレフィルドシリンジ市場が今後10年間でどのように発展していくのか、またCOVID-19の景気後退と好転の変動に合わせてどのように発展していくのかをお伝えします。この市場は過去10年間のどの時点よりも今が重要です。
2034年までの予測やその他の分析から、商業的な展望が明らかになる
-
2034年までの収益予測に加え、最近の実績、成長率、市場シェアも提供している。
-
ビジネスの展望や展開など、独自の分析が掲載されている。
-
定性的分析(市場ダイナミクス、促進要因、機会、阻害要因、課題を含む)、コスト構造、プレフィルドシリンジ価格上昇の影響、最新動向をご覧ください。
本レポートには、COVID-19が業界と貴社にどのような影響を与えるかについてのデータ分析と貴重な洞察が含まれている。本レポートでは、COVID-19の4つの回復パターンとその影響、すなわち「V」、「L」、「W」、「U」について論じている。
レポート対象セグメント
タイプ別
素材別
デザイン
-
シングルチャンバー
-
デュアルチャンバー
-
カスタマイズ
デリバリー
用途別
世界市場全体と各分野の収益予測に加え、4つの地域と28の主要国市場の収益予測も掲載している:
北米
欧州
-
ドイツ
-
英国
-
フランス
-
スペイン
-
イタリア
-
ロシア
-
ポーランド
-
ベルギー
-
その他の欧州
アジア太平洋
-
中国
-
日本
-
インド
-
オーストラリア
-
韓国
-
シンガポール
-
台湾
-
その他のアジア太平洋
ラテンアメリカ
-
ブラジル
-
メキシコ
-
コロンビア
-
アルゼンチン
-
その他のラテンアメリカ
MEA
また、2024年から2034年までのプレフィルドシリンジ市場における主要企業のプロファイルも掲載しており、これらの企業の事業のこのセグメントに焦点を当てている。
報告書に掲載されている主要企業
-
Baxter International Inc.
-
BD
-
Biocon
-
Cardinal Health
-
Catalent, Inc.
-
Datwyler Holding Inc.
-
Debiotech S.A.
-
Elcam Medical
-
Fresenius Kabi AG
-
Gerresheimer AG
-
Jiangsu Micsafe Medical Technology Co., Ltd
-
MedXL Inc
-
Nipro Medical Corporation
-
Owen Mumford Ltd
-
Scandinavian Health Limited (SHL) Group
-
Schott AG
-
Stevanato Group
-
Terumo Corporation
-
Vetter Pharma
-
West Pharmaceutical Services, Inc.
プレフィルドシリンジ市場全体の世界売上高、2024年から2034年までの金額ベースで、市場は2024年に50億米ドルを突破する、との試算がある。2034年まで力強い収益成長を予測。当研究所では、最大の可能性を秘めた組織を特定しています。彼らの能力、進歩、商業的展望を発見し、一歩先を行くための一助としてください。
プレフィルドシリンジ市場、2024-2034年レポートはどのように役立ちますか?
要約すると、320ページを超えるこのレポートは、以下の知識を提供する:
-
プレフィルドシリンジ市場の2024年から2034年までの収益予測、材料、デザイン、タイプ、送達、用途の各予測を世界レベルと地域レベルで掲載 - 業界の将来性を発見し、投資と収益に最も有利な場所を見つけることができます。
-
5つの地域と27の主要国市場の2034年までの収益予測 - プレフィルドシリンジ市場、北米、欧州、アジア太平洋、中南米、MEAの2024年から2034年までの市場予測をご覧ください。また、米国、カナダ、メキシコ、ブラジル、ドイツ、フランス、英国、イタリア、中国、インド、日本、オーストラリアなどの著名経済圏の市場も予測しています。
-
2024年から2034年までのプレフィルドシリンジ市場に関わる主要企業20社の企業プロファイルを含む。
独自の予測による定量的・定性的分析をご覧ください。私たちのレポートだけに含まれる情報を入手し、貴重なビジネスインテリジェンスで情報を得ることができます。
他にはない情報
私たちの新しいレポートがあれば、知識に遅れをとったり、チャンスを逃したりする可能性が低くなります。弊社の調査レポートが貴社の調査、分析、意思決定にどのように役立つかをご覧ください。Visiongainの調査は、プレフィルドシリンジ市場、2024年から2034年、市場をリードする企業の商業分析を必要とするすべての人のためのものです。データ、トレンド、予測をご覧いただけます。
ページTOPに戻る
目次
目次
1 レポート概要
1.1 研究の目的
1.2 プレフィルドシリンジ市場の紹介
1.3 本レポートの内容
1.4 本レポートを読むべき理由
1.5 本分析レポートが回答する主な質問
1.6 本レポートは誰のためのものか?
1.7 方法論
1.7.1 市場の定義
1.7.2 市場評価・予測手法
1.7.3 データの検証
1.7.3.1 一次調査
1.7.3.2 セカンダリーリサーチ
1.8 よくある質問(FAQ)
1.9 Visiongainの関連レポート
1.10 Visiongainについて
2 エグゼクティブ・サマリー
3 市場概要
3.1 主要な調査結果
3.2 市場ダイナミクス
3.2.1 市場促進要因
3.2.1.1 在宅医療に向けた新たな動き
3.2.1.2 注射薬の増加
3.2.1.3 高まるプレフィルドシリンジのニーズに対応する革新的ソリューション
3.2.2 市場抑制要因
3.2.2.1 製造工程における課題
3.2.2.2 代替薬剤投与技術の存在
3.2.2.3 滅菌の難しさとより経済的な代替品の存在
3.2.3 市場機会
3.2.3.1 生物学的製剤とバイオシミラーの拡大
3.2.3.2 注射薬ニーズの急増
3.2.3.3 バイオテクノロジー産業における好機
3.3 COVID-19の影響分析
3.4 ポーターのファイブフォース分析
3.4.1 サプライヤーの交渉力
3.4.2 買い手の交渉力
3.4.3 競争相手のライバル関係
3.4.4 代替品による脅威
3.4.5 新規参入企業の脅威
3.5 PEST分析
4 プレフィルドシリンジ市場分析:タイプ別
4.1 主要な調査結果
4.2 タイプ別セグメント 市場魅力度指数
4.3 プレフィルドシリンジのタイプ別市場規模推定と予測
4.4 従来型
4.4.1 2024〜2034年の地域別市場規模(US$ Million)
4.4.2 地域別市場シェア、2024年・2034年 (%)
4.5 安全性
4.5.1 2024〜2034年の地域別市場規模(US$ Million)
4.5.2 地域別市場シェア、2024年・2034年 (%)
5 プレフィルドシリンジ市場分析:材料別
5.1 主要調査結果
5.2 材料セグメント 市場魅力度指数
5.3 プレフィルドシリンジ材料別市場規模推定と予測
5.4 ガラス
5.4.1 2024〜2034年の地域別市場規模(US$ Million)
5.4.2 地域別市場シェア、2024年・2034年 (%)
5.5 プラスチック
5.5.1 2024年~2034年の地域別市場規模(US$ Million)
5.5.2 地域別市場シェア、2024年・2034年 (%)
5.6 ステンレス
5.6.1 2024-2034年地域別市場規模(US$ Million)
5.6.2 地域別市場シェア、2024年・2034年 (%)
5.7 エラストマー
5.7.1 2024~2034年の地域別市場規模(US$ Million)
5.7.2 地域別市場シェア、2024年・2034年 (%)
6 プレフィルドシリンジ市場分析:デザイン別
6.1 デザインセグメント 市場魅力度指数
6.2 デザイン別プレフィルドシリンジ市場規模推定と予測
6.3 シングルチャンバー
6.3.1 2024〜2034年の地域別市場規模(US$ Million)
6.3.2 地域別市場シェア、2024年・2034年 (%)
6.4 デュアルチャンバー
6.4.1 2024~2034年の地域別市場規模(US$ Million)
6.4.2 地域別市場シェア、2024年・2034年 (%)
6.5 カスタマイズ
6.5.1 2024〜2034年の地域別市場規模(US$ Million)
6.5.2 地域別市場シェア、2024年・2034年 (%)
7 プレフィルドシリンジ市場分析:デリバリー別
7.1 主要調査結果
7.2 配達セグメント 市場魅力度指数
7.3 プレフィルドシリンジのデリバリー別市場規模推定と予測
7.4 静注用
7.4.1 2024〜2034年の地域別市場規模(US$ Million)
7.4.2 地域別市場シェア、2024年・2034年 (%)
7.5 皮下注射
7.5.1 2024~2034年の地域別市場規模(US$ Million)
7.5.2 地域別市場シェア、2024年・2034年 (%)
7.6 筋肉内
7.6.1 2024~2034年の地域別市場規模(US$ Million)
7.6.2 地域別市場シェア、2024年・2034年 (%)
7.7 その他
7.7.1 2024〜2034年の地域別市場規模(US$ Million)
7.7.2 地域別市場シェア、2024年・2034年 (%)
8 プレフィルドシリンジ市場分析:用途別
8.1 主要な調査結果
8.2 用途別セグメント 市場魅力度指数
8.3 プレフィルドシリンジの用途別市場規模推定と予測
8.4 糖尿病
8.4.1 2024〜2034年の地域別市場規模(US$ Million)
8.4.2 地域別市場シェア、2024年・2034年 (%)
8.5 関節リウマチ
8.5.1 2024〜2034年の地域別市場規模(US$ Million)
8.5.2 地域別市場シェア、2024年・2034年 (%)
8.6 アナフィラキシー
8.6.1 2024〜2034年の地域別市場規模(US$ Million)
8.6.2 地域別市場シェア、2024年・2034年 (%)
8.7 その他
8.7.1 2024〜2034年の地域別市場規模(US$ Million)
8.7.2 地域別市場シェア、2024年・2034年 (%)
9 プレフィルドシリンジ市場分析:地域別
9.1 主要な調査結果
9.2 地域別市場規模の推定と予測
10 北米のプレフィルドシリンジ市場分析
10.1 主要な調査結果
10.2 北米のプレフィルドシリンジ市場魅力度指数
10.3 北米のプレフィルドシリンジ国別市場、2024年、2029年、2034年(US$ Million)
10.4 北米のプレフィルドシリンジ市場規模推定と予測:国別
10.5 北米のプレフィルドシリンジ市場規模推定と予測:タイプ別
10.6 北米のプレフィルドシリンジ市場規模推定と予測:素材別
10.7 北米のプレフィルドシリンジ市場規模推定と予測:デザイン別
10.8 北米のプレフィルドシリンジ市場規模推定と予測:デリバリー別
10.9 北米のプレフィルドシリンジ市場規模推定と予測:用途別
10.10 アメリカのプレフィルドシリンジ市場分析
10.11 カナダのプレフィルドシリンジ市場分析
11 欧州のプレフィルドシリンジ市場分析
11.1 主要な調査結果
11.2 欧州のプレフィルドシリンジ市場魅力度指数
11.3 欧州のプレフィルドシリンジ国別市場:2024年、2029年、2034年(US$ Million)
11.4 欧州のプレフィルドシリンジ国別市場規模推定と予測
11.5 欧州のプレフィルドシリンジ市場規模推定と予測:タイプ別
11.6 欧州のプレフィルドシリンジ市場規模推定と予測:素材別
11.7 欧州のプレフィルドシリンジ市場規模推定と予測:デザイン別
11.8 欧州のプレフィルドシリンジ市場規模推定と予測:デリバリー別
11.9 欧州のプレフィルドシリンジ市場規模推定と予測:用途別
11.10 ドイツのプレフィルドシリンジ市場分析
11.11 フランスのプレフィルドシリンジ市場分析
11.12 イギリスのプレフィルドシリンジ市場分析
11.13 イタリアのプレフィルドシリンジ市場分析
11.14 スペインのプレフィルドシリンジ市場分析
11.15 ロシアのプレフィルドシリンジ市場分析
11.16 ポーランドプレフィルドシリンジ市場分析
11.17 ベルギーのプレフィルドシリンジ市場分析
11.18 その他の欧州のプレフィルドシリンジ市場分析
12 アジア太平洋地域のプレフィルドシリンジ市場分析
12.1 主要な調査結果
12.2 アジア太平洋地域のプレフィルドシリンジ市場魅力度指数
12.3 アジア太平洋地域のプレフィルドシリンジ国別市場:2024年、2029年、2034年(US$ Million)
12.4 アジア太平洋地域のプレフィルドシリンジ国別市場規模推定と予測
12.5 アジア太平洋地域のプレフィルドシリンジ市場規模推定と予測:タイプ別
12.6 アジア太平洋地域のプレフィルドシリンジ市場規模推定と予測:材料別
12.7 アジア太平洋地域のプレフィルドシリンジ市場規模推定と予測:デザイン別
12.8 アジア太平洋地域のプレフィルドシリンジ市場規模推定と予測:デリバリー別
12.9 アジア太平洋地域のプレフィルドシリンジ市場規模推定と予測:用途別
12.10 日本のプレフィルドシリンジ市場分析
12.11 中国のプレフィルドシリンジ市場分析
12.12 インドのプレフィルドシリンジ市場分析
12.13 オーストラリアのプレフィルドシリンジ市場分析
12.14 韓国のプレフィルドシリンジ市場分析
12.15 シンガポールのプレフィルドシリンジ市場分析
12.16 台湾のプレフィルドシリンジ市場分析
12.17 その他のアジア太平洋地域のプレフィルドシリンジ市場分析
13 ラテンアメリカのプレフィルドシリンジ市場分析
13.1 主要な調査結果
13.2 ラテンアメリカのプレフィルドシリンジ市場魅力度指数
13.3 ラテンアメリカのプレフィルドシリンジ国別市場:2024年、2029年、2034年(US$ Million)
13.4 ラテンアメリカのプレフィルドシリンジ市場規模推定と予測:国別
13.5 ラテンアメリカのプレフィルドシリンジ市場規模推定と予測:タイプ別
13.6 ラテンアメリカのプレフィルドシリンジ市場規模推定と予測:素材別
13.7 ラテンアメリカのプレフィルドシリンジ市場規模推定と予測:デザイン別
13.8 ラテンアメリカのプレフィルドシリンジ市場規模推定と予測:デリバリー別
13.9 ラテンアメリカのプレフィルドシリンジ市場規模推定と予測:用途別
13.10 ブラジルのプレフィルドシリンジ市場分析
13.11 メキシコのプレフィルドシリンジ市場分析
13.12 アルゼンチンのプレフィルドシリンジ市場分析
13.13 コロンビアのプレフィルドシリンジ市場分析
13.14 その他のラテンアメリカのプレフィルドシリンジ市場分析
14 MEAのプレフィルドシリンジ市場分析
14.1 主要な調査結果
14.2 MEAのプレフィルドシリンジ市場魅力度指数
14.3 MEAのプレフィルドシリンジ国別市場:2024年、2029年、2034年(US$ Million)
14.4 MEAのプレフィルドシリンジ市場規模推定と予測:国別
14.5 MEAのプレフィルドシリンジ市場規模推定と予測:タイプ別
14.6 MEAのプレフィルドシリンジ市場規模推定と予測:素材別
14.7 MEAのプレフィルドシリンジ市場規模推定と予測:デザイン別
14.8 MEAのプレフィルドシリンジ市場規模推定と予測:デリバリー別
14.9 MEAのプレフィルドシリンジ市場規模推定と予測:用途別
14.10 GCCのプレフィルドシリンジ市場分析
14.11 南アフリカのプレフィルドシリンジ市場分析
14.12 その他のMEAのプレフィルドシリンジ市場の分析
15 会社概要
15.1 競争環境、2022年
15.2 戦略的展望
15.3 Baxter International Inc.
15.3.1 会社概要
15.3.2 会社概要
15.3.3 財務分析
15.3.3.1 純収入、2017-2022年
15.3.3.2 R&D、2017-2022年
15.3.3.3 地域市場シェア、2022年
15.3.4 製品ベンチマーク
15.3.5 戦略的展望
15.4 BD
15.4.1 会社概要
15.4.2 会社概要
15.4.3 財務分析
15.4.3.1 純収入、2017-2023年
15.4.3.2 R&D、2017年~2023年
15.4.3.3 地域市場シェア、2023年
15.4.4 製品ベンチマーク
15.4.5 戦略的展望
15.5 Biocon
15.5.1 会社概要
15.5.2 会社概要
15.5.3 財務分析
15.5.3.1 純収入、2017-2023年
15.5.3.2 R&D、2017年〜2023年
15.5.3.3 地域市場シェア、2023年
15.5.4 製品ベンチマーク
15.5.5 戦略的展望
15.6 Cardinal Health
15.6.1 会社概要
15.6.2 会社概要
15.6.3 財務分析
15.6.3.1 純収入、2017年~2023年
15.6.3.2 地域市場シェア、2022年
15.6.4 製品ベンチマーク
15.6.5 戦略的展望
15.7 Catalent, Inc.
15.7.1 会社概要
15.7.2 会社概要
15.7.3 財務分析
15.7.3.1 純収入、2017-2023年
15.7.3.2 売上高、2017-2023年
15.7.4 製品ベンチマーク
15.7.5 戦略的展望
15.8 Datwyler Holding Inc.
15.8.1 会社概要
15.8.2 会社概要
15.8.3 財務分析
15.8.3.1 純収入、2017-2022年
15.8.3.2 R&D、2017-2022年
15.8.3.3 地域市場シェア、2022年
15.8.4 製品ベンチマーク
15.8.5 戦略的展望
15.9 Debiotech S.A.
15.9.1 会社概要
15.9.2 会社概要
15.9.3 製品ベンチマーク
15.9.4 戦略的展望
15.10 Elcam Medical
15.10.1 会社概要
15.10.2 会社概要
15.10.3 製品ベンチマーク
15.11 Fresenius Kabi AG
15.11.1 会社概要
15.11.2 会社概要
15.11.3 財務分析
15.11.3.1 純収入、2017-2022年
15.11.3.2 R&D、2017-2022年
15.11.3.3 地域市場シェア、2022年
15.11.4 製品ベンチマーク
15.11.5 戦略的展望
15.12 Gerresheimer AG
15.12.1 会社概要
15.12.2 会社概要
15.12.3 財務分析
15.12.3.1 純収入、2017-2022年
15.12.3.2 R&D、2017-2022年
15.12.3.3 地域市場シェア、2022年
15.12.4 製品ベンチマーク
15.12.5 戦略的展望
15.13 Micsafe Med (Jiangsu Micsafe Medical Technology Co., Ltd)
15.13.1 会社概要
15.13.2 会社概要
15.13.3 製品ベンチマーク
15.14 MedXL Inc.
15.14.1 会社概要
15.14.2 会社概要
15.14.3 製品ベンチマーク
15.14.4 戦略的展望
15.15 Nipro Medical Corporation
15.15.1 会社概要
15.15.2 会社概要
15.15.3 財務分析
15.15.3.1 純収入、2017-2022年
15.15.3.2 R&D、2017-2022年
15.15.3.3 地域市場シェア、2022年
15.15.4 製品ベンチマーク
15.15.5 戦略的展望
15.16 Owen Mumford Ltd
15.16.1 会社概要
15.16.2 会社概要
15.16.3 製品ベンチマーク
15.16.4 戦略的展望
15.17 Scandinavian Health Limited (SHL) Group
15.17.1 会社概要
15.17.2 会社概要
15.17.3 製品ベンチマーク
15.17.4 戦略的展望
15.18 Schott AG
15.18.1 会社概要
15.18.2 会社概要
15.18.3 財務分析
15.18.3.1 純収入(2020-2022年
15.18.3.2 売上高、2020-2022年
15.18.3.3 地域市場シェア、2023年
15.18.4 製品ベンチマーク
15.18.5 戦略的展望
15.19 Stevanato Group
15.19.1 会社概要
15.19.2 会社概要
15.19.3 財務分析
15.19.3.1 純収入、2020-2022年
15.19.3.2 売上高、2020-2022年
15.19.4 製品ベンチマーク
15.19.5 戦略的展望
15.20 Terumo Corporation
15.20.1 会社概要
15.20.2 会社概要
15.20.3 財務分析
15.20.3.1 純収入(2017年~2023年
15.20.3.2 売上高、2017年~2023年
15.20.3.3 地域市場シェア、2022年
15.20.4 製品ベンチマーク
15.20.5 戦略的展望
15.21 Vetter Pharma
15.21.1 会社概要
15.21.2 会社概要
15.21.3 製品ベンチマーク
15.22 West Pharmaceutical Services, Inc.
15.22.1 会社概要
15.22.2 会社概要
15.22.3 財務分析
15.22.3.1 純収入、2017-2022年
15.22.3.2 R&D、2017-2022年
15.22.3.3 地域市場シェア、2022年
15.22.4 製品ベンチマーク
15.22.5 戦略的展望
16 結論と提言
16.1 Visiongainからの結びの言葉
16.2 市場プレイヤーへの提言
ページTOPに戻る
図表リスト
表の一覧
Table 1 Pre-Filled Syringes Market Snapshot, 2024 & 2034 (US$ Million, CAGR %)
Table 2 Pre-Filled Syringes Market Forecast by Region, 2024-2034 (US$ Million, AGR%, CAGR%): “V” Shaped Recovery
Table 3 Pre-Filled Syringes Market Forecast by Region, 2024-2034 (US$ Million, AGR%, CAGR%): “U” Shaped Recovery
Table 4 Pre-Filled Syringes Market Forecast by Region, 2024-2034 (US$ Million, AGR%, CAGR%): “W” Shaped Recovery
Table 5 Pre-Filled Syringes Market Forecast by Region, 2024-2034 (US$ Million, AGR%, CAGR%): “L” Shaped Recovery
Table 6 Pre-Filled Syringes Market Forecast by Type, 2024-2034 (US$ Million, AGR%, CAGR %)
Table 7 Conventional Segment Market Forecast by Region, 2024-2034 (US$ Million, AGR%, CAGR %)
Table 8 Safety Segment Market Forecast by Region, 2024-2034 (US$ Million, AGR%, CAGR %)
Table 9 Pre-Filled Syringes Market Forecast by Material, 2024-2034 (US$ Million, AGR%, CAGR %)
Table 10 Glass Segment Market Forecast by Region, 2024-2034 (US$ Million, AGR%, CAGR%)
Table 11 Plastic Segment Market Forecast by Region, 2024-2034 (US$ Million, AGR%, CAGR %)
Table 12 Stainless Steel Segment Market Forecast by Region, 2024-2034 (US$ Million, AGR%, CAGR%)
Table 13 Elastomer Segment Market Forecast by Region, 2024-2034 (US$ Million, AGR%, CAGR%)
Table 14 Pre-Filled Syringes Market Forecast by Design, 2024-2034 (US$ Million, AGR%, CAGR %)
Table 15 Single-chamber Segment Market Forecast by Region, 2024-2034 (US$ Million, AGR%, CAGR%)
Table 16 Dual-chamber Segment Market Forecast by Region, 2024-2034 (US$ Million, AGR%, CAGR %)
Table 17 Customized Segment Market Forecast by Region, 2024-2034 (US$ Million, AGR%, CAGR%)
Table 18 Pre-Filled Syringes Market Delivery, 2024-2034 (US$ Million, AGR%, CAGR%)
Table 19 Intravenous Market Forecast by Region, 2024-2034 (US$ Million, AGR%, CAGR%)
Table 20 Subcutaneous Market Forecast by Region, 2024-2034 (US$ Million, AGR%, CAGR %)
Table 21 Intramuscular Market Forecast by Region, 2024-2034 (US$ Million, AGR%, CAGR%)
Table 22 Others Market Forecast by Region, 2024-2034 (US$ Million, AGR%, CAGR %)
Table 23 Pre-Filled Syringes Market Application, 2024-2034 (US$ Million, AGR%, CAGR %)
Table 24 Diabetes Market Forecast by Region, 2024-2034 (US$ Million, AGR%, CAGR %)
Table 25 Rheumatoid Arthritis Market Forecast by Region, 2024-2034 (US$ Million, AGR%, CAGR %)
Table 26 Anaphylaxis Market Forecast by Region, 2024-2034 (US$ Million, AGR%, CAGR %)
Table 27 Other Market Forecast by Region, 2024-2034 (US$ Million, AGR%, CAGR %)
Table 28 Pre-Filled Syringes Market Forecast by Region, 2024-2034 (US$ Million, AGR%, CAGR %)
Table 29 North America Pre-Filled Syringes Market Forecast by Country, 2024-2034 (US$ Million, AGR%, CAGR %)
Table 30 North America Pre-Filled Syringes Market Forecast by Type, 2024-2034 (US$ Million, AGR%, CAGR %)
Table 31 North America Pre-Filled Syringes Market Forecast by Material, 2024-2034 (US$ Million, AGR%, CAGR%)
Table 32 North America Pre-Filled Syringes Market Forecast by Design, 2024-2034 (US$ Million, AGR%, CAGR%)
Table 33 Pre-Filled Syringes Market Delivery, 2024-2034 (US$ Million, AGR%, CAGR%)
Table 34 North America Pre-Filled Syringes Market Application, 2024-2034 (US$ Million, AGR%, CAGR%)
Table 35 U.S Pre-Filled Syringes Market Forecast, 2024-2034 (US$ Million, AGR%, CAGR %)
Table 36 Canada Pre-Filled Syringes Market Forecast, 2024-2034 (US$ Million, AGR%, CAGR %)
Table 37 Europe Pre-Filled Syringes Market Forecast by Country, 2024-2034 (US$ Million, AGR%, CAGR%)
Table 38 Pre-Filled Syringes Market Forecast by Type, 2024-2034 (US$ Million, AGR%, CAGR %)
Table 39 Europe Pre-Filled Syringes Market Forecast by Material, 2024-2034 (US$ Million, AGR%, CAGR%)
Table 40 Europe Pre-Filled Syringes Market Forecast by Design, 2024-2034 (US$ Million, AGR%, CAGR%)
Table 41 Europe Pre-Filled Syringes Market Delivery, 2024-2034 (US$ Million, AGR%, CAGR%)
Table 42 Europe Pre-Filled Syringes Market Application, 2024-2034 (US$ Million, AGR%, CAGR%)
Table 43 Germany Pre-Filled Syringes Market Forecast, 2024-2034 (US$ Million, AGR%, CAGR %)
Table 44 France Pre-Filled Syringes Market Forecast, 2024-2034 (US$ Million, AGR%, CAGR %)
Table 45 UK Pre-Filled Syringes Market Forecast, 2024-2034 (US$ Million, AGR%, CAGR%)
Table 46 Italy Pre-Filled Syringes Market Forecast, 2024-2034 (US$ Million, AGR%, CAGR %)
Table 47 Spain Pre-Filled Syringes Market Forecast, 2024-2034 (US$ Million, AGR%, CAGR %)
Table 48 Russia Pre-Filled Syringes Market Forecast, 2024-2034 (US$ Million, AGR%, CAGR%)
Table 49 Poland Pre-Filled Syringes Market Forecast, 2024-2034 (US$ Million, AGR%, CAGR%)
Table 50 Belgium Pre-Filled Syringes Market Forecast, 2024-2034 (US$ Million, AGR%, CAGR%)
Table 51 Rest of Europe Pre-Filled Syringes Market Forecast, 2024-2034 (US$ Million, AGR%, CAGR%)
Table 52 Asia Pacific Pre-Filled Syringes Market Forecast by Country, 2024-2034 (US$ Million, AGR%, CAGR%)
Table 53 Asia Pacific Pre-Filled Syringes Market Forecast by Type, 2024-2034 (US$ Million, AGR%, CAGR %)
Table 54 Asia Pacific Pre-Filled Syringes Market Forecast by Material, 2024-2034 (US$ Million, AGR%, CAGR%)
Table 55 Asia Pacific Pre-Filled Syringes Market Forecast by Design, 2024-2034 (US$ Million, AGR%, CAGR%)
Table 56 Asia Pacific Pre-Filled Syringes Market Delivery, 2024-2034 (US$ Million, AGR%, CAGR%)
Table 57 Asia Pacific Pre-Filled Syringes Market Application, 2024-2034 (US$ Million, AGR%, CAGR%)
Table 58 Japan Pre-Filled Syringes Market Forecast, 2024-2034 (US$ Million, AGR%, CAGR%)
Table 59 China Pre-Filled Syringes Market Forecast, 2024-2034 (US$ Million, AGR%, CAGR%)
Table 60 India Pre-Filled Syringes Market Forecast, 2024-2034 (US$ Million, AGR%, CAGR %)
Table 61 Australia Pre-Filled Syringes Market Forecast, 2024-2034 (US$ Million, AGR%, CAGR %)
Table 62 South Korea Pre-Filled Syringes Market Forecast, 2024-2034 (US$ Million, AGR%, CAGR%)
Table 63 Singapore Pre-Filled Syringes Market Forecast, 2024-2034 (US$ Million, AGR%, CAGR%)
Table 64 Taiwan Pre-Filled Syringes Market Forecast, 2024-2034 (US$ Million, AGR%, CAGR%)
Table 65 Rest of Asia Pacific Pre-Filled Syringes Market Forecast, 2024-2034 (US$ Million, AGR%, CAGR %)
Table 66 Latin America Pre-Filled Syringes Market Forecast by Country, 2024-2034 (US$ Million, AGR%, CAGR%)
Table 67 Latin America Pre-Filled Syringes Market Forecast by Type, 2024-2034 (US$ Million, AGR%, CAGR %)
Table 68 Latin America Pre-Filled Syringes Market Forecast by Material, 2024-2034 (US$ Million, AGR%, CAGR%)
Table 69 Latin America Pre-Filled Syringes Market Forecast by Design, 2024-2034 (US$ Million, AGR%, CAGR%)
Table 70 Latin America Pre-Filled Syringes Market Delivery, 2024-2034 (US$ Million, AGR%, CAGR%)
Table 71 Latin America Pre-Filled Syringes Market by Application, 2024-2034 (US$ Million, AGR%, CAGR%)
Table 72 Brazil Pre-Filled Syringes Market Forecast, 2024-2034 (US$ Million, AGR%, CAGR %)
Table 73 Mexico Pre-Filled Syringes Market Forecast, 2024-2034 (US$ Million, AGR%, CAGR%)
Table 74 Argentina Pre-Filled Syringes Market Forecast, 2024-2034 (US$ Million, AGR%, CAGR%)
Table 75 Colombia Pre-Filled Syringes Market Forecast, 2024-2034 (US$ Million, AGR%, CAGR%)
Table 76 Rest of Latin America Pre-Filled Syringes Market Forecast, 2024-2034 (US$ Million, AGR%, CAGR%)
Table 77 MEA Pre-Filled Syringes Market Forecast by Country, 2024-2034 (US$ Million, AGR%, CAGR%)
Table 78 MEA Pre-Filled Syringes Market Forecast by Type, 2024-2034 (US$ Million, AGR%, CAGR %)
Table 79 MEA Pre-Filled Syringes Market Forecast by Material, 2024-2034 (US$ Million, AGR%, CAGR%)
Table 80 MEA Pre-Filled Syringes Market Forecast by Design, 2024-2034 (US$ Million, AGR%, CAGR%)
Table 81 MEA Pre-Filled Syringes Market Delivery, 2024-2034 (US$ Million, AGR%, CAGR%)
Table 82 MEA Pre-Filled Syringes Market by Application, 2024-2034 (US$ Million, AGR%, CAGR%)
Table 83 GCC Pre-Filled Syringes Market Forecast, 2024-2034 (US$ Million, AGR%, CAGR%)
Table 84 South Africa Pre-Filled Syringes Market Forecast, 2024-2034 (US$ Million, AGR%, CAGR%)
Table 85 Rest of MEA Pre-Filled Syringes Market Forecast, 2024-2034 (US$ Million, AGR%, CAGR %)
Table 86 Strategic Outlook
Table 87 Baxter International Inc.: Key Details, (CEO, HQ, Revenue, Founded, No. of Employees, Company Type, Website, Business Segment)
Table 88 Baxter International Inc.: Product Benchmarking
Table 89 Baxter International Inc.: Strategic Outlook
Table 90 BD : Key Details, (CEO, HQ, Revenue, Founded, No. of Employees, Company Type, Website, Business Segment)
Table 91 BD: Product Benchmarking
Table 92 BD. Strategic Outlook
Table 93 Biocon : Key Details, (CEO, HQ, Revenue, Founded, No. of Employees, Company Type, Website, Business Segment)
Table 94 Biocon: Product Benchmarking
Table 95 Biocon: Strategic Outlook
Table 96 Cardinal Health : Key Details, (CEO, HQ, Revenue, Founded, No. of Employees, Company Type, Website, Business Segment)
Table 97 Cardinal Health: Product Benchmarking
Table 98 Cardinal Health: Strategic Outlook
Table 99 Catalent, Inc: Key Details, (CEO, HQ, Revenue, Founded, No. of Employees, Company Type, Website, Business Segment)
Table 100 Catalent Inc: Product Benchmarking
Table 101 Catalent Inc: Strategic Outlook
Table 102 Datwyler Holding Inc: Key Details, (CEO, HQ, Revenue, Founded, No. of Employees, Company Type, Website, Business Segment)
Table 103 Datwyler Holding Inc: Product Benchmarking
Table 104 Datwyler Holding Inc: Strategic Outlook
Table 105 Debiotech S.A.: Key Details, (CEO, HQ, Revenue, Founded, No. of Employees, Company Type, Website, Business Segment)
Table 106 Debiotech SA: Product Benchmarking
Table 107 Debiotech SA: Strategic Outlook
Table 108 Elcam Medical: Key Details, (CEO, HQ, Revenue, Founded, No. of Employees, Company Type, Website, Business Segment)
Table 109 Elcam Medical: Product Benchmarking
Table 110 Fresenius Kabi AG: Key Details, (CEO, HQ, Revenue, Founded, No. of Employees, Company Type, Website, Business Segment)
Table 111 Fresenius Kabi AG: Product Benchmarking
Table 112 Fresenius Kabi AG: Strategic Outlook
Table 113 Gerresheimer AG: Key Details, (CEO, HQ, Revenue, Founded, No. of Employees, Company Type, Website, Business Segment)
Table 114 Gerresheimer AG: Product Benchmarking
Table 115 Gerresheimer AG: Strategic Outlook
Table 116 Micsafe Med (Jiangsu Micsafe Medical Technology Co., Ltd): Key Details, (CEO, HQ, Revenue, Founded, No. of Employees, Company Type, Website, Business Segment)
Table 117 Micsafe Med (Jiangsu Micsafe Medical Technology Co., Ltd).: Product Benchmarking
Table 118 MedXL Inc.: Key Details, (CEO, HQ, Revenue, Founded, No. of Employees, Company Type, Website, Business Segment)
Table 119 MedXL Inc.: Product Benchmarking
Table 120 MedXL Inc.: Strategic Outlook
Table 121 Nipro Medical Corporation: Key Details, (CEO, HQ, Revenue, Founded, No. of Employees, Company Type, Website, Business Segment)
Table 122 Nipro Medical Corporation: Product Benchmarking
Table 123 Nipro Medical Corporation.: Strategic Outlook
Table 124 Owen Mumford Ltd: Key Details, (CEO, HQ, Revenue, Founded, No. of Employees, Company Type, Website, Business Segment)
Table 125 Owen Mumford: Product Benchmarking
Table 126 Owen Mumford.: Strategic Outlook
Table 127 Scandinavian Health Limited (SHL) Group: Key Details, (CEO, HQ, Revenue, Founded, No. of Employees, Company Type, Website, Business Segment)
Table 128 Scandinavian Health Limited (SHL): Product Benchmarking
Table 129 Scandinavian Health Limited (SHL).: Strategic Outlook
Table 130 Schott AG: Key Details, (CEO, HQ, Revenue, Founded, No. of Employees, Company Type, Website, Business Segment)
Table 131 Schott AG: Product Benchmarking
Table 132 Schott AG: Strategic Outlook
Table 133 Stevanato Group: Key Details, (CEO, HQ, Revenue, Founded, No. of Employees, Company Type, Website, Business Segment)
Table 134 Stevanato Group: Product Benchmarking
Table 135 Stevanato Group: Strategic Outlook
Table 136 Terumo Corporation: Key Details, (CEO, HQ, Revenue, Founded, No. of Employees, Company Type, Website, Business Segment)
Table 137 Terumo Corporation: Product Benchmarking
Table 138 Terumo Corporation: Strategic Outlook
Table 139 Vetter Pharma: Key Details, (CEO, HQ, Revenue, Founded, No. of Employees, Company Type, Website, Business Segment)
Table 140 Vetter Pharma: Product Benchmarking
Table 141 West Pharmaceutical Services, Inc.: Key Details, (CEO, HQ, Revenue, Founded, No. of Employees, Company Type, Website, Business Segment)
Table 142 West Pharmaceutical Services, Inc.: Product Benchmarking
Table 143 West Pharmaceutical Services, Inc.: Strategic Outlook
図の一覧
Figure 1 Pre-Filled Syringes Market Segmentation
Figure 2 Pre-Filled Syringes Market by Type: Market Attractiveness Index
Figure 3 Pre-Filled Syringes Market by Material: Market Attractiveness Index
Figure 4 Pre-Filled Syringes Market by Design: Market Attractiveness Index
Figure 5 Pre-Filled Syringes Market by Delivery: Market Attractiveness Index
Figure 6 Pre-Filled Syringes Market by Application: Market Attractiveness Index
Figure 7 Pre-Filled Syringes Market Attractiveness Index by Region
Figure 8 Pre-Filled Syringes Market: Market Dynamics
Figure 9 Pre-Filled Syringes Market by Region, 2024-2034 (US$ Million, AGR %): “V” Shaped Recovery
Figure 10 Pre-Filled Syringes Market by Region, 2024-2034 (US$ Million, AGR %): “U” Shaped Recovery
Figure 11 Pre-Filled Syringes Market by Region, 2024-2034 (US$ Million, AGR %): “W” Shaped Recovery
Figure 12 Pre-Filled Syringes Market by Region, 2024-2034 (US$ Million, AGR %): “L” Shaped Recovery
Figure 13 Pre-filled Syringes Market: Porter’s Five Forces Analysis
Figure 14 Pre-Filled Syringes Market: PEST Analysis
Figure 15 Pre-Filled Syringes Market by Type: Market Attractiveness Index
Figure 16 Pre-Filled Syringes Market Forecast by Type, 2024-2034 (US$ Million, AGR %)
Figure 17 Pre-Filled Syringes Market Share Forecast by Type, 2024, 2029, 2034 (%)
Figure 18 Conventional Segment Market Forecast by Region, 2024-2034 (US$ Million, AGR %)
Figure 19 Conventional Segment Market Share Forecast by Region, 2024 & 2034 (%)
Figure 20 Safety Segment Market Forecast by Region, 2024-2034 (US$ Million, AGR %)
Figure 21 Safety Segment Market Share Forecast by Region, 2024 & 2034 (%)
Figure 22 Pre-Filled Syringes Market by Material: Market Attractiveness Index
Figure 23 Pre-Filled Syringes Market Forecast by Material, 2024-2034 (US$ Million, AGR %)
Figure 24 Pre-Filled Syringes Market Share Forecast by Material, 2024, 2029, 2034 (%)
Figure 25 Glass Segment Market Forecast by Region, 2024-2034 (US$ Million, AGR %)
Figure 26 Glass Segment Market Share Forecast by Region, 2024 & 2034 (%)
Figure 27 Plastic Segment Market Forecast by Region, 2024-2034 (US$ Million, AGR %)
Figure 28 Plastic Segment Market Share Forecast by Region, 2024 & 2034 (%)
Figure 29 Stainless Steel Segment Market Forecast by Region, 2024-2034 (US$ Million, AGR %)
Figure 30 Stainless Steel Segment Market Share Forecast by Region, 2024 & 2034 (%)
Figure 31 Elastomer Segment Market Forecast by Region, 2024-2034 (US$ Million, AGR %)
Figure 32 Elastomer Segment Market Share Forecast by Region, 2024 & 2034 (%)
Figure 33 Pre-Filled Syringes Market by Design: Market Attractiveness Index
Figure 34 Pre-Filled Syringes Market Forecast by Design, 2024-2034 (US$ Million, AGR %)
Figure 35 Pre-Filled Syringes Market Share Forecast by Design, 2024, 2029, 2034 (%)
Figure 36 Single-chamber Segment Market Forecast by Region, 2024-2034 (US$ Million, AGR %)
Figure 37 Single-chamber Segment Market Share Forecast by Region, 2024 & 2034 (%)
Figure 38 Dual-chamber Segment Market Forecast by Region, 2024-2034 (US$ Million, AGR %)
Figure 39 Dual-chamber Segment Market Share Forecast by Region, 2024 & 2034 (%)
Figure 40 Customized Segment Market Forecast by Region, 2024-2034 (US$ Million, AGR %)
Figure 41 Customized Segment Market Share Forecast by Region, 2024 & 2034 (%)
Figure 42 Pre-Filled Syringes Market by Delivery: Market Attractiveness Index
Figure 43 Pre-Filled Syringes Market Forecast by Delivery, 2024-2034 (US$ Million, AGR %)
Figure 44 Pre-Filled Syringes Market Share Forecast by Delivery, 2024, 2029, 2034 (%)
Figure 45 Intravenous Segment Market Forecast by Region, 2024-2034 (US$ Million, AGR %)
Figure 46 Pharmacies Segment Market Share Forecast by Region, 2024 & 2034 (%)
Figure 47 Subcutaneous Market Forecast by Region, 2024-2034 (US$ Million, AGR %)
Figure 48 Subcutaneous Market Share Forecast by Region, 2024 & 2034 (%)
Figure 49 Intramuscular Segment Market Forecast by Region, 2024-2034 (US$ Million, AGR %)
Figure 50 Intramuscular Segment Market Share Forecast by Region, 2024 & 2034 (%)
Figure 51 Others Market Forecast by Region, 2024-2034 (US$ Million, AGR %)
Figure 52 Others Market Share Forecast by Region, 2024 & 2034 (%)
Figure 53 Pre-Filled Syringes Market by Application: Market Attractiveness Index
Figure 54 Pre-Filled Syringes Market Forecast by Application, 2024-2034 (US$ Million, AGR %)
Figure 55 Pre-Filled Syringes Market Share Forecast by Application, 2024, 2029, 2034 (%)
Figure 56 Diabetes Segment Market Forecast by Region, 2024-2034 (US$ Million, AGR %)
Figure 57 Diabetes Segment Market Share Forecast by Region, 2024 & 2034 (%)
Figure 58 Rheumatoid Arthritis Market Forecast by Region, 2024-2034 (US$ Million, AGR %)
Figure 59 Rheumatoid Arthritis Market Share Forecast by Region, 2024 & 2034 (%)
Figure 60 Anaphylaxis Segment Market Forecast by Region, 2024-2034 (US$ Million, AGR %)
Figure 61 Anaphylaxis Segment Market Share Forecast by Region, 2024 & 2034 (%)
Figure 62 Other Market Forecast by Region, 2024-2034 (US$ Million, AGR %)
Figure 63 Other Market Share Forecast by Region, 2024 & 2034 (%)
Figure 64 Pre-Filled Syringes Market Forecast by Region 2023 and 2033 (Revenue, CAGR %)
Figure 65 Pre-Filled Syringes Market Share Forecast by Region 2024, 2029, 2034 (%)
Figure 66 Pre-Filled Syringes Market by Region, 2024-2034 (US$ Million, AGR %)
Figure 67 North America Pre-Filled Syringes Market Attractiveness Index
Figure 68 North America Pre-Filled Syringes Market by Region, 2024, 2029 & 2034 (US$ Million)
Figure 69 North America Pre-Filled Syringes Market Forecast by Country, 2024-2034 (US$ Million, AGR %)
Figure 70 North America Pre-Filled Syringes Market Share Forecast by Country, 2024 & 2034 (%)
Figure 71 North America Pre-Filled Syringes Market Forecast by Type, 2024-2034 (US$ Million, AGR %)
Figure 72 North America Pre-Filled Syringes Market Share Forecast by Type, 2024 & 2034 (%)
Figure 73 North America Pre-Filled Syringes Market Forecast by Material, 2024-2034 (US$ Million, AGR %)
Figure 74 North America Pre-Filled Syringes Market Share Forecast by Material, 2024 & 2034 (%)
Figure 75 North America Pre-Filled Syringes Market Forecast by Design, 2024-2034 (US$ Million, AGR %)
Figure 76 North America Pre-Filled Syringes Market Share Forecast by Design, 2024 & 2034 (%)
Figure 77 North America Pre-Filled Syringes Market Forecast by Delivery, 2024-2034 (US$ Million, AGR %)
Figure 78 North America Pre-Filled Syringes Market Share Forecast by Delivery, 2024 & 2034 (%)
Figure 79 North America Pre-Filled Syringes Market Forecast by Application, 2024-2034 (US$ Million, AGR %)
Figure 80 North America Pre-Filled Syringes Market Share Forecast by Application, 2024 & 2034 (%)
Figure 81 U.S. Pre-Filled Syringes Market Forecast, 2024-2034 (US$ Million, AGR %)
Figure 82 Canada Pre-Filled Syringes Market Forecast, 2024-2034 (US$ Million, AGR %)
Figure 83 Europe Pre-Filled Syringes Market Attractiveness Index
Figure 84 Europe Pre-Filled Syringes Market by Region, 2024, 2029 & 2034 (US$ Million)
Figure 85 Europe Pre-Filled Syringes Market Forecast by Country, 2024-2034 (US$ Million, AGR %)
Figure 86 Europe Pre-Filled Syringes Market Share Forecast by Country, 2024 & 2034 (%)
Figure 87 Europe Pre-Filled Syringes Market Forecast by Type, 2024-2034 (US$ Million, AGR %)
Figure 88 Europe Pre-Filled Syringes Market Share Forecast by Type, 2024 & 2034 (%)
Figure 89 Europe Pre-Filled Syringes Market Forecast by Material, 2024-2034 (US$ Million, AGR %)
Figure 90 Europe Pre-Filled Syringes Market Share Forecast by Material, 2024 & 2034 (%)
Figure 91 Europe Pre-Filled Syringes Market Forecast by Design, 2024-2034 (US$ Million, AGR %)
Figure 92 Europe Pre-Filled Syringes Market Share Forecast by Design, 2024 & 2034 (%)
Figure 93 Europe Pre-Filled Syringes Market Forecast by Delivery, 2024-2034 (US$ Million, AGR %)
Figure 94 Europe Pre-Filled Syringes Market Share Forecast by Delivery, 2024 & 2034 (%)
Figure 95 Europe Pre-Filled Syringes Market Forecast by Application, 2024-2034 (US$ Million, AGR %)
Figure 96 Europe Pre-Filled Syringes Market Share Forecast by Application, 2024 & 2034 (%)
Figure 97 Germany Pre-Filled Syringes Market Forecast, 2024-2034 (US$ Million, AGR %)
Figure 98 France Pre-Filled Syringes Market Forecast, 2024-2034 (US$ Million, AGR %)
Figure 99 UK Pre-Filled Syringes Market Forecast, 2024-2034 (US$ Million, AGR %)
Figure 100 Italy Pre-Filled Syringes Market Forecast, 2024-2034 (US$ Million, AGR %)
Figure 101 Spain Pre-Filled Syringes Market Forecast, 2024-2034 (US$ Million, AGR %)
Figure 102 Russia Pre-Filled Syringes Market Forecast, 2024-2034 (US$ Million, AGR %)
Figure 103 Poland Pre-Filled Syringes Market Forecast, 2024-2034 (US$ Million, AGR %)
Figure 104 Belgium Pre-Filled Syringes Market Forecast, 2024-2034 (US$ Million, AGR %)
Figure 105 Rest of Europe Pre-Filled Syringes Market Forecast, 2024-2034 (US$ Million, AGR %)
Figure 106 Asia Pacific Pre-Filled Syringes Market Attractiveness Index
Figure 107 Asia Pacific Pre-Filled Syringes Market by Region, 2024, 2029 & 2034 (US$ Million)
Figure 108 Asia Pacific Pre-Filled Syringes Market Forecast by Country, 2024-2034 (US$ Million, AGR %)
Figure 109 Asia Pacific Pre-Filled Syringes Market Share Forecast by Country, 2024 & 2034 (%)
Figure 110 Asia Pacific Pre-Filled Syringes Market Forecast by Type, 2024-2034 (US$ Million, AGR %)
Figure 111 Asia Pacific Pre-Filled Syringes Market Share Forecast by Type, 2024 & 2034 (%)
Figure 112 Asia Pacific Pre-Filled Syringes Market Forecast by Material, 2024-2034 (US$ Million, AGR %)
Figure 113 Asia Pacific Pre-Filled Syringes Market Share Forecast by Material, 2024 & 2034 (%)
Figure 114 Asia Pacific Pre-Filled Syringes Market Forecast by Design, 2024-2034 (US$ Million, AGR %)
Figure 115 Asia Pacific Pre-Filled Syringes Market Share Forecast by Design, 2024 & 2034 (%)
Figure 116 Asia Pacific Pre-Filled Syringes Market Forecast by Delivery, 2024-2034 (US$ Million, AGR %)
Figure 117 Asia Pacific Pre-Filled Syringes Market Share Forecast by Delivery, 2024 & 2034 (%)
Figure 118 Asia Pacific Pre-Filled Syringes Market Forecast by Application, 2024-2034 (US$ Million, AGR %)
Figure 119 Asia Pacific Pre-Filled Syringes Market Share Forecast by Application, 2024 & 2034 (%)
Figure 120 Japan Pre-Filled Syringes Market Forecast, 2024-2034 (US$ Million, AGR %)
Figure 121 China Pre-Filled Syringes Market Forecast, 2024-2034 (US$ Million, AGR %)
Figure 122 India Pre-Filled Syringes Market Forecast, 2024-2034 (US$ Million, AGR %)
Figure 123 Australia Pre-Filled Syringes Market Forecast, 2024-2034 (US$ Million, AGR %)
Figure 124 South Korea Pre-Filled Syringes Market Forecast, 2024-2034 (US$ Million, AGR %)
Figure 125 Singapore Pre-Filled Syringes Market Forecast, 2024-2034 (US$ Million, AGR %)
Figure 126 Taiwan Pre-Filled Syringes Market Forecast, 2024-2034 (US$ Million, AGR %)
Figure 127 Rest of Asia Pacific Pre-Filled Syringes Market Forecast, 2024-2034 (US$ Million, AGR %)
Figure 128 Latin America Pre-Filled Syringes Market Attractiveness Index
Figure 129 Latin America Pre-Filled Syringes Market by Region, 2024, 2029 & 2034 (US$ Million)
Figure 130 Latin America Pre-Filled Syringes Market Forecast by Country, 2024-2034 (US$ Million, AGR %)
Figure 131 Latin America Pre-Filled Syringes Market Share Forecast by Country, 2024 & 2034 (%)
Figure 132 Latin America Pre-Filled Syringes Market Forecast by Type, 2024-2034 (US$ Million, AGR %)
Figure 133 Latin America Pre-filled syringes Market Share Forecast by Type, 2024 & 2034 (%)
Figure 134 Latin America Pre-Filled Syringes Market Forecast by Material, 2024-2034 (US$ Million, AGR %)
Figure 135 Latin America Pre-Filled Syringes Market Share Forecast by Material, 2024 & 2034 (%)
Figure 136 Latin America Pre-Filled Syringes Market Forecast by Design, 2024-2034 (US$ Million, AGR %)
Figure 137 Latin America Pre-Filled Syringes Market Share Forecast by Design, 2024 & 2034 (%)
Figure 138 Latin America Pre-Filled Syringes Market Forecast by Delivery, 2024-2034 (US$ Million, AGR %)
Figure 139 Latin America Pre-Filled Syringes Market Share Forecast by Delivery, 2024 & 2034 (%)
Figure 140 Latin America Pre-Filled Syringes Market Forecast by Application, 2024-2034 (US$ Million, AGR %)
Figure 141 Latin America Pre-Filled Syringes Market Share Forecast by Application, 2024 & 2034 (%)
Figure 142 Brazil Pre-Filled Syringes Market Forecast, 2024-2034 (US$ Million, AGR %)
Figure 143 Mexico Pre-Filled Syringes Market Forecast, 2024-2034 (US$ Million, AGR %)
Figure 144 Argentina Pre-Filled Syringes Market Forecast, 2024-2034 (US$ Million, AGR %)
Figure 145 Colombia Pre-Filled Syringes Market Forecast, 2024-2034 (US$ Million, AGR %)
Figure 146 Rest of Latin America Pre-Filled Syringes Market Forecast, 2024-2034 (US$ Million, AGR %)
Figure 147 MEA Pre-Filled Syringes Market Attractiveness Index
Figure 148 MEA Pre-Filled Syringes Market by Region, 2024, 2029 & 2034 (US$ Million)
Figure 149 MEA Pre-Filled Syringes Market Forecast by Country, 2024-2034 (US$ Million, AGR %)
Figure 150 MEA Pre-Filled Syringes Market Share Forecast by Country, 2024 & 2034 (%)
Figure 151 MEA Pre-Filled Syringes Market Forecast by Type, 2024-2034 (US$ Million, AGR %)
Figure 152 MEA Pre-Filled Syringes Market Share Forecast by Type, 2024 & 2034 (%)
Figure 153 MEA Pre-Filled Syringes Market Forecast by Material, 2024-2034 (US$ Million, AGR %)
Figure 154 MEA Pre-Filled Syringes Market Share Forecast by Material, 2024 & 2034 (%)
Figure 155 MEA Pre-Filled Syringes Market Forecast by Design, 2024-2034 (US$ Million, AGR %)
Figure 156 MEA Pre-Filled Syringes Market Share Forecast by Design, 2024 & 2034 (%)
Figure 157 MEA Pre-Filled Syringes Market Forecast by Delivery, 2024-2034 (US$ Million, AGR %)
Figure 158 MEA Pre-Filled Syringes Market Share Forecast by Delivery, 2024 & 2034 (%)
Figure 159 MEA Pre-Filled Syringes Market Forecast by Application, 2024-2034 (US$ Million, AGR %)
Figure 160 MEA Pre-Filled Syringes Market Share Forecast by Application, 2024 & 2034 (%)
Figure 161 GCC Pre-Filled Syringes Market Forecast, 2024-2034 (US$ Million, AGR %)
Figure 162 South Africa Pre-Filled Syringes Market Forecast, 2024-2034 (US$ Million, AGR %)
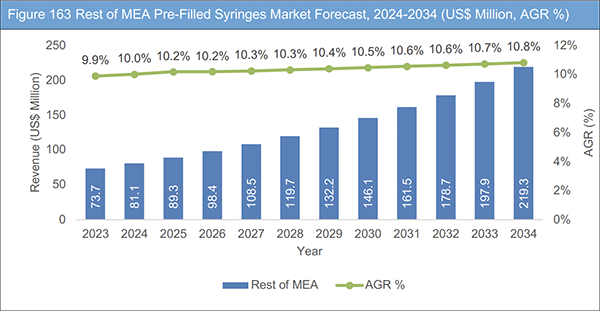
Figure 163 Rest of MEA Pre-Filled Syringes Market Forecast, 2024-2034 (US$ Million, AGR %)
Figure 164 Pre-Filled Syringes Market Company Share, 2022
Figure 165 Baxter International Inc.: Net Revenue, 2017-2022 (US$ Million, AGR%)
Figure 166 Baxter International Inc.: R&D, 2017-2022 (US$ Million, AGR%)
Figure 167 Baxter International Inc.: Regional Market Shares, 2022
Figure 168 BD: Net Revenue, 2017-2023 (US$ Million, AGR%)
Figure 169 BD: R&D, 2017-2023 (US$ Million, AGR%)
Figure 170 BD: Regional Market Shares, 2023
Figure 171 Biocon: Net Revenue, 2017-2023 (US$ Million, AGR%)
Figure 172 Biocon: R&D, 2017-2023 (US$ Million, AGR%)
Figure 173 Biocon: Regional Market Shares, 2023
Figure 174 Cardinal Health: Net Revenue, 2017-2023 (US$ Million, AGR%)
Figure 175 Cardinal Health: Regional Market Shares, 2022
Figure 176 Catalent Inc: Net Revenue, 2017-2023 (US$ Million, AGR%)
Figure 177 Catalent Inc: R&D, 2017-2023 (US$ Million, AGR%)
Figure 178 Datwyler Holding Inc: Net Revenue, 2017-2022 (US$ Million, AGR%)
Figure 179 Datwyler Holding Inc: R&D, 2017-2022 (US$ Million, AGR%)
Figure 180 Datwyler Holding Inc: Regional Market Shares, 2022
Figure 181 Fresenius Kabi AG: Net Revenue, 2017-2022 (US$ Million, AGR%)
Figure 182 Fresenius Kabi AG: R&D, 2017-2022 (US$ Million, AGR%)
Figure 183 Fresenius Kabi AG: Regional Market Shares, 2022
Figure 184 Gerresheimer AG: Net Revenue, 2017-2022 (US$ Million, AGR%)
Figure 185 Gerresheimer AG: R&D, 2017-2022 (US$ Million, AGR%)
Figure 186 Gerresheimer AG: Regional Market Shares, 2022
Figure 187 Nipro Medical Corporation: Net Revenue, 2017-2022 (US$ Million, AGR%)
Figure 188 Nipro Medical Corporation: R&D, 2017-2022 (US$ Million, AGR%)
Figure 189 Nipro Medical Corporation: Regional Market Shares, 2022
Figure 190 Schott AG: Net Revenue, 2020-2022 (US$ Million, AGR%)
Figure 191 Schott AG: R&D, 2020-2022 (US$ Million, AGR%)
Figure 192 Schott AG: Regional Market Shares, 2023
Figure 193 Stevanato Group: Net Revenue, 2020-2022 (US$ Million, AGR%)
Figure 194 Stevanato Group: R&D, 2020-2022 (US$ Million, AGR%)
Figure 195 Terumo Corporation: Net Revenue, 2017-2023 (US$ Million, AGR%)
Figure 196 Terumo Corporation: R&D, 2017-2023 (US$ Million, AGR%)
Figure 197 Terumo Corporation: Regional Market Shares, 2022
Figure 198 West Pharmaceutical Services, Inc.: Net Revenue, 2017-2022 (US$ Million, AGR%)
Figure 199 West Pharmaceutical Services, Inc.: R&D, 2017-2022 (US$ Million, AGR%)
Figure 200 West Pharmaceutical Services, Inc.: Regional Market Shares, 2022
ページTOPに戻る
Summary
Report Details
The Pre-Filled Syringes Market Report 2024-2034: This report will prove invaluable to leading firms striving for new revenue pockets if they wish to better understand the industry and its underlying dynamics. It will be useful for companies that would like to expand into different industries or to expand their existing operations in a new region.
Technological Advancements in Pre-filled Injectors
Pre-filled injectors find application primarily in hospital emergency departments and for managing specific chronic conditions. These drugs are often used to treat chronic conditions such as rheumatoid arthritis, diabetes, cancer, and autoimmune disorders. This trend will contribute to market growth during the forecast period include the increasing demand for biotechnology drugs presenting expanded opportunities for biotech industry growth. The advanced therapies, often requiring precise dosing and stringent safety measures, find an ideal match in prefilled syringes. These syringes offer convenience, accuracy, and sterility, ensuring patients receive the correct dosage with reduced risk of contamination. With the rising demand for biologics to manage chronic conditions, prefilled syringes emerge as a preferred delivery method, enhancing patient adherence and treatment outcomes while minimizing waste and improving overall healthcare efficiency.
Increase in Patient Convenience and Compliance
Patient convenience and compliance play crucial roles in driving adoption and usage of prefilled syringes. Prefilled syringes offer significant advantages over traditional vials and ampoules, particularly in terms of convenience and ease of use for patients. With prefilled syringes, patients can avoid the need for manual drawing of medication, reducing preparation time and simplifying administration. This streamlined process not only enhances convenience but also encourages patient compliance with prescribed treatment regimens. By eliminating potential barriers to adherence, such as complicated dosing procedures or fear of needle handling, prefilled syringes contribute to better treatment outcomes and improved patient satisfaction. Overall, the focus on patient convenience and compliance serves as a key driver in the continued growth and adoption of prefilled syringes in healthcare settings.
What Questions Should You Ask before Buying a Market Research Report?
-
How is the Pre-Filled Syringes Market evolving?
-
What is driving and restraining the Pre-Filled Syringes Market?
-
How will each Pre-Filled Syringes submarket segment grow over the forecast period and how much revenue will these submarkets account for in 2034?
-
How will the market shares for each Pre-Filled Syringes submarket develop from 2024 to 2034?
-
What will be the main driver for the overall market from 2024 to 2034?
-
Will leading Pre-Filled Syringes Markets broadly follow the macroeconomic dynamics, or will individual national markets outperform others?
-
How will the market shares of the national markets change by 2034 and which geographical region will lead the market in 2034?
-
Who are the leading players and what are their prospects over the forecast period?
-
What are the Pre-Filled Syringes projects for these leading companies?
-
How will the industry evolve during the period between 2024 and 2034? What are the implications of Pre-Filled Syringes projects taking place now and over the next 10 years?
-
Is there a greater need for product commercialisation to further scale the Pre-Filled Syringes Market?
-
Where is the Pre-Filled Syringes Market heading and how can you ensure you are at the forefront of the market?
-
What are the best investment options for new product and service lines?
-
What are the key prospects for moving companies into a new growth path and C-suite?
You need to discover how this will impact the Pre-Filled Syringes Market today, and over the next 10 years:
-
Our 329-page report provides 143 tables and 200 charts/graphs exclusively to you.
-
The report highlights key lucrative areas in the industry so you can target them – NOW.
-
It contains in-depth analysis of global, regional and national sales and growth.
-
It highlights for you the key successful trends, changes and revenue projections made by your competitors.
This report tells you TODAY how the Pre-Filled Syringes Market will develop in the next 10 years, and in line with the variations in COVID-19 economic recession and bounce. This market is more critical now than at any point over the last 10 years.
Forecasts to 2034 and other analyses reveal commercial prospects
-
In addition to revenue forecasting to 2034, our new study provides you with recent results, growth rates, and market shares.
-
You will find original analyses, with business outlooks and developments.
-
Discover qualitative analyses (including market dynamics, drivers, opportunities, restraints and challenges), cost structure, impact of rising Pre-Filled Syringes prices and recent developments.
This report includes data analysis and invaluable insight into how COVID-19 will affect the industry and your company. Four COVID-19 recovery patterns and their impact, namely, “V”, “L”, “W” and “U” are discussed in this report.
Segments Covered in the Report
By Type
By Material
-
Glass
-
Plastic
-
Stainless Steel
-
Elastomer
By Design
-
Single-chamber
-
Dual-chamber
-
Customized
By Delivery
-
Intravenous
-
Subcutaneous
-
Intramuscular
-
Others
By Application
-
Diabetes
-
Rheumatoid Arthritis
-
Anaphylaxis
-
Others
In addition to the revenue predictions for the overall world market and segments, you will also find revenue forecasts for four regional and 28 leading national markets:
North America
Europe
-
Germany
-
UK
-
France
-
Spain
-
Italy
-
Russia
-
Poland
-
Belgium
-
Rest of Europe
Asia Pacific
-
China
-
Japan
-
India
-
Australia
-
South Korea
-
Singapore
-
Taiwan
-
Rest of Asia Pacific
Latin America
-
Brazil
-
Mexico
-
Colombia
-
Argentina
-
Rest of Latin America
MEA
-
GCC
-
South Africa
-
Rest of MEA
The report also includes profiles and for some of the leading companies in the Pre-Filled Syringes Market, 2024 to 2034, with a focus on this segment of these companies’ operations.
Leading companies profiled in the report
-
Baxter International Inc.
-
BD
-
Biocon
-
Cardinal Health
-
Catalent, Inc.
-
Datwyler Holding Inc.
-
Debiotech S.A.
-
Elcam Medical
-
Fresenius Kabi AG
-
Gerresheimer AG
-
Jiangsu Micsafe Medical Technology Co., Ltd
-
MedXL Inc
-
Nipro Medical Corporation
-
Owen Mumford Ltd
-
Scandinavian Health Limited (SHL) Group
-
Schott AG
-
Stevanato Group
-
Terumo Corporation
-
Vetter Pharma
-
West Pharmaceutical Services, Inc.
Overall world revenue for Pre-Filled Syringes Market, 2024 to 2034 in terms of value the market will surpass US$5,000.0 million in 2024, our work calculates. We predict strong revenue growth through to 2034. Our work identifies which organizations hold the greatest potential. Discover their capabilities, progress, and commercial prospects, helping you stay ahead.
How will the Pre-Filled Syringes Market, 2024 to 2034 report help you?
In summary, our 320+ page report provides you with the following knowledge:
-
Revenue forecasts to 2034 for Pre-Filled Syringes Market, 2024 to 2034, with forecasts for material, design, type, delivery and application, each forecast at a global and regional level – discover the industry’s prospects, finding the most lucrative places for investments and revenues.
-
Revenue forecasts to 2034 for five regional and 27 key national markets – See forecasts for the Pre-Filled Syringes Market, 2024 to 2034 market in North America, Europe, Asia-Pacific, Latin America, and MEA. Also forecasted is the market in the US, Canada, Mexico, Brazil, Germany, France, UK, Italy, China, India, Japan, and Australia among other prominent economies.
-
Prospects for established firms and those seeking to enter the market – including company profiles for 20 of the major companies involved in the Pre-Filled Syringes Market, 2024 to 2034.
Find quantitative and qualitative analyses with independent predictions. Receive information that only our report contains, staying informed with invaluable business intelligence.
Information found nowhere else
With our new report, you are less likely to fall behind in knowledge or miss out on opportunities. See how our work could benefit your research, analyses, and decisions. Visiongain’s study is for everybody needing commercial analyses for the Pre-Filled Syringes Market, 2024 to 2034, market-leading companies. You will find data, trends and predictions.
ページTOPに戻る
Table of Contents
Table of Contents
1 Report Overview
1.1 Objectives of the Study
1.2 Introduction to Pre-Filled Syringes Market
1.3 What This Report Delivers
1.4 Why You Should Read This Report
1.5 Key Questions Answered by This Analytical Report
1.6 Who is This Report for?
1.7 Methodology
1.7.1 Market Definitions
1.7.2 Market Evaluation & Forecasting Methodology
1.7.3 Data Validation
1.7.3.1 Primary Research
1.7.3.2 Secondary Research
1.8 Frequently Asked Questions (FAQs)
1.9 Associated Visiongain Reports
1.10 About Visiongain
2 Executive Summary
3 Market Overview
3.1 Key Findings
3.2 Market Dynamics
3.2.1 Market Driving Factors
3.2.1.1 Emerging Movement Towards Home-based Healthcare
3.2.1.2 Rising Uptake of Injectable Medications
3.2.1.3 Innovative Solutions Addressing the Escalating Need for Pre-Filled Syringes
3.2.2 Market Restraining Factors
3.2.2.1 Challenges in the Manufacturing Process
3.2.2.2 Presence of Alternative Drug Administration Techniques
3.2.2.3 Sterilization Difficulties and the Presence of More Economical Alternatives
3.2.3 Market Opportunities
3.2.3.1 Expansion of Biologicals and Biosimilars
3.2.3.2 Surge in the Need for Pre-Filled Injectable Drugs
3.2.3.3 Favourable Opportunities in Biotech Industry
3.3 COVID-19 Impact Analysis
3.4 Porter’s Five Forces Analysis
3.4.1 Bargaining Power of Suppliers
3.4.2 Bargaining Power of Buyers
3.4.3 Competitive Rivalry
3.4.4 Threat from Substitutes
3.4.5 Threat of New Entrants
3.5 PEST Analysis
4 Pre-Filled Syringes Market Analysis by Type
4.1 Key Findings
4.2 Type Segment: Market Attractiveness Index
4.3 Pre-Filled Syringes Market Size Estimation and Forecast by Type
4.4 Conventional
4.4.1 Market Size by Region, 2024-2034 (US$ Million)
4.4.2 Market Share by Region, 2024 & 2034 (%)
4.5 Safety
4.5.1 Market Size by Region, 2024-2034 (US$ Million)
4.5.2 Market Share by Region, 2024 & 2034 (%)
5 Pre-Filled Syringes Market Analysis by Material
5.1 Key Findings
5.2 Material Segment: Market Attractiveness Index
5.3 Pre-Filled Syringes Market Size Estimation and Forecast by Material
5.4 Glass
5.4.1 Market Size by Region, 2024-2034 (US$ Million)
5.4.2 Market Share by Region, 2024 & 2034 (%)
5.5 Plastic
5.5.1 Market Size by Region, 2024-2034 (US$ Million)
5.5.2 Market Share by Region, 2024 & 2034 (%)
5.6 Stainless Steel
5.6.1 Market Size by Region, 2024-2034 (US$ Million)
5.6.2 Market Share by Region, 2024 & 2034 (%)
5.7 Elastomer
5.7.1 Market Size by Region, 2024-2034 (US$ Million)
5.7.2 Market Share by Region, 2024 & 2034 (%)
6 Pre-Filled Syringes Market Analysis by Design
6.1 Design Segment: Market Attractiveness Index
6.2 Pre-Filled Syringes Market Size Estimation and Forecast by Design
6.3 Single-chamber
6.3.1 Market Size by Region, 2024-2034 (US$ Million)
6.3.2 Market Share by Region, 2024 & 2034 (%)
6.4 Dual-chamber
6.4.1 Market Size by Region, 2024-2034 (US$ Million)
6.4.2 Market Share by Region, 2024 & 2034 (%)
6.5 Customized
6.5.1 Market Size by Region, 2024-2034 (US$ Million)
6.5.2 Market Share by Region, 2024 & 2034 (%)
7 Pre-Filled Syringes Market Analysis by Delivery
7.1 Key Findings
7.2 Delivery Segment: Market Attractiveness Index
7.3 Pre-Filled Syringes Market Size Estimation and Forecast by Delivery
7.4 Intravenous
7.4.1 Market Size by Region, 2024-2034 (US$ Million)
7.4.2 Market Share by Region, 2024 & 2034 (%)
7.5 Subcutaneous
7.5.1 Market Size by Region, 2024-2034 (US$ Million)
7.5.2 Market Share by Region, 2024 & 2034 (%)
7.6 Intramuscular
7.6.1 Market Size by Region, 2024-2034 (US$ Million)
7.6.2 Market Share by Region, 2024 & 2034 (%)
7.7 Others
7.7.1 Market Size by Region, 2024-2034 (US$ Million)
7.7.2 Market Share by Region, 2024 & 2034 (%)
8 Pre-Filled Syringes Market Analysis by Application
8.1 Key Findings
8.2 Application Segment: Market Attractiveness Index
8.3 Pre-Filled Syringes Market Size Estimation and Forecast by Application
8.4 Diabetes
8.4.1 Market Size by Region, 2024-2034 (US$ Million)
8.4.2 Market Share by Region, 2024 & 2034 (%)
8.5 Rheumatoid Arthritis
8.5.1 Market Size by Region, 2024-2034 (US$ Million)
8.5.2 Market Share by Region, 2024 & 2034 (%)
8.6 Anaphylaxis
8.6.1 Market Size by Region, 2024-2034 (US$ Million)
8.6.2 Market Share by Region, 2024 & 2034 (%)
8.7 Other
8.7.1 Market Size by Region, 2024-2034 (US$ Million)
8.7.2 Market Share by Region, 2024 & 2034 (%)
9 Pre-Filled Syringes Market Analysis by Region
9.1 Key Findings
9.2 Regional Market Size Estimation and Forecast
10 North America Pre-Filled Syringes Market Analysis
10.1 Key Findings
10.2 North America Pre-Filled Syringes Market Attractiveness Index
10.3 North America Pre-Filled Syringes Market by Country, 2024, 2029 & 2034 (US$ Million)
10.4 North America Pre-Filled Syringes Market Size Estimation and Forecast by Country
10.5 North America Pre-Filled Syringes Market Size Estimation and Forecast by Type
10.6 North America Pre-Filled Syringes Market Size Estimation and Forecast by Material
10.7 North America Pre-Filled Syringes Market Size Estimation and Forecast by Design
10.8 North America Pre-Filled Syringes Market Size Estimation and Forecast by Delivery
10.9 North America Pre-Filled Syringes Market Size Estimation and Forecast by Application
10.10 U.S. Pre-Filled Syringes Market Analysis
10.11 Canada Pre-Filled Syringes Market Analysis
11 Europe Pre-Filled Syringes Market Analysis
11.1 Key Findings
11.2 Europe Pre-Filled Syringes Market Attractiveness Index
11.3 Europe Pre-Filled Syringes Market by Country, 2024, 2029 & 2034 (US$ Million)
11.4 Europe Pre-Filled Syringes Market Size Estimation and Forecast by Country
11.5 Europe Pre-Filled Syringes Market Size Estimation and Forecast by Type
11.6 Europe Pre-Filled Syringes Market Size Estimation and Forecast by Material
11.7 Europe Pre-Filled Syringes Market Size Estimation and Forecast by Design
11.8 Europe Pre-Filled Syringes Market Size Estimation and Forecast by Delivery
11.9 Europe Pre-Filled Syringes Market Size Estimation and Forecast by Application
11.10 Germany Pre-Filled Syringes Market Analysis
11.11 France Pre-Filled Syringes Market Analysis
11.12 UK Pre-Filled Syringes Market Analysis
11.13 Italy Pre-Filled Syringes Market Analysis
11.14 Spain Pre-Filled Syringes Market Analysis
11.15 Russia Pre-Filled Syringes Market Analysis
11.16 Poland Pre-Filled Syringes Market Analysis
11.17 Belgium Pre-Filled Syringes Market Analysis
11.18 Rest of Europe Pre-Filled Syringes Market Analysis
12 Asia Pacific Pre-Filled Syringes Market Analysis
12.1 Key Findings
12.2 Asia Pacific Pre-Filled Syringes Market Attractiveness Index
12.3 Asia Pacific Pre-Filled Syringes Market by Country, 2024, 2029 & 2034 (US$ Million)
12.4 Asia Pacific Pre-Filled Syringes Market Size Estimation and Forecast by Country
12.5 Asia Pacific Pre-Filled Syringes Market Size Estimation and Forecast by Type
12.6 Asia Pacific Pre-Filled Syringes Market Size Estimation and Forecast by Material
12.7 Asia Pacific Pre-Filled Syringes Market Size Estimation and Forecast by Design
12.8 Asia Pacific Pre-Filled Syringes Market Size Estimation and Forecast by Delivery
12.9 Asia Pacific Pre-Filled Syringes Market Size Estimation and Forecast by Application
12.10 Japan Pre-Filled Syringes Market Analysis
12.11 China Pre-Filled Syringes Market Analysis
12.12 India Pre-Filled Syringes Market Analysis
12.13 Australia Pre-Filled Syringes Market Analysis
12.14 South Korea Pre-Filled Syringes Market Analysis
12.15 Singapore Pre-Filled Syringes Market Analysis
12.16 Taiwan Pre-Filled Syringes Market Analysis
12.17 Rest of Asia Pacific Pre-Filled Syringes Market Analysis
13 Latin America Pre-Filled Syringes Market Analysis
13.1 Key Findings
13.2 Latin America Pre-Filled Syringes Market Attractiveness Index
13.3 Latin America Pre-Filled Syringes Market by Country, 2024, 2029 & 2034 (US$ Million)
13.4 Latin America Pre-Filled Syringes Market Size Estimation and Forecast by Country
13.5 Latin America Pre-Filled Syringes Market Size Estimation and Forecast by Type
13.6 Latin America Pre-Filled Syringes Market Size Estimation and Forecast by Material
13.7 Latin America Pre-Filled Syringes Market Size Estimation and Forecast by Design
13.8 Latin America Pre-Filled Syringes Market Size Estimation and Forecast by Delivery
13.9 Latin America Pre-Filled Syringes Market Size Estimation and Forecast by Application
13.10 Brazil Pre-Filled Syringes Market Analysis
13.11 Mexico Pre-Filled Syringes Market Analysis
13.12 Argentina Pre-Filled Syringes Market Analysis
13.13 Colombia Pre-Filled Syringes Market Analysis
13.14 Rest of Latin America Pre-Filled Syringes Market Analysis
14 MEA Pre-Filled Syringes Market Analysis
14.1 Key Findings
14.2 MEA Pre-Filled Syringes Market Attractiveness Index
14.3 MEA Pre-Filled Syringes Market by Country, 2024, 2029 & 2034 (US$ Million)
14.4 MEA Pre-Filled Syringes Market Size Estimation and Forecast by Country
14.5 MEA Pre-Filled Syringes Market Size Estimation and Forecast by Type
14.6 MEA Pre-Filled Syringes Market Size Estimation and Forecast by Material
14.7 MEA Pre-Filled Syringes Market Size Estimation and Forecast by Design
14.8 MEA Pre-Filled Syringes Market Size Estimation and Forecast by Delivery
14.9 MEA Pre-Filled Syringes Market Size Estimation and Forecast by Application
14.10 GCC Pre-Filled Syringes Market Analysis
14.11 South Africa Pre-Filled Syringes Market Analysis
14.12 Rest of MEA Pre-Filled Syringes Market Analysis
15 Company Profiles
15.1 Competitive Landscape, 2022
15.2 Strategic Outlook
15.3 Baxter International Inc.
15.3.1 Company Snapshot
15.3.2 Company Overview
15.3.3 Financial Analysis
15.3.3.1 Net Revenue, 2017-2022
15.3.3.2 R&D, 2017-2022
15.3.3.3 Regional Market Shares, 2022
15.3.4 Product Benchmarking
15.3.5 Strategic Outlook
15.4 BD
15.4.1 Company Snapshot
15.4.2 Company Overview
15.4.3 Financial Analysis
15.4.3.1 Net Revenue, 2017-2023
15.4.3.2 R&D, 2017-2023
15.4.3.3 Regional Market Shares, 2023
15.4.4 Product Benchmarking
15.4.5 Strategic Outlook
15.5 Biocon
15.5.1 Company Snapshot
15.5.2 Company Overview
15.5.3 Financial Analysis
15.5.3.1 Net Revenue, 2017-2023
15.5.3.2 R&D, 2017-2023
15.5.3.3 Regional Market Shares, 2023
15.5.4 Product Benchmarking
15.5.5 Strategic Outlook
15.6 Cardinal Health
15.6.1 Company Snapshot
15.6.2 Company Overview
15.6.3 Financial Analysis
15.6.3.1 Net Revenue, 2017-2023
15.6.3.2 Regional Market Shares, 2022
15.6.4 Product Benchmarking
15.6.5 Strategic Outlook
15.7 Catalent, Inc.
15.7.1 Company Snapshot
15.7.2 Company Overview
15.7.3 Financial Analysis
15.7.3.1 Net Revenue, 2017-2023
15.7.3.2 R&D, 2017-2023
15.7.4 Product Benchmarking
15.7.5 Strategic Outlook
15.8 Datwyler Holding Inc.
15.8.1 Company Snapshot
15.8.2 Company Overview
15.8.3 Financial Analysis
15.8.3.1 Net Revenue, 2017-2022
15.8.3.2 R&D, 2017-2022
15.8.3.3 Regional Market Shares, 2022
15.8.4 Product Benchmarking
15.8.5 Strategic Outlook
15.9 Debiotech S.A.
15.9.1 Company Snapshot
15.9.2 Company Overview
15.9.3 Product Benchmarking
15.9.4 Strategic Outlook
15.10 Elcam Medical
15.10.1 Company Snapshot
15.10.2 Company Overview
15.10.3 Product Benchmarking
15.11 Fresenius Kabi AG
15.11.1 Company Snapshot
15.11.2 Company Overview
15.11.3 Financial Analysis
15.11.3.1 Net Revenue, 2017-2022
15.11.3.2 R&D, 2017-2022
15.11.3.3 Regional Market Shares, 2022
15.11.4 Product Benchmarking
15.11.5 Strategic Outlook
15.12 Gerresheimer AG
15.12.1 Company Snapshot
15.12.2 Company Overview
15.12.3 Financial Analysis
15.12.3.1 Net Revenue, 2017-2022
15.12.3.2 R&D, 2017-2022
15.12.3.3 Regional Market Shares, 2022
15.12.4 Product Benchmarking
15.12.5 Strategic Outlook
15.13 Micsafe Med (Jiangsu Micsafe Medical Technology Co., Ltd)
15.13.1 Company Snapshot
15.13.2 Company Overview
15.13.3 Product Benchmarking
15.14 MedXL Inc.
15.14.1 Company Snapshot
15.14.2 Company Overview
15.14.3 Product Benchmarking
15.14.4 Strategic Outlook
15.15 Nipro Medical Corporation
15.15.1 Company Snapshot
15.15.2 Company Overview
15.15.3 Financial Analysis
15.15.3.1 Net Revenue, 2017-2022
15.15.3.2 R&D, 2017-2022
15.15.3.3 Regional Market Shares, 2022
15.15.4 Product Benchmarking
15.15.5 Strategic Outlook
15.16 Owen Mumford Ltd
15.16.1 Company Snapshot
15.16.2 Company Overview
15.16.3 Product Benchmarking
15.16.4 Strategic Outlook
15.17 Scandinavian Health Limited (SHL) Group
15.17.1 Company Snapshot
15.17.2 Company Overview
15.17.3 Product Benchmarking
15.17.4 Strategic Outlook
15.18 Schott AG
15.18.1 Company Snapshot
15.18.2 Company Overview
15.18.3 Financial Analysis
15.18.3.1 Net Revenue, 2020-2022
15.18.3.2 R&D, 2020-2022
15.18.3.3 Regional Market Shares, 2023
15.18.4 Product Benchmarking
15.18.5 Strategic Outlook
15.19 Stevanato Group
15.19.1 Company Snapshot
15.19.2 Company Overview
15.19.3 Financial Analysis
15.19.3.1 Net Revenue, 2020-2022
15.19.3.2 R&D, 2020-2022
15.19.4 Product Benchmarking
15.19.5 Strategic Outlook
15.20 Terumo Corporation
15.20.1 Company Snapshot
15.20.2 Company Overview
15.20.3 Financial Analysis
15.20.3.1 Net Revenue, 2017-2023
15.20.3.2 R&D, 2017-2023
15.20.3.3 Regional Market Shares, 2022
15.20.4 Product Benchmarking
15.20.5 Strategic Outlook
15.21 Vetter Pharma
15.21.1 Company Snapshot
15.21.2 Company Overview
15.21.3 Product Benchmarking
15.22 West Pharmaceutical Services, Inc.
15.22.1 Company Snapshot
15.22.2 Company Overview
15.22.3 Financial Analysis
15.22.3.1 Net Revenue, 2017-2022
15.22.3.2 R&D, 2017-2022
15.22.3.3 Regional Market Shares, 2022
15.22.4 Product Benchmarking
15.22.5 Strategic Outlook
16 Conclusion and Recommendations
16.1 Concluding Remarks from Visiongain
16.2 Recommendations for Market Players
ページTOPに戻る
List of Tables/Graphs
List of Tables
Table 1 Pre-Filled Syringes Market Snapshot, 2024 & 2034 (US$ Million, CAGR %)
Table 2 Pre-Filled Syringes Market Forecast by Region, 2024-2034 (US$ Million, AGR%, CAGR%): “V” Shaped Recovery
Table 3 Pre-Filled Syringes Market Forecast by Region, 2024-2034 (US$ Million, AGR%, CAGR%): “U” Shaped Recovery
Table 4 Pre-Filled Syringes Market Forecast by Region, 2024-2034 (US$ Million, AGR%, CAGR%): “W” Shaped Recovery
Table 5 Pre-Filled Syringes Market Forecast by Region, 2024-2034 (US$ Million, AGR%, CAGR%): “L” Shaped Recovery
Table 6 Pre-Filled Syringes Market Forecast by Type, 2024-2034 (US$ Million, AGR%, CAGR %)
Table 7 Conventional Segment Market Forecast by Region, 2024-2034 (US$ Million, AGR%, CAGR %)
Table 8 Safety Segment Market Forecast by Region, 2024-2034 (US$ Million, AGR%, CAGR %)
Table 9 Pre-Filled Syringes Market Forecast by Material, 2024-2034 (US$ Million, AGR%, CAGR %)
Table 10 Glass Segment Market Forecast by Region, 2024-2034 (US$ Million, AGR%, CAGR%)
Table 11 Plastic Segment Market Forecast by Region, 2024-2034 (US$ Million, AGR%, CAGR %)
Table 12 Stainless Steel Segment Market Forecast by Region, 2024-2034 (US$ Million, AGR%, CAGR%)
Table 13 Elastomer Segment Market Forecast by Region, 2024-2034 (US$ Million, AGR%, CAGR%)
Table 14 Pre-Filled Syringes Market Forecast by Design, 2024-2034 (US$ Million, AGR%, CAGR %)
Table 15 Single-chamber Segment Market Forecast by Region, 2024-2034 (US$ Million, AGR%, CAGR%)
Table 16 Dual-chamber Segment Market Forecast by Region, 2024-2034 (US$ Million, AGR%, CAGR %)
Table 17 Customized Segment Market Forecast by Region, 2024-2034 (US$ Million, AGR%, CAGR%)
Table 18 Pre-Filled Syringes Market Delivery, 2024-2034 (US$ Million, AGR%, CAGR%)
Table 19 Intravenous Market Forecast by Region, 2024-2034 (US$ Million, AGR%, CAGR%)
Table 20 Subcutaneous Market Forecast by Region, 2024-2034 (US$ Million, AGR%, CAGR %)
Table 21 Intramuscular Market Forecast by Region, 2024-2034 (US$ Million, AGR%, CAGR%)
Table 22 Others Market Forecast by Region, 2024-2034 (US$ Million, AGR%, CAGR %)
Table 23 Pre-Filled Syringes Market Application, 2024-2034 (US$ Million, AGR%, CAGR %)
Table 24 Diabetes Market Forecast by Region, 2024-2034 (US$ Million, AGR%, CAGR %)
Table 25 Rheumatoid Arthritis Market Forecast by Region, 2024-2034 (US$ Million, AGR%, CAGR %)
Table 26 Anaphylaxis Market Forecast by Region, 2024-2034 (US$ Million, AGR%, CAGR %)
Table 27 Other Market Forecast by Region, 2024-2034 (US$ Million, AGR%, CAGR %)
Table 28 Pre-Filled Syringes Market Forecast by Region, 2024-2034 (US$ Million, AGR%, CAGR %)
Table 29 North America Pre-Filled Syringes Market Forecast by Country, 2024-2034 (US$ Million, AGR%, CAGR %)
Table 30 North America Pre-Filled Syringes Market Forecast by Type, 2024-2034 (US$ Million, AGR%, CAGR %)
Table 31 North America Pre-Filled Syringes Market Forecast by Material, 2024-2034 (US$ Million, AGR%, CAGR%)
Table 32 North America Pre-Filled Syringes Market Forecast by Design, 2024-2034 (US$ Million, AGR%, CAGR%)
Table 33 Pre-Filled Syringes Market Delivery, 2024-2034 (US$ Million, AGR%, CAGR%)
Table 34 North America Pre-Filled Syringes Market Application, 2024-2034 (US$ Million, AGR%, CAGR%)
Table 35 U.S Pre-Filled Syringes Market Forecast, 2024-2034 (US$ Million, AGR%, CAGR %)
Table 36 Canada Pre-Filled Syringes Market Forecast, 2024-2034 (US$ Million, AGR%, CAGR %)
Table 37 Europe Pre-Filled Syringes Market Forecast by Country, 2024-2034 (US$ Million, AGR%, CAGR%)
Table 38 Pre-Filled Syringes Market Forecast by Type, 2024-2034 (US$ Million, AGR%, CAGR %)
Table 39 Europe Pre-Filled Syringes Market Forecast by Material, 2024-2034 (US$ Million, AGR%, CAGR%)
Table 40 Europe Pre-Filled Syringes Market Forecast by Design, 2024-2034 (US$ Million, AGR%, CAGR%)
Table 41 Europe Pre-Filled Syringes Market Delivery, 2024-2034 (US$ Million, AGR%, CAGR%)
Table 42 Europe Pre-Filled Syringes Market Application, 2024-2034 (US$ Million, AGR%, CAGR%)
Table 43 Germany Pre-Filled Syringes Market Forecast, 2024-2034 (US$ Million, AGR%, CAGR %)
Table 44 France Pre-Filled Syringes Market Forecast, 2024-2034 (US$ Million, AGR%, CAGR %)
Table 45 UK Pre-Filled Syringes Market Forecast, 2024-2034 (US$ Million, AGR%, CAGR%)
Table 46 Italy Pre-Filled Syringes Market Forecast, 2024-2034 (US$ Million, AGR%, CAGR %)
Table 47 Spain Pre-Filled Syringes Market Forecast, 2024-2034 (US$ Million, AGR%, CAGR %)
Table 48 Russia Pre-Filled Syringes Market Forecast, 2024-2034 (US$ Million, AGR%, CAGR%)
Table 49 Poland Pre-Filled Syringes Market Forecast, 2024-2034 (US$ Million, AGR%, CAGR%)
Table 50 Belgium Pre-Filled Syringes Market Forecast, 2024-2034 (US$ Million, AGR%, CAGR%)
Table 51 Rest of Europe Pre-Filled Syringes Market Forecast, 2024-2034 (US$ Million, AGR%, CAGR%)
Table 52 Asia Pacific Pre-Filled Syringes Market Forecast by Country, 2024-2034 (US$ Million, AGR%, CAGR%)
Table 53 Asia Pacific Pre-Filled Syringes Market Forecast by Type, 2024-2034 (US$ Million, AGR%, CAGR %)
Table 54 Asia Pacific Pre-Filled Syringes Market Forecast by Material, 2024-2034 (US$ Million, AGR%, CAGR%)
Table 55 Asia Pacific Pre-Filled Syringes Market Forecast by Design, 2024-2034 (US$ Million, AGR%, CAGR%)
Table 56 Asia Pacific Pre-Filled Syringes Market Delivery, 2024-2034 (US$ Million, AGR%, CAGR%)
Table 57 Asia Pacific Pre-Filled Syringes Market Application, 2024-2034 (US$ Million, AGR%, CAGR%)
Table 58 Japan Pre-Filled Syringes Market Forecast, 2024-2034 (US$ Million, AGR%, CAGR%)
Table 59 China Pre-Filled Syringes Market Forecast, 2024-2034 (US$ Million, AGR%, CAGR%)
Table 60 India Pre-Filled Syringes Market Forecast, 2024-2034 (US$ Million, AGR%, CAGR %)
Table 61 Australia Pre-Filled Syringes Market Forecast, 2024-2034 (US$ Million, AGR%, CAGR %)
Table 62 South Korea Pre-Filled Syringes Market Forecast, 2024-2034 (US$ Million, AGR%, CAGR%)
Table 63 Singapore Pre-Filled Syringes Market Forecast, 2024-2034 (US$ Million, AGR%, CAGR%)
Table 64 Taiwan Pre-Filled Syringes Market Forecast, 2024-2034 (US$ Million, AGR%, CAGR%)
Table 65 Rest of Asia Pacific Pre-Filled Syringes Market Forecast, 2024-2034 (US$ Million, AGR%, CAGR %)
Table 66 Latin America Pre-Filled Syringes Market Forecast by Country, 2024-2034 (US$ Million, AGR%, CAGR%)
Table 67 Latin America Pre-Filled Syringes Market Forecast by Type, 2024-2034 (US$ Million, AGR%, CAGR %)
Table 68 Latin America Pre-Filled Syringes Market Forecast by Material, 2024-2034 (US$ Million, AGR%, CAGR%)
Table 69 Latin America Pre-Filled Syringes Market Forecast by Design, 2024-2034 (US$ Million, AGR%, CAGR%)
Table 70 Latin America Pre-Filled Syringes Market Delivery, 2024-2034 (US$ Million, AGR%, CAGR%)
Table 71 Latin America Pre-Filled Syringes Market by Application, 2024-2034 (US$ Million, AGR%, CAGR%)
Table 72 Brazil Pre-Filled Syringes Market Forecast, 2024-2034 (US$ Million, AGR%, CAGR %)
Table 73 Mexico Pre-Filled Syringes Market Forecast, 2024-2034 (US$ Million, AGR%, CAGR%)
Table 74 Argentina Pre-Filled Syringes Market Forecast, 2024-2034 (US$ Million, AGR%, CAGR%)
Table 75 Colombia Pre-Filled Syringes Market Forecast, 2024-2034 (US$ Million, AGR%, CAGR%)
Table 76 Rest of Latin America Pre-Filled Syringes Market Forecast, 2024-2034 (US$ Million, AGR%, CAGR%)
Table 77 MEA Pre-Filled Syringes Market Forecast by Country, 2024-2034 (US$ Million, AGR%, CAGR%)
Table 78 MEA Pre-Filled Syringes Market Forecast by Type, 2024-2034 (US$ Million, AGR%, CAGR %)
Table 79 MEA Pre-Filled Syringes Market Forecast by Material, 2024-2034 (US$ Million, AGR%, CAGR%)
Table 80 MEA Pre-Filled Syringes Market Forecast by Design, 2024-2034 (US$ Million, AGR%, CAGR%)
Table 81 MEA Pre-Filled Syringes Market Delivery, 2024-2034 (US$ Million, AGR%, CAGR%)
Table 82 MEA Pre-Filled Syringes Market by Application, 2024-2034 (US$ Million, AGR%, CAGR%)
Table 83 GCC Pre-Filled Syringes Market Forecast, 2024-2034 (US$ Million, AGR%, CAGR%)
Table 84 South Africa Pre-Filled Syringes Market Forecast, 2024-2034 (US$ Million, AGR%, CAGR%)
Table 85 Rest of MEA Pre-Filled Syringes Market Forecast, 2024-2034 (US$ Million, AGR%, CAGR %)
Table 86 Strategic Outlook
Table 87 Baxter International Inc.: Key Details, (CEO, HQ, Revenue, Founded, No. of Employees, Company Type, Website, Business Segment)
Table 88 Baxter International Inc.: Product Benchmarking
Table 89 Baxter International Inc.: Strategic Outlook
Table 90 BD : Key Details, (CEO, HQ, Revenue, Founded, No. of Employees, Company Type, Website, Business Segment)
Table 91 BD: Product Benchmarking
Table 92 BD. Strategic Outlook
Table 93 Biocon : Key Details, (CEO, HQ, Revenue, Founded, No. of Employees, Company Type, Website, Business Segment)
Table 94 Biocon: Product Benchmarking
Table 95 Biocon: Strategic Outlook
Table 96 Cardinal Health : Key Details, (CEO, HQ, Revenue, Founded, No. of Employees, Company Type, Website, Business Segment)
Table 97 Cardinal Health: Product Benchmarking
Table 98 Cardinal Health: Strategic Outlook
Table 99 Catalent, Inc: Key Details, (CEO, HQ, Revenue, Founded, No. of Employees, Company Type, Website, Business Segment)
Table 100 Catalent Inc: Product Benchmarking
Table 101 Catalent Inc: Strategic Outlook
Table 102 Datwyler Holding Inc: Key Details, (CEO, HQ, Revenue, Founded, No. of Employees, Company Type, Website, Business Segment)
Table 103 Datwyler Holding Inc: Product Benchmarking
Table 104 Datwyler Holding Inc: Strategic Outlook
Table 105 Debiotech S.A.: Key Details, (CEO, HQ, Revenue, Founded, No. of Employees, Company Type, Website, Business Segment)
Table 106 Debiotech SA: Product Benchmarking
Table 107 Debiotech SA: Strategic Outlook
Table 108 Elcam Medical: Key Details, (CEO, HQ, Revenue, Founded, No. of Employees, Company Type, Website, Business Segment)
Table 109 Elcam Medical: Product Benchmarking
Table 110 Fresenius Kabi AG: Key Details, (CEO, HQ, Revenue, Founded, No. of Employees, Company Type, Website, Business Segment)
Table 111 Fresenius Kabi AG: Product Benchmarking
Table 112 Fresenius Kabi AG: Strategic Outlook
Table 113 Gerresheimer AG: Key Details, (CEO, HQ, Revenue, Founded, No. of Employees, Company Type, Website, Business Segment)
Table 114 Gerresheimer AG: Product Benchmarking
Table 115 Gerresheimer AG: Strategic Outlook
Table 116 Micsafe Med (Jiangsu Micsafe Medical Technology Co., Ltd): Key Details, (CEO, HQ, Revenue, Founded, No. of Employees, Company Type, Website, Business Segment)
Table 117 Micsafe Med (Jiangsu Micsafe Medical Technology Co., Ltd).: Product Benchmarking
Table 118 MedXL Inc.: Key Details, (CEO, HQ, Revenue, Founded, No. of Employees, Company Type, Website, Business Segment)
Table 119 MedXL Inc.: Product Benchmarking
Table 120 MedXL Inc.: Strategic Outlook
Table 121 Nipro Medical Corporation: Key Details, (CEO, HQ, Revenue, Founded, No. of Employees, Company Type, Website, Business Segment)
Table 122 Nipro Medical Corporation: Product Benchmarking
Table 123 Nipro Medical Corporation.: Strategic Outlook
Table 124 Owen Mumford Ltd: Key Details, (CEO, HQ, Revenue, Founded, No. of Employees, Company Type, Website, Business Segment)
Table 125 Owen Mumford: Product Benchmarking
Table 126 Owen Mumford.: Strategic Outlook
Table 127 Scandinavian Health Limited (SHL) Group: Key Details, (CEO, HQ, Revenue, Founded, No. of Employees, Company Type, Website, Business Segment)
Table 128 Scandinavian Health Limited (SHL): Product Benchmarking
Table 129 Scandinavian Health Limited (SHL).: Strategic Outlook
Table 130 Schott AG: Key Details, (CEO, HQ, Revenue, Founded, No. of Employees, Company Type, Website, Business Segment)
Table 131 Schott AG: Product Benchmarking
Table 132 Schott AG: Strategic Outlook
Table 133 Stevanato Group: Key Details, (CEO, HQ, Revenue, Founded, No. of Employees, Company Type, Website, Business Segment)
Table 134 Stevanato Group: Product Benchmarking
Table 135 Stevanato Group: Strategic Outlook
Table 136 Terumo Corporation: Key Details, (CEO, HQ, Revenue, Founded, No. of Employees, Company Type, Website, Business Segment)
Table 137 Terumo Corporation: Product Benchmarking
Table 138 Terumo Corporation: Strategic Outlook
Table 139 Vetter Pharma: Key Details, (CEO, HQ, Revenue, Founded, No. of Employees, Company Type, Website, Business Segment)
Table 140 Vetter Pharma: Product Benchmarking
Table 141 West Pharmaceutical Services, Inc.: Key Details, (CEO, HQ, Revenue, Founded, No. of Employees, Company Type, Website, Business Segment)
Table 142 West Pharmaceutical Services, Inc.: Product Benchmarking
Table 143 West Pharmaceutical Services, Inc.: Strategic Outlook
List of Figures
Figure 1 Pre-Filled Syringes Market Segmentation
Figure 2 Pre-Filled Syringes Market by Type: Market Attractiveness Index
Figure 3 Pre-Filled Syringes Market by Material: Market Attractiveness Index
Figure 4 Pre-Filled Syringes Market by Design: Market Attractiveness Index
Figure 5 Pre-Filled Syringes Market by Delivery: Market Attractiveness Index
Figure 6 Pre-Filled Syringes Market by Application: Market Attractiveness Index
Figure 7 Pre-Filled Syringes Market Attractiveness Index by Region
Figure 8 Pre-Filled Syringes Market: Market Dynamics
Figure 9 Pre-Filled Syringes Market by Region, 2024-2034 (US$ Million, AGR %): “V” Shaped Recovery
Figure 10 Pre-Filled Syringes Market by Region, 2024-2034 (US$ Million, AGR %): “U” Shaped Recovery
Figure 11 Pre-Filled Syringes Market by Region, 2024-2034 (US$ Million, AGR %): “W” Shaped Recovery
Figure 12 Pre-Filled Syringes Market by Region, 2024-2034 (US$ Million, AGR %): “L” Shaped Recovery
Figure 13 Pre-filled Syringes Market: Porter’s Five Forces Analysis
Figure 14 Pre-Filled Syringes Market: PEST Analysis
Figure 15 Pre-Filled Syringes Market by Type: Market Attractiveness Index
Figure 16 Pre-Filled Syringes Market Forecast by Type, 2024-2034 (US$ Million, AGR %)
Figure 17 Pre-Filled Syringes Market Share Forecast by Type, 2024, 2029, 2034 (%)
Figure 18 Conventional Segment Market Forecast by Region, 2024-2034 (US$ Million, AGR %)
Figure 19 Conventional Segment Market Share Forecast by Region, 2024 & 2034 (%)
Figure 20 Safety Segment Market Forecast by Region, 2024-2034 (US$ Million, AGR %)
Figure 21 Safety Segment Market Share Forecast by Region, 2024 & 2034 (%)
Figure 22 Pre-Filled Syringes Market by Material: Market Attractiveness Index
Figure 23 Pre-Filled Syringes Market Forecast by Material, 2024-2034 (US$ Million, AGR %)
Figure 24 Pre-Filled Syringes Market Share Forecast by Material, 2024, 2029, 2034 (%)
Figure 25 Glass Segment Market Forecast by Region, 2024-2034 (US$ Million, AGR %)
Figure 26 Glass Segment Market Share Forecast by Region, 2024 & 2034 (%)
Figure 27 Plastic Segment Market Forecast by Region, 2024-2034 (US$ Million, AGR %)
Figure 28 Plastic Segment Market Share Forecast by Region, 2024 & 2034 (%)
Figure 29 Stainless Steel Segment Market Forecast by Region, 2024-2034 (US$ Million, AGR %)
Figure 30 Stainless Steel Segment Market Share Forecast by Region, 2024 & 2034 (%)
Figure 31 Elastomer Segment Market Forecast by Region, 2024-2034 (US$ Million, AGR %)
Figure 32 Elastomer Segment Market Share Forecast by Region, 2024 & 2034 (%)
Figure 33 Pre-Filled Syringes Market by Design: Market Attractiveness Index
Figure 34 Pre-Filled Syringes Market Forecast by Design, 2024-2034 (US$ Million, AGR %)
Figure 35 Pre-Filled Syringes Market Share Forecast by Design, 2024, 2029, 2034 (%)
Figure 36 Single-chamber Segment Market Forecast by Region, 2024-2034 (US$ Million, AGR %)
Figure 37 Single-chamber Segment Market Share Forecast by Region, 2024 & 2034 (%)
Figure 38 Dual-chamber Segment Market Forecast by Region, 2024-2034 (US$ Million, AGR %)
Figure 39 Dual-chamber Segment Market Share Forecast by Region, 2024 & 2034 (%)
Figure 40 Customized Segment Market Forecast by Region, 2024-2034 (US$ Million, AGR %)
Figure 41 Customized Segment Market Share Forecast by Region, 2024 & 2034 (%)
Figure 42 Pre-Filled Syringes Market by Delivery: Market Attractiveness Index
Figure 43 Pre-Filled Syringes Market Forecast by Delivery, 2024-2034 (US$ Million, AGR %)
Figure 44 Pre-Filled Syringes Market Share Forecast by Delivery, 2024, 2029, 2034 (%)
Figure 45 Intravenous Segment Market Forecast by Region, 2024-2034 (US$ Million, AGR %)
Figure 46 Pharmacies Segment Market Share Forecast by Region, 2024 & 2034 (%)
Figure 47 Subcutaneous Market Forecast by Region, 2024-2034 (US$ Million, AGR %)
Figure 48 Subcutaneous Market Share Forecast by Region, 2024 & 2034 (%)
Figure 49 Intramuscular Segment Market Forecast by Region, 2024-2034 (US$ Million, AGR %)
Figure 50 Intramuscular Segment Market Share Forecast by Region, 2024 & 2034 (%)
Figure 51 Others Market Forecast by Region, 2024-2034 (US$ Million, AGR %)
Figure 52 Others Market Share Forecast by Region, 2024 & 2034 (%)
Figure 53 Pre-Filled Syringes Market by Application: Market Attractiveness Index
Figure 54 Pre-Filled Syringes Market Forecast by Application, 2024-2034 (US$ Million, AGR %)
Figure 55 Pre-Filled Syringes Market Share Forecast by Application, 2024, 2029, 2034 (%)
Figure 56 Diabetes Segment Market Forecast by Region, 2024-2034 (US$ Million, AGR %)
Figure 57 Diabetes Segment Market Share Forecast by Region, 2024 & 2034 (%)
Figure 58 Rheumatoid Arthritis Market Forecast by Region, 2024-2034 (US$ Million, AGR %)
Figure 59 Rheumatoid Arthritis Market Share Forecast by Region, 2024 & 2034 (%)
Figure 60 Anaphylaxis Segment Market Forecast by Region, 2024-2034 (US$ Million, AGR %)
Figure 61 Anaphylaxis Segment Market Share Forecast by Region, 2024 & 2034 (%)
Figure 62 Other Market Forecast by Region, 2024-2034 (US$ Million, AGR %)
Figure 63 Other Market Share Forecast by Region, 2024 & 2034 (%)
Figure 64 Pre-Filled Syringes Market Forecast by Region 2023 and 2033 (Revenue, CAGR %)
Figure 65 Pre-Filled Syringes Market Share Forecast by Region 2024, 2029, 2034 (%)
Figure 66 Pre-Filled Syringes Market by Region, 2024-2034 (US$ Million, AGR %)
Figure 67 North America Pre-Filled Syringes Market Attractiveness Index
Figure 68 North America Pre-Filled Syringes Market by Region, 2024, 2029 & 2034 (US$ Million)
Figure 69 North America Pre-Filled Syringes Market Forecast by Country, 2024-2034 (US$ Million, AGR %)
Figure 70 North America Pre-Filled Syringes Market Share Forecast by Country, 2024 & 2034 (%)
Figure 71 North America Pre-Filled Syringes Market Forecast by Type, 2024-2034 (US$ Million, AGR %)
Figure 72 North America Pre-Filled Syringes Market Share Forecast by Type, 2024 & 2034 (%)
Figure 73 North America Pre-Filled Syringes Market Forecast by Material, 2024-2034 (US$ Million, AGR %)
Figure 74 North America Pre-Filled Syringes Market Share Forecast by Material, 2024 & 2034 (%)
Figure 75 North America Pre-Filled Syringes Market Forecast by Design, 2024-2034 (US$ Million, AGR %)
Figure 76 North America Pre-Filled Syringes Market Share Forecast by Design, 2024 & 2034 (%)
Figure 77 North America Pre-Filled Syringes Market Forecast by Delivery, 2024-2034 (US$ Million, AGR %)
Figure 78 North America Pre-Filled Syringes Market Share Forecast by Delivery, 2024 & 2034 (%)
Figure 79 North America Pre-Filled Syringes Market Forecast by Application, 2024-2034 (US$ Million, AGR %)
Figure 80 North America Pre-Filled Syringes Market Share Forecast by Application, 2024 & 2034 (%)
Figure 81 U.S. Pre-Filled Syringes Market Forecast, 2024-2034 (US$ Million, AGR %)
Figure 82 Canada Pre-Filled Syringes Market Forecast, 2024-2034 (US$ Million, AGR %)
Figure 83 Europe Pre-Filled Syringes Market Attractiveness Index
Figure 84 Europe Pre-Filled Syringes Market by Region, 2024, 2029 & 2034 (US$ Million)
Figure 85 Europe Pre-Filled Syringes Market Forecast by Country, 2024-2034 (US$ Million, AGR %)
Figure 86 Europe Pre-Filled Syringes Market Share Forecast by Country, 2024 & 2034 (%)
Figure 87 Europe Pre-Filled Syringes Market Forecast by Type, 2024-2034 (US$ Million, AGR %)
Figure 88 Europe Pre-Filled Syringes Market Share Forecast by Type, 2024 & 2034 (%)
Figure 89 Europe Pre-Filled Syringes Market Forecast by Material, 2024-2034 (US$ Million, AGR %)
Figure 90 Europe Pre-Filled Syringes Market Share Forecast by Material, 2024 & 2034 (%)
Figure 91 Europe Pre-Filled Syringes Market Forecast by Design, 2024-2034 (US$ Million, AGR %)
Figure 92 Europe Pre-Filled Syringes Market Share Forecast by Design, 2024 & 2034 (%)
Figure 93 Europe Pre-Filled Syringes Market Forecast by Delivery, 2024-2034 (US$ Million, AGR %)
Figure 94 Europe Pre-Filled Syringes Market Share Forecast by Delivery, 2024 & 2034 (%)
Figure 95 Europe Pre-Filled Syringes Market Forecast by Application, 2024-2034 (US$ Million, AGR %)
Figure 96 Europe Pre-Filled Syringes Market Share Forecast by Application, 2024 & 2034 (%)
Figure 97 Germany Pre-Filled Syringes Market Forecast, 2024-2034 (US$ Million, AGR %)
Figure 98 France Pre-Filled Syringes Market Forecast, 2024-2034 (US$ Million, AGR %)
Figure 99 UK Pre-Filled Syringes Market Forecast, 2024-2034 (US$ Million, AGR %)
Figure 100 Italy Pre-Filled Syringes Market Forecast, 2024-2034 (US$ Million, AGR %)
Figure 101 Spain Pre-Filled Syringes Market Forecast, 2024-2034 (US$ Million, AGR %)
Figure 102 Russia Pre-Filled Syringes Market Forecast, 2024-2034 (US$ Million, AGR %)
Figure 103 Poland Pre-Filled Syringes Market Forecast, 2024-2034 (US$ Million, AGR %)
Figure 104 Belgium Pre-Filled Syringes Market Forecast, 2024-2034 (US$ Million, AGR %)
Figure 105 Rest of Europe Pre-Filled Syringes Market Forecast, 2024-2034 (US$ Million, AGR %)
Figure 106 Asia Pacific Pre-Filled Syringes Market Attractiveness Index
Figure 107 Asia Pacific Pre-Filled Syringes Market by Region, 2024, 2029 & 2034 (US$ Million)
Figure 108 Asia Pacific Pre-Filled Syringes Market Forecast by Country, 2024-2034 (US$ Million, AGR %)
Figure 109 Asia Pacific Pre-Filled Syringes Market Share Forecast by Country, 2024 & 2034 (%)
Figure 110 Asia Pacific Pre-Filled Syringes Market Forecast by Type, 2024-2034 (US$ Million, AGR %)
Figure 111 Asia Pacific Pre-Filled Syringes Market Share Forecast by Type, 2024 & 2034 (%)
Figure 112 Asia Pacific Pre-Filled Syringes Market Forecast by Material, 2024-2034 (US$ Million, AGR %)
Figure 113 Asia Pacific Pre-Filled Syringes Market Share Forecast by Material, 2024 & 2034 (%)
Figure 114 Asia Pacific Pre-Filled Syringes Market Forecast by Design, 2024-2034 (US$ Million, AGR %)
Figure 115 Asia Pacific Pre-Filled Syringes Market Share Forecast by Design, 2024 & 2034 (%)
Figure 116 Asia Pacific Pre-Filled Syringes Market Forecast by Delivery, 2024-2034 (US$ Million, AGR %)
Figure 117 Asia Pacific Pre-Filled Syringes Market Share Forecast by Delivery, 2024 & 2034 (%)
Figure 118 Asia Pacific Pre-Filled Syringes Market Forecast by Application, 2024-2034 (US$ Million, AGR %)
Figure 119 Asia Pacific Pre-Filled Syringes Market Share Forecast by Application, 2024 & 2034 (%)
Figure 120 Japan Pre-Filled Syringes Market Forecast, 2024-2034 (US$ Million, AGR %)
Figure 121 China Pre-Filled Syringes Market Forecast, 2024-2034 (US$ Million, AGR %)
Figure 122 India Pre-Filled Syringes Market Forecast, 2024-2034 (US$ Million, AGR %)
Figure 123 Australia Pre-Filled Syringes Market Forecast, 2024-2034 (US$ Million, AGR %)
Figure 124 South Korea Pre-Filled Syringes Market Forecast, 2024-2034 (US$ Million, AGR %)
Figure 125 Singapore Pre-Filled Syringes Market Forecast, 2024-2034 (US$ Million, AGR %)
Figure 126 Taiwan Pre-Filled Syringes Market Forecast, 2024-2034 (US$ Million, AGR %)
Figure 127 Rest of Asia Pacific Pre-Filled Syringes Market Forecast, 2024-2034 (US$ Million, AGR %)
Figure 128 Latin America Pre-Filled Syringes Market Attractiveness Index
Figure 129 Latin America Pre-Filled Syringes Market by Region, 2024, 2029 & 2034 (US$ Million)
Figure 130 Latin America Pre-Filled Syringes Market Forecast by Country, 2024-2034 (US$ Million, AGR %)
Figure 131 Latin America Pre-Filled Syringes Market Share Forecast by Country, 2024 & 2034 (%)
Figure 132 Latin America Pre-Filled Syringes Market Forecast by Type, 2024-2034 (US$ Million, AGR %)
Figure 133 Latin America Pre-filled syringes Market Share Forecast by Type, 2024 & 2034 (%)
Figure 134 Latin America Pre-Filled Syringes Market Forecast by Material, 2024-2034 (US$ Million, AGR %)
Figure 135 Latin America Pre-Filled Syringes Market Share Forecast by Material, 2024 & 2034 (%)
Figure 136 Latin America Pre-Filled Syringes Market Forecast by Design, 2024-2034 (US$ Million, AGR %)
Figure 137 Latin America Pre-Filled Syringes Market Share Forecast by Design, 2024 & 2034 (%)
Figure 138 Latin America Pre-Filled Syringes Market Forecast by Delivery, 2024-2034 (US$ Million, AGR %)
Figure 139 Latin America Pre-Filled Syringes Market Share Forecast by Delivery, 2024 & 2034 (%)
Figure 140 Latin America Pre-Filled Syringes Market Forecast by Application, 2024-2034 (US$ Million, AGR %)
Figure 141 Latin America Pre-Filled Syringes Market Share Forecast by Application, 2024 & 2034 (%)
Figure 142 Brazil Pre-Filled Syringes Market Forecast, 2024-2034 (US$ Million, AGR %)
Figure 143 Mexico Pre-Filled Syringes Market Forecast, 2024-2034 (US$ Million, AGR %)
Figure 144 Argentina Pre-Filled Syringes Market Forecast, 2024-2034 (US$ Million, AGR %)
Figure 145 Colombia Pre-Filled Syringes Market Forecast, 2024-2034 (US$ Million, AGR %)
Figure 146 Rest of Latin America Pre-Filled Syringes Market Forecast, 2024-2034 (US$ Million, AGR %)
Figure 147 MEA Pre-Filled Syringes Market Attractiveness Index
Figure 148 MEA Pre-Filled Syringes Market by Region, 2024, 2029 & 2034 (US$ Million)
Figure 149 MEA Pre-Filled Syringes Market Forecast by Country, 2024-2034 (US$ Million, AGR %)
Figure 150 MEA Pre-Filled Syringes Market Share Forecast by Country, 2024 & 2034 (%)
Figure 151 MEA Pre-Filled Syringes Market Forecast by Type, 2024-2034 (US$ Million, AGR %)
Figure 152 MEA Pre-Filled Syringes Market Share Forecast by Type, 2024 & 2034 (%)
Figure 153 MEA Pre-Filled Syringes Market Forecast by Material, 2024-2034 (US$ Million, AGR %)
Figure 154 MEA Pre-Filled Syringes Market Share Forecast by Material, 2024 & 2034 (%)
Figure 155 MEA Pre-Filled Syringes Market Forecast by Design, 2024-2034 (US$ Million, AGR %)
Figure 156 MEA Pre-Filled Syringes Market Share Forecast by Design, 2024 & 2034 (%)
Figure 157 MEA Pre-Filled Syringes Market Forecast by Delivery, 2024-2034 (US$ Million, AGR %)
Figure 158 MEA Pre-Filled Syringes Market Share Forecast by Delivery, 2024 & 2034 (%)
Figure 159 MEA Pre-Filled Syringes Market Forecast by Application, 2024-2034 (US$ Million, AGR %)
Figure 160 MEA Pre-Filled Syringes Market Share Forecast by Application, 2024 & 2034 (%)
Figure 161 GCC Pre-Filled Syringes Market Forecast, 2024-2034 (US$ Million, AGR %)
Figure 162 South Africa Pre-Filled Syringes Market Forecast, 2024-2034 (US$ Million, AGR %)
Figure 163 Rest of MEA Pre-Filled Syringes Market Forecast, 2024-2034 (US$ Million, AGR %)
Figure 164 Pre-Filled Syringes Market Company Share, 2022
Figure 165 Baxter International Inc.: Net Revenue, 2017-2022 (US$ Million, AGR%)
Figure 166 Baxter International Inc.: R&D, 2017-2022 (US$ Million, AGR%)
Figure 167 Baxter International Inc.: Regional Market Shares, 2022
Figure 168 BD: Net Revenue, 2017-2023 (US$ Million, AGR%)
Figure 169 BD: R&D, 2017-2023 (US$ Million, AGR%)
Figure 170 BD: Regional Market Shares, 2023
Figure 171 Biocon: Net Revenue, 2017-2023 (US$ Million, AGR%)
Figure 172 Biocon: R&D, 2017-2023 (US$ Million, AGR%)
Figure 173 Biocon: Regional Market Shares, 2023
Figure 174 Cardinal Health: Net Revenue, 2017-2023 (US$ Million, AGR%)
Figure 175 Cardinal Health: Regional Market Shares, 2022
Figure 176 Catalent Inc: Net Revenue, 2017-2023 (US$ Million, AGR%)
Figure 177 Catalent Inc: R&D, 2017-2023 (US$ Million, AGR%)
Figure 178 Datwyler Holding Inc: Net Revenue, 2017-2022 (US$ Million, AGR%)
Figure 179 Datwyler Holding Inc: R&D, 2017-2022 (US$ Million, AGR%)
Figure 180 Datwyler Holding Inc: Regional Market Shares, 2022
Figure 181 Fresenius Kabi AG: Net Revenue, 2017-2022 (US$ Million, AGR%)
Figure 182 Fresenius Kabi AG: R&D, 2017-2022 (US$ Million, AGR%)
Figure 183 Fresenius Kabi AG: Regional Market Shares, 2022
Figure 184 Gerresheimer AG: Net Revenue, 2017-2022 (US$ Million, AGR%)
Figure 185 Gerresheimer AG: R&D, 2017-2022 (US$ Million, AGR%)
Figure 186 Gerresheimer AG: Regional Market Shares, 2022
Figure 187 Nipro Medical Corporation: Net Revenue, 2017-2022 (US$ Million, AGR%)
Figure 188 Nipro Medical Corporation: R&D, 2017-2022 (US$ Million, AGR%)
Figure 189 Nipro Medical Corporation: Regional Market Shares, 2022
Figure 190 Schott AG: Net Revenue, 2020-2022 (US$ Million, AGR%)
Figure 191 Schott AG: R&D, 2020-2022 (US$ Million, AGR%)
Figure 192 Schott AG: Regional Market Shares, 2023
Figure 193 Stevanato Group: Net Revenue, 2020-2022 (US$ Million, AGR%)
Figure 194 Stevanato Group: R&D, 2020-2022 (US$ Million, AGR%)
Figure 195 Terumo Corporation: Net Revenue, 2017-2023 (US$ Million, AGR%)
Figure 196 Terumo Corporation: R&D, 2017-2023 (US$ Million, AGR%)
Figure 197 Terumo Corporation: Regional Market Shares, 2022
Figure 198 West Pharmaceutical Services, Inc.: Net Revenue, 2017-2022 (US$ Million, AGR%)
Figure 199 West Pharmaceutical Services, Inc.: R&D, 2017-2022 (US$ Million, AGR%)
Figure 200 West Pharmaceutical Services, Inc.: Regional Market Shares, 2022
ページTOPに戻る
本レポートと同じKEY WORD()の最新刊レポート
- 本レポートと同じKEY WORDの最新刊レポートはありません。
よくあるご質問
Visiongain社はどのような調査会社ですか?
英国の調査会社ヴィジョンゲイン社(Visiongain)は、通信とエネルギーのほか、自動車や化学・医薬品、金属など、広範な市場を対象に調査を行っています。自動車市場については、市場全般に関する調査のほ... もっと見る
調査レポートの納品までの日数はどの程度ですか?
在庫のあるものは速納となりますが、平均的には 3-4日と見て下さい。
但し、一部の調査レポートでは、発注を受けた段階で内容更新をして納品をする場合もあります。
発注をする前のお問合せをお願いします。
注文の手続きはどのようになっていますか?
1)お客様からの御問い合わせをいただきます。
2)見積書やサンプルの提示をいたします。
3)お客様指定、もしくは弊社の発注書をメール添付にて発送してください。
4)データリソース社からレポート発行元の調査会社へ納品手配します。
5) 調査会社からお客様へ納品されます。最近は、pdfにてのメール納品が大半です。
お支払方法の方法はどのようになっていますか?
納品と同時にデータリソース社よりお客様へ請求書(必要に応じて納品書も)を発送いたします。
お客様よりデータリソース社へ(通常は円払い)の御振り込みをお願いします。
請求書は、納品日の日付で発行しますので、翌月最終営業日までの当社指定口座への振込みをお願いします。振込み手数料は御社負担にてお願いします。
お客様の御支払い条件が60日以上の場合は御相談ください。
尚、初めてのお取引先や個人の場合、前払いをお願いすることもあります。ご了承のほど、お願いします。
データリソース社はどのような会社ですか?
当社は、世界各国の主要調査会社・レポート出版社と提携し、世界各国の市場調査レポートや技術動向レポートなどを日本国内の企業・公官庁及び教育研究機関に提供しております。
世界各国の「市場・技術・法規制などの」実情を調査・収集される時には、データリソース社にご相談ください。
お客様の御要望にあったデータや情報を抽出する為のレポート紹介や調査のアドバイスも致します。
|
|


