医薬品卸売・流通市場レポート:2024-2034
Pharma Wholesale and Distribution Market Report 2024-2034
レポート詳細
医薬品卸売・流通市場レポート 2024-2034年:この調査レポートは、業界とその基礎となるダイナミクスをより良く理解することを望むなら、新たな収益ポケットを目指す大手企業にとって貴... もっと見る
※上記価格は部署ライセンス(Departmental licence)価格です。
その他の価格についてはデータリソースまでお問合せください。
日本語のページは自動翻訳を利用し作成しています。
実際のレポートは英文のみでご納品いたします。

|

|
サマリー
レポート詳細
医薬品卸売・流通市場レポート 2024-2034年:この調査レポートは、業界とその基礎となるダイナミクスをより良く理解することを望むなら、新たな収益ポケットを目指す大手企業にとって貴重なものとなるでしょう。異業種への進出や、新たな地域での既存事業の拡大を目指す企業にとっても有用なレポートです。
医薬品に対する政府の取り組みの増加が市場成長を牽引
世界の医薬品業界では、医薬品の開発、入手しやすさ、買いやすさを促進することを目的とした政府の取り組みが顕著に急増しています。世界各国の政府は、公衆衛生において製薬業界が果たす極めて重要な役割をますます認識するようになっており、ヘルスケアの課題に対処し、国民の幸福を確保するために積極的な対策を講じている。政府のイニシアティブの顕著な側面のひとつに、新製品の迅速な承認と市場参入を促進するための規制プロセスの合理化があります。規制当局はより効率的な承認経路を採用し、緊急の医療ニーズに対応するための医薬品、ワクチン、医療機器の評価を加速させている。さらに、研究開発のための環境整備も重視されており、各国政府は製薬企業や学術機関に対し、奨励金や助成金、研究資金を提供している。こうしたイニシアチブは、特にアンメット・メディカル・ニーズが根強く残る分野でのイノベーションを刺激することを目的としている。
各国政府は、医薬品の購入しやすさと入手しやすさを向上させるための政策も実施している。価格統制メカニズム、ジェネリック医薬品の促進、医療保険制度の確立は、一般国民にとって必要不可欠な医薬品をより安価に入手できるようにすることに貢献している。医療インフラの改善、サプライチェーンの強化、医薬品へのアクセスの拡大には、特に十分なサービスを受けていない地域において、官民パートナーシップがますます活用されています。
厳しい規制 産業の成長
医薬品卸・流通市場は、政府による厳しい規制によって大きな課題に直面している。規制は医薬品の安全性と品質を確保するために極めて重要である一方、その厳しさが流通網の効率性を阻害することもある。これらの規制を遵守するためには、包括的な品質管理対策を満たし、高度な保管設備を導入し、温度管理された輸送基準を確実に守るために、多額の財政投資が必要となることが多い。規制機関が要求する広範な文書化および報告要件は、時間とリソースを必要とし、業務効率に影響を与える可能性がある。例えば、医薬品流通の規制では食品医薬品局(FDA)が頂点に君臨しています。医薬品製造管理および品質管理基準(CGMP)ガイドラインは、倉庫管理、輸送、記録管理について厳しい基準を定めています。卸売業者や販売業者はFDAの認可を受ける必要があり、偽造を防ぐために厳格な追跡システムを遵守しなければならない。
市場調査レポートを購入する前にすべき質問とは?
-
医薬品卸売・流通市場はどのように進化しているのか?
-
医薬品卸売・流通市場の促進要因と阻害要因は何か?
-
医薬品卸売・流通の各サブマーケットは予測期間中にどのように成長し、2034年にはどれくらいの売上高を占めるようになるのか?
-
2024年から2034年にかけて、医薬品卸売・流通の各サブマーケットの市場シェアはどのように推移するか?
-
2024年から2034年にかけて、市場全体を牽引する主な要因は何か?
-
主要な医薬品卸売・流通市場はマクロ経済の動きに大枠で追随するのか、それとも個々の国の市場が他を凌駕するのか。
-
2034年までに各国市場のシェアはどのように変化し、どの地域が2034年の市場をリードするのか。
-
主要プレーヤーと予測期間中の見通しは?
-
これらの大手企業の医薬品卸売・流通プロジェクトとは?
-
2024年から2034年にかけて、医薬品業界はどのような進化を遂げるのか?現在、そして今後10年間に実施される医薬品卸売・流通プロジェクトにはどのような影響があるのか?
-
医薬品卸売・流通市場をさらに拡大するために、製品の商業化の必要性は高まっていますか?
-
医薬品卸売・流通市場はどこに向かっているのか、また、どのようにすれば市場の最前線に立てるのか?
-
新商品や新サービスに最適な投資方法とは?
-
企業を新たな成長軌道に乗せ、C-suiteに移行させるための重要な展望とは?
現在、そして今後10年間、医薬品卸売・流通市場にどのような影響を与えるかを見極める必要がある:
-
300ページに及ぶレポートには、109の表と144の図表が掲載されている。
-
について本レポートでは、業界の主要な有利分野を取り上げている。今すぐ
-
世界、地域、国の売上高と成長に関する詳細な分析が含まれている。
-
競合他社が成功した主なトレンド、変化、収益予測をハイライトします。
本レポートは、医薬品卸売・流通市場が今後10年間にどのように発展するか、またCOVID-19の景気後退と回復の変動に合わせてどのように発展するかをお伝えします。この市場は、過去10年間のどの時点よりも今が重要です。
2034年までの予測やその他の分析から、商業的な展望が明らかになる
-
2034年までの収益予測に加え、最新の実績、成長率、市場シェアも提供している。
-
ビジネスの展望や展開など、独自の分析が掲載されている。
-
定性的分析(市場ダイナミクス、促進要因、機会、阻害要因、課題を含む)、および最近の動向をご覧いただけます。
本レポートには、COVID-19が業界と貴社にどのような影響を与えるかについてのデータ分析と貴重な洞察が含まれている。本レポートでは、COVID-19の4つの回収パターンとその影響、すなわち「V」、「L」、「W」、「U」について論じている。
レポート対象セグメント
タイプ
-
卸売業者生産者卸売業者、商人卸売業者、代理店およびブローカー
-
ディストリビューターシングル・パーティー・ディストリビューター、マルチ・パーティー・ディストリビューター
流通タイプ
-
医療用/ブランド医薬品販売業者
-
ジェネリック医薬品販売業者
-
宣伝・販売(PCD)フランチャイズ
-
一般用医薬品/医療用医薬品販売業者
-
その他
製品タイプ
-
ブランド医薬品
-
ジェネリック医薬品
-
OTC医薬品
-
医療機器
-
ワクチン
-
その他
世界市場全体と各分野の収益予測に加え、5つの地域と24の主要国市場の収益予測も掲載している:
北米
欧州
-
ドイツ
-
フランス
-
英国
-
イタリア
-
スペイン
-
ロシア
-
その他の欧州
アジア太平洋
-
日本
-
中国
-
インド
-
オーストラリア
-
韓国
-
シンガポール
-
その他のアジア太平洋
ラテンアメリカ
-
ブラジル
-
メキシコ
-
アルゼンチン
-
コロンビア
-
その他のラテンアメリカ
MEA
本レポートでは、医薬品卸売・流通市場の2024年から2034年までの主要企業のプロファイルも掲載している。
主要企業と市場成長の可能性
-
AmerisourceBergen Corporation
-
Cardinal Health, Inc.
-
CuraScript, Inc.
-
Dakota Drug, Inc.
-
Fortissa
-
Geo-Young Co., Ltd.
-
Kingworld Medicines Group Limited
-
Mckesson Corporation
-
Medipal Holdings Corporation
-
Mutual Drug
-
Petrone Group
-
Prodigy Health LLC
-
Sinopharm Group Co. Ltd.
-
Smith Drug Co., Inc.
-
Walgreens Boots Alliance, Inc.
医薬品卸売・流通市場の2024年~2034年の世界全体の売上高(金額ベース)は、2024年に8,000億米ドルを突破する。2034年まで収益の力強い成長を予測。当調査では、最も大きな可能性を秘めた組織を特定しています。彼らの能力、進歩、商業的展望を発見し、一歩先を行くお手伝いをします。
医薬品卸売・流通市場、2024-2034年レポートはどのようにお役に立ちますか?
要約すると、弊社の300ページを超えるレポートは以下の知識を提供します:
-
医薬品卸売・流通市場の2024年から2034年までの収益予測 市場タイプ別、流通タイプ別、製品タイプ別、世界・地域レベルでの各予測 - 業界の将来性を発見し、投資と収益に最も有利な場所を見つけることができます。
-
5つの地域と24の主要国市場の2033年までの収益予測 - 北米、欧州、アジア太平洋、ラテンアメリカ、MEAの医薬品卸売・流通市場の2024年から2034年までの市場予測をご覧ください。また、米国、カナダ、メキシコ、ブラジル、ドイツ、フランス、英国、イタリア、中国、インド、日本、オーストラリアなどの著名経済圏の市場も予測しています。
-
2024年から2034年までの医薬品卸売・流通市場に関わる主要企業15社の企業プロファイルを含む、既存企業および市場参入を目指す企業の展望。
独自の予測による定量的・定性的分析をご覧いただけます。当レポートにしか掲載されていない情報を入手し、貴重なビジネスインテリジェンスで情報を得ることができます。
他にはない情報
私たちの新しいレポートがあれば、知識に遅れをとったり、チャンスを逃したりする可能性が低くなります。Visiongainの調査レポートが貴社の調査、分析、意思決定にどのように役立つかをご覧ください。Visiongainの調査は、医薬品卸売・流通市場、2023年から2033年、市場をリードする企業の商業分析を必要とするすべての人のためのものです。データ、トレンド、予測をご覧いただけます。
ページTOPに戻る
目次
目次
1 レポート概要
1.1 調査の目的
1.2 医薬品卸売・流通市場の紹介
1.3 本レポートの内容
1.4 本レポートを読むべき理由
1.5 本分析レポートが回答する主な質問
1.6 本レポートの対象者
1.7 方法論
1.7.1 市場の定義
1.7.2 市場評価・予測手法
1.7.3 データの検証
1.7.3.1 一次調査
1.7.3.2 セカンダリーリサーチ
1.8 よくある質問(FAQ)
1.9 Visiongainの関連レポート
1.10 Visiongainについて
2 エグゼクティブ・サマリー
3 市場概要
3.1 主要な調査結果
3.2 市場ダイナミクス
3.2.1 市場促進要因
3.2.1.1 医薬品販売の世界的成長
3.2.1.2 医薬品に対する政府の取り組みの増加
3.2.1.3 医薬品海上輸送の増加
3.2.1.4 医薬品流通の技術的進歩
3.2.1.5 追跡ソリューションの導入
3.2.2 市場抑制要因
3.2.2.1 政府による厳しい規制
3.2.2.2 価格圧力は市場成長の妨げになる可能性が高い
3.2.2.3 医薬品偽造の増加
3.2.3 市場機会
3.2.3.1 ニッチ医薬品と治療法への特化
3.2.3.2 電子商取引とデジタル技術の採用
3.2.3.3 持続可能性と倫理的調達の重視
3.2.3.4 医薬品サプライチェーンにおけるAIの導入
3.3 COVID-19の影響分析
3.4 ポーターのファイブフォース分析
3.4.1 サプライヤーの交渉力
3.4.2 買い手の交渉力
3.4.3 競争上のライバル
3.4.4 代替品の脅威
3.4.5 新規参入企業の脅威
3.5 PEST分析
4 医薬品卸売・流通市場分析:タイプ別
4.1 主要な調査結果
4.2 タイプ別セグメント 市場魅力度指数
4.3 医薬品卸売・流通のタイプ別市場規模推定と予測
4.4 卸売業者
4.4.1 2024〜2034年の地域別市場規模(US$ Billion)
4.4.2 地域別市場シェア、2024年・2034年(%)
4.4.3 生産者卸売業者
4.4.3.1 2024~2034年の地域別市場規模(US$ Billion)
4.4.3.2 地域別市場シェア、2024年・2034年(%)
4.4.4 商社ホールセラー
4.4.4.1 地域別市場規模(2024~2034年)(US$ Billion
4.4.4.2 地域別市場シェア、2024年・2034年(%)
4.4.5 代理店・ブローカー
4.4.5.1 2024-2034年地域別市場規模(US$ Billion)
4.4.5.2 地域別市場シェア、2024年・2034年(%)
4.5 ディストリビューター
4.5.1 2024年~2034年の地域別市場規模(US$ Billion)
4.5.2 地域別市場シェア、2024年・2034年(%)
4.5.3 シングル・パーティ・ディストリビューター
4.5.3.1 2024~2034年の地域別市場規模(US$ Billion)
4.5.3.2 地域別市場シェア、2024年・2034年(%)
4.5.4 マルチパーティーディストリビューター
4.5.4.1 2024~2034年の地域別市場規模(US$ Billion)
4.5.4.2 地域別市場シェア、2024年・2034年(%)
5 医薬品卸売・流通市場分析:流通タイプ別
5.1 主な調査結果
5.2 流通タイプセグメント 市場魅力度指数
5.3 流通タイプ別医薬品卸売・流通市場規模の推定と予測
5.4 医療用医薬品/ブランド医薬品の流通業者
5.4.1 2024〜2034年の地域別市場規模(US$ Billion)
5.4.2 地域別市場シェア、2024年・2034年(%)
5.5 ジェネリック医薬品販売業者
5.5.1 2024〜2034年の地域別市場規模(US$ Billion)
5.5.2 地域別市場シェア、2024年・2034年(%)
5.6 プロパガンダ・カム・ディストリビューション(PCD)フランチャイズ
5.6.1 2024〜2034年の地域別市場規模(US$ Billion)
5.6.2 地域別市場シェア、2024年・2034年(%)
5.7 一般用医薬品/医療機関向け医薬品ディストリビューター
5.7.1 2024年~2034年の地域別市場規模(US$ Billion)
5.7.2 地域別市場シェア、2024年・2034年(%)
5.8 その他
5.8.1 2024〜2034年の地域別市場規模(US$ Billion)
5.8.2 地域別市場シェア、2024年・2034年(%)
6 医薬品卸売・流通市場分析:製品タイプ別
6.1 主要な調査結果
6.2 製品タイプ別セグメント 市場魅力度指数
6.3 製品タイプ別医薬品卸売・流通市場規模の推定と予測
6.4 ブランド医薬品
6.4.1 2024〜2034年の地域別市場規模(US$ Billion)
6.4.2 地域別市場シェア、2024年・2034年(%)
6.5 ジェネリック医薬品
6.5.1 2024〜2034年の地域別市場規模(US$ Billion)
6.5.2 地域別市場シェア、2024年・2034年(%)
6.6 OTC医薬品
6.6.1 2024〜2034年の地域別市場規模(US$ Billion)
6.6.2 地域別市場シェア、2024年・2034年(%)
6.7 医療機器
6.7.1 2024〜2034年の地域別市場規模(US$ Billion)
6.7.2 地域別市場シェア、2024年・2034年(%)
6.8 ワクチン
6.8.1 2024〜2034年の地域別市場規模(US$ Billion)
6.8.2 地域別市場シェア、2024年・2034年(%)
6.9 その他
6.9.1 2024〜2034年の地域別市場規模(US$ Billion)
6.9.2 地域別市場シェア、2024年・2034年(%)
7 医薬品卸売・流通市場分析:地域別
7.1 主要な調査結果
7.2 地域別市場規模の推定と予測
8 北米医薬品卸売・流通市場の分析
8.1 主要な調査結果
8.2 北米の医薬品卸売・流通市場魅力度指数
8.3 北米の医薬品卸売・流通市場の国別市場規模、2024年、2029年、2034年(US$ Billion)
8.4 北米の医薬品卸売・流通市場推定と予測国別
8.5 北米の医薬品卸売・流通市場規模推定と予測:タイプ別
8.6 北米の医薬品卸売・流通市場規模推定と予測:流通タイプ別
8.7 北米の医薬品卸売・流通市場規模推定と予測:製品タイプ別
8.8 アメリカの医薬品卸売・流通市場分析
8.9 カナダの医薬品卸売・流通市場分析
9 欧州の医薬品卸売・流通市場分析
9.1 主要な調査結果
9.2 欧州の医薬品卸売・流通市場魅力度指数
9.3 欧州の医薬品卸売・流通市場の国別市場規模、2024年、2029年、2034年(US$ Billion)
9.4 欧州の医薬品卸売・流通市場推定と予測:国別
9.5 欧州の医薬品卸売・流通市場規模推定と予測:タイプ別
9.6 欧州の医薬品卸売・流通市場規模推定と予測:流通タイプ別
9.7 欧州の医薬品卸売・流通市場規模推定と予測:製品タイプ別
9.8 ドイツの医薬品卸売・流通市場分析
9.9 フランスの医薬品卸売・流通市場分析
9.10 イギリスの医薬品卸売・流通市場分析
9.11 イタリアの医薬品卸売・流通市場分析
9.12 スペインの医薬品卸売・流通市場分析
9.13 ロシアの医薬品卸売・流通市場分析
9.14 その他の欧州の医薬品卸売・流通市場分析
10 アジア太平洋地域の医薬品卸売・流通市場分析
10.1 主要な調査結果
10.2 アジア太平洋地域の医薬品卸売・流通市場魅力度指数
10.3 アジア太平洋地域の医薬品卸売・流通市場の国別市場規模、2024年、2029年、2034年(US$ Billion)
10.4 アジア太平洋地域の医薬品卸売・流通市場推定と予測:国別
10.5 アジア太平洋地域の医薬品卸売・流通市場規模推定と予測:タイプ別
10.6 アジア太平洋地域の医薬品卸売・流通市場規模推定と予測:流通タイプ別
10.7 アジア太平洋地域の医薬品卸売・流通市場規模推定と予測:製品タイプ別
10.8 日本医薬品卸売・流通市場分析
10.9 中国の医薬品卸売・流通市場分析
10.10 インドの医薬品卸売・流通市場分析
10.11 オーストラリアの医薬品卸売・流通市場分析
10.12 韓国の医薬品卸売・流通市場分析
10.13 シンガポールの医薬品卸売・流通市場分析
10.14 その他のアジア太平洋地域の医薬品卸売・流通市場分析
11 ラテンアメリカの医薬品卸売・流通市場分析
11.1 主要な調査結果
11.2 ラテンアメリカの医薬品卸売・流通市場魅力度指数
11.3 ラテンアメリカの医薬品卸売・流通市場の国別市場規模、2024年、2029年、2034年(US$ Billion)
11.4 ラテンアメリカの医薬品卸売・流通市場推定と予測:国別
11.5 ラテンアメリカの医薬品卸売・流通市場規模推定と予測:タイプ別
11.6 ラテンアメリカの医薬品卸売・流通市場規模推定と予測:流通タイプ別
11.7 ラテンアメリカの医薬品卸売・流通市場規模推定と予測:製品タイプ別
11.8 ブラジルの医薬品卸売・流通市場分析
11.9 メキシコの医薬品卸売・流通市場分析
11.10 アルゼンチンの医薬品卸売・流通市場分析
11.11 コロンビアの医薬品卸売・流通市場分析
11.12 その他のラテンアメリカの医薬品卸売・流通市場分析
12 MEAの医薬品卸売・流通市場の分析
12.1 主要な調査結果
12.2 MEAの医薬品卸売・流通市場魅力度指数
12.3 MEAの医薬品卸売・流通市場の国別市場規模、2024年、2029年、2034年(US$ Billion)
12.4 MEAの医薬品卸売・流通市場の国別推定と予測
12.5 MEAの医薬品卸売・流通市場規模推定と予測:タイプ別
12.6 MEAの医薬品卸売・流通市場規模推定と予測:流通タイプ別
12.7 MEAの医薬品卸売・流通市場規模推定と予測:製品タイプ別
12.8 GCCの医薬品卸売・流通市場分析
12.9 南アフリカの医薬品卸売・流通市場分析
12.10 その他のMEA医薬品卸売・流通市場分析
13 企業のプロフィール
13.1 競争環境、2022年
13.2 戦略的展望
13.3 AmerisourceBergen Corporation
13.3.1 会社概要
13.3.2 会社概要
13.3.3 財務分析
13.3.3.1 純収入、2017-2022年
13.3.3.2 地域市場シェア、2022年
13.3.4 サービスベンチマーク
13.3.5 戦略的展望
13.4 Cardinal Health, Inc.
13.4.1 会社概要
13.4.2 会社概要
13.4.3 財務分析
13.4.3.1 純収入、2017-2022年
13.4.3.2 地域市場シェア、2022年
13.4.4 サービスベンチマーク
13.4.5 戦略的展望
13.5 CuraScript, Inc.
13.5.1 会社概要
13.5.2 会社概要
13.5.3 サービスベンチマーク
13.6 Dakota Drug, Inc.
13.6.1 会社概要
13.6.2 会社概要
13.6.3 サービスベンチマーク
13.7 Fortissa
13.7.1 会社概要
13.7.2 会社概要
13.7.3 サービスベンチマーク
13.8 Geo-Young Co., Ltd.
13.8.1 会社概要
13.8.2 会社概要
13.8.3 サービスベンチマーク
13.9 Kingworld Medicines Group Limited
13.9.1 会社概要
13.9.2 会社概要
13.9.3 サービス・ベンチマーク
13.10 Mckesson Corporation
13.10.1 会社概要
13.10.2 会社概要
13.10.3 財務分析
13.10.3.1 純収入、2017年~2022年
13.10.3.2 地域市場シェア、2022年
13.10.4 サービスベンチマーク
13.10.5 戦略的展望
13.11 Medipal Holdings Corporation
13.11.1 会社概要
13.11.2 会社概要
13.11.3 財務分析
13.11.3.1 純収入、2017-2022年
13.11.4 サービスベンチマーク
13.11.5 戦略的展望
13.12 Mutual Drug
13.12.1 会社概要
13.12.2 会社概要
13.12.3 サービス・ベンチマーク
13.13 Petrone Group
13.13.1 会社概要
13.13.2 会社概要
13.13.3 サービス・ベンチマーク
13.13.4 戦略的展望
13.14 Prodigy Health LLC
13.14.1 会社概要
13.14.2 会社概要
13.14.3 サービス・ベンチマーク
13.15 Sinopharm Group Co.Ltd.
13.15.1 会社概要
13.15.2 会社概要
13.15.3 財務分析
13.15.3.1 純収入、2017-2022年
13.15.4 サービス・ベンチマーク
13.15.5 戦略的展望
13.16 Smith Drug Co., Inc.
13.16.1 会社概要
13.16.2 会社概要
13.16.3 サービス・ベンチマーク
13.17 Walgreens Boots Alliance, Inc.
13.17.1 企業スナップショット
13.17.2 会社概要
13.17.3 財務分析
13.17.3.1 純収入、2017年~2022年
13.17.4 サービスベンチマーク
13.17.5 戦略的展望
14 結論と提言
14.1 Visiongainからの結びの言葉
14.2 市場プレイヤーへの提言
ページTOPに戻る
図表リスト
表の一覧
Table 1 Pharma Wholesale and Distribution Market Snapshot, 2024 & 2034 (US$ Billion, CAGR %)
Table 2 Pharma Wholesale and Distribution Market Forecast by Region, 2024-2034 (US$ Billion, AGR%, CAGR%): “V” Shaped Recovery
Table 3 Pharma Wholesale and Distribution Market Forecast by Region, 2024-2034 (US$ Billion, AGR%, CAGR%): “U” Shaped Recovery
Table 4 Pharma Wholesale and Distribution Market Forecast by Region, 2024-2034 (US$ Billion, AGR%, CAGR%): “W” Shaped Recovery
Table 5 Pharma Wholesale and Distribution Market Forecast by Region, 2024-2034 (US$ Billion, AGR%, CAGR%): “L” Shaped Recovery
Table 6 Pharma Wholesale and Distribution Market Forecast by Type, 2024-2034 (US$ Billion, AGR%, CAGR%)
Table 7 Wholesalers Segment Market Forecast by Region, 2024-2034 (US$ Billion, AGR%, CAGR%)
Table 8 Producer Wholesaler Segment Market Forecast by Region, 2024-2034 (US$ Billion, AGR%, CAGR%)
Table 9 Merchant Wholesaler Segment Market Forecast by Region, 2024-2034 (US$ Billion, AGR%, CAGR%)
Table 10 Agents and Brokers Segment Market Forecast by Region, 2024-2034 (US$ Billion, AGR%, CAGR%)
Table 11 Distributor Segment Market Forecast by Region, 2024-2034 (US$ Billion, AGR%, CAGR%)
Table 12 Single Party Distributor Segment Market Forecast by Region, 2024-2034 (US$ Billion, AGR%, CAGR%)
Table 13 Multi Party Distributor Segment Market Forecast by Region, 2024-2034 (US$ Billion, AGR%, CAGR%)
Table 14 Pharma Wholesale and Distribution Market Forecast by Distribution Type, 2024-2034 (US$ Billion, AGR%, CAGR%)
Table 15 Ethical/Branded Pharma Products Distributors Segment Market Forecast by Region, 2024-2034 (US$ Billion, AGR%, CAGR%)
Table 16 Generic Pharma Products Distributors Segment Market Forecast by Region, 2024-2034 (US$ Billion, AGR%, CAGR%)
Table 17 Propaganda Cum Distribution (PCD) Franchise Segment Market Forecast by Region, 2024-2034 (US$ Billion, AGR%, CAGR%)
Table 18 OTC/Institutional Supply Pharma Distributors Segment Market Forecast by Region, 2024-2034 (US$ Billion, AGR%, CAGR%)
Table 19 Others Segment Market Forecast by Region, 2024-2034 (US$ Billion, AGR%, CAGR%)
Table 20 Pharma Wholesale and Distribution Market Forecast by Product Type, 2024-2034 (US$ Billion, AGR%, CAGR%)
Table 21 Branded Pharmaceuticals Segment Market Forecast by Region, 2024-2034 (US$ Billion, AGR%, CAGR%)
Table 22 Generic Pharmaceuticals Segment Market Forecast by Region, 2024-2034 (US$ Billion, AGR%, CAGR%)
Table 23 Over-the-counter (OTC) Pharmaceuticals Segment Market Forecast by Region, 2024-2034 (US$ Billion, AGR%, CAGR%)
Table 24 Medical Devices Segment Market Forecast by Region, 2024-2034 (US$ Billion, AGR%, CAGR%)
Table 25 Vaccines Segment Market Forecast by Region, 2024-2034 (US$ Billion, AGR%, CAGR%)
Table 26 Others Segment Market Forecast by Region, 2024-2034 (US$ Billion, AGR%, CAGR%)
Table 27 Pharma Wholesale and Distribution Market Forecast by Region, 2024-2034 (US$ Billion, AGR%, CAGR%)
Table 28 North America Pharma Wholesale and Distribution Market Forecast by Country, 2024-2034 (US$ Billion, AGR%, CAGR%)
Table 29 North America Pharma Wholesale and Distribution Market Forecast by Type, 2024-2034 (US$ Billion, AGR%, CAGR%)
Table 30 North America Pharma Wholesale and Distribution Market Forecast by Distribution Type, 2024-2034 (US$ Billion, AGR%, CAGR%)
Table 31 North America Pharma Wholesale and Distribution Market Forecast by Product Type, 2024-2034 (US$ Billion, AGR%, CAGR%)
Table 32 U.S. Pharma Wholesale and Distribution Market Forecast, 2024-2034 (US$ Billion, AGR%, CAGR%)
Table 33 Canada Pharma Wholesale and Distribution Market Forecast, 2024-2034 (US$ Billion, AGR%, CAGR%)
Table 34 Europe Pharma Wholesale and Distribution Market Forecast by Country, 2024-2034 (US$ Billion, AGR%, CAGR%)
Table 35 Europe Pharma Wholesale and Distribution Market Forecast by Type, 2024-2034 (US$ Billion, AGR%, CAGR%)
Table 36 Europe Pharma Wholesale and Distribution Market Forecast by Distribution Type, 2024-2034 (US$ Billion, AGR%, CAGR%)
Table 37 Europe Pharma Wholesale and Distribution Market Forecast by Product Type, 2024-2034 (US$ Billion, AGR%, CAGR%)
Table 38 Germany Pharma Wholesale and Distribution Market Forecast, 2024-2034 (US$ Billion, AGR%, CAGR%)
Table 39 France Pharma Wholesale and Distribution Market Forecast, 2024-2034 (US$ Billion, AGR%, CAGR%)
Table 40 UK Pharma Wholesale and Distribution Market Forecast, 2024-2034 (US$ Billion, AGR%, CAGR%)
Table 41 Italy Pharma Wholesale and Distribution Market Forecast, 2024-2034 (US$ Billion, AGR%, CAGR%)
Table 42 Spain Pharma Wholesale and Distribution Market Forecast, 2024-2034 (US$ Billion, AGR%, CAGR%)
Table 43 Russia Pharma Wholesale and Distribution Market Forecast, 2024-2034 (US$ Billion, AGR%, CAGR%)
Table 44 Rest of Europe Pharma Wholesale and Distribution Market Forecast, 2024-2034 (US$ Billion, AGR%, CAGR%)
Table 45 Asia Pacific Pharma Wholesale and Distribution Market Forecast by Country, 2024-2034 (US$ Billion, AGR%, CAGR%)
Table 46 Asia Pacific Pharma Wholesale and Distribution Market Forecast by Type, 2024-2034 (US$ Billion, AGR%, CAGR%)
Table 47 Asia Pacific Pharma Wholesale and Distribution Market Forecast by Distribution Type, 2024-2034 (US$ Billion, AGR%, CAGR%)
Table 48 Asia Pacific Pharma Wholesale and Distribution Market Forecast by Product Type, 2024-2034 (US$ Billion, AGR%, CAGR%)
Table 49 Japan Pharma Wholesale and Distribution Market Forecast, 2024-2034 (US$ Billion, AGR%, CAGR%)
Table 50 China Pharma Wholesale and Distribution Market Forecast, 2024-2034 (US$ Billion, AGR%, CAGR%)
Table 51 India Pharma Wholesale and Distribution Market Forecast, 2024-2034 (US$ Billion, AGR%, CAGR%)
Table 52 Australia Pharma Wholesale and Distribution Market Forecast, 2024-2034 (US$ Billion, AGR%, CAGR%)
Table 53 South Korea Pharma Wholesale and Distribution Market Forecast, 2024-2034 (US$ Billion, AGR%, CAGR%)
Table 54 Singapore Pharma Wholesale and Distribution Market Forecast, 2024-2034 (US$ Billion, AGR%, CAGR%)
Table 55 Rest of Asia Pacific Pharma Wholesale and Distribution Market Forecast, 2024-2034 (US$ Billion, AGR%, CAGR%)
Table 56 Latin America Pharma Wholesale and Distribution Market Forecast by Country, 2024-2034 (US$ Billion, AGR%, CAGR%)
Table 57 Latin America Pharma Wholesale and Distribution Market Forecast by Type, 2024-2034 (US$ Billion, AGR%, CAGR%)
Table 58 Latin America Pharma Wholesale and Distribution Market Forecast by Distribution Type, 2024-2034 (US$ Billion, AGR%, CAGR%)
Table 59 Latin America Pharma Wholesale and Distribution Market Forecast by Product Type, 2024-2034 (US$ Billion, AGR%, CAGR%)
Table 60 Brazil Pharma Wholesale and Distribution Market Forecast, 2024-2034 (US$ Billion, AGR%, CAGR%)
Table 61 Mexico Pharma Wholesale and Distribution Market Forecast, 2024-2034 (US$ Billion, AGR%, CAGR%)
Table 62 Argentina Pharma Wholesale and Distribution Market Forecast, 2024-2034 (US$ Billion, AGR%, CAGR%)
Table 63 Colombia Pharma Wholesale and Distribution Market Forecast, 2024-2034 (US$ Billion, AGR%, CAGR%)
Table 64 Rest of Latin America Pharma Wholesale and Distribution Market Forecast, 2024-2034 (US$ Billion, AGR%, CAGR%)
Table 65 MEA Pharma Wholesale and Distribution Market Forecast by Country, 2024-2034 (US$ Billion, AGR%, CAGR%)
Table 66 MEA Pharma Wholesale and Distribution Market Forecast by Type, 2024-2034 (US$ Billion, AGR%, CAGR%)
Table 67 MEA Pharma Wholesale and Distribution Market Forecast by Distribution Type, 2024-2034 (US$ Billion, AGR%, CAGR%)
Table 68 MEA Pharma Wholesale and Distribution Market Forecast by Product Type, 2024-2034 (US$ Billion, AGR%, CAGR%)
Table 69 GCC Pharma Wholesale and Distribution Market Forecast, 2024-2034 (US$ Billion, AGR%, CAGR%)
Table 70 South Africa Pharma Wholesale and Distribution Market Forecast, 2024-2034 (US$ Billion, AGR%, CAGR%)
Table 71 Rest of MEA Pharma Wholesale and Distribution Market Forecast, 2024-2034 (US$ Billion, AGR%, CAGR%)
Table 72 Strategic Outlook
Table 73 AmerisourceBergen Corporation: Key Details, (CEO, HQ, Revenue, Founded, No. of Employees, Company Type, Website, Business Segment)
Table 74 AmerisourceBergen Corporation: Service Benchmarking
Table 75 AmerisourceBergen Corporation: Strategic Outlook
Table 76 Cardinal Health, Inc.: Key Details, (CEO, HQ, Revenue, Founded, No. of Employees, Company Type, Website, Business Segment)
Table 77 Cardinal Health, Inc.: Service Benchmarking
Table 78 Cardinal Health, Inc.: Strategic Outlook
Table 79 CuraScript, Inc.: Key Details, (CEO, HQ, Revenue, Founded, No. of Employees, Company Type, Website, Business Segment)
Table 80 CuraScript, Inc.: Service Benchmarking
Table 81 Dakota Drug, Inc.: Key Details, (CEO, HQ, Revenue, Founded, No. of Employees, Company Type, Website, Business Segment)
Table 82 Dakota Drug, Inc.: Service Benchmarking
Table 83 Fortissa: Key Details, (CEO, HQ, Revenue, Founded, No. of Employees, Company Type, Website, Business Segment)
Table 84 Fortissa: Service Benchmarking
Table 85 Geo-Young Co., Ltd.: Key Details, (CEO, HQ, Revenue, Founded, No. of Employees, Company Type, Website, Business Segment)
Table 86 Geo-Young Co., Ltd.: Service Benchmarking
Table 87 Kingworld Medicines Group Limited: Key Details, (CEO, HQ, Revenue, Founded, No. of Employees, Company Type, Website, Business Segment)
Table 88 Kingworld Medicines Group Limited: Service Benchmarking
Table 89 Mckesson Corporation: Key Details, (CEO, HQ, Revenue, Founded, No. of Employees, Company Type, Website, Business Segment)
Table 90 Mckesson Corporation: Service Benchmarking
Table 91 Mckesson Corporation: Strategic Outlook
Table 92 Medipal Holdings Corporation: Key Details, (CEO, HQ, Revenue, Founded, No. of Employees, Company Type, Website, Business Segment)
Table 93 Medipal Holdings Corporation: Service Benchmarking
Table 94 Medipal Holdings Corporation: Strategic Outlook
Table 95 Mutual Drug: Key Details, (CEO, HQ, Revenue, Founded, No. of Employees, Company Type, Website, Business Segment)
Table 96 Mutual Drug: Service Benchmarking
Table 97 Petrone Group: Key Details, (CEO, HQ, Revenue, Founded, No. of Employees, Company Type, Website, Business Segment)
Table 98 Petrone Group: Service Benchmarking
Table 99 Petrone Group: Strategic Outlook
Table 100 Prodigy Health LLC: Key Details, (CEO, HQ, Revenue, Founded, No. of Employees, Company Type, Website, Business Segment)
Table 101 Prodigy Health LLC: Service Benchmarking
Table 102 Sinopharm Group Co. Ltd.: Key Details, (CEO, HQ, Revenue, Founded, No. of Employees, Company Type, Website, Business Segment)
Table 103 Sinopharm Group Co. Ltd.: Service Benchmarking
Table 104 Sinopharm Group Co. Ltd.: Strategic Outlook
Table 105 Smith Drug Co., Inc.: Key Details, (CEO, HQ, Revenue, Founded, No. of Employees, Company Type, Website, Business Segment)
Table 106 Smith Drug Co., Inc.: Service Benchmarking
Table 107 Walgreens Boots Alliance, Inc.: Key Details, (CEO, HQ, Revenue, Founded, No. of Employees, Company Type, Website, Business Segment)
Table 108 Walgreens Boots Alliance, Inc.: Service Benchmarking
Table 109 Walgreens Boots Alliance, Inc.: Strategic Outlook
図の一覧
Figure 1 Pharma Wholesale and Distribution Market Segmentation
Figure 2 Pharma Wholesale and Distribution Market by Type: Market Attractiveness Index
Figure 3 Pharma Wholesale and Distribution Market by Distribution Type: Market Attractiveness Index
Figure 4 Pharma Wholesale and Distribution Market by Product Type: Market Attractiveness Index
Figure 5 Pharma Wholesale and Distribution Market Attractiveness Index by Region
Figure 6 Pharma Wholesale and Distribution Market: Market Dynamics
Figure 7 Pharma Wholesale and Distribution Market by Region, 2024-2034 (US$ Billion, AGR %): “V” Shaped Recovery
Figure 8 Pharma Wholesale and Distribution Market by Region, 2024-2034 (US$ Billion, AGR %): “U” Shaped Recovery
Figure 9 Pharma Wholesale and Distribution Market by Region, 2024-2034 (US$ Billion, AGR %): “W” Shaped Recovery
Figure 10 Pharma Wholesale and Distribution Market by Region, 2024-2034 (US$ Billion, AGR %): “L” Shaped Recovery
Figure 11 Pharma Wholesale and Distribution Market: Porter’s Five Forces Analysis
Figure 12 Pharma Wholesale and Distribution Market: PEST Analysis
Figure 13 Pharma Wholesale and Distribution Market by Type: Market Attractiveness Index
Figure 14 Pharma Wholesale and Distribution Market Forecast by Type, 2024-2034 (US$ Billion, AGR %)
Figure 15 Pharma Wholesale and Distribution Market Share Forecast by Type, 2023, 2028, 2033 (%)
Figure 16 Wholesalers Segment Market Forecast by Region, 2024-2034 (US$ Billion, AGR %)
Figure 17 Wholesalers Segment Market Share Forecast by Region, 2024 & 2034 (%)
Figure 18 Producer Wholesaler Segment Market Forecast by Region, 2024-2034 (US$ Billion, AGR %)
Figure 19 Producer Wholesaler Segment Market Share Forecast by Region, 2024 & 2034 (%)
Figure 20 Merchant Wholesaler Segment Market Forecast by Region, 2024-2034 (US$ Billion, AGR %)
Figure 21 Merchant Wholesaler Segment Market Share Forecast by Region, 2024 & 2034 (%)
Figure 22 Agents and Brokers Segment Market Forecast by Region, 2024-2034 (US$ Billion, AGR %)
Figure 23 Agents and Brokers Segment Market Share Forecast by Region, 2024 & 2034 (%)
Figure 24 Distributor Segment Market Forecast by Region, 2024-2034 (US$ Billion, AGR %)
Figure 25 Distributor Segment Market Share Forecast by Region, 2024 & 2034 (%)
Figure 26 Single Party Distributor Segment Market Forecast by Region, 2024-2034 (US$ Billion, AGR %)
Figure 27 Single Party Distributor Segment Market Share Forecast by Region, 2024 & 2034 (%)
Figure 28 Multi Party Distributor Segment Market Forecast by Region, 2024-2034 (US$ Billion, AGR %)
Figure 29 Multi Party Distributor Segment Market Share Forecast by Region, 2024 & 2034 (%)
Figure 30 Pharma Wholesale and Distribution Market by Distribution Type: Market Attractiveness Index
Figure 31 Pharma Wholesale and Distribution Market Forecast by Distribution Type, 2024-2034 (US$ Billion, AGR %)
Figure 32 Pharma Wholesale and Distribution Market Share Forecast by Distribution Type, 2024, 2029, 2034 (%)
Figure 33 Ethical/Branded Pharma Products Distributors Segment Market Forecast by Region, 2024-2034 (US$ Billion, AGR %)
Figure 34 Ethical/Branded Pharma Products Distributors Segment Market Share Forecast by Region, 2024 & 2034 (%)
Figure 35 Generic Pharma Products Distributors Segment Market Forecast by Region, 2024-2034 (US$ Billion, AGR %)
Figure 36 Generic Pharma Products Distributors Segment Market Share Forecast by Region, 2024 & 2034 (%)
Figure 37 Propaganda Cum Distribution (PCD) Franchise Segment Market Forecast by Region, 2024-2034 (US$ Billion, AGR %)
Figure 38 Propaganda Cum Distribution (PCD) Franchise Segment Market Share Forecast by Region, 2024 & 2034 (%)
Figure 39 OTC/Institutional Supply Pharma Distributors Segment Market Forecast by Region, 2024-2034 (US$ Billion, AGR %)
Figure 40 OTC/Institutional Supply Pharma Distributors Segment Market Share Forecast by Region, 2024 & 2034 (%)
Figure 41 Others Segment Market Forecast by Region, 2024-2034 (US$ Billion, AGR %)
Figure 42 Others Segment Market Share Forecast by Region, 2024 & 2034 (%)
Figure 43 Pharma Wholesale and Distribution Market by Product Type: Market Attractiveness Index
Figure 44 Pharma Wholesale and Distribution Market Forecast by Product Type, 2024-2034 (US$ Billion, AGR %)
Figure 45 Pharma Wholesale and Distribution Market Share Forecast by Product Type, 2024, 2029, 2034 (%)
Figure 46 Branded Pharmaceuticals Segment Market Forecast by Region, 2024-2034 (US$ Billion, AGR %)
Figure 47 Branded Pharmaceuticals Segment Market Share Forecast by Region, 2024 & 2034 (%)
Figure 48 Generic Pharmaceuticals Segment Market Forecast by Region, 2024-2034 (US$ Billion, AGR %)
Figure 49 Generic Pharmaceuticals Segment Market Share Forecast by Region, 2024 & 2034 (%)
Figure 50 Over-the-counter (OTC) Pharmaceuticals Segment Market Forecast by Region, 2024-2034 (US$ Billion, AGR %)
Figure 51 Over-the-counter (OTC) Pharmaceuticals Segment Market Share Forecast by Region, 2024 & 2034 (%)
Figure 52 Medical Devices Segment Market Forecast by Region, 2024-2034 (US$ Billion, AGR %)
Figure 53 Medical Devices Segment Market Share Forecast by Region, 2024 & 2034 (%)
Figure 54 Vaccines Segment Market Forecast by Region, 2024-2034 (US$ Billion, AGR %)
Figure 55 Vaccines Segment Market Share Forecast by Region, 2024 & 2034 (%)
Figure 56 Others Segment Market Forecast by Region, 2024-2034 (US$ Billion, AGR %)
Figure 57 Others Segment Market Share Forecast by Region, 2024 & 2034 (%)
Figure 58 Pharma Wholesale and Distribution Market Forecast by Region 2024 and 2034 (Revenue, CAGR%)
Figure 59 Pharma Wholesale and Distribution Market Share Forecast by Region 2024, 2029, 2034 (%)
Figure 60 Pharma Wholesale and Distribution Market by Region, 2024-2034 (US$ Billion, AGR %)
Figure 61 North America Pharma Wholesale and Distribution Market Attractiveness Index
Figure 62 North America Pharma Wholesale and Distribution Market by Region, 2024, 2029 & 2034 (US$ Billion)
Figure 63 North America Pharma Wholesale and Distribution Market Forecast by Country, 2024-2034 (US$ Billion, AGR %)
Figure 64 North America Pharma Wholesale and Distribution Market Share Forecast by Country, 2024 & 2034 (%)
Figure 65 North America Pharma Wholesale and Distribution Market Forecast by Type, 2024-2034 (US$ Billion, AGR %)
Figure 66 North America Pharma Wholesale and Distribution Market Share Forecast by Type, 2024 & 2034 (%)
Figure 67 North America Pharma Wholesale and Distribution Market Forecast by Distribution Type, 2024-2034 (US$ Billion, AGR %)
Figure 68 North America Pharma Wholesale and Distribution Market Share Forecast by Distribution Type, 2024 & 2034 (%)
Figure 69 North America Pharma Wholesale and Distribution Market Forecast by Product Type, 2024-2034 (US$ Billion, AGR %)
Figure 70 North America Pharma Wholesale and Distribution Market Share Forecast by Product Type, 2024 & 2034 (%)
Figure 71 U.S. Pharma Wholesale and Distribution Market Forecast, 2024-2034 (US$ Billion, AGR %)
Figure 72 Canada Pharma Wholesale and Distribution Market Forecast, 2024-2034 (US$ Billion, AGR %)
Figure 73 Europe Pharma Wholesale and Distribution Market Attractiveness Index
Figure 74 Europe Pharma Wholesale and Distribution Market by Region, 2024, 2029 & 2034 (US$ Billion)
Figure 75 Europe Pharma Wholesale and Distribution Market Forecast by Country, 2024-2034 (US$ Billion, AGR %)
Figure 76 Europe Pharma Wholesale and Distribution Market Share Forecast by Country, 2024 & 2034 (%)
Figure 77 Europe Pharma Wholesale and Distribution Market Forecast by Type, 2024-2034 (US$ Billion, AGR %)
Figure 78 Europe Pharma Wholesale and Distribution Market Share Forecast by Type, 2024 & 2034 (%)
Figure 79 Europe Pharma Wholesale and Distribution Market Forecast by Distribution Type, 2024-2034 (US$ Billion, AGR %)
Figure 80 Europe Pharma Wholesale and Distribution Market Share Forecast by Distribution Type, 2024 & 2034 (%)
Figure 81 Europe Pharma Wholesale and Distribution Market Forecast by Product Type, 2024-2034 (US$ Billion, AGR.%)
Figure 82 Europe Pharma Wholesale and Distribution Market Share Forecast by Product Type, 2024 & 2034 (%)
Figure 83 Germany Pharma Wholesale and Distribution Market Forecast, 2024-2034 (US$ Billion, AGR %)
Figure 84 France Pharma Wholesale and Distribution Market Forecast, 2024-2034 (US$ Billion, AGR %)
Figure 85 UK Pharma Wholesale and Distribution Market Forecast, 2024-2034 (US$ Billion, AGR %)
Figure 86 Italy Pharma Wholesale and Distribution Market Forecast, 2024-2034 (US$ Billion, AGR %)
Figure 87 Spain Pharma Wholesale and Distribution Market Forecast, 2024-2034 (US$ Billion, AGR %)
Figure 88 Russia Pharma Wholesale and Distribution Market Forecast, 2024-2034 (US$ Billion, AGR %)
Figure 89 Rest of Europe Pharma Wholesale and Distribution Market Forecast, 2024-2034 (US$ Billion, AGR %)
Figure 90 Asia Pacific Pharma Wholesale and Distribution Market Attractiveness Index
Figure 91 Asia Pacific Pharma Wholesale and Distribution Market by Region, 2024, 2029 & 2034 (US$ Billion)
Figure 92 Asia Pacific Pharma Wholesale and Distribution Market Forecast by Country, 2024-2034 (US$ Billion, AGR %)
Figure 93 Asia Pacific Pharma Wholesale and Distribution Market Share Forecast by Country, 2024 & 2034 (%)
Figure 94 Asia Pacific Pharma Wholesale and Distribution Market Forecast by Type, 2024-2034 (US$ Billion, AGR %)
Figure 95 Asia Pacific Pharma Wholesale and Distribution Market Share Forecast by Type, 2024 & 2034 (%)
Figure 96 Asia Pacific Pharma Wholesale and Distribution Market Forecast by Distribution Type, 2024-2034 (US$ Billion, AGR %)
Figure 97 Asia Pacific Pharma Wholesale and Distribution Market Share Forecast by Distribution Type, 2024 & 2034 (%)
Figure 98 Asia Pacific Pharma Wholesale and Distribution Market Forecast by Product Type, 2024-2034 (US$ Billion, AGR %)
Figure 99 Asia Pacific Pharma Wholesale and Distribution Market Share Forecast by Product Type, 2024 & 2034 (%)
Figure 100 Japan Pharma Wholesale and Distribution Market Forecast, 2024-2034 (US$ Billion, AGR %)
Figure 101 China Pharma Wholesale and Distribution Market Forecast, 2024-2034 (US$ Billion, AGR %)
Figure 102 India Pharma Wholesale and Distribution Market Forecast, 2024-2034 (US$ Billion, AGR %)
Figure 103 Australia Pharma Wholesale and Distribution Market Forecast, 2024-2034 (US$ Billion, AGR %)
Figure 104 South Korea Pharma Wholesale and Distribution Market Forecast, 2024-2034 (US$ Billion, AGR %)
Figure 105 Singapore Pharma Wholesale and Distribution Market Forecast, 2024-2034 (US$ Billion, AGR %)
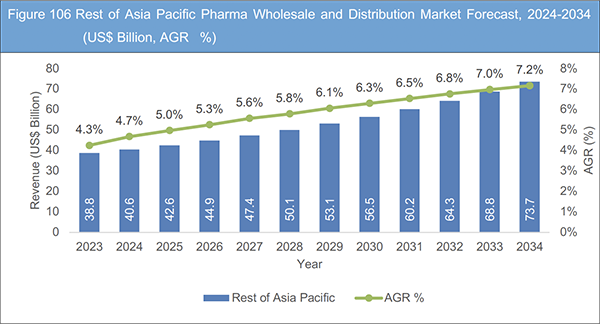
Figure 106 Rest of Asia Pacific Pharma Wholesale and Distribution Market Forecast, 2024-2034 (US$ Billion, AGR %)
Figure 107 Latin America Pharma Wholesale and Distribution Market Attractiveness Index
Figure 108 Latin America Pharma Wholesale and Distribution Market by Region, 2024, 2029 & 2034 (US$ Billion)
Figure 109 Latin America Pharma Wholesale and Distribution Market Forecast by Country, 2024-2034 (US$ Billion, AGR %)
Figure 110 Latin America Pharma Wholesale and Distribution Market Share Forecast by Country, 2024 & 2034 (%)
Figure 111 Latin America Pharma Wholesale and Distribution Market Forecast by Type, 2024-2034 (US$ Billion, AGR %)
Figure 112 Latin America Pharma Wholesale and Distribution Market Share Forecast by Type, 2024 & 2034 (%)
Figure 113 Latin America Pharma Wholesale and Distribution Market Forecast by Distribution Type, 2024-2034 (US$ Billion, AGR %)
Figure 114 Latin America Pharma Wholesale and Distribution Market Share Forecast by Distribution Type, 2024 & 2034 (%)
Figure 115 Latin America Pharma Wholesale and Distribution Market Forecast by Product Type, 2024-2034 (US$ Billion, AGR %)
Figure 116 Latin America Pharma Wholesale and Distribution Market Share Forecast by Product Type, 2024 & 2034 (%)
Figure 117 Brazil Pharma Wholesale and Distribution Market Forecast, 2024-2034 (US$ Billion, AGR %)
Figure 118 Mexico Pharma Wholesale and Distribution Market Forecast, 2024-2034 (US$ Billion, AGR %)
Figure 119 Argentina Pharma Wholesale and Distribution Market Forecast, 2024-2034 (US$ Billion, AGR %)
Figure 120 Colombia Pharma Wholesale and Distribution Market Forecast, 2024-2034 (US$ Billion, AGR %)
Figure 121 Rest of Latin America Pharma Wholesale and Distribution Market Forecast, 2024-2034 (US$ Billion, AGR %)
Figure 122 MEA Pharma Wholesale and Distribution Market Attractiveness Index
Figure 123 MEA Pharma Wholesale and Distribution Market by Region, 2024, 2029 & 2034 (US$ Billion)
Figure 124 MEA Pharma Wholesale and Distribution Market Forecast by Country, 2024-2034 (US$ Billion, AGR %)
Figure 125 MEA Pharma Wholesale and Distribution Market Share Forecast by Country, 2024 & 2034 (%)
Figure 126 MEA Pharma Wholesale and Distribution Market Forecast by Type, 2024-2034 (US$ Billion, AGR %)
Figure 127 MEA Pharma Wholesale and Distribution Market Share Forecast by Type, 2024 & 2034 (%)
Figure 128 MEA Pharma Wholesale and Distribution Market Forecast by Distribution Type, 2024-2034 (US$ Billion, AGR %)
Figure 129 MEA Pharma Wholesale and Distribution Market Share Forecast by Distribution Type, 2024 & 2034 (%)
Figure 130 MEA Pharma Wholesale and Distribution Market Forecast by Product Type, 2024-2034 (US$ Billion, AGR %)
Figure 131 MEA Pharma Wholesale and Distribution Market Share Forecast by Product Type, 2024 & 2034 (%)
Figure 132 GCC Pharma Wholesale and Distribution Market Forecast, 2024-2034 (US$ Billion, AGR %)
Figure 133 South Africa Pharma Wholesale and Distribution Market Forecast, 2024-2034 (US$ Billion, AGR %)
Figure 134 Rest of MEA Pharma Wholesale and Distribution Market Forecast, 2024-2034 (US$ Billion, AGR %)
Figure 135 Pharma Wholesale and Distribution Market: Company Share/Ranking, 2022
Figure 136 AmerisourceBergen Corporation: Net Revenue, 2017-2022 (US$ Million, AGR %)
Figure 137 AmerisourceBergen Corporation: Regional Market Shares, 2022
Figure 138 Cardinal Health, Inc.: Net Revenue, 2017-2022 (US$ Million, AGR %)
Figure 139 Cardinal Health, Inc.: Regional Market Shares, 2022
Figure 140 Mckesson Corporation: Net Revenue, 2017-2022 (US$ Million, AGR %)
Figure 141 Mckesson Corporation: Regional Market Shares, 2022
Figure 142 Medipal Holdings Corporation: Net Revenue, 2017-2022 (US$ Million, AGR %)
Figure 143 Sinopharm Group Co. Ltd.: Net Revenue, 2017-2022 (US$ Million, AGR %)
Figure 144 Walgreens Boots Alliance, Inc.: Net Revenue, 2017-2022 (US$ Million, AGR %)
ページTOPに戻る
Summary
Report Details
The Pharma Wholesale and Distribution Market Report 2024-2034: This report will prove invaluable to leading firms striving for new revenue pockets if they wish to better understand the industry and its underlying dynamics. It will be useful for companies that would like to expand into different industries or to expand their existing operations in a new region.
Increasing Government Initiatives for Pharmaceutical Products Driving Market Growth
The global pharmaceutical landscape is witnessing a notable surge in government initiatives aimed at fostering the development, accessibility, and affordability of pharmaceutical products. Governments worldwide are increasingly recognizing the pivotal role played by the pharmaceutical industry in public health, and they are taking proactive measures to address healthcare challenges and ensure the well-being of their populations. One prominent aspect of government initiatives involves streamlining regulatory processes to facilitate the faster approval and market entry of new pharmaceutical products. Regulatory agencies are adopting more efficient approval pathways, accelerating the evaluation of drugs, vaccines, and medical devices to address urgent health needs. Additionally, there is a growing emphasis on creating a conducive environment for research and development, with governments offering incentives, grants, and research funding to pharmaceutical companies and academic institutions. These initiatives aim to stimulate innovation, especially in areas where unmet medical needs persist.
Governments are also implementing policies to enhance the affordability and accessibility of pharmaceuticals. Price control mechanisms, generic drug promotion, and the establishment of health insurance schemes contribute to making essential medications more affordable for the general population. Public-private partnerships are increasingly being leveraged to improve healthcare infrastructure, strengthen supply chains, and expand access to pharmaceutical products, particularly in underserved regions.
Stringent Regulations Industry Growth
The pharmaceutical wholesale and distribution market face substantial challenges due to the stringent regulations imposed by governments. While regulations are crucial for ensuring the safety and quality of pharmaceutical products, their strictness can hinder the efficiency of the distribution network. Compliance with these regulations often involves significant financial investments to meet comprehensive quality control measures, implement advanced storage facilities, and ensure adherence to temperature-controlled transportation standards. The extensive documentation and reporting requirements demanded by regulatory bodies can be time-consuming and resource-intensive, impacting operational efficiency. For instance, the Food and Drug Administration (FDA) reigns supreme in regulating pharmaceutical distribution. Their Current Good Manufacturing Practice (CGMP) guidelines set stringent standards for warehousing, transportation, and record-keeping. Wholesalers and distributors need to be licensed by the FDA and comply with rigorous track-and-trace systems to prevent counterfeiting.
What Questions Should You Ask before Buying a Market Research Report?
-
How is the Pharma Wholesale and Distribution market evolving?
-
What is driving and restraining the Pharma Wholesale and Distribution market?
-
How will each Pharma Wholesale and Distribution submarket segment grow over the forecast period and how much revenue will these submarkets account for in 2034?
-
How will the market shares for each Pharma Wholesale and Distribution submarket develop from 2024 to 2034?
-
What will be the main driver for the overall market from 2024 to 2034?
-
Will leading Pharma Wholesale and Distribution markets broadly follow the macroeconomic dynamics, or will individual national markets outperform others?
-
How will the market shares of the national markets change by 2034 and which geographical region will lead the market in 2034?
-
Who are the leading players and what are their prospects over the forecast period?
-
What are the Pharma Wholesale and Distribution projects for these leading companies?
-
How will the industry evolve during the period between 2024 and 2034? What are the implications of Pharma Wholesale and Distribution projects taking place now and over the next 10 years?
-
Is there a greater need for product commercialisation to further scale the Pharma Wholesale and Distribution market?
-
Where is the Pharma Wholesale and Distribution market heading and how can you ensure you are at the forefront of the market?
-
What are the best investment options for new product and service lines?
-
What are the key prospects for moving companies into a new growth path and C-suite?
You need to discover how this will impact the Pharma Wholesale and Distribution market today, and over the next 10 years:
-
Our 300-page report provides 109 tables and 144 charts/graphs exclusively to you.
-
The report highlights key lucrative areas in the industry so you can target them – NOW.
-
It contains in-depth analysis of global, regional and national sales and growth.
-
It highlights for you the key successful trends, changes and revenue projections made by your competitors.
This report tells you TODAY how the Pharma Wholesale and Distribution market will develop in the next 10 years, and in line with the variations in COVID-19 economic recession and bounce. This market is more critical now than at any point over the last 10 years.
Forecasts to 2034 and other analyses reveal commercial prospects
-
In addition to revenue forecasting to 2034, our new study provides you with recent results, growth rates, and market shares.
-
You will find original analyses, with business outlooks and developments.
-
Discover qualitative analyses (including market dynamics, drivers, opportunities, restraints and challenges), and recent developments.
This report includes data analysis and invaluable insight into how COVID-19 will affect the industry and your company. Four COVID-19 recovery patterns and their impact, namely, “V”, “L”, “W” and “U” are discussed in this report.
Segments Covered in the Report
Type
-
Wholesalers: Producer Wholesaler, Merchant Wholesaler, Agents and Brokers
-
Distributor: Single Party Distributor, Multi Party Distributor
Distribution Type
-
Ethical/Branded Pharma Products Distributors
-
Generic Pharma Products Distributors
-
Propaganda Cum Distribution (PCD) Franchise
-
OTC/Institutional Supply Pharma Distributors
-
Others
Product Type
-
Branded Pharmaceuticals
-
Generic Pharmaceuticals
-
Over-the-counter (OTC) Pharmaceuticals
-
Medical Devices
-
Vaccines
-
Others
In addition to the revenue predictions for the overall world market and segments, you will also find revenue forecasts for five regional and 24 leading national markets:
North America
Europe
-
Germany
-
France
-
UK
-
Italy
-
Spain
-
Russia
-
Rest of Europe
Asia Pacific
-
Japan
-
China
-
India
-
Australia
-
South Korea
-
Singapore
-
Rest of Asia Pacific
Latin America
-
Brazil
-
Mexico
-
Argentina
-
Colombia
-
Rest of Latin America
MEA
-
GCC
-
South Africa
-
Rest of MEA
The report also includes profiles and for some of the leading companies in the Pharma Wholesale and Distribution Market, 2024 to 2034, with a focus on this segment of these companies’ operations.
Leading companies and the potential for market growth
-
AmerisourceBergen Corporation
-
Cardinal Health, Inc.
-
CuraScript, Inc.
-
Dakota Drug, Inc.
-
Fortissa
-
Geo-Young Co., Ltd.
-
Kingworld Medicines Group Limited
-
Mckesson Corporation
-
Medipal Holdings Corporation
-
Mutual Drug
-
Petrone Group
-
Prodigy Health LLC
-
Sinopharm Group Co. Ltd.
-
Smith Drug Co., Inc.
-
Walgreens Boots Alliance, Inc.
Overall world revenue for Pharma Wholesale and Distribution Market, 2024 to 2034 in terms of value the market will surpass US$800.0 billion in 2024, our work calculates. We predict strong revenue growth through to 2034. Our work identifies which organizations hold the greatest potential. Discover their capabilities, progress, and commercial prospects, helping you stay ahead.
How will the Pharma Wholesale and Distribution Market, 2024 to 2034 report help you?
In summary, our 300+ page report provides you with the following knowledge:
-
Revenue forecasts to 2034 for Pharma Wholesale and Distribution Market, 2024 to 2034 Market, with forecasts for type, distribution type, product type, each forecast at a global and regional level – discover the industry’s prospects, finding the most lucrative places for investments and revenues.
-
Revenue forecasts to 2033 for five regional and 24 key national markets – See forecasts for the Pharma Wholesale and Distribution Market, 2024 to 2034 market in North America, Europe, Asia-Pacific, Latin America, and MEA. Also forecasted is the market in the US, Canada, Mexico, Brazil, Germany, France, UK, Italy, China, India, Japan, and Australia among other prominent economies.
-
Prospects for established firms and those seeking to enter the market – including company profiles for 15 of the major companies involved in the Pharma Wholesale and Distribution Market, 2024 to 2034.
Find quantitative and qualitative analyses with independent predictions. Receive information that only our report contains, staying informed with invaluable business intelligence.
Information found nowhere else
With our new report, you are less likely to fall behind in knowledge or miss out on opportunities. See how our work could benefit your research, analyses, and decisions. Visiongain’s study is for everybody needing commercial analyses for the Pharma Wholesale and Distribution Market, 2023 to 2033, market-leading companies. You will find data, trends and predictions.
ページTOPに戻る
Table of Contents
Table of Contents
1 Report Overview
1.1 Objectives of the Study
1.2 Introduction to Pharma Wholesale and Distribution Market
1.3 What This Report Delivers
1.4 Why You Should Read This Report
1.5 Key Questions Answered by This Analytical Report
1.6 Who is This Report for?
1.7 Methodology
1.7.1 Market Definitions
1.7.2 Market Evaluation & Forecasting Methodology
1.7.3 Data Validation
1.7.3.1 Primary Research
1.7.3.2 Secondary Research
1.8 Frequently Asked Questions (FAQs)
1.9 Associated Visiongain Reports
1.10 About Visiongain
2 Executive Summary
3 Market Overview
3.1 Key Findings
3.2 Market Dynamics
3.2.1 Market Driving Factors
3.2.1.1 Growing Global Pharmaceutical Sales
3.2.1.2 Increasing Government Initiatives for Pharmaceutical Products
3.2.1.3 Rising Seaborne Pharmaceutical Transportation
3.2.1.4 Technological Advancements in Pharmaceutical Distribution
3.2.1.5 Implementation of Track and Trace Solutions
3.2.2 Market Restraining Factors
3.2.2.1 Stringent Regulations Imposed by Government
3.2.2.2 Price Pressures Likely to Challenge Market Growth
3.2.2.3 Rise in Pharmaceutical Counterfeiting
3.2.3 Market Opportunities
3.2.3.1 Specializing in Niche Drugs and Therapies
3.2.3.2 Embracing E-commerce and Digital Technologies
3.2.3.3 Focusing on Sustainability and Ethical Sourcing
3.2.3.4 Implementation of AI in Pharmaceutical Supply Chain
3.3 COVID-19 Impact Analysis
3.4 Porter’s Five Forces Analysis
3.4.1 Bargaining Power of Suppliers
3.4.2 Bargaining Power of Buyers
3.4.3 Competitive Rivalry
3.4.4 Threat of Substitutes
3.4.5 Threat of New Entrants
3.5 PEST Analysis
4 Pharma Wholesale and Distribution Market Analysis by Type
4.1 Key Findings
4.2 Type Segment: Market Attractiveness Index
4.3 Pharma Wholesale and Distribution Market Size Estimation and Forecast by Type
4.4 Wholesalers
4.4.1 Market Size by Region, 2024-2034 (US$ Billion)
4.4.2 Market Share by Region, 2024 & 2034 (%)
4.4.3 Producer Wholesaler
4.4.3.1 Market Size by Region, 2024-2034 (US$ Billion)
4.4.3.2 Market Share by Region, 2024 & 2034 (%)
4.4.4 Merchant Wholesaler
4.4.4.1 Market Size by Region, 2024-2034 (US$ Billion)
4.4.4.2 Market Share by Region, 2024 & 2034 (%)
4.4.5 Agents and Brokers
4.4.5.1 Market Size by Region, 2024-2034 (US$ Billion)
4.4.5.2 Market Share by Region, 2024 & 2034 (%)
4.5 Distributor
4.5.1 Market Size by Region, 2024-2034 (US$ Billion)
4.5.2 Market Share by Region, 2024 & 2034 (%)
4.5.3 Single Party Distributor
4.5.3.1 Market Size by Region, 2024-2034 (US$ Billion)
4.5.3.2 Market Share by Region, 2024 & 2034 (%)
4.5.4 Multi Party Distributor
4.5.4.1 Market Size by Region, 2024-2034 (US$ Billion)
4.5.4.2 Market Share by Region, 2024 & 2034 (%)
5 Pharma Wholesale and Distribution Market Analysis by Distribution Type
5.1 Key Findings
5.2 Distribution Type Segment: Market Attractiveness Index
5.3 Pharma Wholesale and Distribution Market Size Estimation and Forecast by Distribution Type
5.4 Ethical/Branded Pharma Products Distributors
5.4.1 Market Size by Region, 2024-2034 (US$ Billion)
5.4.2 Market Share by Region, 2024 & 2034 (%)
5.5 Generic Pharma Products Distributors
5.5.1 Market Size by Region, 2024-2034 (US$ Billion)
5.5.2 Market Share by Region, 2024 & 2034 (%)
5.6 Propaganda Cum Distribution (PCD) Franchise
5.6.1 Market Size by Region, 2024-2034 (US$ Billion)
5.6.2 Market Share by Region, 2024 & 2034 (%)
5.7 OTC/Institutional Supply Pharma Distributors
5.7.1 Market Size by Region, 2024-2034 (US$ Billion)
5.7.2 Market Share by Region, 2024 & 2034 (%)
5.8 Others
5.8.1 Market Size by Region, 2024-2034 (US$ Billion)
5.8.2 Market Share by Region, 2024 & 2034 (%)
6 Pharma Wholesale and Distribution Market Analysis by Product Type
6.1 Key Findings
6.2 Product Type Segment: Market Attractiveness Index
6.3 Pharma Wholesale and Distribution Market Size Estimation and Forecast by Product Type
6.4 Branded Pharmaceuticals
6.4.1 Market Size by Region, 2024-2034 (US$ Billion)
6.4.2 Market Share by Region, 2024 & 2034 (%)
6.5 Generic Pharmaceuticals
6.5.1 Market Size by Region, 2024-2034 (US$ Billion)
6.5.2 Market Share by Region, 2024 & 2034 (%)
6.6 Over-the-counter (OTC) Pharmaceuticals
6.6.1 Market Size by Region, 2024-2034 (US$ Billion)
6.6.2 Market Share by Region, 2024 & 2034 (%)
6.7 Medical Devices
6.7.1 Market Size by Region, 2024-2034 (US$ Billion)
6.7.2 Market Share by Region, 2024 & 2034 (%)
6.8 Vaccines
6.8.1 Market Size by Region, 2024-2034 (US$ Billion)
6.8.2 Market Share by Region, 2024 & 2034 (%)
6.9 Others
6.9.1 Market Size by Region, 2024-2034 (US$ Billion)
6.9.2 Market Share by Region, 2024 & 2034 (%)
7 Pharma Wholesale and Distribution Market Analysis by Region
7.1 Key Findings
7.2 Regional Market Size Estimation and Forecast
8 North America Pharma Wholesale and Distribution Market Analysis
8.1 Key Findings
8.2 North America Pharma Wholesale and Distribution Market Attractiveness Index
8.3 North America Pharma Wholesale and Distribution Market by Country, 2024, 2029 & 2034 (US$ Billion)
8.4 North America Pharma Wholesale and Distribution Market Size Estimation and Forecast by Country
8.5 North America Pharma Wholesale and Distribution Market Size Estimation and Forecast by Type
8.6 North America Pharma Wholesale and Distribution Market Size Estimation and Forecast by Distribution Type
8.7 North America Pharma Wholesale and Distribution Market Size Estimation and Forecast by Product Type
8.8 U.S. Pharma Wholesale and Distribution Market Analysis
8.9 Canada Pharma Wholesale and Distribution Market Analysis
9 Europe Pharma Wholesale and Distribution Market Analysis
9.1 Key Findings
9.2 Europe Pharma Wholesale and Distribution Market Attractiveness Index
9.3 Europe Pharma Wholesale and Distribution Market by Country, 2024, 2029 & 2034 (US$ Billion)
9.4 Europe Pharma Wholesale and Distribution Market Size Estimation and Forecast by Country
9.5 Europe Pharma Wholesale and Distribution Market Size Estimation and Forecast by Type
9.6 Europe Pharma Wholesale and Distribution Market Size Estimation and Forecast by Distribution Type
9.7 Europe Pharma Wholesale and Distribution Market Size Estimation and Forecast by Product Type
9.8 Germany Pharma Wholesale and Distribution Market Analysis
9.9 France Pharma Wholesale and Distribution Market Analysis
9.10 UK Pharma Wholesale and Distribution Market Analysis
9.11 Italy Pharma Wholesale and Distribution Market Analysis
9.12 Spain Pharma Wholesale and Distribution Market Analysis
9.13 Russia Pharma Wholesale and Distribution Market Analysis
9.14 Rest of Europe Pharma Wholesale and Distribution Market Analysis
10 Asia Pacific Pharma Wholesale and Distribution Market Analysis
10.1 Key Findings
10.2 Asia Pacific Pharma Wholesale and Distribution Market Attractiveness Index
10.3 Asia Pacific Pharma Wholesale and Distribution Market by Country, 2024, 2029 & 2034 (US$ Billion)
10.4 Asia Pacific Pharma Wholesale and Distribution Market Size Estimation and Forecast by Country
10.5 Asia Pacific Pharma Wholesale and Distribution Market Size Estimation and Forecast by Type
10.6 Asia Pacific Pharma Wholesale and Distribution Market Size Estimation and Forecast by Distribution Type
10.7 Asia Pacific Pharma Wholesale and Distribution Market Size Estimation and Forecast by Product Type
10.8 Japan Pharma Wholesale and Distribution Market Analysis
10.9 China Pharma Wholesale and Distribution Market Analysis
10.10 India Pharma Wholesale and Distribution Market Analysis
10.11 Australia Pharma Wholesale and Distribution Market Analysis
10.12 South Korea Pharma Wholesale and Distribution Market Analysis
10.13 Singapore Pharma Wholesale and Distribution Market Analysis
10.14 Rest of Asia Pacific Pharma Wholesale and Distribution Market Analysis
11 Latin America Pharma Wholesale and Distribution Market Analysis
11.1 Key Findings
11.2 Latin America Pharma Wholesale and Distribution Market Attractiveness Index
11.3 Latin America Pharma Wholesale and Distribution Market by Country, 2024, 2029 & 2034 (US$ Billion)
11.4 Latin America Pharma Wholesale and Distribution Market Size Estimation and Forecast by Country
11.5 Latin America Pharma Wholesale and Distribution Market Size Estimation and Forecast by Type
11.6 Latin America Pharma Wholesale and Distribution Market Size Estimation and Forecast by Distribution Type
11.7 Latin America Pharma Wholesale and Distribution Market Size Estimation and Forecast by Product Type
11.8 Brazil Pharma Wholesale and Distribution Market Analysis
11.9 Mexico Pharma Wholesale and Distribution Market Analysis
11.10 Argentina Pharma Wholesale and Distribution Market Analysis
11.11 Colombia Pharma Wholesale and Distribution Market Analysis
11.12 Rest of Latin America Pharma Wholesale and Distribution Market Analysis
12 MEA Pharma Wholesale and Distribution Market Analysis
12.1 Key Findings
12.2 MEA Pharma Wholesale and Distribution Market Attractiveness Index
12.3 MEA Pharma Wholesale and Distribution Market by Country, 2024, 2029 & 2034 (US$ Billion)
12.4 MEA Pharma Wholesale and Distribution Market Size Estimation and Forecast by Country
12.5 MEA Pharma Wholesale and Distribution Market Size Estimation and Forecast by Type
12.6 MEA Pharma Wholesale and Distribution Market Size Estimation and Forecast by Distribution Type
12.7 MEA Pharma Wholesale and Distribution Market Size Estimation and Forecast by Product Type
12.8 GCC Pharma Wholesale and Distribution Market Analysis
12.9 South Africa Pharma Wholesale and Distribution Market Analysis
12.10 Rest of MEA Pharma Wholesale and Distribution Market Analysis
13 Company Profiles
13.1 Competitive Landscape, 2022
13.2 Strategic Outlook
13.3 AmerisourceBergen Corporation
13.3.1 Company Snapshot
13.3.2 Company Overview
13.3.3 Financial Analysis
13.3.3.1 Net Revenue, 2017-2022
13.3.3.2 Regional Market Shares, 2022
13.3.4 Service Benchmarking
13.3.5 Strategic Outlook
13.4 Cardinal Health, Inc.
13.4.1 Company Snapshot
13.4.2 Company Overview
13.4.3 Financial Analysis
13.4.3.1 Net Revenue, 2017-2022
13.4.3.2 Regional Market Shares, 2022
13.4.4 Service Benchmarking
13.4.5 Strategic Outlook
13.5 CuraScript, Inc.
13.5.1 Company Snapshot
13.5.2 Company Overview
13.5.3 Service Benchmarking
13.6 Dakota Drug, Inc.
13.6.1 Company Snapshot
13.6.2 Company Overview
13.6.3 Service Benchmarking
13.7 Fortissa
13.7.1 Company Snapshot
13.7.2 Company Overview
13.7.3 Service Benchmarking
13.8 Geo-Young Co., Ltd.
13.8.1 Company Snapshot
13.8.2 Company Overview
13.8.3 Service Benchmarking
13.9 Kingworld Medicines Group Limited
13.9.1 Company Snapshot
13.9.2 Company Overview
13.9.3 Service Benchmarking
13.10 Mckesson Corporation
13.10.1 Company Snapshot
13.10.2 Company Overview
13.10.3 Financial Analysis
13.10.3.1 Net Revenue, 2017-2022
13.10.3.2 Regional Market Shares, 2022
13.10.4 Service Benchmarking
13.10.5 Strategic Outlook
13.11 Medipal Holdings Corporation
13.11.1 Company Snapshot
13.11.2 Company Overview
13.11.3 Financial Analysis
13.11.3.1 Net Revenue, 2017-2022
13.11.4 Service Benchmarking
13.11.5 Strategic Outlook
13.12 Mutual Drug
13.12.1 Company Snapshot
13.12.2 Company Overview
13.12.3 Service Benchmarking
13.13 Petrone Group
13.13.1 Company Snapshot
13.13.2 Company Overview
13.13.3 Service Benchmarking
13.13.4 Strategic Outlook
13.14 Prodigy Health LLC
13.14.1 Company Snapshot
13.14.2 Company Overview
13.14.3 Service Benchmarking
13.15 Sinopharm Group Co. Ltd.
13.15.1 Company Snapshot
13.15.2 Company Overview
13.15.3 Financial Analysis
13.15.3.1 Net Revenue, 2017-2022
13.15.4 Service Benchmarking
13.15.5 Strategic Outlook
13.16 Smith Drug Co., Inc.
13.16.1 Company Snapshot
13.16.2 Company Overview
13.16.3 Service Benchmarking
13.17 Walgreens Boots Alliance, Inc.
13.17.1 Company Snapshot
13.17.2 Company Overview
13.17.3 Financial Analysis
13.17.3.1 Net Revenue, 2017-2022
13.17.4 Service Benchmarking
13.17.5 Strategic Outlook
14 Conclusion and Recommendations
14.1 Concluding Remarks from Visiongain
14.2 Recommendations for Market Players
ページTOPに戻る
List of Tables/Graphs
List of Tables
Table 1 Pharma Wholesale and Distribution Market Snapshot, 2024 & 2034 (US$ Billion, CAGR %)
Table 2 Pharma Wholesale and Distribution Market Forecast by Region, 2024-2034 (US$ Billion, AGR%, CAGR%): “V” Shaped Recovery
Table 3 Pharma Wholesale and Distribution Market Forecast by Region, 2024-2034 (US$ Billion, AGR%, CAGR%): “U” Shaped Recovery
Table 4 Pharma Wholesale and Distribution Market Forecast by Region, 2024-2034 (US$ Billion, AGR%, CAGR%): “W” Shaped Recovery
Table 5 Pharma Wholesale and Distribution Market Forecast by Region, 2024-2034 (US$ Billion, AGR%, CAGR%): “L” Shaped Recovery
Table 6 Pharma Wholesale and Distribution Market Forecast by Type, 2024-2034 (US$ Billion, AGR%, CAGR%)
Table 7 Wholesalers Segment Market Forecast by Region, 2024-2034 (US$ Billion, AGR%, CAGR%)
Table 8 Producer Wholesaler Segment Market Forecast by Region, 2024-2034 (US$ Billion, AGR%, CAGR%)
Table 9 Merchant Wholesaler Segment Market Forecast by Region, 2024-2034 (US$ Billion, AGR%, CAGR%)
Table 10 Agents and Brokers Segment Market Forecast by Region, 2024-2034 (US$ Billion, AGR%, CAGR%)
Table 11 Distributor Segment Market Forecast by Region, 2024-2034 (US$ Billion, AGR%, CAGR%)
Table 12 Single Party Distributor Segment Market Forecast by Region, 2024-2034 (US$ Billion, AGR%, CAGR%)
Table 13 Multi Party Distributor Segment Market Forecast by Region, 2024-2034 (US$ Billion, AGR%, CAGR%)
Table 14 Pharma Wholesale and Distribution Market Forecast by Distribution Type, 2024-2034 (US$ Billion, AGR%, CAGR%)
Table 15 Ethical/Branded Pharma Products Distributors Segment Market Forecast by Region, 2024-2034 (US$ Billion, AGR%, CAGR%)
Table 16 Generic Pharma Products Distributors Segment Market Forecast by Region, 2024-2034 (US$ Billion, AGR%, CAGR%)
Table 17 Propaganda Cum Distribution (PCD) Franchise Segment Market Forecast by Region, 2024-2034 (US$ Billion, AGR%, CAGR%)
Table 18 OTC/Institutional Supply Pharma Distributors Segment Market Forecast by Region, 2024-2034 (US$ Billion, AGR%, CAGR%)
Table 19 Others Segment Market Forecast by Region, 2024-2034 (US$ Billion, AGR%, CAGR%)
Table 20 Pharma Wholesale and Distribution Market Forecast by Product Type, 2024-2034 (US$ Billion, AGR%, CAGR%)
Table 21 Branded Pharmaceuticals Segment Market Forecast by Region, 2024-2034 (US$ Billion, AGR%, CAGR%)
Table 22 Generic Pharmaceuticals Segment Market Forecast by Region, 2024-2034 (US$ Billion, AGR%, CAGR%)
Table 23 Over-the-counter (OTC) Pharmaceuticals Segment Market Forecast by Region, 2024-2034 (US$ Billion, AGR%, CAGR%)
Table 24 Medical Devices Segment Market Forecast by Region, 2024-2034 (US$ Billion, AGR%, CAGR%)
Table 25 Vaccines Segment Market Forecast by Region, 2024-2034 (US$ Billion, AGR%, CAGR%)
Table 26 Others Segment Market Forecast by Region, 2024-2034 (US$ Billion, AGR%, CAGR%)
Table 27 Pharma Wholesale and Distribution Market Forecast by Region, 2024-2034 (US$ Billion, AGR%, CAGR%)
Table 28 North America Pharma Wholesale and Distribution Market Forecast by Country, 2024-2034 (US$ Billion, AGR%, CAGR%)
Table 29 North America Pharma Wholesale and Distribution Market Forecast by Type, 2024-2034 (US$ Billion, AGR%, CAGR%)
Table 30 North America Pharma Wholesale and Distribution Market Forecast by Distribution Type, 2024-2034 (US$ Billion, AGR%, CAGR%)
Table 31 North America Pharma Wholesale and Distribution Market Forecast by Product Type, 2024-2034 (US$ Billion, AGR%, CAGR%)
Table 32 U.S. Pharma Wholesale and Distribution Market Forecast, 2024-2034 (US$ Billion, AGR%, CAGR%)
Table 33 Canada Pharma Wholesale and Distribution Market Forecast, 2024-2034 (US$ Billion, AGR%, CAGR%)
Table 34 Europe Pharma Wholesale and Distribution Market Forecast by Country, 2024-2034 (US$ Billion, AGR%, CAGR%)
Table 35 Europe Pharma Wholesale and Distribution Market Forecast by Type, 2024-2034 (US$ Billion, AGR%, CAGR%)
Table 36 Europe Pharma Wholesale and Distribution Market Forecast by Distribution Type, 2024-2034 (US$ Billion, AGR%, CAGR%)
Table 37 Europe Pharma Wholesale and Distribution Market Forecast by Product Type, 2024-2034 (US$ Billion, AGR%, CAGR%)
Table 38 Germany Pharma Wholesale and Distribution Market Forecast, 2024-2034 (US$ Billion, AGR%, CAGR%)
Table 39 France Pharma Wholesale and Distribution Market Forecast, 2024-2034 (US$ Billion, AGR%, CAGR%)
Table 40 UK Pharma Wholesale and Distribution Market Forecast, 2024-2034 (US$ Billion, AGR%, CAGR%)
Table 41 Italy Pharma Wholesale and Distribution Market Forecast, 2024-2034 (US$ Billion, AGR%, CAGR%)
Table 42 Spain Pharma Wholesale and Distribution Market Forecast, 2024-2034 (US$ Billion, AGR%, CAGR%)
Table 43 Russia Pharma Wholesale and Distribution Market Forecast, 2024-2034 (US$ Billion, AGR%, CAGR%)
Table 44 Rest of Europe Pharma Wholesale and Distribution Market Forecast, 2024-2034 (US$ Billion, AGR%, CAGR%)
Table 45 Asia Pacific Pharma Wholesale and Distribution Market Forecast by Country, 2024-2034 (US$ Billion, AGR%, CAGR%)
Table 46 Asia Pacific Pharma Wholesale and Distribution Market Forecast by Type, 2024-2034 (US$ Billion, AGR%, CAGR%)
Table 47 Asia Pacific Pharma Wholesale and Distribution Market Forecast by Distribution Type, 2024-2034 (US$ Billion, AGR%, CAGR%)
Table 48 Asia Pacific Pharma Wholesale and Distribution Market Forecast by Product Type, 2024-2034 (US$ Billion, AGR%, CAGR%)
Table 49 Japan Pharma Wholesale and Distribution Market Forecast, 2024-2034 (US$ Billion, AGR%, CAGR%)
Table 50 China Pharma Wholesale and Distribution Market Forecast, 2024-2034 (US$ Billion, AGR%, CAGR%)
Table 51 India Pharma Wholesale and Distribution Market Forecast, 2024-2034 (US$ Billion, AGR%, CAGR%)
Table 52 Australia Pharma Wholesale and Distribution Market Forecast, 2024-2034 (US$ Billion, AGR%, CAGR%)
Table 53 South Korea Pharma Wholesale and Distribution Market Forecast, 2024-2034 (US$ Billion, AGR%, CAGR%)
Table 54 Singapore Pharma Wholesale and Distribution Market Forecast, 2024-2034 (US$ Billion, AGR%, CAGR%)
Table 55 Rest of Asia Pacific Pharma Wholesale and Distribution Market Forecast, 2024-2034 (US$ Billion, AGR%, CAGR%)
Table 56 Latin America Pharma Wholesale and Distribution Market Forecast by Country, 2024-2034 (US$ Billion, AGR%, CAGR%)
Table 57 Latin America Pharma Wholesale and Distribution Market Forecast by Type, 2024-2034 (US$ Billion, AGR%, CAGR%)
Table 58 Latin America Pharma Wholesale and Distribution Market Forecast by Distribution Type, 2024-2034 (US$ Billion, AGR%, CAGR%)
Table 59 Latin America Pharma Wholesale and Distribution Market Forecast by Product Type, 2024-2034 (US$ Billion, AGR%, CAGR%)
Table 60 Brazil Pharma Wholesale and Distribution Market Forecast, 2024-2034 (US$ Billion, AGR%, CAGR%)
Table 61 Mexico Pharma Wholesale and Distribution Market Forecast, 2024-2034 (US$ Billion, AGR%, CAGR%)
Table 62 Argentina Pharma Wholesale and Distribution Market Forecast, 2024-2034 (US$ Billion, AGR%, CAGR%)
Table 63 Colombia Pharma Wholesale and Distribution Market Forecast, 2024-2034 (US$ Billion, AGR%, CAGR%)
Table 64 Rest of Latin America Pharma Wholesale and Distribution Market Forecast, 2024-2034 (US$ Billion, AGR%, CAGR%)
Table 65 MEA Pharma Wholesale and Distribution Market Forecast by Country, 2024-2034 (US$ Billion, AGR%, CAGR%)
Table 66 MEA Pharma Wholesale and Distribution Market Forecast by Type, 2024-2034 (US$ Billion, AGR%, CAGR%)
Table 67 MEA Pharma Wholesale and Distribution Market Forecast by Distribution Type, 2024-2034 (US$ Billion, AGR%, CAGR%)
Table 68 MEA Pharma Wholesale and Distribution Market Forecast by Product Type, 2024-2034 (US$ Billion, AGR%, CAGR%)
Table 69 GCC Pharma Wholesale and Distribution Market Forecast, 2024-2034 (US$ Billion, AGR%, CAGR%)
Table 70 South Africa Pharma Wholesale and Distribution Market Forecast, 2024-2034 (US$ Billion, AGR%, CAGR%)
Table 71 Rest of MEA Pharma Wholesale and Distribution Market Forecast, 2024-2034 (US$ Billion, AGR%, CAGR%)
Table 72 Strategic Outlook
Table 73 AmerisourceBergen Corporation: Key Details, (CEO, HQ, Revenue, Founded, No. of Employees, Company Type, Website, Business Segment)
Table 74 AmerisourceBergen Corporation: Service Benchmarking
Table 75 AmerisourceBergen Corporation: Strategic Outlook
Table 76 Cardinal Health, Inc.: Key Details, (CEO, HQ, Revenue, Founded, No. of Employees, Company Type, Website, Business Segment)
Table 77 Cardinal Health, Inc.: Service Benchmarking
Table 78 Cardinal Health, Inc.: Strategic Outlook
Table 79 CuraScript, Inc.: Key Details, (CEO, HQ, Revenue, Founded, No. of Employees, Company Type, Website, Business Segment)
Table 80 CuraScript, Inc.: Service Benchmarking
Table 81 Dakota Drug, Inc.: Key Details, (CEO, HQ, Revenue, Founded, No. of Employees, Company Type, Website, Business Segment)
Table 82 Dakota Drug, Inc.: Service Benchmarking
Table 83 Fortissa: Key Details, (CEO, HQ, Revenue, Founded, No. of Employees, Company Type, Website, Business Segment)
Table 84 Fortissa: Service Benchmarking
Table 85 Geo-Young Co., Ltd.: Key Details, (CEO, HQ, Revenue, Founded, No. of Employees, Company Type, Website, Business Segment)
Table 86 Geo-Young Co., Ltd.: Service Benchmarking
Table 87 Kingworld Medicines Group Limited: Key Details, (CEO, HQ, Revenue, Founded, No. of Employees, Company Type, Website, Business Segment)
Table 88 Kingworld Medicines Group Limited: Service Benchmarking
Table 89 Mckesson Corporation: Key Details, (CEO, HQ, Revenue, Founded, No. of Employees, Company Type, Website, Business Segment)
Table 90 Mckesson Corporation: Service Benchmarking
Table 91 Mckesson Corporation: Strategic Outlook
Table 92 Medipal Holdings Corporation: Key Details, (CEO, HQ, Revenue, Founded, No. of Employees, Company Type, Website, Business Segment)
Table 93 Medipal Holdings Corporation: Service Benchmarking
Table 94 Medipal Holdings Corporation: Strategic Outlook
Table 95 Mutual Drug: Key Details, (CEO, HQ, Revenue, Founded, No. of Employees, Company Type, Website, Business Segment)
Table 96 Mutual Drug: Service Benchmarking
Table 97 Petrone Group: Key Details, (CEO, HQ, Revenue, Founded, No. of Employees, Company Type, Website, Business Segment)
Table 98 Petrone Group: Service Benchmarking
Table 99 Petrone Group: Strategic Outlook
Table 100 Prodigy Health LLC: Key Details, (CEO, HQ, Revenue, Founded, No. of Employees, Company Type, Website, Business Segment)
Table 101 Prodigy Health LLC: Service Benchmarking
Table 102 Sinopharm Group Co. Ltd.: Key Details, (CEO, HQ, Revenue, Founded, No. of Employees, Company Type, Website, Business Segment)
Table 103 Sinopharm Group Co. Ltd.: Service Benchmarking
Table 104 Sinopharm Group Co. Ltd.: Strategic Outlook
Table 105 Smith Drug Co., Inc.: Key Details, (CEO, HQ, Revenue, Founded, No. of Employees, Company Type, Website, Business Segment)
Table 106 Smith Drug Co., Inc.: Service Benchmarking
Table 107 Walgreens Boots Alliance, Inc.: Key Details, (CEO, HQ, Revenue, Founded, No. of Employees, Company Type, Website, Business Segment)
Table 108 Walgreens Boots Alliance, Inc.: Service Benchmarking
Table 109 Walgreens Boots Alliance, Inc.: Strategic Outlook
List of Figures
Figure 1 Pharma Wholesale and Distribution Market Segmentation
Figure 2 Pharma Wholesale and Distribution Market by Type: Market Attractiveness Index
Figure 3 Pharma Wholesale and Distribution Market by Distribution Type: Market Attractiveness Index
Figure 4 Pharma Wholesale and Distribution Market by Product Type: Market Attractiveness Index
Figure 5 Pharma Wholesale and Distribution Market Attractiveness Index by Region
Figure 6 Pharma Wholesale and Distribution Market: Market Dynamics
Figure 7 Pharma Wholesale and Distribution Market by Region, 2024-2034 (US$ Billion, AGR %): “V” Shaped Recovery
Figure 8 Pharma Wholesale and Distribution Market by Region, 2024-2034 (US$ Billion, AGR %): “U” Shaped Recovery
Figure 9 Pharma Wholesale and Distribution Market by Region, 2024-2034 (US$ Billion, AGR %): “W” Shaped Recovery
Figure 10 Pharma Wholesale and Distribution Market by Region, 2024-2034 (US$ Billion, AGR %): “L” Shaped Recovery
Figure 11 Pharma Wholesale and Distribution Market: Porter’s Five Forces Analysis
Figure 12 Pharma Wholesale and Distribution Market: PEST Analysis
Figure 13 Pharma Wholesale and Distribution Market by Type: Market Attractiveness Index
Figure 14 Pharma Wholesale and Distribution Market Forecast by Type, 2024-2034 (US$ Billion, AGR %)
Figure 15 Pharma Wholesale and Distribution Market Share Forecast by Type, 2023, 2028, 2033 (%)
Figure 16 Wholesalers Segment Market Forecast by Region, 2024-2034 (US$ Billion, AGR %)
Figure 17 Wholesalers Segment Market Share Forecast by Region, 2024 & 2034 (%)
Figure 18 Producer Wholesaler Segment Market Forecast by Region, 2024-2034 (US$ Billion, AGR %)
Figure 19 Producer Wholesaler Segment Market Share Forecast by Region, 2024 & 2034 (%)
Figure 20 Merchant Wholesaler Segment Market Forecast by Region, 2024-2034 (US$ Billion, AGR %)
Figure 21 Merchant Wholesaler Segment Market Share Forecast by Region, 2024 & 2034 (%)
Figure 22 Agents and Brokers Segment Market Forecast by Region, 2024-2034 (US$ Billion, AGR %)
Figure 23 Agents and Brokers Segment Market Share Forecast by Region, 2024 & 2034 (%)
Figure 24 Distributor Segment Market Forecast by Region, 2024-2034 (US$ Billion, AGR %)
Figure 25 Distributor Segment Market Share Forecast by Region, 2024 & 2034 (%)
Figure 26 Single Party Distributor Segment Market Forecast by Region, 2024-2034 (US$ Billion, AGR %)
Figure 27 Single Party Distributor Segment Market Share Forecast by Region, 2024 & 2034 (%)
Figure 28 Multi Party Distributor Segment Market Forecast by Region, 2024-2034 (US$ Billion, AGR %)
Figure 29 Multi Party Distributor Segment Market Share Forecast by Region, 2024 & 2034 (%)
Figure 30 Pharma Wholesale and Distribution Market by Distribution Type: Market Attractiveness Index
Figure 31 Pharma Wholesale and Distribution Market Forecast by Distribution Type, 2024-2034 (US$ Billion, AGR %)
Figure 32 Pharma Wholesale and Distribution Market Share Forecast by Distribution Type, 2024, 2029, 2034 (%)
Figure 33 Ethical/Branded Pharma Products Distributors Segment Market Forecast by Region, 2024-2034 (US$ Billion, AGR %)
Figure 34 Ethical/Branded Pharma Products Distributors Segment Market Share Forecast by Region, 2024 & 2034 (%)
Figure 35 Generic Pharma Products Distributors Segment Market Forecast by Region, 2024-2034 (US$ Billion, AGR %)
Figure 36 Generic Pharma Products Distributors Segment Market Share Forecast by Region, 2024 & 2034 (%)
Figure 37 Propaganda Cum Distribution (PCD) Franchise Segment Market Forecast by Region, 2024-2034 (US$ Billion, AGR %)
Figure 38 Propaganda Cum Distribution (PCD) Franchise Segment Market Share Forecast by Region, 2024 & 2034 (%)
Figure 39 OTC/Institutional Supply Pharma Distributors Segment Market Forecast by Region, 2024-2034 (US$ Billion, AGR %)
Figure 40 OTC/Institutional Supply Pharma Distributors Segment Market Share Forecast by Region, 2024 & 2034 (%)
Figure 41 Others Segment Market Forecast by Region, 2024-2034 (US$ Billion, AGR %)
Figure 42 Others Segment Market Share Forecast by Region, 2024 & 2034 (%)
Figure 43 Pharma Wholesale and Distribution Market by Product Type: Market Attractiveness Index
Figure 44 Pharma Wholesale and Distribution Market Forecast by Product Type, 2024-2034 (US$ Billion, AGR %)
Figure 45 Pharma Wholesale and Distribution Market Share Forecast by Product Type, 2024, 2029, 2034 (%)
Figure 46 Branded Pharmaceuticals Segment Market Forecast by Region, 2024-2034 (US$ Billion, AGR %)
Figure 47 Branded Pharmaceuticals Segment Market Share Forecast by Region, 2024 & 2034 (%)
Figure 48 Generic Pharmaceuticals Segment Market Forecast by Region, 2024-2034 (US$ Billion, AGR %)
Figure 49 Generic Pharmaceuticals Segment Market Share Forecast by Region, 2024 & 2034 (%)
Figure 50 Over-the-counter (OTC) Pharmaceuticals Segment Market Forecast by Region, 2024-2034 (US$ Billion, AGR %)
Figure 51 Over-the-counter (OTC) Pharmaceuticals Segment Market Share Forecast by Region, 2024 & 2034 (%)
Figure 52 Medical Devices Segment Market Forecast by Region, 2024-2034 (US$ Billion, AGR %)
Figure 53 Medical Devices Segment Market Share Forecast by Region, 2024 & 2034 (%)
Figure 54 Vaccines Segment Market Forecast by Region, 2024-2034 (US$ Billion, AGR %)
Figure 55 Vaccines Segment Market Share Forecast by Region, 2024 & 2034 (%)
Figure 56 Others Segment Market Forecast by Region, 2024-2034 (US$ Billion, AGR %)
Figure 57 Others Segment Market Share Forecast by Region, 2024 & 2034 (%)
Figure 58 Pharma Wholesale and Distribution Market Forecast by Region 2024 and 2034 (Revenue, CAGR%)
Figure 59 Pharma Wholesale and Distribution Market Share Forecast by Region 2024, 2029, 2034 (%)
Figure 60 Pharma Wholesale and Distribution Market by Region, 2024-2034 (US$ Billion, AGR %)
Figure 61 North America Pharma Wholesale and Distribution Market Attractiveness Index
Figure 62 North America Pharma Wholesale and Distribution Market by Region, 2024, 2029 & 2034 (US$ Billion)
Figure 63 North America Pharma Wholesale and Distribution Market Forecast by Country, 2024-2034 (US$ Billion, AGR %)
Figure 64 North America Pharma Wholesale and Distribution Market Share Forecast by Country, 2024 & 2034 (%)
Figure 65 North America Pharma Wholesale and Distribution Market Forecast by Type, 2024-2034 (US$ Billion, AGR %)
Figure 66 North America Pharma Wholesale and Distribution Market Share Forecast by Type, 2024 & 2034 (%)
Figure 67 North America Pharma Wholesale and Distribution Market Forecast by Distribution Type, 2024-2034 (US$ Billion, AGR %)
Figure 68 North America Pharma Wholesale and Distribution Market Share Forecast by Distribution Type, 2024 & 2034 (%)
Figure 69 North America Pharma Wholesale and Distribution Market Forecast by Product Type, 2024-2034 (US$ Billion, AGR %)
Figure 70 North America Pharma Wholesale and Distribution Market Share Forecast by Product Type, 2024 & 2034 (%)
Figure 71 U.S. Pharma Wholesale and Distribution Market Forecast, 2024-2034 (US$ Billion, AGR %)
Figure 72 Canada Pharma Wholesale and Distribution Market Forecast, 2024-2034 (US$ Billion, AGR %)
Figure 73 Europe Pharma Wholesale and Distribution Market Attractiveness Index
Figure 74 Europe Pharma Wholesale and Distribution Market by Region, 2024, 2029 & 2034 (US$ Billion)
Figure 75 Europe Pharma Wholesale and Distribution Market Forecast by Country, 2024-2034 (US$ Billion, AGR %)
Figure 76 Europe Pharma Wholesale and Distribution Market Share Forecast by Country, 2024 & 2034 (%)
Figure 77 Europe Pharma Wholesale and Distribution Market Forecast by Type, 2024-2034 (US$ Billion, AGR %)
Figure 78 Europe Pharma Wholesale and Distribution Market Share Forecast by Type, 2024 & 2034 (%)
Figure 79 Europe Pharma Wholesale and Distribution Market Forecast by Distribution Type, 2024-2034 (US$ Billion, AGR %)
Figure 80 Europe Pharma Wholesale and Distribution Market Share Forecast by Distribution Type, 2024 & 2034 (%)
Figure 81 Europe Pharma Wholesale and Distribution Market Forecast by Product Type, 2024-2034 (US$ Billion, AGR.%)
Figure 82 Europe Pharma Wholesale and Distribution Market Share Forecast by Product Type, 2024 & 2034 (%)
Figure 83 Germany Pharma Wholesale and Distribution Market Forecast, 2024-2034 (US$ Billion, AGR %)
Figure 84 France Pharma Wholesale and Distribution Market Forecast, 2024-2034 (US$ Billion, AGR %)
Figure 85 UK Pharma Wholesale and Distribution Market Forecast, 2024-2034 (US$ Billion, AGR %)
Figure 86 Italy Pharma Wholesale and Distribution Market Forecast, 2024-2034 (US$ Billion, AGR %)
Figure 87 Spain Pharma Wholesale and Distribution Market Forecast, 2024-2034 (US$ Billion, AGR %)
Figure 88 Russia Pharma Wholesale and Distribution Market Forecast, 2024-2034 (US$ Billion, AGR %)
Figure 89 Rest of Europe Pharma Wholesale and Distribution Market Forecast, 2024-2034 (US$ Billion, AGR %)
Figure 90 Asia Pacific Pharma Wholesale and Distribution Market Attractiveness Index
Figure 91 Asia Pacific Pharma Wholesale and Distribution Market by Region, 2024, 2029 & 2034 (US$ Billion)
Figure 92 Asia Pacific Pharma Wholesale and Distribution Market Forecast by Country, 2024-2034 (US$ Billion, AGR %)
Figure 93 Asia Pacific Pharma Wholesale and Distribution Market Share Forecast by Country, 2024 & 2034 (%)
Figure 94 Asia Pacific Pharma Wholesale and Distribution Market Forecast by Type, 2024-2034 (US$ Billion, AGR %)
Figure 95 Asia Pacific Pharma Wholesale and Distribution Market Share Forecast by Type, 2024 & 2034 (%)
Figure 96 Asia Pacific Pharma Wholesale and Distribution Market Forecast by Distribution Type, 2024-2034 (US$ Billion, AGR %)
Figure 97 Asia Pacific Pharma Wholesale and Distribution Market Share Forecast by Distribution Type, 2024 & 2034 (%)
Figure 98 Asia Pacific Pharma Wholesale and Distribution Market Forecast by Product Type, 2024-2034 (US$ Billion, AGR %)
Figure 99 Asia Pacific Pharma Wholesale and Distribution Market Share Forecast by Product Type, 2024 & 2034 (%)
Figure 100 Japan Pharma Wholesale and Distribution Market Forecast, 2024-2034 (US$ Billion, AGR %)
Figure 101 China Pharma Wholesale and Distribution Market Forecast, 2024-2034 (US$ Billion, AGR %)
Figure 102 India Pharma Wholesale and Distribution Market Forecast, 2024-2034 (US$ Billion, AGR %)
Figure 103 Australia Pharma Wholesale and Distribution Market Forecast, 2024-2034 (US$ Billion, AGR %)
Figure 104 South Korea Pharma Wholesale and Distribution Market Forecast, 2024-2034 (US$ Billion, AGR %)
Figure 105 Singapore Pharma Wholesale and Distribution Market Forecast, 2024-2034 (US$ Billion, AGR %)
Figure 106 Rest of Asia Pacific Pharma Wholesale and Distribution Market Forecast, 2024-2034 (US$ Billion, AGR %)
Figure 107 Latin America Pharma Wholesale and Distribution Market Attractiveness Index
Figure 108 Latin America Pharma Wholesale and Distribution Market by Region, 2024, 2029 & 2034 (US$ Billion)
Figure 109 Latin America Pharma Wholesale and Distribution Market Forecast by Country, 2024-2034 (US$ Billion, AGR %)
Figure 110 Latin America Pharma Wholesale and Distribution Market Share Forecast by Country, 2024 & 2034 (%)
Figure 111 Latin America Pharma Wholesale and Distribution Market Forecast by Type, 2024-2034 (US$ Billion, AGR %)
Figure 112 Latin America Pharma Wholesale and Distribution Market Share Forecast by Type, 2024 & 2034 (%)
Figure 113 Latin America Pharma Wholesale and Distribution Market Forecast by Distribution Type, 2024-2034 (US$ Billion, AGR %)
Figure 114 Latin America Pharma Wholesale and Distribution Market Share Forecast by Distribution Type, 2024 & 2034 (%)
Figure 115 Latin America Pharma Wholesale and Distribution Market Forecast by Product Type, 2024-2034 (US$ Billion, AGR %)
Figure 116 Latin America Pharma Wholesale and Distribution Market Share Forecast by Product Type, 2024 & 2034 (%)
Figure 117 Brazil Pharma Wholesale and Distribution Market Forecast, 2024-2034 (US$ Billion, AGR %)
Figure 118 Mexico Pharma Wholesale and Distribution Market Forecast, 2024-2034 (US$ Billion, AGR %)
Figure 119 Argentina Pharma Wholesale and Distribution Market Forecast, 2024-2034 (US$ Billion, AGR %)
Figure 120 Colombia Pharma Wholesale and Distribution Market Forecast, 2024-2034 (US$ Billion, AGR %)
Figure 121 Rest of Latin America Pharma Wholesale and Distribution Market Forecast, 2024-2034 (US$ Billion, AGR %)
Figure 122 MEA Pharma Wholesale and Distribution Market Attractiveness Index
Figure 123 MEA Pharma Wholesale and Distribution Market by Region, 2024, 2029 & 2034 (US$ Billion)
Figure 124 MEA Pharma Wholesale and Distribution Market Forecast by Country, 2024-2034 (US$ Billion, AGR %)
Figure 125 MEA Pharma Wholesale and Distribution Market Share Forecast by Country, 2024 & 2034 (%)
Figure 126 MEA Pharma Wholesale and Distribution Market Forecast by Type, 2024-2034 (US$ Billion, AGR %)
Figure 127 MEA Pharma Wholesale and Distribution Market Share Forecast by Type, 2024 & 2034 (%)
Figure 128 MEA Pharma Wholesale and Distribution Market Forecast by Distribution Type, 2024-2034 (US$ Billion, AGR %)
Figure 129 MEA Pharma Wholesale and Distribution Market Share Forecast by Distribution Type, 2024 & 2034 (%)
Figure 130 MEA Pharma Wholesale and Distribution Market Forecast by Product Type, 2024-2034 (US$ Billion, AGR %)
Figure 131 MEA Pharma Wholesale and Distribution Market Share Forecast by Product Type, 2024 & 2034 (%)
Figure 132 GCC Pharma Wholesale and Distribution Market Forecast, 2024-2034 (US$ Billion, AGR %)
Figure 133 South Africa Pharma Wholesale and Distribution Market Forecast, 2024-2034 (US$ Billion, AGR %)
Figure 134 Rest of MEA Pharma Wholesale and Distribution Market Forecast, 2024-2034 (US$ Billion, AGR %)
Figure 135 Pharma Wholesale and Distribution Market: Company Share/Ranking, 2022
Figure 136 AmerisourceBergen Corporation: Net Revenue, 2017-2022 (US$ Million, AGR %)
Figure 137 AmerisourceBergen Corporation: Regional Market Shares, 2022
Figure 138 Cardinal Health, Inc.: Net Revenue, 2017-2022 (US$ Million, AGR %)
Figure 139 Cardinal Health, Inc.: Regional Market Shares, 2022
Figure 140 Mckesson Corporation: Net Revenue, 2017-2022 (US$ Million, AGR %)
Figure 141 Mckesson Corporation: Regional Market Shares, 2022
Figure 142 Medipal Holdings Corporation: Net Revenue, 2017-2022 (US$ Million, AGR %)
Figure 143 Sinopharm Group Co. Ltd.: Net Revenue, 2017-2022 (US$ Million, AGR %)
Figure 144 Walgreens Boots Alliance, Inc.: Net Revenue, 2017-2022 (US$ Million, AGR %)
ページTOPに戻る
- 医療機器市場調査レポート:機器の種類別、用途別、エンドユーザー別、地域別(2035年までの予測)
- 施術方法別体脂肪減少市場調査レポート[外科的(脂肪吸引、腹部整形)、 非外科的(クライオリポライシス、レーザー脂肪除去、高周波(RF)治療、その他)、薬物療法)、部位別(腹部、太もも、腕、背中、顎・首、全身)、用途別(肥満管理、ボディスカルプティング、産後ケア)、および地域別(北米、欧州、アジア太平洋、南米、中東・アフリカ) 2035年までの予測
- 自己検査市場の規模、シェアおよび動向分析レポート:製品別(キット、機器、テストストリップ)、検体別(血液、尿、便)、用途別、流通チャネル別、利用形態別、地域別、およびセグメント別予測(2026年~2033年)
- 梅毒検査市場の規模、シェアおよび動向分析レポート:技術別(分子診断、免疫測定法)、検査実施場所別(臨床検査、ポイント・オブ・ケア検査)、地域別(北米、欧州、アジア太平洋、ラテンアメリカ、中東・アフリカ)、およびセグメント別予測(2026年~2033年)
- ビリルビン検査市場規模、シェアおよび動向分析レポート:製品別(検査カートリッジ・ストリップ、専用血液ビリルビン分析装置)、検査方法別、患者層別(新生児)、用途別、最終用途別、地域別、およびセグメント別予測(2026年~2033年)
- 犬預かりサービス市場規模、シェアおよび動向分析レポート:犬種別(小型犬、中型犬、大型犬)、サービス別(長期、短期)、提供チャネル別(施設内、自宅)、地域別、およびセグメント別予測(2026年~2033年)
- 伴侶動物向け再生医療市場の規模、シェアおよび動向分析レポート:製品別(幹細胞、多血小板血漿(PRP))、動物別(犬、猫、馬)、用途別(整形外科、外傷・創傷ケア)、最終用途別、地域別、およびセグメント別予測(2026年~2033年)
- Animal Health Market Size, Share & Trends Analysis Report By Product (Biologics, Pharmaceuticals, Diagnostics), By Animal (Companion, Production), By Distribution Channel (Retail, E-Commerce), By End Use, By Region, And Segment Forecasts, 2026 - 2033
- 迅速検査市場の規模、シェアおよび動向分析レポート:製品別(機器、消耗品)、技術別(免疫測定法、分子診断法)、用途別、最終用途別、地域別、およびセグメント別予測(2026年~2033年)
- 腎機能検査市場の規模、シェアおよび動向分析レポート:製品別(クリアランス検査、尿検査、血液検査、希釈・濃縮検査)、用途別(病院、診断検査室)、地域別、およびセグメント別予測(2026年~2033年)
本レポートと同じKEY WORD(pharma)の最新刊レポート
- 本レポートと同じKEY WORDの最新刊レポートはありません。
よくあるご質問
Visiongain社はどのような調査会社ですか?
英国の調査会社ヴィジョンゲイン社(Visiongain)は、通信とエネルギーのほか、自動車や化学・医薬品、金属など、広範な市場を対象に調査を行っています。自動車市場については、市場全般に関する調査のほ... もっと見る
調査レポートの納品までの日数はどの程度ですか?
在庫のあるものは速納となりますが、平均的には 3-4日と見て下さい。
但し、一部の調査レポートでは、発注を受けた段階で内容更新をして納品をする場合もあります。
発注をする前のお問合せをお願いします。
注文の手続きはどのようになっていますか?
1)お客様からの御問い合わせをいただきます。
2)見積書やサンプルの提示をいたします。
3)お客様指定、もしくは弊社の発注書をメール添付にて発送してください。
4)データリソース社からレポート発行元の調査会社へ納品手配します。
5) 調査会社からお客様へ納品されます。最近は、pdfにてのメール納品が大半です。
お支払方法の方法はどのようになっていますか?
納品と同時にデータリソース社よりお客様へ請求書(必要に応じて納品書も)を発送いたします。
お客様よりデータリソース社へ(通常は円払い)の御振り込みをお願いします。
請求書は、納品日の日付で発行しますので、翌月最終営業日までの当社指定口座への振込みをお願いします。振込み手数料は御社負担にてお願いします。
お客様の御支払い条件が60日以上の場合は御相談ください。
尚、初めてのお取引先や個人の場合、前払いをお願いすることもあります。ご了承のほど、お願いします。
データリソース社はどのような会社ですか?
当社は、世界各国の主要調査会社・レポート出版社と提携し、世界各国の市場調査レポートや技術動向レポートなどを日本国内の企業・公官庁及び教育研究機関に提供しております。
世界各国の「市場・技術・法規制などの」実情を調査・収集される時には、データリソース社にご相談ください。
お客様の御要望にあったデータや情報を抽出する為のレポート紹介や調査のアドバイスも致します。
|
|

