セルベースアッセイ市場レポート:2024-2034
Cell-Based Assays Market Report 2024-2034
レポート詳細
セルベースアッセイ市場レポート 2024-2034年 :本レポートは、業界とその基礎となるダイナミクスをより良く理解したい場合、新たな収益ポケットを目指す大手企業にとって貴重なものと... もっと見る
※上記価格は部署ライセンス(Departmental licence)価格です。
その他の価格についてはデータリソースまでお問合せください。
日本語のページは自動翻訳を利用し作成しています。
実際のレポートは英文のみでご納品いたします。

|

|
サマリー
レポート詳細
セルベースアッセイ市場レポート 2024-2034年:本レポートは、業界とその基礎となるダイナミクスをより良く理解したい場合、新たな収益ポケットを目指す大手企業にとって貴重なものとなるでしょう。異業種への進出や新規地域での既存事業の拡大を目指す企業にも有用です。
バイオテクノロジー業界の進歩が業界の成長を促進する
バイオテクノロジー、特にゲノミクス、プロテオミクス、細胞生物学の進歩は、洗練されたセルベースアッセイの需要を促進する上で極めて重要な役割を果たしている。これらの技術的進歩の融合は、研究者に新たな道を開き、細胞機能、シグナル伝達経路、複雑な分子相互作用の複雑さをより深く掘り下げることを可能にしている。例えば、2023年のバイオテクノロジーによる医薬品売上は3,040億ドルで、近年一貫して増加傾向にある。予測によれば、この数字は2026年までに5,050億ドルにまで上昇すると見込まれている。これに対し、従来の医薬品市場は同年に6810億ドルに達すると予想されている。さらに、世界のバイオテクノロジー・セクターは、がん領域の普及を経験し、約39%という大きなシェアを占めている。このことは、がん治療と療法の進歩に向けられた注目と投資の大きさを浮き彫りにしている。
ゲノミクスの分野は、ハイスループット・シーケンス技術の登場によって目覚ましい進歩を遂げ、研究者はゲノム全体をかつてないスピードと精度で解析できるようになった。この豊富な遺伝子情報は、疾患の分子基盤を理解し、潜在的な治療標的を同定するための基盤となった。ゲノミクスと並行して、セルベースアッセイはこの遺伝的知識を活用し、特定の遺伝子や変異が細胞機能にどのような影響を与えるかを研究し、より的を絞った個別化された医薬品開発戦略への道を開いている。
セルベースアッセイの高コストが業界の成長を阻む可能性が高い
洗練されたセルベースアッセイの開発と導入は、かなりの経済的負担を強いるものであり、予算が限られている小規模の研究機関や研究所にとっては、手ごわい障壁となっている。このような多額の初期費用の主な要因は、高度な機器や特殊な試薬の購入、アッセイ設計と実行のための熟練した人材の維持などである。ハイコンテントイメージングシステムや自動リキッドハンドリングプラットフォームのような最先端技術には高額な値札がついており、小規模施設にとっては経済的に困難なものとなっている。高度なアッセイの複雑さに合わせた特殊な試薬の需要は、全体的なコストをさらにエスカレートさせる。
市場調査レポートを購入する前にすべき質問とは?
- セルベースドアッセイ市場はどのように進化しているのか?
- セルベースドアッセイ市場の推進要因と阻害要因は何か?
- セルベースドアッセイの各サブマーケットセグメントは予測期間中にどのように成長し、2034年にはどれくらいの収益を占めるようになるのか?
- 2024年から2034年にかけて、セルベースドアッセイの各サブマーケットの市場シェアはどのように推移するのか?
- 2024年から2034年にかけて市場全体を牽引する主な要因は何か?
- セルベースドアッセイの主要市場はマクロ経済ダイナミクスに概ね追随するのか、それとも個々の国市場が他を凌駕するのか?
- 2034年までに各国市場のシェアはどのように変化し、2034年にはどの地域が市場をリードするのか?
- 主要プレイヤーは誰で、予測期間中の見通しは?
- これらの主要企業のセルベースアッセイプロジェクトは?
- 2024年から2034年の間に、業界はどのように発展していくのか?現在および今後10年間に実施されるセルベースドアッセイのプロジェクトにはどのような意味があるのか?
- セルベースドアッセイ市場をさらに拡大するために、製品の商業化の必要性は高まっているか?
- セルベースドアッセイ市場はどこへ向かっているのか?
- 新製品やサービスラインへの最適な投資方法とは?
- 企業を新たな成長軌道に乗せ、C-suiteに移行させるための重要な展望とは?
このことがセルベースアッセイ市場に現在、そして今後10年間、どのような影響を与えるかを見極める必要がある:
- 314ページにわたる本レポートでは、114の表と170の図表を掲載しています。
- 本レポートでは、業界における主要な有利分野を取り上げているため、今すぐターゲットを絞ることができます。
- 本レポートには、世界、地域、国の売上と成長に関する詳細な分析が含まれています。
- 競合他社が成功した主なトレンド、変化、収益予測をハイライトしています。
本レポートは、セルベースアッセイ市場が今後10年間にどのように発展するか、またCOVID-19の景気後退と好転の変動に合わせてどのように発展するかをお伝えします。この市場は過去10年間のどの時点よりも今が重要である。
2034年までの予測やその他の分析から、商業的な展望が明らかになる
- 2034年までの収益予測に加え、直近の実績、成長率、市場シェアを提供します。
- ビジネスの展望と展開に関する独自の分析をご覧いただけます。
- 質的分析(市場ダイナミクス、促進要因、機会、阻害要因、課題を含む)、コスト構造、セルベースアッセイ価格上昇の影響、最新動向をご覧いただけます。
本レポートには、COVID-19が業界と貴社にどのような影響を与えるかについてのデータ分析と貴重な洞察が含まれている。本レポートでは、COVID-19の4つの回収パターンとその影響、すなわち「V」、「L」、「W」、「U」について論じている。
レポート対象セグメント
製品
・ マイクロプレート
- マイクロプレート
- マイクロプレートリーダー
- リキッドハンドリングシステム
- インキュベーター
- 顕微鏡
- その他
・ 消耗品
- 試薬
- アッセイキット
- 細胞株
- プローブ&ラベル
- その他
・ ソフトウェア
・ サービス
用途
- 創薬
- 基礎研究
- ADME試験
- トキシコロジー
- その他
エンドユーザー
- 製薬・バイオテクノロジー企業
- 学術機関
- CRO
- その他
世界市場全体と各分野の収益予測に加え、5つの地域と24の主要国市場の収益予測も掲載している:
北米
- アメリカ
- カナダ
欧州
- ドイツ
- フランス
- 英国
- イタリア
- スペイン
- ロシア
- その他の欧州
アジア太平洋
- 日本
- 中国
- インド
- オーストラリア
- 韓国
- シンガポール
- その他のアジア太平洋地域
ラテンアメリカ
- ブラジル
- メキシコ
- アルゼンチン
- コロンビア
- その他のラテンアメリカ
MEA
- GCC
- 南アフリカ
- その他のMEA
本レポートには、セルベースアッセイ市場2024-2034における主要企業のプロファイルも掲載されており、これらの企業の事業のこのセグメントに焦点を当てている。
報告書に掲載されている主要企業
・ Agilent Technologies Inc.
・ Becton, Dickinson and Company
・ BioAgilytix Labs LLC
・ Bio-Rad Laboratories
・ BioVision Inc.
・ Charles River Laboratories
・ Cisbio (Revvity)
・ Danaher Corporation
・ DiscoverX (Eurofins)
・ F. Hoffmann-La Roche Ltd
・ GE HealthCare
・ InSphero
・ Merck KGaA
・ Thermo Fisher Scientific Inc.
2024年から2034年までのセルベースアッセイ市場全体の世界売上高(金額ベース)は、2024年に188億米ドルを突破する。2034年まで力強い収益成長を予測。当研究所では、最も大きな可能性を秘めた組織を特定しています。各組織の能力、進捗状況、商業的展望を把握することで、常に一歩先を行くことができます。
セルベースアッセイ市場、2024-2034年レポートはどのようにお役に立ちますか?
要約すると、310ページを超えるこのレポートは、以下の知識を提供する:
- セルベースアッセイ市場の2024年から2034年までの収益予測 市場(製品、用途、エンドユーザー)ごとの予測を世界および地域レベルで掲載 - 業界の将来性を発見し、投資と収益に最も有利な場所を見つけることができます。
- 5つの地域と24の主要国市場の2034年までの収益予測 - 北米、ヨーロッパ、アジア太平洋、ラテンアメリカ、MEAのセルベースアッセイ市場2024年から2034年までの予測をご覧ください。また、米国、カナダ、メキシコ、ブラジル、ドイツ、フランス、英国、イタリア、中国、インド、日本、オーストラリアなどの主要経済圏の市場も予測しています。
- 既存企業および市場参入を目指す企業の展望 - セルベースアッセイ市場2024年から2034年に関わる主要企業15社の企業プロファイルを含む。
独自の予測による定量的・定性的分析をご覧ください。私たちのレポートだけに含まれる情報を入手し、貴重なビジネスインテリジェンスで情報を得ることができます。
他にはない情報
私たちの新しいレポートがあれば、知識に遅れをとったり、チャンスを逃したりする可能性が低くなります。Visiongainの調査レポートが貴社の研究、分析、意思決定にどのように役立つかをご覧ください。Visiongainの調査は、セルベースアッセイ市場、2024年から2034年、市場をリードする企業の商業分析を必要とするすべての人のためのものです。データ、トレンド、予測をご覧いただけます。
ページTOPに戻る
目次
目次
1 レポート概要
1.1 研究の目的
1.2 セルベースアッセイ市場の紹介
1.3 本レポートの特徴
1.4 本レポートを読むべき理由
1.5 本分析レポートが回答する主な質問
1.6 本レポートは誰のためのものか?
1.7 方法論
1.7.1 市場の定義
1.7.2 市場評価・予測手法
1.7.3 データの検証
1.7.3.1 一次調査
1.7.3.2 セカンダリーリサーチ
1.8 よくある質問(FAQ)
1.9 Visiongainの関連レポート
1.10 Visiongainについて
2 エグゼクティブ・サマリー
3 市場概要
3.1 主要な調査結果
3.2 市場ダイナミクス
3.2.1 市場促進要因
3.2.1.1 創薬・薬剤開発におけるセルベースアッセイのニーズの高まり
3.2.1.2 バイオテクノロジーの進歩
3.2.1.3 精密医療への需要の高まりが細胞培養アッセイ市場に好影響を与える
3.2.1.4 細胞ベースの研究に対する資金提供の増加
3.2.1.5 慢性疾患の有病率の上昇
3.2.2 市場抑制要因
3.2.2.1 セルベースアッセイに関連する高コスト
3.2.2.2 セルベース・アッセイの技術的複雑性
3.2.2.3 標準化の欠如
3.2.3 市場機会
3.2.3.1 ラベルフリーセルベースアッセイの採用拡大
3.2.3.2 高度なアッセイの基礎となる3D細胞培養モデル
3.2.3.3 細胞ベースアッセイの需要を促進するハイスループットスクリーニング
3.3 COVID-19インパクト分析
3.4 ポーターのファイブフォース分析
3.4.1 サプライヤーの交渉力
3.4.2 バイヤーの交渉力
3.4.3 競争相手のライバル関係
3.4.4 代替品による脅威
3.4.5 新規参入企業の脅威
3.5 PEST分析
4 セルベースアッセイ市場分析:製品別
4.1 主要な調査結果
4.2 製品セグメント 市場魅力度指数
4.3 セルベースアッセイの製品別市場規模の推定と予測
4.4 測定機器
4.4.1 2024〜2034年の地域別市場規模(US$ Million)
4.4.2 地域別市場シェア、2024年・2034年(%)
4.4.3 マイクロプレート
4.4.3.1 2024~2034年の地域別市場規模(US$ Million)
4.4.3.2 地域別市場シェア、2024年・2034年(%)
4.4.4 マイクロプレートリーダー
4.4.4.1 2024~2034年の地域別市場規模(US$ Million)
4.4.4.2 地域別市場シェア、2024年・2034年(%)
4.4.5 リキッドハンドリングシステム
4.4.5.1 2024~2034年の地域別市場規模(US$ Million)
4.4.5.2 地域別市場シェア、2024年・2034年(%)
4.4.6 インキュベーター
4.4.6.1 2024~2034年の地域別市場規模(US$ Million)
4.4.6.2 地域別市場シェア、2024年・2034年(%)
4.4.7 マイクロスコープ
4.4.7.1 2024~2034年の地域別市場規模(US$ Million)
4.4.7.2 地域別市場シェア、2024年・2034年(%)
4.4.8 その他
4.4.8.1 2024〜2034年の地域別市場規模(US$ Million)
4.4.8.2 地域別市場シェア、2024年・2034年(%)
4.5 消耗品
4.5.1 2024年~2034年の地域別市場規模(US$ Million)
4.5.2 地域別市場シェア、2024年・2034年(%)
4.5.3 試薬
4.5.3.1 2024〜2034年の地域別市場規模(US$ Million)
4.5.3.2 地域別市場シェア、2024年・2034年(%)
4.5.4 アッセイキット
4.5.4.1 2024~2034年の地域別市場規模(US$ Million)
4.5.4.2 地域別市場シェア、2024年・2034年(%)
4.5.5 セルライン
4.5.5.1 2024~2034年の地域別市場規模(US$ Million)
4.5.5.2 地域別市場シェア、2024年・2034年(%)
4.5.6 プローブ&ラベル
4.5.6.1 2024~2034年の地域別市場規模(US$ Million)
4.5.6.2 地域別市場シェア、2024年・2034年(%)
4.5.7 その他
4.5.7.1 2024〜2034年の地域別市場規模(US$ Million)
4.5.7.2 地域別市場シェア、2024年・2034年(%)
4.6 ソフトウェア
4.6.1 2024~2034年の地域別市場規模(US$ Million)
4.6.2 地域別市場シェア、2024年・2034年(%)
4.7 サービス
4.7.1 2024~2034年地域別市場規模(US$ Million)
4.7.2 地域別市場シェア、2024年・2034年(%)
5 セルベースアッセイ市場分析:用途別
5.1 主要な調査結果
5.2 アプリケーションセグメント 市場魅力度指数
5.3 セルベースアッセイの用途別市場規模の推定と予測
5.4 創薬
5.4.1 2024〜2034年の地域別市場規模(US$ Million)
5.4.2 地域別市場シェア、2024年・2034年(%)
5.5 基礎研究
5.5.1 2024〜2034年の地域別市場規模(US$ Million)
5.5.2 地域別市場シェア、2024年・2034年(%)
5.6 ADME研究
5.6.1 2024~2034年の地域別市場規模(US$ Million)
5.6.2 地域別市場シェア、2024年・2034年(%)
5.7 毒性試験
5.7.1 2024〜2034年の地域別市場規模(US$ Million)
5.7.2 地域別市場シェア、2024年・2034年(%)
5.8 その他
5.8.1 2024〜2034年の地域別市場規模(US$ Million)
5.8.2 地域別市場シェア、2024年・2034年 (%)
6 セルベースアッセイ市場分析:エンドユーザー別
6.1 主要調査結果
6.2 エンドユーザーセグメント 市場魅力度指数
6.3 エンドユーザー別セルベースアッセイ市場規模の推定と予測
6.4 製薬・バイオテクノロジー企業
6.4.1 2024〜2034年の地域別市場規模(US$ Million)
6.4.2 地域別市場シェア、2024年・2034年(%)
6.5 学術機関
6.5.1 2024〜2034年の地域別市場規模(US$ Million)
6.5.2 地域別市場シェア、2024年・2034年(%)
6.6 CRO
6.6.1 2024~2034年地域別市場規模(US$ Million)
6.6.2 地域別市場シェア、2024年・2034年(%)
6.7 その他
6.7.1 2024年~2034年の地域別市場規模(US$ Million)
6.7.2 地域別市場シェア、2024年・2034年(%)
7 セルベースアッセイ市場分析:地域別
7.1 主要な調査結果
7.2 地域別市場規模の推定と予測
8 北米セルベースアッセイ市場分析
8.1 主要な調査結果
8.2 北米のセルベースアッセイ市場魅力度指数
8.3 北米のセルベースアッセイ国別市場:2024年、2029年、2034年(US$ Million)
8.4 北米のセルベースアッセイ市場規模推定と予測:国別
8.5 北米のセルベースアッセイ市場規模推定と予測:製品別
8.6 北米のセルベースアッセイ市場規模推定と予測:用途別
8.7 北米のセルベースドアッセイ市場規模推定と予測:エンドユーザー別
8.8 アメリカのセルベースアッセイ市場分析
8.9 カナダのセルベースドアッセイ市場分析
9 欧州のセルベースアッセイ市場分析
9.1 主要な調査結果
9.2 欧州セルベースアッセイ市場魅力度指数
9.3 欧州のセルベースアッセイ国別市場、2024年、2029年、2034年 (US$百万)
9.4 欧州のセルベースアッセイ市場規模推定と予測:国別
9.5 欧州のセルベースアッセイ市場規模推定と予測:製品別
9.6 欧州のセルベースドアッセイ市場規模推定と予測:用途別
9.7 欧州のセルベースドアッセイ市場規模推定と予測:エンドユーザー別
9.8 ドイツのセルベースドアッセイ市場分析
9.9 フランスのセルベースドアッセイ市場分析
9.10 イギリスのセルベースドアッセイ市場分析
9.11 イタリアのセルベースアッセイ市場分析
9.12 スペインのセルベースドアッセイ市場分析
9.13 ロシアのセルベースドアッセイ市場分析
9.14 その他の欧州のセルベースアッセイ市場分析
10 アジア太平洋地域のセルベースアッセイ市場分析
10.1 主要な調査結果
10.2 アジア太平洋地域のセルベースアッセイ市場魅力度指数
10.3 アジア太平洋地域のセルベースアッセイ国別市場、2024年、2029年、2034年(US$ Million)
10.4 アジア太平洋地域のセルベースアッセイ市場規模推定と予測:国別
10.5 アジア太平洋地域のセルベースアッセイ市場規模推定と予測:製品別
10.6 アジア太平洋地域のセルベースアッセイ市場規模推定と予測:用途別
10.7 アジア太平洋地域のセルベースアッセイ市場規模推定と予測:エンドユーザー別
10.8 日本のセルベースアッセイ市場分析
10.9 中国のセルベースアッセイ市場分析
10.10 インドのセルベースアッセイ市場分析
10.11 オーストラリアのセルベースドアッセイ市場分析
10.12 韓国のセルベースアッセイ市場分析
10.13 シンガポールのセルベースアッセイ市場分析
10.14 その他のアジア太平洋地域のセルベースアッセイ市場分析
11 ラテンアメリカのセルベースアッセイ市場分析
11.1 主要な調査結果
11.2 ラテンアメリカのセルベースアッセイ市場魅力度指数
11.3 ラテンアメリカのセルベースアッセイ国別市場、2024年、2029年、2034年 (US$ Million)
11.4 ラテンアメリカのセルベースアッセイ市場規模推定と予測:国別
11.5 ラテンアメリカのセルベースアッセイ市場規模推定と予測:製品別
11.6 ラテンアメリカのセルベースアッセイ市場規模推定と予測:用途別
11.7 ラテンアメリカのセルベースドアッセイ市場規模推定と予測:エンドユーザー別
11.8 ブラジルのセルベースアッセイ市場分析
11.9 メキシコのセルベースアッセイ市場分析
11.10 アルゼンチンのセルベースアッセイ市場分析
11.11 コロンビアのセルベースアッセイ市場分析
11.12 その他のラテンアメリカのセルベースアッセイ市場分析
12 MEAのセルベースアッセイ市場分析
12.1 主要な調査結果
12.2 MEAのセルベースアッセイ市場魅力度指数
12.3 MEAのセルベースアッセイ国別市場、2024年、2029年、2034年(US$ Million)
12.4 MEAのセルベースアッセイ市場規模推定と予測:国別
12.5 MEAのセルベースアッセイ市場規模推定と予測:製品別
12.6 MEAのセルベースドアッセイ市場規模推定と予測:用途別
12.7 MEAのセルベースドアッセイ市場規模推定と予測:エンドユーザー別
12.8 GCCのセルベースドアッセイ市場分析
12.9 南アフリカのセルベースドアッセイ市場分析
12.10 その他のMEAセルベースドアッセイ市場分析
13 主要企業のプロフィール
13.1 競争環境、2022年
13.2 戦略的展望
13.3 Agilent Technologies, Inc.
13.3.1 会社概要
13.3.2 会社概要
13.3.3 財務分析
13.3.3.1 純収入、2017-2022年
13.3.3.2 地域市場シェア、2022年
13.3.3.3 R&D、2017-2022年
13.3.4 製品ベンチマーク
13.3.5 戦略的展望
13.4 Becton, Dickinson and Company
13.4.1 会社概要
13.4.2 会社概要
13.4.3 財務分析
13.4.3.1 純収入、2017-2022年
13.4.3.2 売上高、2017-2022年
13.4.4 製品ベンチマーク
13.4.5 戦略的展望
13.5 Bio-Rad Laboratories, Inc.
13.5.1 会社概要
13.5.2 会社概要
13.5.3 財務分析
13.5.3.1 純収入、2017-2022年
13.5.3.2 地域市場シェア、2022年
13.5.3.3 R&D、2017-2022年
13.5.4 製品ベンチマーク
13.5.5 戦略的展望
13.6 BioVision Inc.
13.6.1 会社概要
13.6.2 会社概要
13.6.3 製品ベンチマーク
13.7 Charles River Laboratories
13.7.1 会社概要
13.7.2 会社概要
13.7.3 財務分析
13.7.3.1 純収入、2017-2022年
13.7.3.2 地域市場シェア、2022年
13.7.4 製品ベンチマーク
13.8 Cisbio (Revvity)
13.8.1 会社概要
13.8.2 会社概要
13.8.3 製品ベンチマーク
13.8.4 戦略的展望
13.9 Danaher Corporation
13.9.1 会社概要
13.9.2 会社概要
13.9.3 財務分析
13.9.3.1 純収入、2017-2022年
13.9.3.2 地域市場シェア、2022年
13.9.3.3 R&D、2017-2022年
13.9.4 製品ベンチマーク
13.9.5 戦略的展望
13.10 DiscoverX (Eurofins)
13.10.1 会社概要
13.10.2 会社概要
13.10.3 製品ベンチマーク
13.10.4 戦略的展望
13.11 F. Hoffmann-La Roche Ltd
13.11.1 会社概要
13.11.2 会社概要
13.11.3 財務分析
13.11.3.1 純収入、2017-2022年
13.11.3.2 売上高、2017-2022年
13.11.4 製品ベンチマーク
13.11.5 戦略的展望
13.12 GE HealthCare
13.12.1 会社概要
13.12.2 会社概要
13.12.3 財務分析
13.12.3.1 純収入、2017-2022年
13.12.3.2 地域市場シェア、2022年
13.12.3.3 R&D、2017-2022年
13.12.4 製品ベンチマーク
13.12.5 戦略的展望
13.13 InSphero
13.13.1 会社概要
13.13.2 会社概要
13.13.3 製品ベンチマーク
13.14 Merck KGaA
13.14.1 会社概要
13.14.2 会社概要
13.14.3 財務分析
13.14.3.1 純収入、2017-2022年
13.14.3.2 地域市場シェア、2022年
13.14.3.3 R&D、2017-2022年
13.14.4 製品ベンチマーク
13.15 BioAgilytix Labs LLC
13.15.1 会社概要
13.15.2 会社概要
13.15.3 製品ベンチマーク
13.16 Thermo Fisher Scientific Inc.
13.16.1 会社概要
13.16.2 会社概要
13.16.3 財務分析
13.16.3.1 純収入、2017-2022年
13.16.3.2 地域市場シェア、2022年
13.16.3.3 R&D、2017年〜2022年
13.16.4 製品ベンチマーク
14 結論と提言
14.1 Visiongainからの結びの言葉
14.2 市場プレイヤーへの提言
ページTOPに戻る
図表リスト
表の一覧
Table 1 Cell-Based Assays Market Snapshot, 2024 & 2034 (US$ Million, CAGR %)
Table 2 Cell-Based Assays Market Forecast by Region, 2024-2034 (US$ Million, AGR%, CAGR%): “V” Shaped Recovery
Table 3 Cell-Based Assays Market Forecast by Region, 2024-2034 (US$ Million, AGR%, CAGR%): “U” Shaped Recovery
Table 4 Cell-Based Assays Market Forecast by Region, 2024-2034 (US$ Million, AGR%, CAGR%): “W” Shaped Recovery
Table 5 Cell-Based Assays Market Forecast by Region, 2024-2034 (US$ Million, AGR%, CAGR%): “L” Shaped Recovery
Table 6 Cell-Based Assays Market Forecast by Product, 2024-2034 (US$ Million, AGR%, CAGR%)
Table 7 Instruments Segment Market Forecast by Region, 2024-2034 (US$ Million, AGR%, CAGR%)
Table 8 Microplates Segment Market Forecast by Region, 2024-2034 (US$ Million, AGR%, CAGR%)
Table 9 Microplate Reader Segment Market Forecast by Region, 2024-2034 (US$ Million, AGR%, CAGR%)
Table 10 Liquid Handling System Segment Market Forecast by Region, 2024-2034 (US$ Million, AGR%, CAGR%)
Table 11 Incubator Segment Market Forecast by Region, 2024-2034 (US$ Million, AGR%, CAGR%)
Table 12 Microscope Segment Market Forecast by Region, 2024-2034 (US$ Million, AGR%, CAGR%)
Table 13 Others Segment Market Forecast by Region, 2024-2034 (US$ Million, AGR%, CAGR%)
Table 14 Consumables Segment Market Forecast by Region, 2024-2034 (US$ Million, AGR%, CAGR%)
Table 15 Reagents Segment Market Forecast by Region, 2024-2034 (US$ Million, AGR%, CAGR%)
Table 16 Assay Kits Segment Market Forecast by Region, 2024-2034 (US$ Million, AGR%, CAGR%)
Table 17 Cell Lines Segment Market Forecast by Region, 2024-2034 (US$ Million, AGR%, CAGR%)
Table 18 Probes & Labels Segment Market Forecast by Region, 2024-2034 (US$ Million, AGR%, CAGR%)
Table 19 Others Segment Market Forecast by Region, 2024-2034 (US$ Million, AGR%, CAGR%)
Table 20 Software Segment Market Forecast by Region, 2024-2034 (US$ Million, AGR%, CAGR%)
Table 21 Services Segment Market Forecast by Region, 2024-2034 (US$ Million, AGR%, CAGR%)
Table 22 Cell-Based Assays Market Forecast by Application, 2024-2034 (US$ Million, AGR%, CAGR%)
Table 23 Drug Discovery Segment Market Forecast by Region, 2024-2034 (US$ Million, AGR%, CAGR%)
Table 24 Basic Research Segment Market Forecast by Region, 2024-2034 (US$ Million, AGR%, CAGR%)
Table 25 ADME Studies Segment Market Forecast by Region, 2024-2034 (US$ Million, AGR%, CAGR%)
Table 26 Toxicology Segment Market Forecast by Region, 2024-2034 (US$ Million, AGR%, CAGR%)
Table 27 Others Segment Market Forecast by Region, 2024-2034 (US$ Million, AGR%, CAGR%)
Table 28 Cell-Based Assays Market Forecast by End-users, 2024-2034 (US$ Million, AGR%, CAGR%)
Table 29 Pharmaceutical & Biotechnology Companies Segment Market Forecast by Region, 2024-2034 (US$ Million, AGR%, CAGR%)
Table 30 Academic Institutes Segment Market Forecast by Region, 2024-2034 (US$ Million, AGR%, CAGR%)
Table 31 CROs Segment Market Forecast by Region, 2024-2034 (US$ Million, AGR%, CAGR%)
Table 32 Others Segment Market Forecast by Region, 2024-2034 (US$ Million, AGR%, CAGR%)
Table 33 Cell-Based Assays Market Forecast by Region, 2024-2034 (US$ Million, AGR%, CAGR%)
Table 34 North America Cell-Based Assays Market Forecast by Country, 2024-2034 (US$ Million, AGR%, CAGR%)
Table 35 North America Cell-Based Assays Market Forecast by Product, 2024-2034 (US$ Million, AGR%, CAGR%)
Table 36 North America Cell-Based Assays Market Forecast by Application, 2024-2034 (US$ Million, AGR%, CAGR%)
Table 37 North America Cell-Based Assays Market Forecast by End-users, 2024-2034 (US$ Million, AGR%, CAGR%)
Table 38 U.S. Cell-Based Assays Market Forecast, 2024-2034 (US$ Million, AGR%, CAGR%)
Table 39 Canada Cell-Based Assays Market Forecast, 2024-2034 (US$ Million, AGR%, CAGR%)
Table 40 Europe Cell-Based Assays Market Forecast by Country, 2024-2034 (US$ Million, AGR%, CAGR%)
Table 41 Europe Cell-Based Assays Market Forecast by Product, 2024-2034 (US$ Million, AGR%, CAGR%)
Table 42 Europe Cell-Based Assays Market Forecast by Application, 2024-2034 (US$ Million, AGR%, CAGR%)
Table 43 Europe Cell-Based Assays Market Forecast by End-users, 2024-2034 (US$ Million, AGR%, CAGR%)
Table 44 Germany Cell-Based Assays Market Forecast, 2024-2034 (US$ Million, AGR%, CAGR%)
Table 45 France Cell-Based Assays Market Forecast, 2024-2034 (US$ Million, AGR%, CAGR%)
Table 46 UK Cell-Based Assays Market Forecast, 2024-2034 (US$ Million, AGR%, CAGR%)
Table 47 Italy Cell-Based Assays Market Forecast, 2024-2034 (US$ Million, AGR%, CAGR%)
Table 48 Spain Cell-Based Assays Market Forecast, 2024-2034 (US$ Million, AGR%, CAGR%)
Table 49 Russia Cell-Based Assays Market Forecast, 2024-2034 (US$ Million, AGR%, CAGR%)
Table 50 Rest of Europe Cell-Based Assays Market Forecast, 2024-2034 (US$ Million, AGR%, CAGR%)
Table 51 Asia Pacific Cell-Based Assays Market Forecast by Country, 2024-2034 (US$ Million, AGR%, CAGR%)
Table 52 Asia Pacific Cell-Based Assays Market Forecast by Product, 2024-2034 (US$ Million, AGR%, CAGR%)
Table 53 Asia Pacific Cell-Based Assays Market Forecast by Application, 2024-2034 (US$ Million, AGR%, CAGR%)
Table 54 Asia Pacific Cell-Based Assays Market Forecast by End-users, 2024-2034 (US$ Million, AGR%, CAGR%)
Table 55 Japan Cell-Based Assays Market Forecast, 2024-2034 (US$ Million, AGR%, CAGR%)
Table 56 China Cell-Based Assays Market Forecast, 2024-2034 (US$ Million, AGR%, CAGR%)
Table 57 India Cell-Based Assays Market Forecast, 2024-2034 (US$ Million, AGR%, CAGR%)
Table 58 Australia Cell-Based Assays Market Forecast, 2024-2034 (US$ Million, AGR%, CAGR%)
Table 59 South Korea Cell-Based Assays Market Forecast, 2024-2034 (US$ Million, AGR%, CAGR%)
Table 60 Singapore Cell-Based Assays Market Forecast, 2024-2034 (US$ Million, AGR%, CAGR%)
Table 61 Rest of Asia Pacific Cell-Based Assays Market Forecast, 2024-2034 (US$ Million, AGR%, CAGR%)
Table 62 Latin America Cell-Based Assays Market Forecast by Country, 2024-2034 (US$ Million, AGR%, CAGR%)
Table 63 Latin America Cell-Based Assays Market Forecast by Product, 2024-2034 (US$ Million, AGR%, CAGR%)
Table 64 Latin America Cell-Based Assays Market Forecast by Application, 2024-2034 (US$ Million, AGR%, CAGR%)
Table 65 Latin America Cell-Based Assays Market Forecast by End-users, 2024-2034 (US$ Million, AGR%, CAGR%)
Table 66 Brazil Cell-Based Assays Market Forecast, 2024-2034 (US$ Million, AGR%, CAGR%)
Table 67 Mexico Cell-Based Assays Market Forecast, 2024-2034 (US$ Million, AGR%, CAGR%)
Table 68 Argentina Cell-Based Assays Market Forecast, 2024-2034 (US$ Million, AGR%, CAGR%)
Table 69 Colombia Cell-Based Assays Market Forecast, 2024-2034 (US$ Million, AGR%, CAGR%)
Table 70 Rest of Latin America Cell-Based Assays Market Forecast, 2024-2034 (US$ Million, AGR%, CAGR%)
Table 71 MEA Cell-Based Assays Market Forecast by Country, 2024-2034 (US$ Million, AGR%, CAGR%)
Table 72 MEA Cell-Based Assays Market Forecast by Product, 2024-2034 (US$ Million, AGR%, CAGR%)
Table 73 MEA Cell-Based Assays Market Forecast by Application, 2024-2034 (US$ Million, AGR%, CAGR%)
Table 74 MEA Cell-Based Assays Market Forecast by End-users, 2024-2034 (US$ Million, AGR%, CAGR%)
Table 75 GCC Cell-Based Assays Market Forecast, 2024-2034 (US$ Million, AGR%, CAGR%)
Table 76 South Africa Cell-Based Assays Market Forecast, 2024-2034 (US$ Million, AGR%, CAGR%)
Table 77 Rest of MEA Cell-Based Assays Market Forecast, 2024-2034 (US$ Million, AGR%, CAGR%)
Table 78 Strategic Outlook
Table 79 Agilent Technologies, Inc: Key Details, (CEO, HQ, Revenue, Founded, No of Employees, Company Type, Website, Business Segment)
Table 80 Agilent Technologies, Inc: Product Benchmarking
Table 81 Agilent Technologies, Inc: Strategic Outlook
Table 82 Becton, Dickinson and Company: Key Details, (CEO, HQ, Revenue, Founded, No of Employees, Company Type, Website, Business Segment)
Table 83 Becton, Dickinson and Company: Product Benchmarking
Table 84 Becton, Dickinson and Company: Strategic Outlook
Table 85 Bio-Rad Laboratories, Inc: Key Details, (CEO, HQ, Revenue, Founded, No of Employees, Company Type, Website, Business Segment)
Table 86 Bio-Rad Laboratories, Inc: Product Benchmarking
Table 87 Bio-Rad Laboratories, Inc: Strategic Outlook
Table 88 BioVision Inc: Key Details, (CEO, HQ, Revenue, Founded, No of Employees, Company Type, Website, Business Segment)
Table 89 BioVision Inc: Product Benchmarking
Table 90 Charles River Laboratories: Key Details, (CEO, HQ, Revenue, Founded, No of Employees, Company Type, Website, Business Segment)
Table 91 Charles River Laboratories: Product Benchmarking
Table 92 Cisbio (Revvity): Key Details, (CEO, HQ, Revenue, Founded, No of Employees, Company Type, Website, Business Segment)
Table 93 Cisbio (Revvity): Product Benchmarking
Table 94 Cisbio (Revvity): Strategic Outlook
Table 95 Danaher Corporation: Key Details, (CEO, HQ, Revenue, Founded, No of Employees, Company Type, Website, Business Segment)
Table 96 Danaher Corporation: Product Benchmarking
Table 97 Danaher Corporation: Strategic Outlook
Table 98 DiscoverX (Eurofins): Key Details, (CEO, HQ, Revenue, Founded, No of Employees, Company Type, Website, Business Segment)
Table 99 DiscoverX (Eurofins): Product Benchmarking
Table 100 DiscoverX (Eurofins): Strategic Outlook
Table 101 F Hoffmann-La Roche Ltd: Key Details, (CEO, HQ, Revenue, Founded, No of Employees, Company Type, Website, Business Segment)
Table 102 F Hoffmann-La Roche Ltd: Product Benchmarking
Table 103 F Hoffmann-La Roche Ltd: Strategic Outlook
Table 104 GE HealthCare: Key Details, (CEO, HQ, Revenue, Founded, No of Employees, Company Type, Website, Business Segment)
Table 105 GE HealthCare: Product Benchmarking
Table 106 GE HealthCare: Strategic Outlook
Table 107 InSphero: Key Details, (CEO, HQ, Revenue, Founded, No of Employees, Company Type, Website, Business Segment)
Table 108 InSphero: Product Benchmarking
Table 109 Merck KGaA: Key Details, (CEO, HQ, Revenue, Founded, No of Employees, Company Type, Website, Business Segment)
Table 110 Merck KGaA: Product Benchmarking
Table 111 BioAgilytix Labs LLC: Key Details, (CEO, HQ, Revenue, Founded, No of Employees, Company Type, Website, Business Segment)
Table 112 BioAgilytix Labs LLC: Product Benchmarking
Table 113 Thermo Fisher Scientific Inc: Key Details, (CEO, HQ, Revenue, Founded, No of Employees, Company Type, Website, Business Segment)
Table 114 Thermo Fisher Scientific Inc: Product Benchmarking
図の一覧
Figure 1 Cell-Based Assays Market Segmentation
Figure 2 Cell-Based Assays Market by Product: Market Attractiveness Index
Figure 3 Cell-Based Assays Market by Application: Market Attractiveness Index
Figure 4 Cell-Based Assays Market by End-users: Market Attractiveness Index
Figure 5 Cell-Based Assays Market Attractiveness Index by Region
Figure 6 Cell-Based Assays Market: Market Dynamics
Figure 7 Cell-Based Assays Market by Region, 2024-2034 (US$ Million, AGR %): “V” Shaped Recovery
Figure 8 Cell-Based Assays Market by Region, 2024-2034 (US$ Million, AGR %): “U” Shaped Recovery
Figure 9 Cell-Based Assays Market by Region, 2024-2034 (US$ Million, AGR %): “W” Shaped Recovery
Figure 10 Cell-Based Assays Market by Region, 2024-2034 (US$ Million, AGR %): “L” Shaped Recovery
Figure 11 Cell-Based Assays Market: Porter’s Five Forces Analysis
Figure 12 Cell-Based Assays Market: PEST Analysis
Figure 13 Cell-Based Assays Market by Product: Market Attractiveness Index
Figure 14 Cell-Based Assays Market Forecast by Product, 2024-2034 (US$ Million, AGR %)
Figure 15 Cell-Based Assays Market Share Forecast by Product, 2023, 2028, 2033 (%)
Figure 16 Instruments Segment Market Forecast by Region, 2024-2034 (US$ Million, AGR %)
Figure 17 Instruments Segment Market Share Forecast by Region, 2024 & 2034 (%)
Figure 18 Microplates Segment Market Forecast by Region, 2024-2034 (US$ Million, AGR %)
Figure 19 Microplates Segment Market Share Forecast by Region, 2024 & 2034 (%)
Figure 20 Microplate Reader Segment Market Forecast by Region, 2024-2034 (US$ Million, AGR %)
Figure 21 Microplate Reader Segment Market Share Forecast by Region, 2024 & 2034 (%)
Figure 22 Liquid Handling System Segment Market Forecast by Region, 2024-2034 (US$ Million, AGR %)
Figure 23 Liquid Handling System Segment Market Share Forecast by Region, 2024 & 2034 (%)
Figure 24 Incubator Segment Market Forecast by Region, 2024-2034 (US$ Million, AGR %)
Figure 25 Incubator Segment Market Share Forecast by Region, 2024 & 2034 (%)
Figure 26 Microscope Segment Market Forecast by Region, 2024-2034 (US$ Million, AGR %)
Figure 27 Microscope Segment Market Share Forecast by Region, 2024 & 2034 (%)
Figure 28 Others Segment Market Forecast by Region, 2024-2034 (US$ Million, AGR %)
Figure 29 Others Segment Market Share Forecast by Region, 2024 & 2034 (%)
Figure 30 Consumables Segment Market Forecast by Region, 2024-2034 (US$ Million, AGR %)
Figure 31 Consumables Segment Market Share Forecast by Region, 2024 & 2034 (%)
Figure 32 Reagents Segment Market Forecast by Region, 2024-2034 (US$ Million, AGR %)
Figure 33 Reagents Segment Market Share Forecast by Region, 2024 & 2034 (%)
Figure 34 Assay Kits Segment Market Forecast by Region, 2024-2034 (US$ Million, AGR %)
Figure 35 Assay Kits Segment Market Share Forecast by Region, 2024 & 2034 (%)
Figure 36 Cell Lines Segment Market Forecast by Region, 2024-2034 (US$ Million, AGR %)
Figure 37 Cell Lines Segment Market Share Forecast by Region, 2024 & 2034 (%)
Figure 38 Probes & Labels Segment Market Forecast by Region, 2024-2034 (US$ Million, AGR %)
Figure 39 Probes & Labels Segment Market Share Forecast by Region, 2024 & 2034 (%)
Figure 40 Others Segment Market Forecast by Region, 2024-2034 (US$ Million, AGR %)
Figure 41 Others Segment Market Share Forecast by Region, 2024 & 2034 (%)
Figure 42 Software Segment Market Forecast by Region, 2024-2034 (US$ Million, AGR %)
Figure 43 Software Segment Market Share Forecast by Region, 2024 & 2034 (%)
Figure 44 Services Segment Market Forecast by Region, 2024-2034 (US$ Million, AGR %)
Figure 45 Services Segment Market Share Forecast by Region, 2024 & 2034 (%)
Figure 46 Cell-Based Assays Market by Application: Market Attractiveness Index
Figure 47 Cell-Based Assays Market Forecast by Application, 2024-2034 (US$ Million, AGR %)
Figure 48 Cell-Based Assays Market Share Forecast by Application, 2024, 2029, 2034 (%)
Figure 49 Drug Discovery Segment Market Forecast by Region, 2024-2034 (US$ Million, AGR %)
Figure 50 Drug Discovery Segment Market Share Forecast by Region, 2024 & 2034 (%)
Figure 51 Basic Research Segment Market Forecast by Region, 2024-2034 (US$ Million, AGR %)
Figure 52 Basic Research Segment Market Share Forecast by Region, 2024 & 2034 (%)
Figure 53 ADME Studies Segment Market Forecast by Region, 2024-2034 (US$ Million, AGR %)
Figure 54 ADME Studies Segment Market Share Forecast by Region, 2024 & 2034 (%)
Figure 55 Toxicology Segment Market Forecast by Region, 2024-2034 (US$ Million, AGR %)
Figure 56 Toxicology Segment Market Share Forecast by Region, 2024 & 2034 (%)
Figure 57 Others Segment Market Forecast by Region, 2024-2034 (US$ Million, AGR %)
Figure 58 Others Segment Market Share Forecast by Region, 2024 & 2034 (%)
Figure 59 Cell-Based Assays Market by End-users: Market Attractiveness Index
Figure 60 Cell-Based Assays Market Forecast by End-users, 2024-2034 (US$ Million, AGR %)
Figure 61 Cell-Based Assays Market Share Forecast by End-users, 2023, 2028, 2033 (%)
Figure 62 Pharmaceutical & Biotechnology Companies Segment Market Forecast by Region, 2024-2034 (US$ Million, AGR %)
Figure 63 Pharmaceutical & Biotechnology Companies Segment Market Share Forecast by Region, 2024 & 2034 (%)
Figure 64 Academic Institutes Segment Market Forecast by Region, 2024-2034 (US$ Million, AGR %)
Figure 65 Academic Institutes Segment Market Share Forecast by Region, 2024 & 2034 (%)
Figure 66 CROs Segment Market Forecast by Region, 2024-2034 (US$ Million, AGR %)
Figure 67 CROs Segment Market Share Forecast by Region, 2024 & 2034 (%)
Figure 68 Others Segment Market Forecast by Region, 2024-2034 (US$ Million, AGR %)
Figure 69 Others Segment Market Share Forecast by Region, 2024 & 2034 (%)
Figure 70 Cell-Based Assays Market Forecast by Region 2024 and 2034 (Revenue, CAGR%)
Figure 71 Cell-Based Assays Market Share Forecast by Region 2024, 2029, 2034 (%)
Figure 72 Cell-Based Assays Market by Region, 2024-2034 (US$ Million, AGR %)
Figure 73 North America Cell-Based Assays Market Attractiveness Index
Figure 74 North America Cell-Based Assays Market by Region, 2024, 2029 & 2034 (US$ Million)
Figure 75 North America Cell-Based Assays Market Forecast by Country, 2024-2034 (US$ Million, AGR %)
Figure 76 North America Cell-Based Assays Market Share Forecast by Country, 2024 & 2034 (%)
Figure 77 North America Cell-Based Assays Market Forecast by Product, 2024-2034 (US$ Million, AGR %)
Figure 78 North America Cell-Based Assays Market Share Forecast by Product, 2024 & 2034 (%)
Figure 79 North America Cell-Based Assays Market Forecast by Application, 2024-2034 (US$ Million, AGR %)
Figure 80 North America Cell-Based Assays Market Share Forecast by Application, 2024 & 2034 (%)
Figure 81 North America Cell-Based Assays Market Forecast by End-users, 2024-2034 (US$ Million, AGR %)
Figure 82 North America Cell-Based Assays Market Share Forecast by End-users, 2024 & 2034 (%)
Figure 83 U.S. Cell-Based Assays Market Forecast, 2024-2034 (US$ Million, AGR %)
Figure 84 Canada Cell-Based Assays Market Forecast, 2024-2034 (US$ Million, AGR %)
Figure 85 Europe Cell-Based Assays Market Attractiveness Index
Figure 86 Europe Cell-Based Assays Market by Region, 2024, 2029 & 2034 (US$ Million)
Figure 87 Europe Cell-Based Assays Market Forecast by Country, 2024-2034 (US$ Million, AGR %)
Figure 88 Europe Cell-Based Assays Market Share Forecast by Country, 2024 & 2034 (%)
Figure 89 Europe Cell-Based Assays Market Forecast by Product, 2024-2034 (US$ Million, AGR %)
Figure 90 Europe Cell-Based Assays Market Share Forecast by Product, 2024 & 2034 (%)
Figure 91 Europe Cell-Based Assays Market Forecast by Application, 2024-2034 (US$ Million, AGR %)
Figure 92 Europe Cell-Based Assays Market Share Forecast by Application, 2024 & 2034 (%)
Figure 93 Europe Cell-Based Assays Market Forecast by End-users, 2024-2034 (US$ Million, AGR %)
Figure 94 Europe Cell-Based Assays Market Share Forecast by End-users, 2024 & 2034 (%)
Figure 95 Germany Cell-Based Assays Market Forecast, 2024-2034 (US$ Million, AGR %)
Figure 96 France Cell-Based Assays Market Forecast, 2024-2034 (US$ Million, AGR %)
Figure 97 UK Cell-Based Assays Market Forecast, 2024-2034 (US$ Million, AGR %)
Figure 98 Italy Cell-Based Assays Market Forecast, 2024-2034 (US$ Million, AGR %)
Figure 99 Spain Cell-Based Assays Market Forecast, 2024-2034 (US$ Million, AGR %)
Figure 100 Russia Cell-Based Assays Market Forecast, 2024-2034 (US$ Million, AGR %)
Figure 101 Rest of Europe Cell-Based Assays Market Forecast, 2024-2034 (US$ Million, AGR %)
Figure 102 Asia Pacific Cell-Based Assays Market Attractiveness Index
Figure 103 Asia Pacific Cell-Based Assays Market by Region, 2024, 2029 & 2034 (US$ Million)
Figure 104 Asia Pacific Cell-Based Assays Market Forecast by Country, 2024-2034 (US$ Million, AGR %)
Figure 105 Asia Pacific Cell-Based Assays Market Share Forecast by Country, 2024 & 2034 (%)
Figure 106 Asia Pacific Cell-Based Assays Market Forecast by Product, 2024-2034 (US$ Million, AGR %)
Figure 107 Asia Pacific Cell-Based Assays Market Share Forecast by Product, 2024 & 2034 (%)
Figure 108 Asia Pacific Cell-Based Assays Market Forecast by Application, 2024-2034 (US$ Million, AGR %)
Figure 109 Asia Pacific Cell-Based Assays Market Share Forecast by Application, 2024 & 2034 (%)
Figure 110 Asia Pacific Cell-Based Assays Market Forecast by End-users, 2024-2034 (US$ Million, AGR %)
Figure 111 Asia Pacific Cell-Based Assays Market Share Forecast by End-users, 2024 & 2034 (%)
Figure 112 Japan Cell-Based Assays Market Forecast, 2024-2034 (US$ Million, AGR %)
Figure 113 China Cell-Based Assays Market Forecast, 2024-2034 (US$ Million, AGR %)
Figure 114 India Cell-Based Assays Market Forecast, 2024-2034 (US$ Million, AGR %)
Figure 115 Australia Cell-Based Assays Market Forecast, 2024-2034 (US$ Million, AGR %)
Figure 116 South Korea Cell-Based Assays Market Forecast, 2024-2034 (US$ Million, AGR %)
Figure 117 Singapore Cell-Based Assays Market Forecast, 2024-2034 (US$ Million, AGR %)
Figure 118 Rest of Asia Pacific Cell-Based Assays Market Forecast, 2024-2034 (US$ Million, AGR %)
Figure 119 Latin America Cell-Based Assays Market Attractiveness Index
Figure 120 Latin America Cell-Based Assays Market by Region, 2024, 2029 & 2034 (US$ Million)
Figure 121 Latin America Cell-Based Assays Market Forecast by Country, 2024-2034 (US$ Million, AGR %)
Figure 122 Latin America Cell-Based Assays Market Share Forecast by Country, 2024 & 2034 (%)
Figure 123 Latin America Cell-Based Assays Market Forecast by Product, 2024-2034 (US$ Million, AGR %)
Figure 124 Latin America Cell-Based Assays Market Share Forecast by Product, 2024 & 2034 (%)
Figure 125 Latin America Cell-Based Assays Market Forecast by Application, 2024-2034 (US$ Million, AGR %)
Figure 126 Latin America Cell-Based Assays Market Share Forecast by Application, 2024 & 2034 (%)
Figure 127 Latin America Cell-Based Assays Market Forecast by End-users, 2024-2034 (US$ Million, AGR %)
Figure 128 Latin America Cell-Based Assays Market Share Forecast by End-users, 2024 & 2034 (%)
Figure 129 Brazil Cell-Based Assays Market Forecast, 2024-2034 (US$ Million, AGR %)
Figure 130 Mexico Cell-Based Assays Market Forecast, 2024-2034 (US$ Million, AGR %)
Figure 131 Argentina Cell-Based Assays Market Forecast, 2024-2034 (US$ Million, AGR %)
Figure 132 Colombia Cell-Based Assays Market Forecast, 2024-2034 (US$ Million, AGR %)
Figure 133 Rest of Latin America Cell-Based Assays Market Forecast, 2024-2034 (US$ Million, AGR %)
Figure 134 MEA Cell-Based Assays Market Attractiveness Index
Figure 135 MEA Cell-Based Assays Market by Region, 2024, 2029 & 2034 (US$ Million)
Figure 136 MEA Cell-Based Assays Market Forecast by Country, 2024-2034 (US$ Million, AGR %)
Figure 137 MEA Cell-Based Assays Market Share Forecast by Country, 2024 & 2034 (%)
Figure 138 MEA Cell-Based Assays Market Forecast by Product, 2024-2034 (US$ Million, AGR %)
Figure 139 MEA Cell-Based Assays Market Share Forecast by Product, 2024 & 2034 (%)
Figure 140 MEA Cell-Based Assays Market Forecast by Application, 2024-2034 (US$ Million, AGR %)
Figure 141 MEA Cell-Based Assays Market Share Forecast by Application, 2024 & 2034 (%)
Figure 142 MEA Cell-Based Assays Market Forecast by End-users, 2024-2034 (US$ Million, AGR %)
Figure 143 MEA Cell-Based Assays Market Share Forecast by End-users, 2024 & 2034 (%)
Figure 144 GCC Cell-Based Assays Market Forecast, 2024-2034 (US$ Million, AGR %)
Figure 145 South Africa Cell-Based Assays Market Forecast, 2024-2034 (US$ Million, AGR %)
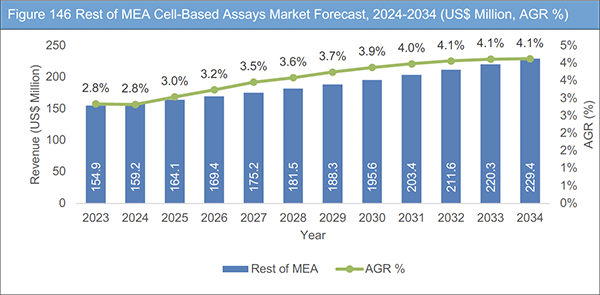
Figure 146 Rest of MEA Cell-Based Assays Market Forecast, 2024-2034 (US$ Million, AGR %)
Figure 147 Agilent Technologies, Inc: Net Revenue, 2017-2022 (US$ Million, AGR %)
Figure 148 Agilent Technologies, Inc: Regional Market Shares, 2022
Figure 149 Agilent Technologies, Inc: R&D, 2017-2022 (US$ Million, AGR %)
Figure 150 Becton, Dickinson and Company: Net Revenue, 2017-2022 (US$ Million, AGR %)
Figure 151 Becton, Dickinson and Company: R&D, 2017-2022 (US$ Million, AGR %)
Figure 152 Bio-Rad Laboratories, Inc: Net Revenue, 2017-2022 (US$ Million, AGR %)
Figure 153 Bio-Rad Laboratories, Inc: Regional Market Share, 2022
Figure 154 Bio-Rad Laboratories, Inc: R&D, 2017-2022 (US$ Million, AGR %)
Figure 155 Charles River Laboratories: Net Revenue, 2017-2022 (US$ Million, AGR %)
Figure 156 Charles River Laboratories: Regional Market Share, 2022
Figure 157 Danaher Corporation: Net Revenue, 2017-2022 (US$ Million, AGR %)
Figure 158 Danaher Corporation: Regional Market Share, 2022
Figure 159 Danaher Corporation: R&D, 2017-2022 (US$ Million, AGR %)
Figure 160 F Hoffmann-La Roche Ltd: Net Revenue, 2017-2022 (US$ Million, AGR %)
Figure 161 F Hoffmann-La Roche Ltd: R&D, 2017-2022 (US$ Million, AGR %)
Figure 162 GE HealthCare: Net Revenue, 2017-2022 (US$ Million, AGR%)
Figure 163 GE HealthCare: Regional Market Share, 2022
Figure 164 GE HealthCare: R&D, 2017-2022 (US$ Million, AGR%)
Figure 165 Merck KGaA: Net Revenue, 2017-2022 (US$ Million, AGR%)
Figure 166 Merck KGaA: Regional Market Share, 2022
Figure 167 Merck KGaA: R&D, 2017-2022 (US$ Million, AGR%)
Figure 168 Thermo Fisher Scientific Inc: Net Revenue, 2017-2022 (US$ Million, AGR %)
Figure 169 Thermo Fisher Scientific Inc: Regional Market Share, 2022
Figure 170 Thermo Fisher Scientific Inc: R&D, 2017-2022 (US$ Million, AGR %)
ページTOPに戻る
Summary
Report Details
The Cell-Based Assays Market Report 2024-2034: This report will prove invaluable to leading firms striving for new revenue pockets if they wish to better understand the industry and its underlying dynamics. It will be useful for companies that would like to expand into different industries or to expand their existing operations in a new region.
Advancements in Biotechnology Industry Projected to Boost Industry Growth
Advances in biotechnology, specifically in genomics, proteomics, and cell biology, are playing a pivotal role in propelling the demand for sophisticated cell-based assays. The convergence of these technological advancements has opened new avenues for researchers, enabling them to delve deeper into the intricacies of cellular functions, signaling pathways, and complex molecular interactions. For instance, in 2023, biotechnology contributed $304 billion to drug revenues, demonstrating a consistent upward trend over recent years. Projections indicate that this figure is anticipated to climb to $505 billion by 2026. In comparison, the conventional drug market is expected to reach a value of $681 billion in the same year. In addition, the global biotechnology sector experienced the prevalence of oncology, holding a significant share of around 39%. This highlights the substantial attention and investment directed toward the advancement of cancer treatments and therapies.
The field of genomics has witnessed remarkable progress with the advent of high-throughput sequencing technologies, allowing researchers to analyze entire genomes with unprecedented speed and precision. This wealth of genetic information has provided a foundation for understanding the molecular basis of diseases and identifying potential therapeutic targets. In tandem with genomics, cell-based assays capitalize on this genetic knowledge to study how specific genes and mutations influence cellular functions, paving the way for more targeted and personalized drug development strategies.
High Cost Associated with Cell-Based Assays Likely to Challenge Industry Growth
The development and deployment of sophisticated cell-based assays impose a considerable financial burden, acting as a formidable barrier for smaller research institutions and laboratories grappling with limited budgets. The principal contributors to these substantial upfront costs encompass the acquisition of advanced equipment, specialized reagents, and the maintenance of skilled personnel for assay design and execution. State-of-the-art technologies, such as high-content imaging systems and automated liquid handling platforms, come with hefty price tags, making them financially daunting for smaller institutions. The demand for specialized reagents, tailored to the intricacies of sophisticated assays, further escalates overall costs.
What Questions Should You Ask before Buying a Market Research Report?
• How is the Cell-Based Assays market evolving?
• What is driving and restraining the Cell-Based Assays market?
• How will each Cell-Based Assays submarket segment grow over the forecast period and how much revenue will these submarkets account for in 2034?
• How will the market shares for each Cell-Based Assays submarket develop from 2024 to 2034?
• What will be the main driver for the overall market from 2024 to 2034?
• Will leading Cell-Based Assays markets broadly follow the macroeconomic dynamics, or will individual national markets outperform others?
• How will the market shares of the national markets change by 2034 and which geographical region will lead the market in 2034?
• Who are the leading players and what are their prospects over the forecast period?
• What are the Cell-Based Assays projects for these leading companies?
• How will the industry evolve during the period between 2024 and 2034? What are the implications of Cell-Based Assays projects taking place now and over the next 10 years?
• Is there a greater need for product commercialisation to further scale the Cell-Based Assays market?
• Where is the Cell-Based Assays market heading and how can you ensure you are at the forefront of the market?
• What are the best investment options for new product and service lines?
• What are the key prospects for moving companies into a new growth path and C-suite?
You need to discover how this will impact the Cell-Based Assays market today, and over the next 10 years:
• Our 314-page report provides 114 tables and 170 charts/graphs exclusively to you.
• The report highlights key lucrative areas in the industry so you can target them – NOW.
• It contains in-depth analysis of global, regional and national sales and growth.
• It highlights for you the key successful trends, changes and revenue projections made by your competitors.
This report tells you TODAY how the Cell-Based Assays market will develop in the next 10 years, and in line with the variations in COVID-19 economic recession and bounce. This market is more critical now than at any point over the last 10 years.
Forecasts to 2034 and other analyses reveal commercial prospects
• In addition to revenue forecasting to 2034, our new study provides you with recent results, growth rates, and market shares.
• You will find original analyses, with business outlooks and developments.
• Discover qualitative analyses (including market dynamics, drivers, opportunities, restraints and challenges), cost structure, impact of rising Cell-Based Assays prices and recent developments.
This report includes data analysis and invaluable insight into how COVID-19 will affect the industry and your company. Four COVID-19 recovery patterns and their impact, namely, “V”, “L”, “W” and “U” are discussed in this report.
Segments Covered in the Report
Product
• Instruments
– Microplates
– Microplate Reader
– Liquid Handling System
– Incubator
– Microscope
– Others
• Consumables
– Reagents
– Assay Kits
– Cell Lines
– Probes & Labels
– Others
• Software
• Services
Application
• Drug Discovery
• Basic Research
• ADME Studies
• Toxicology
• Others
End-User
• Pharmaceutical & Biotechnology Companies
• Academic Institutes
• CROs
• Others
In addition to the revenue predictions for the overall world market and segments, you will also find revenue forecasts for five regional and 24 leading national markets:
North America
• U.S.
• Canada
Europe
• Germany
• France
• UK
• Italy
• Spain
• Russia
• Rest of Europe
Asia Pacific
• Japan
• China
• India
• Australia
• South Korea
• Singapore
• Rest of Asia Pacific
Latin America
• Brazil
• Mexico
• Argentina
• Colombia
• Rest of Latin America
MEA
• GCC
• South Africa
• Rest of MEA
The report also includes profiles and for some of the leading companies in the Cell-Based Assays Market 2024 to 2034, with a focus on this segment of these companies’ operations.
Leading companies profiled in the report
• Agilent Technologies Inc.
• Becton, Dickinson and Company
• BioAgilytix Labs LLC
• Bio-Rad Laboratories
• BioVision Inc.
• Charles River Laboratories
• Cisbio (Revvity)
• Danaher Corporation
• DiscoverX (Eurofins)
• F. Hoffmann-La Roche Ltd
• GE HealthCare
• InSphero
• Merck KGaA
• Thermo Fisher Scientific Inc.
Overall world revenue for Cell-Based Assays Market, 2024 to 2034 in terms of value the market will surpass US$18,800 million in 2024, our work calculates. We predict strong revenue growth through to 2034. Our work identifies which organizations hold the greatest potential. Discover their capabilities, progress, and commercial prospects, helping you stay ahead.
How will the Cell-Based Assays Market, 2024 to 2034 report help you?
In summary, our 310+ page report provides you with the following knowledge:
• Revenue forecasts to 2034 for Cell-Based Assays Market, 2024 to 2034 Market, with forecasts for product, application and end-user, each forecast at a global and regional level – discover the industry’s prospects, finding the most lucrative places for investments and revenues.
• Revenue forecasts to 2034 for five regional and 24 key national markets – See forecasts for the Cell-Based Assays Market 2024 to 2034 in North America, Europe, Asia-Pacific, Latin America, and MEA. Also forecasted is the market in the US, Canada, Mexico, Brazil, Germany, France, UK, Italy, China, India, Japan, and Australia among other prominent economies.
• Prospects for established firms and those seeking to enter the market – including company profiles for 15 of the major companies involved in the Cell-Based Assays Market 2024 to 2034.
Find quantitative and qualitative analyses with independent predictions. Receive information that only our report contains, staying informed with invaluable business intelligence.
Information found nowhere else
With our new report, you are less likely to fall behind in knowledge or miss out on opportunities. See how our work could benefit your research, analyses, and decisions. Visiongain’s study is for everybody needing commercial analyses for the Cell-Based Assays Market, 2024 to 2034, market-leading companies. You will find data, trends and predictions.
ページTOPに戻る
Table of Contents
Table of Contents
1 Report Overview
1.1 Objectives of the Study
1.2 Introduction to Cell-Based Assays Market
1.3 What This Report Delivers
1.4 Why You Should Read This Report
1.5 Key Questions Answered by This Analytical Report
1.6 Who is This Report for?
1.7 Methodology
1.7.1 Market Definitions
1.7.2 Market Evaluation & Forecasting Methodology
1.7.3 Data Validation
1.7.3.1 Primary Research
1.7.3.2 Secondary Research
1.8 Frequently Asked Questions (FAQs)
1.9 Associated Visiongain Reports
1.10 About Visiongain
2 Executive Summary
3 Market Overview
3.1 Key Findings
3.2 Market Dynamics
3.2.1 Market Driving Factors
3.2.1.1 Increased Need of Cell-Based Assays in Drug Discovery and Development
3.2.1.2 Advances in Biotechnology
3.2.1.3 Growing Demand for Precision Medicine Impacting the Cell-Based Assays Market Positively
3.2.1.4 Increasing Funding for Cell-based Research
3.2.1.5 Rising Prevalence of Chronic Diseases
3.2.2 Market Restraining Factors
3.2.2.1 High Cost Associated with Cell-Based Assays
3.2.2.2 Technical Complexity of Cell-Based Assays
3.2.2.3 Lack of Standardization
3.2.3 Market Opportunities
3.2.3.1 Growing Adoption of Label-Free Cell-Based Assays
3.2.3.2 3D Cell Culture Models as a Cornerstone of Advanced Assays
3.2.3.3 High-Throughput Screening Driving Demand for Cell-Based Assays
3.3 COVID-19 Impact Analysis
3.4 Porter’s Five Forces Analysis
3.4.1 Bargaining Power of Suppliers
3.4.2 Bargaining Power of Buyers
3.4.3 Competitive Rivalry
3.4.4 Threat from Substitutes
3.4.5 Threat of New Entrants
3.5 PEST Analysis
4 Cell-Based Assays Market Analysis by Product
4.1 Key Findings
4.2 Product Segment: Market Attractiveness Index
4.3 Cell-Based Assays Market Size Estimation and Forecast by Product
4.4 Instruments
4.4.1 Market Size by Region, 2024-2034 (US$ Million)
4.4.2 Market Share by Region, 2024 & 2034 (%)
4.4.3 Microplates
4.4.3.1 Market Size by Region, 2024-2034 (US$ Million)
4.4.3.2 Market Share by Region, 2024 & 2034 (%)
4.4.4 Microplate Reader
4.4.4.1 Market Size by Region, 2024-2034 (US$ Million)
4.4.4.2 Market Share by Region, 2024 & 2034 (%)
4.4.5 Liquid Handling System
4.4.5.1 Market Size by Region, 2024-2034 (US$ Million)
4.4.5.2 Market Share by Region, 2024 & 2034 (%)
4.4.6 Incubator
4.4.6.1 Market Size by Region, 2024-2034 (US$ Million)
4.4.6.2 Market Share by Region, 2024 & 2034 (%)
4.4.7 Microscope
4.4.7.1 Market Size by Region, 2024-2034 (US$ Million)
4.4.7.2 Market Share by Region, 2024 & 2034 (%)
4.4.8 Others
4.4.8.1 Market Size by Region, 2024-2034 (US$ Million)
4.4.8.2 Market Share by Region, 2024 & 2034 (%)
4.5 Consumables
4.5.1 Market Size by Region, 2024-2034 (US$ Million)
4.5.2 Market Share by Region, 2024 & 2034 (%)
4.5.3 Reagents
4.5.3.1 Market Size by Region, 2024-2034 (US$ Million)
4.5.3.2 Market Share by Region, 2024 & 2034 (%)
4.5.4 Assay Kits
4.5.4.1 Market Size by Region, 2024-2034 (US$ Million)
4.5.4.2 Market Share by Region, 2024 & 2034 (%)
4.5.5 Cell Lines
4.5.5.1 Market Size by Region, 2024-2034 (US$ Million)
4.5.5.2 Market Share by Region, 2024 & 2034 (%)
4.5.6 Probes & Labels
4.5.6.1 Market Size by Region, 2024-2034 (US$ Million)
4.5.6.2 Market Share by Region, 2024 & 2034 (%)
4.5.7 Others
4.5.7.1 Market Size by Region, 2024-2034 (US$ Million)
4.5.7.2 Market Share by Region, 2024 & 2034 (%)
4.6 Software
4.6.1 Market Size by Region, 2024-2034 (US$ Million)
4.6.2 Market Share by Region, 2024 & 2034 (%)
4.7 Services
4.7.1 Market Size by Region, 2024-2034 (US$ Million)
4.7.2 Market Share by Region, 2024 & 2034 (%)
5 Cell-Based Assays Market Analysis by Application
5.1 Key Findings
5.2 Application Segment: Market Attractiveness Index
5.3 Cell-Based Assays Market Size Estimation and Forecast by Application
5.4 Drug Discovery
5.4.1 Market Size by Region, 2024-2034 (US$ Million)
5.4.2 Market Share by Region, 2024 & 2034 (%)
5.5 Basic Research
5.5.1 Market Size by Region, 2024-2034 (US$ Million)
5.5.2 Market Share by Region, 2024 & 2034 (%)
5.6 ADME Studies
5.6.1 Market Size by Region, 2024-2034 (US$ Million)
5.6.2 Market Share by Region, 2024 & 2034 (%)
5.7 Toxicology
5.7.1 Market Size by Region, 2024-2034 (US$ Million)
5.7.2 Market Share by Region, 2024 & 2034 (%)
5.8 Others
5.8.1 Market Size by Region, 2024-2034 (US$ Million)
5.8.2 Market Share by Region, 2024 & 2034 (%)
6 Cell-Based Assays Market Analysis by End-users
6.1 Key Findings
6.2 End-users Segment: Market Attractiveness Index
6.3 Cell-Based Assays Market Size Estimation and Forecast by End-users
6.4 Pharmaceutical & Biotechnology Companies
6.4.1 Market Size by Region, 2024-2034 (US$ Million)
6.4.2 Market Share by Region, 2024 & 2034 (%)
6.5 Academic Institutes
6.5.1 Market Size by Region, 2024-2034 (US$ Million)
6.5.2 Market Share by Region, 2024 & 2034 (%)
6.6 CROs
6.6.1 Market Size by Region, 2024-2034 (US$ Million)
6.6.2 Market Share by Region, 2024 & 2034 (%)
6.7 Others
6.7.1 Market Size by Region, 2024-2034 (US$ Million)
6.7.2 Market Share by Region, 2024 & 2034 (%)
7 Cell-Based Assays Market Analysis by Region
7.1 Key Findings
7.2 Regional Market Size Estimation and Forecast
8 North America Cell-Based Assays Market Analysis
8.1 Key Findings
8.2 North America Cell-Based Assays Market Attractiveness Index
8.3 North America Cell-Based Assays Market by Country, 2024, 2029 & 2034 (US$ Million)
8.4 North America Cell-Based Assays Market Size Estimation and Forecast by Country
8.5 North America Cell-Based Assays Market Size Estimation and Forecast by Product
8.6 North America Cell-Based Assays Market Size Estimation and Forecast by Application
8.7 North America Cell-Based Assays Market Size Estimation and Forecast by End-users
8.8 U.S. Cell-Based Assays Market Analysis
8.9 Canada Cell-Based Assays Market Analysis
9 Europe Cell-Based Assays Market Analysis
9.1 Key Findings
9.2 Europe Cell-Based Assays Market Attractiveness Index
9.3 Europe Cell-Based Assays Market by Country, 2024, 2029 & 2034 (US$ Million)
9.4 Europe Cell-Based Assays Market Size Estimation and Forecast by Country
9.5 Europe Cell-Based Assays Market Size Estimation and Forecast by Product
9.6 Europe Cell-Based Assays Market Size Estimation and Forecast by Application
9.7 Europe Cell-Based Assays Market Size Estimation and Forecast by End-users
9.8 Germany Cell-Based Assays Market Analysis
9.9 France Cell-Based Assays Market Analysis
9.10 UK Cell-Based Assays Market Analysis
9.11 Italy Cell-Based Assays Market Analysis
9.12 Spain Cell-Based Assays Market Analysis
9.13 Russia Cell-Based Assays Market Analysis
9.14 Rest of Europe Cell-Based Assays Market Analysis
10 Asia Pacific Cell-Based Assays Market Analysis
10.1 Key Findings
10.2 Asia Pacific Cell-Based Assays Market Attractiveness Index
10.3 Asia Pacific Cell-Based Assays Market by Country, 2024, 2029 & 2034 (US$ Million)
10.4 Asia Pacific Cell-Based Assays Market Size Estimation .and Forecast by Country
10.5 Asia Pacific Cell-Based Assays Market Size Estimation and Forecast by Product
10.6 Asia Pacific Cell-Based Assays Market Size Estimation and Forecast by Application
10.7 Asia Pacific Cell-Based Assays Market Size Estimation and Forecast by End-users
10.8 Japan Cell-Based Assays Market Analysis
10.9 China Cell-Based Assays Market Analysis
10.10 India Cell-Based Assays Market Analysis
10.11 Australia Cell-Based Assays Market Analysis
10.12 South Korea Cell-Based Assays Market Analysis
10.13 Singapore Cell-Based Assays Market Analysis
10.14 Rest of Asia Pacific Cell-Based Assays Market Analysis
11 Latin America Cell-Based Assays Market Analysis
11.1 Key Findings
11.2 Latin America Cell-Based Assays Market Attractiveness Index
11.3 Latin America Cell-Based Assays Market by Country, 2024, 2029 & 2034 (US$ Million)
11.4 Latin America Cell-Based Assays Market Size .Estimation and Forecast by Country
11.5 Latin America Cell-Based Assays Market Size Estimation and Forecast by Product
11.6 Latin America Cell-Based Assays Market Size Estimation and Forecast by Application
11.7 Latin America Cell-Based Assays Market Size Estimation and Forecast by End-users
11.8 Brazil Cell-Based Assays Market Analysis
11.9 Mexico Cell-Based Assays Market Analysis
11.10 Argentina Cell-Based Assays Market Analysis
11.11 Colombia Cell-Based Assays Market Analysis
11.12 Rest of Latin America Cell-Based Assays Market Analysis
12 MEA Cell-Based Assays Market Analysis
12.1 Key Findings
12.2 MEA Cell-Based Assays Market Attractiveness Index
12.3 MEA Cell-Based Assays Market by Country, 2024, 2029 & 2034 (US$ Million)
12.4 MEA Cell-Based Assays Market Size Estimation and Forecast by Country
12.5 MEA Cell-Based Assays Market Size Estimation and Forecast by Product
12.6 MEA Cell-Based Assays Market Size Estimation and Forecast by Application
12.7 MEA Cell-Based Assays Market Size Estimation and Forecast by End-users
12.8 GCC Cell-Based Assays Market Analysis
12.9 South Africa Cell-Based Assays Market Analysis
12.10 Rest of MEA Cell-Based Assays Market Analysis
13 Company Profiles
13.1 Competitive Landscape, 2022
13.2 Strategic Outlook
13.3 Agilent Technologies, Inc.
13.3.1 Company Snapshot
13.3.2 Company Overview
13.3.3 Financial Analysis
13.3.3.1 Net Revenue, 2017-2022
13.3.3.2 Regional Market Shares, 2022
13.3.3.3 R&D, 2017-2022
13.3.4 Product Benchmarking
13.3.5 Strategic Outlook
13.4 Becton, Dickinson and Company
13.4.1 Company Snapshot
13.4.2 Company Overview
13.4.3 Financial Analysis
13.4.3.1 Net Revenue, 2017-2022
13.4.3.2 R&D, 2017-2022
13.4.4 Product Benchmarking
13.4.5 Strategic Outlook
13.5 Bio-Rad Laboratories, Inc.
13.5.1 Company Snapshot
13.5.2 Company Overview
13.5.3 Financial Analysis
13.5.3.1 Net Revenue, 2017-2022
13.5.3.2 Regional Market Share, 2022
13.5.3.3 R&D, 2017-2022
13.5.4 Product Benchmarking
13.5.5 Strategic Outlook
13.6 BioVision Inc.
13.6.1 Company Snapshot
13.6.2 Company Overview
13.6.3 Product Benchmarking
13.7 Charles River Laboratories
13.7.1 Company Snapshot
13.7.2 Company Overview
13.7.3 Financial Analysis
13.7.3.1 Net Revenue, 2017-2022
13.7.3.2 Regional Market Share, 2022
13.7.4 Product Benchmarking
13.8 Cisbio (Revvity)
13.8.1 Company Snapshot
13.8.2 Company Overview
13.8.3 Product Benchmarking
13.8.4 Strategic Outlook
13.9 Danaher Corporation
13.9.1 Company Snapshot
13.9.2 Company Overview
13.9.3 Financial Analysis
13.9.3.1 Net Revenue, 2017-2022
13.9.3.2 Regional Market Share, 2022
13.9.3.3 R&D, 2017-2022
13.9.4 Product Benchmarking
13.9.5 Strategic Outlook
13.10 DiscoverX (Eurofins)
13.10.1 Company Snapshot
13.10.2 Company Overview
13.10.3 Product Benchmarking
13.10.4 Strategic Outlook
13.11 F. Hoffmann-La Roche Ltd
13.11.1 Company Snapshot
13.11.2 Company Overview
13.11.3 Financial Analysis
13.11.3.1 Net Revenue, 2017-2022
13.11.3.2 R&D, 2017-2022
13.11.4 Product Benchmarking
13.11.5 Strategic Outlook
13.12 GE HealthCare
13.12.1 Company Snapshot
13.12.2 Company Overview
13.12.3 Financial Analysis
13.12.3.1 Net Revenue, 2017-2022
13.12.3.2 Regional Market Share, 2022
13.12.3.3 R&D, 2017-2022
13.12.4 Product Benchmarking
13.12.5 Strategic Outlook
13.13 InSphero
13.13.1 Company Snapshot
13.13.2 Company Overview
13.13.3 Product Benchmarking
13.14 Merck KGaA
13.14.1 Company Snapshot
13.14.2 Company Overview
13.14.3 Financial Analysis
13.14.3.1 Net Revenue, 2017-2022
13.14.3.2 Regional Market Share, 2022
13.14.3.3 R&D, 2017-2022
13.14.4 Product Benchmarking
13.15 BioAgilytix Labs LLC
13.15.1 Company Snapshot
13.15.2 Company Overview
13.15.3 Product Benchmarking
13.16 Thermo Fisher Scientific Inc.
13.16.1 Company Snapshot
13.16.2 Company Overview
13.16.3 Financial Analysis
13.16.3.1 Net Revenue, 2017-2022
13.16.3.2 Regional Market Share, 2022
13.16.3.3 R&D, 2017-2022
13.16.4 Product Benchmarking
14 Conclusion and Recommendations
14.1 Concluding Remarks from Visiongain
14.2 Recommendations for Market Players
ページTOPに戻る
List of Tables/Graphs
List of Tables
Table 1 Cell-Based Assays Market Snapshot, 2024 & 2034 (US$ Million, CAGR %)
Table 2 Cell-Based Assays Market Forecast by Region, 2024-2034 (US$ Million, AGR%, CAGR%): “V” Shaped Recovery
Table 3 Cell-Based Assays Market Forecast by Region, 2024-2034 (US$ Million, AGR%, CAGR%): “U” Shaped Recovery
Table 4 Cell-Based Assays Market Forecast by Region, 2024-2034 (US$ Million, AGR%, CAGR%): “W” Shaped Recovery
Table 5 Cell-Based Assays Market Forecast by Region, 2024-2034 (US$ Million, AGR%, CAGR%): “L” Shaped Recovery
Table 6 Cell-Based Assays Market Forecast by Product, 2024-2034 (US$ Million, AGR%, CAGR%)
Table 7 Instruments Segment Market Forecast by Region, 2024-2034 (US$ Million, AGR%, CAGR%)
Table 8 Microplates Segment Market Forecast by Region, 2024-2034 (US$ Million, AGR%, CAGR%)
Table 9 Microplate Reader Segment Market Forecast by Region, 2024-2034 (US$ Million, AGR%, CAGR%)
Table 10 Liquid Handling System Segment Market Forecast by Region, 2024-2034 (US$ Million, AGR%, CAGR%)
Table 11 Incubator Segment Market Forecast by Region, 2024-2034 (US$ Million, AGR%, CAGR%)
Table 12 Microscope Segment Market Forecast by Region, 2024-2034 (US$ Million, AGR%, CAGR%)
Table 13 Others Segment Market Forecast by Region, 2024-2034 (US$ Million, AGR%, CAGR%)
Table 14 Consumables Segment Market Forecast by Region, 2024-2034 (US$ Million, AGR%, CAGR%)
Table 15 Reagents Segment Market Forecast by Region, 2024-2034 (US$ Million, AGR%, CAGR%)
Table 16 Assay Kits Segment Market Forecast by Region, 2024-2034 (US$ Million, AGR%, CAGR%)
Table 17 Cell Lines Segment Market Forecast by Region, 2024-2034 (US$ Million, AGR%, CAGR%)
Table 18 Probes & Labels Segment Market Forecast by Region, 2024-2034 (US$ Million, AGR%, CAGR%)
Table 19 Others Segment Market Forecast by Region, 2024-2034 (US$ Million, AGR%, CAGR%)
Table 20 Software Segment Market Forecast by Region, 2024-2034 (US$ Million, AGR%, CAGR%)
Table 21 Services Segment Market Forecast by Region, 2024-2034 (US$ Million, AGR%, CAGR%)
Table 22 Cell-Based Assays Market Forecast by Application, 2024-2034 (US$ Million, AGR%, CAGR%)
Table 23 Drug Discovery Segment Market Forecast by Region, 2024-2034 (US$ Million, AGR%, CAGR%)
Table 24 Basic Research Segment Market Forecast by Region, 2024-2034 (US$ Million, AGR%, CAGR%)
Table 25 ADME Studies Segment Market Forecast by Region, 2024-2034 (US$ Million, AGR%, CAGR%)
Table 26 Toxicology Segment Market Forecast by Region, 2024-2034 (US$ Million, AGR%, CAGR%)
Table 27 Others Segment Market Forecast by Region, 2024-2034 (US$ Million, AGR%, CAGR%)
Table 28 Cell-Based Assays Market Forecast by End-users, 2024-2034 (US$ Million, AGR%, CAGR%)
Table 29 Pharmaceutical & Biotechnology Companies Segment Market Forecast by Region, 2024-2034 (US$ Million, AGR%, CAGR%)
Table 30 Academic Institutes Segment Market Forecast by Region, 2024-2034 (US$ Million, AGR%, CAGR%)
Table 31 CROs Segment Market Forecast by Region, 2024-2034 (US$ Million, AGR%, CAGR%)
Table 32 Others Segment Market Forecast by Region, 2024-2034 (US$ Million, AGR%, CAGR%)
Table 33 Cell-Based Assays Market Forecast by Region, 2024-2034 (US$ Million, AGR%, CAGR%)
Table 34 North America Cell-Based Assays Market Forecast by Country, 2024-2034 (US$ Million, AGR%, CAGR%)
Table 35 North America Cell-Based Assays Market Forecast by Product, 2024-2034 (US$ Million, AGR%, CAGR%)
Table 36 North America Cell-Based Assays Market Forecast by Application, 2024-2034 (US$ Million, AGR%, CAGR%)
Table 37 North America Cell-Based Assays Market Forecast by End-users, 2024-2034 (US$ Million, AGR%, CAGR%)
Table 38 U.S. Cell-Based Assays Market Forecast, 2024-2034 (US$ Million, AGR%, CAGR%)
Table 39 Canada Cell-Based Assays Market Forecast, 2024-2034 (US$ Million, AGR%, CAGR%)
Table 40 Europe Cell-Based Assays Market Forecast by Country, 2024-2034 (US$ Million, AGR%, CAGR%)
Table 41 Europe Cell-Based Assays Market Forecast by Product, 2024-2034 (US$ Million, AGR%, CAGR%)
Table 42 Europe Cell-Based Assays Market Forecast by Application, 2024-2034 (US$ Million, AGR%, CAGR%)
Table 43 Europe Cell-Based Assays Market Forecast by End-users, 2024-2034 (US$ Million, AGR%, CAGR%)
Table 44 Germany Cell-Based Assays Market Forecast, 2024-2034 (US$ Million, AGR%, CAGR%)
Table 45 France Cell-Based Assays Market Forecast, 2024-2034 (US$ Million, AGR%, CAGR%)
Table 46 UK Cell-Based Assays Market Forecast, 2024-2034 (US$ Million, AGR%, CAGR%)
Table 47 Italy Cell-Based Assays Market Forecast, 2024-2034 (US$ Million, AGR%, CAGR%)
Table 48 Spain Cell-Based Assays Market Forecast, 2024-2034 (US$ Million, AGR%, CAGR%)
Table 49 Russia Cell-Based Assays Market Forecast, 2024-2034 (US$ Million, AGR%, CAGR%)
Table 50 Rest of Europe Cell-Based Assays Market Forecast, 2024-2034 (US$ Million, AGR%, CAGR%)
Table 51 Asia Pacific Cell-Based Assays Market Forecast by Country, 2024-2034 (US$ Million, AGR%, CAGR%)
Table 52 Asia Pacific Cell-Based Assays Market Forecast by Product, 2024-2034 (US$ Million, AGR%, CAGR%)
Table 53 Asia Pacific Cell-Based Assays Market Forecast by Application, 2024-2034 (US$ Million, AGR%, CAGR%)
Table 54 Asia Pacific Cell-Based Assays Market Forecast by End-users, 2024-2034 (US$ Million, AGR%, CAGR%)
Table 55 Japan Cell-Based Assays Market Forecast, 2024-2034 (US$ Million, AGR%, CAGR%)
Table 56 China Cell-Based Assays Market Forecast, 2024-2034 (US$ Million, AGR%, CAGR%)
Table 57 India Cell-Based Assays Market Forecast, 2024-2034 (US$ Million, AGR%, CAGR%)
Table 58 Australia Cell-Based Assays Market Forecast, 2024-2034 (US$ Million, AGR%, CAGR%)
Table 59 South Korea Cell-Based Assays Market Forecast, 2024-2034 (US$ Million, AGR%, CAGR%)
Table 60 Singapore Cell-Based Assays Market Forecast, 2024-2034 (US$ Million, AGR%, CAGR%)
Table 61 Rest of Asia Pacific Cell-Based Assays Market Forecast, 2024-2034 (US$ Million, AGR%, CAGR%)
Table 62 Latin America Cell-Based Assays Market Forecast by Country, 2024-2034 (US$ Million, AGR%, CAGR%)
Table 63 Latin America Cell-Based Assays Market Forecast by Product, 2024-2034 (US$ Million, AGR%, CAGR%)
Table 64 Latin America Cell-Based Assays Market Forecast by Application, 2024-2034 (US$ Million, AGR%, CAGR%)
Table 65 Latin America Cell-Based Assays Market Forecast by End-users, 2024-2034 (US$ Million, AGR%, CAGR%)
Table 66 Brazil Cell-Based Assays Market Forecast, 2024-2034 (US$ Million, AGR%, CAGR%)
Table 67 Mexico Cell-Based Assays Market Forecast, 2024-2034 (US$ Million, AGR%, CAGR%)
Table 68 Argentina Cell-Based Assays Market Forecast, 2024-2034 (US$ Million, AGR%, CAGR%)
Table 69 Colombia Cell-Based Assays Market Forecast, 2024-2034 (US$ Million, AGR%, CAGR%)
Table 70 Rest of Latin America Cell-Based Assays Market Forecast, 2024-2034 (US$ Million, AGR%, CAGR%)
Table 71 MEA Cell-Based Assays Market Forecast by Country, 2024-2034 (US$ Million, AGR%, CAGR%)
Table 72 MEA Cell-Based Assays Market Forecast by Product, 2024-2034 (US$ Million, AGR%, CAGR%)
Table 73 MEA Cell-Based Assays Market Forecast by Application, 2024-2034 (US$ Million, AGR%, CAGR%)
Table 74 MEA Cell-Based Assays Market Forecast by End-users, 2024-2034 (US$ Million, AGR%, CAGR%)
Table 75 GCC Cell-Based Assays Market Forecast, 2024-2034 (US$ Million, AGR%, CAGR%)
Table 76 South Africa Cell-Based Assays Market Forecast, 2024-2034 (US$ Million, AGR%, CAGR%)
Table 77 Rest of MEA Cell-Based Assays Market Forecast, 2024-2034 (US$ Million, AGR%, CAGR%)
Table 78 Strategic Outlook
Table 79 Agilent Technologies, Inc: Key Details, (CEO, HQ, Revenue, Founded, No of Employees, Company Type, Website, Business Segment)
Table 80 Agilent Technologies, Inc: Product Benchmarking
Table 81 Agilent Technologies, Inc: Strategic Outlook
Table 82 Becton, Dickinson and Company: Key Details, (CEO, HQ, Revenue, Founded, No of Employees, Company Type, Website, Business Segment)
Table 83 Becton, Dickinson and Company: Product Benchmarking
Table 84 Becton, Dickinson and Company: Strategic Outlook
Table 85 Bio-Rad Laboratories, Inc: Key Details, (CEO, HQ, Revenue, Founded, No of Employees, Company Type, Website, Business Segment)
Table 86 Bio-Rad Laboratories, Inc: Product Benchmarking
Table 87 Bio-Rad Laboratories, Inc: Strategic Outlook
Table 88 BioVision Inc: Key Details, (CEO, HQ, Revenue, Founded, No of Employees, Company Type, Website, Business Segment)
Table 89 BioVision Inc: Product Benchmarking
Table 90 Charles River Laboratories: Key Details, (CEO, HQ, Revenue, Founded, No of Employees, Company Type, Website, Business Segment)
Table 91 Charles River Laboratories: Product Benchmarking
Table 92 Cisbio (Revvity): Key Details, (CEO, HQ, Revenue, Founded, No of Employees, Company Type, Website, Business Segment)
Table 93 Cisbio (Revvity): Product Benchmarking
Table 94 Cisbio (Revvity): Strategic Outlook
Table 95 Danaher Corporation: Key Details, (CEO, HQ, Revenue, Founded, No of Employees, Company Type, Website, Business Segment)
Table 96 Danaher Corporation: Product Benchmarking
Table 97 Danaher Corporation: Strategic Outlook
Table 98 DiscoverX (Eurofins): Key Details, (CEO, HQ, Revenue, Founded, No of Employees, Company Type, Website, Business Segment)
Table 99 DiscoverX (Eurofins): Product Benchmarking
Table 100 DiscoverX (Eurofins): Strategic Outlook
Table 101 F Hoffmann-La Roche Ltd: Key Details, (CEO, HQ, Revenue, Founded, No of Employees, Company Type, Website, Business Segment)
Table 102 F Hoffmann-La Roche Ltd: Product Benchmarking
Table 103 F Hoffmann-La Roche Ltd: Strategic Outlook
Table 104 GE HealthCare: Key Details, (CEO, HQ, Revenue, Founded, No of Employees, Company Type, Website, Business Segment)
Table 105 GE HealthCare: Product Benchmarking
Table 106 GE HealthCare: Strategic Outlook
Table 107 InSphero: Key Details, (CEO, HQ, Revenue, Founded, No of Employees, Company Type, Website, Business Segment)
Table 108 InSphero: Product Benchmarking
Table 109 Merck KGaA: Key Details, (CEO, HQ, Revenue, Founded, No of Employees, Company Type, Website, Business Segment)
Table 110 Merck KGaA: Product Benchmarking
Table 111 BioAgilytix Labs LLC: Key Details, (CEO, HQ, Revenue, Founded, No of Employees, Company Type, Website, Business Segment)
Table 112 BioAgilytix Labs LLC: Product Benchmarking
Table 113 Thermo Fisher Scientific Inc: Key Details, (CEO, HQ, Revenue, Founded, No of Employees, Company Type, Website, Business Segment)
Table 114 Thermo Fisher Scientific Inc: Product Benchmarking
List of Figures
Figure 1 Cell-Based Assays Market Segmentation
Figure 2 Cell-Based Assays Market by Product: Market Attractiveness Index
Figure 3 Cell-Based Assays Market by Application: Market Attractiveness Index
Figure 4 Cell-Based Assays Market by End-users: Market Attractiveness Index
Figure 5 Cell-Based Assays Market Attractiveness Index by Region
Figure 6 Cell-Based Assays Market: Market Dynamics
Figure 7 Cell-Based Assays Market by Region, 2024-2034 (US$ Million, AGR %): “V” Shaped Recovery
Figure 8 Cell-Based Assays Market by Region, 2024-2034 (US$ Million, AGR %): “U” Shaped Recovery
Figure 9 Cell-Based Assays Market by Region, 2024-2034 (US$ Million, AGR %): “W” Shaped Recovery
Figure 10 Cell-Based Assays Market by Region, 2024-2034 (US$ Million, AGR %): “L” Shaped Recovery
Figure 11 Cell-Based Assays Market: Porter’s Five Forces Analysis
Figure 12 Cell-Based Assays Market: PEST Analysis
Figure 13 Cell-Based Assays Market by Product: Market Attractiveness Index
Figure 14 Cell-Based Assays Market Forecast by Product, 2024-2034 (US$ Million, AGR %)
Figure 15 Cell-Based Assays Market Share Forecast by Product, 2023, 2028, 2033 (%)
Figure 16 Instruments Segment Market Forecast by Region, 2024-2034 (US$ Million, AGR %)
Figure 17 Instruments Segment Market Share Forecast by Region, 2024 & 2034 (%)
Figure 18 Microplates Segment Market Forecast by Region, 2024-2034 (US$ Million, AGR %)
Figure 19 Microplates Segment Market Share Forecast by Region, 2024 & 2034 (%)
Figure 20 Microplate Reader Segment Market Forecast by Region, 2024-2034 (US$ Million, AGR %)
Figure 21 Microplate Reader Segment Market Share Forecast by Region, 2024 & 2034 (%)
Figure 22 Liquid Handling System Segment Market Forecast by Region, 2024-2034 (US$ Million, AGR %)
Figure 23 Liquid Handling System Segment Market Share Forecast by Region, 2024 & 2034 (%)
Figure 24 Incubator Segment Market Forecast by Region, 2024-2034 (US$ Million, AGR %)
Figure 25 Incubator Segment Market Share Forecast by Region, 2024 & 2034 (%)
Figure 26 Microscope Segment Market Forecast by Region, 2024-2034 (US$ Million, AGR %)
Figure 27 Microscope Segment Market Share Forecast by Region, 2024 & 2034 (%)
Figure 28 Others Segment Market Forecast by Region, 2024-2034 (US$ Million, AGR %)
Figure 29 Others Segment Market Share Forecast by Region, 2024 & 2034 (%)
Figure 30 Consumables Segment Market Forecast by Region, 2024-2034 (US$ Million, AGR %)
Figure 31 Consumables Segment Market Share Forecast by Region, 2024 & 2034 (%)
Figure 32 Reagents Segment Market Forecast by Region, 2024-2034 (US$ Million, AGR %)
Figure 33 Reagents Segment Market Share Forecast by Region, 2024 & 2034 (%)
Figure 34 Assay Kits Segment Market Forecast by Region, 2024-2034 (US$ Million, AGR %)
Figure 35 Assay Kits Segment Market Share Forecast by Region, 2024 & 2034 (%)
Figure 36 Cell Lines Segment Market Forecast by Region, 2024-2034 (US$ Million, AGR %)
Figure 37 Cell Lines Segment Market Share Forecast by Region, 2024 & 2034 (%)
Figure 38 Probes & Labels Segment Market Forecast by Region, 2024-2034 (US$ Million, AGR %)
Figure 39 Probes & Labels Segment Market Share Forecast by Region, 2024 & 2034 (%)
Figure 40 Others Segment Market Forecast by Region, 2024-2034 (US$ Million, AGR %)
Figure 41 Others Segment Market Share Forecast by Region, 2024 & 2034 (%)
Figure 42 Software Segment Market Forecast by Region, 2024-2034 (US$ Million, AGR %)
Figure 43 Software Segment Market Share Forecast by Region, 2024 & 2034 (%)
Figure 44 Services Segment Market Forecast by Region, 2024-2034 (US$ Million, AGR %)
Figure 45 Services Segment Market Share Forecast by Region, 2024 & 2034 (%)
Figure 46 Cell-Based Assays Market by Application: Market Attractiveness Index
Figure 47 Cell-Based Assays Market Forecast by Application, 2024-2034 (US$ Million, AGR %)
Figure 48 Cell-Based Assays Market Share Forecast by Application, 2024, 2029, 2034 (%)
Figure 49 Drug Discovery Segment Market Forecast by Region, 2024-2034 (US$ Million, AGR %)
Figure 50 Drug Discovery Segment Market Share Forecast by Region, 2024 & 2034 (%)
Figure 51 Basic Research Segment Market Forecast by Region, 2024-2034 (US$ Million, AGR %)
Figure 52 Basic Research Segment Market Share Forecast by Region, 2024 & 2034 (%)
Figure 53 ADME Studies Segment Market Forecast by Region, 2024-2034 (US$ Million, AGR %)
Figure 54 ADME Studies Segment Market Share Forecast by Region, 2024 & 2034 (%)
Figure 55 Toxicology Segment Market Forecast by Region, 2024-2034 (US$ Million, AGR %)
Figure 56 Toxicology Segment Market Share Forecast by Region, 2024 & 2034 (%)
Figure 57 Others Segment Market Forecast by Region, 2024-2034 (US$ Million, AGR %)
Figure 58 Others Segment Market Share Forecast by Region, 2024 & 2034 (%)
Figure 59 Cell-Based Assays Market by End-users: Market Attractiveness Index
Figure 60 Cell-Based Assays Market Forecast by End-users, 2024-2034 (US$ Million, AGR %)
Figure 61 Cell-Based Assays Market Share Forecast by End-users, 2023, 2028, 2033 (%)
Figure 62 Pharmaceutical & Biotechnology Companies Segment Market Forecast by Region, 2024-2034 (US$ Million, AGR %)
Figure 63 Pharmaceutical & Biotechnology Companies Segment Market Share Forecast by Region, 2024 & 2034 (%)
Figure 64 Academic Institutes Segment Market Forecast by Region, 2024-2034 (US$ Million, AGR %)
Figure 65 Academic Institutes Segment Market Share Forecast by Region, 2024 & 2034 (%)
Figure 66 CROs Segment Market Forecast by Region, 2024-2034 (US$ Million, AGR %)
Figure 67 CROs Segment Market Share Forecast by Region, 2024 & 2034 (%)
Figure 68 Others Segment Market Forecast by Region, 2024-2034 (US$ Million, AGR %)
Figure 69 Others Segment Market Share Forecast by Region, 2024 & 2034 (%)
Figure 70 Cell-Based Assays Market Forecast by Region 2024 and 2034 (Revenue, CAGR%)
Figure 71 Cell-Based Assays Market Share Forecast by Region 2024, 2029, 2034 (%)
Figure 72 Cell-Based Assays Market by Region, 2024-2034 (US$ Million, AGR %)
Figure 73 North America Cell-Based Assays Market Attractiveness Index
Figure 74 North America Cell-Based Assays Market by Region, 2024, 2029 & 2034 (US$ Million)
Figure 75 North America Cell-Based Assays Market Forecast by Country, 2024-2034 (US$ Million, AGR %)
Figure 76 North America Cell-Based Assays Market Share Forecast by Country, 2024 & 2034 (%)
Figure 77 North America Cell-Based Assays Market Forecast by Product, 2024-2034 (US$ Million, AGR %)
Figure 78 North America Cell-Based Assays Market Share Forecast by Product, 2024 & 2034 (%)
Figure 79 North America Cell-Based Assays Market Forecast by Application, 2024-2034 (US$ Million, AGR %)
Figure 80 North America Cell-Based Assays Market Share Forecast by Application, 2024 & 2034 (%)
Figure 81 North America Cell-Based Assays Market Forecast by End-users, 2024-2034 (US$ Million, AGR %)
Figure 82 North America Cell-Based Assays Market Share Forecast by End-users, 2024 & 2034 (%)
Figure 83 U.S. Cell-Based Assays Market Forecast, 2024-2034 (US$ Million, AGR %)
Figure 84 Canada Cell-Based Assays Market Forecast, 2024-2034 (US$ Million, AGR %)
Figure 85 Europe Cell-Based Assays Market Attractiveness Index
Figure 86 Europe Cell-Based Assays Market by Region, 2024, 2029 & 2034 (US$ Million)
Figure 87 Europe Cell-Based Assays Market Forecast by Country, 2024-2034 (US$ Million, AGR %)
Figure 88 Europe Cell-Based Assays Market Share Forecast by Country, 2024 & 2034 (%)
Figure 89 Europe Cell-Based Assays Market Forecast by Product, 2024-2034 (US$ Million, AGR %)
Figure 90 Europe Cell-Based Assays Market Share Forecast by Product, 2024 & 2034 (%)
Figure 91 Europe Cell-Based Assays Market Forecast by Application, 2024-2034 (US$ Million, AGR %)
Figure 92 Europe Cell-Based Assays Market Share Forecast by Application, 2024 & 2034 (%)
Figure 93 Europe Cell-Based Assays Market Forecast by End-users, 2024-2034 (US$ Million, AGR %)
Figure 94 Europe Cell-Based Assays Market Share Forecast by End-users, 2024 & 2034 (%)
Figure 95 Germany Cell-Based Assays Market Forecast, 2024-2034 (US$ Million, AGR %)
Figure 96 France Cell-Based Assays Market Forecast, 2024-2034 (US$ Million, AGR %)
Figure 97 UK Cell-Based Assays Market Forecast, 2024-2034 (US$ Million, AGR %)
Figure 98 Italy Cell-Based Assays Market Forecast, 2024-2034 (US$ Million, AGR %)
Figure 99 Spain Cell-Based Assays Market Forecast, 2024-2034 (US$ Million, AGR %)
Figure 100 Russia Cell-Based Assays Market Forecast, 2024-2034 (US$ Million, AGR %)
Figure 101 Rest of Europe Cell-Based Assays Market Forecast, 2024-2034 (US$ Million, AGR %)
Figure 102 Asia Pacific Cell-Based Assays Market Attractiveness Index
Figure 103 Asia Pacific Cell-Based Assays Market by Region, 2024, 2029 & 2034 (US$ Million)
Figure 104 Asia Pacific Cell-Based Assays Market Forecast by Country, 2024-2034 (US$ Million, AGR %)
Figure 105 Asia Pacific Cell-Based Assays Market Share Forecast by Country, 2024 & 2034 (%)
Figure 106 Asia Pacific Cell-Based Assays Market Forecast by Product, 2024-2034 (US$ Million, AGR %)
Figure 107 Asia Pacific Cell-Based Assays Market Share Forecast by Product, 2024 & 2034 (%)
Figure 108 Asia Pacific Cell-Based Assays Market Forecast by Application, 2024-2034 (US$ Million, AGR %)
Figure 109 Asia Pacific Cell-Based Assays Market Share Forecast by Application, 2024 & 2034 (%)
Figure 110 Asia Pacific Cell-Based Assays Market Forecast by End-users, 2024-2034 (US$ Million, AGR %)
Figure 111 Asia Pacific Cell-Based Assays Market Share Forecast by End-users, 2024 & 2034 (%)
Figure 112 Japan Cell-Based Assays Market Forecast, 2024-2034 (US$ Million, AGR %)
Figure 113 China Cell-Based Assays Market Forecast, 2024-2034 (US$ Million, AGR %)
Figure 114 India Cell-Based Assays Market Forecast, 2024-2034 (US$ Million, AGR %)
Figure 115 Australia Cell-Based Assays Market Forecast, 2024-2034 (US$ Million, AGR %)
Figure 116 South Korea Cell-Based Assays Market Forecast, 2024-2034 (US$ Million, AGR %)
Figure 117 Singapore Cell-Based Assays Market Forecast, 2024-2034 (US$ Million, AGR %)
Figure 118 Rest of Asia Pacific Cell-Based Assays Market Forecast, 2024-2034 (US$ Million, AGR %)
Figure 119 Latin America Cell-Based Assays Market Attractiveness Index
Figure 120 Latin America Cell-Based Assays Market by Region, 2024, 2029 & 2034 (US$ Million)
Figure 121 Latin America Cell-Based Assays Market Forecast by Country, 2024-2034 (US$ Million, AGR %)
Figure 122 Latin America Cell-Based Assays Market Share Forecast by Country, 2024 & 2034 (%)
Figure 123 Latin America Cell-Based Assays Market Forecast by Product, 2024-2034 (US$ Million, AGR %)
Figure 124 Latin America Cell-Based Assays Market Share Forecast by Product, 2024 & 2034 (%)
Figure 125 Latin America Cell-Based Assays Market Forecast by Application, 2024-2034 (US$ Million, AGR %)
Figure 126 Latin America Cell-Based Assays Market Share Forecast by Application, 2024 & 2034 (%)
Figure 127 Latin America Cell-Based Assays Market Forecast by End-users, 2024-2034 (US$ Million, AGR %)
Figure 128 Latin America Cell-Based Assays Market Share Forecast by End-users, 2024 & 2034 (%)
Figure 129 Brazil Cell-Based Assays Market Forecast, 2024-2034 (US$ Million, AGR %)
Figure 130 Mexico Cell-Based Assays Market Forecast, 2024-2034 (US$ Million, AGR %)
Figure 131 Argentina Cell-Based Assays Market Forecast, 2024-2034 (US$ Million, AGR %)
Figure 132 Colombia Cell-Based Assays Market Forecast, 2024-2034 (US$ Million, AGR %)
Figure 133 Rest of Latin America Cell-Based Assays Market Forecast, 2024-2034 (US$ Million, AGR %)
Figure 134 MEA Cell-Based Assays Market Attractiveness Index
Figure 135 MEA Cell-Based Assays Market by Region, 2024, 2029 & 2034 (US$ Million)
Figure 136 MEA Cell-Based Assays Market Forecast by Country, 2024-2034 (US$ Million, AGR %)
Figure 137 MEA Cell-Based Assays Market Share Forecast by Country, 2024 & 2034 (%)
Figure 138 MEA Cell-Based Assays Market Forecast by Product, 2024-2034 (US$ Million, AGR %)
Figure 139 MEA Cell-Based Assays Market Share Forecast by Product, 2024 & 2034 (%)
Figure 140 MEA Cell-Based Assays Market Forecast by Application, 2024-2034 (US$ Million, AGR %)
Figure 141 MEA Cell-Based Assays Market Share Forecast by Application, 2024 & 2034 (%)
Figure 142 MEA Cell-Based Assays Market Forecast by End-users, 2024-2034 (US$ Million, AGR %)
Figure 143 MEA Cell-Based Assays Market Share Forecast by End-users, 2024 & 2034 (%)
Figure 144 GCC Cell-Based Assays Market Forecast, 2024-2034 (US$ Million, AGR %)
Figure 145 South Africa Cell-Based Assays Market Forecast, 2024-2034 (US$ Million, AGR %)
Figure 146 Rest of MEA Cell-Based Assays Market Forecast, 2024-2034 (US$ Million, AGR %)
Figure 147 Agilent Technologies, Inc: Net Revenue, 2017-2022 (US$ Million, AGR %)
Figure 148 Agilent Technologies, Inc: Regional Market Shares, 2022
Figure 149 Agilent Technologies, Inc: R&D, 2017-2022 (US$ Million, AGR %)
Figure 150 Becton, Dickinson and Company: Net Revenue, 2017-2022 (US$ Million, AGR %)
Figure 151 Becton, Dickinson and Company: R&D, 2017-2022 (US$ Million, AGR %)
Figure 152 Bio-Rad Laboratories, Inc: Net Revenue, 2017-2022 (US$ Million, AGR %)
Figure 153 Bio-Rad Laboratories, Inc: Regional Market Share, 2022
Figure 154 Bio-Rad Laboratories, Inc: R&D, 2017-2022 (US$ Million, AGR %)
Figure 155 Charles River Laboratories: Net Revenue, 2017-2022 (US$ Million, AGR %)
Figure 156 Charles River Laboratories: Regional Market Share, 2022
Figure 157 Danaher Corporation: Net Revenue, 2017-2022 (US$ Million, AGR %)
Figure 158 Danaher Corporation: Regional Market Share, 2022
Figure 159 Danaher Corporation: R&D, 2017-2022 (US$ Million, AGR %)
Figure 160 F Hoffmann-La Roche Ltd: Net Revenue, 2017-2022 (US$ Million, AGR %)
Figure 161 F Hoffmann-La Roche Ltd: R&D, 2017-2022 (US$ Million, AGR %)
Figure 162 GE HealthCare: Net Revenue, 2017-2022 (US$ Million, AGR%)
Figure 163 GE HealthCare: Regional Market Share, 2022
Figure 164 GE HealthCare: R&D, 2017-2022 (US$ Million, AGR%)
Figure 165 Merck KGaA: Net Revenue, 2017-2022 (US$ Million, AGR%)
Figure 166 Merck KGaA: Regional Market Share, 2022
Figure 167 Merck KGaA: R&D, 2017-2022 (US$ Million, AGR%)
Figure 168 Thermo Fisher Scientific Inc: Net Revenue, 2017-2022 (US$ Million, AGR %)
Figure 169 Thermo Fisher Scientific Inc: Regional Market Share, 2022
Figure 170 Thermo Fisher Scientific Inc: R&D, 2017-2022 (US$ Million, AGR %)
ページTOPに戻る
本レポートと同じKEY WORD()の最新刊レポート
- 本レポートと同じKEY WORDの最新刊レポートはありません。
よくあるご質問
Visiongain社はどのような調査会社ですか?
英国の調査会社ヴィジョンゲイン社(Visiongain)は、通信とエネルギーのほか、自動車や化学・医薬品、金属など、広範な市場を対象に調査を行っています。自動車市場については、市場全般に関する調査のほ... もっと見る
調査レポートの納品までの日数はどの程度ですか?
在庫のあるものは速納となりますが、平均的には 3-4日と見て下さい。
但し、一部の調査レポートでは、発注を受けた段階で内容更新をして納品をする場合もあります。
発注をする前のお問合せをお願いします。
注文の手続きはどのようになっていますか?
1)お客様からの御問い合わせをいただきます。
2)見積書やサンプルの提示をいたします。
3)お客様指定、もしくは弊社の発注書をメール添付にて発送してください。
4)データリソース社からレポート発行元の調査会社へ納品手配します。
5) 調査会社からお客様へ納品されます。最近は、pdfにてのメール納品が大半です。
お支払方法の方法はどのようになっていますか?
納品と同時にデータリソース社よりお客様へ請求書(必要に応じて納品書も)を発送いたします。
お客様よりデータリソース社へ(通常は円払い)の御振り込みをお願いします。
請求書は、納品日の日付で発行しますので、翌月最終営業日までの当社指定口座への振込みをお願いします。振込み手数料は御社負担にてお願いします。
お客様の御支払い条件が60日以上の場合は御相談ください。
尚、初めてのお取引先や個人の場合、前払いをお願いすることもあります。ご了承のほど、お願いします。
データリソース社はどのような会社ですか?
当社は、世界各国の主要調査会社・レポート出版社と提携し、世界各国の市場調査レポートや技術動向レポートなどを日本国内の企業・公官庁及び教育研究機関に提供しております。
世界各国の「市場・技術・法規制などの」実情を調査・収集される時には、データリソース社にご相談ください。
お客様の御要望にあったデータや情報を抽出する為のレポート紹介や調査のアドバイスも致します。
|
|

