仮想発電所(VPP)市場レポート:2024-2034
Virtual Power Plant (VPP) Market Report 2024-2034
レポート詳細
仮想発電所(VPP)市場レポート 2024-2034 :本レポートは、新たな収益の柱を目指す大手企業にとって、業界とその根底にある力学をより深く理解する上で貴重なものとなろう。異業種への... もっと見る
※上記価格は部署ライセンス(Departmental licence)価格です。
その他の価格についてはデータリソースまでお問合せください。
日本語のページは自動翻訳を利用し作成しています。
実際のレポートは英文のみでご納品いたします。

|

|
サマリー
レポート詳細
仮想発電所(VPP)市場レポート 2024-2034:本レポートは、新たな収益の柱を目指す大手企業にとって、業界とその根底にある力学をより深く理解する上で貴重なものとなろう。異業種への進出や、新たな地域での既存事業の拡大を希望する企業にとっても有用であろう。
仮想発電所(VPP)市場の推進力と機会
VPP市場の推進力は、太陽光発電、風力発電、エネルギー貯蔵システムを含む分散型エネルギー資源(DERs)の広範な導入が主要な触媒として際立っている、いくつかの影響力のある要因から生じている。政府や産業界が後押しする、よりクリーンなエネルギー源への世界的なシフトは、再生可能資源のグリッドへのシームレスな統合を促している。同時に、現在進行中の電力市場の自由化が原動力となり、進化し続けるエネルギー環境の中で必要不可欠な柔軟性と適応性を提供するVPPのような革新的ソリューションへの需要が高まっている。
サイバー脅威への脆弱性と潜在的なシステム障害が市場成長の抑制要因として台頭
サイバー脅威や潜在的なシステム障害に対する脆弱性が、仮想発電所(VPP)市場の成長を抑制する大きな要因となっている。VPPはデジタル技術と相互接続システムに大きく依存しているため、サイバー攻撃の影響を受けやすく、システム全体の完全性と機能性が損なわれる可能性がある。効率性と協調性を高めるために設計されたVPPの相互接続性は、システム障害のリスクにもさらされる。サイバー脅威によるものであれ、システム障害によるものであれ、いかなる混乱も、発電と配電の信頼性と安定性に影響を及ぼし、広範囲に及ぶ結果をもたらす可能性がある。その結果、VPP技術の普及と安全な導入には、これらの脆弱性への対処と緩和が不可欠となる。
市場調査レポートを購入する前にすべき質問とは?
- 仮想発電所(VPP)市場はどのように進化しているのか?
- 仮想発電所(VPP)市場の推進要因と抑制要因は何か?
- 仮想発電所(VPP)の各サブ市場セグメントは予測期間中にどのように成長し、これらのサブ市場が2034年にどれくらいの収益を占めるのか?
- 各仮想発電所(VPP)サブマーケットの市場シェアは2024年から2034年にかけてどのように推移するのか?
- 2024年から2034年までの市場全体の主な牽引役は何か?
- 主要な仮想発電所(VPP)市場はマクロ経済の動きに概ね追随するのか、それとも個々の国市場が他を凌駕するのか?
- 2034年までに各国市場のシェアはどのように変化し、2034年にはどの地域が市場をリードするのか?
- 主要プレーヤーは誰で、予測期間中の見通しは?
- これらの大手企業の仮想発電所(VPP)プロジェクトとは?
- 2024年から2034年の間に、産業はどのように発展するのか?現在および今後10年間に実施される仮想発電所(VPP)プロジェクトにはどのような意味があるのか?
- 仮想発電所(VPP)市場をさらに拡大するために、製品の商業化の必要性は高まっているのか?
- 仮想発電所(VPP)市場はどこに向かい、どのようにすれば市場の最前線に立てるのか?
- 新製品やサービスラインに対する最適な投資オプションは何か?
- 企業を新たな成長軌道に乗せ、C-suiteに移行させるための重要な展望とは?
仮想発電所(VPP)市場が現在、そして今後10年間でどのような影響を受けるかを知る必要がある:
- 367ページにわたる本レポートでは、120の表と170の図表を掲載しています。
- 本レポートは、業界の主要な儲かる分野をハイライトしており、今すぐターゲットを絞ることができます。
- 世界、地域、国の売上と成長に関する詳細な分析が含まれています。
- 競合他社が成功した主なトレンド、変化、収益予測をハイライトしています。
本レポートは、仮想発電所(VPP)市場が今後10年間でどのように発展していくのか、またCOVID-19の景気後退と好転の変動に合わせてどのように発展していくのかをお伝えします。この市場は、過去10年間のどの時点よりも今が重要である。
2034年までの予測やその他の分析から、商業的な展望が明らかになる
- 2034年までの収益予測に加え、直近の実績、成長率、市場シェアを提供します。
- ビジネスの展望と展開に関する独自の分析をご覧いただけます。
- 定性的分析(市場ダイナミクス、促進要因、機会、阻害要因、課題を含む)、コスト構造、仮想発電所(VPP)価格上昇の影響、最近の動向などをご覧いただけます。
本レポートには、COVID-19が業界と貴社にどのような影響を与えるかについてのデータ分析と貴重な洞察が含まれている。本レポートでは、COVID-19の4つの回収パターンとその影響、すなわち「V」、「L」、「W」、「U」について論じている。
レポート対象セグメント
コンポーネント別市場セグメント
- ソフトウェア
- ハードウェア
技術別市場セグメント
- デマンドレスポンスVPP
- 分散型発電VPP
- ミックスド・アセットVPP
エンドユーザー別市場セグメント
- 住宅用
- 商業
- 産業用
- 公益事業
発電源別市場セグメント
- 太陽光発電
- 風力発電
- 熱電併給(CHP)ユニット
- エネルギー貯蔵システム
- その他の電源
世界市場全体とセグメント別の収益予測に加え、4つの地域と20の主要国市場の収益予測も掲載しています:
北米
- アメリカ
- カナダ
欧州
- ドイツ
- スペイン
- イギリス
- フランス
- イタリア
- その他の欧州
アジア太平洋
- 中国
- 日本
- インド
- オーストラリア
- 韓国
- その他のアジア太平洋地域
ラテンアメリカ
- ブラジル
- メキシコ
- その他のラテンアメリカ
中東・アフリカ
- GCC
- 南アフリカ
- その他の中東・アフリカ
また、本レポートでは、仮想発電所(VPP)市場の2024年から2034年までの主要企業のプロファイルと、これらの企業の事業のこのセグメントに焦点を当てています。
報告書に掲載されている主要企業
・ ABB Ltd.
・ Cisco Systems Inc.
・ Cpower Energy Management
・ Enel X
・ Engie SA
・ General Electric Company
・ LO3 Energy Inc.
・ Next Kraftwerke
・ Schneider Electric SE
・ Siemens AG
・ Spirae Inc.
・ Sunverge Energy Inc.
・ Swell Energy Inc.
・ Sympower
・ Tesla, Inc.
仮想発電所(VPP)市場の2024年から2034年までの世界全体の売上高(金額ベース)は、2024年に26億3,880万米ドルを突破すると弊社は算出した。2034年まで力強い収益成長を予測している。当研究所では、最も大きな可能性を秘めた組織を特定する。彼らの能力、進歩、商業的展望を発見し、あなたが一歩先を行くのを支援します。
仮想発電所(VPP)市場、2024-2034年レポートはどのように役立ちますか?
要約すると、360ページを超えるレポートでは、以下のような知識を得ることができる:
- 仮想発電所(VPP)市場の2034年までの収益予測、2024年から2034年市場 コンポーネント、技術、エンドユーザー、発電源の各予測を世界レベルと地域レベルで掲載 - 業界の展望を発見し、投資と収益に最も有利な場所を見つけることができます。
- 4つの地域と20の主要国市場の2034年までの収益予測 - 仮想発電所(VPP)市場の2024年から2034年までの北米、ヨーロッパ、アジア太平洋、ラテンアメリカ、中東・アフリカの市場予測をご覧ください。また、米国、カナダ、ブラジル、ドイツ、フランス、英国、イタリア、中国、インド、日本、オーストラリアなどの著名経済圏の市場も予測しています。
- 仮想発電所(VPP)市場に関わる主要企業15社の企業プロファイルを含む、2024年から2034年までの市場参入を目指す企業および既存企業の展望。
独自の予測による定量的・定性的分析をご覧ください。私たちのレポートだけに含まれる情報を入手し、貴重なビジネスインテリジェンスで情報を得ることができます。
他にはない情報
私たちの新しいレポートがあれば、知識に遅れをとったり、チャンスを逃したりする可能性が低くなります。弊社の調査レポートが貴社の調査、分析、意思決定にどのように役立つかをご覧ください。Visiongainの調査は、仮想発電所(VPP)市場、2024年から2034年、市場をリードする企業の商業分析を必要とするすべての人のためのものです。データ、トレンド、予測をご覧いただけます。
ページTOPに戻る
目次
目次
1 レポート概要
1.1 研究の目的
1.2 仮想発電所(VPP)市場の紹介
1.3 本レポートの特徴
1.4 本レポートを読むべき理由
1.5 本分析レポートが回答する主な質問
1.6 本レポートは誰のためのものか?
1.7 方法論
1.7.1 市場の定義
1.7.2 市場評価・予測手法
1.7.3 データの検証
1.7.3.1 一次調査
1.7.3.2 セカンダリーリサーチ
1.8 よくある質問(FAQ)
1.9 Visiongainの関連レポート
1.10 Visiongainについて
2 エグゼクティブ・サマリー
3 市場概要
3.1 主要な調査結果
3.2 市場ダイナミクス
3.2.1 市場牽引要因
3.2.1.1 継続的な技術革新と研究がVPPの進歩を促進する
3.2.1.2 仮想発電所は脱炭素化への道となり得る
3.2.1.3 分散型エネルギー資源(DER)のプラットフォームとしてのVPP
3.2.2 市場の阻害要因
3.2.2.1 サイバー脅威への脆弱性とシステム障害の可能性が市場成長の抑制要因に
3.2.2.2 スマートグリッドや高度制御システムを含むVPPインフラ導入に伴う多額の初期費用
3.2.2.3 エネルギー市場の変動と政府の政策やインセンティブの不確実性
3.2.3 市場機会
3.2.3.1 Iot、AI、通信技術の継続的進歩
3.2.3.2 世界各国がスマート分散型エネルギーシステムの利点を認識
3.2.3.3 住宅用太陽光発電、蓄電、スマートホーム技術の普及がVPPの成長に貢献
3.3 ポーターのファイブフォース分析
3.3.1 サプライヤーの交渉力(中)
3.3.2 買い手の交渉力(中〜高)
3.3.3 競争力(高)
3.3.4 代替品による脅威(低)
3.3.5 新規参入の脅威(中)
3.4 COVID-19の影響分析
3.4.1 "V字型回復"
3.4.2 "U字型回復"
3.4.3 "W字型回復"
3.4.4 "L字型回復"
3.5 PEST分析
4 仮想発電所(VPP)市場分析:コンポーネント別
4.1 主要な調査結果
4.2 コンポーネントセグメント 市場魅力度指数
4.3 仮想発電所(VPP)のコンポーネント別市場規模推定と予測
4.4 ソフトウェア
4.4.1 2024〜2034年の地域別市場規模(US$ Million)
4.4.2 地域別市場シェア、2024年・2034年(%)
4.5 ハードウェア
4.5.1 2024年~2034年の地域別市場規模(US$ Million)
4.5.2 地域別市場シェア、2024年・2034年(%)
5 仮想発電所(VPP)市場分析:技術別
5.1 主な調査結果
5.2 技術セグメント 市場魅力度指数
5.3 仮想発電所(VPP)の技術別市場規模推定と予測
5.4 デマンドレスポンスVPP
5.4.1 2024〜2034年の地域別市場規模(US$ Million)
5.4.2 地域別市場シェア、2024年・2034年(%)
5.5 分散型発電VPP
5.5.1 2024年~2034年の地域別市場規模(US$ Million)
5.5.2 地域別市場シェア、2024年・2034年(%)
5.6 混合資産VPP
5.6.1 2024~2034年の地域別市場規模(US$ Million)
5.6.2 地域別市場シェア、2024年・2034年(%)
6 仮想発電所(VPP)市場分析:エンドユーザー別
6.1 主要な調査結果
6.2 エンドユーザーセグメント 市場魅力度指数
6.3 仮想発電所(VPP)のエンドユーザー別市場規模推定と予測
6.4 住宅用
6.4.1 2024〜2034年の地域別市場規模(US$ Million)
6.4.2 地域別市場シェア、2024年・2034年(%)
6.5 業務用
6.5.1 2024年~2034年の地域別市場規模(US$ Million)
6.5.2 地域別市場シェア、2024年・2034年(%)
6.6 産業用
6.6.1 2024-2034年地域別市場規模(US$ Million)
6.6.2 地域別市場シェア、2024年・2034年(%)
6.7 ユーティリティ
6.7.1 2024年~2034年の地域別市場規模(US$ Million)
6.7.2 地域別市場シェア、2024年・2034年(%)
7 仮想発電所(VPP)市場分析:発電源別
7.1 主要な調査結果
7.2 発電源セグメント 市場魅力度指数
7.3 仮想発電所(VPP)の発電源別市場規模の推定と予測
7.4 太陽光発電
7.4.1 2024〜2034年の地域別市場規模(US$ Million)
7.4.2 地域別市場シェア、2024年・2034年(%)
7.5 風力発電
7.5.1 2024年~2034年の地域別市場規模(US$ Million)
7.5.2 地域別市場シェア、2024年・2034年(%)
7.6 熱電併給(CHP)ユニット
7.6.1 2024~2034年の地域別市場規模(US$ Million)
7.6.2 地域別市場シェア、2024年・2034年(%)
7.7 エネルギー貯蔵システム
7.7.1 2024~2034年の地域別市場規模(US$ Million)
7.7.2 地域別市場シェア、2024年・2034年(%)
7.8 その他の電源
7.8.1 2024〜2034年の地域別市場規模(US$ Million)
7.8.2 地域別市場シェア、2024年・2034年(%)
8 仮想発電所(VPP)市場分析:地域別
8.1 主要な調査結果
8.2 地域別市場規模の推定と予測
9 北米の仮想発電所(VPP)市場分析
9.1 主要な調査結果
9.2 北米の仮想発電所(VPP)市場魅力度指数
9.3 北米の仮想発電所(VPP)市場国別、2024年、2029年、2034年(US$ Million)
9.4 北米の仮想発電所(VPP)市場規模推定と予測
9.5 北米の仮想発電所(VPP)市場規模推定と予測:国別
9.6 北米の仮想発電所(VPP)市場規模推定と予測:コンポーネント別
9.7 北米の仮想発電所(VPP)市場規模推定と予測:技術別
9.8 北米の仮想発電所(VPP)市場規模推定と予測:エンドユーザー別
9.9 北米の仮想発電所(VPP)市場規模推定と予測:発電源別
9.10 アメリカの仮想発電所(VPP)市場分析
9.11 カナダの仮想発電所(VPP)市場分析
10 欧州の仮想発電所(VPP)市場分析
10.1 主要な調査結果
10.2 欧州の仮想発電所(VPP)市場魅力度指数
10.3 欧州の仮想発電所(VPP)市場国別、2024年、2029年、2034年 (US$ Million)
10.4 欧州の仮想発電所(VPP)市場規模推定と予測
10.5 欧州の仮想発電所(VPP)市場規模推定と予測:国別
10.6 欧州の仮想発電所(VPP)市場規模推定と予測:コンポーネント別
10.7 欧州の仮想発電所(VPP)市場規模推定と予測:技術別
10.8 欧州の仮想発電所(VPP)市場規模推定と予測:エンドユーザー別
10.9 欧州の仮想発電所(VPP)市場規模推定と予測:発電源別
10.10 ドイツの仮想発電所(VPP)市場分析
10.11 イギリスの仮想発電所(VPP)市場分析
10.12 フランスの仮想発電所(VPP)市場分析
10.13 イタリアの仮想発電所(VPP)市場分析
10.14 スペインの仮想発電所(VPP)市場分析
10.15 その他の欧州の仮想発電所(VPP)市場分析
11 アジア太平洋地域の仮想発電所(VPP)市場分析
11.1 主要な調査結果
11.2 アジア太平洋地域の仮想発電所(VPP)市場魅力度指数
11.3 アジア太平洋地域の仮想発電所(VPP)市場国別、2024年、2029年、2034年(US$ Million)
11.4 アジア太平洋地域の仮想発電所(VPP)市場規模推定と予測
11.5 アジア太平洋地域の仮想発電所(VPP)市場規模推定と予測:国別
11.6 アジア太平洋地域の仮想発電所(VPP)市場規模推定と予測:コンポーネント別
11.7 アジア太平洋地域の仮想発電所(VPP)市場規模推定と予測:技術別
11.8 アジア太平洋地域の仮想発電所(VPP)市場規模推定と予測:エンドユーザー別
11.9 アジア太平洋地域の仮想発電所(VPP)市場規模推定と予測:発電源別
11.10 中国の仮想発電所(VPP)市場分析
11.11 インドの仮想発電所(VPP)市場分析
11.12 日本の仮想発電所(VPP)市場分析
11.13 韓国の仮想発電所(VPP)市場分析
11.14 オーストラリアの仮想発電所(VPP)市場分析
11.15 その他のアジア太平洋地域の仮想発電所(VPP)市場分析
12 中東・アフリカの仮想発電所(VPP)市場分析
12.1 主要な調査結果
12.2 中東・アフリカの仮想発電所(VPP)市場魅力度指数
12.3 中東・アフリカの仮想発電所(VPP)国別市場、2024年、2029年、2034年(US$ Million)
12.4 中東・アフリカの仮想発電所(VPP)市場規模推定と予測
12.5 中東・アフリカの仮想発電所(VPP)市場規模推定と予測:国別
12.6 中東・アフリカの仮想発電所(VPP)市場規模推定と予測:コンポーネント別
12.7 中東・アフリカの仮想発電所(VPP)市場規模推定と予測:技術別
12.8 中東・アフリカの仮想発電所(VPP)市場規模推定と予測:エンドユーザー別
12.9 中東・アフリカの仮想発電所(VPP)市場規模推定と予測:発電源別
12.10 GCCの仮想発電所(VPP)市場分析
12.11 南アフリカの仮想発電所(VPP)市場分析
12.12 その他の中東・アフリカ地域の仮想発電所(VPP)市場分析
13 ラテンアメリカの仮想発電所(VPP)市場分析
13.1 主要な調査結果
13.2 ラテンアメリカの仮想発電所(VPP)市場魅力度指数
13.3 ラテンアメリカの仮想発電所(VPP)市場国別、2024年、2029年、2034年(US$ Million)
13.4 ラテンアメリカの仮想発電所(VPP)市場規模推定と予測
13.5 ラテンアメリカの仮想発電所(VPP)市場規模推定と予測:国別
13.6 ラテンアメリカの仮想発電所(VPP)市場規模推定と予測:コンポーネント別
13.7 ラテンアメリカの仮想発電所(VPP)市場規模推定と予測:技術別予測
13.8 ラテンアメリカの仮想発電所(VPP)市場規模推定と予測:エンドユーザー別
13.9 ラテンアメリカの仮想発電所(VPP)市場規模推定と予測:発電源別
13.10 ブラジルの仮想発電所(VPP)市場分析
13.11 メキシコの仮想発電所(VPP)市場分析
13.12 その他のラテンアメリカの仮想発電所(VPP)市場分析
14 主要企業のプロファイル
14.1 競争環境、2022年
14.2 戦略的展望
14.3 Siemens AG
14.3.1 会社概要
14.3.2 会社概要
14.3.3 財務分析
14.3.4 純収入、2018-2022年
14.3.4.1 売上高、2018年~2022年
14.3.4.2 地域別収益シェア、2022年(%)
14.3.4.3 事業セグメント別売上シェア、2022年(%)
14.3.5 製品ベンチマーク
14.3.6 戦略的展望
14.4 ABB Ltd.
14.4.1 会社概要
14.4.2 会社概要
14.4.3 財務分析
14.4.4 純収入、2018-2022年
14.4.4.1 売上高、2018年~2022年
14.4.4.2 事業セグメント収益シェア、2022年(%)
14.4.5 製品ベンチマーク
14.4.6 戦略的展望
14.5 Schneider Electric SE
14.5.1 会社概要
14.5.2 会社概要
14.5.3 財務分析
14.5.4 純収入、2018-2022年
14.5.4.1 R&D、2018年~2022年
14.5.4.2 地域別収益シェア、2022年(%)
14.5.4.3 事業セグメント別売上シェア、2022年(%)
14.5.5 製品ベンチマーク
14.5.6 戦略的展望
14.6 General Electric Company
14.6.1 会社概要
14.6.2 会社概要
14.6.3 財務分析
14.6.4 純収入、2018-2022年
14.6.4.1 R&D、2018年〜2022年
14.6.4.2 地域別収入シェア、2022年(%)
14.6.4.3 事業セグメント別売上シェア、2022年(%)
14.6.5 製品ベンチマーク
14.6.6 戦略的展望
14.7 Next Kraftwerke
14.7.1 会社概要
14.7.2 会社概要
14.7.3 製品ベンチマーク
14.7.4 戦略的展望
14.8 Cisco Systems Inc
14.8.1 会社概要
14.8.2 会社概要
14.8.3 財務分析
14.8.4 純収入、2019-2023年
14.8.4.1 売上高、2019年~2023年
14.8.4.2 地域別収益シェア、2023年(%)
14.8.4.3 事業セグメント収益シェア、2023年(%)
14.8.5 製品ベンチマーク
14.8.6 戦略的展望
14.9 Enel X
14.9.1 会社概要
14.9.2 会社概要
14.9.3 財務分析
14.9.4 純収入、2018年~2022年
14.9.4.1 売上高、2018年~2022年
14.9.4.2 地域別売上シェア、2022年(%)
14.9.4.3 事業セグメント別売上シェア、2022年(%)
14.9.5 製品ベンチマーク
14.9.6 戦略的展望
14.10 Engie SA
14.10.1 会社概要
14.10.2 会社概要
14.10.3 製品ベンチマーク
14.10.4 戦略的展望
14.11 Sunverge Energy Inc
14.11.1 会社概要
14.11.2 会社概要
14.11.3 製品ベンチマーク
14.11.4 戦略的展望
14.12 Spirae Inc.
14.12.1 会社概要
14.12.2 会社概要
14.12.3 製品ベンチマーク
14.12.4 戦略的展望
14.13 Tesla, Inc
14.13.1 会社概要
14.13.2 会社概要
14.13.3 財務分析
14.13.4 純収入、2018年~2022年
14.13.4.1 R&D、2018年~2022年
14.13.4.2 地域別売上シェア、2022年(%)
14.13.4.3 事業セグメント別売上シェア、2022年(%)
14.13.5 製品ベンチマーク
14.13.6 戦略的展望
14.14 Cpower Energy Management
14.14.1 会社概要
14.14.2 会社概要
14.14.3 製品ベンチマーク
14.14.4 戦略的展望
14.15 Sympower
14.15.1 会社概要
14.15.2 会社概要
14.15.3 製品ベンチマーク
14.15.4 戦略的展望
14.16 Swell Energy Inc.
14.16.1 会社概要
14.16.2 会社概要
14.16.3 製品ベンチマーク
14.16.4 戦略的展望
14.17 LO3 Energy Inc.
14.17.1 会社概要
14.17.2 会社概要
14.17.3 製品ベンチマーク
14.17.4 戦略的展望
15 結論と提言
15.1 ビジョンゲインからの結びの言葉
15.2 市場プレイヤーへの提言
ページTOPに戻る
図表リスト
表の一覧
Table 1 Virtual Power Plant (VPP) Market Snapshot, 2024 & 2034 (US$ Million, CAGR %)
Table 2 Annual Solar PV capacity additions in India, 2019-2022
Table 3 Global Virtual Power Plant (VPP) Market by Region, 2024-2034 (US$ Mn, AGR (%), CAGR (%)) (V-Shaped Recovery Scenario)
Table 4 Global Virtual Power Plant (VPP) Market by Region, 2024-2034 (US$ Mn, AGR (%), CAGR (%)) (U-Shaped Recovery Scenario)
Table 5 Global Virtual Power Plant (VPP) Market by Region, 2024-2034 (US$ Mn, AGR (%), CAGR (%)) (W-Shaped Recovery Scenario)
Table 6 Global Virtual Power Plant (VPP) Market by Region, 2024-2034 (US$ Mn, AGR (%), CAGR (%)) (L-Shaped Recovery Scenario)
Table 7 Global Virtual Power Plant (VPP) Market by Component, 2024-2034 (US$ Mn, AGR (%), CAGR (%))
Table 8 Software Market by Region, 2024-2034 (US$ Mn, AGR (%), CAGR (%))
Table 9 Hardware Market by Region, 2024-2034 (US$ Mn, AGR (%), CAGR (%))
Table 10 Global Virtual Power Plant (VPP) Market by Technology, 2024-2034 (US$ Mn, AGR (%), CAGR (%))
Table 11 Demand Response VPP Market by Region, 2024-2034 (US$ Mn, AGR (%), CAGR (%))
Table 12 Distributed Generation VPP Market by Region, 2024-2034 (US$ Mn, AGR (%), CAGR (%))
Table 13 Mixed Asset VPP Market by Region, 2024-2034 (US$ Mn, AGR (%), CAGR (%))
Table 14 Global Virtual Power Plant (VPP) Market by End-User, 2024-2034 (US$ Mn, AGR (%), CAGR (%))
Table 15 Residential Market by Region, 2024-2034 (US$ Mn, AGR (%), CAGR (%))
Table 16 Commercial Market by Region, 2024-2034 (US$ Mn, AGR (%), CAGR (%))
Table 17 Industrial Market by Region, 2024-2034 (US$ Mn, AGR (%), CAGR (%))
Table 18 Utility Market by Region, 2024-2034 (US$ Mn, AGR (%), CAGR (%))
Table 19 Global Virtual Power Plant (VPP) Market by Generation Source, 2024-2034 (US$ Mn, AGR (%), CAGR (%))
Table 20 Solar PV Market by Region, 2024-2034 (US$ Mn, AGR (%), CAGR (%))
Table 21 Wind Power Market by Region, 2024-2034 (US$ Mn, AGR (%), CAGR (%))
Table 22 Combined Heat and Power (CHP) Units Market by Region, 2024-2034 (US$ Mn, AGR (%), CAGR (%))
Table 23 Energy Storage Systems Market by Region, 2024-2034 (US$ Mn, AGR (%), CAGR (%))
Table 24 Other Sources Market by Region, 2024-2034 (US$ Mn, AGR (%), CAGR (%))
Table 25 Virtual Power Plant (VPP) Market Forecast by Region, 2024-2034 (US$ Million, AGR%, CAGR%)
Table 26 North America Virtual Power Plant (VPP) Market by Value, 2024-2034 (US$ Mn, AGR (%), CAGR (%))
Table 27 North America Virtual Power Plant (VPP) Market by Country, 2024-2034 (US$ Mn, AGR (%), CAGR (%))
Table 28 North America Virtual Power Plant (VPP) Market by Component, 2024-2034 (US$ Mn, AGR (%), CAGR (%))
Table 29 North America Virtual Power Plant (VPP) Market by Technology, 2024-2034 (US$ Mn, AGR (%), CAGR (%))
Table 30 North America Virtual Power Plant (VPP) Market by End-User, 2024-2034 (US$ Mn, AGR (%), CAGR (%))
Table 31 North America Virtual Power Plant (VPP) Market by Generation Source, 2024-2034 (US$ Mn, AGR (%), CAGR (%))
Table 32 US Virtual Power Plant (VPP) Market by Value, 2024-2034 (US$ Mn, AGR (%), CAGR (%))
Table 33 Canada Virtual Power Plant (VPP) Market by Value, 2024-2034 (US$ Mn, AGR (%), CAGR (%))
Table 34 Europe Virtual Power Plant (VPP) Market by Value, 2024-2034 (US$ Mn, AGR (%), CAGR (%))
Table 35 Europe Virtual Power Plant (VPP) Market by Country, 2024-2034 (US$ Mn, AGR (%), CAGR (%))
Table 36 Europe Virtual Power Plant (VPP) Market by Component, 2024-2034 (US$ Mn, AGR (%), CAGR (%))
Table 37 Europe Virtual Power Plant (VPP) Market by Technology, 2024-2034 (US$ Mn, AGR (%), CAGR (%))
Table 38 Europe Virtual Power Plant (VPP) Market by End-User, 2024-2034 (US$ Mn, AGR (%), CAGR (%))
Table 39 Europe Virtual Power Plant (VPP) Market by Generation Source, 2024-2034 (US$ Mn, AGR (%), CAGR (%))
Table 40 Germany Virtual Power Plant (VPP) Market by Value, 2024-2034 (US$ Mn, AGR (%), CAGR (%))
Table 41 UK Virtual Power Plant (VPP) Market by Value, 2024-2034 (US$ Mn, AGR (%), CAGR (%))
Table 42 France Virtual Power Plant (VPP) Market by Value, 2024-2034 (US$ Mn, AGR (%), CAGR (%))
Table 43 Italy Virtual Power Plant (VPP) Market by Value, 2024-2034 (US$ Mn, AGR (%), CAGR (%))
Table 44 Spain Virtual Power Plant (VPP) Market by Value, 2024-2034 (US$ Mn, AGR (%), CAGR (%))
Table 45 Rest of Europe Virtual Power Plant (VPP) Market by Value, 2024-2034 (US$ Mn, AGR (%), CAGR (%))
Table 46 Asia-Pacific Virtual Power Plant (VPP) Market by Value, 2024-2034 (US$ Mn, AGR (%), CAGR (%))
Table 47 Asia-Pacific Virtual Power Plant (VPP) Market by Country, 2024-2034 (US$ Mn, AGR (%), CAGR (%))
Table 48 Asia-Pacific Virtual Power Plant (VPP) Market by Component, 2024-2034 (US$ Mn, AGR (%), CAGR (%))
Table 49 Asia-Pacific Virtual Power Plant (VPP) Market by Technology, 2024-2034 (US$ Mn, AGR (%), CAGR (%))
Table 50 Asia-Pacific Virtual Power Plant (VPP) Market by End-User, 2024-2034 (US$ Mn, AGR (%), CAGR (%))
Table 51 Asia-Pacific Virtual Power Plant (VPP) Market by Generation Source, 2024-2034 (US$ Mn, AGR (%), CAGR (%))
Table 52 China Virtual Power Plant (VPP) Market by Value, 2024-2034 (US$ Mn, AGR (%), CAGR (%))
Table 53 India Virtual Power Plant (VPP) Market by Value, 2024-2034 (US$ Mn, AGR (%), CAGR (%))
Table 54 Japan Virtual Power Plant (VPP) Market by Value, 2024-2034 (US$ Mn, AGR (%), CAGR (%))
Table 55 South Korea Virtual Power Plant (VPP) Market by Value, 2024-2034 (US$ Mn, AGR (%), CAGR (%))
Table 56 Australia Virtual Power Plant (VPP) Market by Value, 2024-2034 (US$ Mn, AGR (%), CAGR (%))
Table 57 Rest of Asia-Pacific Virtual Power Plant (VPP) Market by Value, 2024-2034 (US$ Mn, AGR (%), CAGR (%))
Table 58 Middle East & Africa Virtual Power Plant (VPP) Market by Value, 2024-2034 (US$ Mn, AGR (%), CAGR (%))
Table 59 Middle East & Africa Virtual Power Plant (VPP) Market by Country, 2024-2034 (US$ Mn, AGR (%), CAGR (%))
Table 60 Middle East & Africa Virtual Power Plant (VPP) Market by Component, 2024-2034 (US$ Mn, AGR (%), CAGR (%))
Table 61 Middle East & Africa Virtual Power Plant (VPP) Market by Technology, 2024-2034 (US$ Mn, AGR (%), CAGR (%))
Table 62 Middle East & Africa Virtual Power Plant (VPP) Market by End-User, 2024-2034 (US$ Mn, AGR (%), CAGR (%))
Table 63 Middle East & Africa Virtual Power Plant (VPP) Market by Generation Source, 2024-2034 (US$ Mn, AGR (%), CAGR (%))
Table 64 GCC Virtual Power Plant (VPP) Market by Value, 2024-2034 (US$ Mn, AGR (%), CAGR (%))
Table 65 South Africa Virtual Power Plant (VPP) Market by Value, 2024-2034 (US$ Mn, AGR (%), CAGR (%))
Table 66 Rest of Middle East & Africa Virtual Power Plant (VPP) Market by Value, 2024-2034 (US$ Mn, AGR (%), CAGR (%))
Table 67 Latin America Virtual Power Plant (VPP) Market by Value, 2024-2034 (US$ Mn, AGR (%), CAGR (%))
Table 68 Latin America Virtual Power Plant (VPP) Market by Country, 2024-2034 (US$ Mn, AGR (%), CAGR (%))
Table 69 Latin America Virtual Power Plant (VPP) Market by Component, 2024-2034 (US$ Mn, AGR (%), CAGR (%))
Table 70 Latin America Virtual Power Plant (VPP) Market by Technology, 2024-2034 (US$ Mn, AGR (%), CAGR (%))
Table 71 Latin America Virtual Power Plant (VPP) Market by End-User, 2024-2034 (US$ Mn, AGR (%), CAGR (%))
Table 72 Latin America Virtual Power Plant (VPP) Market by Generation Source, 2024-2034 (US$ Mn, AGR (%), CAGR (%))
Table 73 Brazil Virtual Power Plant (VPP) Market by Value, 2024-2034 (US$ Mn, AGR (%), CAGR (%))
Table 74 Mexico Virtual Power Plant (VPP) Market by Value, 2024-2034 (US$ Mn, AGR (%), CAGR (%))
Table 75 Rest of Latin America Virtual Power Plant (VPP) Market by Value, 2024-2034 (US$ Mn, AGR (%), CAGR (%))
Table 76 Strategic Outlook - Contract
Table 77 Siemens AG: Key Details, (CEO, HQ, Revenue, Founded, No. of Employees, Company Type, Website, Business Segment)
Table 78 Siemens AG: Product Benchmarking
Table 79 Siemens AG: Strategic Outlook
Table 80 ABB Ltd.: Key Details, (CEO, HQ, Revenue, Founded, No. of Employees, Company Type, Website, Business Segment)
Table 81 ABB Ltd.: Product Benchmarking
Table 82 ABB Ltd.: Strategic Outlook
Table 83 Schneider Electric SE: Key Details, (CEO, HQ, Revenue, Founded, No. of Employees, Company Type, Website, Business Segment)
Table 84 Schneider Electric SE: Product Benchmarking
Table 85 Schneider Electric SE: Strategic Outlook
Table 86 General Electric Company: Key Details, (CEO, HQ, Revenue, Founded, No. of Employees, Company Type, Website, Business Segment)
Table 87 General Electric Company: Product Benchmarking
Table 88 General Electric Company: Strategic Outlook
Table 89 Next Kraftwerke: Key Details, (CEO, HQ, Revenue, Founded, No. of Employees, Company Type, Website, Business Segment)
Table 90 Next Kraftwerke: Product Benchmarking
Table 91 Next Kraftwerke: Strategic Outlook
Table 92 Cisco Systems Inc: Key Details, (CEO, HQ, Revenue, Founded, No. of Employees, Company Type, Website, Business Segment)
Table 93 Cisco Systems Inc: Product Benchmarking
Table 94 Cisco Systems Inc: Strategic Outlook
Table 95 Enel X: Key Details, (CEO, HQ, Revenue, Founded, No. of Employees, Company Type, Website, Business Segment)
Table 96 Enel X: Product Benchmarking
Table 97 Enel X: Strategic Outlook
Table 98 Engie SA: Key Details, (CEO, HQ, Revenue, Founded, No. of Employees, Company Type, Website, Business Segment)
Table 99 Engie SA: Product Benchmarking
Table 100 Engie SA: Strategic Outlook
Table 101 Sunverge Energy Inc: Key Details, (CEO, HQ, Revenue, Founded, No. of Employees, Company Type, Website, Business Segment)
Table 102 Sunverge Energy Inc: Product Benchmarking
Table 103 Sunverge Energy Inc: Strategic Outlook
Table 104 Spirae Inc.: Key Details, (CEO, HQ, Revenue, Founded, No. of Employees, Company Type, Website, Business Segment)
Table 105 Spirae Inc.: Product Benchmarking
Table 106 Spirae Inc.: Strategic Outlook
Table 107 Tesla, Inc: Key Details, (CEO, HQ, Revenue, Founded, No. of Employees, Company Type, Website, Business Segment)
Table 108 Tesla, Inc: Product Benchmarking
Table 109 Tesla, Inc: Strategic Outlook
Table 110 Cpower Energy Management: Key Details, (CEO, HQ, Revenue, Founded, No. of Employees, Company Type, Website, Business Segment)
Table 111 Cpower Energy Management: Product Benchmarking
Table 112 Cpower Energy Management: Strategic Outlook
Table 113 Sympower: Key Details, (CEO, HQ, Revenue, Founded, No. of Employees, Company Type, Website, Business Segment)
Table 114 Sympower: Product Benchmarking
Table 115 Sympower: Strategic Outlook
Table 116 Swell Energy Inc.: Key Details, (CEO, HQ, Revenue, Founded, No. of Employees, Company Type, Website, Business Segment)
Table 117 Swell Energy Inc.: Product Benchmarking
Table 118 Swell Energy Inc.: Strategic Outlook
Table 119 LO3 Energy Inc.: Key Details, (CEO, HQ, Revenue, Founded, No. of Employees, Company Type, Website, Business Segment)
Table 120 LO3 Energy Inc.: Product Benchmarking
Table 121 LO3 Energy Inc.: Strategic Outlook
図の一覧
Figure 1 Virtual Power Plant (VPP) Market Segmentation
Figure 2 Virtual Power Plant (VPP) Market by Component: Market Attractiveness Index
Figure 3 Virtual Power Plant (VPP) Market by Technology: Market Attractiveness Index
Figure 4 Virtual Power Plant (VPP) Market by End-User: Market Attractiveness Index
Figure 5 Virtual Power Plant (VPP) Market by Generation Source: Market Attractiveness Index
Figure 6 Virtual Power Plant (VPP) Market Attractiveness Index by Region
Figure 7 Virtual Power Plant (VPP) Market: Market Dynamics
Figure 8 Virtual Power Plant (VPP) Market: Porter’s Five Forces Analysis
Figure 9 Global Virtual Power Plant (VPP) Market Share Forecast by COVID, 2024-2034 (%)
Figure 10 Global Virtual Power Plant (VPP) Market by Region, 2024-2034 (US$ Mn, AGR (%)) (V-Shaped Recovery Scenario)
Figure 11 Global Virtual Power Plant (VPP) Market by Region, 2024-2034 (US$ Mn, AGR (%)) (U-Shaped Recovery Scenario)
Figure 12 Global Virtual Power Plant (VPP) Market by Region, 2024-2034 (US$ Mn, AGR (%)) (W-Shaped Recovery Scenario)
Figure 13 Global Virtual Power Plant (VPP) Market by Region, 2024-2034 (US$ Mn, AGR (%)) (L-Shaped Recovery Scenario)
Figure 14 Virtual Power Plant (VPP) Market: PEST Analysis
Figure 15 Virtual Power Plant (VPP) Market by Component: Market Attractiveness Index
Figure 16 Global Virtual Power Plant (VPP) Market by Component, 2024-2034 (US$ Mn, AGR (%))
Figure 17 Virtual Power Plant (VPP) Market Share Forecast by Component, 2024, 2029, 2034 (%)
Figure 18 Software Market by Region, 2024-2034 (US$ Mn, AGR (%))
Figure 19 Software Market Share Forecast by Region, 2024 & 2034 (%)
Figure 20 Hardware Market by Region, 2024-2034 (US$ Mn, AGR (%))
Figure 21 Hardware Market Share Forecast by Region, 2024 & 2034 (%)
Figure 22 Virtual Power Plant (VPP) Market by Technology: Market Attractiveness Index
Figure 23 Global Virtual Power Plant (VPP) Market by Technology, 2024-2034 (US$ Mn, AGR (%))
Figure 24 Virtual Power Plant (VPP) Market Share Forecast by Technology, 2024, 2029, 2034 (%)
Figure 25 Demand Response VPP Market by Region, 2024-2034 (US$ Mn, AGR (%))
Figure 26 Demand Response VPP Market Share Forecast by Region, 2024 & 2034 (%)
Figure 27 Distributed Generation VPP Market by Region, 2024-2034 (US$ Mn, AGR (%))
Figure 28 Distributed Generation VPP Market Share Forecast by Region, 2024 & 2034 (%)
Figure 29 Mixed Asset VPP Market by Region, 2024-2034 (US$ Mn, AGR (%))
Figure 30 Mixed Asset VPP Market Share Forecast by Region, 2024 & 2034 (%)
Figure 31 Virtual Power Plant (VPP) Market by End-User: Market Attractiveness Index
Figure 32 Global Virtual Power Plant (VPP) Market by End-User, 2024-2034 (US$ Mn, AGR (%))
Figure 33 Virtual Power Plant (VPP) Market Share Forecast by End-User, 2024, 2029, 2034 (%)
Figure 34 Residential Market by Region, 2024-2034 (US$ Mn, AGR (%))
Figure 35 Residential Market Share Forecast by Region, 2024 & 2034 (%)
Figure 36 Commercial Market by Region, 2024-2034 (US$ Mn, AGR (%))
Figure 37 Commercial Market Share Forecast by Region, 2024 & 2034 (%)
Figure 38 Industrial Market by Region, 2024-2034 (US$ Mn, AGR (%))
Figure 39 Industrial Market Share Forecast by Region, 2024 & 2034 (%)
Figure 40 Utility Market by Region, 2024-2034 (US$ Mn, AGR (%))
Figure 41 Utility Market Share Forecast by Region, 2024 & 2034 (%)
Figure 42 Virtual Power Plant (VPP) Market by Generation Source: Market Attractiveness Index
Figure 43 Global Virtual Power Plant (VPP) Market by Generation Source, 2024-2034 (US$ Mn, AGR (%))
Figure 44 Virtual Power Plant (VPP) Market Share Forecast by Generation Source, 2024, 2029, 2034 (%)
Figure 45 Solar PV Market by Region, 2024-2034 (US$ Mn, AGR (%))
Figure 46 Solar PV Market Share Forecast by Region, 2024 & 2034 (%)
Figure 47 Wind Power Market by Region, 2024-2034 (US$ Mn, AGR (%))
Figure 48 Wind Power Market Share Forecast by Region, 2024 & 2034 (%)
Figure 49 Combined Heat and Power (CHP) Units Market by Region, 2024-2034 (US$ Mn, AGR (%))
Figure 50 Combined Heat and Power (CHP) Units Market Share Forecast by Region, 2024 & 2034 (%)
Figure 51 Energy Storage Systems Market by Region, 2024-2034 (US$ Mn, AGR (%))
Figure 52 Energy Storage Systems Market Share Forecast by Region, 2024 & 2034 (%)
Figure 53 Other Sources Market by Region, 2024-2034 (US$ Mn, AGR (%))
Figure 54 Other Sources Market Share Forecast by Region, 2024 & 2034 (%)
Figure 55 Virtual Power Plant (VPP) Market Forecast by Region 2024 and 2034 (Revenue, CAGR%)
Figure 56 Virtual Power Plant (VPP) Market Share Forecast by Region 2024, 2029, 2034 (%)
Figure 57 Virtual Power Plant (VPP) Market by Region, 2024-2034 (US$ Million, AGR %)
Figure 58 North America Virtual Power Plant (VPP) Market Attractiveness Index
Figure 59 North America Virtual Power Plant (VPP) Market by Region, 2024, 2029 & 2034 (US$ Million)
Figure 60 North America Virtual Power Plant (VPP) Market by Value, 2024-2034 (US$ Mn, AGR (%))
Figure 61 North America Virtual Power Plant (VPP) Market by Country, 2024-2034 (US$ Mn, AGR (%))
Figure 62 North America Virtual Power Plant (VPP) Market Share Forecast by Country, 2024 & 2034 (%)
Figure 63 North America Virtual Power Plant (VPP) Market by Component, 2024-2034 (US$ Mn, AGR (%))
Figure 64 North America Virtual Power Plant (VPP) Market Share Forecast Component, 2024 & 2034 (%)
Figure 65 North America Virtual Power Plant (VPP) Market by Technology, 2024-2034 (US$ Mn, AGR (%))
Figure 66 North America Virtual Power Plant (VPP) Market Share Forecast by Technology, 2024 & 2034 (%)
Figure 67 North America Virtual Power Plant (VPP) Market by End-User, 2024-2034 (US$ Mn, AGR (%))
Figure 68 North America Virtual Power Plant (VPP) Market Share Forecast by End-User, 2024 & 2034 (%)
Figure 69 North America Virtual Power Plant (VPP) Market by Generation Source, 2024-2034 (US$ Mn, AGR (%))
Figure 70 North America Virtual Power Plant (VPP) Market Share Forecast by Generation Source, 2024 & 2034 (%)
Figure 71 US Virtual Power Plant (VPP) Market by Value, 2024-2034 (US$ Mn, AGR (%))
Figure 72 Canada Virtual Power Plant (VPP) Market by Value, 2024-2034 (US$ Mn, AGR (%))
Figure 73 Europe Virtual Power Plant (VPP) Market Attractiveness Index
Figure 74 Europe Virtual Power Plant (VPP) Market by Region, 2024, 2029 & 2034 (US$ Million)
Figure 75 Europe Virtual Power Plant (VPP) Market by Value, 2024-2034 (US$ Mn, AGR (%))
Figure 76 Europe Virtual Power Plant (VPP) Market by Country, 2024-2034 (US$ Mn, AGR (%))
Figure 77 Europe Virtual Power Plant (VPP) Market Share Forecast by Country, 2024 & 2034 (%)
Figure 78 Europe Virtual Power Plant (VPP) Market by Component, 2024-2034 (US$ Mn, AGR (%))
Figure 79 Europe Virtual Power Plant (VPP) Market Share Forecast Component, 2024 & 2034 (%)
Figure 80 Europe Virtual Power Plant (VPP) Market by Technology, 2024-2034 (US$ Mn, AGR (%))
Figure 81 Europe Virtual Power Plant (VPP) Market Share Forecast by Technology, 2024 & 2034 (%)
Figure 82 Europe Virtual Power Plant (VPP) Market by End-User, 2024-2034 (US$ Mn, AGR (%))
Figure 83 Europe Virtual Power Plant (VPP) Market Share Forecast by End-User, 2024 & 2034 (%)
Figure 84 Europe Virtual Power Plant (VPP) Market by Generation Source, 2024-2034 (US$ Mn, AGR (%))
Figure 85 Europe Virtual Power Plant (VPP) Market Share Forecast by Generation Source, 2024 & 2034 (%)
Figure 86 Germany Virtual Power Plant (VPP) Market by Value, 2024-2034 (US$ Mn, AGR (%))
Figure 87 UK Virtual Power Plant (VPP) Market by Value, 2024-2034 (US$ Mn, AGR (%))
Figure 88 France Virtual Power Plant (VPP) Market by Value, 2024-2034 (US$ Mn, AGR (%))
Figure 89 Italy Virtual Power Plant (VPP) Market by Value, 2024-2034 (US$ Mn, AGR (%))
Figure 90 Spain Virtual Power Plant (VPP) Market by Value, 2024-2034 (US$ Mn, AGR (%))
Figure 91 Rest of Europe Virtual Power Plant (VPP) Market by Value, 2024-2034 (US$ Mn, AGR (%))
Figure 92 Asia-Pacific Virtual Power Plant (VPP) Market Attractiveness Index
Figure 93 Asia-Pacific Virtual Power Plant (VPP) Market by Region, 2024, 2029 & 2034 (US$ Million)
Figure 94 Asia-Pacific Virtual Power Plant (VPP) Market by Value, 2024-2034 (US$ Mn, AGR (%))
Figure 95 Asia-Pacific Virtual Power Plant (VPP) Market by Country, 2024-2034 (US$ Mn, AGR (%))
Figure 96 Asia-Pacific Virtual Power Plant (VPP) Market Share Forecast by Country, 2024 & 2034 (%)
Figure 97 Asia-Pacific Virtual Power Plant (VPP) Market by Component, 2024-2034 (US$ Mn, AGR (%))
Figure 98 Asia-Pacific Virtual Power Plant (VPP) Market Share Forecast Component, 2024 & 2034 (%)
Figure 99 Asia-Pacific Virtual Power Plant (VPP) Market by Technology, 2024-2034 (US$ Mn, AGR (%))
Figure 100 Asia-Pacific Virtual Power Plant (VPP) Market Share Forecast by Technology, 2024 & 2034 (%)
Figure 101 Asia-Pacific Virtual Power Plant (VPP) Market by End-User, 2024-2034 (US$ Mn, AGR (%))
Figure 102 Asia-Pacific Virtual Power Plant (VPP) Market Share Forecast by End-User, 2024 & 2034 (%)
Figure 103 Asia-Pacific Virtual Power Plant (VPP) Market by Generation Source, 2024-2034 (US$ Mn, AGR (%))
Figure 104 Asia-Pacific Virtual Power Plant (VPP) Market Share Forecast by Generation Source, 2024 & 2034 (%)
Figure 105 China Virtual Power Plant (VPP) Market by Value, 2024-2034 (US$ Mn, AGR (%))
Figure 106 India Virtual Power Plant (VPP) Market by Value, 2024-2034 (US$ Mn, AGR (%))
Figure 107 Japan Virtual Power Plant (VPP) Market by Value, 2024-2034 (US$ Mn, AGR (%))
Figure 108 South Korea Virtual Power Plant (VPP) Market by Value, 2024-2034 (US$ Mn, AGR (%))
Figure 109 Australia Virtual Power Plant (VPP) Market by Value, 2024-2034 (US$ Mn, AGR (%))
Figure 110 Rest of Asia-Pacific Virtual Power Plant (VPP) Market by Value, 2024-2034 (US$ Mn, AGR (%))
Figure 111 Middle East and Africa Virtual Power Plant (VPP) Market Attractiveness Index
Figure 112 Middle East and Africa Virtual Power Plant (VPP) Market by Region, 2024, 2029 & 2034 (US$ Million)
Figure 113 Middle East & Africa Virtual Power Plant (VPP) Market by Value, 2024-2034 (US$ Mn, AGR (%))
Figure 114 Middle East & Africa Virtual Power Plant (VPP) Market by Country, 2024-2034 (US$ Mn, AGR (%))
Figure 115 Middle East and Africa Virtual Power Plant (VPP) Market Share Forecast by Country, 2024 & 2034 (%)
Figure 116 Middle East & Africa Virtual Power Plant (VPP) Market by Component, 2024-2034 (US$ Mn, AGR (%))
Figure 117 Middle East and Africa Virtual Power Plant (VPP) Market Share Forecast Component, 2024 & 2034 (%)
Figure 118 Middle East & Africa Virtual Power Plant (VPP) Market by Technology, 2024-2034 (US$ Mn, AGR (%))
Figure 119 Middle East and Africa Virtual Power Plant (VPP) Market Share Forecast by Technology, 2024 & 2034 (%)
Figure 120 Middle East & Africa Virtual Power Plant (VPP) Market by End-User, 2024-2034 (US$ Mn, AGR (%))
Figure 121 Middle East and Africa Virtual Power Plant (VPP) Market Share Forecast by End-User, 2024 & 2034 (%)
Figure 122 Middle East & Africa Virtual Power Plant (VPP) Market by Generation Source, 2024-2034 (US$ Mn, AGR (%))
Figure 123 Middle East and Africa Virtual Power Plant (VPP) Market Share Forecast by Generation Source, 2024 & 2034 (%)
Figure 124 GCC Virtual Power Plant (VPP) Market by Value, 2024-2034 (US$ Mn, AGR (%))
Figure 125 South Africa Virtual Power Plant (VPP) Market by Value, 2024-2034 (US$ Mn, AGR (%))
Figure 126 Rest of Middle East & Africa Virtual Power Plant (VPP) Market by Value, 2024-2034 (US$ Mn, AGR (%))
Figure 127 Latin America Virtual Power Plant (VPP) Market Attractiveness Index
Figure 128 Latin America Virtual Power Plant (VPP) Market by Region, 2024, 2029 & 2034 (US$ Million)
Figure 129 Latin America Virtual Power Plant (VPP) Market by Value, 2024-2034 (US$ Mn, AGR (%))
Figure 130 Latin America Virtual Power Plant (VPP) Market by Country, 2024-2034 (US$ Mn, AGR (%))
Figure 131 Latin America Virtual Power Plant (VPP) Market Share Forecast by Country, 2024 & 2034 (%)
Figure 132 Latin America Virtual Power Plant (VPP) Market by Component, 2024-2034 (US$ Mn, AGR (%))
Figure 133 Latin America Virtual Power Plant (VPP) Market Share Forecast Component, 2024 & 2034 (%)
Figure 134 Latin America Virtual Power Plant (VPP) Market by Technology, 2024-2034 (US$ Mn, AGR (%))
Figure 135 Latin America Virtual Power Plant (VPP) Market Share Forecast by Technology, 2024 & 2034 (%)
Figure 136 Latin America Virtual Power Plant (VPP) Market by End-User, 2024-2034 (US$ Mn, AGR (%))
Figure 137 Latin America Virtual Power Plant (VPP) Market Share Forecast by End-User, 2024 & 2034 (%)
Figure 138 Latin America Virtual Power Plant (VPP) Market by Generation Source, 2024-2034 (US$ Mn, AGR (%))
Figure 139 Latin America Virtual Power Plant (VPP) Market Share Forecast by Generation Source, 2024 & 2034 (%)
Figure 140 Brazil Virtual Power Plant (VPP) Market by Value, 2024-2034 (US$ Mn, AGR (%))
Figure 141 Mexico Virtual Power Plant (VPP) Market by Value, 2024-2034 (US$ Mn, AGR (%))
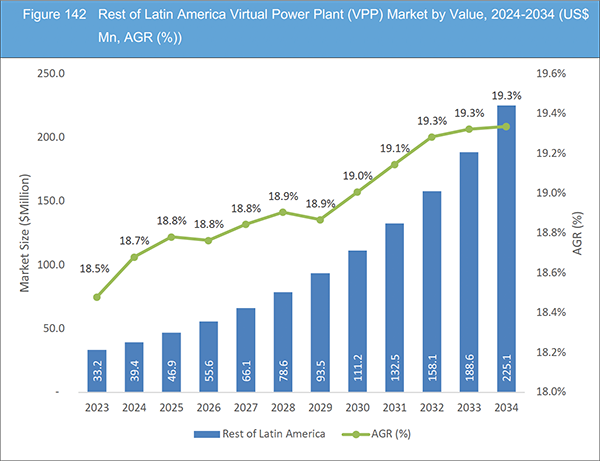
Figure 142 Rest of Latin America Virtual Power Plant (VPP) Market by Value, 2024-2034 (US$ Mn, AGR (%))
Figure 143 Virtual Power Plant (VPP) Market: Company Share, 2022
Figure 144 Siemens AG.: Net Revenue, 2018-2022 (US$ Million, AGR%)
Figure 145 Siemens AG.: R&D, 2018-2022 (US$ Million, AGR%)
Figure 146 Siemens AG.: Regional Revenue Share, 2022 (%)
Figure 147 Siemens AG.: Business Segment Revenue Share, 2022 (%)
Figure 148 ABB Ltd.: Net Revenue, 2018-2022 (US$ Million, AGR%)
Figure 149 ABB Ltd..: R&D, 2018-2022 (US$ Million, AGR%)
Figure 150 ABB Ltd..: Business Segment Revenue Share, 2022 (%)
Figure 151 Schneider Electric SE.: Net Revenue, 2018-2022 (US$ Million, AGR%)
Figure 152 Schneider Electric SE.: R&D, 2018-2022 (US$ Million, AGR%)
Figure 153 Schneider Electric SE.: Regional Revenue Share, 2022 (%)
Figure 154 Schneider Electric SE.: Business Segment Revenue Share, 2022 (%)
Figure 155 General Electric Company.: Net Revenue, 2018-2022 (US$ Million, AGR%)
Figure 156 General Electric Company.: R&D, 2018-2022 (US$ Million, AGR%)
Figure 157 General Electric Company.: Regional Revenue Share, 2022 (%)
Figure 158 General Electric Company.: Business Segment Revenue Share, 2022 (%)
Figure 159 Cisco Systems Inc.: Net Revenue, 2019-2023 (US$ Million, AGR%)
Figure 160 Cisco Systems Inc.: R&D, 2019-2023 (US$ Million, AGR%)
Figure 161 Cisco Systems Inc.: Regional Revenue Share, 2023 (%)
Figure 162 Cisco Systems Inc.: Business Segment Revenue Share, 2023 (%)
Figure 163 Enel X.: Net Revenue, 2018-2022 (US$ Million, AGR%)
Figure 164 Enel X.: R&D, 2018-2022 (US$ Million, AGR%)
Figure 165 Enel X.: Regional Revenue Share, 2022 (%)
Figure 166 Enel X.: Business Segment Revenue Share, 2022 (%)
Figure 167 Tesla, Inc.: Net Revenue, 2018-2022 (US$ Million, AGR%)
Figure 168 Tesla, Inc.: R&D, 2018-2022 (US$ Million, AGR%)
Figure 169 Tesla, Inc.: Regional Revenue Share, 2022 (%)
Figure 170 Tesla, Inc.: Business Segment Revenue Share, 2022 (%)
ページTOPに戻る
Summary
Report Details
The Virtual Power Plant (VPP) Market Report 2024-2034: This report will prove invaluable to leading firms striving for new revenue pockets if they wish to better understand the industry and its underlying dynamics. It will be useful for companies that would like to expand into different industries or to expand their existing operations in a new region.
Driving Forces and Opportunities in the Virtual Power Plant (VPP) Market
The propulsion of the VPP market stems from several influential factors, with the widespread deployment of Distributed Energy Resources (DERs), encompassing solar PV, wind power, and energy storage systems, standing out as a primary catalyst. A global shift toward cleaner energy sources, supported by governments and industries, encourages the seamless integration of renewable resources into the grid. Simultaneously, the ongoing liberalization of electricity markets acts as a driving force, fostering demand for innovative solutions like VPPs that provide essential flexibility and adaptability within the ever-evolving energy landscape.
Vulnerability to Cyber Threats and Potential System Failures Rises Restraining Factor for Market Growth
The vulnerability to cyber threats and potential system failures stands out as a significant restraining factor for the growth of the Virtual Power Plant (VPP) market. As VPPs rely heavily on digital technologies and interconnected systems, they become susceptible to cyberattacks, which could compromise the integrity and functionality of the entire system. The interconnected nature of VPPs, designed to enhance efficiency and coordination, also exposes them to the risk of system failures. Any disruptions, whether caused by cyber threats or system failures, can have far-reaching consequences, affecting the reliability and stability of power generation and distribution. As a result, addressing and mitigating these vulnerabilities becomes crucial for the widespread and secure adoption of VPP technologies.
What Questions Should You Ask before Buying a Market Research Report?
• How is the virtual power plant (VPP) market evolving?
• What is driving and restraining the virtual power plant (VPP) market?
• How will each virtual power plant (VPP) submarket segment grow over the forecast period and how much revenue will these submarkets account for in 2034?
• How will the market shares for each virtual power plant (VPP) submarket develop from 2024 to 2034?
• What will be the main driver for the overall market from 2024 to 2034?
• Will leading virtual power plant (VPP) markets broadly follow the macroeconomic dynamics, or will individual national markets outperform others?
• How will the market shares of the national markets change by 2034 and which geographical region will lead the market in 2034?
• Who are the leading players and what are their prospects over the forecast period?
• What are the virtual power plant (VPP) projects for these leading companies?
• How will the industry evolve during the period between 2024 and 2034? What are the implications of virtual power plant (VPP) projects taking place now and over the next 10 years?
• Is there a greater need for product commercialisation to further scale the virtual power plant (VPP) market?
• Where is the virtual power plant (VPP) market heading and how can you ensure you are at the forefront of the market?
• What are the best investment options for new product and service lines?
• What are the key prospects for moving companies into a new growth path and C-suite?
You need to discover how this will impact the virtual power plant (VPP) market today, and over the next 10 years:
• Our 367-page report provides 120 tables and 170 charts/graphs exclusively to you.
• The report highlights key lucrative areas in the industry so you can target them – NOW.
• It contains in-depth analysis of global, regional and national sales and growth.
• It highlights for you the key successful trends, changes and revenue projections made by your competitors.
This report tells you TODAY how the virtual power plant (VPP) market will develop in the next 10 years, and in line with the variations in COVID-19 economic recession and bounce. This market is more critical now than at any point over the last 10 years.
Forecasts to 2034 and other analyses reveal commercial prospects
• In addition to revenue forecasting to 2034, our new study provides you with recent results, growth rates, and market shares.
• You will find original analyses, with business outlooks and developments.
• Discover qualitative analyses (including market dynamics, drivers, opportunities, restraints and challenges), cost structure, impact of rising virtual power plant (VPP) prices and recent developments.
This report includes data analysis and invaluable insight into how COVID-19 will affect the industry and your company. Four COVID-19 recovery patterns and their impact, namely, “V”, “L”, “W” and “U” are discussed in this report.
Segments Covered in the Report
Market Segment by Component
• Software
• Hardware
Market Segment by Technology
• Demand Response VPP
• Distributed Generation VPP
• Mixed Asset VPP
Market Segment by End-User
• Residential
• Commercial
• Industrial
• Utility
Market Segment by Generation Source
• Solar PV
• Wind Power
• Combined Heat and Power (CHP) Units
• Energy Storage Systems
• Other Sources
In addition to the revenue predictions for the overall world market and segments, you will also find revenue forecasts for four regional and 20 leading national markets:
North America
• U.S.
• Canada
Europe
• Germany
• Spain
• United Kingdom
• France
• Italy
• Rest of Europe
Asia Pacific
• China
• Japan
• India
• Australia
• South Korea
• Rest of Asia Pacific
Latin America
• Brazil
• Mexico
• Rest of Latin America
Middle East & Africa
• GCC
• South Africa
• Rest of Middle East & Africa
The report also includes profiles and for some of the leading companies in the Virtual Power Plant (VPP) Market, 2024 to 2034, with a focus on this segment of these companies’ operations.
Leading companies profiled in the report
• ABB Ltd.
• Cisco Systems Inc.
• Cpower Energy Management
• Enel X
• Engie SA
• General Electric Company
• LO3 Energy Inc.
• Next Kraftwerke
• Schneider Electric SE
• Siemens AG
• Spirae Inc.
• Sunverge Energy Inc.
• Swell Energy Inc.
• Sympower
• Tesla, Inc.
Overall world revenue for Virtual Power Plant (VPP) Market, 2024 to 2034 in terms of value the market will surpass US$2,638.8 million in 2024, our work calculates. We predict strong revenue growth through to 2034. Our work identifies which organizations hold the greatest potential. Discover their capabilities, progress, and commercial prospects, helping you stay ahead.
How will the Virtual Power Plant (VPP) Market, 2024 to 2034 report help you?
In summary, our 360+ page report provides you with the following knowledge:
• Revenue forecasts to 2034 for Virtual Power Plant (VPP) Market, 2024 to 2034 Market, with forecasts for component, technology, end-user, and generation source, each forecast at a global and regional level – discover the industry’s prospects, finding the most lucrative places for investments and revenues.
• Revenue forecasts to 2034 for four regional and 20 key national markets – See forecasts for the Virtual Power Plant (VPP) Market, 2024 to 2034 market in North America, Europe, Asia-Pacific, Latin America and Middle East & Africa. Also forecasted is the market in the US, Canada, Brazil, Germany, France, UK, Italy, China, India, Japan, and Australia among other prominent economies.
• Prospects for established firms and those seeking to enter the market – including company profiles for 15 of the major companies involved in the Virtual Power Plant (VPP) Market, 2024 to 2034.
Find quantitative and qualitative analyses with independent predictions. Receive information that only our report contains, staying informed with invaluable business intelligence.
Information found nowhere else
With our new report, you are less likely to fall behind in knowledge or miss out on opportunities. See how our work could benefit your research, analyses, and decisions. Visiongain’s study is for everybody needing commercial analyses for the Virtual Power Plant (VPP) Market, 2024 to 2034, market-leading companies. You will find data, trends and predictions.
ページTOPに戻る
Table of Contents
Table of Contents
1 Report Overview
1.1 Objectives of the Study
1.2 Introduction to Virtual Power Plant (VPP) Market
1.3 What This Report Delivers
1.4 Why You Should Read This Report
1.5 Key Questions Answered by This Analytical Report
1.6 Who Is This Report for?
1.7 Methodology
1.7.1 Market Definitions
1.7.2 Market Evaluation & Forecasting Methodology
1.7.3 Data Validation
1.7.3.1 Primary Research
1.7.3.2 Secondary Research
1.8 Frequently Asked Questions (FAQs)
1.9 Associated Visiongain Reports
1.10 About Visiongain
2 Executive Summary
3 Market Overview
3.1 Key Findings
3.2 Market Dynamics
3.2.1 Market Driving Factors
3.2.1.1 Ongoing Innovation and Research Fueling VPP Advancements
3.2.1.2 Virtual Power Plants Could be Pathway to Decarbonization
3.2.1.3 VPPs as Platforms for Distributed Energy Resources (DERs)
3.2.2 Market Restraining Factors
3.2.2.1 Vulnerability to Cyber Threats and Potential System Failures Rises Restraining Factor for Market Growth
3.2.2.2 The Substantial Upfront Costs Associated with the Deployment of VPP Infrastructure, Including Smart Grids and Advanced Control Systems
3.2.2.3 Fluctuations in Energy Markets, coupled with Uncertainties in Government Policies and Incentives
3.2.3 Market Opportunities
3.2.3.1 Continued Advancements in Iot, AI, And Communication Technologies
3.2.3.2 Countries Worldwide Recognize the Benefits of Smart, Distributed Energy Systems
3.2.3.3 Increasing Adoption of Residential Solar, Storage, and Smart Home Technologies Contributes to the Growth of VPPs
3.3 Porter’s Five Forces Analysis
3.3.1 Bargaining Power of Suppliers (Medium)
3.3.2 Bargaining Power of Buyers (Medium to High)
3.3.3 Competitive Rivalry (High)
3.3.4 Threat from Substitutes (Low)
3.3.5 Threat of New Entrants (Medium)
3.4 COVID-19 Impact Analysis
3.4.1 “V-Shaped Recovery”
3.4.2 “U-Shaped Recovery”
3.4.3 “W-Shaped Recovery”
3.4.4 “L-Shaped Recovery”
3.5 PEST Analysis
4 Virtual Power Plant (VPP) Market Analysis by Component
4.1 Key Findings
4.2 Component Segment: Market Attractiveness Index
4.3 Virtual Power Plant (VPP) Market Size Estimation and Forecast by Component
4.4 Software
4.4.1 Market Size by Region, 2024-2034 (US$ Million)
4.4.2 Market Share by Region, 2024 & 2034 (%)
4.5 Hardware
4.5.1 Market Size by Region, 2024-2034 (US$ Million)
4.5.2 Market Share by Region, 2024 & 2034 (%)
5 Virtual Power Plant (VPP) Market Analysis by Technology
5.1 Key Findings
5.2 Technology Segment: Market Attractiveness Index
5.3 Virtual Power Plant (VPP) Market Size Estimation and Forecast by Technology
5.4 Demand Response VPP
5.4.1 Market Size by Region, 2024-2034 (US$ Million)
5.4.2 Market Share by Region, 2024 & 2034 (%)
5.5 Distributed Generation VPP
5.5.1 Market Size by Region, 2024-2034 (US$ Million)
5.5.2 Market Share by Region, 2024 & 2034 (%)
5.6 Mixed Asset VPP
5.6.1 Market Size by Region, 2024-2034 (US$ Million)
5.6.2 Market Share by Region, 2024 & 2034 (%)
6 Virtual Power Plant (VPP) Market Analysis by End-User
6.1 Key Findings
6.2 End-User Segment: Market Attractiveness Index
6.3 Virtual Power Plant (VPP) Market Size Estimation and Forecast by End-User
6.4 Residential
6.4.1 Market Size by Region, 2024-2034 (US$ Million)
6.4.2 Market Share by Region, 2024 & 2034 (%)
6.5 Commercial
6.5.1 Market Size by Region, 2024-2034 (US$ Million)
6.5.2 Market Share by Region, 2024 & 2034 (%)
6.6 Industrial
6.6.1 Market Size by Region, 2024-2034 (US$ Million)
6.6.2 Market Share by Region, 2024 & 2034 (%)
6.7 Utility
6.7.1 Market Size by Region, 2024-2034 (US$ Million)
6.7.2 Market Share by Region, 2024 & 2034 (%)
7 Virtual Power Plant (VPP) Market Analysis by Generation Source
7.1 Key Findings
7.2 Generation Source Segment: Market Attractiveness Index
7.3 Virtual Power Plant (VPP) Market Size Estimation and Forecast by Generation Source
7.4 Solar PV
7.4.1 Market Size by Region, 2024-2034 (US$ Million)
7.4.2 Market Share by Region, 2024 & 2034 (%)
7.5 Wind Power
7.5.1 Market Size by Region, 2024-2034 (US$ Million)
7.5.2 Market Share by Region, 2024 & 2034 (%)
7.6 Combined Heat and Power (CHP) Units
7.6.1 Market Size by Region, 2024-2034 (US$ Million)
7.6.2 Market Share by Region, 2024 & 2034 (%)
7.7 Energy Storage Systems
7.7.1 Market Size by Region, 2024-2034 (US$ Million)
7.7.2 Market Share by Region, 2024 & 2034 (%)
7.8 Other Sources
7.8.1 Market Size by Region, 2024-2034 (US$ Million)
7.8.2 Market Share by Region, 2024 & 2034 (%)
8 Virtual Power Plant (VPP) Market Analysis by Region
8.1 Key Findings
8.2 Regional Market Size Estimation and Forecast
9 North America Virtual Power Plant (VPP) Market Analysis
9.1 Key Findings
9.2 North America Virtual Power Plant (VPP) Market Attractiveness Index
9.3 North America Virtual Power Plant (VPP) Market by Country, 2024, 2029 & 2034 (US$ Million)
9.4 North America Virtual Power Plant (VPP) Market Size Estimation and Forecast
9.5 North America Virtual Power Plant (VPP) Market Size Estimation and Forecast by Country
9.6 North America Virtual Power Plant (VPP) Market Size Estimation and Forecast by Component
9.7 North America Virtual Power Plant (VPP) Market Size Estimation and Forecast by Technology
9.8 North America Virtual Power Plant (VPP) Market Size Estimation and Forecast by End-User
9.9 North America Virtual Power Plant (VPP) Market Size Estimation and Forecast by Generation Source
9.10 U.S. Virtual Power Plant (VPP) Market Analysis
9.11 Canada Virtual Power Plant (VPP) Market Analysis
10 Europe Virtual Power Plant (VPP) Market Analysis
10.1 Key Findings
10.2 Europe Virtual Power Plant (VPP) Market Attractiveness Index
10.3 Europe Virtual Power Plant (VPP) Market by Country, 2024, 2029 & 2034 (US$ Million)
10.4 Europe Virtual Power Plant (VPP) Market Size Estimation and Forecast
10.5 Europe Virtual Power Plant (VPP) Market Size Estimation and Forecast by Country
10.6 Europe Virtual Power Plant (VPP) Market Size Estimation and Forecast by Component
10.7 Europe Virtual Power Plant (VPP) Market Size Estimation and Forecast by Technology
10.8 Europe Virtual Power Plant (VPP) Market Size Estimation and Forecast by End-User
10.9 Europe Virtual Power Plant (VPP) Market Size Estimation and Forecast by Generation Source
10.10 Germany Virtual Power Plant (VPP) Market Analysis
10.11 UK Virtual Power Plant (VPP) Market Analysis
10.12 France Virtual Power Plant (VPP) Market Analysis
10.13 Italy Virtual Power Plant (VPP) Market Analysis
10.14 Spain Virtual Power Plant (VPP) Market Analysis
10.15 Rest of Europe Virtual Power Plant (VPP) Market Analysis
11 Asia-Pacific Virtual Power Plant (VPP) Market Analysis
11.1 Key Findings
11.2 Asia-Pacific Virtual Power Plant (VPP) Market Attractiveness Index
11.3 Asia-Pacific Virtual Power Plant (VPP) Market by Country, 2024, 2029 & 2034 (US$ Million)
11.4 Asia-Pacific Virtual Power Plant (VPP) Market Size Estimation and Forecast
11.5 Asia-Pacific Virtual Power Plant (VPP) Market Size Estimation and Forecast by Country
11.6 Asia-Pacific Virtual Power Plant (VPP) Market Size Estimation and Forecast by Component
11.7 Asia-Pacific Virtual Power Plant (VPP) Market Size Estimation and Forecast by Technology
11.8 Asia-Pacific Virtual Power Plant (VPP) Market Size Estimation and Forecast by End-User
11.9 Asia-Pacific Virtual Power Plant (VPP) Market Size Estimation and Forecast by Generation Source
11.10 China Virtual Power Plant (VPP) Market Analysis
11.11 India Virtual Power Plant (VPP) Market Analysis
11.12 Japan Virtual Power Plant (VPP) Market Analysis
11.13 South Korea Virtual Power Plant (VPP) Market Analysis
11.14 Australia Virtual Power Plant (VPP) Market Analysis
11.15 Rest of Asia-Pacific Virtual Power Plant (VPP) Market Analysis
12 Middle East and Africa Virtual Power Plant (VPP) Market Analysis
12.1 Key Findings
12.2 Middle East and Africa Virtual Power Plant (VPP) Market Attractiveness Index
12.3 Middle East and Africa Virtual Power Plant (VPP) Market by Country, 2024, 2029 & 2034 (US$ Million)
12.4 Middle East and Africa Virtual Power Plant (VPP) Market Size Estimation and Forecast
12.5 Middle East and Africa Virtual Power Plant (VPP) Market Size Estimation and Forecast by Country
12.6 Middle East and Africa Virtual Power Plant (VPP) Market Size Estimation and Forecast by Component
12.7 Middle East and Africa Virtual Power Plant (VPP) Market Size Estimation and Forecast by Technology
12.8 Middle East and Africa Virtual Power Plant (VPP) Market Size Estimation and Forecast by End-User
12.9 Middle East and Africa Virtual Power Plant (VPP) Market Size Estimation and Forecast by Generation Source
12.10 GCC Virtual Power Plant (VPP) Market Analysis
12.11 South Africa Virtual Power Plant (VPP) Market Analysis
12.12 Rest of Middle East & Africa Virtual Power Plant (VPP) Market Analysis
13 Latin America Virtual Power Plant (VPP) Market Analysis
13.1 Key Findings
13.2 Latin America Virtual Power Plant (VPP) Market Attractiveness Index
13.3 Latin America Virtual Power Plant (VPP) Market by Country, 2024, 2029 & 2034 (US$ Million)
13.4 Latin America Virtual Power Plant (VPP) Market Size Estimation and Forecast
13.5 Latin America Virtual Power Plant (VPP) Market Size Estimation and Forecast by Country
13.6 Latin America Virtual Power Plant (VPP) Market Size Estimation and Forecast by Component
13.7 Latin America Virtual Power Plant (VPP) Market Size Estimation and Forecast by Technology
13.8 Latin America Virtual Power Plant (VPP) Market Size Estimation and Forecast by End-User
13.9 Latin America Virtual Power Plant (VPP) Market Size Estimation and Forecast by Generation Source
13.10 Brazil Virtual Power Plant (VPP) Market Analysis
13.11 Mexico Virtual Power Plant (VPP) Market Analysis
13.12 Rest of Latin America Virtual Power Plant (VPP) Market Analysis
14 Company Profiles
14.1 Competitive Landscape, 2022
14.2 Strategic Outlook
14.3 Siemens AG
14.3.1 Company Snapshot
14.3.2 Company Overview
14.3.3 Financial Analysis
14.3.4 Net Revenue, 2018-2022
14.3.4.1 R&D, 2018-2022
14.3.4.2 Regional Revenue Share, 2022 (%)
14.3.4.3 Business Segment Revenue Share, 2022 (%)
14.3.5 Product Benchmarking
14.3.6 Strategic Outlook
14.4 ABB Ltd.
14.4.1 Company Snapshot
14.4.2 Company Overview
14.4.3 Financial Analysis
14.4.4 Net Revenue, 2018-2022
14.4.4.1 R&D, 2018-2022
14.4.4.2 Business Segment Revenue Share, 2022 (%)
14.4.5 Product Benchmarking
14.4.6 Strategic Outlook
14.5 Schneider Electric SE
14.5.1 Company Snapshot
14.5.2 Company Overview
14.5.3 Financial Analysis
14.5.4 Net Revenue, 2018-2022
14.5.4.1 R&D, 2018-2022
14.5.4.2 Regional Revenue Share, 2022 (%)
14.5.4.3 Business Segment Revenue Share, 2022 (%)
14.5.5 Product Benchmarking
14.5.6 Strategic Outlook
14.6 General Electric Company
14.6.1 Company Snapshot
14.6.2 Company Overview
14.6.3 Financial Analysis
14.6.4 Net Revenue, 2018-2022
14.6.4.1 R&D, 2018-2022
14.6.4.2 Regional Revenue Share, 2022 (%)
14.6.4.3 Business Segment Revenue Share, 2022 (%)
14.6.5 Product Benchmarking
14.6.6 Strategic Outlook
14.7 Next Kraftwerke
14.7.1 Company Snapshot
14.7.2 Company Overview
14.7.3 Product Benchmarking
14.7.4 Strategic Outlook
14.8 Cisco Systems Inc
14.8.1 Company Snapshot
14.8.2 Company Overview
14.8.3 Financial Analysis
14.8.4 Net Revenue, 2019-2023
14.8.4.1 R&D, 2019-2023
14.8.4.2 Regional Revenue Share, 2023 (%)
14.8.4.3 Business Segment Revenue Share, 2023 (%)
14.8.5 Product Benchmarking
14.8.6 Strategic Outlook
14.9 Enel X
14.9.1 Company Snapshot
14.9.2 Company Overview
14.9.3 Financial Analysis
14.9.4 Net Revenue, 2018-2022
14.9.4.1 R&D, 2018-2022
14.9.4.2 Regional Revenue Share, 2022 (%)
14.9.4.3 Business Segment Revenue Share, 2022 (%)
14.9.5 Product Benchmarking
14.9.6 Strategic Outlook
14.10 Engie SA
14.10.1 Company Snapshot
14.10.2 Company Overview
14.10.3 Product Benchmarking
14.10.4 Strategic Outlook
14.11 Sunverge Energy Inc
14.11.1 Company Snapshot
14.11.2 Company Overview
14.11.3 Product Benchmarking
14.11.4 Strategic Outlook
14.12 Spirae Inc.
14.12.1 Company Snapshot
14.12.2 Company Overview
14.12.3 Product Benchmarking
14.12.4 Strategic Outlook
14.13 Tesla, Inc
14.13.1 Company Snapshot
14.13.2 Company Overview
14.13.3 Financial Analysis
14.13.4 Net Revenue, 2018-2022
14.13.4.1 R&D, 2018-2022
14.13.4.2 Regional Revenue Share, 2022 (%)
14.13.4.3 Business Segment Revenue Share, 2022 (%)
14.13.5 Product Benchmarking
14.13.6 Strategic Outlook
14.14 Cpower Energy Management
14.14.1 Company Snapshot
14.14.2 Company Overview
14.14.3 Product Benchmarking
14.14.4 Strategic Outlook
14.15 Sympower
14.15.1 Company Snapshot
14.15.2 Company Overview
14.15.3 Product Benchmarking
14.15.4 Strategic Outlook
14.16 Swell Energy Inc.
14.16.1 Company Snapshot
14.16.2 Company Overview
14.16.3 Product Benchmarking
14.16.4 Strategic Outlook
14.17 LO3 Energy Inc.
14.17.1 Company Snapshot
14.17.2 Company Overview
14.17.3 Product Benchmarking
14.17.4 Strategic Outlook
15 Conclusion and Recommendations
15.1 Concluding Remarks from Visiongain
15.2 Recommendations for Market Players
ページTOPに戻る
List of Tables/Graphs
List of Tables
Table 1 Virtual Power Plant (VPP) Market Snapshot, 2024 & 2034 (US$ Million, CAGR %)
Table 2 Annual Solar PV capacity additions in India, 2019-2022
Table 3 Global Virtual Power Plant (VPP) Market by Region, 2024-2034 (US$ Mn, AGR (%), CAGR (%)) (V-Shaped Recovery Scenario)
Table 4 Global Virtual Power Plant (VPP) Market by Region, 2024-2034 (US$ Mn, AGR (%), CAGR (%)) (U-Shaped Recovery Scenario)
Table 5 Global Virtual Power Plant (VPP) Market by Region, 2024-2034 (US$ Mn, AGR (%), CAGR (%)) (W-Shaped Recovery Scenario)
Table 6 Global Virtual Power Plant (VPP) Market by Region, 2024-2034 (US$ Mn, AGR (%), CAGR (%)) (L-Shaped Recovery Scenario)
Table 7 Global Virtual Power Plant (VPP) Market by Component, 2024-2034 (US$ Mn, AGR (%), CAGR (%))
Table 8 Software Market by Region, 2024-2034 (US$ Mn, AGR (%), CAGR (%))
Table 9 Hardware Market by Region, 2024-2034 (US$ Mn, AGR (%), CAGR (%))
Table 10 Global Virtual Power Plant (VPP) Market by Technology, 2024-2034 (US$ Mn, AGR (%), CAGR (%))
Table 11 Demand Response VPP Market by Region, 2024-2034 (US$ Mn, AGR (%), CAGR (%))
Table 12 Distributed Generation VPP Market by Region, 2024-2034 (US$ Mn, AGR (%), CAGR (%))
Table 13 Mixed Asset VPP Market by Region, 2024-2034 (US$ Mn, AGR (%), CAGR (%))
Table 14 Global Virtual Power Plant (VPP) Market by End-User, 2024-2034 (US$ Mn, AGR (%), CAGR (%))
Table 15 Residential Market by Region, 2024-2034 (US$ Mn, AGR (%), CAGR (%))
Table 16 Commercial Market by Region, 2024-2034 (US$ Mn, AGR (%), CAGR (%))
Table 17 Industrial Market by Region, 2024-2034 (US$ Mn, AGR (%), CAGR (%))
Table 18 Utility Market by Region, 2024-2034 (US$ Mn, AGR (%), CAGR (%))
Table 19 Global Virtual Power Plant (VPP) Market by Generation Source, 2024-2034 (US$ Mn, AGR (%), CAGR (%))
Table 20 Solar PV Market by Region, 2024-2034 (US$ Mn, AGR (%), CAGR (%))
Table 21 Wind Power Market by Region, 2024-2034 (US$ Mn, AGR (%), CAGR (%))
Table 22 Combined Heat and Power (CHP) Units Market by Region, 2024-2034 (US$ Mn, AGR (%), CAGR (%))
Table 23 Energy Storage Systems Market by Region, 2024-2034 (US$ Mn, AGR (%), CAGR (%))
Table 24 Other Sources Market by Region, 2024-2034 (US$ Mn, AGR (%), CAGR (%))
Table 25 Virtual Power Plant (VPP) Market Forecast by Region, 2024-2034 (US$ Million, AGR%, CAGR%)
Table 26 North America Virtual Power Plant (VPP) Market by Value, 2024-2034 (US$ Mn, AGR (%), CAGR (%))
Table 27 North America Virtual Power Plant (VPP) Market by Country, 2024-2034 (US$ Mn, AGR (%), CAGR (%))
Table 28 North America Virtual Power Plant (VPP) Market by Component, 2024-2034 (US$ Mn, AGR (%), CAGR (%))
Table 29 North America Virtual Power Plant (VPP) Market by Technology, 2024-2034 (US$ Mn, AGR (%), CAGR (%))
Table 30 North America Virtual Power Plant (VPP) Market by End-User, 2024-2034 (US$ Mn, AGR (%), CAGR (%))
Table 31 North America Virtual Power Plant (VPP) Market by Generation Source, 2024-2034 (US$ Mn, AGR (%), CAGR (%))
Table 32 US Virtual Power Plant (VPP) Market by Value, 2024-2034 (US$ Mn, AGR (%), CAGR (%))
Table 33 Canada Virtual Power Plant (VPP) Market by Value, 2024-2034 (US$ Mn, AGR (%), CAGR (%))
Table 34 Europe Virtual Power Plant (VPP) Market by Value, 2024-2034 (US$ Mn, AGR (%), CAGR (%))
Table 35 Europe Virtual Power Plant (VPP) Market by Country, 2024-2034 (US$ Mn, AGR (%), CAGR (%))
Table 36 Europe Virtual Power Plant (VPP) Market by Component, 2024-2034 (US$ Mn, AGR (%), CAGR (%))
Table 37 Europe Virtual Power Plant (VPP) Market by Technology, 2024-2034 (US$ Mn, AGR (%), CAGR (%))
Table 38 Europe Virtual Power Plant (VPP) Market by End-User, 2024-2034 (US$ Mn, AGR (%), CAGR (%))
Table 39 Europe Virtual Power Plant (VPP) Market by Generation Source, 2024-2034 (US$ Mn, AGR (%), CAGR (%))
Table 40 Germany Virtual Power Plant (VPP) Market by Value, 2024-2034 (US$ Mn, AGR (%), CAGR (%))
Table 41 UK Virtual Power Plant (VPP) Market by Value, 2024-2034 (US$ Mn, AGR (%), CAGR (%))
Table 42 France Virtual Power Plant (VPP) Market by Value, 2024-2034 (US$ Mn, AGR (%), CAGR (%))
Table 43 Italy Virtual Power Plant (VPP) Market by Value, 2024-2034 (US$ Mn, AGR (%), CAGR (%))
Table 44 Spain Virtual Power Plant (VPP) Market by Value, 2024-2034 (US$ Mn, AGR (%), CAGR (%))
Table 45 Rest of Europe Virtual Power Plant (VPP) Market by Value, 2024-2034 (US$ Mn, AGR (%), CAGR (%))
Table 46 Asia-Pacific Virtual Power Plant (VPP) Market by Value, 2024-2034 (US$ Mn, AGR (%), CAGR (%))
Table 47 Asia-Pacific Virtual Power Plant (VPP) Market by Country, 2024-2034 (US$ Mn, AGR (%), CAGR (%))
Table 48 Asia-Pacific Virtual Power Plant (VPP) Market by Component, 2024-2034 (US$ Mn, AGR (%), CAGR (%))
Table 49 Asia-Pacific Virtual Power Plant (VPP) Market by Technology, 2024-2034 (US$ Mn, AGR (%), CAGR (%))
Table 50 Asia-Pacific Virtual Power Plant (VPP) Market by End-User, 2024-2034 (US$ Mn, AGR (%), CAGR (%))
Table 51 Asia-Pacific Virtual Power Plant (VPP) Market by Generation Source, 2024-2034 (US$ Mn, AGR (%), CAGR (%))
Table 52 China Virtual Power Plant (VPP) Market by Value, 2024-2034 (US$ Mn, AGR (%), CAGR (%))
Table 53 India Virtual Power Plant (VPP) Market by Value, 2024-2034 (US$ Mn, AGR (%), CAGR (%))
Table 54 Japan Virtual Power Plant (VPP) Market by Value, 2024-2034 (US$ Mn, AGR (%), CAGR (%))
Table 55 South Korea Virtual Power Plant (VPP) Market by Value, 2024-2034 (US$ Mn, AGR (%), CAGR (%))
Table 56 Australia Virtual Power Plant (VPP) Market by Value, 2024-2034 (US$ Mn, AGR (%), CAGR (%))
Table 57 Rest of Asia-Pacific Virtual Power Plant (VPP) Market by Value, 2024-2034 (US$ Mn, AGR (%), CAGR (%))
Table 58 Middle East & Africa Virtual Power Plant (VPP) Market by Value, 2024-2034 (US$ Mn, AGR (%), CAGR (%))
Table 59 Middle East & Africa Virtual Power Plant (VPP) Market by Country, 2024-2034 (US$ Mn, AGR (%), CAGR (%))
Table 60 Middle East & Africa Virtual Power Plant (VPP) Market by Component, 2024-2034 (US$ Mn, AGR (%), CAGR (%))
Table 61 Middle East & Africa Virtual Power Plant (VPP) Market by Technology, 2024-2034 (US$ Mn, AGR (%), CAGR (%))
Table 62 Middle East & Africa Virtual Power Plant (VPP) Market by End-User, 2024-2034 (US$ Mn, AGR (%), CAGR (%))
Table 63 Middle East & Africa Virtual Power Plant (VPP) Market by Generation Source, 2024-2034 (US$ Mn, AGR (%), CAGR (%))
Table 64 GCC Virtual Power Plant (VPP) Market by Value, 2024-2034 (US$ Mn, AGR (%), CAGR (%))
Table 65 South Africa Virtual Power Plant (VPP) Market by Value, 2024-2034 (US$ Mn, AGR (%), CAGR (%))
Table 66 Rest of Middle East & Africa Virtual Power Plant (VPP) Market by Value, 2024-2034 (US$ Mn, AGR (%), CAGR (%))
Table 67 Latin America Virtual Power Plant (VPP) Market by Value, 2024-2034 (US$ Mn, AGR (%), CAGR (%))
Table 68 Latin America Virtual Power Plant (VPP) Market by Country, 2024-2034 (US$ Mn, AGR (%), CAGR (%))
Table 69 Latin America Virtual Power Plant (VPP) Market by Component, 2024-2034 (US$ Mn, AGR (%), CAGR (%))
Table 70 Latin America Virtual Power Plant (VPP) Market by Technology, 2024-2034 (US$ Mn, AGR (%), CAGR (%))
Table 71 Latin America Virtual Power Plant (VPP) Market by End-User, 2024-2034 (US$ Mn, AGR (%), CAGR (%))
Table 72 Latin America Virtual Power Plant (VPP) Market by Generation Source, 2024-2034 (US$ Mn, AGR (%), CAGR (%))
Table 73 Brazil Virtual Power Plant (VPP) Market by Value, 2024-2034 (US$ Mn, AGR (%), CAGR (%))
Table 74 Mexico Virtual Power Plant (VPP) Market by Value, 2024-2034 (US$ Mn, AGR (%), CAGR (%))
Table 75 Rest of Latin America Virtual Power Plant (VPP) Market by Value, 2024-2034 (US$ Mn, AGR (%), CAGR (%))
Table 76 Strategic Outlook - Contract
Table 77 Siemens AG: Key Details, (CEO, HQ, Revenue, Founded, No. of Employees, Company Type, Website, Business Segment)
Table 78 Siemens AG: Product Benchmarking
Table 79 Siemens AG: Strategic Outlook
Table 80 ABB Ltd.: Key Details, (CEO, HQ, Revenue, Founded, No. of Employees, Company Type, Website, Business Segment)
Table 81 ABB Ltd.: Product Benchmarking
Table 82 ABB Ltd.: Strategic Outlook
Table 83 Schneider Electric SE: Key Details, (CEO, HQ, Revenue, Founded, No. of Employees, Company Type, Website, Business Segment)
Table 84 Schneider Electric SE: Product Benchmarking
Table 85 Schneider Electric SE: Strategic Outlook
Table 86 General Electric Company: Key Details, (CEO, HQ, Revenue, Founded, No. of Employees, Company Type, Website, Business Segment)
Table 87 General Electric Company: Product Benchmarking
Table 88 General Electric Company: Strategic Outlook
Table 89 Next Kraftwerke: Key Details, (CEO, HQ, Revenue, Founded, No. of Employees, Company Type, Website, Business Segment)
Table 90 Next Kraftwerke: Product Benchmarking
Table 91 Next Kraftwerke: Strategic Outlook
Table 92 Cisco Systems Inc: Key Details, (CEO, HQ, Revenue, Founded, No. of Employees, Company Type, Website, Business Segment)
Table 93 Cisco Systems Inc: Product Benchmarking
Table 94 Cisco Systems Inc: Strategic Outlook
Table 95 Enel X: Key Details, (CEO, HQ, Revenue, Founded, No. of Employees, Company Type, Website, Business Segment)
Table 96 Enel X: Product Benchmarking
Table 97 Enel X: Strategic Outlook
Table 98 Engie SA: Key Details, (CEO, HQ, Revenue, Founded, No. of Employees, Company Type, Website, Business Segment)
Table 99 Engie SA: Product Benchmarking
Table 100 Engie SA: Strategic Outlook
Table 101 Sunverge Energy Inc: Key Details, (CEO, HQ, Revenue, Founded, No. of Employees, Company Type, Website, Business Segment)
Table 102 Sunverge Energy Inc: Product Benchmarking
Table 103 Sunverge Energy Inc: Strategic Outlook
Table 104 Spirae Inc.: Key Details, (CEO, HQ, Revenue, Founded, No. of Employees, Company Type, Website, Business Segment)
Table 105 Spirae Inc.: Product Benchmarking
Table 106 Spirae Inc.: Strategic Outlook
Table 107 Tesla, Inc: Key Details, (CEO, HQ, Revenue, Founded, No. of Employees, Company Type, Website, Business Segment)
Table 108 Tesla, Inc: Product Benchmarking
Table 109 Tesla, Inc: Strategic Outlook
Table 110 Cpower Energy Management: Key Details, (CEO, HQ, Revenue, Founded, No. of Employees, Company Type, Website, Business Segment)
Table 111 Cpower Energy Management: Product Benchmarking
Table 112 Cpower Energy Management: Strategic Outlook
Table 113 Sympower: Key Details, (CEO, HQ, Revenue, Founded, No. of Employees, Company Type, Website, Business Segment)
Table 114 Sympower: Product Benchmarking
Table 115 Sympower: Strategic Outlook
Table 116 Swell Energy Inc.: Key Details, (CEO, HQ, Revenue, Founded, No. of Employees, Company Type, Website, Business Segment)
Table 117 Swell Energy Inc.: Product Benchmarking
Table 118 Swell Energy Inc.: Strategic Outlook
Table 119 LO3 Energy Inc.: Key Details, (CEO, HQ, Revenue, Founded, No. of Employees, Company Type, Website, Business Segment)
Table 120 LO3 Energy Inc.: Product Benchmarking
Table 121 LO3 Energy Inc.: Strategic Outlook
List of Figures
Figure 1 Virtual Power Plant (VPP) Market Segmentation
Figure 2 Virtual Power Plant (VPP) Market by Component: Market Attractiveness Index
Figure 3 Virtual Power Plant (VPP) Market by Technology: Market Attractiveness Index
Figure 4 Virtual Power Plant (VPP) Market by End-User: Market Attractiveness Index
Figure 5 Virtual Power Plant (VPP) Market by Generation Source: Market Attractiveness Index
Figure 6 Virtual Power Plant (VPP) Market Attractiveness Index by Region
Figure 7 Virtual Power Plant (VPP) Market: Market Dynamics
Figure 8 Virtual Power Plant (VPP) Market: Porter’s Five Forces Analysis
Figure 9 Global Virtual Power Plant (VPP) Market Share Forecast by COVID, 2024-2034 (%)
Figure 10 Global Virtual Power Plant (VPP) Market by Region, 2024-2034 (US$ Mn, AGR (%)) (V-Shaped Recovery Scenario)
Figure 11 Global Virtual Power Plant (VPP) Market by Region, 2024-2034 (US$ Mn, AGR (%)) (U-Shaped Recovery Scenario)
Figure 12 Global Virtual Power Plant (VPP) Market by Region, 2024-2034 (US$ Mn, AGR (%)) (W-Shaped Recovery Scenario)
Figure 13 Global Virtual Power Plant (VPP) Market by Region, 2024-2034 (US$ Mn, AGR (%)) (L-Shaped Recovery Scenario)
Figure 14 Virtual Power Plant (VPP) Market: PEST Analysis
Figure 15 Virtual Power Plant (VPP) Market by Component: Market Attractiveness Index
Figure 16 Global Virtual Power Plant (VPP) Market by Component, 2024-2034 (US$ Mn, AGR (%))
Figure 17 Virtual Power Plant (VPP) Market Share Forecast by Component, 2024, 2029, 2034 (%)
Figure 18 Software Market by Region, 2024-2034 (US$ Mn, AGR (%))
Figure 19 Software Market Share Forecast by Region, 2024 & 2034 (%)
Figure 20 Hardware Market by Region, 2024-2034 (US$ Mn, AGR (%))
Figure 21 Hardware Market Share Forecast by Region, 2024 & 2034 (%)
Figure 22 Virtual Power Plant (VPP) Market by Technology: Market Attractiveness Index
Figure 23 Global Virtual Power Plant (VPP) Market by Technology, 2024-2034 (US$ Mn, AGR (%))
Figure 24 Virtual Power Plant (VPP) Market Share Forecast by Technology, 2024, 2029, 2034 (%)
Figure 25 Demand Response VPP Market by Region, 2024-2034 (US$ Mn, AGR (%))
Figure 26 Demand Response VPP Market Share Forecast by Region, 2024 & 2034 (%)
Figure 27 Distributed Generation VPP Market by Region, 2024-2034 (US$ Mn, AGR (%))
Figure 28 Distributed Generation VPP Market Share Forecast by Region, 2024 & 2034 (%)
Figure 29 Mixed Asset VPP Market by Region, 2024-2034 (US$ Mn, AGR (%))
Figure 30 Mixed Asset VPP Market Share Forecast by Region, 2024 & 2034 (%)
Figure 31 Virtual Power Plant (VPP) Market by End-User: Market Attractiveness Index
Figure 32 Global Virtual Power Plant (VPP) Market by End-User, 2024-2034 (US$ Mn, AGR (%))
Figure 33 Virtual Power Plant (VPP) Market Share Forecast by End-User, 2024, 2029, 2034 (%)
Figure 34 Residential Market by Region, 2024-2034 (US$ Mn, AGR (%))
Figure 35 Residential Market Share Forecast by Region, 2024 & 2034 (%)
Figure 36 Commercial Market by Region, 2024-2034 (US$ Mn, AGR (%))
Figure 37 Commercial Market Share Forecast by Region, 2024 & 2034 (%)
Figure 38 Industrial Market by Region, 2024-2034 (US$ Mn, AGR (%))
Figure 39 Industrial Market Share Forecast by Region, 2024 & 2034 (%)
Figure 40 Utility Market by Region, 2024-2034 (US$ Mn, AGR (%))
Figure 41 Utility Market Share Forecast by Region, 2024 & 2034 (%)
Figure 42 Virtual Power Plant (VPP) Market by Generation Source: Market Attractiveness Index
Figure 43 Global Virtual Power Plant (VPP) Market by Generation Source, 2024-2034 (US$ Mn, AGR (%))
Figure 44 Virtual Power Plant (VPP) Market Share Forecast by Generation Source, 2024, 2029, 2034 (%)
Figure 45 Solar PV Market by Region, 2024-2034 (US$ Mn, AGR (%))
Figure 46 Solar PV Market Share Forecast by Region, 2024 & 2034 (%)
Figure 47 Wind Power Market by Region, 2024-2034 (US$ Mn, AGR (%))
Figure 48 Wind Power Market Share Forecast by Region, 2024 & 2034 (%)
Figure 49 Combined Heat and Power (CHP) Units Market by Region, 2024-2034 (US$ Mn, AGR (%))
Figure 50 Combined Heat and Power (CHP) Units Market Share Forecast by Region, 2024 & 2034 (%)
Figure 51 Energy Storage Systems Market by Region, 2024-2034 (US$ Mn, AGR (%))
Figure 52 Energy Storage Systems Market Share Forecast by Region, 2024 & 2034 (%)
Figure 53 Other Sources Market by Region, 2024-2034 (US$ Mn, AGR (%))
Figure 54 Other Sources Market Share Forecast by Region, 2024 & 2034 (%)
Figure 55 Virtual Power Plant (VPP) Market Forecast by Region 2024 and 2034 (Revenue, CAGR%)
Figure 56 Virtual Power Plant (VPP) Market Share Forecast by Region 2024, 2029, 2034 (%)
Figure 57 Virtual Power Plant (VPP) Market by Region, 2024-2034 (US$ Million, AGR %)
Figure 58 North America Virtual Power Plant (VPP) Market Attractiveness Index
Figure 59 North America Virtual Power Plant (VPP) Market by Region, 2024, 2029 & 2034 (US$ Million)
Figure 60 North America Virtual Power Plant (VPP) Market by Value, 2024-2034 (US$ Mn, AGR (%))
Figure 61 North America Virtual Power Plant (VPP) Market by Country, 2024-2034 (US$ Mn, AGR (%))
Figure 62 North America Virtual Power Plant (VPP) Market Share Forecast by Country, 2024 & 2034 (%)
Figure 63 North America Virtual Power Plant (VPP) Market by Component, 2024-2034 (US$ Mn, AGR (%))
Figure 64 North America Virtual Power Plant (VPP) Market Share Forecast Component, 2024 & 2034 (%)
Figure 65 North America Virtual Power Plant (VPP) Market by Technology, 2024-2034 (US$ Mn, AGR (%))
Figure 66 North America Virtual Power Plant (VPP) Market Share Forecast by Technology, 2024 & 2034 (%)
Figure 67 North America Virtual Power Plant (VPP) Market by End-User, 2024-2034 (US$ Mn, AGR (%))
Figure 68 North America Virtual Power Plant (VPP) Market Share Forecast by End-User, 2024 & 2034 (%)
Figure 69 North America Virtual Power Plant (VPP) Market by Generation Source, 2024-2034 (US$ Mn, AGR (%))
Figure 70 North America Virtual Power Plant (VPP) Market Share Forecast by Generation Source, 2024 & 2034 (%)
Figure 71 US Virtual Power Plant (VPP) Market by Value, 2024-2034 (US$ Mn, AGR (%))
Figure 72 Canada Virtual Power Plant (VPP) Market by Value, 2024-2034 (US$ Mn, AGR (%))
Figure 73 Europe Virtual Power Plant (VPP) Market Attractiveness Index
Figure 74 Europe Virtual Power Plant (VPP) Market by Region, 2024, 2029 & 2034 (US$ Million)
Figure 75 Europe Virtual Power Plant (VPP) Market by Value, 2024-2034 (US$ Mn, AGR (%))
Figure 76 Europe Virtual Power Plant (VPP) Market by Country, 2024-2034 (US$ Mn, AGR (%))
Figure 77 Europe Virtual Power Plant (VPP) Market Share Forecast by Country, 2024 & 2034 (%)
Figure 78 Europe Virtual Power Plant (VPP) Market by Component, 2024-2034 (US$ Mn, AGR (%))
Figure 79 Europe Virtual Power Plant (VPP) Market Share Forecast Component, 2024 & 2034 (%)
Figure 80 Europe Virtual Power Plant (VPP) Market by Technology, 2024-2034 (US$ Mn, AGR (%))
Figure 81 Europe Virtual Power Plant (VPP) Market Share Forecast by Technology, 2024 & 2034 (%)
Figure 82 Europe Virtual Power Plant (VPP) Market by End-User, 2024-2034 (US$ Mn, AGR (%))
Figure 83 Europe Virtual Power Plant (VPP) Market Share Forecast by End-User, 2024 & 2034 (%)
Figure 84 Europe Virtual Power Plant (VPP) Market by Generation Source, 2024-2034 (US$ Mn, AGR (%))
Figure 85 Europe Virtual Power Plant (VPP) Market Share Forecast by Generation Source, 2024 & 2034 (%)
Figure 86 Germany Virtual Power Plant (VPP) Market by Value, 2024-2034 (US$ Mn, AGR (%))
Figure 87 UK Virtual Power Plant (VPP) Market by Value, 2024-2034 (US$ Mn, AGR (%))
Figure 88 France Virtual Power Plant (VPP) Market by Value, 2024-2034 (US$ Mn, AGR (%))
Figure 89 Italy Virtual Power Plant (VPP) Market by Value, 2024-2034 (US$ Mn, AGR (%))
Figure 90 Spain Virtual Power Plant (VPP) Market by Value, 2024-2034 (US$ Mn, AGR (%))
Figure 91 Rest of Europe Virtual Power Plant (VPP) Market by Value, 2024-2034 (US$ Mn, AGR (%))
Figure 92 Asia-Pacific Virtual Power Plant (VPP) Market Attractiveness Index
Figure 93 Asia-Pacific Virtual Power Plant (VPP) Market by Region, 2024, 2029 & 2034 (US$ Million)
Figure 94 Asia-Pacific Virtual Power Plant (VPP) Market by Value, 2024-2034 (US$ Mn, AGR (%))
Figure 95 Asia-Pacific Virtual Power Plant (VPP) Market by Country, 2024-2034 (US$ Mn, AGR (%))
Figure 96 Asia-Pacific Virtual Power Plant (VPP) Market Share Forecast by Country, 2024 & 2034 (%)
Figure 97 Asia-Pacific Virtual Power Plant (VPP) Market by Component, 2024-2034 (US$ Mn, AGR (%))
Figure 98 Asia-Pacific Virtual Power Plant (VPP) Market Share Forecast Component, 2024 & 2034 (%)
Figure 99 Asia-Pacific Virtual Power Plant (VPP) Market by Technology, 2024-2034 (US$ Mn, AGR (%))
Figure 100 Asia-Pacific Virtual Power Plant (VPP) Market Share Forecast by Technology, 2024 & 2034 (%)
Figure 101 Asia-Pacific Virtual Power Plant (VPP) Market by End-User, 2024-2034 (US$ Mn, AGR (%))
Figure 102 Asia-Pacific Virtual Power Plant (VPP) Market Share Forecast by End-User, 2024 & 2034 (%)
Figure 103 Asia-Pacific Virtual Power Plant (VPP) Market by Generation Source, 2024-2034 (US$ Mn, AGR (%))
Figure 104 Asia-Pacific Virtual Power Plant (VPP) Market Share Forecast by Generation Source, 2024 & 2034 (%)
Figure 105 China Virtual Power Plant (VPP) Market by Value, 2024-2034 (US$ Mn, AGR (%))
Figure 106 India Virtual Power Plant (VPP) Market by Value, 2024-2034 (US$ Mn, AGR (%))
Figure 107 Japan Virtual Power Plant (VPP) Market by Value, 2024-2034 (US$ Mn, AGR (%))
Figure 108 South Korea Virtual Power Plant (VPP) Market by Value, 2024-2034 (US$ Mn, AGR (%))
Figure 109 Australia Virtual Power Plant (VPP) Market by Value, 2024-2034 (US$ Mn, AGR (%))
Figure 110 Rest of Asia-Pacific Virtual Power Plant (VPP) Market by Value, 2024-2034 (US$ Mn, AGR (%))
Figure 111 Middle East and Africa Virtual Power Plant (VPP) Market Attractiveness Index
Figure 112 Middle East and Africa Virtual Power Plant (VPP) Market by Region, 2024, 2029 & 2034 (US$ Million)
Figure 113 Middle East & Africa Virtual Power Plant (VPP) Market by Value, 2024-2034 (US$ Mn, AGR (%))
Figure 114 Middle East & Africa Virtual Power Plant (VPP) Market by Country, 2024-2034 (US$ Mn, AGR (%))
Figure 115 Middle East and Africa Virtual Power Plant (VPP) Market Share Forecast by Country, 2024 & 2034 (%)
Figure 116 Middle East & Africa Virtual Power Plant (VPP) Market by Component, 2024-2034 (US$ Mn, AGR (%))
Figure 117 Middle East and Africa Virtual Power Plant (VPP) Market Share Forecast Component, 2024 & 2034 (%)
Figure 118 Middle East & Africa Virtual Power Plant (VPP) Market by Technology, 2024-2034 (US$ Mn, AGR (%))
Figure 119 Middle East and Africa Virtual Power Plant (VPP) Market Share Forecast by Technology, 2024 & 2034 (%)
Figure 120 Middle East & Africa Virtual Power Plant (VPP) Market by End-User, 2024-2034 (US$ Mn, AGR (%))
Figure 121 Middle East and Africa Virtual Power Plant (VPP) Market Share Forecast by End-User, 2024 & 2034 (%)
Figure 122 Middle East & Africa Virtual Power Plant (VPP) Market by Generation Source, 2024-2034 (US$ Mn, AGR (%))
Figure 123 Middle East and Africa Virtual Power Plant (VPP) Market Share Forecast by Generation Source, 2024 & 2034 (%)
Figure 124 GCC Virtual Power Plant (VPP) Market by Value, 2024-2034 (US$ Mn, AGR (%))
Figure 125 South Africa Virtual Power Plant (VPP) Market by Value, 2024-2034 (US$ Mn, AGR (%))
Figure 126 Rest of Middle East & Africa Virtual Power Plant (VPP) Market by Value, 2024-2034 (US$ Mn, AGR (%))
Figure 127 Latin America Virtual Power Plant (VPP) Market Attractiveness Index
Figure 128 Latin America Virtual Power Plant (VPP) Market by Region, 2024, 2029 & 2034 (US$ Million)
Figure 129 Latin America Virtual Power Plant (VPP) Market by Value, 2024-2034 (US$ Mn, AGR (%))
Figure 130 Latin America Virtual Power Plant (VPP) Market by Country, 2024-2034 (US$ Mn, AGR (%))
Figure 131 Latin America Virtual Power Plant (VPP) Market Share Forecast by Country, 2024 & 2034 (%)
Figure 132 Latin America Virtual Power Plant (VPP) Market by Component, 2024-2034 (US$ Mn, AGR (%))
Figure 133 Latin America Virtual Power Plant (VPP) Market Share Forecast Component, 2024 & 2034 (%)
Figure 134 Latin America Virtual Power Plant (VPP) Market by Technology, 2024-2034 (US$ Mn, AGR (%))
Figure 135 Latin America Virtual Power Plant (VPP) Market Share Forecast by Technology, 2024 & 2034 (%)
Figure 136 Latin America Virtual Power Plant (VPP) Market by End-User, 2024-2034 (US$ Mn, AGR (%))
Figure 137 Latin America Virtual Power Plant (VPP) Market Share Forecast by End-User, 2024 & 2034 (%)
Figure 138 Latin America Virtual Power Plant (VPP) Market by Generation Source, 2024-2034 (US$ Mn, AGR (%))
Figure 139 Latin America Virtual Power Plant (VPP) Market Share Forecast by Generation Source, 2024 & 2034 (%)
Figure 140 Brazil Virtual Power Plant (VPP) Market by Value, 2024-2034 (US$ Mn, AGR (%))
Figure 141 Mexico Virtual Power Plant (VPP) Market by Value, 2024-2034 (US$ Mn, AGR (%))
Figure 142 Rest of Latin America Virtual Power Plant (VPP) Market by Value, 2024-2034 (US$ Mn, AGR (%))
Figure 143 Virtual Power Plant (VPP) Market: Company Share, 2022
Figure 144 Siemens AG.: Net Revenue, 2018-2022 (US$ Million, AGR%)
Figure 145 Siemens AG.: R&D, 2018-2022 (US$ Million, AGR%)
Figure 146 Siemens AG.: Regional Revenue Share, 2022 (%)
Figure 147 Siemens AG.: Business Segment Revenue Share, 2022 (%)
Figure 148 ABB Ltd.: Net Revenue, 2018-2022 (US$ Million, AGR%)
Figure 149 ABB Ltd..: R&D, 2018-2022 (US$ Million, AGR%)
Figure 150 ABB Ltd..: Business Segment Revenue Share, 2022 (%)
Figure 151 Schneider Electric SE.: Net Revenue, 2018-2022 (US$ Million, AGR%)
Figure 152 Schneider Electric SE.: R&D, 2018-2022 (US$ Million, AGR%)
Figure 153 Schneider Electric SE.: Regional Revenue Share, 2022 (%)
Figure 154 Schneider Electric SE.: Business Segment Revenue Share, 2022 (%)
Figure 155 General Electric Company.: Net Revenue, 2018-2022 (US$ Million, AGR%)
Figure 156 General Electric Company.: R&D, 2018-2022 (US$ Million, AGR%)
Figure 157 General Electric Company.: Regional Revenue Share, 2022 (%)
Figure 158 General Electric Company.: Business Segment Revenue Share, 2022 (%)
Figure 159 Cisco Systems Inc.: Net Revenue, 2019-2023 (US$ Million, AGR%)
Figure 160 Cisco Systems Inc.: R&D, 2019-2023 (US$ Million, AGR%)
Figure 161 Cisco Systems Inc.: Regional Revenue Share, 2023 (%)
Figure 162 Cisco Systems Inc.: Business Segment Revenue Share, 2023 (%)
Figure 163 Enel X.: Net Revenue, 2018-2022 (US$ Million, AGR%)
Figure 164 Enel X.: R&D, 2018-2022 (US$ Million, AGR%)
Figure 165 Enel X.: Regional Revenue Share, 2022 (%)
Figure 166 Enel X.: Business Segment Revenue Share, 2022 (%)
Figure 167 Tesla, Inc.: Net Revenue, 2018-2022 (US$ Million, AGR%)
Figure 168 Tesla, Inc.: R&D, 2018-2022 (US$ Million, AGR%)
Figure 169 Tesla, Inc.: Regional Revenue Share, 2022 (%)
Figure 170 Tesla, Inc.: Business Segment Revenue Share, 2022 (%)
ページTOPに戻る
よくあるご質問
Visiongain社はどのような調査会社ですか?
英国の調査会社ヴィジョンゲイン社(Visiongain)は、通信とエネルギーのほか、自動車や化学・医薬品、金属など、広範な市場を対象に調査を行っています。自動車市場については、市場全般に関する調査のほ... もっと見る
調査レポートの納品までの日数はどの程度ですか?
在庫のあるものは速納となりますが、平均的には 3-4日と見て下さい。
但し、一部の調査レポートでは、発注を受けた段階で内容更新をして納品をする場合もあります。
発注をする前のお問合せをお願いします。
注文の手続きはどのようになっていますか?
1)お客様からの御問い合わせをいただきます。
2)見積書やサンプルの提示をいたします。
3)お客様指定、もしくは弊社の発注書をメール添付にて発送してください。
4)データリソース社からレポート発行元の調査会社へ納品手配します。
5) 調査会社からお客様へ納品されます。最近は、pdfにてのメール納品が大半です。
お支払方法の方法はどのようになっていますか?
納品と同時にデータリソース社よりお客様へ請求書(必要に応じて納品書も)を発送いたします。
お客様よりデータリソース社へ(通常は円払い)の御振り込みをお願いします。
請求書は、納品日の日付で発行しますので、翌月最終営業日までの当社指定口座への振込みをお願いします。振込み手数料は御社負担にてお願いします。
お客様の御支払い条件が60日以上の場合は御相談ください。
尚、初めてのお取引先や個人の場合、前払いをお願いすることもあります。ご了承のほど、お願いします。
データリソース社はどのような会社ですか?
当社は、世界各国の主要調査会社・レポート出版社と提携し、世界各国の市場調査レポートや技術動向レポートなどを日本国内の企業・公官庁及び教育研究機関に提供しております。
世界各国の「市場・技術・法規制などの」実情を調査・収集される時には、データリソース社にご相談ください。
お客様の御要望にあったデータや情報を抽出する為のレポート紹介や調査のアドバイスも致します。
|
|


