廃棄物からエネルギー利用(WtE)市場レポート:2024-2034
Waste to Energy (WtE) Market Report 2024-2034
レポート詳細
廃棄物からエネルギー利用(WtE)市場レポート 2024-2034 :この調査レポートは、業界とその基礎となる原動力をより良く理解することを望むなら、新たな収益ポケットを目指す大手企業に... もっと見る
※上記価格は部署ライセンス(Departmental licence)価格です。
その他の価格についてはデータリソースまでお問合せください。
日本語のページは自動翻訳を利用し作成しています。
実際のレポートは英文のみでご納品いたします。
サマリー
レポート詳細
廃棄物からエネルギー利用(WtE)市場レポート 2024-2034:この調査レポートは、業界とその基礎となる原動力をより良く理解することを望むなら、新たな収益ポケットを目指す大手企業にとって貴重なものとなるでしょう。異業種への進出や新規国での既存事業の拡大を目指す企業にも有用です。
世界人口の急激な増加と都市化により廃棄物の発生が増加
世界人口の急激な増加と都市化により、廃棄物の発生量は大幅に増加し、高度な廃棄物管理ソリューションが必要とされている。特に都市部は、増え続ける都市固形廃棄物の処理という大きな課題に直面している。廃棄物からエネルギー利用は、深刻化する廃棄物の危機に対処するための持続可能なアプローチを提供する、重要な市場牽引役として浮上している。例えば、世界最大級の人口密度を誇る東京では、1日当たり約1万2,500トンの廃棄物が発生している。この膨大な廃棄物排出量を効率的に管理するため、東京都は廃棄物からエネルギー利用施設に投資し、廃棄物のかなりの部分を電力に変換することで、廃棄物処理の課題に取り組むと同時に、同市のエネルギー需要にも貢献している。
厳しい環境規制
世界各国の政府は、気候変動と闘い、持続可能な活動を推進するため、厳しい環境規制を制定している。これらの規制は、温室効果ガスの排出削減に重点を置き、よりクリーンな代替エネルギーの採用を奨励し、廃棄物からエネルギー利用市場を牽引している。欧州連合の廃棄物焼却指令は、この傾向を象徴している。この指令は、廃棄物からエネルギー利用技術を安全かつ環境に配慮して利用するための厳格なガイドラインを定めている。例えば、ドイツのような国では、廃棄物焼却による環境への影響を最小限に抑えるため、これらの規制に準拠した先進的な排ガス浄化システムを廃棄物からエネルギー利用施設に導入している。
市場調査レポートを購入する前にすべき質問とは?
- 廃棄物からエネルギー利用(WtE)市場はどのように進化しているのか?
- 何が廃棄物エネルギー利用(WtE)市場を促進し、抑制しているのか?
- 各廃棄物エネルギー利用(WtE)サブ市場セグメントは予測期間中にどのように成長し、2034年にはどれくらいの売上高を占めるようになるのか?
- 各廃棄物発電(WtE)サブマーケットの市場シェアは2024年から2034年にかけてどのように推移するのか?
- 2024年から2034年までの市場全体の主な牽引役は何か?
- 主要な廃棄物エネルギー利用(WtE)市場はマクロ経済の動きに概ね追随するのか、それとも個々の国市場が他を凌駕するのか?
- 2034年までに各国市場のシェアはどのように変化し、2034年に市場をリードするのはどの国か?
- 主要プレーヤーは誰で、予測期間中の見通しは?
- 主要企業の廃棄物からエネルギー利用(WtE)プロジェクトとは?
- 2024年から2034年の間に、産業はどのように発展していくのか?現在および今後10年間に実施される廃棄物からエネルギー利用(WtE)プロジェクトにはどのような意味があるのか?
- 廃棄物からエネルギー利用(WtE)市場をさらに拡大するために、製品の商業化の必要性は高まっているか?
- 廃棄物からエネルギー利用(WtE)市場はどこへ向かっているのか、そしてどのようにすれば市場の最前線に立てるのか?
- 新製品や新サービスへの最適な投資方法とは?
- 企業を新たな成長軌道に乗せ、C-suiteに移行させるための重要な展望とは?
廃棄物からエネルギー利用(WtE)市場が現在、そして今後10年間でどのような影響を受けるのかを知る必要がある:
- 本レポートは329ページにわたり、152の表と109の図表を掲載しています。
- 本レポートでは、業界の主要な有利分野をハイライトしているため、今すぐターゲットを絞ることができます。
- 世界および各国の成長に関する詳細な分析が含まれています。
- 競合他社が成功した主要トレンド、変化、収益予測をハイライトしています。
本レポートは、廃棄物からエネルギー利用(WtE)市場が今後10年間でどのように発展するか、またCOVID-19の景気後退と好転の変動に合わせてどのように発展するかをお伝えします。この市場は、過去10年間のどの時点よりも今が重要である。
2034年までの予測やその他の分析から、商業的な展望が明らかになる
- 2034年までの収益予測に加え、直近の実績、成長率、市場シェアを提供します。
- ビジネスの展望と展開に関する独自の分析をご覧いただけます。
- 定性的分析(市場力学、促進要因、機会、阻害要因、課題を含む)、コスト構造、廃棄物からエネルギー利用(WtE)価格上昇の影響、最近の動向をご覧いただけます。
本レポートには、COVID-19が業界と貴社にどのような影響を与えるかについてのデータ分析と貴重な洞察が含まれている。本レポートでは、COVID-19の4つの回収パターンとその影響、すなわち「V」、「L」、「W」、「U」について論じている。
レポート対象セグメント
市場セグメント
- 市場価値
- 設備投資
- エネルギー
- 発電能力
- プラントユニット数
プラント状況別市場セグメント
- 稼働中のWtEプラント
- 建設中WtEプラント
技術別市場セグメント
- 直接燃焼(大量燃焼とRDF)
- プラズマアークガス化
- 従来型ガス化
- 熱分解WtE
- 化学処理
- バイオ医薬品処理
用途別市場セグメント
- 発電
- 蒸気輸出
- 熱電併給(CHP)
- 合成ガス
- ごみ固形燃料(RDF)
市場セグメント国名
・ US
・ UK
・ Germany
・ France
・ Netherlands
・ China
・ Japan
・ India
・ Singapore
・ Thailand
・ RoW
また、2024年から2034年までの廃棄物からエネルギー利用(WtE)市場の主要企業のプロファイルと、これらの企業の事業のこのセグメントに焦点を当てています。
報告書に掲載されている主要企業
・ Abu Dhabi National Energy Company, PJSC(TAQA)
・ Babcock & Wilcox Enterprises, Inc.
・ C&G Environmental Protection Holdings Limited
・ Covanta Holding Corporation
・ Foster Wheeler AG
・ Hitachi, Ltd
・ Keppel Seghers Engineering Singapore Pte Ltd.
・ Martin Environmental Services
・ Mitsubishi Heavy Industries Environmental & Chemical Engineering Co., Ltd.
・ Rambøll Group A/S
・ Suez SA
・ Veolia Environmental Services
・ Viridor Waste Management Ltd.
・ Waste Management, Inc.
・ Wheelabrator Technologies Inc.
2024年から2034年までの廃棄物発電(WtE)市場全体の世界売上高(CAPEXベース)は、2024年に239億5,800万米ドルを突破する。また、2034年まで収益が大きく伸びると予測している。当社の調査では、どの企業が最も大きな可能性を秘めているかを特定しています。彼らの能力、進歩、商業的展望を発見し、一歩先を行くお手伝いをします。
廃棄物からエネルギー(WtE)市場、2024〜2034年」レポートはどのようにお役に立ちますか?
要約すると、320ページを超えるこのレポートは、以下の知識を提供する:
- 廃棄物からエネルギー利用(WtE)市場の2034年までの収益予測、2024年から2034年までの市場 - 価値、CAPEX、エネルギー生成、プラント容量、プラント数、国ごとの予測を世界と国レベルで掲載 - 業界の展望を発見し、投資と収益に最も有利な場所を見つけることができます。
- 主要7ヶ国市場の2034年までの収益予測 - 廃棄物からエネルギー利用(WtE)市場の2024年から2034年までの市場予測を、米国、英国、ドイツ、フランス、オランダ、中国、日本、インド、シンガポール、タイ、その他の主要経済圏でご覧いただけます。
- 既存企業および市場参入を目指す企業の展望 - 廃棄物からエネルギー利用(WtE)市場(2024年~2034年)に関与する主要企業15社の企業プロファイルを含む。
独自の予測による定量的・定性的分析をご覧ください。私たちのレポートだけに含まれる情報を入手し、貴重なビジネスインテリジェンスで情報を得ることができます。
他にはない情報
私たちの新しいレポートがあれば、知識に遅れをとったり、チャンスを逃したりする可能性が低くなります。Visiongainのレポートが貴社の調査、分析、意思決定にどのように役立つかをご覧ください。Visiongainの調査は、2024年から2034年までの廃棄物からエネルギー利用(WtE)市場の商業分析を必要とするすべての人、市場をリードする企業のためのものです。データ、トレンド、予測をご覧いただけます。
ページTOPに戻る
目次
目次
1 レポートの概要
1.1 研究の目的
1.2 廃棄物からエネルギー利用市場の紹介
1.3 本レポートの内容
1.4 本レポートを読むべき理由
1.5 本分析レポートが回答する主な質問
1.6 本レポートは誰のためのものか?
1.7 方法論
1.7.1 市場の定義
1.7.2 市場評価・予測手法
1.7.3 データ検証
1.7.3.1 一次調査
1.7.3.2 セカンダリーリサーチ
1.8 よくある質問(FAQ)
1.9 Visiongainの関連レポート
1.10 Visiongainについて
2 エグゼクティブ・サマリー
3 市場の概要
3.1 主要な調査結果
3.2 市場ダイナミクス
3.2.1 市場促進要因
3.2.1.1 世界の廃棄物-エネルギー(WtE)施設向け一般廃棄物の量が急増している
3.2.1.2 埋め立てに利用可能な土地が減少しており、代替廃棄物管理ソリューションが必要になっている
3.2.1.3 政府機関からの財政支援の増加により、廃棄物発生量の増加問題に対処することを目的とした取り組みが推進されている。
3.2.2 市場抑制要因
3.2.2.1 各国の廃棄物エネルギー化(WtE)施設の拡大は、環境問題への反対により著しい減速に直面している
3.2.2.2 発展途上国における廃棄物焼却は依然として一般的ではなく、市場の課題となっている
3.2.2.3 装置、特に焼却炉のコスト高が、導入に大きな財政的障壁をもたらす
3.2.3 市場機会
3.2.3.1 WtEプラントの需要拡大がもたらすビジネスチャンス
3.2.3.2 アジア諸国の年間廃棄物発生量は増加傾向にあり、WtEソリューションの潜在市場を提供する
3.2.3.3 各国政府は廃棄物発電企業との連携を強めている
3.3 ポーターのファイブフォース分析
3.3.1 サプライヤーの交渉力(低)
3.3.2 買い手の交渉力(中)
3.3.3 競争上のライバル(高)
3.3.4 代替品による脅威(低)
3.3.5 新規参入の脅威(中~高)
3.4 COVID-19の影響分析
3.4.1 "V字回復"
3.4.2 "U字回復"
3.4.3 "W字回復"
3.4.4 "L字回復"
3.5 PEST分析
4 廃棄物からエネルギー利用の世界市場分析:国別
4.1 主要な調査結果
4.2 世界市場の展望
4.3 廃棄物からエネルギー利用(WtE)の世界市場:エネルギー生成別
4.4 廃棄物からエネルギー利用(WtE)の世界市場:予測別
4.5 廃棄物からエネルギー利用(WtE)の世界市場予測:プラント状況別
4.5.1 稼働中のWtEプラント
4.5.2 建設中のWtEプラント
4.6 廃棄物からエネルギー利用(WtE)の世界市場:技術別
4.6.1 直接燃焼(大量燃焼およびRDF)
4.6.2 プラズマアークガス化
4.6.3 従来型ガス化
4.6.4 熱分解WtE
4.6.5 化学処理
4.6.6 生物処理
4.7 廃棄物からエネルギー利用(WtE)の世界市場:用途別
4.7.1 発電
4.7.2 蒸気輸出
4.7.3 熱電併給(CHP)
4.7.4 合成ガス
4.7.5 ごみ固形燃料(RDF)
4.8 廃棄物からエネルギー利用(WtE)の世界国別市場
5 米国の廃棄物からエネルギー利用市場分析
5.1 主な調査結果
5.2 米国市場の展望
5.3 米国の廃棄物からエネルギー利用(WtE)市場:エネルギー生成別
5.4 米国の廃棄物からエネルギー利用(WtE)市場:予測別
5.5 米国の廃棄物からエネルギー利用(WtE)市場予測:プラント状況別
5.6 米国の廃棄物からエネルギー利用(WtE)市場:技術別
5.7 米国の廃棄物からエネルギー利用(WtE)市場:用途別
6 英国の廃棄物からエネルギー利用市場分析
6.1 主要な調査結果
6.2 英国市場の展望
6.3 英国の廃棄物からエネルギー利用(WtE)市場:エネルギー生成別
6.4 英国の廃棄物からエネルギー利用(WtE)市場:予測別
6.5 英国の廃棄物からエネルギー利用(WtE)市場予測:プラント状況別
6.6 英国の廃棄物からエネルギー利用(WtE)市場:技術別
6.7 英国の廃棄物からエネルギー利用(WtE)市場:用途別
7 ドイツの廃棄物からエネルギー利用市場分析
7.1 主要な調査結果
7.2 ドイツ市場の展望
7.3 ドイツの廃棄物からエネルギー利用(WtE)市場:エネルギー生成別
7.4 ドイツの廃棄物からエネルギー利用(WtE)市場:予測別
7.5 ドイツの廃棄物からエネルギー利用(WtE)市場予測:プラント状況別
7.6 ドイツの廃棄物からエネルギー利用(WtE)市場:技術別
7.7 ドイツの廃棄物からエネルギー利用(WtE)市場:用途別
8 フランスの廃棄物からエネルギー利用市場分析
8.1 主要な調査結果
8.2 フランス市場の展望
8.3 フランスの廃棄物からエネルギー利用(WtE)市場:エネルギー生成別
8.4 フランスの廃棄物からエネルギー利用(WtE)市場:予測別
8.5 フランスの廃棄物からエネルギー利用(WtE)市場予測:プラント状況別
8.6 フランスの廃棄物からエネルギー利用(WtE)市場:技術別
8.7 フランスの廃棄物からエネルギー利用(WtE)市場:用途別
9 オランダの廃棄物からエネルギー利用市場分析
9.1 主要な調査結果
9.2 オランダ市場の展望
9.3 オランダの廃棄物からエネルギー利用(WtE)市場:エネルギー生成別
9.4 オランダの廃棄物からエネルギー利用(WtE)市場:予測別
9.5 オランダの廃棄物からエネルギー利用(WtE)市場予測:プラント状況別
9.6 オランダの廃棄物からエネルギー利用(WtE)市場:技術別
9.7 オランダの廃棄物からエネルギー利用(WtE)市場:用途別
10 中国の廃棄物エネルギー利用市場分析
10.1 主要な調査結果
10.2 中国市場の展望
10.3 中国の廃棄物からエネルギー利用(WtE)市場:エネルギー生成別
10.4 中国の廃棄物からエネルギー利用(WtE)市場:予測別
10.5 中国の廃棄物からエネルギー利用(WtE)市場予測:プラント状況別
10.6 中国の廃棄物からエネルギー利用(WtE)市場:技術別
10.7 中国の廃棄物からエネルギー利用(WtE)市場:用途別
11 日本の廃棄物からエネルギー利用市場分析
11.1 主要な調査結果
11.2 日本市場の展望
11.3 日本の廃棄物からエネルギー利用(WtE)市場:エネルギー生成別
11.4 日本の廃棄物からエネルギー利用(WtE)市場:予測別
11.5 日本の廃棄物からエネルギー利用(WtE)市場予測:プラント状況別
11.6 日本の廃棄物からエネルギー利用(WtE)市場:技術別
11.7 日本の廃棄物からエネルギー利用(WtE)市場:用途別
12 インドの廃棄物からエネルギー利用市場分析
12.1 主要な調査結果
12.2 インド市場の展望
12.3 インドの廃棄物からエネルギー利用(WtE)市場:エネルギー生成別
12.4 インドの廃棄物からエネルギー利用(WtE)市場:予測別
12.5 インドの廃棄物からエネルギー利用(WtE)市場予測:プラント状況別
12.6 インドの廃棄物からエネルギー利用(WtE)市場:技術別
12.7 インドの廃棄物からエネルギー利用(WtE)市場:用途別
13 シンガポールの廃棄物からエネルギー利用市場分析
13.1 主要な調査結果
13.2 シンガポール市場の展望
13.3 シンガポールの廃棄物からエネルギー利用(WtE)市場:エネルギー生成別
13.4 シンガポールの廃棄物からエネルギー利用(WtE)市場:予測別
13.5 シンガポールの廃棄物からエネルギー利用(WtE)市場予測:プラント状況別
13.6 シンガポールの廃棄物からエネルギー利用(WtE)市場:技術別
13.7 シンガポールの廃棄物からエネルギー利用(WtE)市場:用途別
14 タイの廃棄物からエネルギー利用市場分析
14.1 主要な調査結果
14.2 タイ市場の展望
14.3 タイの廃棄物からエネルギー利用(WtE)市場:発電量別
14.4 タイの廃棄物からエネルギー利用(WtE)市場:予測別
14.5 タイの廃棄物からエネルギー利用(WtE)市場予測:プラント状況別
14.6 タイの廃棄物からエネルギー利用(WtE)市場:技術別
14.7 タイの廃棄物からエネルギー利用(WtE)市場:用途別
15 世界の廃棄物からエネルギー利用市場の分析
15.1 主要な調査結果
15.2 その他の地域の市場展望
15.3 その他の地域の廃棄物からエネルギー利用(WtE)市場:エネルギー生成量別
15.4 その他の地域の廃棄物からエネルギー利用(WtE)市場:予測別
15.5 その他の地域の廃棄物からエネルギー利用(WtE)市場予測:プラント状況別
15.6 その他の地域の廃棄物からエネルギー利用(WtE)市場:技術別
15.7 その他の地域の廃棄物からエネルギー利用(WtE)市場:用途別
16 会社概要
16.1 競争環境、2022年
16.2 戦略的展望
16.3 Waste Management, Inc.
16.3.1 会社概要
16.3.2 会社概要
16.3.3 財務分析
16.3.4 純収入、2018年~2022年
16.3.4.1 地域別収益シェア、2022年(%)
16.3.4.2 事業セグメント別売上シェア、2022年(%)
16.3.5 製品ベンチマーク
16.3.6 戦略的展望
16.4 Veolia Environmental Services
16.4.1 会社概要
16.4.2 会社概要
16.4.3 財務分析
16.4.4 純収入、2018-2022年
16.4.5 製品ベンチマーク
16.4.6 戦略的展望
16.5 Covanta Holding Corporation
16.5.1 会社概要
16.5.2 会社概要
16.5.3 製品ベンチマーク
16.5.4 戦略的展望
16.6 Suez SA
16.6.1 会社概要
16.6.2 会社概要
16.6.3 製品ベンチマーク
16.6.4 戦略的展望
16.7 Babcock & Wilcox Enterprises, Inc.
16.7.1 会社概要
16.7.2 会社概要
16.7.3 財務分析
16.7.4 純収入、2018-2022年
16.7.4.1 売上高、2018-2022年
16.7.4.2 地域別収益シェア、2022年(%)
16.7.4.3 事業セグメント別売上シェア、2022年(%)
16.7.5 製品ベンチマーク
16.7.6 戦略的展望
16.8 Keppel Seghers Engineering Singapore Pte Ltd.
16.8.1 会社概要
16.8.2 会社概要
16.8.3 製品ベンチマーク
16.8.4 戦略的展望
16.9 Wheelabrator Technologies Inc.
16.9.1 会社概要
16.9.2 会社概要
16.9.3 製品ベンチマーク
16.9.4 戦略的展望
16.10 Martin Environmental Services
16.10.1 会社概要
16.10.2 会社概要
16.10.3 製品ベンチマーク
16.10.4 戦略的展望
16.11 Viridor Waste Management Ltd.
16.11.1 会社概要
16.11.2 会社概要
16.11.3 製品ベンチマーク
16.11.4 戦略的展望
16.12 Abu Dhabi National Energy Company, PJSC(TAQA)
16.12.1 会社概要
16.12.2 会社概要
16.12.3 製品ベンチマーク
16.12.4 戦略的展望
16.13 Mitsubishi Heavy Industries Environmental & Chemical Engineering Co., Ltd.
16.13.1 会社概要
16.13.2 会社概要
16.13.3 財務分析
16.13.4 純売上高、2018-2022年
16.13.4.1 売上高、2018年-2022年
16.13.4.2 地域別売上シェア、2022年(%)
16.13.4.3 事業セグメント別売上シェア、2022年(%)
16.13.5 製品ベンチマーク
16.13.6 戦略的展望
16.14 Hitachi, Ltd
16.14.1 会社概要
16.14.2 会社概要
16.14.3 財務分析
16.14.4 純収入、2018-2022年
16.14.4.1 地域別売上高シェア、2022年(%)
16.14.4.2 事業セグメント別売上シェア、2022年(%)
16.14.5 製品ベンチマーク
16.14.6 戦略的展望
16.15 Foster Wheeler AG
16.15.1 会社概要
16.15.2 会社概要
16.15.3 製品ベンチマーク
16.15.4 戦略的展望
16.16 Rambøll Group A/S
16.16.1 会社概要
16.16.2 会社概要
16.16.3 製品ベンチマーク
16.16.4 戦略的展望
16.17 C&G Environmental Protection Holdings Limited
16.17.1 会社概要
16.17.2 会社概要
16.17.3 製品ベンチマーク
16.17.4 戦略的展望
17 結論と提言
17.1 Visiongainからの結びの言葉
17.2 市場プレイヤーへの提言
ページTOPに戻る
図表リスト
表の一覧
Table 1 Waste to Energy Market Snapshot, 2024 & 2034 (US US$Million, MWe, MTPA, CAGR %)
Table 2 Global Waste-to-Energy (WtE) CAPEX Market by Country, 2024-2034 (US US$Mn, AGR (%), CAGR (%), Cumulative)
Table 3 Global Waste-to-Energy (WtE) CAPEX Market by Country, 2024-2034 (US US$Mn, AGR (%), CAGR (%), Cumulative)
Table 4 Global Waste-to-Energy (WtE) CAPEX Market by Country, 2024-2034 (US US$Mn, AGR (%), CAGR (%), Cumulative)
Table 5 Global Waste-to-Energy (WtE) CAPEX Market by Country, 2024-2034 (US US$Mn, AGR (%), CAGR (%), Cumulative)
Table 6 Global Waste-to-Energy (WtE) Market Forecast by Energy Generation, 2024-2034 (MWe, AGR (%), CAGR (%), Cumulative)
Table 7 Global Waste-to-Energy (WtE) Market Forecast by CAPEX, 2024-2034 (US US$Mn, AGR (%), CAGR (%), Cumulative)
Table 8 Global Waste-to-Energy (WtE) Market Forecast by Capacity, 2024-2034 (MTPA, AGR (%), CAGR (%), Cumulative)
Table 9 Global Waste-to-Energy (WtE) Market Forecast, 2024-2034 (No. of Units, AGR (%), CAGR (%), Cumulative)
Table 10 Global Waste-to-Energy (WtE) Market Forecast by Plant Status, 2024-2034 (Plant Units, AGR (%), CAGR (%), Cumulative)
Table 11 Global Waste-to-Energy (WtE) Market by Technology, 2024-2034 (MTPA, AGR (%), CAGR (%), Cumulative)
Table 12 Global Waste-to-Energy (WtE) Market by End-Use, 2024-2034 (MWe, AGR (%), CAGR (%), Cumulative)
Table 13 Global Waste-to-Energy (WtE) Market by Country, 2024-2034 (MWe, AGR (%), CAGR (%), Cumulative)
Table 14 U.S. Local Name of the Plant
Table 15 US Waste-to-Energy (WtE) Market Forecast by Energy Generation, 2024-2034 (MWe, AGR (%), CAGR (%), Cumulative)
Table 16 US Waste-to-Energy (WtE) Market Forecast by CAPEX, 2024-2034 (US US$Mn, AGR (%), CAGR (%), Cumulative)
Table 17 US Waste-to-Energy (WtE) Market Forecast by Capacity, 2024-2034 (MTPA, AGR (%), CAGR (%), Cumulative)
Table 18 US Waste-to-Energy (WtE) Market Forecast, 2024-2034 (No. of Units, AGR (%), CAGR (%), Cumulative)
Table 19 US Waste-to-Energy (WtE) Market Forecast by Plant Status, 2024-2034 (Plant Units, AGR (%), CAGR (%), Cumulative)
Table 20 US Waste-to-Energy (WtE) Market by Technology, 2024-2034 (MTPA, AGR (%), CAGR (%), Cumulative)
Table 21 US Waste-to-Energy (WtE) Market by End-Use, 2024-2034 (MWe, AGR (%), CAGR (%), Cumulative)
Table 22 U.K. Local Name of the Plant
Table 23 UK Waste-to-Energy (WtE) Market Forecast by Energy Generation, 2024-2034 (MWe, AGR (%), CAGR (%), Cumulative)
Table 24 UK Waste-to-Energy (WtE) Market Forecast by CAPEX, 2024-2034 (UKD Mn, AGR (%), CAGR (%), Cumulative)
Table 25 UK Waste-to-Energy (WtE) Market Forecast by Capacity, 2024-2034 (MTPA, AGR (%), CAGR (%), Cumulative)
Table 26 UK Waste-to-Energy (WtE) Market Forecast, 2024-2034 (No. of Units, AGR (%), CAGR (%), Cumulative)
Table 27 UK Waste-to-Energy (WtE) Market Forecast by Plant Status, 2024-2034 (Plant Units, AGR (%), CAGR (%), Cumulative)
Table 28 UK Waste-to-Energy (WtE) Market by Technology, 2024-2034 (MTPA, AGR (%), CAGR (%), Cumulative)
Table 29 UK Waste-to-Energy (WtE) Market by End-Use, 2024-2034 (MWe, AGR (%), CAGR (%), Cumulative)
Table 30 Germany Local name of the Plant
Table 31 Germany Waste-to-Energy (WtE) Market Forecast by Energy Generation, 2024-2034 (MWe, AGR (%), CAGR (%), Cumulative)
Table 32 Germany Waste-to-Energy (WtE) Market Forecast by CAPEX, 2024-2034 (Germany Mn, AGR (%), CAGR (%), Cumulative)
Table 33 Germany Waste-to-Energy (WtE) Market Forecast by Capacity, 2024-2034 (MTPA, AGR (%), CAGR (%), Cumulative)
Table 34 Germany Waste-to-Energy (WtE) Market Forecast, 2024-2034 (No. of Units, AGR (%), CAGR (%), Cumulative)
Table 35 Germany Waste-to-Energy (WtE) Market Forecast by Plant Status, 2024-2034 (Plant Units, AGR (%), CAGR (%), Cumulative)
Table 36 Germany Waste-to-Energy (WtE) Market by Technology, 2024-2034 (MTPA, AGR (%), CAGR (%), Cumulative)
Table 37 Germany Waste-to-Energy (WtE) Market by End-Use, 2024-2034 (MWe, AGR (%), CAGR (%), Cumulative)
Table 38 France Local Name of the Plant
Table 39 France Waste-to-Energy (WtE) Market Forecast by Energy Generation, 2024-2034 (MWe, AGR (%), CAGR (%), Cumulative)
Table 40 France Waste-to-Energy (WtE) Market Forecast by CAPEX, 2024-2034 (FranceD Mn, AGR (%), CAGR (%), Cumulative)
Table 41 France Waste-to-Energy (WtE) Market Forecast by Capacity, 2024-2034 (MTPA, AGR (%), CAGR (%), Cumulative)
Table 42 France Waste-to-Energy (WtE) Market Forecast, 2024-2034 (No. of Units, AGR (%), CAGR (%), Cumulative)
Table 43 France Waste-to-Energy (WtE) Market Forecast by Plant Status, 2024-2034 (Plant Units, AGR (%), CAGR (%), Cumulative)
Table 44 France Waste-to-Energy (WtE) Market by Technology, 2024-2034 (MTPA, AGR (%), CAGR (%), Cumulative)
Table 45 France Waste-to-Energy (WtE) Market by End-Use, 2024-2034 (MWe, AGR (%), CAGR (%), Cumulative)
Table 46 Netherlands Local Name of the Plants
Table 47 Netherlands Waste-to-Energy (WtE) Market Forecast by Energy Generation, 2024-2034 (MWe, AGR (%), CAGR (%), Cumulative)
Table 48 Netherlands Waste-to-Energy (WtE) Market Forecast by CAPEX, 2024-2034 (NetherlandsD Mn, AGR (%), CAGR (%), Cumulative)
Table 49 Netherlands Waste-to-Energy (WtE) Market Forecast by Capacity, 2024-2034 (MTPA, AGR (%), CAGR (%), Cumulative)
Table 50 Netherlands Waste-to-Energy (WtE) Market Forecast, 2024-2034 (No. of Units, AGR (%), CAGR (%), Cumulative)
Table 51 Netherlands Waste-to-Energy (WtE) Market Forecast by Plant Status, 2024-2034 (Plant Units, AGR (%), CAGR (%), Cumulative)
Table 52 Netherlands Waste-to-Energy (WtE) Market by Technology, 2024-2034 (MTPA, AGR (%), CAGR (%), Cumulative)
Table 53 Netherlands Waste-to-Energy (WtE) Market by End-Use, 2024-2034 (MWe, AGR (%), CAGR (%), Cumulative)
Table 54 China Local Name of the Plant
Table 55 China Waste-to-Energy (WtE) Market Forecast by Energy Generation, 2024-2034 (MWe, AGR (%), CAGR (%), Cumulative)
Table 56 China Waste-to-Energy (WtE) Market Forecast by CAPEX, 2024-2034 (ChinaD Mn, AGR (%), CAGR (%), Cumulative)
Table 57 China Waste-to-Energy (WtE) Market Forecast by Capacity, 2024-2034 (MTPA, AGR (%), CAGR (%), Cumulative)
Table 58 China Waste-to-Energy (WtE) Market Forecast, 2024-2034 (No. of Units, AGR (%), CAGR (%), Cumulative)
Table 59 China Waste-to-Energy (WtE) Market Forecast by Plant Status, 2024-2034 (Plant Units, AGR (%), CAGR (%), Cumulative)
Table 60 China Waste-to-Energy (WtE) Market by Technology, 2024-2034 (MTPA, AGR (%), CAGR (%), Cumulative)
Table 61 China Waste-to-Energy (WtE) Market by End-Use, 2024-2034 (MWe, AGR (%), CAGR (%), Cumulative)
Table 62 Japan Local Name of the Plant
Table 63 Japan Waste-to-Energy (WtE) Market Forecast by Energy Generation, 2024-2034 (MWe, AGR (%), CAGR (%), Cumulative)
Table 64 Japan Waste-to-Energy (WtE) Market Forecast by CAPEX, 2024-2034 (Japan Mn, AGR (%), CAGR (%), Cumulative)
Table 65 Japan Waste-to-Energy (WtE) Market Forecast by Capacity, 2024-2034 (MTPA, AGR (%), CAGR (%), Cumulative)
Table 66 Japan Waste-to-Energy (WtE) Market Forecast, 2024-2034 (No. of Units, AGR (%), CAGR (%), Cumulative)
Table 67 Japan Waste-to-Energy (WtE) Market Forecast by Plant Status, 2024-2034 (Plant Units, AGR (%), CAGR (%), Cumulative)
Table 68 Japan Waste-to-Energy (WtE) Market by Technology, 2024-2034 (MTPA, AGR (%), CAGR (%), Cumulative)
Table 69 Japan Waste-to-Energy (WtE) Market by End-Use, 2024-2034 (MWe, AGR (%), CAGR (%), Cumulative)
Table 70 India Local Name of the Plant
Table 71 India Waste-to-Energy (WtE) Market Forecast by Energy Generation, 2024-2034 (MWe, AGR (%), CAGR (%), Cumulative)
Table 72 India Waste-to-Energy (WtE) Market Forecast by CAPEX, 2024-2034 (IndiaD Mn, AGR (%), CAGR (%), Cumulative)
Table 73 India Waste-to-Energy (WtE) Market Forecast by Capacity, 2024-2034 (MTPA, AGR (%), CAGR (%), Cumulative)
Table 74 India Waste-to-Energy (WtE) Market Forecast, 2024-2034 (No. of Units, AGR (%), CAGR (%), Cumulative)
Table 75 India Waste-to-Energy (WtE) Market Forecast by Plant Status, 2024-2034 (Plant Units, AGR (%), CAGR (%), Cumulative)
Table 76 India Waste-to-Energy (WtE) Market by Technology, 2024-2034 (MTPA, AGR (%), CAGR (%), Cumulative)
Table 77 India Waste-to-Energy (WtE) Market by End-Use, 2024-2034 (MWe, AGR (%), CAGR (%), Cumulative)
Table 78 Singapore Local name of the Plant
Table 79 Singapore Waste-to-Energy (WtE) Market Forecast by Energy Generation, 2024-2034 (MWe, AGR (%), CAGR (%), Cumulative)
Table 80 Singapore Waste-to-Energy (WtE) Market Forecast by CAPEX, 2024-2034 (Singapore Mn, AGR (%), CAGR (%), Cumulative)
Table 81 Singapore Waste-to-Energy (WtE) Market Forecast by Capacity, 2024-2034 (MTPA, AGR (%), CAGR (%), Cumulative)
Table 82 Singapore Waste-to-Energy (WtE) Market Forecast, 2024-2034 (No. of Units, AGR (%), CAGR (%), Cumulative)
Table 83 Singapore Waste-to-Energy (WtE) Market Forecast by Plant Status, 2024-2034 (Plant Units, AGR (%), CAGR (%), Cumulative)
Table 84 Singapore Waste-to-Energy (WtE) Market by Technology, 2024-2034 (MTPA, AGR (%), CAGR (%), Cumulative)
Table 85 Singapore Waste-to-Energy (WtE) Market by End-Use, 2024-2034 (MWe, AGR (%), CAGR (%), Cumulative)
Table 86 Thailand Local Name of the Plant
Table 87 Thailand Waste-to-Energy (WtE) Market Forecast by Energy Generation, 2024-2034 (MWe, AGR (%), CAGR (%), Cumulative)
Table 88 Thailand Waste-to-Energy (WtE) Market Forecast by CAPEX, 2024-2034 (Thailand Mn, AGR (%), CAGR (%), Cumulative)
Table 89 Thailand Waste-to-Energy (WtE) Market Forecast by Capacity, 2024-2034 (MTPA, AGR (%), CAGR (%), Cumulative)
Table 90 Thailand Waste-to-Energy (WtE) Market Forecast, 2024-2034 (No. of Units, AGR (%), CAGR (%), Cumulative)
Table 91 Thailand Waste-to-Energy (WtE) Market Forecast by Plant Status, 2024-2034 (Plant Units, AGR (%), CAGR (%), Cumulative)
Table 92 Thailand Waste-to-Energy (WtE) Market by Technology, 2024-2034 (MTPA, AGR (%), CAGR (%), Cumulative)
Table 93 Thailand Waste-to-Energy (WtE) Market by End-Use, 2024-2034 (MWe, AGR (%), CAGR (%), Cumulative)
Table 94 Austria Local name of the Plant
Table 95 Switzerland Local Name of the Plant
Table 96 Italy Local name of the Plant
Table 97 Norway Local name of the Plant
Table 98 Sweden Local name of the Plant
Table 99 Belgium Local name of the Plant
Table 100 Rest of World Waste-to-Energy (WtE) Market Forecast by Energy Generation, 2024-2034 (MWe, AGR (%), CAGR (%), Cumulative)
Table 101 Rest of World Waste-to-Energy (WtE) Market Forecast by CAPEX, 2024-2034 (Rest of WorldD Mn, AGR (%), CAGR (%), Cumulative)
Table 102 Rest of World Waste-to-Energy (WtE) Market Forecast by Capacity, 2024-2034 (MTPA, AGR (%), CAGR (%), Cumulative)
Table 103 Rest of World Waste-to-Energy (WtE) Market Forecast, 2024-2034 (No. of Units, AGR (%), CAGR (%), Cumulative)
Table 104 Rest of World Waste-to-Energy (WtE) Market Forecast by Plant Status, 2024-2034 (Plant Units, AGR (%), CAGR (%), Cumulative)
Table 105 Rest of World Waste-to-Energy (WtE) Market by Technology, 2024-2034 (MTPA, AGR (%), CAGR (%), Cumulative)
Table 106 Rest of World Waste-to-Energy (WtE) Market by End-Use, 2024-2034 (MWe, AGR (%), CAGR (%), Cumulative)
Table 107 Strategic Outlook - Contract
Table 108 Waste Management, Inc.: Key Details, (CEO, HQ, Revenue, Founded, No. of Employees, Company Type, Website, Business Segment)
Table 109 Waste Management, Inc.: Product Benchmarking
Table 110 Waste Management, Inc.: Strategic Outlook
Table 111 Veolia Environmental Services: Key Details, (CEO, HQ, Revenue, Founded, No. of Employees, Company Type, Website, Business Segment)
Table 112 Veolia Environmental Services: Product Benchmarking
Table 113 Veolia Environmental Services: Strategic Outlook
Table 114 Covanta Holding Corporation: Key Details, (CEO, HQ, Revenue, Founded, No. of Employees, Company Type, Website, Business Segment)
Table 115 Covanta Holding Corporation: Product Benchmarking
Table 116 Covanta Holding Corporation: Strategic Outlook
Table 117 Suez SA: Key Details, (CEO, HQ, Revenue, Founded, No. of Employees, Company Type, Website, Business Segment)
Table 118 Suez SA: Product Benchmarking
Table 119 Suez SA: Strategic Outlook
Table 120 Babcock & Wilcox Enterprises, Inc.: Key Details, (CEO, HQ, Revenue, Founded, No. of Employees, Company Type, Website, Business Segment)
Table 121 Babcock & Wilcox Enterprises, Inc.: Product Benchmarking
Table 122 Babcock & Wilcox Enterprises, Inc.: Strategic Outlook
Table 123 Keppel Seghers Engineering Singapore Pte Ltd.: Key Details, (CEO, HQ, Revenue, Founded, No. of Employees, Company Type, Website, Business Segment)
Table 124 Keppel Seghers Engineering Singapore Pte Ltd.: Product Benchmarking
Table 125 Keppel Seghers Engineering Singapore Pte Ltd.: Strategic Outlook
Table 126 Wheelabrator Technologies Inc: Key Details, (CEO, HQ, Revenue, Founded, No. of Employees, Company Type, Website, Business Segment)
Table 127 Wheelabrator Technologies Inc: Product Benchmarking
Table 128 Wheelabrator Technologies Inc: Strategic Outlook
Table 129 Martin Environmental Services: Key Details, (CEO, HQ, Revenue, Founded, No. of Employees, Company Type, Website, Business Segment)
Table 130 Martin Environmental Services: Product Benchmarking
Table 131 Martin Environmental Services: Strategic Outlook
Table 132 Viridor Waste Management Ltd. Key Details, (CEO, HQ, Revenue, Founded, No. of Employees, Company Type, Website, Business Segment)
Table 133 Viridor Waste Management Ltd.: Product Benchmarking
Table 134 Viridor Waste Management Ltd.: Strategic Outlook
Table 135 Abu Dhabi National Energy Company, PJSC (TAQA: Key Details, (CEO, HQ, Revenue, Founded, No. of Employees, Company Type, Website, Business Segment)
Table 136 Abu Dhabi National Energy Company, PJSC (TAQA: Product Benchmarking
Table 137 Abu Dhabi National Energy Company, PJSC (TAQA: Strategic Outlook
Table 138 Mitsubishi Heavy Industries Environmental & Chemical Engineering Co., Ltd.: Key Details, (CEO, HQ, Revenue, Founded, No. of Employees, Company Type, Website, Business Segment)
Table 139 Mitsubishi Heavy Industries Environmental & Chemical Engineering Co., Ltd.: Product Benchmarking
Table 140 Mitsubishi Heavy Industries Environmental & Chemical Engineering Co., Ltd.: Strategic Outlook
Table 141 Hitachi, Ltd: Key Details, (CEO, HQ, Revenue, Founded, No. of Employees, Company Type, Website, Business Segment)
Table 142 Hitachi, Ltd: Product Benchmarking
Table 143 Hitachi, Ltd: Strategic Outlook
Table 144 Foster Wheeler AG: Key Details, (CEO, HQ, Revenue, Founded, No. of Employees, Company Type, Website, Business Segment)
Table 145 Foster Wheeler AG: Product Benchmarking
Table 146 Foster Wheeler AG: Strategic Outlook
Table 147 Rambøll Group A/S: Key Details, (CEO, HQ, Revenue, Founded, No. of Employees, Company Type, Website, Business Segment)
Table 148 Rambøll Group A/S: Product Benchmarking
Table 149 Rambøll Group A/S: Strategic Outlook
Table 150 C&G Environmental Protection Holdings Limited: Key Details, (CEO, HQ, Revenue, Founded, No. of Employees, Company Type, Website, Business Segment)
Table 151 C&G Environmental Protection Holdings Limited: Product Benchmarking
Table 152 C&G Environmental Protection Holdings Limited: Strategic Outlook
図の一覧
Figure 1 Waste to Energy Market Segmentation
Figure 2 Waste to Energy Market: Market Dynamics
Figure 3 Waste to Energy Market: Porter’s Five Forces Analysis
Figure 4 Global Waste-to-Energy (WtE) CAPEX Market by Country, 2024-2034 (US US$Mn, AGR (%)), Cumulative)
Figure 5 Global Waste-to-Energy (WtE) CAPEX Market by Country, 2024-2034 (US US$Mn, AGR (%), Cumulative)
Figure 6 Global Waste-to-Energy (WtE) CAPEX Market by Country, 2024-2034 (US US$Mn, AGR (%)), Cumulative)
Figure 7 Global Waste-to-Energy (WtE) CAPEX Market by Country, 2024-2034 (US US$Mn, AGR (%), Cumulative)
Figure 8 Waste to Energy Market: PEST Analysis
Figure 9 Global Waste-to-Energy (WtE) Market Forecast by Energy Generation, 2024-2034 (MWe, AGR (%), Cumulative)
Figure 10 Global Waste-to-Energy (WtE) Market Forecast by CAPEX, 2024-2034 (US US$Mn, AGR (%), Cumulative)
Figure 11 Global Waste-to-Energy (WtE) Market Forecast by Capacity, 2024-2034 (MTPA, AGR (%), Cumulative)
Figure 12 Global Waste-to-Energy (WtE) Market Forecast, 2024-2034 (No. of Units, AGR (%), Cumulative)
Figure 13 Global Waste-to-Energy (WtE) Market Forecast by Plant Status, 2024-2034 (Plant Units, AGR (%), Cumulative)
Figure 14 Global Waste-to-Energy (WtE) Market by Technology, 2024-2034 (MTPA, AGR (%), Cumulative)
Figure 15 Global Waste-to-Energy (WtE) Market by End-Use, 2024-2034 (MWe, AGR (%), Cumulative)
Figure 16 Waste to Energy Market by Country, 2024-2034 (US US$Million, AGR %)
Figure 17 US Waste-to-Energy (WtE) Market Forecast by Energy Generation, 2024-2034 (MWe, AGR (%), Cumulative)
Figure 18 US Waste-to-Energy (WtE) Market Forecast by CAPEX, 2024-2034 (US US$Mn, AGR (%), Cumulative)
Figure 19 US Waste-to-Energy (WtE) Market Forecast by Capacity, 2024-2034 (MTPA, AGR (%), Cumulative)
Figure 20 US Waste-to-Energy (WtE) Market Forecast, 2024-2034 (No. of Units, AGR (%), Cumulative)
Figure 21 US Waste-to-Energy (WtE) Market Forecast by Plant Status, 2024-2034 (Plant Units, AGR (%), Cumulative)
Figure 22 US Waste-to-Energy (WtE) Market by Technology, 2024-2034 (MTPA, AGR (%), Cumulative)
Figure 23 US Waste-to-Energy (WtE) Market by End-Use, 2024-2034 (MWe, AGR (%), Cumulative)
Figure 24 UK Waste-to-Energy (WtE) Market Forecast by Energy Generation, 2024-2034 (MWe, AGR (%), Cumulative)
Figure 25 UK Waste-to-Energy (WtE) Market Forecast by CAPEX, 2024-2034 (UKD Mn, AGR (%), Cumulative)
Figure 26 UK Waste-to-Energy (WtE) Market Forecast by Capacity, 2024-2034 (MTPA, AGR (%), Cumulative)
Figure 27 UK Waste-to-Energy (WtE) Market Forecast, 2024-2034 (No. of Units, AGR (%), Cumulative)
Figure 28 UK Waste-to-Energy (WtE) Market Forecast by Plant Status, 2024-2034 (Plant Units, AGR (%), Cumulative)
Figure 29 UK Waste-to-Energy (WtE) Market by Technology, 2024-2034 (MTPA, AGR (%), Cumulative)
Figure 30 UK Waste-to-Energy (WtE) Market by End-Use, 2024-2034 (MWe, AGR (%), Cumulative)
Figure 31 Germany Waste-to-Energy (WtE) Market Forecast by Energy Generation, 2024-2034 (MWe, AGR (%), Cumulative)
Figure 32 Germany Waste-to-Energy (WtE) Market Forecast by CAPEX, 2024-2034 (Germany Mn, AGR (%), Cumulative)
Figure 33 Germany Waste-to-Energy (WtE) Market Forecast by Capacity, 2024-2034 (MTPA, AGR (%), Cumulative)
Figure 34 Germany Waste-to-Energy (WtE) Market Forecast, 2024-2034 (No. of Units, AGR (%), Cumulative)
Figure 35 Germany Waste-to-Energy (WtE) Market Forecast by Plant Status, 2024-2034 (Plant Units, AGR (%), Cumulative)
Figure 36 Germany Waste-to-Energy (WtE) Market by Technology, 2024-2034 (MTPA, AGR (%), Cumulative)
Figure 37 Germany Waste-to-Energy (WtE) Market by End-Use, 2024-2034 (MWe, AGR (%), Cumulative)
Figure 38 France Waste-to-Energy (WtE) Market Forecast by Energy Generation, 2024-2034 (MWe, AGR (%), Cumulative)
Figure 39 France Waste-to-Energy (WtE) Market Forecast by CAPEX, 2024-2034 (FranceD Mn, AGR (%), Cumulative)
Figure 40 France Waste-to-Energy (WtE) Market Forecast by Capacity, 2024-2034 (MTPA, AGR (%), Cumulative)
Figure 41 France Waste-to-Energy (WtE) Market Forecast, 2024-2034 (No. of Units, AGR (%), Cumulative)
Figure 42 France Waste-to-Energy (WtE) Market Forecast by Plant Status, 2024-2034 (Plant Units, AGR (%), Cumulative)
Figure 43 France Waste-to-Energy (WtE) Market by Technology, 2024-2034 (MTPA, AGR (%), Cumulative)
Figure 44 France Waste-to-Energy (WtE) Market by End-Use, 2024-2034 (MWe, AGR (%), Cumulative)
Figure 45 Netherlands Waste-to-Energy (WtE) Market Forecast by Energy Generation, 2024-2034 (MWe, AGR (%), Cumulative)
Figure 46 Netherlands Waste-to-Energy (WtE) Market Forecast by CAPEX, 2024-2034 (NetherlandsD Mn, AGR (%), Cumulative)
Figure 47 Netherlands Waste-to-Energy (WtE) Market Forecast by Capacity, 2024-2034 (MTPA, AGR (%), Cumulative)
Figure 48 Netherlands Waste-to-Energy (WtE) Market Forecast, 2024-2034 (No. of Units, AGR (%), Cumulative)
Figure 49 Netherlands Waste-to-Energy (WtE) Market Forecast by Plant Status, 2024-2034 (Plant Units, AGR (%), Cumulative)
Figure 50 Netherlands Waste-to-Energy (WtE) Market by Technology, 2024-2034 (MTPA, AGR (%), Cumulative)
Figure 51 Netherlands Waste-to-Energy (WtE) Market by End-Use, 2024-2034 (MWe, AGR (%), Cumulative)
Figure 52 China Waste-to-Energy (WtE) Market Forecast by Energy Generation, 2024-2034 (MWe, AGR (%), Cumulative)
Figure 53 China Waste-to-Energy (WtE) Market Forecast by CAPEX, 2024-2034 (ChinaD Mn, AGR (%), Cumulative)
Figure 54 China Waste-to-Energy (WtE) Market Forecast by Capacity, 2024-2034 (MTPA, AGR (%), Cumulative)
Figure 55 China Waste-to-Energy (WtE) Market Forecast, 2024-2034 (No. of Units, AGR (%), Cumulative)
Figure 56 China Waste-to-Energy (WtE) Market Forecast by Plant Status, 2024-2034 (Plant Units, AGR (%), Cumulative)
Figure 57 China Waste-to-Energy (WtE) Market by Technology, 2024-2034 (MTPA, AGR (%), Cumulative)
Figure 58 China Waste-to-Energy (WtE) Market by End-Use, 2024-2034 (MWe, AGR (%), Cumulative)
Figure 59 Japan Waste-to-Energy (WtE) Market Forecast by Energy Generation, 2024-2034 (MWe, AGR (%), Cumulative)
Figure 60 Japan Waste-to-Energy (WtE) Market Forecast by CAPEX, 2024-2034 (JapanD Mn, AGR (%), Cumulative)
Figure 61 Japan Waste-to-Energy (WtE) Market Forecast by Capacity, 2024-2034 (MTPA, AGR (%), Cumulative)
Figure 62 Japan Waste-to-Energy (WtE) Market Forecast, 2024-2034 (No. of Units, AGR (%), Cumulative)
Figure 63 Japan Waste-to-Energy (WtE) Market Forecast, 2024-2034 (No. of Units, AGR (%), Cumulative)
Figure 64 Japan Waste-to-Energy (WtE) Market by Technology, 2024-2034 (MTPA, AGR (%), Cumulative)
Figure 65 Japan Waste-to-Energy (WtE) Market by End-Use, 2024-2034 (MWe, AGR (%), Cumulative)
Figure 66 India Waste-to-Energy (WtE) Market Forecast by Energy Generation, 2024-2034 (MWe, AGR (%), Cumulative)
Figure 67 India Waste-to-Energy (WtE) Market Forecast by CAPEX, 2024-2034 (IndiaD Mn, AGR (%), Cumulative)
Figure 68 India Waste-to-Energy (WtE) Market Forecast by Capacity, 2024-2034 (MTPA, AGR (%), Cumulative)
Figure 69 India Waste-to-Energy (WtE) Market Forecast, 2024-2034 (No. of Units, AGR (%), Cumulative)
Figure 70 India Waste-to-Energy (WtE) Market Forecast by Plant Status, 2024-2034 (Plant Units, AGR (%), Cumulative)
Figure 71 India Waste-to-Energy (WtE) Market by Technology, 2024-2034 (MTPA, AGR (%), Cumulative)
Figure 72 India Waste-to-Energy (WtE) Market by End-Use, 2024-2034 (MWe, AGR (%), Cumulative)
Figure 73 Singapore Waste-to-Energy (WtE) Market Forecast by Energy Generation, 2024-2034 (MWe, AGR (%), Cumulative)
Figure 74 Singapore Waste-to-Energy (WtE) Market Forecast by CAPEX, 2024-2034 (SingaporeD Mn, AGR (%), Cumulative)
Figure 75 Singapore Waste-to-Energy (WtE) Market Forecast by Capacity, 2024-2034 (MTPA, AGR (%), Cumulative)
Figure 76 Singapore Waste-to-Energy (WtE) Market Forecast, 2024-2034 (No. of Units, AGR (%), Cumulative)
Figure 77 Singapore Waste-to-Energy (WtE) Market Forecast by Plant Status, 2024-2034 (Plant Units, AGR (%), Cumulative)
Figure 78 Singapore Waste-to-Energy (WtE) Market by Technology, 2024-2034 (MTPA, AGR (%), Cumulative)
Figure 79 Singapore Waste-to-Energy (WtE) Market by End-Use, 2024-2034 (MWe, AGR (%), Cumulative)
Figure 80 Thailand Waste-to-Energy (WtE) Market Forecast by Energy Generation, 2024-2034 (MWe, AGR (%), Cumulative)
Figure 81 Thailand Waste-to-Energy (WtE) Market Forecast by CAPEX, 2024-2034 (Thailand Mn, AGR (%), Cumulative)
Figure 82 Thailand Waste-to-Energy (WtE) Market Forecast by Capacity, 2024-2034 (MTPA, AGR (%), Cumulative)
Figure 83 Thailand Waste-to-Energy (WtE) Market Forecast, 2024-2034 (No. of Units, AGR (%), Cumulative)
Figure 84 Thailand Waste-to-Energy (WtE) Market Forecast by Plant Status, 2024-2034 (Plant Units, AGR (%), Cumulative)
Figure 85 Thailand Waste-to-Energy (WtE) Market by Technology, 2024-2034 (MTPA, AGR (%), Cumulative)
Figure 86 Thailand Waste-to-Energy (WtE) Market by End-Use, 2024-2034 (MWe, AGR (%), Cumulative)
Figure 87 Rest of World Waste-to-Energy (WtE) Market Forecast by Energy Generation, 2024-2034 (MWe, AGR (%), Cumulative)
Figure 88 Rest of World Waste-to-Energy (WtE) Market Forecast by CAPEX, 2024-2034 (Rest of WorldD Mn, AGR (%), Cumulative)
Figure 89 Rest of World Waste-to-Energy (WtE) Market Forecast by Capacity, 2024-2034 (MTPA, AGR (%), Cumulative)
Figure 90 Rest of World Waste-to-Energy (WtE) Market Forecast, 2024-2034 (No. of Units, AGR (%), Cumulative)
Figure 91 Rest of World Waste-to-Energy (WtE) Market Forecast by Plant Status, 2024-2034 (Plant Units, AGR (%), Cumulative)
Figure 92 Rest of World Waste-to-Energy (WtE) Market by Technology, 2024-2034 (MTPA, AGR (%), Cumulative)
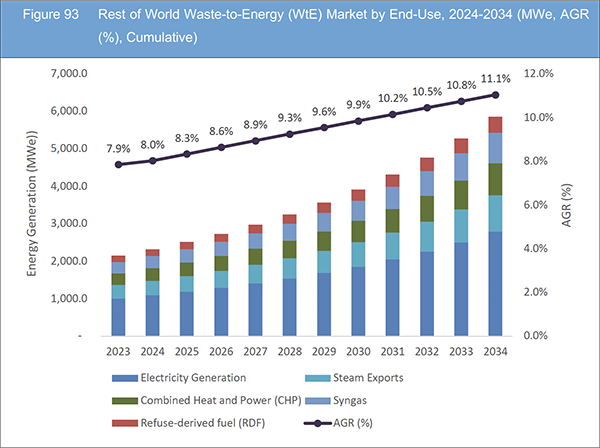
Figure 93 Rest of World Waste-to-Energy (WtE) Market by End-Use, 2024-2034 (MWe, AGR (%), Cumulative)
Figure 94 Waste to Energy Market: Company Share, 2022
Figure 95 Waste Management, Inc..: Net Revenue, 2018-2022 (US US$Million, AGR%)
Figure 96 Waste Management, Inc..: Regional Revenue Share, 2022 (%)
Figure 97 Waste Management, Inc..: Business Segment Revenue Share, 2022 (%)
Figure 98 Veolia Environmental Services.: Net Revenue, 2018-2022 (US US$Million, AGR%)
Figure 99 Babcock & Wilcox Enterprises, Inc..: Net Revenue, 2018-2022 (US US$Million, AGR%)
Figure 100 Babcock & Wilcox Enterprises, Inc..: R&D, 2018-2022 (US US$Million, AGR%)
Figure 101 Babcock & Wilcox Enterprises, Inc..: Regional Revenue Share, 2022 (%)
Figure 102 Babcock & Wilcox Enterprises, Inc..: Business Segment Revenue Share, 2022 (%)
Figure 103 Mitsubishi Heavy Industries Environmental & Chemical Engineering Co., Ltd..: Net Revenue, 2018-2022 (US US$Million, AGR%)
Figure 104 Mitsubishi Heavy Industries Environmental & Chemical Engineering Co., Ltd..: R&D, 2018-2022 (US US$Million, AGR%)
Figure 105 Mitsubishi Heavy Industries Environmental & Chemical Engineering Co., Ltd..: Regional Revenue Share, 2022 (%)
Figure 106 Mitsubishi Heavy Industries Environmental & Chemical Engineering Co., Ltd..: Business Segment Revenue Share, 2022 (%)
Figure 107 Hitachi, Ltd.: Net Revenue, 2018-2022 (US US$Million, AGR%)
Figure 108 Hitachi, Ltd.: Regional Revenue Share, 2022 (%)
Figure 109 Hitachi, Ltd.: Business Segment Revenue Share, 2022 (%)
ページTOPに戻る
Summary
Report Details
The Waste to Energy (WtE) Market Report 2024-2034: This report will prove invaluable to leading firms striving for new revenue pockets if they wish to better understand the industry and its underlying dynamics. It will be useful for companies that would like to expand into different industries or to expand their existing operations in a new country.
Exponential Growth in Global Population and Urbanisation Has Increased Waste Generation
The exponential growth in global population and urbanisation has led to a substantial surge in waste generation, necessitating advanced waste management solutions. Urban areas, in particular, face significant challenges in handling the escalating volumes of municipal solid waste. Waste to energy emerges as a critical market driver, offering a sustainable approach to address the mounting waste crisis. For instance, Tokyo, one of the world’s largest and most densely populated cities, generates approximately 12,500 tons of waste per day. To manage this colossal waste output efficiently, Tokyo has invested in waste to energy facilities, converting a substantial portion of its waste into electricity, thereby addressing both waste disposal challenges and contributing to the city’s energy needs.
Stringent Environmental Regulations
Governments worldwide are enacting stringent environmental regulations to combat climate change and promote sustainable practices. These regulations focus on reducing greenhouse gas emissions and encourage the adoption of cleaner energy alternatives, driving the waste to energy market. The European Union’s waste incineration directive exemplifies this trend. This directive establishes strict guidelines for the safe and environmentally responsible use of waste to energy technologies. For instance, countries like Germany have implemented advanced flue gas cleaning systems in waste to energy plants to comply with these regulations, ensuring that the environmental impact of waste incineration is minimised.
What Questions Should You Ask before Buying a Market Research Report?
• How is the waste-to-energy (WtE) market evolving?
• What is driving and restraining the waste-to-energy (WtE) market?
• How will each waste-to-energy (WtE) submarket segment grow over the forecast period and how much revenue will these submarkets account for in 2034?
• How will the market shares for each waste-to-energy (WtE) submarket develop from 2024 to 2034?
• What will be the main driver for the overall market from 2024 to 2034?
• Will leading waste-to-energy (WtE) markets broadly follow the macroeconomic dynamics, or will individual national markets outperform others?
• How will the market shares of the national markets change by 2034 and which country will lead the market in 2034?
• Who are the leading players and what are their prospects over the forecast period?
• What are the waste-to-energy (WtE) projects for these leading companies?
• How will the industry evolve during the period between 2024 and 2034? What are the implications of waste-to-energy (WtE) projects taking place now and over the next 10 years?
• Is there a greater need for product commercialisation to further scale the waste-to-energy (WtE) market?
• Where is the waste-to-energy (WtE) market heading and how can you ensure you are at the forefront of the market?
• What are the best investment options for new product and service lines?
• What are the key prospects for moving companies into a new growth path and C-suite?
You need to discover how this will impact the waste-to-energy (WtE) market today, and over the next 10 years:
• Our 329-page report provides 152 tables and 109 charts/graphs exclusively to you.
• The report highlights key lucrative areas in the industry so you can target them – NOW.
• It contains in-depth analysis of global, and national growth.
• It highlights for you the key successful trends, changes and revenue projections made by your competitors.
This report tells you TODAY how the waste-to-energy (WtE) market will develop in the next 10 years, and in line with the variations in COVID-19 economic recession and bounce. This market is more critical now than at any point over the last 10 years.
Forecasts to 2034 and other analyses reveal commercial prospects
• In addition to revenue forecasting to 2034, our new study provides you with recent results, growth rates, and market shares.
• You will find original analyses, with business outlooks and developments.
• Discover qualitative analyses (including market dynamics, drivers, opportunities, restraints and challenges), cost structure, impact of rising waste-to-energy (WtE) prices and recent developments.
This report includes data analysis and invaluable insight into how COVID-19 will affect the industry and your company. Four COVID-19 recovery patterns and their impact, namely, “V”, “L”, “W” and “U” are discussed in this report.
Segments Covered in the Report
Market Segment by
• Market Value
• CAPEX
• Energy Generation
• Capacity
• No. of Plant Units
Market Segment by Plant Status
• Operational WtE Plants
• Under Construction WtE Plants
Market Segment by Technology
• Direct Combustion (Mass Burn and RDF)
• Plasma Arc Gasification
• Conventional Gasification
• Pyrolysis WtE
• Chemical Treatment
• Biological Treatment
Market Segment by End-Use
• Electricity Generation
• Steam Exports
• Combined Heat and Power (CHP)
• Syngas
• Refuse-derived fuel (RDF))
Market Segment by Country
• US
• UK
• Germany
• France
• Netherlands
• China
• Japan
• India
• Singapore
• Thailand
• RoW
The report also includes profiles and for some of the leading companies in the Waste-to-Energy (WtE) Market, 2024 to 2034, with a focus on this segment of these companies’ operations.
Leading companies profiled in the report
• Abu Dhabi National Energy Company, PJSC(TAQA)
• Babcock & Wilcox Enterprises, Inc.
• C&G Environmental Protection Holdings Limited
• Covanta Holding Corporation
• Foster Wheeler AG
• Hitachi, Ltd
• Keppel Seghers Engineering Singapore Pte Ltd.
• Martin Environmental Services
• Mitsubishi Heavy Industries Environmental & Chemical Engineering Co., Ltd.
• Rambøll Group A/S
• Suez SA
• Veolia Environmental Services
• Viridor Waste Management Ltd.
• Waste Management, Inc.
• Wheelabrator Technologies Inc.
Overall world revenue for Waste-to-Energy (WtE) Market, 2024 to 2034 in terms of CAPEX the market will surpass US$23,958 million in 2024, our work calculates. We predict strong revenue growth through to 2034. Our work identifies which organisations hold the greatest potential. Discover their capabilities, progress, and commercial prospects, helping you stay ahead.
How will the Waste-to-Energy (WtE) Market, 2024 to 2034 report help you?
In summary, our 320+ page report provides you with the following knowledge:
• Revenue forecasts to 2034 for Waste-to-Energy (WtE) Market, 2024 to 2034 Market, with forecasts for value, CAPEX, energy generation, plant capacity, no. of plants, and country, each forecast at a global and national level – discover the industry’s prospects, finding the most lucrative places for investments and revenues.
• Revenue forecasts to 2034 for seven key national markets – See forecasts for the Waste-to-Energy (WtE) Market, 2024 to 2034 market in US, UK, Germany, France, Netherlands, China, Japan, India, Singapore, Thailand, and RoW among other prominent economies.
• Prospects for established firms and those seeking to enter the market – including company profiles for 15 of the major companies involved in the Waste-to-Energy (WtE) Market, 2024 to 2034.
Find quantitative and qualitative analyses with independent predictions. Receive information that only our report contains, staying informed with invaluable business intelligence.
Information found nowhere else
With our new report, you are less likely to fall behind in knowledge or miss out on opportunities. See how our work could benefit your research, analyses, and decisions. Visiongain’s study is for everybody needing commercial analyses for the Waste-to-Energy (WtE) Market, 2024 to 2034, market-leading companies. You will find data, trends and predictions.
ページTOPに戻る
Table of Contents
Table of Contents
1 Report Overview
1.1 Objectives of the Study
1.2 Introduction to Waste to Energy Market
1.3 What This Report Delivers
1.4 Why You Should Read This Report
1.5 Key Questions Answered by This Analytical Report
1.6 Who Is This Report for?
1.7 Methodology
1.7.1 Market Definitions
1.7.2 Market Evaluation & Forecasting Methodology
1.7.3 Data Validation
1.7.3.1 Primary Research
1.7.3.2 Secondary Research
1.8 Frequently Asked Questions (FAQs)
1.9 Associated Visiongain Reports
1.10 About Visiongain
2 Executive Summary
3 Market Overview
3.1 Key Findings
3.2 Market Dynamics
3.2.1 Market Driving Factors
3.2.1.1 The Global Municipal Waste Destined for Waste-To-Energy (WtE) Facilities is Experiencing an Upsurge in Volume
3.2.1.2 The Available Land Space for Landfilling Is Diminishing, Necessitating Alternative Waste Management Solutions
3.2.1.3 Increased Financial Support from Governmental Entities Is Promoting Initiatives Aimed at Addressing the Issue of Escalating Waste Generation
3.2.2 Market Restraining Factors
3.2.2.1 The Expansion of Waste-to-Energy (WtE) Facilities in the Countries has Faced Notable Slowdowns Due to Environmental Opposition
3.2.2.2 Waste Incineration Remains an Uncommon Practice in Developing Countries, Posing a Challenge for Market
3.2.2.3 The Cost-Intensive Nature of Equipment, Particularly Incinerators, Presents a Significant Financial Barrier to Implementation
3.2.3 Market Opportunities
3.2.3.1 Opportunities in the Growing Demand for WtE Plants
3.2.3.2 The Annual Volume of Waste Generated in Asian Countries Is on the Rise, Offering a Potential Market for WtE Solutions
3.2.3.3 National Governments are Increasingly Collaborating with Waste-to-Energy Companies
3.3 Porter’s Five Forces Analysis
3.3.1 Bargaining Power of Suppliers (Low)
3.3.2 Bargaining Power of Buyers (Medium)
3.3.3 Competitive Rivalry (High)
3.3.4 Threat from Substitutes (Low)
3.3.5 Threat of New Entrants (Medium to High)
3.4 COVID-19 Impact Analysis
3.4.1 “V-Shaped Recovery”
3.4.2 “U-Shaped Recovery”
3.4.3 “W-Shaped Recovery”
3.4.4 “L-Shaped Recovery”
3.5 PEST Analysis
4 Global Waste to Energy Market Analysis by Country
4.1 Key Findings
4.2 Global Market Outlook
4.3 Global Waste-to-Energy (WtE) Market by Energy Generation
4.4 Global Waste-to-Energy (WtE) Market by Forecast
4.5 Global Waste-to-Energy (WtE) Market Forecast by Plant Status
4.5.1 Operational WtE Plants
4.5.2 Under Construction WtE Plants
4.6 Global Waste-to-Energy (WtE) Market by Technology
4.6.1 Direct Combustion (Mass Burn and RDF)
4.6.2 Plasma Arc Gasification
4.6.3 Conventional Gasification
4.6.4 Pyrolysis WtE
4.6.5 Chemical Treatment
4.6.6 Biological Treatment
4.7 Global Waste-to-Energy (WtE) Market by End-Use
4.7.1 Electricity Generation
4.7.2 Steam Exports
4.7.3 Combined Heat and Power (CHP)
4.7.4 Syngas
4.7.5 Refuse-derived fuel (RDF)
4.8 Global Waste-to-Energy (WtE) Market by Country
5 U.S. Waste to Energy Market Analysis
5.1 Key Findings
5.2 US Market Outlook
5.3 U.S. Waste-to-Energy (WtE) Market by Energy Generation
5.4 U.S. Waste-to-Energy (WtE) Market by Forecast
5.5 U.S. Waste-to-Energy (WtE) Market Forecast by Plant Status
5.6 U.S. Waste-to-Energy (WtE) Market by Technology
5.7 U.S. Waste-to-Energy (WtE) Market by End-Use
6 U.K. Waste to Energy Market Analysis
6.1 Key Findings
6.2 U.K. Market Outlook
6.3 U.K. Waste-to-Energy (WtE) Market by Energy Generation
6.4 U.K. Waste-to-Energy (WtE) Market by Forecast
6.5 U.K. Waste-to-Energy (WtE) Market Forecast by Plant Status
6.6 U.K. Waste-to-Energy (WtE) Market by Technology
6.7 U.K. Waste-to-Energy (WtE) Market by End-Use
7 Germany Waste to Energy Market Analysis
7.1 Key Findings
7.2 Germany Market Outlook
7.3 Germany Waste-to-Energy (WtE) Market by Energy Generation
7.4 Germany Waste-to-Energy (WtE) Market by Forecast
7.5 Germany Waste-to-Energy (WtE) Market Forecast by Plant Status
7.6 Germany Waste-to-Energy (WtE) Market by Technology
7.7 Germany Waste-to-Energy (WtE) Market by End-Use
8 France Waste to Energy Market Analysis
8.1 Key Findings
8.2 France Market Outlook
8.3 France Waste-to-Energy (WtE) Market by Energy Generation
8.4 France Waste-to-Energy (WtE) Market by Forecast
8.5 France Waste-to-Energy (WtE) Market Forecast by Plant Status
8.6 France Waste-to-Energy (WtE) Market by Technology
8.7 France Waste-to-Energy (WtE) Market by End-Use
9 Netherlands Waste to Energy Market Analysis
9.1 Key Findings
9.2 Netherlands Market Outlook
9.3 Netherlands Waste-to-Energy (WtE) Market by Energy Generation
9.4 Netherlands Waste-to-Energy (WtE) Market by Forecast
9.5 Netherlands Waste-to-Energy (WtE) Market Forecast by Plant Status
9.6 Netherlands Waste-to-Energy (WtE) Market by Technology
9.7 Netherlands Waste-to-Energy (WtE) Market by End-Use
10 China Waste to Energy Market Analysis
10.1 Key Findings
10.2 China Market Outlook
10.3 China Waste-to-Energy (WtE) Market by Energy Generation
10.4 China Waste-to-Energy (WtE) Market by Forecast
10.5 China Waste-to-Energy (WtE) Market Forecast by Plant Status
10.6 China Waste-to-Energy (WtE) Market by Technology
10.7 China Waste-to-Energy (WtE) Market by End-Use
11 Japan Waste to Energy Market Analysis
11.1 Key Findings
11.2 Japan Market Outlook
11.3 Japan Waste-to-Energy (WtE) Market by Energy Generation
11.4 Japan Waste-to-Energy (WtE) Market by Forecast
11.5 Japan Waste-to-Energy (WtE) Market Forecast by Plant Status
11.6 Japan Waste-to-Energy (WtE) Market by Technology
11.7 Japan Waste-to-Energy (WtE) Market by End-Use
12 India Waste to Energy Market Analysis
12.1 Key Findings
12.2 India Market Outlook
12.3 India Waste-to-Energy (WtE) Market by Energy Generation
12.4 India Waste-to-Energy (WtE) Market by Forecast
12.5 India Waste-to-Energy (WtE) Market Forecast by Plant Status
12.6 India Waste-to-Energy (WtE) Market by Technology
12.7 India Waste-to-Energy (WtE) Market by End-Use
13 Singapore Waste to Energy Market Analysis
13.1 Key Findings
13.2 Singapore Market Outlook
13.3 Singapore Waste-to-Energy (WtE) Market by Energy Generation
13.4 Singapore Waste-to-Energy (WtE) Market by Forecast
13.5 Singapore Waste-to-Energy (WtE) Market Forecast by Plant Status
13.6 Singapore Waste-to-Energy (WtE) Market by Technology
13.7 Singapore Waste-to-Energy (WtE) Market by End-Use
14 Thailand Waste to Energy Market Analysis
14.1 Key Findings
14.2 Thailand Market Outlook
14.3 Thailand Waste-to-Energy (WtE) Market by Energy Generation
14.4 Thailand Waste-to-Energy (WtE) Market by Forecast
14.5 Thailand Waste-to-Energy (WtE) Market Forecast by Plant Status
14.6 Thailand Waste-to-Energy (WtE) Market by Technology
14.7 Thailand Waste-to-Energy (WtE) Market by End-Use
15 Rest of World Waste to Energy Market Analysis
15.1 Key Findings
15.2 Rest of World Market Outlook
15.3 Rest of World Waste-to-Energy (WtE) Market by Energy Generation
15.4 Rest of World Waste-to-Energy (WtE) Market by Forecast
15.5 Rest of World Waste-to-Energy (WtE) Market Forecast by Plant Status
15.6 Rest of World Waste-to-Energy (WtE) Market by Technology
15.7 Rest of World Waste-to-Energy (WtE) Market by End-Use
16 Company Profiles
16.1 Competitive Landscape, 2022
16.2 Strategic Outlook
16.3 Waste Management, Inc.
16.3.1 Company Snapshot
16.3.2 Company Overview
16.3.3 Financial Analysis
16.3.4 Net Revenue, 2018-2022
16.3.4.1 Regional Revenue Share, 2022 (%)
16.3.4.2 Business Segment Revenue Share, 2022 (%)
16.3.5 Product Benchmarking
16.3.6 Strategic Outlook
16.4 Veolia Environmental Services
16.4.1 Company Snapshot
16.4.2 Company Overview
16.4.3 Financial Analysis
16.4.4 Net Revenue, 2018-2022
16.4.5 Product Benchmarking
16.4.6 Strategic Outlook
16.5 Covanta Holding Corporation
16.5.1 Company Snapshot
16.5.2 Company Overview
16.5.3 Product Benchmarking
16.5.4 Strategic Outlook
16.6 Suez SA
16.6.1 Company Snapshot
16.6.2 Company Overview
16.6.3 Product Benchmarking
16.6.4 Strategic Outlook
16.7 Babcock & Wilcox Enterprises, Inc.
16.7.1 Company Snapshot
16.7.2 Company Overview
16.7.3 Financial Analysis
16.7.4 Net Revenue, 2018-2022
16.7.4.1 R&D, 2018-2022
16.7.4.2 Regional Revenue Share, 2022 (%)
16.7.4.3 Business Segment Revenue Share, 2022 (%)
16.7.5 Product Benchmarking
16.7.6 Strategic Outlook
16.8 Keppel Seghers Engineering Singapore Pte Ltd.
16.8.1 Company Snapshot
16.8.2 Company Overview
16.8.3 Product Benchmarking
16.8.4 Strategic Outlook
16.9 Wheelabrator Technologies Inc
16.9.1 Company Snapshot
16.9.2 Company Overview
16.9.3 Product Benchmarking
16.9.4 Strategic Outlook
16.10 Martin Environmental Services
16.10.1 Company Snapshot
16.10.2 Company Overview
16.10.3 Product Benchmarking
16.10.4 Strategic Outlook
16.11 Viridor Waste Management Ltd.
16.11.1 Company Snapshot
16.11.2 Company Overview
16.11.3 Product Benchmarking
16.11.4 Strategic Outlook
16.12 Abu Dhabi National Energy Company, PJSC(TAQA)
16.12.1 Company Snapshot
16.12.2 Company Overview
16.12.3 Product Benchmarking
16.12.4 Strategic Outlook
16.13 Mitsubishi Heavy Industries Environmental & Chemical Engineering Co., Ltd.
16.13.1 Company Snapshot
16.13.2 Company Overview
16.13.3 Financial Analysis
16.13.4 Net Revenue, 2018-2022
16.13.4.1 R&D, 2018-2022
16.13.4.2 Regional Revenue Share, 2022 (%)
16.13.4.3 Business Segment Revenue Share, 2022 (%)
16.13.5 Product Benchmarking
16.13.6 Strategic Outlook
16.14 Hitachi, Ltd
16.14.1 Company Snapshot
16.14.2 Company Overview
16.14.3 Financial Analysis
16.14.4 Net Revenue, 2018-2022
16.14.4.1 Regional Revenue Share, 2022 (%)
16.14.4.2 Business Segment Revenue Share, 2022 (%)
16.14.5 Product Benchmarking
16.14.6 Strategic Outlook
16.15 Foster Wheeler AG
16.15.1 Company Snapshot
16.15.2 Company Overview
16.15.3 Product Benchmarking
16.15.4 Strategic Outlook
16.16 Rambøll Group A/S
16.16.1 Company Snapshot
16.16.2 Company Overview
16.16.3 Product Benchmarking
16.16.4 Strategic Outlook
16.17 C&G Environmental Protection Holdings Limited
16.17.1 Company Snapshot
16.17.2 Company Overview
16.17.3 Product Benchmarking
16.17.4 Strategic Outlook
17 Conclusion and Recommendations
17.1 Concluding Remarks from Visiongain
17.2 Recommendations for Market Players
ページTOPに戻る
List of Tables/Graphs
List of Tables
Table 1 Waste to Energy Market Snapshot, 2024 & 2034 (US US$Million, MWe, MTPA, CAGR %)
Table 2 Global Waste-to-Energy (WtE) CAPEX Market by Country, 2024-2034 (US US$Mn, AGR (%), CAGR (%), Cumulative)
Table 3 Global Waste-to-Energy (WtE) CAPEX Market by Country, 2024-2034 (US US$Mn, AGR (%), CAGR (%), Cumulative)
Table 4 Global Waste-to-Energy (WtE) CAPEX Market by Country, 2024-2034 (US US$Mn, AGR (%), CAGR (%), Cumulative)
Table 5 Global Waste-to-Energy (WtE) CAPEX Market by Country, 2024-2034 (US US$Mn, AGR (%), CAGR (%), Cumulative)
Table 6 Global Waste-to-Energy (WtE) Market Forecast by Energy Generation, 2024-2034 (MWe, AGR (%), CAGR (%), Cumulative)
Table 7 Global Waste-to-Energy (WtE) Market Forecast by CAPEX, 2024-2034 (US US$Mn, AGR (%), CAGR (%), Cumulative)
Table 8 Global Waste-to-Energy (WtE) Market Forecast by Capacity, 2024-2034 (MTPA, AGR (%), CAGR (%), Cumulative)
Table 9 Global Waste-to-Energy (WtE) Market Forecast, 2024-2034 (No. of Units, AGR (%), CAGR (%), Cumulative)
Table 10 Global Waste-to-Energy (WtE) Market Forecast by Plant Status, 2024-2034 (Plant Units, AGR (%), CAGR (%), Cumulative)
Table 11 Global Waste-to-Energy (WtE) Market by Technology, 2024-2034 (MTPA, AGR (%), CAGR (%), Cumulative)
Table 12 Global Waste-to-Energy (WtE) Market by End-Use, 2024-2034 (MWe, AGR (%), CAGR (%), Cumulative)
Table 13 Global Waste-to-Energy (WtE) Market by Country, 2024-2034 (MWe, AGR (%), CAGR (%), Cumulative)
Table 14 U.S. Local Name of the Plant
Table 15 US Waste-to-Energy (WtE) Market Forecast by Energy Generation, 2024-2034 (MWe, AGR (%), CAGR (%), Cumulative)
Table 16 US Waste-to-Energy (WtE) Market Forecast by CAPEX, 2024-2034 (US US$Mn, AGR (%), CAGR (%), Cumulative)
Table 17 US Waste-to-Energy (WtE) Market Forecast by Capacity, 2024-2034 (MTPA, AGR (%), CAGR (%), Cumulative)
Table 18 US Waste-to-Energy (WtE) Market Forecast, 2024-2034 (No. of Units, AGR (%), CAGR (%), Cumulative)
Table 19 US Waste-to-Energy (WtE) Market Forecast by Plant Status, 2024-2034 (Plant Units, AGR (%), CAGR (%), Cumulative)
Table 20 US Waste-to-Energy (WtE) Market by Technology, 2024-2034 (MTPA, AGR (%), CAGR (%), Cumulative)
Table 21 US Waste-to-Energy (WtE) Market by End-Use, 2024-2034 (MWe, AGR (%), CAGR (%), Cumulative)
Table 22 U.K. Local Name of the Plant
Table 23 UK Waste-to-Energy (WtE) Market Forecast by Energy Generation, 2024-2034 (MWe, AGR (%), CAGR (%), Cumulative)
Table 24 UK Waste-to-Energy (WtE) Market Forecast by CAPEX, 2024-2034 (UKD Mn, AGR (%), CAGR (%), Cumulative)
Table 25 UK Waste-to-Energy (WtE) Market Forecast by Capacity, 2024-2034 (MTPA, AGR (%), CAGR (%), Cumulative)
Table 26 UK Waste-to-Energy (WtE) Market Forecast, 2024-2034 (No. of Units, AGR (%), CAGR (%), Cumulative)
Table 27 UK Waste-to-Energy (WtE) Market Forecast by Plant Status, 2024-2034 (Plant Units, AGR (%), CAGR (%), Cumulative)
Table 28 UK Waste-to-Energy (WtE) Market by Technology, 2024-2034 (MTPA, AGR (%), CAGR (%), Cumulative)
Table 29 UK Waste-to-Energy (WtE) Market by End-Use, 2024-2034 (MWe, AGR (%), CAGR (%), Cumulative)
Table 30 Germany Local name of the Plant
Table 31 Germany Waste-to-Energy (WtE) Market Forecast by Energy Generation, 2024-2034 (MWe, AGR (%), CAGR (%), Cumulative)
Table 32 Germany Waste-to-Energy (WtE) Market Forecast by CAPEX, 2024-2034 (Germany Mn, AGR (%), CAGR (%), Cumulative)
Table 33 Germany Waste-to-Energy (WtE) Market Forecast by Capacity, 2024-2034 (MTPA, AGR (%), CAGR (%), Cumulative)
Table 34 Germany Waste-to-Energy (WtE) Market Forecast, 2024-2034 (No. of Units, AGR (%), CAGR (%), Cumulative)
Table 35 Germany Waste-to-Energy (WtE) Market Forecast by Plant Status, 2024-2034 (Plant Units, AGR (%), CAGR (%), Cumulative)
Table 36 Germany Waste-to-Energy (WtE) Market by Technology, 2024-2034 (MTPA, AGR (%), CAGR (%), Cumulative)
Table 37 Germany Waste-to-Energy (WtE) Market by End-Use, 2024-2034 (MWe, AGR (%), CAGR (%), Cumulative)
Table 38 France Local Name of the Plant
Table 39 France Waste-to-Energy (WtE) Market Forecast by Energy Generation, 2024-2034 (MWe, AGR (%), CAGR (%), Cumulative)
Table 40 France Waste-to-Energy (WtE) Market Forecast by CAPEX, 2024-2034 (FranceD Mn, AGR (%), CAGR (%), Cumulative)
Table 41 France Waste-to-Energy (WtE) Market Forecast by Capacity, 2024-2034 (MTPA, AGR (%), CAGR (%), Cumulative)
Table 42 France Waste-to-Energy (WtE) Market Forecast, 2024-2034 (No. of Units, AGR (%), CAGR (%), Cumulative)
Table 43 France Waste-to-Energy (WtE) Market Forecast by Plant Status, 2024-2034 (Plant Units, AGR (%), CAGR (%), Cumulative)
Table 44 France Waste-to-Energy (WtE) Market by Technology, 2024-2034 (MTPA, AGR (%), CAGR (%), Cumulative)
Table 45 France Waste-to-Energy (WtE) Market by End-Use, 2024-2034 (MWe, AGR (%), CAGR (%), Cumulative)
Table 46 Netherlands Local Name of the Plants
Table 47 Netherlands Waste-to-Energy (WtE) Market Forecast by Energy Generation, 2024-2034 (MWe, AGR (%), CAGR (%), Cumulative)
Table 48 Netherlands Waste-to-Energy (WtE) Market Forecast by CAPEX, 2024-2034 (NetherlandsD Mn, AGR (%), CAGR (%), Cumulative)
Table 49 Netherlands Waste-to-Energy (WtE) Market Forecast by Capacity, 2024-2034 (MTPA, AGR (%), CAGR (%), Cumulative)
Table 50 Netherlands Waste-to-Energy (WtE) Market Forecast, 2024-2034 (No. of Units, AGR (%), CAGR (%), Cumulative)
Table 51 Netherlands Waste-to-Energy (WtE) Market Forecast by Plant Status, 2024-2034 (Plant Units, AGR (%), CAGR (%), Cumulative)
Table 52 Netherlands Waste-to-Energy (WtE) Market by Technology, 2024-2034 (MTPA, AGR (%), CAGR (%), Cumulative)
Table 53 Netherlands Waste-to-Energy (WtE) Market by End-Use, 2024-2034 (MWe, AGR (%), CAGR (%), Cumulative)
Table 54 China Local Name of the Plant
Table 55 China Waste-to-Energy (WtE) Market Forecast by Energy Generation, 2024-2034 (MWe, AGR (%), CAGR (%), Cumulative)
Table 56 China Waste-to-Energy (WtE) Market Forecast by CAPEX, 2024-2034 (ChinaD Mn, AGR (%), CAGR (%), Cumulative)
Table 57 China Waste-to-Energy (WtE) Market Forecast by Capacity, 2024-2034 (MTPA, AGR (%), CAGR (%), Cumulative)
Table 58 China Waste-to-Energy (WtE) Market Forecast, 2024-2034 (No. of Units, AGR (%), CAGR (%), Cumulative)
Table 59 China Waste-to-Energy (WtE) Market Forecast by Plant Status, 2024-2034 (Plant Units, AGR (%), CAGR (%), Cumulative)
Table 60 China Waste-to-Energy (WtE) Market by Technology, 2024-2034 (MTPA, AGR (%), CAGR (%), Cumulative)
Table 61 China Waste-to-Energy (WtE) Market by End-Use, 2024-2034 (MWe, AGR (%), CAGR (%), Cumulative)
Table 62 Japan Local Name of the Plant
Table 63 Japan Waste-to-Energy (WtE) Market Forecast by Energy Generation, 2024-2034 (MWe, AGR (%), CAGR (%), Cumulative)
Table 64 Japan Waste-to-Energy (WtE) Market Forecast by CAPEX, 2024-2034 (Japan Mn, AGR (%), CAGR (%), Cumulative)
Table 65 Japan Waste-to-Energy (WtE) Market Forecast by Capacity, 2024-2034 (MTPA, AGR (%), CAGR (%), Cumulative)
Table 66 Japan Waste-to-Energy (WtE) Market Forecast, 2024-2034 (No. of Units, AGR (%), CAGR (%), Cumulative)
Table 67 Japan Waste-to-Energy (WtE) Market Forecast by Plant Status, 2024-2034 (Plant Units, AGR (%), CAGR (%), Cumulative)
Table 68 Japan Waste-to-Energy (WtE) Market by Technology, 2024-2034 (MTPA, AGR (%), CAGR (%), Cumulative)
Table 69 Japan Waste-to-Energy (WtE) Market by End-Use, 2024-2034 (MWe, AGR (%), CAGR (%), Cumulative)
Table 70 India Local Name of the Plant
Table 71 India Waste-to-Energy (WtE) Market Forecast by Energy Generation, 2024-2034 (MWe, AGR (%), CAGR (%), Cumulative)
Table 72 India Waste-to-Energy (WtE) Market Forecast by CAPEX, 2024-2034 (IndiaD Mn, AGR (%), CAGR (%), Cumulative)
Table 73 India Waste-to-Energy (WtE) Market Forecast by Capacity, 2024-2034 (MTPA, AGR (%), CAGR (%), Cumulative)
Table 74 India Waste-to-Energy (WtE) Market Forecast, 2024-2034 (No. of Units, AGR (%), CAGR (%), Cumulative)
Table 75 India Waste-to-Energy (WtE) Market Forecast by Plant Status, 2024-2034 (Plant Units, AGR (%), CAGR (%), Cumulative)
Table 76 India Waste-to-Energy (WtE) Market by Technology, 2024-2034 (MTPA, AGR (%), CAGR (%), Cumulative)
Table 77 India Waste-to-Energy (WtE) Market by End-Use, 2024-2034 (MWe, AGR (%), CAGR (%), Cumulative)
Table 78 Singapore Local name of the Plant
Table 79 Singapore Waste-to-Energy (WtE) Market Forecast by Energy Generation, 2024-2034 (MWe, AGR (%), CAGR (%), Cumulative)
Table 80 Singapore Waste-to-Energy (WtE) Market Forecast by CAPEX, 2024-2034 (Singapore Mn, AGR (%), CAGR (%), Cumulative)
Table 81 Singapore Waste-to-Energy (WtE) Market Forecast by Capacity, 2024-2034 (MTPA, AGR (%), CAGR (%), Cumulative)
Table 82 Singapore Waste-to-Energy (WtE) Market Forecast, 2024-2034 (No. of Units, AGR (%), CAGR (%), Cumulative)
Table 83 Singapore Waste-to-Energy (WtE) Market Forecast by Plant Status, 2024-2034 (Plant Units, AGR (%), CAGR (%), Cumulative)
Table 84 Singapore Waste-to-Energy (WtE) Market by Technology, 2024-2034 (MTPA, AGR (%), CAGR (%), Cumulative)
Table 85 Singapore Waste-to-Energy (WtE) Market by End-Use, 2024-2034 (MWe, AGR (%), CAGR (%), Cumulative)
Table 86 Thailand Local Name of the Plant
Table 87 Thailand Waste-to-Energy (WtE) Market Forecast by Energy Generation, 2024-2034 (MWe, AGR (%), CAGR (%), Cumulative)
Table 88 Thailand Waste-to-Energy (WtE) Market Forecast by CAPEX, 2024-2034 (Thailand Mn, AGR (%), CAGR (%), Cumulative)
Table 89 Thailand Waste-to-Energy (WtE) Market Forecast by Capacity, 2024-2034 (MTPA, AGR (%), CAGR (%), Cumulative)
Table 90 Thailand Waste-to-Energy (WtE) Market Forecast, 2024-2034 (No. of Units, AGR (%), CAGR (%), Cumulative)
Table 91 Thailand Waste-to-Energy (WtE) Market Forecast by Plant Status, 2024-2034 (Plant Units, AGR (%), CAGR (%), Cumulative)
Table 92 Thailand Waste-to-Energy (WtE) Market by Technology, 2024-2034 (MTPA, AGR (%), CAGR (%), Cumulative)
Table 93 Thailand Waste-to-Energy (WtE) Market by End-Use, 2024-2034 (MWe, AGR (%), CAGR (%), Cumulative)
Table 94 Austria Local name of the Plant
Table 95 Switzerland Local Name of the Plant
Table 96 Italy Local name of the Plant
Table 97 Norway Local name of the Plant
Table 98 Sweden Local name of the Plant
Table 99 Belgium Local name of the Plant
Table 100 Rest of World Waste-to-Energy (WtE) Market Forecast by Energy Generation, 2024-2034 (MWe, AGR (%), CAGR (%), Cumulative)
Table 101 Rest of World Waste-to-Energy (WtE) Market Forecast by CAPEX, 2024-2034 (Rest of WorldD Mn, AGR (%), CAGR (%), Cumulative)
Table 102 Rest of World Waste-to-Energy (WtE) Market Forecast by Capacity, 2024-2034 (MTPA, AGR (%), CAGR (%), Cumulative)
Table 103 Rest of World Waste-to-Energy (WtE) Market Forecast, 2024-2034 (No. of Units, AGR (%), CAGR (%), Cumulative)
Table 104 Rest of World Waste-to-Energy (WtE) Market Forecast by Plant Status, 2024-2034 (Plant Units, AGR (%), CAGR (%), Cumulative)
Table 105 Rest of World Waste-to-Energy (WtE) Market by Technology, 2024-2034 (MTPA, AGR (%), CAGR (%), Cumulative)
Table 106 Rest of World Waste-to-Energy (WtE) Market by End-Use, 2024-2034 (MWe, AGR (%), CAGR (%), Cumulative)
Table 107 Strategic Outlook - Contract
Table 108 Waste Management, Inc.: Key Details, (CEO, HQ, Revenue, Founded, No. of Employees, Company Type, Website, Business Segment)
Table 109 Waste Management, Inc.: Product Benchmarking
Table 110 Waste Management, Inc.: Strategic Outlook
Table 111 Veolia Environmental Services: Key Details, (CEO, HQ, Revenue, Founded, No. of Employees, Company Type, Website, Business Segment)
Table 112 Veolia Environmental Services: Product Benchmarking
Table 113 Veolia Environmental Services: Strategic Outlook
Table 114 Covanta Holding Corporation: Key Details, (CEO, HQ, Revenue, Founded, No. of Employees, Company Type, Website, Business Segment)
Table 115 Covanta Holding Corporation: Product Benchmarking
Table 116 Covanta Holding Corporation: Strategic Outlook
Table 117 Suez SA: Key Details, (CEO, HQ, Revenue, Founded, No. of Employees, Company Type, Website, Business Segment)
Table 118 Suez SA: Product Benchmarking
Table 119 Suez SA: Strategic Outlook
Table 120 Babcock & Wilcox Enterprises, Inc.: Key Details, (CEO, HQ, Revenue, Founded, No. of Employees, Company Type, Website, Business Segment)
Table 121 Babcock & Wilcox Enterprises, Inc.: Product Benchmarking
Table 122 Babcock & Wilcox Enterprises, Inc.: Strategic Outlook
Table 123 Keppel Seghers Engineering Singapore Pte Ltd.: Key Details, (CEO, HQ, Revenue, Founded, No. of Employees, Company Type, Website, Business Segment)
Table 124 Keppel Seghers Engineering Singapore Pte Ltd.: Product Benchmarking
Table 125 Keppel Seghers Engineering Singapore Pte Ltd.: Strategic Outlook
Table 126 Wheelabrator Technologies Inc: Key Details, (CEO, HQ, Revenue, Founded, No. of Employees, Company Type, Website, Business Segment)
Table 127 Wheelabrator Technologies Inc: Product Benchmarking
Table 128 Wheelabrator Technologies Inc: Strategic Outlook
Table 129 Martin Environmental Services: Key Details, (CEO, HQ, Revenue, Founded, No. of Employees, Company Type, Website, Business Segment)
Table 130 Martin Environmental Services: Product Benchmarking
Table 131 Martin Environmental Services: Strategic Outlook
Table 132 Viridor Waste Management Ltd. Key Details, (CEO, HQ, Revenue, Founded, No. of Employees, Company Type, Website, Business Segment)
Table 133 Viridor Waste Management Ltd.: Product Benchmarking
Table 134 Viridor Waste Management Ltd.: Strategic Outlook
Table 135 Abu Dhabi National Energy Company, PJSC (TAQA: Key Details, (CEO, HQ, Revenue, Founded, No. of Employees, Company Type, Website, Business Segment)
Table 136 Abu Dhabi National Energy Company, PJSC (TAQA: Product Benchmarking
Table 137 Abu Dhabi National Energy Company, PJSC (TAQA: Strategic Outlook
Table 138 Mitsubishi Heavy Industries Environmental & Chemical Engineering Co., Ltd.: Key Details, (CEO, HQ, Revenue, Founded, No. of Employees, Company Type, Website, Business Segment)
Table 139 Mitsubishi Heavy Industries Environmental & Chemical Engineering Co., Ltd.: Product Benchmarking
Table 140 Mitsubishi Heavy Industries Environmental & Chemical Engineering Co., Ltd.: Strategic Outlook
Table 141 Hitachi, Ltd: Key Details, (CEO, HQ, Revenue, Founded, No. of Employees, Company Type, Website, Business Segment)
Table 142 Hitachi, Ltd: Product Benchmarking
Table 143 Hitachi, Ltd: Strategic Outlook
Table 144 Foster Wheeler AG: Key Details, (CEO, HQ, Revenue, Founded, No. of Employees, Company Type, Website, Business Segment)
Table 145 Foster Wheeler AG: Product Benchmarking
Table 146 Foster Wheeler AG: Strategic Outlook
Table 147 Rambøll Group A/S: Key Details, (CEO, HQ, Revenue, Founded, No. of Employees, Company Type, Website, Business Segment)
Table 148 Rambøll Group A/S: Product Benchmarking
Table 149 Rambøll Group A/S: Strategic Outlook
Table 150 C&G Environmental Protection Holdings Limited: Key Details, (CEO, HQ, Revenue, Founded, No. of Employees, Company Type, Website, Business Segment)
Table 151 C&G Environmental Protection Holdings Limited: Product Benchmarking
Table 152 C&G Environmental Protection Holdings Limited: Strategic Outlook
List of Figures
Figure 1 Waste to Energy Market Segmentation
Figure 2 Waste to Energy Market: Market Dynamics
Figure 3 Waste to Energy Market: Porter’s Five Forces Analysis
Figure 4 Global Waste-to-Energy (WtE) CAPEX Market by Country, 2024-2034 (US US$Mn, AGR (%)), Cumulative)
Figure 5 Global Waste-to-Energy (WtE) CAPEX Market by Country, 2024-2034 (US US$Mn, AGR (%), Cumulative)
Figure 6 Global Waste-to-Energy (WtE) CAPEX Market by Country, 2024-2034 (US US$Mn, AGR (%)), Cumulative)
Figure 7 Global Waste-to-Energy (WtE) CAPEX Market by Country, 2024-2034 (US US$Mn, AGR (%), Cumulative)
Figure 8 Waste to Energy Market: PEST Analysis
Figure 9 Global Waste-to-Energy (WtE) Market Forecast by Energy Generation, 2024-2034 (MWe, AGR (%), Cumulative)
Figure 10 Global Waste-to-Energy (WtE) Market Forecast by CAPEX, 2024-2034 (US US$Mn, AGR (%), Cumulative)
Figure 11 Global Waste-to-Energy (WtE) Market Forecast by Capacity, 2024-2034 (MTPA, AGR (%), Cumulative)
Figure 12 Global Waste-to-Energy (WtE) Market Forecast, 2024-2034 (No. of Units, AGR (%), Cumulative)
Figure 13 Global Waste-to-Energy (WtE) Market Forecast by Plant Status, 2024-2034 (Plant Units, AGR (%), Cumulative)
Figure 14 Global Waste-to-Energy (WtE) Market by Technology, 2024-2034 (MTPA, AGR (%), Cumulative)
Figure 15 Global Waste-to-Energy (WtE) Market by End-Use, 2024-2034 (MWe, AGR (%), Cumulative)
Figure 16 Waste to Energy Market by Country, 2024-2034 (US US$Million, AGR %)
Figure 17 US Waste-to-Energy (WtE) Market Forecast by Energy Generation, 2024-2034 (MWe, AGR (%), Cumulative)
Figure 18 US Waste-to-Energy (WtE) Market Forecast by CAPEX, 2024-2034 (US US$Mn, AGR (%), Cumulative)
Figure 19 US Waste-to-Energy (WtE) Market Forecast by Capacity, 2024-2034 (MTPA, AGR (%), Cumulative)
Figure 20 US Waste-to-Energy (WtE) Market Forecast, 2024-2034 (No. of Units, AGR (%), Cumulative)
Figure 21 US Waste-to-Energy (WtE) Market Forecast by Plant Status, 2024-2034 (Plant Units, AGR (%), Cumulative)
Figure 22 US Waste-to-Energy (WtE) Market by Technology, 2024-2034 (MTPA, AGR (%), Cumulative)
Figure 23 US Waste-to-Energy (WtE) Market by End-Use, 2024-2034 (MWe, AGR (%), Cumulative)
Figure 24 UK Waste-to-Energy (WtE) Market Forecast by Energy Generation, 2024-2034 (MWe, AGR (%), Cumulative)
Figure 25 UK Waste-to-Energy (WtE) Market Forecast by CAPEX, 2024-2034 (UKD Mn, AGR (%), Cumulative)
Figure 26 UK Waste-to-Energy (WtE) Market Forecast by Capacity, 2024-2034 (MTPA, AGR (%), Cumulative)
Figure 27 UK Waste-to-Energy (WtE) Market Forecast, 2024-2034 (No. of Units, AGR (%), Cumulative)
Figure 28 UK Waste-to-Energy (WtE) Market Forecast by Plant Status, 2024-2034 (Plant Units, AGR (%), Cumulative)
Figure 29 UK Waste-to-Energy (WtE) Market by Technology, 2024-2034 (MTPA, AGR (%), Cumulative)
Figure 30 UK Waste-to-Energy (WtE) Market by End-Use, 2024-2034 (MWe, AGR (%), Cumulative)
Figure 31 Germany Waste-to-Energy (WtE) Market Forecast by Energy Generation, 2024-2034 (MWe, AGR (%), Cumulative)
Figure 32 Germany Waste-to-Energy (WtE) Market Forecast by CAPEX, 2024-2034 (Germany Mn, AGR (%), Cumulative)
Figure 33 Germany Waste-to-Energy (WtE) Market Forecast by Capacity, 2024-2034 (MTPA, AGR (%), Cumulative)
Figure 34 Germany Waste-to-Energy (WtE) Market Forecast, 2024-2034 (No. of Units, AGR (%), Cumulative)
Figure 35 Germany Waste-to-Energy (WtE) Market Forecast by Plant Status, 2024-2034 (Plant Units, AGR (%), Cumulative)
Figure 36 Germany Waste-to-Energy (WtE) Market by Technology, 2024-2034 (MTPA, AGR (%), Cumulative)
Figure 37 Germany Waste-to-Energy (WtE) Market by End-Use, 2024-2034 (MWe, AGR (%), Cumulative)
Figure 38 France Waste-to-Energy (WtE) Market Forecast by Energy Generation, 2024-2034 (MWe, AGR (%), Cumulative)
Figure 39 France Waste-to-Energy (WtE) Market Forecast by CAPEX, 2024-2034 (FranceD Mn, AGR (%), Cumulative)
Figure 40 France Waste-to-Energy (WtE) Market Forecast by Capacity, 2024-2034 (MTPA, AGR (%), Cumulative)
Figure 41 France Waste-to-Energy (WtE) Market Forecast, 2024-2034 (No. of Units, AGR (%), Cumulative)
Figure 42 France Waste-to-Energy (WtE) Market Forecast by Plant Status, 2024-2034 (Plant Units, AGR (%), Cumulative)
Figure 43 France Waste-to-Energy (WtE) Market by Technology, 2024-2034 (MTPA, AGR (%), Cumulative)
Figure 44 France Waste-to-Energy (WtE) Market by End-Use, 2024-2034 (MWe, AGR (%), Cumulative)
Figure 45 Netherlands Waste-to-Energy (WtE) Market Forecast by Energy Generation, 2024-2034 (MWe, AGR (%), Cumulative)
Figure 46 Netherlands Waste-to-Energy (WtE) Market Forecast by CAPEX, 2024-2034 (NetherlandsD Mn, AGR (%), Cumulative)
Figure 47 Netherlands Waste-to-Energy (WtE) Market Forecast by Capacity, 2024-2034 (MTPA, AGR (%), Cumulative)
Figure 48 Netherlands Waste-to-Energy (WtE) Market Forecast, 2024-2034 (No. of Units, AGR (%), Cumulative)
Figure 49 Netherlands Waste-to-Energy (WtE) Market Forecast by Plant Status, 2024-2034 (Plant Units, AGR (%), Cumulative)
Figure 50 Netherlands Waste-to-Energy (WtE) Market by Technology, 2024-2034 (MTPA, AGR (%), Cumulative)
Figure 51 Netherlands Waste-to-Energy (WtE) Market by End-Use, 2024-2034 (MWe, AGR (%), Cumulative)
Figure 52 China Waste-to-Energy (WtE) Market Forecast by Energy Generation, 2024-2034 (MWe, AGR (%), Cumulative)
Figure 53 China Waste-to-Energy (WtE) Market Forecast by CAPEX, 2024-2034 (ChinaD Mn, AGR (%), Cumulative)
Figure 54 China Waste-to-Energy (WtE) Market Forecast by Capacity, 2024-2034 (MTPA, AGR (%), Cumulative)
Figure 55 China Waste-to-Energy (WtE) Market Forecast, 2024-2034 (No. of Units, AGR (%), Cumulative)
Figure 56 China Waste-to-Energy (WtE) Market Forecast by Plant Status, 2024-2034 (Plant Units, AGR (%), Cumulative)
Figure 57 China Waste-to-Energy (WtE) Market by Technology, 2024-2034 (MTPA, AGR (%), Cumulative)
Figure 58 China Waste-to-Energy (WtE) Market by End-Use, 2024-2034 (MWe, AGR (%), Cumulative)
Figure 59 Japan Waste-to-Energy (WtE) Market Forecast by Energy Generation, 2024-2034 (MWe, AGR (%), Cumulative)
Figure 60 Japan Waste-to-Energy (WtE) Market Forecast by CAPEX, 2024-2034 (JapanD Mn, AGR (%), Cumulative)
Figure 61 Japan Waste-to-Energy (WtE) Market Forecast by Capacity, 2024-2034 (MTPA, AGR (%), Cumulative)
Figure 62 Japan Waste-to-Energy (WtE) Market Forecast, 2024-2034 (No. of Units, AGR (%), Cumulative)
Figure 63 Japan Waste-to-Energy (WtE) Market Forecast, 2024-2034 (No. of Units, AGR (%), Cumulative)
Figure 64 Japan Waste-to-Energy (WtE) Market by Technology, 2024-2034 (MTPA, AGR (%), Cumulative)
Figure 65 Japan Waste-to-Energy (WtE) Market by End-Use, 2024-2034 (MWe, AGR (%), Cumulative)
Figure 66 India Waste-to-Energy (WtE) Market Forecast by Energy Generation, 2024-2034 (MWe, AGR (%), Cumulative)
Figure 67 India Waste-to-Energy (WtE) Market Forecast by CAPEX, 2024-2034 (IndiaD Mn, AGR (%), Cumulative)
Figure 68 India Waste-to-Energy (WtE) Market Forecast by Capacity, 2024-2034 (MTPA, AGR (%), Cumulative)
Figure 69 India Waste-to-Energy (WtE) Market Forecast, 2024-2034 (No. of Units, AGR (%), Cumulative)
Figure 70 India Waste-to-Energy (WtE) Market Forecast by Plant Status, 2024-2034 (Plant Units, AGR (%), Cumulative)
Figure 71 India Waste-to-Energy (WtE) Market by Technology, 2024-2034 (MTPA, AGR (%), Cumulative)
Figure 72 India Waste-to-Energy (WtE) Market by End-Use, 2024-2034 (MWe, AGR (%), Cumulative)
Figure 73 Singapore Waste-to-Energy (WtE) Market Forecast by Energy Generation, 2024-2034 (MWe, AGR (%), Cumulative)
Figure 74 Singapore Waste-to-Energy (WtE) Market Forecast by CAPEX, 2024-2034 (SingaporeD Mn, AGR (%), Cumulative)
Figure 75 Singapore Waste-to-Energy (WtE) Market Forecast by Capacity, 2024-2034 (MTPA, AGR (%), Cumulative)
Figure 76 Singapore Waste-to-Energy (WtE) Market Forecast, 2024-2034 (No. of Units, AGR (%), Cumulative)
Figure 77 Singapore Waste-to-Energy (WtE) Market Forecast by Plant Status, 2024-2034 (Plant Units, AGR (%), Cumulative)
Figure 78 Singapore Waste-to-Energy (WtE) Market by Technology, 2024-2034 (MTPA, AGR (%), Cumulative)
Figure 79 Singapore Waste-to-Energy (WtE) Market by End-Use, 2024-2034 (MWe, AGR (%), Cumulative)
Figure 80 Thailand Waste-to-Energy (WtE) Market Forecast by Energy Generation, 2024-2034 (MWe, AGR (%), Cumulative)
Figure 81 Thailand Waste-to-Energy (WtE) Market Forecast by CAPEX, 2024-2034 (Thailand Mn, AGR (%), Cumulative)
Figure 82 Thailand Waste-to-Energy (WtE) Market Forecast by Capacity, 2024-2034 (MTPA, AGR (%), Cumulative)
Figure 83 Thailand Waste-to-Energy (WtE) Market Forecast, 2024-2034 (No. of Units, AGR (%), Cumulative)
Figure 84 Thailand Waste-to-Energy (WtE) Market Forecast by Plant Status, 2024-2034 (Plant Units, AGR (%), Cumulative)
Figure 85 Thailand Waste-to-Energy (WtE) Market by Technology, 2024-2034 (MTPA, AGR (%), Cumulative)
Figure 86 Thailand Waste-to-Energy (WtE) Market by End-Use, 2024-2034 (MWe, AGR (%), Cumulative)
Figure 87 Rest of World Waste-to-Energy (WtE) Market Forecast by Energy Generation, 2024-2034 (MWe, AGR (%), Cumulative)
Figure 88 Rest of World Waste-to-Energy (WtE) Market Forecast by CAPEX, 2024-2034 (Rest of WorldD Mn, AGR (%), Cumulative)
Figure 89 Rest of World Waste-to-Energy (WtE) Market Forecast by Capacity, 2024-2034 (MTPA, AGR (%), Cumulative)
Figure 90 Rest of World Waste-to-Energy (WtE) Market Forecast, 2024-2034 (No. of Units, AGR (%), Cumulative)
Figure 91 Rest of World Waste-to-Energy (WtE) Market Forecast by Plant Status, 2024-2034 (Plant Units, AGR (%), Cumulative)
Figure 92 Rest of World Waste-to-Energy (WtE) Market by Technology, 2024-2034 (MTPA, AGR (%), Cumulative)
Figure 93 Rest of World Waste-to-Energy (WtE) Market by End-Use, 2024-2034 (MWe, AGR (%), Cumulative)
Figure 94 Waste to Energy Market: Company Share, 2022
Figure 95 Waste Management, Inc..: Net Revenue, 2018-2022 (US US$Million, AGR%)
Figure 96 Waste Management, Inc..: Regional Revenue Share, 2022 (%)
Figure 97 Waste Management, Inc..: Business Segment Revenue Share, 2022 (%)
Figure 98 Veolia Environmental Services.: Net Revenue, 2018-2022 (US US$Million, AGR%)
Figure 99 Babcock & Wilcox Enterprises, Inc..: Net Revenue, 2018-2022 (US US$Million, AGR%)
Figure 100 Babcock & Wilcox Enterprises, Inc..: R&D, 2018-2022 (US US$Million, AGR%)
Figure 101 Babcock & Wilcox Enterprises, Inc..: Regional Revenue Share, 2022 (%)
Figure 102 Babcock & Wilcox Enterprises, Inc..: Business Segment Revenue Share, 2022 (%)
Figure 103 Mitsubishi Heavy Industries Environmental & Chemical Engineering Co., Ltd..: Net Revenue, 2018-2022 (US US$Million, AGR%)
Figure 104 Mitsubishi Heavy Industries Environmental & Chemical Engineering Co., Ltd..: R&D, 2018-2022 (US US$Million, AGR%)
Figure 105 Mitsubishi Heavy Industries Environmental & Chemical Engineering Co., Ltd..: Regional Revenue Share, 2022 (%)
Figure 106 Mitsubishi Heavy Industries Environmental & Chemical Engineering Co., Ltd..: Business Segment Revenue Share, 2022 (%)
Figure 107 Hitachi, Ltd.: Net Revenue, 2018-2022 (US US$Million, AGR%)
Figure 108 Hitachi, Ltd.: Regional Revenue Share, 2022 (%)
Figure 109 Hitachi, Ltd.: Business Segment Revenue Share, 2022 (%)
ページTOPに戻る
本レポートと同分野(再生可能エネルギー)の最新刊レポート
Visiongain社のエネルギーと資源分野での最新刊レポート
本レポートと同じKEY WORD(waste)の最新刊レポート
よくあるご質問
Visiongain社はどのような調査会社ですか?
英国の調査会社ヴィジョンゲイン社(Visiongain)は、通信とエネルギーのほか、自動車や化学・医薬品、金属など、広範な市場を対象に調査を行っています。自動車市場については、市場全般に関する調査のほ... もっと見る
調査レポートの納品までの日数はどの程度ですか?
在庫のあるものは速納となりますが、平均的には 3-4日と見て下さい。
但し、一部の調査レポートでは、発注を受けた段階で内容更新をして納品をする場合もあります。
発注をする前のお問合せをお願いします。
注文の手続きはどのようになっていますか?
1)お客様からの御問い合わせをいただきます。
2)見積書やサンプルの提示をいたします。
3)お客様指定、もしくは弊社の発注書をメール添付にて発送してください。
4)データリソース社からレポート発行元の調査会社へ納品手配します。
5) 調査会社からお客様へ納品されます。最近は、pdfにてのメール納品が大半です。
お支払方法の方法はどのようになっていますか?
納品と同時にデータリソース社よりお客様へ請求書(必要に応じて納品書も)を発送いたします。
お客様よりデータリソース社へ(通常は円払い)の御振り込みをお願いします。
請求書は、納品日の日付で発行しますので、翌月最終営業日までの当社指定口座への振込みをお願いします。振込み手数料は御社負担にてお願いします。
お客様の御支払い条件が60日以上の場合は御相談ください。
尚、初めてのお取引先や個人の場合、前払いをお願いすることもあります。ご了承のほど、お願いします。
データリソース社はどのような会社ですか?
当社は、世界各国の主要調査会社・レポート出版社と提携し、世界各国の市場調査レポートや技術動向レポートなどを日本国内の企業・公官庁及び教育研究機関に提供しております。
世界各国の「市場・技術・法規制などの」実情を調査・収集される時には、データリソース社にご相談ください。
お客様の御要望にあったデータや情報を抽出する為のレポート紹介や調査のアドバイスも致します。
|
|

