mRNAワクチン市場レポート:2023-2033
mRNA Vaccines Market Report 2023-2033
レポート詳細
mRNAワクチン市場レポート 2023-2033年: 本レポートは、業界とその基礎となる原動力をよりよく理解したい場合、新たな収益ポケットを目指す大手企業にとって貴重なものとなるでしょう... もっと見る
※上記価格は部署ライセンス(Departmental licence)価格です。
その他の価格についてはデータリソースまでお問合せください。
日本語のページは自動翻訳を利用し作成しています。
実際のレポートは英文のみでご納品いたします。
サマリー
レポート詳細
mRNAワクチン市場レポート 2023-2033年:本レポートは、業界とその基礎となる原動力をよりよく理解したい場合、新たな収益ポケットを目指す大手企業にとって貴重なものとなるでしょう。異業種への進出や新地域での既存事業の拡大を目指す企業にも有用です。
潜在的ながん治療薬としてのmRNAワクチンについては、20年以上にわたって広範な研究が行われてきたが、その成果は限定的であった。最近になって、がんワクチンに対する研究の注目度が急上昇している。この急増は、免疫チェックポイント阻害剤の使用によって特定の悪性腫瘍に顕著かつ永続的な反応が見られたことと、技術の進歩に促されている。ペムブロリズマブ(通称キイトルーダ)と併用する個別化ワクチンmRNA-4157(V940とも呼ばれる)の第3相臨床試験の開始は、2023年7月26日にModernaとMerckによって発表された。本試験は、メラノーマに対して外科的治療を受けたことのある高リスク患者を対象に、併用療法の有効性を評価することを目的としている。本試験の目的は、ステージIIbからIVの患者を合計1,089人リクルートすることである。本試験の主要評価項目は、これらの患者の術後無再発生存率を評価することである。2029年までに決定的な結果が得られると予想される。
市場調査レポートを購入する前にすべき質問とは?
- mRNAワクチン市場はどのように進化しているのか?
- 何がmRNAワクチン市場を牽引し、抑制しているのか?
- 各mRNAワクチンサブマーケットセグメントは予測期間中にどのように成長し、2033年にはどれくらいの収益を占めるようになるのでしょうか?
- 2023年から2033年にかけて、各mRNAワクチンサブマーケットの市場シェアはどのように推移するのか?
- 2023年から2033年にかけて、市場全体を牽引する主な要因は何か?
- 主要なmRNAワクチン市場はマクロ経済ダイナミクスに概ね追随するのか、それとも各国市場が他を凌駕するのか?
- 2033年までに各国市場のシェアはどのように変化し、どの地域が2033年に市場をリードするのか?
- 主要プレイヤーは誰か、また予測期間中の見通しは?
- 主要企業のmRNAワクチンプロジェクトとは?
- 2023年から2033年の間に、業界はどのように進化するのか?現在進行中の
mRNAワクチンプロジェクトは現在、そして今後10年間でどのような意味を持つのでしょうか?
- mRNAワクチン市場をさらに拡大するために、製品化の必要性は高まっていますか?
- mRNAワクチン市場はどこへ向かい、どのようにすれば市場の最前線に立てるのか?
- 新製品やサービスラインに最適な投資オプションは?
- 企業を新たな成長軌道に乗せ、C-suiteに移行させるための重要な展望とは?
このことがmRNAワクチン市場に現在、そして今後10年間でどのような影響を与えるかを見極める必要がある:
- 215ページにわたる本レポートでは、93の表と130の図表を掲載しています。
- 本レポートでは、業界における主要な有利分野を取り上げているため、今すぐターゲットを絞ることができます。
- 世界、地域、国の売上と成長に関する詳細な分析が含まれています。
- 競合他社が成功した主なトレンド、変化、収益予測をハイライトしています。
本レポートは、mRNAワクチン市場が今後10年間でどのように発展するか、またCOVID-19の景気後退と好転の変動に合わせてどのように発展するかをお伝えします。この市場は、過去10年間のどの時点よりも今が重要です。
2033年までの予測やその他の分析から、商業的な展望が明らかになる
- 2033年までの収益予測に加え、直近の業績、成長率、市場シェアもご覧いただけます。
- ビジネスの展望と展開に関する独自の分析をご覧いただけます。
- 定性的分析(市場ダイナミクス、促進要因、機会、阻害要因など)、ポーターのファイブフォース分析、PEST分析、最近の動向をご覧いただけます。
レポート対象セグメント
ワクチンタイプ
- セルフ増幅型 mRNA ベースワクチン
- 従来の非増幅型mRNAベースワクチン
用途
- 癌
- 感染症
- 自己免疫疾患
- その他
エンドユーザー
- 病院およびクリニック
- 研究機関
- その他
世界市場全体と各分野の収益予測に加え、5つの地域と22の主要国市場の収益予測も掲載している:
北米
- アメリカ
- カナダ
欧州
- ドイツ
- 英国
- フランス
- イタリア
- スペイン
- ロシア
- その他の欧州
アジア太平洋
- 日本
- 中国
- インド
- オーストラリア
- 韓国
- 東南アジア
- その他のアジア太平洋地域
ラテンアメリカ
- ブラジル
- メキシコ
- その他のラテンアメリカ
MEA
- GCC
- 南アフリカ
- その他のMEA
本レポートでは、mRNAワクチン市場の2023年から2033年にかけての主要企業のプロファイルも掲載している。
主要企業と市場成長の可能性
・ Pfizer Inc.
・ Moderna, Inc.
・ BioNTech SE
・ AstraZeneca
・ Sanofi
・ GSK plc
・ Daiichi Sankyo
・ Ethris GmbH
・ AIM Vaccine
・ Arcturus Therapeutics Inc.
・ CureVac
・ Sino Biopharmaceutical Co., Ltd.
mRNAワクチン市場全体の世界売上高(金額ベース)、2023年~2033年:2023年に117億米ドルを突破。2033年まで力強い収益成長を予測。当研究所では、最も大きな可能性を秘めた組織を特定しています。彼らの能力、進歩、商業的展望を発見し、一歩先を行くお手伝いをします。
mRNAワクチン市場、2023-2033年レポートはどのように役立ちますか?
要約すると、210ページを超えるこのレポートは、以下の知識を提供する:
- mRNAワクチン市場の2023年から2033年までの収益予測、ワクチンタイプ、用途、エンドユーザー別の予測を世界レベルと地域レベルで掲載 - 業界の将来性を発見し、投資と収益に最も有利な場所を見つけることができます。
- 5つの地域と22の主要国市場の2033年までの収益予測 - mRNAワクチン市場、北米、欧州、アジア太平洋、ラテンアメリカ、MEAの2023年から2033年までの市場予測をご覧ください。また、米国、カナダ、メキシコ、ブラジル、ドイツ、フランス、英国、イタリア、中国、インド、日本、オーストラリアなどの主要国の市場も予測しています。
- 既に市場に参入している企業やこれから参入しようとする企業の展望 - 2023年から2033年までのmRNAワクチン市場に関わる主要企業12社の企業プロファイルを含む。
独自の予測による定量的・定性的分析をご覧ください。私たちのレポートだけに含まれる情報を入手し、貴重なビジネスインテリジェンスで情報を得ることができます。
他では得られない情報
私たちの新しいレポートがあれば、知識に遅れをとったり、チャンスを逃したりする可能性が低くなります。弊社の調査レポートが貴社の調査、分析、意思決定にどのように役立つかをご覧ください。Visiongainの調査は、mRNAワクチン市場2023年から2033年の商業分析を必要とするすべての人、市場をリードする企業のためのものです。データ、トレンド、予測をご覧いただけます。
ページTOPに戻る
目次
目次
1 レポート概要
1.1 研究の目的
1.2 mRNAワクチン市場の紹介
1.3 本レポートの内容
1.4 本レポートを読むべき理由
1.5 本分析レポートが回答する主な質問は以下の通り:
1.6 本レポートは誰のためのものか?
1.7 方法論
1.7.1 市場の定義
1.7.2 市場評価・予測手法
1.7.3 データの検証
1.7.3.1 一次調査
1.7.3.2 セカンダリーリサーチ
1.8 よくある質問(FAQ)
1.9 Visiongainの関連レポート
1.10 Visiongainについて
2 エグゼクティブ・サマリー
3 市場概要
3.1 主要な調査結果
3.2 市場ダイナミクス
3.2.1 市場促進要因
3.2.1.1 COVID-19ワクチン成功後のmRNAの多様な用途の拡大
3.2.1.2 市場成長を後押しする多額の研究資金
3.2.1.3 市場成長を促進する技術的進歩
3.2.1.4 mRNAワクチンベースの臨床試験の増加
3.2.2 市場抑制要因
3.2.2.1 拡張性と費用対効果が依然として大きなボトルネックとなっている
3.2.2.2 低所得国での保管に関する大きな課題が業界の成長を阻む可能性が高い
3.2.3 市場機会
3.2.3.1 mRNAがんワクチン
3.2.3.2 分析、機械学習、クラウドデータウェアハウス
3.3 COVID-19インパクト分析
3.4 ポーターのファイブフォース分析
3.4.1 供給者パワー
3.4.2 バイヤーパワー
3.4.3 競争ライバル
3.4.4 代替品による脅威
3.4.5 新規参入企業の脅威
3.5 PEST分析
3.5.1 政治的要因
3.5.2 経済的要因
3.5.3 社会的要因
3.5.4 技術的要因
4 mRNAワクチン市場分析:ワクチンタイプ別
4.1 主要な調査結果
4.2 ワクチンタイプ別セグメント 市場魅力度指数
4.3 ワクチンタイプ別mRNAワクチン市場規模の推定と予測
4.4 自己増幅型mRNAベースワクチン
4.4.1 2023〜2033年の地域別市場予測(US$ Million, AGR %)
4.4.2 地域別市場シェア、2023年・2033年 (%)
4.5 従来の非増幅型mRNAベースワクチン
4.5.1 2023〜2033年の地域別市場予測(US$ Million, AGR %)
4.5.2 地域別市場シェア、2023年・2033年 (%)
5 mRNAワクチン市場分析:用途別
5.1 主要な調査結果
5.2 用途別セグメント 市場魅力度指数
5.3 mRNAワクチンの用途別市場規模の推定と予測
5.4 癌
5.4.1 2023〜2033年の地域別市場予測(US$ Million, AGR %)
5.4.2 地域別市場シェア、2023年・2033年 (%)
5.5 感染症
5.5.1 2023〜2033年の地域別市場予測(US$ Million, AGR %)
5.5.2 地域別市場シェア、2023年・2033年 (%)
5.6 自己免疫疾患
5.6.1 2023〜2033年の地域別市場予測(US$ Million, AGR %)
5.6.2 地域別市場シェア、2023年・2033年 (%)
5.7 その他
5.7.1 2023〜2033年の地域別市場予測(US$ Million, AGR %)
5.7.2 地域別市場シェア、2023年・2033年 (%)
6 mRNAワクチン市場分析:エンドユーザー別
6.1 主要調査結果
6.2 エンドユーザーセグメント 市場魅力度指数
6.3 mRNAワクチンのエンドユーザー別市場規模推定と予測
6.4 病院・診療所
6.4.1 2023〜2033年の地域別市場予測(US$ Million, AGR %)
6.4.2 地域別市場シェア、2023年・2033年 (%)
6.5 研究機関
6.5.1 2023~2033年の地域別市場予測(US$ Million, AGR %)
6.5.2 地域別市場シェア、2023年・2033年 (%)
6.6 その他
6.6.1 2023〜2033年の地域別市場予測(US$ Million, AGR %)
6.6.2 地域別市場シェア、2023年・2033年(%)
7 mRNAワクチン市場分析:地域別
7.1 主要な調査結果
7.2 地域別市場規模の推定と予測
8 北米のmRNAワクチンの市場分析
8.1 主要な調査結果
8.2 北米mRNAワクチン市場魅力度指数
8.3 北米のmRNAワクチン国別市場、2023年、2028年、2033年(US$ Million)
8.4 北米のmRNAワクチン市場規模推定と予測:国別
8.5 北米のmRNAワクチン市場規模推定と予測:ワクチンタイプ別
8.6 北米のmRNAワクチン市場規模推定と予測:用途別
8.7 北米のmRNAワクチン市場規模推計と予測:エンドユーザー別
8.8 アメリカmRNAワクチン市場分析
8.9 カナダのmRNAワクチン市場分析
9 欧州のmRNAワクチン市場分析
9.1 主要な調査結果
9.2 欧州のmRNAワクチン市場魅力度指数
9.3 欧州のmRNAワクチン国別市場:2023年、2028年、2033年(US$ Million)
9.4 欧州のmRNAワクチン市場規模推定と予測:国別
9.5 欧州のmRNAワクチン市場規模推定と予測:ワクチンタイプ別
9.6 欧州のmRNAワクチン市場規模推定と予測:用途別
9.7 欧州のmRNAワクチン市場規模推計と予測:エンドユーザー別
9.8 ドイツのmRNAワクチン市場分析
9.9 イギリスのmRNAワクチン市場分析
9.10 フランスのmRNAワクチン市場分析
9.11 イタリアのmRNAワクチン市場分析
9.12 スペインのmRNAワクチン市場分析
9.13 ロシアのmRNAワクチン市場分析
9.14 その他の欧州mRNAワクチン市場分析
10 アジア太平洋地域のmRNAワクチン市場分析
10.1 主要な調査結果
10.2 アジア太平洋地域のmRNAワクチン市場魅力度指数
10.3 アジア太平洋地域のmRNAワクチンの国別市場、2023年、2028年、2033年(US$ Million)
10.4 アジア太平洋地域のmRNAワクチンの市場規模推定と予測:国別
10.5 アジア太平洋地域のmRNAワクチンの市場規模推定と予測:ワクチンタイプ別
10.6 アジア太平洋地域のmRNAワクチンの市場規模推定と予測:用途別予測
10.7 アジア太平洋地域のmRNAワクチンの市場規模推計と予測:エンドユーザー別
10.8 日本のmRNAワクチン市場分析
10.9 中国のmRNAワクチン市場分析
10.10 インドのmRNAワクチン市場分析
10.11 オーストラリアのmRNAワクチン市場分析
10.12 韓国のmRNAワクチン市場分析
10.13 東南アジアのmRNAワクチン市場分析
10.14 その他のアジア太平洋地域mRNAワクチン市場分析
11 ラテンアメリカのmRNAワクチン市場分析
11.1 主要な調査結果
11.2 ラテンアメリカのmRNAワクチン市場魅力度指数
11.3 ラテンアメリカのmRNAワクチン国別市場:2023年、2028年、2033年(US$ Million)
11.4 ラテンアメリカのmRNAワクチン市場規模推定と予測:国別
11.5 ラテンアメリカのmRNAワクチン市場規模推定と予測:ワクチンタイプ別
11.6 ラテンアメリカのmRNAワクチン市場規模推定と予測:用途別
11.7 ラテンアメリカのmRNAワクチン市場規模推計と予測:エンドユーザー別
11.8 ブラジルのmRNAワクチン市場分析
11.9 メキシコのmRNAワクチン市場分析
11.10 その他のラテンアメリカmRNAワクチン市場分析
12 MEAのmRNAワクチンの市場分析
12.1 主要な調査結果
12.2 MEAのmRNAワクチン市場魅力度指数
12.3 MEAのmRNAワクチンの国別市場、2023年、2028年、2033年(US$ Million)
12.4 MEAのmRNAワクチン市場規模推定と予測:国別
12.5 MEAのmRNAワクチン市場規模推定と予測:ワクチンタイプ別
12.6 MEAのmRNAワクチン市場規模推定と予測:用途別
12.7 MEAのmRNAワクチン市場規模推定と予測:エンドユーザー別
12.8 GCCのmRNAワクチン市場分析
12.9 南アフリカのmRNAワクチン市場分析
12.10 その他のMEA mRNAワクチン市場分析
13 企業のプロフィール
13.1 Pfizer Inc.
13.1.1 会社概要
13.1.2 会社概要
13.1.3 財務分析
13.1.3.1 純収入、2015-2022年
13.1.3.2 地域市場シェア、2022年
13.1.3.3 R&D、2015-2022年
13.1.4 製品/パイプラインのベンチマーク
13.1.5 戦略的展望
13.2 Moderna, Inc.
13.2.1 会社概要
13.2.2 会社概要
13.2.3 財務分析
13.2.3.1 純収入、2016-2022年
13.2.3.2 R&D、2016-2022年
13.2.4 製品/パイプラインのベンチマーク
13.2.5 戦略的展望
13.3 BioNTech SE
13.3.1 会社概要
13.3.2 会社概要
13.3.3 財務分析
13.3.3.1 純収入、2018-2022年
13.3.3.2 R&D、2018-2022年
13.3.4 製品/パイプラインのベンチマーク
13.3.5 戦略的展望
13.4 GSK plc
13.4.1 会社概要
13.4.2 会社概要
13.4.3 財務分析
13.4.3.1 純収入、2015-2022年
13.4.3.2 地域市場シェア、2022年
13.4.3.3 R&D、2015-2022年
13.4.4 製品/パイプラインのベンチマーク
13.5 Daiichi Sankyo
13.5.1 会社概要
13.5.2 会社概要
13.5.3 製品/パイプラインのベンチマーク
13.5.4 戦略的展望
13.6 Ethris GmbH
13.6.1 会社概要
13.6.2 会社概要
13.6.3 製品/パイプラインのベンチマーキング
13.6.4 戦略的展望
13.7 AIM Vaccine
13.7.1 会社概要
13.7.2 会社概要
13.7.3 製品/パイプラインのベンチマーキング
13.7.4 戦略的展望
13.8 Arcturus Therapeutics Inc.
13.8.1 会社概要
13.8.2 会社概要
13.8.3 製品/パイプライン・ベンチマーク
13.9 CureVac
13.9.1 会社概要
13.9.2 会社概要
13.9.3 製品/パイプラインのベンチマーキング
13.9.4 戦略的展望
13.10 AstraZeneca
13.10.1 会社概要
13.10.2 会社概要
13.10.3 財務分析
13.10.3.1 純収入、2015-2022年
13.10.3.2 地域市場シェア、2022年
13.10.3.3 R&D、2015-2022年
13.10.4 製品/パイプラインのベンチマーキング
13.10.5 戦略的展望
13.11 Sanofi
13.11.1 会社概要
13.11.2 会社概要
13.11.3 財務分析
13.11.3.1 純収入、2018-2022年
13.11.3.2 地域市場シェア、2022年
13.11.3.3 R&D、2018年〜2022年
13.11.4 製品/パイプラインのベンチマーキング
13.12 Sino Biopharmaceutical Co., Ltd.
13.12.1 会社概要
13.12.2 会社概要
13.12.3 製品/パイプラインのベンチマーキング
14 結論と提言
14.1 Visiongainからの結びの言葉
14.2 市場プレイヤーへの提言
ページTOPに戻る
図表リスト
表の一覧
Table 1 mRNA Vaccines Market Snapshot, 2023 & 2033 (US$ million, CAGR %)
Table 2 mRNA Vaccines & Therapeutics: Companies & Delivery Platforms
Table 3 mRNA Vaccines in Clinical Trials: June 2023
Table 4 mRNA Vaccines Market Forecast by Region, 2023-2033 (US$ Million, AGR%, CAGR%): "V" Shaped Recovery
Table 5 mRNA Vaccines Market Forecast by Region, 2023-2033 (US$ Million, AGR%, CAGR%): "U" Shaped Recovery
Table 6 mRNA Vaccines Market Forecast by Region, 2023-2033 (US$ Million, AGR%, CAGR%): "W" Shaped Recovery
Table 7 mRNA Vaccines Market Forecast by Region, 2023-2033 (US$ Million, AGR%, CAGR%): "L" Shaped Recovery
Table 8 mRNA Vaccines Market Forecast by Vaccine Type, 2023-2033 (US$ Million, AGR%, CAGR%)
Table 9 Self-amplifying mRNA-based Vaccines Segment Market Forecast by Region, 2023-2033 (US$ Million, AGR%, CAGR%)
Table 10 Conventional Non-amplifying mRNA-based Vaccines Segment Market Forecast by Region, 2023-2033 (US$ Million, AGR%, CAGR%)
Table 11 mRNA Vaccines Market Forecast by Application, 2023-2033 (US$ Million, AGR%, CAGR%)
Table 12 Cancer Segment Market Forecast by Region, 2023-2033 (US$ Million, AGR%, CAGR%)
Table 13 Infectious Disease Segment Market Forecast by Region, 2023-2033 (US$ Million, AGR%, CAGR%)
Table 14 Autoimmune Diseases Segment Market Forecast by Region, 2023-2033 (US$ Million, AGR%, CAGR%)
Table 15 Others Segment Market Forecast by Region, 2023-2033 (US$ Million, AGR%, CAGR%)
Table 16 mRNA Vaccines Market Forecast by End-users, 2023-2033 (US$ Million, AGR%, CAGR%)
Table 17 Hospitals and Clinics Segment Market Forecast by Region, 2023-2033 (US$ Million, AGR%, CAGR%)
Table 18 Research Organisations Segment Market Forecast by Region, 2023-2033 (US$ Million, AGR%, CAGR%)
Table 19 Others Segment Market Forecast by Region, 2023-2033 (US$ Million, AGR%, CAGR%)
Table 20 mRNA Vaccines Market Forecast by Region, 2023-2033 (US$ Million, AGR%, CAGR%)
Table 21 North America mRNA Vaccines Market Forecast by Country, 2023-2033 (US$ Million, AGR%, CAGR%)
Table 22 North America mRNA Vaccines Market Forecast by Vaccine Type, 2023-2033 (US$ Million, AGR%, CAGR%)
Table 23 North America mRNA Vaccines Market Forecast by Application, 2023-2033 (US$ Million, AGR%, CAGR%)
Table 24 North America mRNA Vaccines Market Forecast by End-users, 2023-2033 (US$ Million, AGR%, CAGR%)
Table 25 U.S. mRNA Vaccines Market Forecast, 2023-2033 (US$ Million, AGR%, CAGR%)
Table 26 Canada mRNA Vaccines Market Forecast, 2023-2033 (US$ Million, AGR%, CAGR%)
Table 27 Europe mRNA Vaccines Market Forecast by Country, 2023-2033 (US$ Million, AGR%, CAGR%)
Table 28 Europe mRNA Vaccines Market Forecast by Vaccine Type, 2023-2033 (US$ Million, AGR%, CAGR%)
Table 29 Europe mRNA Vaccines Market Forecast by Application, 2023-2033 (US$ Million, AGR%, CAGR%)
Table 30 Europe mRNA Vaccines Market Forecast by End-users, 2023-2033 (US$ Million, AGR%, CAGR%)
Table 31 Germany mRNA Vaccines Market Forecast, 2023-2033 (US$ Million, AGR%, CAGR%)
Table 32 UK mRNA Vaccines Market Forecast, 2023-2033 (US$ Million, AGR%, CAGR%)
Table 33 France mRNA Vaccines Market Forecast, 2023-2033 (US$ Million, AGR%, CAGR%)
Table 34 Italy mRNA Vaccines Market Forecast, 2023-2033 (US$ Million, AGR%, CAGR%)
Table 35 Spain mRNA Vaccines Market Forecast, 2023-2033 (US$ Million, AGR%, CAGR%)
Table 36 Russia mRNA Vaccines Market Forecast, 2023-2033 (US$ Million, AGR%, CAGR%)
Table 37 Rest of Europe mRNA Vaccines Market Forecast, 2023-2033 (US$ Million, AGR%, CAGR%)
Table 38 Asia Pacific mRNA Vaccines Market Forecast by Country, 2023-2033 (US$ Million, AGR%, CAGR%)
Table 39 Asia Pacific mRNA Vaccines Market Forecast by Vaccine Type, 2023-2033 (US$ Million, AGR%, CAGR%)
Table 40 Asia Pacific mRNA Vaccines Market Forecast by Application, 2023-2033 (US$ Million, AGR%, CAGR%)
Table 41 Asia Pacific mRNA Vaccines Market Forecast by End-users, 2023-2033 (US$ Million, AGR%, CAGR%)
Table 42 Japan mRNA Vaccines Market Forecast, 2023-2033 (US$ Million, AGR%, CAGR%)
Table 43 China mRNA Vaccines Market Forecast, 2023-2033 (US$ Million, AGR%, CAGR%)
Table 44 India mRNA Vaccines Market Forecast, 2023-2033 (US$ Million, AGR%, CAGR%)
Table 45 Australia mRNA Vaccines Market Forecast, 2023-2033 (US$ Million, AGR%, CAGR%)
Table 46 South Korea mRNA Vaccines Market Forecast, 2023-2033 (US$ Million, AGR%, CAGR%)
Table 47 South-East Asia mRNA Vaccines Market Forecast, 2023-2033 (US$ Million, AGR%, CAGR%)
Table 48 Rest of Asia Pacific mRNA Vaccines Market Forecast, 2023-2033 (US$ Million, AGR%, CAGR%)
Table 49 Latin America mRNA Vaccines Market Forecast by Country, 2023-2033 (US$ Million, AGR%, CAGR%)
Table 50 Latin America mRNA Vaccines Market Forecast by Application, 2023-2033 (US$ Million, AGR%, CAGR%)
Table 51 Latin America mRNA Vaccines Market Forecast by End-users, 2023-2033 (US$ Million, AGR%, CAGR%)
Table 52 Brazil mRNA Vaccines Market Forecast, 2023-2033 (US$ Million, AGR%, CAGR%)
Table 53 Mexico mRNA Vaccines Market Forecast, 2023-2033 (US$ Million, AGR%, CAGR%)
Table 54 Rest of Latin America mRNA Vaccines Market Forecast, 2023-2033 (US$ Million, AGR%, CAGR%)
Table 55 MEA mRNA Vaccines Market Forecast by Country, 2023-2033 (US$ Million, AGR%, CAGR%)
Table 56 MEA mRNA Vaccines Market Forecast by Vaccine Type, 2023-2033 (US$ Million, AGR%, CAGR%)
Table 57 MEA mRNA Vaccines Market Forecast by Application, 2023-2033 (US$ Million, AGR%, CAGR%)
Table 58 MEA mRNA Vaccines Market Forecast by End-users, 2023-2033 (US$ Million, AGR%, CAGR%)
Table 59 GCC mRNA Vaccines Market Forecast, 2023-2033 (US$ Million, AGR%, CAGR%)
Table 60 South Africa mRNA Vaccines Market Forecast, 2023-2033 (US$ Million, AGR%, CAGR%)
Table 61 Rest of MEA mRNA Vaccines Market Forecast, 2023-2033 (US$ Million, AGR%, CAGR%)
Table 62 Pfizer Inc.: Key Details, (CEO, HQ, Revenue, Founded, No. of Employees, Company Type, Website, Business Segment)
Table 63 Pfizer Inc.: Product/Pipeline Benchmarking
Table 64 Pfizer Inc.: Strategic Outlook
Table 65 Moderna, Inc.: Key Details, (CEO, HQ, Revenue, Founded, No. of Employees, Company Type, Website, Business Segment)
Table 66 Moderna, Inc.: Product/Pipeline Benchmarking
Table 67 Moderna, Inc.: Strategic Outlook
Table 68 BioNTech SE: Key Details, (CEO, HQ, Revenue, Founded, No. of Employees, Company Type, Website, Business Segment)
Table 69 BioNTech SE: Product/Pipeline Benchmarking
Table 70 BioNTech SE: Strategic Outlook
Table 71 GSK plc: Key Details, (CEO, HQ, Revenue, Founded, No. of Employees, Company Type, Website, Business Segment)
Table 72 GSK plc: Product/Pipeline Benchmarking
Table 73 Daiichi Sankyo: Key Details, (CEO, HQ, Revenue, Founded, No. of Employees, Company Type, Website, Business Segment)
Table 74 Daiichi Sankyo: Product/Pipeline Benchmarking
Table 75 Daiichi Sankyo: Strategic Outlook
Table 76 Ethris GmbH: Key Details, (CEO, HQ, Revenue, Founded, No. of Employees, Company Type, Website, Business Segment)
Table 77 Ethris GmbH: Product/Pipeline Benchmarking
Table 78 Ethris GmbH: Strategic Outlook
Table 79 AIM Vaccine: Key Details, (CEO, HQ, Revenue, Founded, No. of Employees, Company Type, Website, Business Segment)
Table 80 AIM Vaccine: Product/Pipeline Benchmarking
Table 81 AIM Vaccine: Strategic Outlook
Table 82 Arcturus Therapeutics Inc.: Key Details, (CEO, HQ, Revenue, Founded, No. of Employees, Company Type, Website, Business Segment)
Table 83 Arcturus Therapeutics Inc.: Product/Pipeline Benchmarking
Table 84 CureVac: Key Details, (CEO, HQ, Revenue, Founded, No. of Employees, Company Type, Website, Business Segment)
Table 85 CureVac: Product/Pipeline Benchmarking
Table 86 CureVac: Strategic Outlook
Table 87 AstraZeneca: Key Details, (CEO, HQ, Revenue, Founded, No. of Employees, Company Type, Website, Business Segment)
Table 88 AstraZeneca: Product/Pipeline Benchmarking
Table 89 AstraZeneca: Strategic Outlook
Table 90 Sanofi: Key Details, (CEO, HQ, Revenue, Founded, No. of Employees, Company Type, Website, Business Segment)
Table 91 Sanofi: Product/Pipeline Benchmarking
Table 92 Sino Biopharmaceutical Co., Ltd.: Key Details, (CEO, HQ, Revenue, Founded, No. of Employees, Company Type, Website, Business Segment)
Table 93 Sino Biopharmaceutical Co., Ltd.: Product/Pipeline Benchmarking
図の一覧
Figure 1 mRNA Vaccines Market Segmentation
Figure 2 mRNA Vaccines Market by Vaccine Type: Market Attractiveness Index
Figure 3 mRNA Vaccines Market by Application: Market Attractiveness Index
Figure 4 mRNA Vaccines Market by End-users: Market Attractiveness Index
Figure 5 mRNA Vaccines Market Attractiveness Index by Region
Figure 6 mRNA Vaccines Market: Market Dynamics
Figure 7 mRNA Vaccines Market by Region, 2023-2033 (US$ Million, AGR %): “V” Shaped Recovery
Figure 8 mRNA Vaccines Market by Region, 2023-2033 (US$ Million, AGR %): “U” Shaped Recovery
Figure 9 mRNA Vaccines Market by Region, 2023-2033 (US$ Million, AGR %): “W” Shaped Recovery
Figure 10 mRNA Vaccines Market by Region, 2023-2033 (US$ Million, AGR %): “L” Shaped Recovery
Figure 11 mRNA Vaccines Market: Porter’s Five Forces Analysis
Figure 12 mRNA Vaccines Market: PEST Analysis
Figure 13 mRNA Vaccines Market Attractiveness Index by Vaccine Type
Figure 14 mRNA Vaccines Market Forecast by Vaccine Type, 2023-2033 (US$ Million, AGR %)
Figure 15 mRNA Vaccines Market Share Forecast by Vaccine Type, 2023, 2028, 2033 (%)
Figure 16 Self-amplifying mRNA-based Vaccines Segment Market Forecast by Region, 2023-2033 (US$ Million, AGR %)
Figure 17 Self-amplifying mRNA-based Vaccines Segment Market Share Forecast by Region, 2023 & 2033 (%)
Figure 18 Conventional Non-amplifying mRNA-based Vaccines Segment Market Forecast by Region, 2023-2033 (US$ Million, AGR %)
Figure 19 Conventional Non-amplifying mRNA-based Vaccines Segment Market Share Forecast by Region, 2023 & 2033 (%)
Figure 20 mRNA Vaccines Market Attractiveness Index by Vaccine Type
Figure 21 mRNA Vaccines Market Forecast by Application, 2023-2033 (US$ Million, AGR %)
Figure 22 mRNA Vaccines Market Share Forecast by Application, 2023, 2028, 2033 (%)
Figure 23 Cancer Segment Market Forecast by Region, 2023-2033 (US$ Million, AGR %)
Figure 24 Cancer Segment Market Share Forecast by Region, 2023 & 2033 (%)
Figure 25 Infectious Disease Segment Market Forecast by Region, 2023-2033 (US$ Million, AGR %)
Figure 26 Infectious Disease Segment Market Share Forecast by Region, 2023 & 2033 (%)
Figure 27 Autoimmune Diseases Segment Market Forecast by Region, 2023-2033 (US$ Million, AGR %)
Figure 28 Autoimmune Diseases Segment Market Share Forecast by Region, 2023 & 2033 (%)
Figure 29 Others Segment Market Forecast by Region, 2023-2033 (US$ Million, AGR %)
Figure 30 Others Segment Market Share Forecast by Region, 2023 & 2033 (%)
Figure 31 mRNA Vaccines Market Attractiveness Index by End-users
Figure 32 mRNA Vaccines Market Forecast by End-users, 2023-2033 (US$ Million, AGR %)
Figure 33 mRNA Vaccines Market Share Forecast by End-users, 2023, 2028, 2033 (%)
Figure 34 Hospitals and Clinics Segment Market Forecast by Region, 2023-2033 (US$ Million, AGR %)
Figure 35 Hospitals and Clinics Segment Market Share Forecast by Region, 2023 & 2033 (%)
Figure 36 Research Organisations Segment Market Forecast by Region, 2023-2033 (US$ Million, AGR %)
Figure 37 Research Organisations Segment Market Share Forecast by Region, 2023 & 2033 (%)
Figure 38 Others Segment Market Forecast by Region, 2023-2033 (US$ Million, AGR %)
Figure 39 Others Segment Market Share Forecast by Region, 2023 & 2033 (%)
Figure 40 mRNA Vaccines Market Forecast by Region 2023, 2028, 2033 (Revenue, CAGR%)
Figure 41 mRNA Vaccines Market Share Forecast by Region 2023, 2028, 2033 (%)
Figure 42 mRNA Vaccines Market by Region, 2023-2033 (US$ Mn)
Figure 43 North America mRNA Vaccines Market Attractiveness Index
Figure 44 North America mRNA Vaccines Market by Region, 2023, 2028 & 2033 (US$ million)
Figure 45 North America mRNA Vaccines Market Forecast by Country, 2023-2033 (US$ million)
Figure 46 North America mRNA Vaccines Market Share Forecast by Country, 2023 & 2033 (%)
Figure 47 North America mRNA Vaccines Market Forecast by Vaccine Type, 2023-2033 (US$ Million, AGR %)
Figure 48 North America mRNA Vaccines Market Share Forecast by Vaccine Type, 2023 & 2033 (%)
Figure 49 North America mRNA Vaccines Market Forecast by Application, 2023-2033 (US$ Million, AGR %)
Figure 50 North America mRNA Vaccines Market Share Forecast by Application, 2023 & 2033 (%)
Figure 51 North America mRNA Vaccines Market Forecast by End-users, 2023-2033 (US$ Million, AGR %)
Figure 52 North America mRNA Vaccines Market Share Forecast by End-users, 2023 & 2033 (%)
Figure 53 U.S. mRNA Vaccines Market Forecast, 2023-2033 (US$ Million, AGR %)
Figure 54 Canada mRNA Vaccines Market Forecast, 2023-2033 (US$ Million, AGR %)
Figure 55 Europe mRNA Vaccines Market Attractiveness Index
Figure 56 Europe mRNA Vaccines Market by Region, 2023, 2028 & 2033 (US$ million)
Figure 57 Europe mRNA Vaccines Market Forecast by Country, 2023-2033 (US$ million, AGR %)
Figure 58 Europe mRNA Vaccines Market Share Forecast by Country, 2023 & 2033 (%)
Figure 59 Europe mRNA Vaccines Market Forecast by Vaccine Type, 2023-2033 (US$ Million, AGR %)
Figure 60 Europe mRNA Vaccines Market Share Forecast by Vaccine Type, 2023 & 2033 (%)
Figure 61 Europe mRNA Vaccines Market Forecast by Application, 2023-2033 (US$ Million, AGR %)
Figure 62 Europe mRNA Vaccines Market Share Forecast by Application, 2023 & 2033 (%)
Figure 63 Europe mRNA Vaccines Market Forecast by End-users, 2023-2033 (US$ Million, AGR %)
Figure 64 Europe mRNA Vaccines Market Share Forecast by End-users, 2023 & 2033 (%)
Figure 65 Germany mRNA Vaccines Market Forecast, 2023-2033 (US$ Million, AGR %)
Figure 66 UK mRNA Vaccines Market Forecast, 2023-2033 (US$ Million, AGR %)
Figure 67 France mRNA Vaccines Market Forecast, 2023-2033 (US$ Million, AGR %)
Figure 68 Italy mRNA Vaccines Market Forecast, 2023-2033 (US$ Million, AGR %)
Figure 69 Spain mRNA Vaccines Market Forecast, 2023-2033 (US$ Million, AGR %)
Figure 70 Russia mRNA Vaccines Market Forecast, 2023-2033 (US$ Million, AGR %)
Figure 71 Rest of Europe mRNA Vaccines Market Forecast, 2023-2033 (US$ Million, AGR %)
Figure 72 Asia Pacific mRNA Vaccines Market Attractiveness Index
Figure 73 Asia Pacific mRNA Vaccines Market by Region, 2023, 2028 & 2033 (US$ million)
Figure 74 Asia Pacific mRNA Vaccines Market Forecast by Country, 2023-2033 (US$ million, AGR %)
Figure 75 Asia Pacific mRNA Vaccines Market Share Forecast by Country, 2023 & 2033 (%)
Figure 76 Asia Pacific mRNA Vaccines Market Forecast by Vaccine Type, 2023-2033 (US$ Million, AGR %)
Figure 77 Asia Pacific mRNA Vaccines Market Share Forecast by Vaccine Type, 2023 & 2033 (%)
Figure 78 Asia Pacific mRNA Vaccines Market Forecast by Application, 2023-2033 (US$ Million, AGR %)
Figure 79 Asia Pacific mRNA Vaccines Market Share Forecast by Application, 2023 & 2033 (%)
Figure 80 Asia Pacific mRNA Vaccines Market Forecast by End-users, 2023-2033 (US$ Million, AGR %)
Figure 81 Asia Pacific mRNA Vaccines Market Share Forecast by End-users, 2023 & 2033 (%)
Figure 82 Japan mRNA Vaccines Market Forecast, 2023-2033 (US$ Million, AGR %)
Figure 83 China mRNA Vaccines Market Forecast, 2023-2033 (US$ Million, AGR %)
Figure 84 India mRNA Vaccines Market Forecast, 2023-2033 (US$ Million, AGR %)
Figure 85 Australia mRNA Vaccines Market Forecast, 2023-2033 (US$ Million, AGR %)
Figure 86 South Korea mRNA Vaccines Market Forecast, 2023-2033 (US$ Million, AGR %)
Figure 87 South-East Asia mRNA Vaccines Market Forecast, 2023-2033 (US$ Million, AGR %)
Figure 88 Rest of Asia Pacific mRNA Vaccines Market Forecast, 2023-2033 (US$ Million, AGR %)
Figure 89 Latin America mRNA Vaccines Market Attractiveness Index
Figure 90 Latin America mRNA Vaccines Market by Region, 2023, 2028 & 2033 (US$ million)
Figure 91 Latin America mRNA Vaccines Market Forecast by Country, 2023-2033 (US$ million)
Figure 92 Latin America mRNA Vaccines Market Share Forecast by Country, 2023 & 2033 (%)
Figure 93 Latin America mRNA Vaccines Market Forecast by Vaccine Type, 2023-2033 (US$ Million, AGR %)
Figure 94 Latin America mRNA Vaccines Market Share Forecast by Vaccine Type, 2023 & 2033 (%)
Figure 95 Latin America mRNA Vaccines Market Forecast by Application, 2023-2033 (US$ Million, AGR %)
Figure 96 Latin America mRNA Vaccines Market Share Forecast by Application, 2023 & 2033 (%)
Figure 97 Latin America mRNA Vaccines Market Forecast by End-users, 2023-2033 (US$ Million, AGR %)
Figure 98 Latin America mRNA Vaccines Market Share Forecast by End-users, 2023 & 2033 (%)
Figure 99 Brazil mRNA Vaccines Market Forecast, 2023-2033 (US$ Million, AGR %)
Figure 100 Mexico mRNA Vaccines Market Forecast, 2023-2033 (US$ Million, AGR %)
Figure 101 Rest of Latin America mRNA Vaccines Market Forecast, 2023-2033 (US$ Million, AGR %)
Figure 102 MEA mRNA Vaccines Market Attractiveness Index
Figure 103 MEA mRNA Vaccines Market by Region, 2023, 2028 & 2033 (US$ million)
Figure 104 MEA mRNA Vaccines Market Forecast by Country, 2023-2033 (US$ million)
Figure 105 MEA mRNA Vaccines Market Share Forecast by Country, 2023 & 2033 (%)
Figure 106 MEA mRNA Vaccines Market Forecast by Vaccine Type, 2023-2033 (US$ Million, AGR %)
Figure 107 MEA mRNA Vaccines Market Share Forecast by Vaccine Type, 2023 & 2033 (%)
Figure 108 MEA mRNA Vaccines Market Forecast by Application, 2023-2033 (US$ Million, AGR %)
Figure 109 MEA mRNA Vaccines Market Share Forecast by Application, 2023 & 2033 (%)
Figure 110 MEA mRNA Vaccines Market Forecast by End-users, 2023-2033 (US$ Million, AGR %)
Figure 111 MEA mRNA Vaccines Market Share Forecast by End-users, 2023 & 2033 (%)
Figure 112 GCC mRNA Vaccines Market Forecast, 2023-2033 (US$ Million, AGR %)
Figure 113 South Africa mRNA Vaccines Market Forecast, 2023-2033 (US$ Million, AGR %)
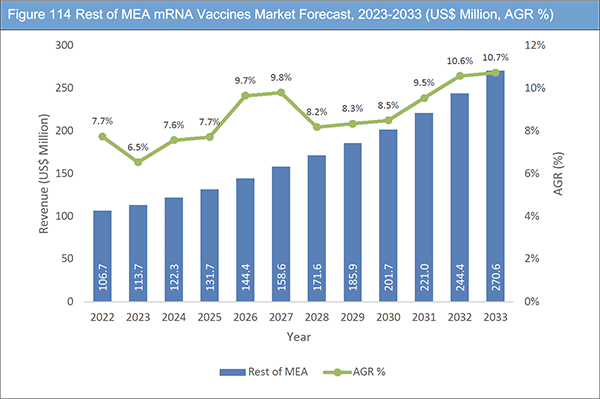
Figure 114 Rest of MEA mRNA Vaccines Market Forecast, 2023-2033 (US$ Million, AGR %)
Figure 115 Pfizer Inc.: Net Revenue, 2015-2022 (US$ million, AGR%)
Figure 116 Pfizer Inc.: Regional Market Shares (%), 2022
Figure 117 Pfizer Inc.: R&D, 2015-2022 (US$ million, AGR%)
Figure 118 Moderna, Inc.: Net Revenue, 2016-2022 (US$ million, AGR%)
Figure 119 Moderna, Inc.: R&D, 2016-2022 (US$ million, AGR%)
Figure 120 BioNTech SE: Net Revenue, 2018-2022 (US$ million, AGR%)
Figure 121 BioNTech SE: R&D, 2018-2022 (US$ million, AGR%)
Figure 122 GSK plc: Net Revenue, 2015-2022 (US$ million, AGR%)
Figure 123 GSK plc: Regional Market Shares (%), 2022
Figure 124 GSK plc: R&D, 2015-2022 (US$ million, AGR%)
Figure 125 AstraZeneca: Net Revenue, 2015-2022 (US$ million, AGR%)
Figure 126 AstraZeneca: Regional Market Shares (%), 2022
Figure 127 AstraZeneca: R&D, 2015-2022 (US$ million, AGR%)
Figure 128 Sanofi: Net Revenue, 2018-2022 (US$ million, AGR%)
Figure 129 Sanofi: Regional Market Shares (%), 2022
Figure 130 Sanofi: R&D, 2018-2022 (US$ million, AGR%)
ページTOPに戻る
Summary
Report Details
The mRNA Vaccines Market Report 2023-2033: This report will prove invaluable to leading firms striving for new revenue pockets if they wish to better understand the industry and its underlying dynamics. It will be useful for companies that would like to expand into different industries or to expand their existing operations in a new region.
Extensive research has been conducted on mRNA vaccines as potential cancer therapeutics for a period exceeding two decades, yielding limited success. In recent times, there has been a notable surge in research attention towards cancer vaccines. This surge has been prompted by the remarkable and enduring responses witnessed in certain malignancies through the use of immune checkpoint inhibitors, as well as advancements in technology. The initiation of a phase 3 clinical trial for the personalised vaccine mRNA-4157 (also referred to as V940) in conjunction with pembrolizumab (commonly known as Keytruda) was announced by Moderna and Merck on 26 July 2023. This trial aims to evaluate the efficacy of the combination therapy in high-risk patients who have previously undergone surgical intervention for melanoma. The objective of the trial is to recruit a total of 1,089 patients who are at stages IIb to IV. The primary endpoint of the trial is to assess the post-surgical recurrence-free survival of these patients. The conclusive outcomes are anticipated to be available by the year 2029.
What Questions Should You Ask before Buying a Market Research Report?
• How is the mRNA vaccines market evolving?
• What is driving and restraining the mRNA vaccines market?
• How will each mRNA vaccines submarket segment grow over the forecast period and how much revenue will these submarkets account for in 2033?
• How will the market shares for each mRNA vaccines submarket develop from 2023 to 2033?
• What will be the main driver for the overall market from 2023 to 2033?
• Will leading mRNA vaccines markets broadly follow the macroeconomic dynamics, or will individual national markets outperform others?
• How will the market shares of the national markets change by 2033 and which geographical region will lead the market in 2033?
• Who are the leading players and what are their prospects over the forecast period?
• What are the mRNA vaccines projects for these leading companies?
• How will the industry evolve during the period between 2023 and 2033? What are the implications of
mRNA vaccines projects taking place now and over the next 10 years?
• Is there a greater need for product commercialisation to further scale the mRNA vaccines market?
• Where is the mRNA vaccines market heading and how can you ensure you are at the forefront of the market?
• What are the best investment options for new product and service lines?
• What are the key prospects for moving companies into a new growth path and C-suite?
You need to discover how this will impact the mRNA vaccines market today, and over the next 10 years:
• Our 215-page report provides 93 tables and 130 charts/graphs exclusively to you.
• The report highlights key lucrative areas in the industry so you can target them – NOW.
• It contains in-depth analysis of global, regional and national sales and growth.
• It highlights for you the key successful trends, changes and revenue projections made by your competitors.
This report tells you TODAY how the mRNA vaccines market will develop in the next 10 years, and in line with the variations in COVID-19 economic recession and bounce. This market is more critical now than at any point over the last 10 years.
Forecasts to 2033 and other analyses reveal commercial prospects
• In addition to revenue forecasting to 2033, our new study provides you with recent results, growth rates, and market shares.
• You will find original analyses, with business outlooks and developments.
• Discover qualitative analyses (including market dynamics, drivers, opportunities, and restraints), Porter’s Five Forces Analysis, PEST Analysis and recent developments.
This report includes data analysis and invaluable insight into how COVID-19 will affect the industry and your company. Four COVID-19 recovery patterns and their impact, namely, “V”, “L”, “W” and “U” are discussed in this report.
Segments Covered in the Report
Vaccine Type
• Self-amplifying mRNA-based Vaccines
• Conventional Non-amplifying mRNA-based Vaccines
Application
• Cancer
• Infectious Disease
• Autoimmune Diseases
• Others
End-users
• Hospitals and Clinics
• Research Organisations
• Others
In addition to the revenue predictions for the overall world market and segments, you will also find revenue forecasts for five regional and 22 leading national markets:
North America
• U.S.
• Canada
Europe
• Germany
• UK
• France
• Italy
• Spain
• Russia
• Rest of Europe
Asia Pacific
• Japan
• China
• India
• Australia
• South Korea
• South-East Asia
• Rest of Asia Pacific
Latin America
• Brazil
• Mexico
• Rest of Latin America
MEA
• GCC
• South Africa
• Rest of MEA
The report also includes profiles and for some of the leading companies in the mRNA Vaccines Market, 2023 to 2033, with a focus on this segment of these companies’ operations.
Leading companies and the potential for market growth
• Pfizer Inc.
• Moderna, Inc.
• BioNTech SE
• AstraZeneca
• Sanofi
• GSK plc
• Daiichi Sankyo
• Ethris GmbH
• AIM Vaccine
• Arcturus Therapeutics Inc.
• CureVac
• Sino Biopharmaceutical Co., Ltd.
Overall world revenue for mRNA Vaccines Market, 2023 to 2033 in terms of value the market will surpass US$11,700.0 million in 2023, our work calculates. We predict strong revenue growth through to 2033. Our work identifies which organizations hold the greatest potential. Discover their capabilities, progress, and commercial prospects, helping you stay ahead.
How will the mRNA Vaccines Market, 2023 to 2033 report help you?
In summary, our 210+ page report provides you with the following knowledge:
• Revenue forecasts to 2033 for mRNA Vaccines Market 2023 to 2033, with forecasts for Vaccine type, application, and end-users, each forecast at a global and regional level – discover the industry’s prospects, finding the most lucrative places for investments and revenues.
• Revenue forecasts to 2033 for five regional and 22 key national markets – See forecasts for the mRNA Vaccines Market, 2023 to 2033 market in North America, Europe, Asia-Pacific, Latin America, and MEA. Also forecasted is the market in the US, Canada, Mexico, Brazil, Germany, France, UK, Italy, China, India, Japan, and Australia among other prominent economies.
• Prospects for established firms and those seeking to enter the market – including company profiles for 12 of the major companies involved in the mRNA Vaccines Market, 2023 to 2033.
Find quantitative and qualitative analyses with independent predictions. Receive information that only our report contains, staying informed with invaluable business intelligence.
Information found nowhere else
With our new report, you are less likely to fall behind in knowledge or miss out on opportunities. See how our work could benefit your research, analyses, and decisions. Visiongain’s study is for everybody needing commercial analyses for the mRNA Vaccines Market 2023 to 2033, market-leading companies. You will find data, trends and predictions.
ページTOPに戻る
Table of Contents
Table of Contents
1 Report Overview
1.1 Objectives of the Study
1.2 Introduction to mRNA Vaccines Market
1.3 What This Report Delivers
1.4 Why You Should Read This Report
1.5 Key Questions Answered by This Analytical Report Include:
1.6 Who is This Report For?
1.7 Methodology
1.7.1 Market Definitions
1.7.2 Market Evaluation & Forecasting Methodology
1.7.3 Data Validation
1.7.3.1 Primary Research
1.7.3.2 Secondary Research
1.8 Frequently Asked Questions (FAQs)
1.9 Associated Visiongain Reports
1.10 About Visiongain
2 Executive Summary
3 Market Overview
3.1 Key Findings
3.2 Market Dynamics
3.2.1 Market Driving Factors
3.2.1.1 Growing Diverse Applications of mRNA Post COVID-19 Vaccine Success
3.2.1.2 Significant Research Funding to Boost Market Growth
3.2.1.3 Technological Advances Driving the Market Growth
3.2.1.4 Rising mRNA Vaccine-based Clinical Trials
3.2.2 Market Restraining Factors
3.2.2.1 Scalability and Cost-Effectiveness is Still a Major Bottleneck
3.2.2.2 Significant Storage Challenges in Low-income Countries Likely to Challenge Industry Growth
3.2.3 Market Opportunities
3.2.3.1 mRNA Cancer Vaccines
3.2.3.2 Analytics, Machine Learning and Cloud Data Warehousing
3.3 COVID-19 Impact Analysis
3.4 Porter’s Five Forces Analysis
3.4.1 Supplier Power
3.4.2 Buyer Power
3.4.3 Competitive Rivalry
3.4.4 Threat from Substitutes
3.4.5 Threat of New Entrants
3.5 PEST Analysis
3.5.1 Political Factors
3.5.2 Economic Factors
3.5.3 Social Factors
3.5.4 Technological Factors
4 mRNA Vaccines Market Analysis by Vaccine Type
4.1 Key Findings
4.2 Vaccine Type Segment: Market Attractiveness Index
4.3 mRNA Vaccines Market Size Estimation and Forecast by Vaccine Type
4.4 Self-amplifying mRNA-based Vaccines
4.4.1 Market Forecast by Region, 2023-2033 (US$ Million, AGR %)
4.4.2 Market Share by Region, 2023 & 2033 (%)
4.5 Conventional Non-amplifying mRNA-based Vaccines
4.5.1 Market Forecast by Region, 2023-2033 (US$ Million, AGR %)
4.5.2 Market Share by Region, 2023 & 2033 (%)
5 mRNA Vaccines Market Analysis by Application
5.1 Key Findings
5.2 Application Segment: Market Attractiveness Index
5.3 mRNA Vaccines Market Size Estimation and Forecast by Application
5.4 Cancer
5.4.1 Market Forecast by Region, 2023-2033 (US$ Million, AGR %)
5.4.2 Market Share by Region, 2023 & 2033 (%)
5.5 Infectious Disease
5.5.1 Market Forecast by Region, 2023-2033 (US$ Million, AGR %)
5.5.2 Market Share by Region, 2023 & 2033 (%)
5.6 Autoimmune Diseases
5.6.1 Market Forecast by Region, 2023-2033 (US$ Million, AGR %)
5.6.2 Market Share by Region, 2023 & 2033 (%)
5.7 Others
5.7.1 Market Forecast by Region, 2023-2033 (US$ Million, AGR %)
5.7.2 Market Share by Region, 2023 & 2033 (%)
6 mRNA Vaccines Market Analysis by End-users
6.1 Key Findings
6.2 End-users Segment: Market Attractiveness Index
6.3 mRNA Vaccines Market Size Estimation and Forecast by End-users
6.4 Hospitals and Clinics
6.4.1 Market Forecast by Region, 2023-2033 (US$ Million, AGR %)
6.4.2 Market Share by Region, 2023 & 2033 (%)
6.5 Research Organisations
6.5.1 Market Forecast by Region, 2023-2033 (US$ Million, AGR %)
6.5.2 Market Share by Region, 2023 & 2033 (%)
6.6 Others
6.6.1 Market Forecast by Region, 2023-2033 (US$ Million, AGR %)
6.6.2 Market Share by Region, 2023 & 2033 (%)
7 mRNA Vaccines Market Analysis by Region
7.1 Key Findings
7.2 Regional Market Size Estimation and Forecast
8 North America mRNA Vaccines Market Analysis
8.1 Key Findings
8.2 North America mRNA Vaccines Market Attractiveness Index
8.3 North America mRNA Vaccines Market by Country, 2023, 2028 & 2033 (US$ Million)
8.4 North America mRNA Vaccines Market Size Estimation and Forecast by Country
8.5 North America mRNA Vaccines Market Size Estimation and Forecast by Vaccine Type
8.6 North America mRNA Vaccines Market Size Estimation and Forecast by Application
8.7 North America mRNA Vaccines Market Size Estimation and Forecast by End-users
8.8 U.S. mRNA Vaccines Market Analysis
8.9 Canada mRNA Vaccines Market Analysis
9 Europe mRNA Vaccines Market Analysis
9.1 Key Findings
9.2 Europe mRNA Vaccines Market Attractiveness Index
9.3 Europe mRNA Vaccines Market by Country, 2023, 2028 & 2033 (US$ Million)
9.4 Europe mRNA Vaccines Market Size Estimation and Forecast by Country
9.5 Europe mRNA Vaccines Market Size Estimation and Forecast by Vaccine Type
9.6 Europe mRNA Vaccines Market Size Estimation and Forecast by Application
9.7 Europe mRNA Vaccines Market Size Estimation and Forecast by End-users
9.8 Germany mRNA Vaccines Market Analysis
9.9 UK mRNA Vaccines Market Analysis
9.10 France mRNA Vaccines Market Analysis
9.11 Italy mRNA Vaccines Market Analysis
9.12 Spain mRNA Vaccines Market Analysis
9.13 Russia mRNA Vaccines Market Analysis
9.14 Rest of Europe mRNA Vaccines Market Analysis
10 Asia Pacific mRNA Vaccines Market Analysis
10.1 Key Findings
10.2 Asia Pacific mRNA Vaccines Market Attractiveness Index
10.3 Asia Pacific mRNA Vaccines Market by Country, 2023, 2028 & 2033 (US$ Million)
10.4 Asia Pacific mRNA Vaccines Market Size Estimation and Forecast by Country
10.5 Asia Pacific mRNA Vaccines Market Size Estimation and Forecast by Vaccine Type
10.6 Asia Pacific mRNA Vaccines Market Size Estimation and Forecast by Application
10.7 Asia Pacific mRNA Vaccines Market Size Estimation and Forecast by End-users
10.8 Japan mRNA Vaccines Market Analysis
10.9 China mRNA Vaccines Market Analysis
10.10 India mRNA Vaccines Market Analysis
10.11 Australia mRNA Vaccines Market Analysis
10.12 South Korea mRNA Vaccines Market Analysis
10.13 South-East Asia mRNA Vaccines Market Analysis
10.14 Rest of Asia Pacific mRNA Vaccines Market Analysis
11 Latin America mRNA Vaccines Market Analysis
11.1 Key Findings
11.2 Latin America mRNA Vaccines Market Attractiveness Index
11.3 Latin America mRNA Vaccines Market by Country, 2023, 2028 & 2033 (US$ Million)
11.4 Latin America mRNA Vaccines Market Size Estimation and Forecast by Country
11.5 Latin America mRNA Vaccines Market Size Estimation and Forecast by Vaccine Type
11.6 Latin America mRNA Vaccines Market Size Estimation and Forecast by Application
11.7 Latin America mRNA Vaccines Market Size Estimation and Forecast by End-users
11.8 Brazil mRNA Vaccines Market Analysis
11.9 Mexico mRNA Vaccines Market Analysis
11.10 Rest of Latin America mRNA Vaccines Market Analysis
12 MEA mRNA Vaccines Market Analysis
12.1 Key Findings
12.2 MEA mRNA Vaccines Market Attractiveness Index
12.3 MEA mRNA Vaccines Market by Country, 2023, 2028 & 2033 (US$ Million)
12.4 MEA mRNA Vaccines Market Size Estimation and Forecast by Country
12.5 MEA mRNA Vaccines Market Size Estimation and Forecast by Vaccine Type
12.6 MEA mRNA Vaccines Market Size Estimation and Forecast by Application
12.7 MEA mRNA Vaccines Market Size Estimation and Forecast by End-users
12.8 GCC mRNA Vaccines Market Analysis
12.9 South Africa mRNA Vaccines Market Analysis
12.10 Rest of MEA mRNA Vaccines Market Analysis
13 Company Profiles
13.1 Pfizer Inc.
13.1.1 Company Snapshot
13.1.2 Company Overview
13.1.3 Financial Analysis
13.1.3.1 Net Revenue, 2015-2022
13.1.3.2 Regional Market Shares, 2022
13.1.3.3 R&D, 2015-2022
13.1.4 Product/Pipeline Benchmarking
13.1.5 Strategic Outlook
13.2 Moderna, Inc.
13.2.1 Company Snapshot
13.2.2 Company Overview
13.2.3 Financial Analysis
13.2.3.1 Net Revenue, 2016-2022
13.2.3.2 R&D, 2016-2022
13.2.4 Product/Pipeline Benchmarking
13.2.5 Strategic Outlook
13.3 BioNTech SE
13.3.1 Company Snapshot
13.3.2 Company Overview
13.3.3 Financial Analysis
13.3.3.1 Net Revenue, 2018-2022
13.3.3.2 R&D, 2018-2022
13.3.4 Product/Pipeline Benchmarking
13.3.5 Strategic Outlook
13.4 GSK plc
13.4.1 Company Snapshot
13.4.2 Company Overview
13.4.3 Financial Analysis
13.4.3.1 Net Revenue, 2015-2022
13.4.3.2 Regional Market Shares, 2022
13.4.3.3 R&D, 2015-2022
13.4.4 Product/Pipeline Benchmarking
13.5 Daiichi Sankyo
13.5.1 Company Snapshot
13.5.2 Company Overview
13.5.3 Product/Pipeline Benchmarking
13.5.4 Strategic Outlook
13.6 Ethris GmbH
13.6.1 Company Snapshot
13.6.2 Company Overview
13.6.3 Product/Pipeline Benchmarking
13.6.4 Strategic Outlook
13.7 AIM Vaccine
13.7.1 Company Snapshot
13.7.2 Company Overview
13.7.3 Product/Pipeline Benchmarking
13.7.4 Strategic Outlook
13.8 Arcturus Therapeutics Inc.
13.8.1 Company Snapshot
13.8.2 Company Overview
13.8.3 Product/Pipeline Benchmarking
13.9 CureVac
13.9.1 Company Snapshot
13.9.2 Company Overview
13.9.3 Product/Pipeline Benchmarking
13.9.4 Strategic Outlook
13.10 AstraZeneca
13.10.1 Company Snapshot
13.10.2 Company Overview
13.10.3 Financial Analysis
13.10.3.1 Net Revenue, 2015-2022
13.10.3.2 Regional Market Shares, 2022
13.10.3.3 R&D, 2015-2022
13.10.4 Product/Pipeline Benchmarking
13.10.5 Strategic Outlook
13.11 Sanofi
13.11.1 Company Snapshot
13.11.2 Company Overview
13.11.3 Financial Analysis
13.11.3.1 Net Revenue, 2018-2022
13.11.3.2 Regional Market Shares, 2022
13.11.3.3 R&D, 2018-2022
13.11.4 Product/Pipeline Benchmarking
13.12 Sino Biopharmaceutical Co., Ltd.
13.12.1 Company Snapshot
13.12.2 Company Overview
13.12.3 Product/Pipeline Benchmarking
14 Conclusion and Recommendations
14.1 Concluding Remarks from Visiongain
14.2 Recommendations for Market Players
ページTOPに戻る
List of Tables/Graphs
List of Tables
Table 1 mRNA Vaccines Market Snapshot, 2023 & 2033 (US$ million, CAGR %)
Table 2 mRNA Vaccines & Therapeutics: Companies & Delivery Platforms
Table 3 mRNA Vaccines in Clinical Trials: June 2023
Table 4 mRNA Vaccines Market Forecast by Region, 2023-2033 (US$ Million, AGR%, CAGR%): "V" Shaped Recovery
Table 5 mRNA Vaccines Market Forecast by Region, 2023-2033 (US$ Million, AGR%, CAGR%): "U" Shaped Recovery
Table 6 mRNA Vaccines Market Forecast by Region, 2023-2033 (US$ Million, AGR%, CAGR%): "W" Shaped Recovery
Table 7 mRNA Vaccines Market Forecast by Region, 2023-2033 (US$ Million, AGR%, CAGR%): "L" Shaped Recovery
Table 8 mRNA Vaccines Market Forecast by Vaccine Type, 2023-2033 (US$ Million, AGR%, CAGR%)
Table 9 Self-amplifying mRNA-based Vaccines Segment Market Forecast by Region, 2023-2033 (US$ Million, AGR%, CAGR%)
Table 10 Conventional Non-amplifying mRNA-based Vaccines Segment Market Forecast by Region, 2023-2033 (US$ Million, AGR%, CAGR%)
Table 11 mRNA Vaccines Market Forecast by Application, 2023-2033 (US$ Million, AGR%, CAGR%)
Table 12 Cancer Segment Market Forecast by Region, 2023-2033 (US$ Million, AGR%, CAGR%)
Table 13 Infectious Disease Segment Market Forecast by Region, 2023-2033 (US$ Million, AGR%, CAGR%)
Table 14 Autoimmune Diseases Segment Market Forecast by Region, 2023-2033 (US$ Million, AGR%, CAGR%)
Table 15 Others Segment Market Forecast by Region, 2023-2033 (US$ Million, AGR%, CAGR%)
Table 16 mRNA Vaccines Market Forecast by End-users, 2023-2033 (US$ Million, AGR%, CAGR%)
Table 17 Hospitals and Clinics Segment Market Forecast by Region, 2023-2033 (US$ Million, AGR%, CAGR%)
Table 18 Research Organisations Segment Market Forecast by Region, 2023-2033 (US$ Million, AGR%, CAGR%)
Table 19 Others Segment Market Forecast by Region, 2023-2033 (US$ Million, AGR%, CAGR%)
Table 20 mRNA Vaccines Market Forecast by Region, 2023-2033 (US$ Million, AGR%, CAGR%)
Table 21 North America mRNA Vaccines Market Forecast by Country, 2023-2033 (US$ Million, AGR%, CAGR%)
Table 22 North America mRNA Vaccines Market Forecast by Vaccine Type, 2023-2033 (US$ Million, AGR%, CAGR%)
Table 23 North America mRNA Vaccines Market Forecast by Application, 2023-2033 (US$ Million, AGR%, CAGR%)
Table 24 North America mRNA Vaccines Market Forecast by End-users, 2023-2033 (US$ Million, AGR%, CAGR%)
Table 25 U.S. mRNA Vaccines Market Forecast, 2023-2033 (US$ Million, AGR%, CAGR%)
Table 26 Canada mRNA Vaccines Market Forecast, 2023-2033 (US$ Million, AGR%, CAGR%)
Table 27 Europe mRNA Vaccines Market Forecast by Country, 2023-2033 (US$ Million, AGR%, CAGR%)
Table 28 Europe mRNA Vaccines Market Forecast by Vaccine Type, 2023-2033 (US$ Million, AGR%, CAGR%)
Table 29 Europe mRNA Vaccines Market Forecast by Application, 2023-2033 (US$ Million, AGR%, CAGR%)
Table 30 Europe mRNA Vaccines Market Forecast by End-users, 2023-2033 (US$ Million, AGR%, CAGR%)
Table 31 Germany mRNA Vaccines Market Forecast, 2023-2033 (US$ Million, AGR%, CAGR%)
Table 32 UK mRNA Vaccines Market Forecast, 2023-2033 (US$ Million, AGR%, CAGR%)
Table 33 France mRNA Vaccines Market Forecast, 2023-2033 (US$ Million, AGR%, CAGR%)
Table 34 Italy mRNA Vaccines Market Forecast, 2023-2033 (US$ Million, AGR%, CAGR%)
Table 35 Spain mRNA Vaccines Market Forecast, 2023-2033 (US$ Million, AGR%, CAGR%)
Table 36 Russia mRNA Vaccines Market Forecast, 2023-2033 (US$ Million, AGR%, CAGR%)
Table 37 Rest of Europe mRNA Vaccines Market Forecast, 2023-2033 (US$ Million, AGR%, CAGR%)
Table 38 Asia Pacific mRNA Vaccines Market Forecast by Country, 2023-2033 (US$ Million, AGR%, CAGR%)
Table 39 Asia Pacific mRNA Vaccines Market Forecast by Vaccine Type, 2023-2033 (US$ Million, AGR%, CAGR%)
Table 40 Asia Pacific mRNA Vaccines Market Forecast by Application, 2023-2033 (US$ Million, AGR%, CAGR%)
Table 41 Asia Pacific mRNA Vaccines Market Forecast by End-users, 2023-2033 (US$ Million, AGR%, CAGR%)
Table 42 Japan mRNA Vaccines Market Forecast, 2023-2033 (US$ Million, AGR%, CAGR%)
Table 43 China mRNA Vaccines Market Forecast, 2023-2033 (US$ Million, AGR%, CAGR%)
Table 44 India mRNA Vaccines Market Forecast, 2023-2033 (US$ Million, AGR%, CAGR%)
Table 45 Australia mRNA Vaccines Market Forecast, 2023-2033 (US$ Million, AGR%, CAGR%)
Table 46 South Korea mRNA Vaccines Market Forecast, 2023-2033 (US$ Million, AGR%, CAGR%)
Table 47 South-East Asia mRNA Vaccines Market Forecast, 2023-2033 (US$ Million, AGR%, CAGR%)
Table 48 Rest of Asia Pacific mRNA Vaccines Market Forecast, 2023-2033 (US$ Million, AGR%, CAGR%)
Table 49 Latin America mRNA Vaccines Market Forecast by Country, 2023-2033 (US$ Million, AGR%, CAGR%)
Table 50 Latin America mRNA Vaccines Market Forecast by Application, 2023-2033 (US$ Million, AGR%, CAGR%)
Table 51 Latin America mRNA Vaccines Market Forecast by End-users, 2023-2033 (US$ Million, AGR%, CAGR%)
Table 52 Brazil mRNA Vaccines Market Forecast, 2023-2033 (US$ Million, AGR%, CAGR%)
Table 53 Mexico mRNA Vaccines Market Forecast, 2023-2033 (US$ Million, AGR%, CAGR%)
Table 54 Rest of Latin America mRNA Vaccines Market Forecast, 2023-2033 (US$ Million, AGR%, CAGR%)
Table 55 MEA mRNA Vaccines Market Forecast by Country, 2023-2033 (US$ Million, AGR%, CAGR%)
Table 56 MEA mRNA Vaccines Market Forecast by Vaccine Type, 2023-2033 (US$ Million, AGR%, CAGR%)
Table 57 MEA mRNA Vaccines Market Forecast by Application, 2023-2033 (US$ Million, AGR%, CAGR%)
Table 58 MEA mRNA Vaccines Market Forecast by End-users, 2023-2033 (US$ Million, AGR%, CAGR%)
Table 59 GCC mRNA Vaccines Market Forecast, 2023-2033 (US$ Million, AGR%, CAGR%)
Table 60 South Africa mRNA Vaccines Market Forecast, 2023-2033 (US$ Million, AGR%, CAGR%)
Table 61 Rest of MEA mRNA Vaccines Market Forecast, 2023-2033 (US$ Million, AGR%, CAGR%)
Table 62 Pfizer Inc.: Key Details, (CEO, HQ, Revenue, Founded, No. of Employees, Company Type, Website, Business Segment)
Table 63 Pfizer Inc.: Product/Pipeline Benchmarking
Table 64 Pfizer Inc.: Strategic Outlook
Table 65 Moderna, Inc.: Key Details, (CEO, HQ, Revenue, Founded, No. of Employees, Company Type, Website, Business Segment)
Table 66 Moderna, Inc.: Product/Pipeline Benchmarking
Table 67 Moderna, Inc.: Strategic Outlook
Table 68 BioNTech SE: Key Details, (CEO, HQ, Revenue, Founded, No. of Employees, Company Type, Website, Business Segment)
Table 69 BioNTech SE: Product/Pipeline Benchmarking
Table 70 BioNTech SE: Strategic Outlook
Table 71 GSK plc: Key Details, (CEO, HQ, Revenue, Founded, No. of Employees, Company Type, Website, Business Segment)
Table 72 GSK plc: Product/Pipeline Benchmarking
Table 73 Daiichi Sankyo: Key Details, (CEO, HQ, Revenue, Founded, No. of Employees, Company Type, Website, Business Segment)
Table 74 Daiichi Sankyo: Product/Pipeline Benchmarking
Table 75 Daiichi Sankyo: Strategic Outlook
Table 76 Ethris GmbH: Key Details, (CEO, HQ, Revenue, Founded, No. of Employees, Company Type, Website, Business Segment)
Table 77 Ethris GmbH: Product/Pipeline Benchmarking
Table 78 Ethris GmbH: Strategic Outlook
Table 79 AIM Vaccine: Key Details, (CEO, HQ, Revenue, Founded, No. of Employees, Company Type, Website, Business Segment)
Table 80 AIM Vaccine: Product/Pipeline Benchmarking
Table 81 AIM Vaccine: Strategic Outlook
Table 82 Arcturus Therapeutics Inc.: Key Details, (CEO, HQ, Revenue, Founded, No. of Employees, Company Type, Website, Business Segment)
Table 83 Arcturus Therapeutics Inc.: Product/Pipeline Benchmarking
Table 84 CureVac: Key Details, (CEO, HQ, Revenue, Founded, No. of Employees, Company Type, Website, Business Segment)
Table 85 CureVac: Product/Pipeline Benchmarking
Table 86 CureVac: Strategic Outlook
Table 87 AstraZeneca: Key Details, (CEO, HQ, Revenue, Founded, No. of Employees, Company Type, Website, Business Segment)
Table 88 AstraZeneca: Product/Pipeline Benchmarking
Table 89 AstraZeneca: Strategic Outlook
Table 90 Sanofi: Key Details, (CEO, HQ, Revenue, Founded, No. of Employees, Company Type, Website, Business Segment)
Table 91 Sanofi: Product/Pipeline Benchmarking
Table 92 Sino Biopharmaceutical Co., Ltd.: Key Details, (CEO, HQ, Revenue, Founded, No. of Employees, Company Type, Website, Business Segment)
Table 93 Sino Biopharmaceutical Co., Ltd.: Product/Pipeline Benchmarking
List of Figures
Figure 1 mRNA Vaccines Market Segmentation
Figure 2 mRNA Vaccines Market by Vaccine Type: Market Attractiveness Index
Figure 3 mRNA Vaccines Market by Application: Market Attractiveness Index
Figure 4 mRNA Vaccines Market by End-users: Market Attractiveness Index
Figure 5 mRNA Vaccines Market Attractiveness Index by Region
Figure 6 mRNA Vaccines Market: Market Dynamics
Figure 7 mRNA Vaccines Market by Region, 2023-2033 (US$ Million, AGR %): “V” Shaped Recovery
Figure 8 mRNA Vaccines Market by Region, 2023-2033 (US$ Million, AGR %): “U” Shaped Recovery
Figure 9 mRNA Vaccines Market by Region, 2023-2033 (US$ Million, AGR %): “W” Shaped Recovery
Figure 10 mRNA Vaccines Market by Region, 2023-2033 (US$ Million, AGR %): “L” Shaped Recovery
Figure 11 mRNA Vaccines Market: Porter’s Five Forces Analysis
Figure 12 mRNA Vaccines Market: PEST Analysis
Figure 13 mRNA Vaccines Market Attractiveness Index by Vaccine Type
Figure 14 mRNA Vaccines Market Forecast by Vaccine Type, 2023-2033 (US$ Million, AGR %)
Figure 15 mRNA Vaccines Market Share Forecast by Vaccine Type, 2023, 2028, 2033 (%)
Figure 16 Self-amplifying mRNA-based Vaccines Segment Market Forecast by Region, 2023-2033 (US$ Million, AGR %)
Figure 17 Self-amplifying mRNA-based Vaccines Segment Market Share Forecast by Region, 2023 & 2033 (%)
Figure 18 Conventional Non-amplifying mRNA-based Vaccines Segment Market Forecast by Region, 2023-2033 (US$ Million, AGR %)
Figure 19 Conventional Non-amplifying mRNA-based Vaccines Segment Market Share Forecast by Region, 2023 & 2033 (%)
Figure 20 mRNA Vaccines Market Attractiveness Index by Vaccine Type
Figure 21 mRNA Vaccines Market Forecast by Application, 2023-2033 (US$ Million, AGR %)
Figure 22 mRNA Vaccines Market Share Forecast by Application, 2023, 2028, 2033 (%)
Figure 23 Cancer Segment Market Forecast by Region, 2023-2033 (US$ Million, AGR %)
Figure 24 Cancer Segment Market Share Forecast by Region, 2023 & 2033 (%)
Figure 25 Infectious Disease Segment Market Forecast by Region, 2023-2033 (US$ Million, AGR %)
Figure 26 Infectious Disease Segment Market Share Forecast by Region, 2023 & 2033 (%)
Figure 27 Autoimmune Diseases Segment Market Forecast by Region, 2023-2033 (US$ Million, AGR %)
Figure 28 Autoimmune Diseases Segment Market Share Forecast by Region, 2023 & 2033 (%)
Figure 29 Others Segment Market Forecast by Region, 2023-2033 (US$ Million, AGR %)
Figure 30 Others Segment Market Share Forecast by Region, 2023 & 2033 (%)
Figure 31 mRNA Vaccines Market Attractiveness Index by End-users
Figure 32 mRNA Vaccines Market Forecast by End-users, 2023-2033 (US$ Million, AGR %)
Figure 33 mRNA Vaccines Market Share Forecast by End-users, 2023, 2028, 2033 (%)
Figure 34 Hospitals and Clinics Segment Market Forecast by Region, 2023-2033 (US$ Million, AGR %)
Figure 35 Hospitals and Clinics Segment Market Share Forecast by Region, 2023 & 2033 (%)
Figure 36 Research Organisations Segment Market Forecast by Region, 2023-2033 (US$ Million, AGR %)
Figure 37 Research Organisations Segment Market Share Forecast by Region, 2023 & 2033 (%)
Figure 38 Others Segment Market Forecast by Region, 2023-2033 (US$ Million, AGR %)
Figure 39 Others Segment Market Share Forecast by Region, 2023 & 2033 (%)
Figure 40 mRNA Vaccines Market Forecast by Region 2023, 2028, 2033 (Revenue, CAGR%)
Figure 41 mRNA Vaccines Market Share Forecast by Region 2023, 2028, 2033 (%)
Figure 42 mRNA Vaccines Market by Region, 2023-2033 (US$ Mn)
Figure 43 North America mRNA Vaccines Market Attractiveness Index
Figure 44 North America mRNA Vaccines Market by Region, 2023, 2028 & 2033 (US$ million)
Figure 45 North America mRNA Vaccines Market Forecast by Country, 2023-2033 (US$ million)
Figure 46 North America mRNA Vaccines Market Share Forecast by Country, 2023 & 2033 (%)
Figure 47 North America mRNA Vaccines Market Forecast by Vaccine Type, 2023-2033 (US$ Million, AGR %)
Figure 48 North America mRNA Vaccines Market Share Forecast by Vaccine Type, 2023 & 2033 (%)
Figure 49 North America mRNA Vaccines Market Forecast by Application, 2023-2033 (US$ Million, AGR %)
Figure 50 North America mRNA Vaccines Market Share Forecast by Application, 2023 & 2033 (%)
Figure 51 North America mRNA Vaccines Market Forecast by End-users, 2023-2033 (US$ Million, AGR %)
Figure 52 North America mRNA Vaccines Market Share Forecast by End-users, 2023 & 2033 (%)
Figure 53 U.S. mRNA Vaccines Market Forecast, 2023-2033 (US$ Million, AGR %)
Figure 54 Canada mRNA Vaccines Market Forecast, 2023-2033 (US$ Million, AGR %)
Figure 55 Europe mRNA Vaccines Market Attractiveness Index
Figure 56 Europe mRNA Vaccines Market by Region, 2023, 2028 & 2033 (US$ million)
Figure 57 Europe mRNA Vaccines Market Forecast by Country, 2023-2033 (US$ million, AGR %)
Figure 58 Europe mRNA Vaccines Market Share Forecast by Country, 2023 & 2033 (%)
Figure 59 Europe mRNA Vaccines Market Forecast by Vaccine Type, 2023-2033 (US$ Million, AGR %)
Figure 60 Europe mRNA Vaccines Market Share Forecast by Vaccine Type, 2023 & 2033 (%)
Figure 61 Europe mRNA Vaccines Market Forecast by Application, 2023-2033 (US$ Million, AGR %)
Figure 62 Europe mRNA Vaccines Market Share Forecast by Application, 2023 & 2033 (%)
Figure 63 Europe mRNA Vaccines Market Forecast by End-users, 2023-2033 (US$ Million, AGR %)
Figure 64 Europe mRNA Vaccines Market Share Forecast by End-users, 2023 & 2033 (%)
Figure 65 Germany mRNA Vaccines Market Forecast, 2023-2033 (US$ Million, AGR %)
Figure 66 UK mRNA Vaccines Market Forecast, 2023-2033 (US$ Million, AGR %)
Figure 67 France mRNA Vaccines Market Forecast, 2023-2033 (US$ Million, AGR %)
Figure 68 Italy mRNA Vaccines Market Forecast, 2023-2033 (US$ Million, AGR %)
Figure 69 Spain mRNA Vaccines Market Forecast, 2023-2033 (US$ Million, AGR %)
Figure 70 Russia mRNA Vaccines Market Forecast, 2023-2033 (US$ Million, AGR %)
Figure 71 Rest of Europe mRNA Vaccines Market Forecast, 2023-2033 (US$ Million, AGR %)
Figure 72 Asia Pacific mRNA Vaccines Market Attractiveness Index
Figure 73 Asia Pacific mRNA Vaccines Market by Region, 2023, 2028 & 2033 (US$ million)
Figure 74 Asia Pacific mRNA Vaccines Market Forecast by Country, 2023-2033 (US$ million, AGR %)
Figure 75 Asia Pacific mRNA Vaccines Market Share Forecast by Country, 2023 & 2033 (%)
Figure 76 Asia Pacific mRNA Vaccines Market Forecast by Vaccine Type, 2023-2033 (US$ Million, AGR %)
Figure 77 Asia Pacific mRNA Vaccines Market Share Forecast by Vaccine Type, 2023 & 2033 (%)
Figure 78 Asia Pacific mRNA Vaccines Market Forecast by Application, 2023-2033 (US$ Million, AGR %)
Figure 79 Asia Pacific mRNA Vaccines Market Share Forecast by Application, 2023 & 2033 (%)
Figure 80 Asia Pacific mRNA Vaccines Market Forecast by End-users, 2023-2033 (US$ Million, AGR %)
Figure 81 Asia Pacific mRNA Vaccines Market Share Forecast by End-users, 2023 & 2033 (%)
Figure 82 Japan mRNA Vaccines Market Forecast, 2023-2033 (US$ Million, AGR %)
Figure 83 China mRNA Vaccines Market Forecast, 2023-2033 (US$ Million, AGR %)
Figure 84 India mRNA Vaccines Market Forecast, 2023-2033 (US$ Million, AGR %)
Figure 85 Australia mRNA Vaccines Market Forecast, 2023-2033 (US$ Million, AGR %)
Figure 86 South Korea mRNA Vaccines Market Forecast, 2023-2033 (US$ Million, AGR %)
Figure 87 South-East Asia mRNA Vaccines Market Forecast, 2023-2033 (US$ Million, AGR %)
Figure 88 Rest of Asia Pacific mRNA Vaccines Market Forecast, 2023-2033 (US$ Million, AGR %)
Figure 89 Latin America mRNA Vaccines Market Attractiveness Index
Figure 90 Latin America mRNA Vaccines Market by Region, 2023, 2028 & 2033 (US$ million)
Figure 91 Latin America mRNA Vaccines Market Forecast by Country, 2023-2033 (US$ million)
Figure 92 Latin America mRNA Vaccines Market Share Forecast by Country, 2023 & 2033 (%)
Figure 93 Latin America mRNA Vaccines Market Forecast by Vaccine Type, 2023-2033 (US$ Million, AGR %)
Figure 94 Latin America mRNA Vaccines Market Share Forecast by Vaccine Type, 2023 & 2033 (%)
Figure 95 Latin America mRNA Vaccines Market Forecast by Application, 2023-2033 (US$ Million, AGR %)
Figure 96 Latin America mRNA Vaccines Market Share Forecast by Application, 2023 & 2033 (%)
Figure 97 Latin America mRNA Vaccines Market Forecast by End-users, 2023-2033 (US$ Million, AGR %)
Figure 98 Latin America mRNA Vaccines Market Share Forecast by End-users, 2023 & 2033 (%)
Figure 99 Brazil mRNA Vaccines Market Forecast, 2023-2033 (US$ Million, AGR %)
Figure 100 Mexico mRNA Vaccines Market Forecast, 2023-2033 (US$ Million, AGR %)
Figure 101 Rest of Latin America mRNA Vaccines Market Forecast, 2023-2033 (US$ Million, AGR %)
Figure 102 MEA mRNA Vaccines Market Attractiveness Index
Figure 103 MEA mRNA Vaccines Market by Region, 2023, 2028 & 2033 (US$ million)
Figure 104 MEA mRNA Vaccines Market Forecast by Country, 2023-2033 (US$ million)
Figure 105 MEA mRNA Vaccines Market Share Forecast by Country, 2023 & 2033 (%)
Figure 106 MEA mRNA Vaccines Market Forecast by Vaccine Type, 2023-2033 (US$ Million, AGR %)
Figure 107 MEA mRNA Vaccines Market Share Forecast by Vaccine Type, 2023 & 2033 (%)
Figure 108 MEA mRNA Vaccines Market Forecast by Application, 2023-2033 (US$ Million, AGR %)
Figure 109 MEA mRNA Vaccines Market Share Forecast by Application, 2023 & 2033 (%)
Figure 110 MEA mRNA Vaccines Market Forecast by End-users, 2023-2033 (US$ Million, AGR %)
Figure 111 MEA mRNA Vaccines Market Share Forecast by End-users, 2023 & 2033 (%)
Figure 112 GCC mRNA Vaccines Market Forecast, 2023-2033 (US$ Million, AGR %)
Figure 113 South Africa mRNA Vaccines Market Forecast, 2023-2033 (US$ Million, AGR %)
Figure 114 Rest of MEA mRNA Vaccines Market Forecast, 2023-2033 (US$ Million, AGR %)
Figure 115 Pfizer Inc.: Net Revenue, 2015-2022 (US$ million, AGR%)
Figure 116 Pfizer Inc.: Regional Market Shares (%), 2022
Figure 117 Pfizer Inc.: R&D, 2015-2022 (US$ million, AGR%)
Figure 118 Moderna, Inc.: Net Revenue, 2016-2022 (US$ million, AGR%)
Figure 119 Moderna, Inc.: R&D, 2016-2022 (US$ million, AGR%)
Figure 120 BioNTech SE: Net Revenue, 2018-2022 (US$ million, AGR%)
Figure 121 BioNTech SE: R&D, 2018-2022 (US$ million, AGR%)
Figure 122 GSK plc: Net Revenue, 2015-2022 (US$ million, AGR%)
Figure 123 GSK plc: Regional Market Shares (%), 2022
Figure 124 GSK plc: R&D, 2015-2022 (US$ million, AGR%)
Figure 125 AstraZeneca: Net Revenue, 2015-2022 (US$ million, AGR%)
Figure 126 AstraZeneca: Regional Market Shares (%), 2022
Figure 127 AstraZeneca: R&D, 2015-2022 (US$ million, AGR%)
Figure 128 Sanofi: Net Revenue, 2018-2022 (US$ million, AGR%)
Figure 129 Sanofi: Regional Market Shares (%), 2022
Figure 130 Sanofi: R&D, 2018-2022 (US$ million, AGR%)
ページTOPに戻る
本レポートと同分野(医療/ヘルスケア)の最新刊レポート
Visiongain社のヘルスケアと医薬・化学品分野での最新刊レポート
本レポートと同じKEY WORD(mrna vaccines)の最新刊レポート
- 本レポートと同じKEY WORDの最新刊レポートはありません。
よくあるご質問
Visiongain社はどのような調査会社ですか?
英国の調査会社ヴィジョンゲイン社(Visiongain)は、通信とエネルギーのほか、自動車や化学・医薬品、金属など、広範な市場を対象に調査を行っています。自動車市場については、市場全般に関する調査のほ... もっと見る
調査レポートの納品までの日数はどの程度ですか?
在庫のあるものは速納となりますが、平均的には 3-4日と見て下さい。
但し、一部の調査レポートでは、発注を受けた段階で内容更新をして納品をする場合もあります。
発注をする前のお問合せをお願いします。
注文の手続きはどのようになっていますか?
1)お客様からの御問い合わせをいただきます。
2)見積書やサンプルの提示をいたします。
3)お客様指定、もしくは弊社の発注書をメール添付にて発送してください。
4)データリソース社からレポート発行元の調査会社へ納品手配します。
5) 調査会社からお客様へ納品されます。最近は、pdfにてのメール納品が大半です。
お支払方法の方法はどのようになっていますか?
納品と同時にデータリソース社よりお客様へ請求書(必要に応じて納品書も)を発送いたします。
お客様よりデータリソース社へ(通常は円払い)の御振り込みをお願いします。
請求書は、納品日の日付で発行しますので、翌月最終営業日までの当社指定口座への振込みをお願いします。振込み手数料は御社負担にてお願いします。
お客様の御支払い条件が60日以上の場合は御相談ください。
尚、初めてのお取引先や個人の場合、前払いをお願いすることもあります。ご了承のほど、お願いします。
データリソース社はどのような会社ですか?
当社は、世界各国の主要調査会社・レポート出版社と提携し、世界各国の市場調査レポートや技術動向レポートなどを日本国内の企業・公官庁及び教育研究機関に提供しております。
世界各国の「市場・技術・法規制などの」実情を調査・収集される時には、データリソース社にご相談ください。
お客様の御要望にあったデータや情報を抽出する為のレポート紹介や調査のアドバイスも致します。
|
|

