廃水回収システム市場レポート:2023-2033
Wastewater Recovery Systems Market Report 2023-2033
レポート詳細
廃水回収システム市場レポート 2023-2033年: 本レポートは、業界とその基礎となる原動力をより良く理解することを望むなら、新たな収益ポケットを目指す大手企業にとって貴重なものと... もっと見る
※上記価格は部署ライセンス(Departmental licence)価格です。
その他の価格についてはデータリソースまでお問合せください。
日本語のページは自動翻訳を利用し作成しています。
実際のレポートは英文のみでご納品いたします。

|

|
サマリー
レポート詳細
廃水回収システム市場レポート 2023-2033年:本レポートは、業界とその基礎となる原動力をより良く理解することを望むなら、新たな収益ポケットを目指す大手企業にとって貴重なものとなるでしょう。異業種への進出や新規地域での既存事業の拡大を目指す企業にも有用です。
持続可能な水管理ソリューションへの需要の高まりが市場を牽引
未処理または不適切に管理された廃水が生態系、人の健康、環境に及ぼす悪影響に関する知識の高まりにより、廃水に関連する環境・健康問題への対処に対する需要が増加している。特に、未処理または不適切に処理された廃水の排出は、危険な化学物質や毒素を水域に持ち込み、水質汚染を引き起こす可能性がある。水質汚染は水生生物に害を与え、生態系を乱し、飲料水源を汚染する可能性がある。このような問題を解決するために、高度な廃水回収技術、より良い水管理戦略、廃水回収システムの導入がますます必要とされている。公衆衛生を守り、環境を保全し、人々と生態系の持続可能な未来を保証するためには、適切な廃水回収と持続可能な水管理が不可欠です。
廃水回収への投資: 高いコストと長期的な報酬
廃水回収システムに必要な設備投資には、最先端技術の統合、堅牢なインフラの整備、厳格な法的要件の遵守、熟練した労働力とメンテナンスの必要性など、さまざまな要素が含まれる。これらの要素が総合的に、このようなシステムの設置に伴う比較的高額な初期費用の原因となっている。しかし、この初期費用が長期的に大きな利点をもたらすことを認識することが極めて重要である。廃水回収システムは、水資源を節約し汚染を最小限に抑えることで、環境の持続可能性に貢献するだけでなく、長期的には経済的なメリットももたらす。効率的な水のリサイクルと環境負荷の低減により、これらのシステムは水供給と廃水処理のコスト削減につながります。さらに、法的規制を遵守することで、企業は潜在的な罰則や風評被害を確実に回避できる。さらに、専門的な労働力とメンテナンスの需要は、廃水回収分野における雇用機会を創出し、熟練労働力を維持する。
市場調査レポートを購入する前にすべき質問とは?
- 廃水回収システム市場はどのように進化しているのか?
- 何が廃水回収システム市場を促進し、抑制しているのか?
- 各排水回収システムサブマーケットセグメントは予測期間中にどのように成長し、これらのサブマーケットが2033年にどれくらいの収益を占めるのか?
- 2023年から2033年にかけて、各排水回収システムサブマーケットの市場シェアはどのように推移するのか?
- 2023年から2033年にかけて市場全体の主な牽引役は何か?
- 主要な廃水回収システム市場はマクロ経済の動きに概ね追随するのか、それとも個々の国内市場が他を凌駕するのか?
- 2033年までに各国市場のシェアはどう変化し、2033年に市場をリードするのはどの地域か?
- 主要プレーヤーは誰か、また予測期間中の見通しは?
- 主要企業の廃水回収システムプロジェクトとは?
- 2023年から2033年にかけて、業界はどのように発展していくのか?現在および今後10年間に実施される廃水回収システムプロジェクトにはどのような意味があるのか?
- 廃水回収システム市場をさらに拡大するために、製品の商業化の必要性は高まっているか?
- 廃水回収システム市場の方向性と、市場の最前線に立つための方法とは?
- 新製品やサービスラインへの最適な投資方法とは?
- 企業を新たな成長軌道に乗せ、C-suiteに移行させるための重要な展望とは?
このことが、現在、そして今後10年間の廃水回収システム市場にどのような影響を与えるかを見極める必要がある:
- 323ページにわたる本レポートでは、103の表と142の図表を掲載しています。
- 本レポートでは、業界における主要な有利分野を取り上げているため、今すぐターゲットを絞ることができます。
- 世界、地域、国の売上と成長に関する詳細な分析が含まれています。
- 競合他社が成功した主なトレンド、変化、収益予測をハイライトしています。
本レポートは、廃水回収システム市場が今後10年間でどのように発展するか、またCOVID-19の景気後退と好況の変動に合わせてどのように発展するかをお伝えします。この市場は、過去10年間のどの時点よりも今が重要です。
2033年までの予測やその他の分析から、商業的な展望が明らかになる
- 2033年までの収益予測に加え、直近の業績、成長率、市場シェアもご覧いただけます。
- ビジネスの展望と展開に関する独自の分析をご覧いただけます。
- 定性的分析(市場力学、促進要因、機会、阻害要因、課題を含む)、コスト構造、廃水回収システム価格上昇の影響、最近の動向をご覧いただけます。
本レポートには、COVID-19が業界と貴社にどのような影響を与えるかについてのデータ分析と貴重な洞察が含まれている。本レポートでは、COVID-19の4つの回収パターンとその影響、すなわち「V」、「L」、「W」、「U」について論じている。
レポート対象セグメント
技術
- 活性炭
- 限外ろ過・逆浸透膜
- 膜ろ過
- IERシステム
- メディアろ過
- その他の技術
用途
- 医薬品
- 石油・ガス
- 金属鉱業
- 化学
- 食品・飲料
- その他の用途
世界市場全体と各分野の売上予測に加え、5つの地域と17の主要国市場の売上予測も掲載しています:
北米
- アメリカ
- カナダ
- その他の北米地域
欧州
- ロシア
- トルコ
- スペイン
- フランス
- 英国
- その他の欧州
アジア太平洋
- 中国
- 日本
- インド
- インドネシア
- 韓国
- その他のアジア太平洋地域
MEA
- GCC
- エジプト
- 南アフリカ
- その他のMEA
ラテンアメリカ
- ブラジル
- メキシコ
- その他のラテンアメリカ
本レポートには、廃水回収システム市場の2023年から2033年までの主要企業のプロファイルも含まれており、これらの企業の事業のこのセグメントに焦点を当てている。
主要企業と市場成長の可能性
・ A.O Smith Corporation
・ AECOM
・ Aquatech International
・ Doosan Enerbility
・ Ecolab
・ Evoqua Water Technologies
・ Hitachi Zosen Corporation
・ Kubota Corporation
・ Kurita Water Industries
・ Ovivo
・ Pall Corporation
・ Suez SA
・ Veolia
・ Vinnolit
・ Xylem
廃水回収システム市場全体の世界売上高(金額ベース)2023年~2033年は、2023年に270億3,000万米ドルを突破するとの試算がある。2033年まで力強い収益成長を予測。当調査では、最も大きな可能性を秘めた企業を特定しています。彼らの能力、進歩、商業的展望を発見し、一歩先を行くお手伝いをします。
廃水回収システム市場、2023-2033年レポートはどのようにお役に立つでしょうか?
要約すると、320ページを超えるこのレポートは、以下の知識を提供する:
- 廃水回収システム市場の2023年から2033年までの収益予測 世界および地域レベルの技術、用途、各予測による市場予測 - 業界の展望を発見し、投資と収益に最も有利な場所を見つけます。
- 5つの地域と17の主要国市場の2033年までの収益予測 - 北米、ヨーロッパ、アジア太平洋、MEA、ラテンアメリカの廃水回収システム市場の2023年から2033年までの予測をご覧ください。また、米国、カナダ、メキシコ、ブラジル、フランス、英国、中国、インド、日本、ロシアなどの著名経済圏の市場も予測しています。
- 既存企業や市場参入を目指す企業の展望 - 廃水回収システム市場に関わる主要企業15社の企業プロファイルを含む、2023年から2033年までの市場。
独自の予測による定量的・定性的分析をご覧ください。私たちのレポートだけに含まれる情報を入手し、貴重なビジネスインテリジェンスで情報を得ることができます。
他にはない情報
私たちの新しいレポートがあれば、知識に遅れをとったり、チャンスを逃したりする可能性が低くなります。弊社の調査レポートが貴社の調査、分析、意思決定にどのように役立つかをご覧ください。Visiongainの調査は、廃水回収システム市場、2023年から2033年、市場をリードする企業の商業分析を必要とするすべての人のためのものです。データ、トレンド、予測をご覧いただけます。
ページTOPに戻る
目次
目次
1 レポート概要
1.1 研究の目的
1.2 廃水回収システム市場の紹介
1.3 本レポートの内容
1.4 本レポートを読むべき理由
1.5 本分析レポートが回答する主な質問
1.6 本レポートは誰のためのものか?
1.7 方法論
1.7.1 市場の定義
1.7.2 市場評価・予測手法
1.7.3 データの検証
1.7.3.1 一次調査
1.7.3.2 セカンダリーリサーチ
1.8 よくある質問(FAQ)
1.9 Visiongainの関連レポート
1.10 Visiongainについて
2 エグゼクティブ・サマリー
3 市場概要
3.1 主要な調査結果
3.2 市場ダイナミクス
3.2.1 市場促進要因
3.2.1.1 持続可能な水管理ソリューションに対する需要の増加
3.2.1.2 主要企業による戦略的取り組み
3.2.1.3 増大する水不足とグリーン産業への傾斜
3.2.2 市場抑制要因
3.2.2.1 高エネルギー消費の増大
3.2.2.2 技術・メンテナンス関連の課題
3.2.2.3 高い設備投資
3.2.3 市場機会
3.2.3.1 都市化と工業化の進展
3.2.3.2 政府イニシアチブの増加
3.2.3.3 環境意識の高まり
3.3 COVID-19の影響分析
3.4 ポーターのファイブフォース分析
3.4.1 サプライヤーの交渉力(低)
3.4.2 買い手の交渉力(中)
3.4.3 競争力(高)
3.4.4 代替品による脅威(低)
3.4.5 新規参入企業の脅威(低)
3.5 PEST分析
4 廃水回収システム市場分析:技術別
4.1 主な調査結果
4.2 技術セグメント 市場魅力度指数
4.3 廃水回収システムの技術別市場規模の推定と予測
4.4 活性炭
4.4.1 ベルギーの活性炭活性化炉
4.4.2 2023~2033年の地域別市場規模(US$ Billion)
4.4.3 地域別市場シェア、2023年・2033年(%)
4.5 限外濾過と逆浸透膜
4.5.1 デュポンがクローズドサーキットの持続可能な利点でイーディ賞を受賞
4.5.2 2023~2033年の地域別市場規模(US$ Billion)
4.5.3 地域別市場シェア、2023年・2033年(%)
4.6 膜ろ過
4.6.1 大規模農場を助ける水ろ過システム-双性イオン
4.6.2 2023~2033年の地域別市場規模(US$ Billion)
4.6.3 地域別市場シェア、2023年・2033年(%)
4.7 IERシステム
4.7.1 ランクセス、イオン交換樹脂を値上げ
4.7.2 2023〜2033年の地域別市場規模(US$ Billion)
4.7.3 地域別市場シェア、2023年・2033年(%)
4.8 メディアろ過
4.8.1 パイル布メディアろ過はマイクロプラスチックの除去に役立つ
4.8.2 2023~2033年の地域別市場規模(US$ Billion)
4.8.3 地域別市場シェア、2023年・2033年(%)
4.9 その他の技術
4.9.1 Nasaが水回収のマイルストーンを達成
4.9.2 2023〜2033年の地域別市場規模(US$ Billion)
4.9.3 地域別市場シェア、2023年・2033年(%)
5 廃水回収システム市場分析:用途別
5.1 主な調査結果
5.2 用途セグメント 市場魅力度指数
5.3 廃水回収システムの用途別市場規模の推定と予測
5.4 医薬品
5.4.1 残留医薬品対策に乗り出すEU
5.4.2 2023〜2033年の地域別市場規模(US$ Billion)
5.4.3 地域別市場シェア、2023年・2033年(%)
5.5 石油・ガス
5.5.1 水質汚染トップはシェブロンのエルセグンド施設
5.5.2 2023〜2033年の地域別市場規模(US$ Billion)
5.5.3 地域別市場シェア、2023年・2033年(%)
5.6 金属鉱業
5.6.1 重要鉱物の回収ソリューション
5.6.2 2023〜2033年の地域別市場規模(US$ Billion)
5.6.3 地域別市場シェア、2023年・2033年(%)
5.7 化学
5.7.1 SUEZが新たな有害廃棄物処理プロジェクトに成功
5.7.2 2023年~2033年の地域別市場規模(US$ Billion)
5.7.3 地域別市場シェア、2023年・2033年(%)
5.8 食品・飲料
5.8.1 Skuma Water、廃水ゼロ浄化のための資金調達を実施
5.8.2 2023〜2033年の地域別市場規模(US$ Billion)
5.8.3 地域別市場シェア、2023年・2033年(%)
5.9 その他の用途
5.9.1 アマーストの水回収事業Elateqがペプシコと提携拡大中
5.9.2 地元ビール会社の副産物が廃水洗浄プロセスを支援
5.9.3 2023-2033年の地域別市場規模(US$ Billion)
5.9.4 地域別市場シェア、2023年・2033年(%)
6 廃水回収システム市場分析:地域別
6.1 主要な調査結果
6.2 地域別市場規模の推定と予測
7 北米の廃水回収システム市場分析
7.1 主要な調査結果
7.2 北米の廃水回収システム市場魅力度指数
7.3 北米の廃水回収システム国別市場、2023年、2028年、2033年(US$ Billion)
7.4 北米の廃水回収システム市場規模推定と予測:国別
7.5 北米の廃水回収システム市場規模推定と予測:技術別
7.6 北米の廃水回収システム市場規模推定と予測:用途別
7.7 アメリカの廃水回収システム市場分析
7.7.1 グアム、飲料水と廃水インフラの回収活動を完了
7.7.2 Valicor Environmental Services社がClean Water Environmental社を買収
7.8 カナダの廃水回収システム市場分析
7.8.1 カナダは廃水回収のアップグレードに投資
8 欧州の廃水回収システム市場分析
8.1 主要な調査結果
8.2 欧州廃水回収システム市場魅力度指数
8.3 欧州の廃水回収システム国別市場、2023年、2028年、2033年 (US$ Billion)
8.4 欧州の排水回収システム市場規模推定と予測:国別
8.5 欧州の廃水回収システム市場規模推定と予測:技術別
8.6 欧州の廃水回収システム市場規模推定と予測:用途別
8.7 ロシアの廃水回収システム市場分析
8.7.1 ロシアとウクライナの軍事紛争が水インフラと水資源に与える影響
8.8 トルコの廃水回収システム市場分析
8.8.1 トルコではUnitopがTeks- Intertekstilと提携を開始
8.8.2 Vatekの廃水・リサイクルシステムで使用水の92%を回収
8.9 スペインの廃水回収システム市場分析
8.9.1 下水管から飲料用グラスへ: 今後の廃水回収
8.10 フランスの廃水回収システム市場分析
8.10.1 フランス最大の下水回収施設
8.10.2 下水の再利用におけるフランスのキャッチアップへの取り組み
8.11 イギリスの廃水回収システム市場分析
8.11.1 気候変動が英国の廃水インフラを危機にさらす
8.11.2 HUBER Technology UK、下水エネルギー回収でNoventaと協力
8.12 その他の欧州の廃水回収システム市場分析
9 アジア太平洋地域の廃水回収システム市場分析
9.1 主要な調査結果
9.2 アジア太平洋地域の廃水回収システム市場魅力度指数
9.3 アジア太平洋地域の廃水回収システム国別市場、2023年、2028年、2033年(US$ Billion)
9.4 アジア太平洋地域の廃水回収システム市場規模推定と予測:国別
9.5 アジア太平洋地域の廃水回収システム市場規模推定と予測:技術別
9.6 アジア太平洋地域の廃水回収システム市場規模推定と予測:用途別
9.7 中国の廃水回収システム市場分析
9.7.1 中国の大規模廃水回収施設
9.8 日本の廃水回収システム市場分析
9.8.1 バギオに分散型廃水回収施設が設置された
9.8.2 原子力専門家が日本の放射性廃水処理計画を議論
9.9 インドの廃水回収システム市場分析
9.9.1 アップグレードされたインドの水回収システム
9.9.2 水の安全保障を高める分散型廃水回収システム
9.10 インドネシアの廃水回収システム市場分析
9.10.1 オーストラリアとインドネシアが建設したパレンバンの廃水回収施設
9.11 韓国の廃水回収システムの市場分析
9.11.1 バイオ電気化学システムのスケールアップ戦略
9.11.2 計画的な廃水放出に対する懸念
9.12 その他のアジア太平洋地域の廃水回収システム市場分析
10 中東・アフリカの廃水回収システム市場分析
10.1 主要調査結果
10.2 中東・アフリカ廃水回収システム市場魅力度指数
10.3 中東・アフリカ廃水回収システムの国別市場、2023年、2028年、2033年(US$ Billion)
10.4 中東・アフリカ廃水回収システム市場規模推定と予測:国別
10.5 中東・アフリカ廃水回収システム市場規模推定と予測:技術別
10.6 中東・アフリカ廃水回収システム市場規模推定と予測:用途別
10.7 GCCの廃水回収システム市場分析
10.7.1 海水淡水化、廃水回収、デジタル化など、中東の水分野における主要な成長可能性
10.8 エジプトの廃水回収システム市場分析
10.8.1 スエズ運河に建設される3つの廃棄物リサイクルプラント
10.8.2 エジプトのアレクサンドリア・イーストに下水汚泥回収装置を設置
10.9 南アフリカの廃水回収システム市場分析
10.9.1 バイオガス施設は自治体システムに放出される廃水を浄化する
10.9.2 スカラベの廃水ソリューション最優秀賞受賞
10.10 その他の中東・アフリカの廃水回収システム市場分析
10.10.1 持続可能な開発のための水関連行動の動員
11 ラテンアメリカの廃水回収システム市場分析
11.1 主要な調査結果
11.2 ラテンアメリカの廃水回収システム市場魅力度指数
11.3 ラテンアメリカの廃水回収システム国別市場、2023年、2028年、2033年(US$ Billion)
11.4 ラテンアメリカの廃水回収システム市場規模推定と予測:国別
11.5 ラテンアメリカの廃水回収システム市場規模推定と予測:技術別
11.6 ラテンアメリカの廃水回収システム市場規模推定と予測:用途別
11.7 ブラジルの廃水回収システム市場分析
11.7.1 ブラジルで始まる競争の新段階
11.7.2 下水回収の新技術は窒素を70%除去できる
11.8 メキシコ下水回収システム市場分析
11.8.1 ティファナ川廃水流出削減のための米国・メキシコ共同イニシアティブ
11.9 その他のラテンアメリカの廃水回収システム市場分析
12 企業のプロフィール
12.1 競争環境、2022年
12.2 戦略的展望
12.3 Suez SA
12.3.1 会社概要
12.3.2 会社概要
12.3.3 財務分析
12.3.3.1 純収入、2017-2021年
12.3.3.2 売上総利益、2017-2021年
12.3.3.3 地域市場シェア、2022年
12.3.4 製品ベンチマーク
12.3.5 戦略的展望
12.4 Veolia
12.4.1 会社概要
12.4.2 会社概要
12.4.3 財務分析
12.4.3.1 純収入、2017-2022年
12.4.3.2 売上総利益、2017-2022年
12.4.3.3 地域市場シェア、2022年
12.4.4 製品ベンチマーク
12.4.5 戦略的展望
12.5 Vinnolit
12.5.1 会社概要
12.5.2 会社概要
12.5.3 財務分析
12.5.3.1 純収入、2017-2022年
12.5.3.2 売上総利益、2017-2022年
12.5.3.3 地域市場シェア、2022年
12.5.4 製品ベンチマーク
12.5.5 戦略的展望
12.6 Pall Corporation
12.6.1 会社概要
12.6.2 会社概要
12.6.3 財務分析
12.6.3.1 純収入、2017-2022年
12.6.3.2 売上総利益、2017-2022年
12.6.3.3 地域市場シェア、2022年
12.6.4 製品ベンチマーク
12.6.5 戦略的展望
12.7 Xylem
12.7.1 会社概要
12.7.2 会社概要
12.7.3 財務分析
12.7.3.1 純収入、2017-2022年
12.7.3.2 売上総利益、2017年〜2022年
12.7.3.3 地域市場シェア、2022年
12.7.4 製品ベンチマーク
12.7.5 戦略的展望
12.8 Ecolab
12.8.1 会社概要
12.8.2 会社概要
12.8.3 財務分析
12.8.3.1 純収入、2017-2022年
12.8.3.2 売上総利益、2017-2022年
12.8.3.3 地域市場シェア、2022年
12.8.4 製品ベンチマーク
12.8.5 戦略的展望
12.9 Evoqua Water Technologies
12.9.1 会社概要
12.9.2 会社概要
12.9.3 財務分析
12.9.3.1 純収入、2017-2022年
12.9.3.2 R&D、2017-2022年
12.9.3.3 地域市場シェア、2022年
12.9.4 製品ベンチマーク
12.9.5 戦略的展望
12.10 Ovivo
12.10.1 会社概要
12.10.2 会社概要
12.10.3 製品ベンチマーク
12.10.4 戦略的展望
12.11 Kubota Corporation
12.11.1 会社概要
12.11.2 会社概要
12.11.3 財務分析
12.11.3.1 純収入、2017-2022年
12.11.3.2 売上総利益、2017年〜2022年
12.11.3.3 地域市場シェア、2022年
12.11.4 製品ベンチマーク
12.11.5 戦略的展望
12.12 AECOM
12.12.1 会社概要
12.12.2 会社概要
12.12.3 財務分析
12.12.3.1 純収入、2017-2022年
12.12.3.2 売上総利益、2017-2022年
12.12.3.3 地域市場シェア、2022年
12.12.4 製品ベンチマーク
12.12.5 戦略的展望
12.13 Aquatech International
12.13.1 会社概要
12.13.2 会社概要
12.13.3 製品ベンチマーク
12.13.4 戦略的展望
12.14 Kurita Water Industries
12.14.1 会社概要
12.14.2 会社概要
12.14.3 財務分析
12.14.3.1 純収入、2017-2022年
12.14.3.2 営業利益、2017-2022年
12.14.3.3 地域市場シェア、2022年
12.14.4 製品ベンチマーク
12.14.5 戦略的展望
12.15 Hitachi Zosen Corporation
12.15.1 会社概要
12.15.2 会社概要
12.15.3 財務分析
12.15.3.1 純売上高、2017-2022年
12.15.3.2 売上総利益、2017-2022年
12.15.3.3 地域市場シェア、2022年
12.15.4 製品ベンチマーク
12.15.5 戦略的展望
12.16 A.O Smith Corporation
12.16.1 会社概要
12.16.2 会社概要
12.16.3 財務分析
12.16.3.1 純収入、2017-2022年
12.16.3.2 売上総利益、2017-2022年
12.16.3.3 地域市場シェア、2022年
12.16.4 製品ベンチマーク
12.16.5 戦略的展望
12.17 Doosan Enerbility
12.17.1 会社概要
12.17.2 会社概要
12.17.2.1 2022年の地域別市場シェア
12.17.3 製品ベンチマーク
12.17.4 戦略的展望
13 結論と提言
13.1 Visiongainからの結びの言葉
13.2 市場プレーヤーへの提言
13.2.1 持続可能性と環境面での利点の重視
13.2.2 研究開発への投資
13.2.3 教育と意識改革
13.2.4 発展途上国での事業拡大
ページTOPに戻る
図表リスト
表の一覧
Table 1 Wastewater Recovery Systems Market Snapshot, 2023 & 2033 (US$ Billion, CAGR %)
Table 2 Wastewater Recovery Systems Market Forecast by Region, 2023-2033 (US$ Billion, AGR%, CAGR%): “V” Shaped Recovery
Table 3 Wastewater Recovery Systems Market Forecast by Region, 2023-2033 (US$ Billion, AGR%, CAGR%): “U” Shaped Recovery
Table 4 Wastewater Recovery Systems Market Forecast by Region, 2023-2033 (US$ Billion, AGR%, CAGR%): “W” Shaped Recovery
Table 5 Wastewater Recovery Systems Market Forecast by Region, 2023-2033 (US$ Billion, AGR%, CAGR%): “L” Shaped Recovery
Table 6 Wastewater Recovery Systems Market Forecast by Technology, 2023-2033 (US$ Billion, AGR%, CAGR%)
Table 7 Activated Carbon Segment Market Forecast by Region, 2023-2033 (US$ Billion, AGR%, CAGR%)
Table 8 Ultra-filtration & Reverse Osmosis Segment Market Forecast by Region, 2023-2033 (US$ Billion, AGR%, CAGR%)
Table 9 Membrane Filtration Segment Market Forecast by Region, 2023-2033 (US$ Billion, AGR%, CAGR%)
Table 10 IER Systems Segment Market Forecast by Region, 2023-2033 (US$ Billion, AGR%, CAGR%)
Table 11 Media Filtration Segment Market Forecast by Region, 2023-2033 (US$ Billion, AGR%, CAGR%)
Table 12 Others Segment Market Forecast by Region, 2023-2033 (US$ Billion, AGR%, CAGR%)
Table 13 Wastewater Recovery Systems Market Forecast by Application, 2023-2033 (US$ Billion, AGR%, CAGR%)
Table 14 Pharmaceuticals Segment Market Forecast by Region, 2023-2033 (US$ Billion, AGR%, CAGR%)
Table 15 Oil & Gas Segment Market Forecast by Region, 2023-2033 (US$ Billion, AGR%, CAGR%)
Table 16 Metal Mining Segment Market Forecast by Region, 2023-2033 (US$ Billion, AGR%, CAGR%)
Table 17 Chemical Segment Market Forecast by Region, 2023-2033 (US$ Billion, AGR%, CAGR%)
Table 18 Food & Beverages Segment Market Forecast by Region, 2023-2033 (US$ Billion, AGR%, CAGR%)
Table 19 Others Segment Market Forecast by Region, 2023-2033 (US$ Billion, AGR%, CAGR%)
Table 20 Wastewater Recovery Systems Market Forecast by Region, 2023-2033 (US$ Billion, AGR%, CAGR%)
Table 21 North America Wastewater Recovery Systems Market Forecast by Country, 2023-2033 (US$ Billion, AGR%, CAGR%)
Table 22 North America Wastewater Recovery Systems Market Forecast by Technology, 2023-2033 (US$ Billion, AGR%, CAGR%)
Table 23 North America Wastewater Recovery Systems Market Forecast by Application, 2023-2033 (US$ Billion, AGR%, CAGR%)
Table 24 U.S. Wastewater Recovery Systems Market Forecast, 2023-2033 (US$ Billion, AGR%, CAGR%)
Table 25 Canada Wastewater Recovery Systems Market Forecast, 2023-2033 (US$ Billion, AGR%, CAGR%)
Table 26 Europe Wastewater Recovery Systems Market Forecast by Country, 2023-2033 (US$ Billion, AGR%, CAGR%)
Table 27 Europe Wastewater Recovery Systems Market Forecast by Technology, 2023-2033 (US$ Billion, AGR%, CAGR%)
Table 28 Europe Wastewater Recovery Systems Market Forecast by Application, 2023-2033 (US$ Billion, AGR%, CAGR%)
Table 29 Russia Wastewater Recovery Systems Market Forecast, 2023-2033 (US$ Billion, AGR%, CAGR%)
Table 30 Turkey Wastewater Recovery Systems Market Forecast, 2023-2033 (US$ Billion, AGR%, CAGR%)
Table 31 Spain Wastewater Recovery Systems Market Forecast, 2023-2033 (US$ Billion, AGR%, CAGR%)
Table 32 France Wastewater Recovery Systems Market Forecast, 2023-2033 (US$ Billion, AGR%, CAGR%)
Table 33 UK Wastewater Recovery Systems Market Forecast, 2023-2033 (US$ Billion, AGR%, CAGR%)
Table 34 Rest of Europe Wastewater Recovery Systems Market Forecast, 2023-2033 (US$ Billion, AGR%, CAGR%)
Table 35 Asia Pacific Wastewater Recovery Systems Market Forecast by Country, 2023-2033 (US$ Billion, AGR%, CAGR%)
Table 36 Asia Pacific Wastewater Recovery Systems Market Forecast by Technology, 2023-2033 (US$ Billion, AGR%, CAGR%)
Table 37 Asia Pacific Wastewater Recovery Systems Market Forecast by Application, 2023-2033 (US$ Billion, AGR%, CAGR%)
Table 38 China Wastewater Recovery Systems Market Forecast, 2023-2033 (US$ Billion, AGR%, CAGR%)
Table 39 Japan Wastewater Recovery Systems Market Forecast, 2023-2033 (US$ Billion, AGR%, CAGR%)
Table 40 India Wastewater Recovery Systems Market Forecast, 2023-2033 (US$ Billion, AGR%, CAGR%)
Table 41 Indonesia Wastewater Recovery Systems Market Forecast, 2023-2033 (US$ Billion, AGR%, CAGR%)
Table 42 South Korea Wastewater Recovery Systems Market Forecast, 2023-2033 (US$ Billion, AGR%, CAGR%)
Table 43 Rest of Asia-Pacific Wastewater Recovery Systems Market Forecast, 2023-2033 (US$ Billion, AGR%, CAGR%)
Table 44 Middle East & Africa Wastewater Recovery Systems Market Forecast by Country, 2023-2033 (US$ Billion, AGR%, CAGR%)
Table 45 Middle East & Africa Wastewater Recovery Systems Market Forecast by Technology, 2023-2033 (US$ Billion, AGR%, CAGR%)
Table 46 Middle East & Africa Wastewater Recovery Systems Market Forecast by Application, 2023-2033 (US$ Billion, AGR%, CAGR%)
Table 47 GCC Wastewater Recovery Systems Market Forecast, 2023-2033 (US$ Billion, AGR%, CAGR%)
Table 48 Egypt Wastewater Recovery Systems Market Forecast, 2023-2033 (US$ Billion, AGR%, CAGR%)
Table 49 South Africa Wastewater Recovery Systems Market Forecast, 2023-2033 (US$ Billion, AGR%, CAGR%)
Table 50 Rest of Middle East & Africa Wastewater Recovery Systems Market Forecast, 2023-2033 (US$ Billion, AGR%, CAGR%)
Table 51 Latin America Wastewater Recovery Systems Market Forecast by Country, 2023-2033 (US$ Billion, AGR%, CAGR%)
Table 52 Latin America Wastewater Recovery Systems Market Forecast by Technology, 2023-2033 (US$ Billion, AGR%, CAGR%)
Table 53 Latin America Wastewater Recovery Systems Market Forecast by Application, 2023-2033 (US$ Billion, AGR%, CAGR%)
Table 54 Brazil Wastewater Recovery Systems Market Forecast, 2023-2033 (US$ Billion, AGR%, CAGR%)
Table 55 Mexico Wastewater Recovery Systems Market Forecast, 2023-2033 (US$ Billion, AGR%, CAGR%)
Table 56 Rest of Latin America Wastewater Recovery Systems Market Forecast, 2023-2033 (US$ Billion, AGR%, CAGR%)
Table 57 Company Ranking Analysis
Table 58 Strategic Outlook
Table 59 SUEZ SA: Key Details, (CEO, HQ, Revenue, Founded, No. of Employees, Company Type, Website, Business Segment)
Table 60 Suez SA: Product Benchmarking
Table 61 Suez SA: Strategic Outlook
Table 62 Veolia: Key Details, (CEO, HQ, Revenue, Founded, No. of Employees, Company Type, Website, Business Segment)
Table 63 General Dynamics Corporation: Product Benchmarking
Table 64 Veolia: Strategic Outlook
Table 65 Vinnolit: Key Details, (CEO, HQ, Revenue, Founded, No. of Employees, Company Type, Website, Business Segment)
Table 66 General Dynamics Corporation: Product Benchmarking
Table 67 Vinnolit: Strategic Outlook
Table 68 Pall Corporation: Key Details, (CEO, HQ, Revenue, Founded, No. of Employees, Company Type, Website, Business Segment)
Table 69 General Dynamics Corporation: Product Benchmarking
Table 70 Pall Corporation: Strategic Outlook
Table 71 Xylem: Key Details, (CEO, HQ, Revenue, Founded, No. of Employees, Company Type, Website, Business Segment)
Table 72 General Dynamics Corporation: Product Benchmarking
Table 73 Xylem: Strategic Outlook
Table 74 Ecolab: Key Details, (CEO, HQ, Revenue, Founded, No. of Employees, Company Type, Website, Business Segment)
Table 75 General Dynamics Corporation: Product Benchmarking
Table 76 Ecolab: Strategic Outlook
Table 77 Evoqua Water Technologies: Key Details, (CEO, HQ, Revenue, Founded, No. of Employees, Company Type, Website, Business Segment)
Table 78 General Dynamics Corporation: Product Benchmarking
Table 79 Evoqua Water Technologies: Strategic Outlook
Table 80 Ovivo: Key Details, (CEO, HQ, Revenue, Founded, No. of Employees, Company Type, Website, Business Segment)
Table 81 General Dynamics Corporation: Product Benchmarking
Table 82 Ovivo: Strategic Outlook
Table 83 Kubota: Key Details, (CEO, HQ, Revenue, Founded, No. of Employees, Company Type, Website, Business Segment)
Table 84 General Dynamics Corporation: Product Benchmarking
Table 85 Kubato Corporation: Strategic Outlook
Table 86 AECOM: Key Details, (CEO, HQ, Revenue, Founded, No. of Employees, Company Type, Website, Business Segment)
Table 87 General Dynamics Corporation: Product Benchmarking
Table 88 AECOM: Strategic Outlook
Table 89 Aquatech International: Key Details, (CEO, HQ, Revenue, Founded, No. of Employees, Company Type, Website, Business Segment)
Table 90 General Dynamics Corporation: Product Benchmarking
Table 91 Aquatech International: Strategic Outlook
Table 92 Kurita Water Industries: Key Details, (CEO, HQ, Revenue, Founded, No. of Employees, Company Type, Website, Business Segment)
Table 93 General Dynamics Corporation: Product Benchmarking
Table 94 Kurita Water Industries: Strategic Outlook
Table 95 Hitachi Zosen Corporation: Key Details, (CEO, HQ, Revenue, Founded, No. of Employees, Company Type, Website, Business Segment)
Table 96 General Dynamics Corporation: Product Benchmarking
Table 97 Hitachi Zosen Corporation: Strategic Outlook
Table 98 AO Smith Corporation: Key Details, (CEO, HQ, Revenue, Founded, No. of Employees, Company Type, Website, Business Segment)
Table 99 General Dynamics Corporation: Product Benchmarking
Table 100 A.O. Smith: Strategic Outlook
Table 101 Doosan Enerbility: Key Details, (CEO, HQ, Revenue, Founded, No. of Employees, Company Type, Website, Business Segment)
Table 102 General Dynamics Corporation: Product Benchmarking
Table 103 Doosan Enerbility: Strategic Outlook
図の一覧
Figure 1 Wastewater Recovery Systems Market Segmentation
Figure 2 Wastewater Recovery Systems Market by Technology: Market Attractiveness Index
Figure 3 Wastewater Recovery Systems Market by Application: Market Attractiveness Index
Figure 4 Wastewater Recovery Systems Market Attractiveness Index by Region
Figure 5 Wastewater Recovery Systems Market: Market Dynamics
Figure 6 Wastewater Recovery Systems Market by Region, 2023-2033 (US$ Billion, AGR %): “V” Shaped Recovery
Figure 7 Wastewater Recovery Systems Market by Region, 2023-2033 (US$ Billion, AGR %): “U” Shaped Recovery
Figure 8 Wastewater Recovery Systems Market by Region, 2023-2033 (US$ Billion, AGR %): “W” Shaped Recovery
Figure 9 Wastewater Recovery Systems Market by Region, 2023-2033 (US$ Billion, AGR %): “L” Shaped Recovery
Figure 10 Wastewater Recovery Systems Market: Porter’s Five Forces Analysis
Figure 11 Wastewater Recovery Systems Market: PEST Analysis
Figure 12 Wastewater Recovery Systems Market by Technology: Market Attractiveness Index
Figure 13 Wastewater Recovery Systems Market Forecast by Technology, 2023-2033 (US$ Billion, AGR %)
Figure 14 Wastewater Recovery Systems Market Share Forecast by Technology, 2023, 2028, 2033 (%)
Figure 15 Activated Carbon Segment Market Forecast by Region, 2023-2033 (US$ Billion, AGR %)
Figure 16 Activated Carbon Segment Market Share Forecast by Region, 2023 & 2033 (%)
Figure 17 Ultra-filtration & Reverse Osmosis Segment Market Forecast by Region, 2023-2033 (US$ Billion, AGR %)
Figure 18 Ultra-filtration & Reverse Osmosis Segment Market Share Forecast by Region, 2023 & 2033 (%)
Figure 19 Membrane Filtration Segment Market Forecast by Region, 2023-2033 (US$ Billion, AGR %)
Figure 20 Membrane Filtration Segment Market Share Forecast by Region, 2023 & 2033 (%)
Figure 21 IER Systems Segment Market Forecast by Region, 2023-2033 (US$ Billion, AGR %)
Figure 22 IER Systems Segment Market Share Forecast by Region, 2023 & 2033 (%)
Figure 23 Media Filtration Segment Market Forecast by Region, 2023-2033 (US$ Billion, AGR %)
Figure 24 Media Filtration Segment Market Share Forecast by Region, 2023 & 2033 (%)
Figure 25 Others Segment Market Forecast by Region, 2023-2033 (US$ Billion, AGR %)
Figure 26 Others Segment Market Share Forecast by Region, 2023 & 2033 (%)
Figure 27 Wastewater Recovery Systems Market by Application: Market Attractiveness Index
Figure 28 Wastewater Recovery Systems Market Forecast by Application, 2023-2033 (US$ Billion, AGR %)
Figure 29 Wastewater Recovery Systems Market Share Forecast by Application, 2023, 2028, 2033 (%)
Figure 30 Pharmaceuticals Segment Market Forecast by Region, 2023-2033 (US$ Billion, AGR %)
Figure 31 Pharmaceuticals Segment Market Share Forecast by Region, 2023 & 2033 (%)
Figure 32 Oil & Gas Segment Market Forecast by Region, 2023-2033 (US$ Billion, AGR %)
Figure 33 Oil & Gas Market Share Forecast by Region, 2023 & 2033 (%)
Figure 34 Metal Mining Segment Market Forecast by Region, 2023-2033 (US$ Billion, AGR %)
Figure 35 Metal Mining Segment Market Share Forecast by Region, 2023 & 2033 (%)
Figure 36 Chemical Segment Market Forecast by Region, 2023-2033 (US$ Billion, AGR %)
Figure 37 Chemical Segment Market Share Forecast by Region, 2023 & 2033 (%)
Figure 38 Food & Beverages Segment Market Forecast by Region, 2023-2033 (US$ Billion, AGR %)
Figure 39 Food & Beverages Segment Market Share Forecast by Region, 2023 & 2033 (%)
Figure 40 Others Segment Market Forecast by Region, 2023-2033 (US$ Billion, AGR %)
Figure 41 Others Segment Market Share Forecast by Region, 2023 & 2033 (%)
Figure 42 Wastewater Recovery Systems Market Forecast by Region 2023 and 2033 (US$ Billion, CAGR%)
Figure 43 Wastewater Recovery Systems Market Share Forecast by Region 2023, 2028, 2033 (%)
Figure 44 Wastewater Recovery Systems Market by Region, 2023-2033 (US$ Billion, AGR %)
Figure 45 North America Wastewater Recovery Systems Market Attractiveness Index
Figure 46 North America Wastewater Recovery Systems Market by Region, 2023, 2028 & 2033 (US$ Billion)
Figure 47 North America Wastewater Recovery Systems Market Forecast by Country, 2023-2033 (US$ Billion, AGR %)
Figure 48 North America Wastewater Recovery Systems Market Share Forecast by Country, 2023 & 2033 (%)
Figure 49 North America Wastewater Recovery Systems Market Forecast by Technology, 2023-2033 (US$ Billion, AGR %)
Figure 50 North America Wastewater Recovery Systems Market Share Forecast by Technology, 2023 & 2033 (%)
Figure 51 North America Wastewater Recovery Systems Market Forecast by Application, 2023-2033 (US$ Billion, AGR %)
Figure 52 North America Wastewater Recovery Systems Market Share Forecast by Application, 2023 & 2033 (%)
Figure 53 U.S. Wastewater Recovery Systems Market Forecast, 2023-2033 (US$ Billion, AGR %)
Figure 54 Canada Wastewater Recovery Systems Market Forecast, 2023-2033 (US$ Billion, AGR %)
Figure 55 Europe Wastewater Recovery Systems Market Attractiveness Index
Figure 56 Europe Wastewater Recovery Systems Market by Region, 2023, 2028 & 2033 (US$ Billion)
Figure 57 Europe Wastewater Recovery Systems Market Forecast by Country, 2023-2033 (US$ Billion, AGR %)
Figure 58 Europe Wastewater Recovery Systems Market Share Forecast by Country, 2023 & 2033 (%)
Figure 59 Europe Wastewater Recovery Systems Market Forecast by Technology, 2023-2033 (US$ Billion, AGR %)
Figure 60 Europe Wastewater Recovery Systems Market Share Forecast by Technology, 2023 & 2033 (%)
Figure 61 Europe Wastewater Recovery Systems Market Forecast by Application, 2023-2033 (US$ Billion, AGR %)
Figure 62 Europe Wastewater Recovery Systems Market Share Forecast by Application, 2023 & 2033 (%)
Figure 63 Russia Wastewater Recovery Systems Market Forecast, 2023-2033 (US$ Billion, AGR %)
Figure 64 Turkey Wastewater Recovery Systems Market Forecast, 2023-2033 (US$ Billion, AGR %)
Figure 65 Spain Wastewater Recovery Systems Market Forecast, 2023-2033 (US$ Billion, AGR %)
Figure 66 France Wastewater Recovery Systems Market Forecast, 2023-2033 (US$ Billion, AGR %)
Figure 67 UK Wastewater Recovery Systems Market Forecast, 2023-2033 (US$ Billion, AGR %)
Figure 68 Rest of Europe Wastewater Recovery Systems Market Forecast, 2023-2033 (US$ Billion, AGR %)
Figure 69 Asia Pacific Wastewater Recovery Systems Market Attractiveness Index
Figure 70 Asia Pacific Wastewater Recovery Systems Market by Region, 2023, 2028 & 2033 (US$ Billion)
Figure 71 Asia Pacific Wastewater Recovery Systems Market Forecast by Country, 2023-2033 (US$ Billion, AGR %)
Figure 72 Asia Pacific Wastewater Recovery Systems Market Share Forecast by Country, 2023 & 2033 (%)
Figure 73 Asia Pacific Wastewater Recovery Systems Market Forecast by Technology, 2023-2033 (US$ Billion, AGR %)
Figure 74 Asia Pacific Wastewater Recovery Systems Market Share Forecast by Technology, 2023 & 2033 (%)
Figure 75 Asia Pacific Wastewater Recovery Systems Market Forecast by Application, 2023-2033 (US$ Billion, AGR %)
Figure 76 Asia Pacific Wastewater Recovery Systems Market Share Forecast by Application, 2023 & 2033 (%)
Figure 77 China Wastewater Recovery Systems Market Forecast, 2023-2033 (US$ Billion, AGR %)
Figure 78 Japan Wastewater Recovery Systems Market Forecast, 2023-2033 (US$ Billion, AGR %)
Figure 79 India Wastewater Recovery Systems Market Forecast, 2023-2033 (US$ Billion, AGR %)
Figure 80 Indonesia Wastewater Recovery Systems Market Forecast, 2023-2033 (US$ Billion, AGR %)
Figure 81 South Korea Wastewater Recovery Systems Market Forecast, 2023-2033 (US$ Billion, AGR %)
Figure 82 Rest of Asia-Pacific Wastewater Recovery Systems Market Forecast, 2023-2033 (US$ Billion, AGR %)
Figure 83 Middle East & Africa Wastewater Recovery Systems Market Attractiveness Index
Figure 84 Middle East & Africa Wastewater Recovery Systems Market by Region, 2023, 2028 & 2033 (US$ Billion)
Figure 85 Middle East & Africa Wastewater Recovery Systems Market Forecast by Country, 2023-2033 (US$ Billion, AGR %)
Figure 86 Middle East & Africa Wastewater Recovery Systems Market Share Forecast by Country, 2023 & 2033 (%)
Figure 87 Middle East & Africa Wastewater Recovery Systems Market Forecast by Technology, 2023-2033 (US$ Billion, AGR %)
Figure 88 Middle East & Africa Wastewater Recovery Systems Market Share Forecast by Technology, 2023 & 2033 (%)
Figure 89 Middle East & Africa Wastewater Recovery Systems Market Forecast by Application, 2023-2033 (US$ Billion, AGR %)
Figure 90 Middle East & Africa Wastewater Recovery Systems Market Share Forecast by Application, 2023 & 2033 (%)
Figure 91 GCC Wastewater Recovery Systems Market Forecast, 2023-2033 (US$ Billion, AGR %)
Figure 92 Egypt Wastewater Recovery Systems Market Forecast, 2023-2033 (US$ Billion, AGR %)
Figure 93 South Africa Wastewater Recovery Systems Market Forecast, 2023-2033 (US$ Billion, AGR %)
Figure 94 Rest of Middle East & Africa Wastewater Recovery Systems Market Forecast, 2023-2033 (US$ Billion, AGR %)
Figure 95 Latin America Wastewater Recovery Systems Market Attractiveness Index
Figure 96 Latin America Wastewater Recovery Systems Market by Region, 2023, 2028 & 2033 (US$ Billion)
Figure 97 Latin America Wastewater Recovery Systems Market Forecast by Country, 2023-2033 (US$ Billion, AGR %)
Figure 98 Latin America Wastewater Recovery Systems Market Share Forecast by Country, 2023 & 2033 (%)
Figure 99 Latin America Wastewater Recovery Systems Market Forecast by Technology, 2023-2033 (US$ Billion, AGR %)
Figure 100 Latin America Wastewater Recovery Systems Market Share Forecast by Technology, 2023 & 2033 (%)
Figure 101 Latin America Wastewater Recovery Systems Market Forecast by Application, 2023-2033 (US$ Billion, AGR %)
Figure 102 Latin America Wastewater Recovery Systems Market Share Forecast by Application, 2023 & 2033 (%)
Figure 103 Brazil Wastewater Recovery Systems Market Forecast, 2023-2033 (US$ Billion, AGR %)
Figure 104 Mexico Wastewater Recovery Systems Market Forecast, 2023-2033 (US$ Billion, AGR %)
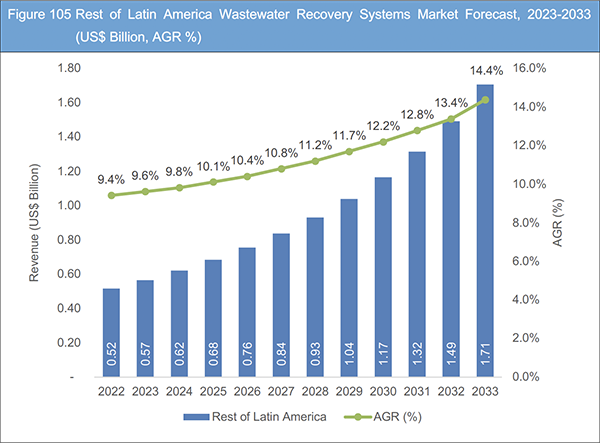
Figure 105 Rest of Latin America Wastewater Recovery Systems Market Forecast, 2023-2033 (US$ Billion, AGR %)
Figure 106 GDF Suez SA: Net Revenue, 2017-2021 (US$ Million, AGR%)
Figure 107 GDF SUEZ SA: R&D, 2017-2021 (US$ Million, AGR%)
Figure 108 Suez SA: Regional Market Shares, 2022
Figure 109 Veolia: Net Revenue, 2017-2022 (US$ Million, AGR%)
Figure 110 Veolia: Gross Profit, 2017-2022 (US$ Million, AGR%)
Figure 111 Veolia: Regional Market Shares, 2022
Figure 112 Vinnolit: Net Revenue, 2017-2022 (US$ Million, AGR%)
Figure 113 Vinnolit: Gross Profit, 2017-2022 (US$ Million, AGR%)
Figure 114 Vinnolit: Market Shares by Products, 2022
Figure 115 Pall Corporation: Net Revenue, 2017-2022 (US$ Million, AGR%)
Figure 116 Pall Corporation: Gross Profit, 2017-2022 (US$ Million, AGR%)
Figure 117 Pall Corporation: Regional Market Shares, 2022
Figure 118 Xylem: Net Revenue, 2017-2022 (US$ Million, AGR%)
Figure 119 Xylem: R&D, 2017-2022 (US$ Million, AGR%)
Figure 120 Xylem: Regional Market Shares, 2022
Figure 121 Ecolab: Net Revenue, 2017-2022 (US$ Million, AGR%)
Figure 122 Ecolab: Gross Profit, 2017-2022 (US$ Million, AGR%)
Figure 123 Ecolab: Regional Market Shares, 2022
Figure 124 Evoqua Water Technologies: Net Revenue, 2017-2022 (US$ Million, AGR%)
Figure 125 Evoqua Water Technologies: R&D, 2017-2022 (US$ Million, AGR%)
Figure 126 Evoqua Water Technologies: Regional Market Shares, 2022
Figure 127 Kubota: Net Revenue, 2017-2022 (US$ Million, AGR%)
Figure 128 Kubota: Gross Profit, 2017-2022 (US$ Million, AGR%)
Figure 129 Kubota: Regional Market Shares, 2022
Figure 130 AECOM: Net Revenue, 2017-2022 (US$ Million, AGR%)
Figure 131 AECOM: Gross Profit, 2017-2022 (US$ Million, AGR%)
Figure 132 AECOM: Regional Market Shares, 2022
Figure 133 Kurita Water Industries: Net Revenue, 2017-2022 (US$ Million, AGR%)
Figure 134 Kurita Water Industries: Operating Profit, 2017-2022 (US$ Million, AGR%)
Figure 135 Kurita Water Industries: Regional Market Shares, 2022
Figure 136 Hitachi Zosen Corporation: Net Revenue, 2017-2022 (US$ Million, AGR%)
Figure 137 Hitachi Zosen Corporation: Gross Profit, 2017-2022 (US$ Million, AGR%)
Figure 138 Hitachi Zosen Corporation: Regional Market Shares, 2022
Figure 139 AO Smith Corporation: Net Revenue, 2017-2022 (US$ Million, AGR%)
Figure 140 AO Smith Corporation: Gross Profit, 2017-2022 (US$ Million, AGR%)
Figure 141 AO Smith Corporation: Regional Market Shares, 2022
Figure 142 Doosan Enerbility: Regional Market Shares, 2022
ページTOPに戻る
Summary
Report Details
The Wastewater Recovery Systems Market Report 2023-2033: This report will prove invaluable to leading firms striving for new revenue pockets if they wish to better understand the industry and its underlying dynamics. It will be useful for companies that would like to expand into different industries or to expand their existing operations in a new region.
Increasing Demand for Sustainable Water Management Solutions to Drive Market
Growing knowledge of the negative effects of untreated or improperly managed wastewater on ecosystems, human health, and the environment has led to an increase in demand for addressing environmental and health issues associated to wastewater. Untreated or inadequately treated wastewater discharge, in particular, can introduce dangerous chemicals and toxins into water bodies, causing water pollution. Water pollution can harm aquatic life, disturb ecosystems, and taint sources of drinking water. There is an increasing need for sophisticated wastewater recovery technology, better water management strategies, and the implementation of wastewater recovery systems to meet these issues. Protecting public health, preserving the environment, and guaranteeing a sustainable future for people and ecosystems all depend on appropriate wastewater recovery and sustainable water management.
Investment in Wastewater Recovery: High Costs, Long-Term Rewards
The capital investment required for wastewater recovery systems encompasses various factors, including the integration of cutting-edge technologies, the development of robust infrastructure, adherence to stringent legal requirements, and the necessity for skilled labor and maintenance. These elements collectively contribute to the relatively high upfront costs associated with establishing such systems. However, it is crucial to recognize that this initial expenditure yields substantial long-term advantages. Wastewater recovery systems not only contribute to environmental sustainability by conserving water resources and minimizing pollution but also offer economic benefits over time. Through efficient water recycling and reduced environmental impact, these systems lead to cost savings in terms of water supply and wastewater treatment. Additionally, compliance with legal regulations ensures that businesses avoid potential penalties and reputational damage. Furthermore, the demand for specialized labor and maintenance creates employment opportunities and sustains a skilled workforce in the wastewater recovery sector.
What Questions Should You Ask before Buying a Market Research Report?
• How is the wastewater recovery systems market evolving?
• What is driving and restraining the wastewater recovery systems market?
• How will each wastewater recovery systems submarket segment grow over the forecast period and how much revenue will these submarkets account for in 2033?
• How will the market shares for each wastewater recovery systems submarket develop from 2023 to 2033?
• What will be the main driver for the overall market from 2023 to 2033?
• Will leading wastewater recovery systems markets broadly follow the macroeconomic dynamics, or will individual national markets outperform others?
• How will the market shares of the national markets change by 2033 and which geographical region will lead the market in 2033?
• Who are the leading players and what are their prospects over the forecast period?
• What are the wastewater recovery systems projects for these leading companies?
• How will the industry evolve during the period between 2023 and 2033? What are the implications of wastewater recovery systems projects taking place now and over the next 10 years?
• Is there a greater need for product commercialisation to further scale the wastewater recovery systems market?
• Where is the wastewater recovery systems market heading and how can you ensure you are at the forefront of the market?
• What are the best investment options for new product and service lines?
• What are the key prospects for moving companies into a new growth path and C-suite?
You need to discover how this will impact the wastewater recovery systems market today, and over the next 10 years:
• Our 323-page report provides 103 tables and 142 charts/graphs exclusively to you.
• The report highlights key lucrative areas in the industry so you can target them – NOW.
• It contains in-depth analysis of global, regional and national sales and growth.
• It highlights for you the key successful trends, changes and revenue projections made by your competitors.
This report tells you TODAY how the wastewater recovery systems market will develop in the next 10 years, and in line with the variations in COVID-19 economic recession and bounce. This market is more critical now than at any point over the last 10 years.
Forecasts to 2033 and other analyses reveal commercial prospects
• In addition to revenue forecasting to 2033, our new study provides you with recent results, growth rates, and market shares.
• You will find original analyses, with business outlooks and developments.
• Discover qualitative analyses (including market dynamics, drivers, opportunities, restraints and challenges), cost structure, impact of rising wastewater recovery systems prices and recent developments.
This report includes data analysis and invaluable insight into how COVID-19 will affect the industry and your company. Four COVID-19 recovery patterns and their impact, namely, “V”, “L”, “W” and “U” are discussed in this report.
Segments Covered in the Report
Technology
• Activated Carbon
• Ultra-filtration & Reverse Osmosis
• Membrane Filtration
• IER Systems
• Media Filtration
• Other Technologies
Application
• Pharmaceuticals
• Oil & Gas
• Metal Mining
• Chemical
• Food & Beverages
• Other Applications
In addition to the revenue predictions for the overall world market and segments, you will also find revenue forecasts for five regional and 17 leading national markets:
North America
• U.S
• Canada
• Rest of North America
Europe
• Russia
• Turkey
• Spain
• France
• UK
• Rest of Europe
Asia Pacific
• China
• Japan
• India
• Indonesia
• South Korea
• Rest of Asia Pacific
MEA
• GCC
• Egypt
• South Africa
• Rest of MEA
Latin America
• Brazil
• Mexico
• Rest of Latin America
The report also includes profiles and for some of the leading companies in the Wastewater Recovery Systems Market, 2023 to 2033, with a focus on this segment of these companies’ operations.
Leading companies and the potential for market growth
• A.O Smith Corporation
• AECOM
• Aquatech International
• Doosan Enerbility
• Ecolab
• Evoqua Water Technologies
• Hitachi Zosen Corporation
• Kubota Corporation
• Kurita Water Industries
• Ovivo
• Pall Corporation
• Suez SA
• Veolia
• Vinnolit
• Xylem
Overall world revenue for Wastewater Recovery Systems Market, 2023 to 2033 in terms of value the market will surpass US$27.03 billion in 2023, our work calculates. We predict strong revenue growth through to 2033. Our work identifies which organizations hold the greatest potential. Discover their capabilities, progress, and commercial prospects, helping you stay ahead.
How will the Wastewater Recovery Systems Market, 2023 to 2033 report help you?
In summary, our 320+ page report provides you with the following knowledge:
• Revenue forecasts to 2033 for Wastewater Recovery Systems Market, 2023 to 2033 Market, with forecasts for technology, application, each forecast at a global and regional level – discover the industry’s prospects, finding the most lucrative places for investments and revenues.
• Revenue forecasts to 2033 for five regional and 17 key national markets – See forecasts for the Wastewater Recovery Systems Market, 2023 to 2033 market in North America, Europe, Asia-Pacific, MEA, and Latin America. Also forecasted is the market in the US, Canada, Mexico, Brazil, France, UK, China, India, Japan, and Russia among other prominent economies.
• Prospects for established firms and those seeking to enter the market – including company profiles for 15 of the major companies involved in the Wastewater Recovery Systems Market, 2023 to 2033.
Find quantitative and qualitative analyses with independent predictions. Receive information that only our report contains, staying informed with invaluable business intelligence.
Information found nowhere else
With our new report, you are less likely to fall behind in knowledge or miss out on opportunities. See how our work could benefit your research, analyses, and decisions. Visiongain’s study is for everybody needing commercial analyses for the Wastewater Recovery Systems Market, 2023 to 2033, market-leading companies. You will find data, trends and predictions.
ページTOPに戻る
Table of Contents
Table of Contents
1 Report Overview
1.1 Objectives of the Study
1.2 Introduction to Wastewater Recovery Systems Market
1.3 What This Report Delivers
1.4 Why You Should Read This Report
1.5 Key Questions Answered by This Analytical Report
1.6 Who is This Report for?
1.7 Methodology
1.7.1 Market Definitions
1.7.2 Market Evaluation & Forecasting Methodology
1.7.3 Data Validation
1.7.3.1 Primary Research
1.7.3.2 Secondary Research
1.8 Frequently Asked Questions (FAQs)
1.9 Associated Visiongain Reports
1.10 About Visiongain
2 Executive Summary
3 Market Overview
3.1 Key Findings
3.2 Market Dynamics
3.2.1 Market Driving Factors
3.2.1.1 Increasing Demand for Sustainable Water Management Solutions
3.2.1.2 Strategic Initiatives Taken by Leading Companies
3.2.1.3 Growing Water Scarcity and Inclination Towards Green Industry
3.2.2 Market Restraining Factors
3.2.2.1 Growing High Energy Consumption
3.2.2.2 Technical and Maintenance Related Challenges
3.2.2.3 High Capital Investment
3.2.3 Market Opportunities
3.2.3.1 Growing Urbanization and Industrialization
3.2.3.2 Increasing Government Initiatives
3.2.3.3 Increasing Environmental Awareness
3.3 COVID-19 Impact Analysis
3.4 Porter’s Five Forces Analysis
3.4.1 Bargaining Power of Suppliers (Low)
3.4.2 Bargaining Power of Buyers (Medium)
3.4.3 Competitive Rivalry (High)
3.4.4 Threat from Substitutes (Low)
3.4.5 Threat of New Entrants (Low)
3.5 PEST Analysis
4 Wastewater Recovery Systems Market Analysis by Technology
4.1 Key Findings
4.2 Technology Segment: Market Attractiveness Index
4.3 Wastewater Recovery Systems Market Size Estimation and Forecast by Technology
4.4 Activated Carbon
4.4.1 Activated Carbon Reactivation Furnace in Belgium
4.4.2 Market Size by Region, 2023-2033 (US$ Billion)
4.4.3 Market Share by Region, 2023 & 2033 (%)
4.5 Ultra-filtration & Reverse Osmosis
4.5.1 DuPont Wins Edie Award for Sustainability Benefits of Closed Circuit
4.5.2 Market Size by Region, 2023-2033 (US$ Billion)
4.5.3 Market Share by Region, 2023 & 2033 (%)
4.6 Membrane Filtration
4.6.1 Water Filtration System Helps Large Farms- Zwitterion
4.6.2 Market Size by Region, 2023-2033 (US$ Billion)
4.6.3 Market Share by Region, 2023 & 2033 (%)
4.7 IER Systems
4.7.1 LANXESS Increases Prices for Ion Exchange Resins
4.7.2 Market Size by Region, 2023-2033 (US$ Billion)
4.7.3 Market Share by Region, 2023 & 2033 (%)
4.8 Media Filtration
4.8.1 Pile Cloth Media Filtration Helps Removal of Microplastics
4.8.2 Market Size by Region, 2023-2033 (US$ Billion)
4.8.3 Market Share by Region, 2023 & 2033 (%)
4.9 Other Technologies
4.9.1 Nasa Achieves Water Recovery Milestone
4.9.2 Market Size by Region, 2023-2033 (US$ Billion)
4.9.3 Market Share by Region, 2023 & 2033 (%)
5 Wastewater Recovery Systems Market Analysis by Application
5.1 Key Findings
5.2 Application Segment: Market Attractiveness Index
5.3 Wastewater Recovery Systems Market Size Estimation and Forecast by Application
5.4 Pharmaceuticals
5.4.1 EU Taking Stand Against Pharmaceutical Residue
5.4.2 Market Size by Region, 2023-2033 (US$ Billion)
5.4.3 Market Share by Region, 2023 & 2033 (%)
5.5 Oil & Gas
5.5.1 Chevron El Segundo Facility as the Top Water Polluter
5.5.2 Market Size by Region, 2023-2033 (US$ Billion)
5.5.3 Market Share by Region, 2023 & 2033 (%)
5.6 Metal Mining
5.6.1 Solution to Recover Critical Minerals
5.6.2 Market Size by Region, 2023-2033 (US$ Billion)
5.6.3 Market Share by Region, 2023 & 2033 (%)
5.7 Chemical
5.7.1 SUEZ Successfully Commissions New Hazardous Waste Disposal Project
5.7.2 Market Size by Region, 2023-2033 (US$ Billion)
5.7.3 Market Share by Region, 2023 & 2033 (%)
5.8 Food & Beverages
5.8.1 Skuma Water Raise Funds for Its Zero-Wastewater Purification
5.8.2 Market Size by Region, 2023-2033 (US$ Billion)
5.8.3 Market Share by Region, 2023 & 2033 (%)
5.9 Other Applications
5.9.1 Elateq, Amherst Water Recovery Business, is Expanding with Pepsico
5.9.2 Local Breweries' Byproduct Assisted in the Wastewater Cleaning Process
5.9.3 Market Size by Region, 2023-2033 (US$ Billion)
5.9.4 Market Share by Region, 2023 & 2033 (%)
6 Wastewater Recovery Systems Market Analysis by Region
6.1 Key Findings
6.2 Regional Market Size Estimation and Forecast
7 North America Wastewater Recovery Systems Market Analysis
7.1 Key Findings
7.2 North America Wastewater Recovery Systems Market Attractiveness Index
7.3 North America Wastewater Recovery Systems Market by Country, 2023, 2028 & 2033 (US$ Billion)
7.4 North America Wastewater Recovery Systems Market Size Estimation and Forecast by Country
7.5 North America Wastewater Recovery Systems Market Size Estimation and Forecast by Technology
7.6 North America Wastewater Recovery Systems Market Size Estimation and Forecast by Application
7.7 U.S. Wastewater Recovery Systems Market Analysis
7.7.1 Guam Completes Recovery Efforts for Drinking Water and Wastewater Infrastructure
7.7.2 Valicor Environmental Services Acquires Clean Water Environmental
7.8 Canada Wastewater Recovery Systems Market Analysis
7.8.1 Canada Invests to Upgrade Wastewater Recovery
8 Europe Wastewater Recovery Systems Market Analysis
8.1 Key Findings
8.2 Europe Wastewater Recovery Systems Market Attractiveness Index
8.3 Europe Wastewater Recovery Systems Market by Country, 2023, 2028 & 2033 (US$ Billion)
8.4 Europe Wastewater Recovery Systems Market Size Estimation and Forecast by Country
8.5 Europe Wastewater Recovery Systems Market Size Estimation and Forecast by Technology
8.6 Europe Wastewater Recovery Systems Market Size Estimation and Forecast by Application
8.7 Russia Wastewater Recovery Systems Market Analysis
8.7.1 Effects of the Military Conflict Between Russia and Ukraine on Water Infrastructure and Resources
8.8 Turkey Wastewater Recovery Systems Market Analysis
8.8.1 In Turkey, Unitop Began Collaborating with Teks- Intertekstil
8.8.2 Vatek's Wastewater and Recycling System Recovered 92 Percent of the Water Used
8.9 Spain Wastewater Recovery Systems Market Analysis
8.9.1 From Sewage Pipe to Drinking Glass: Wastewater Recovery in the Future
8.10 France Wastewater Recovery Systems Market Analysis
8.10.1 France's Largest Sewage Recovery Facility
8.10.2 French Efforts to Catch up in the Reuse of Wastewater
8.11 UK Wastewater Recovery Systems Market Analysis
8.11.1 Climate Change is Putting the UK's Wastewater Infrastructure at Risk
8.11.2 HUBER Technology UK Collaborates with Noventa on Sewer Energy Recovery
8.12 Rest of Europe Wastewater Recovery Systems Market Analysis
9 Asia Pacific Wastewater Recovery Systems Market Analysis
9.1 Key Findings
9.2 Asia Pacific Wastewater Recovery Systems Market Attractiveness Index
9.3 Asia Pacific Wastewater Recovery Systems Market by Country, 2023, 2028 & 2033 (US$ Billion)
9.4 Asia Pacific Wastewater Recovery Systems Market Size Estimation and Forecast by Country
9.5 Asia Pacific Wastewater Recovery Systems Market Size Estimation and Forecast by Technology
9.6 Asia Pacific Wastewater Recovery Systems Market Size Estimation and Forecast by Application
9.7 China Wastewater Recovery Systems Market Analysis
9.7.1 Large-Scale Chinese Wastewater Recovery Facility
9.8 Japan Wastewater Recovery Systems Market Analysis
9.8.1 Decentralized Wastewater Recovery was Installed in Baguio
9.8.2 Nuclear experts discuss Japan's plans for treating radioactive wastewater
9.9 India Wastewater Recovery Systems Market Analysis
9.9.1 Indian Water Recovery Systems Upgraded
9.9.2 Decentralized Wastewater Recovery Systems to Increase Water Security
9.10 Indonesia Wastewater Recovery Systems Market Analysis
9.10.1 Wastewater Recovery Facility in Palembang Built by Australia and Indonesia
9.11 South Korea Wastewater Recovery Systems Market Analysis
9.11.1 Strategies for Scaling up Bio electrochemical Systems
9.11.2 Concerns about the Planned Wastewater Release
9.12 Rest of Asia-Pacific Wastewater Recovery Systems Market Analysis
10 Middle East & Africa Wastewater Recovery Systems Market Analysis
10.1 Key Findings
10.2 Middle East & Africa Wastewater Recovery Systems Market Attractiveness Index
10.3 Middle East & Africa Wastewater Recovery Systems Market by Country, 2023, 2028 & 2033 (US$ Billion)
10.4 Middle East & Africa Wastewater Recovery Systems Market Size Estimation and Forecast by Country
10.5 Middle East & Africa Wastewater Recovery Systems Market Size Estimation and Forecast by Technology
10.6 Middle East & Africa Wastewater Recovery Systems Market Size Estimation and Forecast by Application
10.7 GCC Wastewater Recovery Systems Market Analysis
10.7.1 Key Potential for Growth in the Middle East Water Sector Includes Desalination, Wastewater Recovery, and Digitization
10.8 Egypt Wastewater Recovery Systems Market Analysis
10.8.1 Three Waste Recycling Plants to be Built in the Suez Canal
10.8.2 Suez Inaugurates a Sewage Sludge Recovery Unit in Alexandria East, Egypt
10.9 South Africa Wastewater Recovery Systems Market Analysis
10.9.1 The Biogas Facility Cleans Wastewater that is Released into the Municipal System
10.9.2 Scarab's Awards for Best Wastewater Solutions
10.10 Rest of Middle East & Africa Wastewater Recovery Systems Market Analysis
10.10.1 Mobilize Water Related Action for Sustainable Development
11 Latin America Wastewater Recovery Systems Market Analysis
11.1 Key Findings
11.2 Latin America Wastewater Recovery Systems Market Attractiveness Index
11.3 Latin America Wastewater Recovery Systems Market by Country, 2023, 2028 & 2033 (US$ Billion)
11.4 Latin America Wastewater Recovery Systems Market Size Estimation and Forecast by Country
11.5 Latin America Wastewater Recovery Systems Market Size Estimation and Forecast by Technology
11.6 Latin America Wastewater Recovery Systems Market Size Estimation and Forecast by Application
11.7 Brazil Wastewater Recovery Systems Market Analysis
11.7.1 New Phase of Competition Starting in Brazil
11.7.2 New Sewage Recovery Technology Can Get Rid of 70% of Nitrogen
11.8 Mexico Wastewater Recovery Systems Market Analysis
11.8.1 Joint US-Mexico Initiative to Reduce Tijuana River Wastewater Spills
11.9 Rest of Latin America Wastewater Recovery Systems Market Analysis
12 Company Profiles
12.1 Competitive Landscape, 2022
12.2 Strategic Outlook
12.3 Suez SA
12.3.1 Company Snapshot
12.3.2 Company Overview
12.3.3 Financial Analysis
12.3.3.1 Net Revenue, 2017-2021
12.3.3.2 Gross Profit, 2017-2021
12.3.3.3 Regional Market Shares, 2022
12.3.4 Product Benchmarking
12.3.5 Strategic Outlook
12.4 Veolia
12.4.1 Company Snapshot
12.4.2 Company Overview
12.4.3 Financial Analysis
12.4.3.1 Net Revenue, 2017-2022
12.4.3.2 Gross Profit, 2017-2022
12.4.3.3 Regional Market Shares, 2022
12.4.4 Product Benchmarking
12.4.5 Strategic Outlook
12.5 Vinnolit
12.5.1 Company Snapshot
12.5.2 Company Overview
12.5.3 Financial Analysis
12.5.3.1 Net Revenue, 2017-2022
12.5.3.2 Gross Profit, 2017-2022
12.5.3.3 Regional Market Shares, 2022
12.5.4 Product Benchmarking
12.5.5 Strategic Outlook
12.6 Pall Corporation
12.6.1 Company Snapshot
12.6.2 Company Overview
12.6.3 Financial Analysis
12.6.3.1 Net Revenue, 2017-2022
12.6.3.2 Gross Profit, 2017-2022
12.6.3.3 Regional Market Shares, 2022
12.6.4 Product Benchmarking
12.6.5 Strategic Outlook
12.7 Xylem
12.7.1 Company Snapshot
12.7.2 Company Overview
12.7.3 Financial Analysis
12.7.3.1 Net Revenue, 2017-2022
12.7.3.2 Gross Profit, 2017-2022
12.7.3.3 Regional Market Shares, 2022
12.7.4 Product Benchmarking
12.7.5 Strategic Outlook
12.8 Ecolab
12.8.1 Company Snapshot
12.8.2 Company Overview
12.8.3 Financial Analysis
12.8.3.1 Net Revenue, 2017-2022
12.8.3.2 Gross Profit, 2017-2022
12.8.3.3 Regional Market Shares, 2022
12.8.4 Product Benchmarking
12.8.5 Strategic Outlook
12.9 Evoqua Water Technologies
12.9.1 Company Snapshot
12.9.2 Company Overview
12.9.3 Financial Analysis
12.9.3.1 Net Revenue, 2017-2022
12.9.3.2 R&D, 2017-2022
12.9.3.3 Regional Market Shares, 2022
12.9.4 Product Benchmarking
12.9.5 Strategic Outlook
12.10 Ovivo
12.10.1 Company Snapshot
12.10.2 Company Overview
12.10.3 Product Benchmarking
12.10.4 Strategic Outlook
12.11 Kubota Corporation
12.11.1 Company Snapshot
12.11.2 Company Overview
12.11.3 Financial Analysis
12.11.3.1 Net Revenue, 2017-2022
12.11.3.2 Gross Profit, 2017-2022
12.11.3.3 Regional Market Shares, 2022
12.11.4 Product Benchmarking
12.11.5 Strategic Outlook
12.12 AECOM
12.12.1 Company Snapshot
12.12.2 Company Overview
12.12.3 Financial Analysis
12.12.3.1 Net Revenue, 2017-2022
12.12.3.2 Gross Profit, 2017-2022
12.12.3.3 Regional Market Shares, 2022
12.12.4 Product Benchmarking
12.12.5 Strategic Outlook
12.13 Aquatech International
12.13.1 Company Snapshot
12.13.2 Company Overview
12.13.3 Product Benchmarking
12.13.4 Strategic Outlook
12.14 Kurita Water Industries
12.14.1 Company Snapshot
12.14.2 Company Overview
12.14.3 Financial Analysis
12.14.3.1 Net Revenue, 2017-2022
12.14.3.2 Operating Profit, 2017-2022
12.14.3.3 Regional Market Shares, 2022
12.14.4 Product Benchmarking
12.14.5 Strategic Outlook
12.15 Hitachi Zosen Corporation
12.15.1 Company Snapshot
12.15.2 Company Overview
12.15.3 Financial Analysis
12.15.3.1 Net Revenue, 2017-2022
12.15.3.2 Gross Profit, 2017-2022
12.15.3.3 Regional Market Shares, 2022
12.15.4 Product Benchmarking
12.15.5 Strategic Outlook
12.16 A.O Smith Corporation
12.16.1 Company Snapshot
12.16.2 Company Overview
12.16.3 Financial Analysis
12.16.3.1 Net Revenue, 2017-2022
12.16.3.2 Gross Profit, 2017-2022
12.16.3.3 Regional Market Shares, 2022
12.16.4 Product Benchmarking
12.16.5 Strategic Outlook
12.17 Doosan Enerbility
12.17.1 Company Snapshot
12.17.2 Company Overview
12.17.2.1 Regional Market Shares, 2022
12.17.3 Product Benchmarking
12.17.4 Strategic Outlook
13 Conclusion and Recommendations
13.1 Concluding Remarks from Visiongain
13.2 Recommendations for Market Players
13.2.1 Focus on Sustainability and Environmental Benefits
13.2.2 Investment in Research and Development
13.2.3 Educate and Raise Awareness
13.2.4 Expansion in Developing Nations
ページTOPに戻る
List of Tables/Graphs
List of Tables
Table 1 Wastewater Recovery Systems Market Snapshot, 2023 & 2033 (US$ Billion, CAGR %)
Table 2 Wastewater Recovery Systems Market Forecast by Region, 2023-2033 (US$ Billion, AGR%, CAGR%): “V” Shaped Recovery
Table 3 Wastewater Recovery Systems Market Forecast by Region, 2023-2033 (US$ Billion, AGR%, CAGR%): “U” Shaped Recovery
Table 4 Wastewater Recovery Systems Market Forecast by Region, 2023-2033 (US$ Billion, AGR%, CAGR%): “W” Shaped Recovery
Table 5 Wastewater Recovery Systems Market Forecast by Region, 2023-2033 (US$ Billion, AGR%, CAGR%): “L” Shaped Recovery
Table 6 Wastewater Recovery Systems Market Forecast by Technology, 2023-2033 (US$ Billion, AGR%, CAGR%)
Table 7 Activated Carbon Segment Market Forecast by Region, 2023-2033 (US$ Billion, AGR%, CAGR%)
Table 8 Ultra-filtration & Reverse Osmosis Segment Market Forecast by Region, 2023-2033 (US$ Billion, AGR%, CAGR%)
Table 9 Membrane Filtration Segment Market Forecast by Region, 2023-2033 (US$ Billion, AGR%, CAGR%)
Table 10 IER Systems Segment Market Forecast by Region, 2023-2033 (US$ Billion, AGR%, CAGR%)
Table 11 Media Filtration Segment Market Forecast by Region, 2023-2033 (US$ Billion, AGR%, CAGR%)
Table 12 Others Segment Market Forecast by Region, 2023-2033 (US$ Billion, AGR%, CAGR%)
Table 13 Wastewater Recovery Systems Market Forecast by Application, 2023-2033 (US$ Billion, AGR%, CAGR%)
Table 14 Pharmaceuticals Segment Market Forecast by Region, 2023-2033 (US$ Billion, AGR%, CAGR%)
Table 15 Oil & Gas Segment Market Forecast by Region, 2023-2033 (US$ Billion, AGR%, CAGR%)
Table 16 Metal Mining Segment Market Forecast by Region, 2023-2033 (US$ Billion, AGR%, CAGR%)
Table 17 Chemical Segment Market Forecast by Region, 2023-2033 (US$ Billion, AGR%, CAGR%)
Table 18 Food & Beverages Segment Market Forecast by Region, 2023-2033 (US$ Billion, AGR%, CAGR%)
Table 19 Others Segment Market Forecast by Region, 2023-2033 (US$ Billion, AGR%, CAGR%)
Table 20 Wastewater Recovery Systems Market Forecast by Region, 2023-2033 (US$ Billion, AGR%, CAGR%)
Table 21 North America Wastewater Recovery Systems Market Forecast by Country, 2023-2033 (US$ Billion, AGR%, CAGR%)
Table 22 North America Wastewater Recovery Systems Market Forecast by Technology, 2023-2033 (US$ Billion, AGR%, CAGR%)
Table 23 North America Wastewater Recovery Systems Market Forecast by Application, 2023-2033 (US$ Billion, AGR%, CAGR%)
Table 24 U.S. Wastewater Recovery Systems Market Forecast, 2023-2033 (US$ Billion, AGR%, CAGR%)
Table 25 Canada Wastewater Recovery Systems Market Forecast, 2023-2033 (US$ Billion, AGR%, CAGR%)
Table 26 Europe Wastewater Recovery Systems Market Forecast by Country, 2023-2033 (US$ Billion, AGR%, CAGR%)
Table 27 Europe Wastewater Recovery Systems Market Forecast by Technology, 2023-2033 (US$ Billion, AGR%, CAGR%)
Table 28 Europe Wastewater Recovery Systems Market Forecast by Application, 2023-2033 (US$ Billion, AGR%, CAGR%)
Table 29 Russia Wastewater Recovery Systems Market Forecast, 2023-2033 (US$ Billion, AGR%, CAGR%)
Table 30 Turkey Wastewater Recovery Systems Market Forecast, 2023-2033 (US$ Billion, AGR%, CAGR%)
Table 31 Spain Wastewater Recovery Systems Market Forecast, 2023-2033 (US$ Billion, AGR%, CAGR%)
Table 32 France Wastewater Recovery Systems Market Forecast, 2023-2033 (US$ Billion, AGR%, CAGR%)
Table 33 UK Wastewater Recovery Systems Market Forecast, 2023-2033 (US$ Billion, AGR%, CAGR%)
Table 34 Rest of Europe Wastewater Recovery Systems Market Forecast, 2023-2033 (US$ Billion, AGR%, CAGR%)
Table 35 Asia Pacific Wastewater Recovery Systems Market Forecast by Country, 2023-2033 (US$ Billion, AGR%, CAGR%)
Table 36 Asia Pacific Wastewater Recovery Systems Market Forecast by Technology, 2023-2033 (US$ Billion, AGR%, CAGR%)
Table 37 Asia Pacific Wastewater Recovery Systems Market Forecast by Application, 2023-2033 (US$ Billion, AGR%, CAGR%)
Table 38 China Wastewater Recovery Systems Market Forecast, 2023-2033 (US$ Billion, AGR%, CAGR%)
Table 39 Japan Wastewater Recovery Systems Market Forecast, 2023-2033 (US$ Billion, AGR%, CAGR%)
Table 40 India Wastewater Recovery Systems Market Forecast, 2023-2033 (US$ Billion, AGR%, CAGR%)
Table 41 Indonesia Wastewater Recovery Systems Market Forecast, 2023-2033 (US$ Billion, AGR%, CAGR%)
Table 42 South Korea Wastewater Recovery Systems Market Forecast, 2023-2033 (US$ Billion, AGR%, CAGR%)
Table 43 Rest of Asia-Pacific Wastewater Recovery Systems Market Forecast, 2023-2033 (US$ Billion, AGR%, CAGR%)
Table 44 Middle East & Africa Wastewater Recovery Systems Market Forecast by Country, 2023-2033 (US$ Billion, AGR%, CAGR%)
Table 45 Middle East & Africa Wastewater Recovery Systems Market Forecast by Technology, 2023-2033 (US$ Billion, AGR%, CAGR%)
Table 46 Middle East & Africa Wastewater Recovery Systems Market Forecast by Application, 2023-2033 (US$ Billion, AGR%, CAGR%)
Table 47 GCC Wastewater Recovery Systems Market Forecast, 2023-2033 (US$ Billion, AGR%, CAGR%)
Table 48 Egypt Wastewater Recovery Systems Market Forecast, 2023-2033 (US$ Billion, AGR%, CAGR%)
Table 49 South Africa Wastewater Recovery Systems Market Forecast, 2023-2033 (US$ Billion, AGR%, CAGR%)
Table 50 Rest of Middle East & Africa Wastewater Recovery Systems Market Forecast, 2023-2033 (US$ Billion, AGR%, CAGR%)
Table 51 Latin America Wastewater Recovery Systems Market Forecast by Country, 2023-2033 (US$ Billion, AGR%, CAGR%)
Table 52 Latin America Wastewater Recovery Systems Market Forecast by Technology, 2023-2033 (US$ Billion, AGR%, CAGR%)
Table 53 Latin America Wastewater Recovery Systems Market Forecast by Application, 2023-2033 (US$ Billion, AGR%, CAGR%)
Table 54 Brazil Wastewater Recovery Systems Market Forecast, 2023-2033 (US$ Billion, AGR%, CAGR%)
Table 55 Mexico Wastewater Recovery Systems Market Forecast, 2023-2033 (US$ Billion, AGR%, CAGR%)
Table 56 Rest of Latin America Wastewater Recovery Systems Market Forecast, 2023-2033 (US$ Billion, AGR%, CAGR%)
Table 57 Company Ranking Analysis
Table 58 Strategic Outlook
Table 59 SUEZ SA: Key Details, (CEO, HQ, Revenue, Founded, No. of Employees, Company Type, Website, Business Segment)
Table 60 Suez SA: Product Benchmarking
Table 61 Suez SA: Strategic Outlook
Table 62 Veolia: Key Details, (CEO, HQ, Revenue, Founded, No. of Employees, Company Type, Website, Business Segment)
Table 63 General Dynamics Corporation: Product Benchmarking
Table 64 Veolia: Strategic Outlook
Table 65 Vinnolit: Key Details, (CEO, HQ, Revenue, Founded, No. of Employees, Company Type, Website, Business Segment)
Table 66 General Dynamics Corporation: Product Benchmarking
Table 67 Vinnolit: Strategic Outlook
Table 68 Pall Corporation: Key Details, (CEO, HQ, Revenue, Founded, No. of Employees, Company Type, Website, Business Segment)
Table 69 General Dynamics Corporation: Product Benchmarking
Table 70 Pall Corporation: Strategic Outlook
Table 71 Xylem: Key Details, (CEO, HQ, Revenue, Founded, No. of Employees, Company Type, Website, Business Segment)
Table 72 General Dynamics Corporation: Product Benchmarking
Table 73 Xylem: Strategic Outlook
Table 74 Ecolab: Key Details, (CEO, HQ, Revenue, Founded, No. of Employees, Company Type, Website, Business Segment)
Table 75 General Dynamics Corporation: Product Benchmarking
Table 76 Ecolab: Strategic Outlook
Table 77 Evoqua Water Technologies: Key Details, (CEO, HQ, Revenue, Founded, No. of Employees, Company Type, Website, Business Segment)
Table 78 General Dynamics Corporation: Product Benchmarking
Table 79 Evoqua Water Technologies: Strategic Outlook
Table 80 Ovivo: Key Details, (CEO, HQ, Revenue, Founded, No. of Employees, Company Type, Website, Business Segment)
Table 81 General Dynamics Corporation: Product Benchmarking
Table 82 Ovivo: Strategic Outlook
Table 83 Kubota: Key Details, (CEO, HQ, Revenue, Founded, No. of Employees, Company Type, Website, Business Segment)
Table 84 General Dynamics Corporation: Product Benchmarking
Table 85 Kubato Corporation: Strategic Outlook
Table 86 AECOM: Key Details, (CEO, HQ, Revenue, Founded, No. of Employees, Company Type, Website, Business Segment)
Table 87 General Dynamics Corporation: Product Benchmarking
Table 88 AECOM: Strategic Outlook
Table 89 Aquatech International: Key Details, (CEO, HQ, Revenue, Founded, No. of Employees, Company Type, Website, Business Segment)
Table 90 General Dynamics Corporation: Product Benchmarking
Table 91 Aquatech International: Strategic Outlook
Table 92 Kurita Water Industries: Key Details, (CEO, HQ, Revenue, Founded, No. of Employees, Company Type, Website, Business Segment)
Table 93 General Dynamics Corporation: Product Benchmarking
Table 94 Kurita Water Industries: Strategic Outlook
Table 95 Hitachi Zosen Corporation: Key Details, (CEO, HQ, Revenue, Founded, No. of Employees, Company Type, Website, Business Segment)
Table 96 General Dynamics Corporation: Product Benchmarking
Table 97 Hitachi Zosen Corporation: Strategic Outlook
Table 98 AO Smith Corporation: Key Details, (CEO, HQ, Revenue, Founded, No. of Employees, Company Type, Website, Business Segment)
Table 99 General Dynamics Corporation: Product Benchmarking
Table 100 A.O. Smith: Strategic Outlook
Table 101 Doosan Enerbility: Key Details, (CEO, HQ, Revenue, Founded, No. of Employees, Company Type, Website, Business Segment)
Table 102 General Dynamics Corporation: Product Benchmarking
Table 103 Doosan Enerbility: Strategic Outlook
List of Figures
Figure 1 Wastewater Recovery Systems Market Segmentation
Figure 2 Wastewater Recovery Systems Market by Technology: Market Attractiveness Index
Figure 3 Wastewater Recovery Systems Market by Application: Market Attractiveness Index
Figure 4 Wastewater Recovery Systems Market Attractiveness Index by Region
Figure 5 Wastewater Recovery Systems Market: Market Dynamics
Figure 6 Wastewater Recovery Systems Market by Region, 2023-2033 (US$ Billion, AGR %): “V” Shaped Recovery
Figure 7 Wastewater Recovery Systems Market by Region, 2023-2033 (US$ Billion, AGR %): “U” Shaped Recovery
Figure 8 Wastewater Recovery Systems Market by Region, 2023-2033 (US$ Billion, AGR %): “W” Shaped Recovery
Figure 9 Wastewater Recovery Systems Market by Region, 2023-2033 (US$ Billion, AGR %): “L” Shaped Recovery
Figure 10 Wastewater Recovery Systems Market: Porter’s Five Forces Analysis
Figure 11 Wastewater Recovery Systems Market: PEST Analysis
Figure 12 Wastewater Recovery Systems Market by Technology: Market Attractiveness Index
Figure 13 Wastewater Recovery Systems Market Forecast by Technology, 2023-2033 (US$ Billion, AGR %)
Figure 14 Wastewater Recovery Systems Market Share Forecast by Technology, 2023, 2028, 2033 (%)
Figure 15 Activated Carbon Segment Market Forecast by Region, 2023-2033 (US$ Billion, AGR %)
Figure 16 Activated Carbon Segment Market Share Forecast by Region, 2023 & 2033 (%)
Figure 17 Ultra-filtration & Reverse Osmosis Segment Market Forecast by Region, 2023-2033 (US$ Billion, AGR %)
Figure 18 Ultra-filtration & Reverse Osmosis Segment Market Share Forecast by Region, 2023 & 2033 (%)
Figure 19 Membrane Filtration Segment Market Forecast by Region, 2023-2033 (US$ Billion, AGR %)
Figure 20 Membrane Filtration Segment Market Share Forecast by Region, 2023 & 2033 (%)
Figure 21 IER Systems Segment Market Forecast by Region, 2023-2033 (US$ Billion, AGR %)
Figure 22 IER Systems Segment Market Share Forecast by Region, 2023 & 2033 (%)
Figure 23 Media Filtration Segment Market Forecast by Region, 2023-2033 (US$ Billion, AGR %)
Figure 24 Media Filtration Segment Market Share Forecast by Region, 2023 & 2033 (%)
Figure 25 Others Segment Market Forecast by Region, 2023-2033 (US$ Billion, AGR %)
Figure 26 Others Segment Market Share Forecast by Region, 2023 & 2033 (%)
Figure 27 Wastewater Recovery Systems Market by Application: Market Attractiveness Index
Figure 28 Wastewater Recovery Systems Market Forecast by Application, 2023-2033 (US$ Billion, AGR %)
Figure 29 Wastewater Recovery Systems Market Share Forecast by Application, 2023, 2028, 2033 (%)
Figure 30 Pharmaceuticals Segment Market Forecast by Region, 2023-2033 (US$ Billion, AGR %)
Figure 31 Pharmaceuticals Segment Market Share Forecast by Region, 2023 & 2033 (%)
Figure 32 Oil & Gas Segment Market Forecast by Region, 2023-2033 (US$ Billion, AGR %)
Figure 33 Oil & Gas Market Share Forecast by Region, 2023 & 2033 (%)
Figure 34 Metal Mining Segment Market Forecast by Region, 2023-2033 (US$ Billion, AGR %)
Figure 35 Metal Mining Segment Market Share Forecast by Region, 2023 & 2033 (%)
Figure 36 Chemical Segment Market Forecast by Region, 2023-2033 (US$ Billion, AGR %)
Figure 37 Chemical Segment Market Share Forecast by Region, 2023 & 2033 (%)
Figure 38 Food & Beverages Segment Market Forecast by Region, 2023-2033 (US$ Billion, AGR %)
Figure 39 Food & Beverages Segment Market Share Forecast by Region, 2023 & 2033 (%)
Figure 40 Others Segment Market Forecast by Region, 2023-2033 (US$ Billion, AGR %)
Figure 41 Others Segment Market Share Forecast by Region, 2023 & 2033 (%)
Figure 42 Wastewater Recovery Systems Market Forecast by Region 2023 and 2033 (US$ Billion, CAGR%)
Figure 43 Wastewater Recovery Systems Market Share Forecast by Region 2023, 2028, 2033 (%)
Figure 44 Wastewater Recovery Systems Market by Region, 2023-2033 (US$ Billion, AGR %)
Figure 45 North America Wastewater Recovery Systems Market Attractiveness Index
Figure 46 North America Wastewater Recovery Systems Market by Region, 2023, 2028 & 2033 (US$ Billion)
Figure 47 North America Wastewater Recovery Systems Market Forecast by Country, 2023-2033 (US$ Billion, AGR %)
Figure 48 North America Wastewater Recovery Systems Market Share Forecast by Country, 2023 & 2033 (%)
Figure 49 North America Wastewater Recovery Systems Market Forecast by Technology, 2023-2033 (US$ Billion, AGR %)
Figure 50 North America Wastewater Recovery Systems Market Share Forecast by Technology, 2023 & 2033 (%)
Figure 51 North America Wastewater Recovery Systems Market Forecast by Application, 2023-2033 (US$ Billion, AGR %)
Figure 52 North America Wastewater Recovery Systems Market Share Forecast by Application, 2023 & 2033 (%)
Figure 53 U.S. Wastewater Recovery Systems Market Forecast, 2023-2033 (US$ Billion, AGR %)
Figure 54 Canada Wastewater Recovery Systems Market Forecast, 2023-2033 (US$ Billion, AGR %)
Figure 55 Europe Wastewater Recovery Systems Market Attractiveness Index
Figure 56 Europe Wastewater Recovery Systems Market by Region, 2023, 2028 & 2033 (US$ Billion)
Figure 57 Europe Wastewater Recovery Systems Market Forecast by Country, 2023-2033 (US$ Billion, AGR %)
Figure 58 Europe Wastewater Recovery Systems Market Share Forecast by Country, 2023 & 2033 (%)
Figure 59 Europe Wastewater Recovery Systems Market Forecast by Technology, 2023-2033 (US$ Billion, AGR %)
Figure 60 Europe Wastewater Recovery Systems Market Share Forecast by Technology, 2023 & 2033 (%)
Figure 61 Europe Wastewater Recovery Systems Market Forecast by Application, 2023-2033 (US$ Billion, AGR %)
Figure 62 Europe Wastewater Recovery Systems Market Share Forecast by Application, 2023 & 2033 (%)
Figure 63 Russia Wastewater Recovery Systems Market Forecast, 2023-2033 (US$ Billion, AGR %)
Figure 64 Turkey Wastewater Recovery Systems Market Forecast, 2023-2033 (US$ Billion, AGR %)
Figure 65 Spain Wastewater Recovery Systems Market Forecast, 2023-2033 (US$ Billion, AGR %)
Figure 66 France Wastewater Recovery Systems Market Forecast, 2023-2033 (US$ Billion, AGR %)
Figure 67 UK Wastewater Recovery Systems Market Forecast, 2023-2033 (US$ Billion, AGR %)
Figure 68 Rest of Europe Wastewater Recovery Systems Market Forecast, 2023-2033 (US$ Billion, AGR %)
Figure 69 Asia Pacific Wastewater Recovery Systems Market Attractiveness Index
Figure 70 Asia Pacific Wastewater Recovery Systems Market by Region, 2023, 2028 & 2033 (US$ Billion)
Figure 71 Asia Pacific Wastewater Recovery Systems Market Forecast by Country, 2023-2033 (US$ Billion, AGR %)
Figure 72 Asia Pacific Wastewater Recovery Systems Market Share Forecast by Country, 2023 & 2033 (%)
Figure 73 Asia Pacific Wastewater Recovery Systems Market Forecast by Technology, 2023-2033 (US$ Billion, AGR %)
Figure 74 Asia Pacific Wastewater Recovery Systems Market Share Forecast by Technology, 2023 & 2033 (%)
Figure 75 Asia Pacific Wastewater Recovery Systems Market Forecast by Application, 2023-2033 (US$ Billion, AGR %)
Figure 76 Asia Pacific Wastewater Recovery Systems Market Share Forecast by Application, 2023 & 2033 (%)
Figure 77 China Wastewater Recovery Systems Market Forecast, 2023-2033 (US$ Billion, AGR %)
Figure 78 Japan Wastewater Recovery Systems Market Forecast, 2023-2033 (US$ Billion, AGR %)
Figure 79 India Wastewater Recovery Systems Market Forecast, 2023-2033 (US$ Billion, AGR %)
Figure 80 Indonesia Wastewater Recovery Systems Market Forecast, 2023-2033 (US$ Billion, AGR %)
Figure 81 South Korea Wastewater Recovery Systems Market Forecast, 2023-2033 (US$ Billion, AGR %)
Figure 82 Rest of Asia-Pacific Wastewater Recovery Systems Market Forecast, 2023-2033 (US$ Billion, AGR %)
Figure 83 Middle East & Africa Wastewater Recovery Systems Market Attractiveness Index
Figure 84 Middle East & Africa Wastewater Recovery Systems Market by Region, 2023, 2028 & 2033 (US$ Billion)
Figure 85 Middle East & Africa Wastewater Recovery Systems Market Forecast by Country, 2023-2033 (US$ Billion, AGR %)
Figure 86 Middle East & Africa Wastewater Recovery Systems Market Share Forecast by Country, 2023 & 2033 (%)
Figure 87 Middle East & Africa Wastewater Recovery Systems Market Forecast by Technology, 2023-2033 (US$ Billion, AGR %)
Figure 88 Middle East & Africa Wastewater Recovery Systems Market Share Forecast by Technology, 2023 & 2033 (%)
Figure 89 Middle East & Africa Wastewater Recovery Systems Market Forecast by Application, 2023-2033 (US$ Billion, AGR %)
Figure 90 Middle East & Africa Wastewater Recovery Systems Market Share Forecast by Application, 2023 & 2033 (%)
Figure 91 GCC Wastewater Recovery Systems Market Forecast, 2023-2033 (US$ Billion, AGR %)
Figure 92 Egypt Wastewater Recovery Systems Market Forecast, 2023-2033 (US$ Billion, AGR %)
Figure 93 South Africa Wastewater Recovery Systems Market Forecast, 2023-2033 (US$ Billion, AGR %)
Figure 94 Rest of Middle East & Africa Wastewater Recovery Systems Market Forecast, 2023-2033 (US$ Billion, AGR %)
Figure 95 Latin America Wastewater Recovery Systems Market Attractiveness Index
Figure 96 Latin America Wastewater Recovery Systems Market by Region, 2023, 2028 & 2033 (US$ Billion)
Figure 97 Latin America Wastewater Recovery Systems Market Forecast by Country, 2023-2033 (US$ Billion, AGR %)
Figure 98 Latin America Wastewater Recovery Systems Market Share Forecast by Country, 2023 & 2033 (%)
Figure 99 Latin America Wastewater Recovery Systems Market Forecast by Technology, 2023-2033 (US$ Billion, AGR %)
Figure 100 Latin America Wastewater Recovery Systems Market Share Forecast by Technology, 2023 & 2033 (%)
Figure 101 Latin America Wastewater Recovery Systems Market Forecast by Application, 2023-2033 (US$ Billion, AGR %)
Figure 102 Latin America Wastewater Recovery Systems Market Share Forecast by Application, 2023 & 2033 (%)
Figure 103 Brazil Wastewater Recovery Systems Market Forecast, 2023-2033 (US$ Billion, AGR %)
Figure 104 Mexico Wastewater Recovery Systems Market Forecast, 2023-2033 (US$ Billion, AGR %)
Figure 105 Rest of Latin America Wastewater Recovery Systems Market Forecast, 2023-2033 (US$ Billion, AGR %)
Figure 106 GDF Suez SA: Net Revenue, 2017-2021 (US$ Million, AGR%)
Figure 107 GDF SUEZ SA: R&D, 2017-2021 (US$ Million, AGR%)
Figure 108 Suez SA: Regional Market Shares, 2022
Figure 109 Veolia: Net Revenue, 2017-2022 (US$ Million, AGR%)
Figure 110 Veolia: Gross Profit, 2017-2022 (US$ Million, AGR%)
Figure 111 Veolia: Regional Market Shares, 2022
Figure 112 Vinnolit: Net Revenue, 2017-2022 (US$ Million, AGR%)
Figure 113 Vinnolit: Gross Profit, 2017-2022 (US$ Million, AGR%)
Figure 114 Vinnolit: Market Shares by Products, 2022
Figure 115 Pall Corporation: Net Revenue, 2017-2022 (US$ Million, AGR%)
Figure 116 Pall Corporation: Gross Profit, 2017-2022 (US$ Million, AGR%)
Figure 117 Pall Corporation: Regional Market Shares, 2022
Figure 118 Xylem: Net Revenue, 2017-2022 (US$ Million, AGR%)
Figure 119 Xylem: R&D, 2017-2022 (US$ Million, AGR%)
Figure 120 Xylem: Regional Market Shares, 2022
Figure 121 Ecolab: Net Revenue, 2017-2022 (US$ Million, AGR%)
Figure 122 Ecolab: Gross Profit, 2017-2022 (US$ Million, AGR%)
Figure 123 Ecolab: Regional Market Shares, 2022
Figure 124 Evoqua Water Technologies: Net Revenue, 2017-2022 (US$ Million, AGR%)
Figure 125 Evoqua Water Technologies: R&D, 2017-2022 (US$ Million, AGR%)
Figure 126 Evoqua Water Technologies: Regional Market Shares, 2022
Figure 127 Kubota: Net Revenue, 2017-2022 (US$ Million, AGR%)
Figure 128 Kubota: Gross Profit, 2017-2022 (US$ Million, AGR%)
Figure 129 Kubota: Regional Market Shares, 2022
Figure 130 AECOM: Net Revenue, 2017-2022 (US$ Million, AGR%)
Figure 131 AECOM: Gross Profit, 2017-2022 (US$ Million, AGR%)
Figure 132 AECOM: Regional Market Shares, 2022
Figure 133 Kurita Water Industries: Net Revenue, 2017-2022 (US$ Million, AGR%)
Figure 134 Kurita Water Industries: Operating Profit, 2017-2022 (US$ Million, AGR%)
Figure 135 Kurita Water Industries: Regional Market Shares, 2022
Figure 136 Hitachi Zosen Corporation: Net Revenue, 2017-2022 (US$ Million, AGR%)
Figure 137 Hitachi Zosen Corporation: Gross Profit, 2017-2022 (US$ Million, AGR%)
Figure 138 Hitachi Zosen Corporation: Regional Market Shares, 2022
Figure 139 AO Smith Corporation: Net Revenue, 2017-2022 (US$ Million, AGR%)
Figure 140 AO Smith Corporation: Gross Profit, 2017-2022 (US$ Million, AGR%)
Figure 141 AO Smith Corporation: Regional Market Shares, 2022
Figure 142 Doosan Enerbility: Regional Market Shares, 2022
ページTOPに戻る
本レポートと同じKEY WORD()の最新刊レポート
- 本レポートと同じKEY WORDの最新刊レポートはありません。
よくあるご質問
Visiongain社はどのような調査会社ですか?
英国の調査会社ヴィジョンゲイン社(Visiongain)は、通信とエネルギーのほか、自動車や化学・医薬品、金属など、広範な市場を対象に調査を行っています。自動車市場については、市場全般に関する調査のほ... もっと見る
調査レポートの納品までの日数はどの程度ですか?
在庫のあるものは速納となりますが、平均的には 3-4日と見て下さい。
但し、一部の調査レポートでは、発注を受けた段階で内容更新をして納品をする場合もあります。
発注をする前のお問合せをお願いします。
注文の手続きはどのようになっていますか?
1)お客様からの御問い合わせをいただきます。
2)見積書やサンプルの提示をいたします。
3)お客様指定、もしくは弊社の発注書をメール添付にて発送してください。
4)データリソース社からレポート発行元の調査会社へ納品手配します。
5) 調査会社からお客様へ納品されます。最近は、pdfにてのメール納品が大半です。
お支払方法の方法はどのようになっていますか?
納品と同時にデータリソース社よりお客様へ請求書(必要に応じて納品書も)を発送いたします。
お客様よりデータリソース社へ(通常は円払い)の御振り込みをお願いします。
請求書は、納品日の日付で発行しますので、翌月最終営業日までの当社指定口座への振込みをお願いします。振込み手数料は御社負担にてお願いします。
お客様の御支払い条件が60日以上の場合は御相談ください。
尚、初めてのお取引先や個人の場合、前払いをお願いすることもあります。ご了承のほど、お願いします。
データリソース社はどのような会社ですか?
当社は、世界各国の主要調査会社・レポート出版社と提携し、世界各国の市場調査レポートや技術動向レポートなどを日本国内の企業・公官庁及び教育研究機関に提供しております。
世界各国の「市場・技術・法規制などの」実情を調査・収集される時には、データリソース社にご相談ください。
お客様の御要望にあったデータや情報を抽出する為のレポート紹介や調査のアドバイスも致します。
|
|


