グリッドスケール蓄電池技術市場レポート:2023-2033
Grid-Scale Battery Storage Technologies Market Report 2023-2033
レポート詳細
グリッドスケール蓄電池技術市場レポート 2023-2033年 :本レポートは、業界とその基礎となる原動力をよりよく理解することを望むなら、新たな収益ポケットを目指す大手企業にとって貴... もっと見る
※上記価格は部署ライセンス(Departmental licence)価格です。
その他の価格についてはデータリソースまでお問合せください。
日本語のページは自動翻訳を利用し作成しています。
実際のレポートは英文のみでご納品いたします。
サマリー
レポート詳細
グリッドスケール蓄電池技術市場レポート 2023-2033年:本レポートは、業界とその基礎となる原動力をよりよく理解することを望むなら、新たな収益ポケットを目指す大手企業にとって貴重なものとなるでしょう。異業種への進出や新規地域での既存事業の拡大を目指す企業にも有用です。
再生可能エネルギーの統合 持続可能な未来への電力供給
太陽光や風力などの再生可能エネルギー源の世界的なエネルギーグリッドへの統合は、グリッドスケール蓄電池技術市場の基本的な原動力である。これらのエネルギー源は本質的に断続的であり、太陽が照った時や風が吹いた時に発電するため、余剰エネルギーを貯蔵して後で使用することが重要になります。グリッド・スケールのバッテリーはエネルギー貯蔵庫として機能し、再生可能エネルギーの生産量が多い時期に余剰電力を集め、需要が多いときや再生可能エネルギーの発電量が少ないときに放電する。このプロセスは送電網のバランスをとり、持続可能で低炭素なエネルギーの未来への移行に不可欠な、継続的で信頼できるエネルギー供給を保証する。このように、グリッド規模の蓄電池の成長は、再生可能エネルギー容量の拡大と温室効果ガス排出量の削減と密接に結びついている。
規制と政策支援道を開く政策
政府のインセンティブ、補助金、規制の枠組みは、グリッドスケールの蓄電池市場を形成する上で極めて重要である。税額控除、固定価格買取制度、容量市場など、こうしたシステムの導入を奨励する政策は、有利な投資環境を生み出します。これらは蓄電池設置の初期資本コストを相殺するだけでなく、系統規模の蓄電池を経済的に実行可能なものにする収益源を提供する。さらに、系統計画と運用への蓄電の統合を義務付ける規制は、こうした技術の普及を促進する。世界各国の政府がクリーンエネルギーと送電網の近代化を優先する中、規制による支援は、系統規模の蓄電池の開発と導入を加速させ、最終的にはより信頼性が高く、効率的で持続可能なエネルギーシステムを促進する上で重要な役割を果たします。
市場調査レポートを購入する前にすべき質問とは?
- グリッドスケール蓄電池技術市場はどのように進化しているのか?
- グリッドスケール蓄電池技術市場の促進要因と抑制要因は何か?
- グリッドスケール蓄電池技術の各サブマーケットセグメントは予測期間中にどのように成長し、2033年にどれくらいの収益を占めるのか?
- 2023年から2033年にかけて、各グリッドスケール蓄電池技術サブマーケットの市場シェアはどのように推移するのか?
- 2023年から2033年にかけて市場全体の主な牽引役は何か?
- 主要なグリッドスケール蓄電池技術市場はマクロ経済の動きに大枠で追随するのか、それとも個々の国内市場が他を凌駕するのか?
- 2033年までに各国市場のシェアはどう変化し、2033年に市場をリードするのはどの地域か?
- 主要プレーヤーは誰で、予測期間中の見通しは?
- これら大手企業のグリッドスケール蓄電池技術プロジェクトとは?
- 2023年から2033年にかけて、産業はどのように発展していくのか?グリッドスケール蓄電池技術プロジェクトは現在、そして今後10年間でどのような意味を持つのか?
- グリッドスケール蓄電池技術市場をさらに拡大するために、製品の商業化の必要性は高まっているか?
- グリッドスケール蓄電池技術市場はどこへ向かっているのか?
- 新製品やサービスラインに対する最適な投資オプションは何か?
- 企業を新たな成長軌道に乗せ、C-suiteに移行させるための重要な展望とは?
このことが、現在、そして今後10年間のグリッドスケール蓄電池技術市場にどのような影響を与えるかを見極める必要がある:
- 422ページにわたる本レポートでは、150の表と215の図表を掲載しています。
- 本レポートは、業界における主要な有利分野にハイライトを当てているため、今すぐターゲットを絞ることができます。
- 本レポートには、世界、地域、国の売上と成長に関する詳細な分析が含まれています。
- 競合他社が成功した主なトレンド、変化、収益予測をハイライトしています。
本レポートは、グリッドスケール蓄電池技術市場が今後10年間でどのように発展していくのか、またCOVID-19の景気後退と好転の変動に合わせてどのように発展していくのかをお伝えします。この市場は、過去10年間のどの時点よりも今が重要である。
2033年までの予測やその他の分析から、商業的な展望が明らかになる
- 2033年までの収益予測に加え、直近の業績、成長率、市場シェアもご覧いただけます。
- ビジネスの展望と展開に関する独自の分析をご覧いただけます。
- 定性的分析(市場ダイナミクス、促進要因、機会、阻害要因、課題を含む)、コスト構造、グリッドスケール蓄電池技術価格上昇の影響、最新動向をご覧いただけます。
本レポートには、COVID-19が業界と貴社にどのような影響を与えるかについてのデータ分析と貴重な洞察が含まれている。本レポートでは、COVID-19の4つの回収パターンとその影響、すなわち「V」、「L」、「W」、「U」について論じている。
レポート対象セグメント
設置場所別市場セグメント
- 独立型蓄電池
- ハイブリッド蓄電システム
エンドユーザー別市場セグメント
- 公益事業・住宅部門
- 独立系発電事業者(IPP)
- 商業・産業(C&I)セクター
タイプ別市場セグメント
- リチウムイオン電池
- 鉛蓄電池
- レドックスフロー電池(RFBs)
- ナトリウム電池
- その他の電池タイプ
用途別市場セグメント
- 負荷シフト
- 再生可能エネルギー統合
- 周波数調整
- 系統安定化
- ピークカット
- その他の用途
世界市場全体とセグメント別の収益予測に加え、4つの地域と20の主要国市場の収益予測も掲載しています:
北米
- アメリカ
- カナダ
欧州
- ドイツ
- スペイン
- イギリス
- フランス
- イタリア
- その他の欧州
アジア太平洋
- 中国
- 日本
- インド
- オーストラリア
- 韓国
- その他のアジア太平洋地域
ラテンアメリカ
- ブラジル
- メキシコ
- その他のラテンアメリカ
中東・アフリカ
- GCC
- 南アフリカ
- その他の中東・アフリカ
また、本レポートでは、グリッドスケール蓄電池技術市場の2023年から2033年にかけての主要企業のプロファイルと、これらの企業の事業のこのセグメントに焦点を当てています。
報告書に掲載されている主要企業
・ ABB Ltd
・ BYD Co. Ltd
・ Enphase Energy, Inc.
・ Fluence Energy
・ Kokam Co., Ltd.
・ LG Chem
・ NEC Corporation
・ Powin Energy
・ Primus Power
・ Saft Groupe SAS
・ Samsung SDI Co., Ltd
・ Sonnen GmbH
・ Tesla Energy Operations, Inc.
・ The AES Corporation
・ Wärtsilä Corporation
2023年から2033年までのグリッドスケール蓄電池技術市場全体の世界売上高(金額ベース)は、2023年に37億930万米ドルを突破する。2033年まで力強い収益成長を予測。当研究所では、最も大きな可能性を秘めた組織を特定している。彼らの能力、進歩、商業的展望を発見し、一歩先を行くお手伝いをします。
グリッドスケール蓄電池技術市場、2023-2033年レポートはどのようにお役に立つでしょうか?
要約すると、420ページを超えるこのレポートは、以下の知識を提供する:
- グリッドスケール蓄電池技術市場の2023年から2033年までの収益予測 設置、エンドユーザー、タイプ、アプリケーションの各予測を世界レベルと地域レベルで掲載 - 業界の将来性を発見し、投資と収益に最も有利な場所を見つけます。
- 4つの地域と20の主要国市場の2033年までの収益予測 - 北米、欧州、アジア太平洋、中南米、中東・アフリカのグリッドスケール蓄電池技術市場の2023年から2033年までの予測をご覧ください。また、米国、カナダ、ブラジル、ドイツ、フランス、英国、イタリア、中国、インド、日本、オーストラリアなどの著名経済圏の市場も予測しています。
- 既存企業および市場参入を目指す企業の展望 - 2023年から2033年までのグリッドスケール蓄電池技術市場に関わる主要企業15社の企業プロファイルを含む。
独自の予測による定量的・定性的分析をご覧ください。私たちのレポートだけに含まれる情報を入手し、貴重なビジネスインテリジェンスで情報を得ることができます。
他にはない情報
私たちの新しいレポートがあれば、知識に遅れをとったり、チャンスを逃したりする可能性が低くなります。弊社のレポートが貴社の調査、分析、意思決定にどのように役立つかをご覧ください。Visiongainの調査は、グリッドスケール蓄電池技術市場、2023年~2033年、市場をリードする企業の商業的分析を必要とするすべての人のためのものです。データ、トレンド、予測をご覧いただけます。
ページTOPに戻る
目次
目次
1 レポート概要
1.1 研究の目的
1.2 グリッドスケール蓄電池技術市場の紹介
1.3 本レポートの内容
1.4 本レポートを読むべき理由
1.5 本分析レポートが回答する主な質問
1.6 本レポートは誰のためのものか?
1.7 方法論
1.7.1 市場の定義
1.7.2 市場評価・予測手法
1.7.3 データの検証
1.7.3.1 一次調査
1.7.3.2 セカンダリーリサーチ
1.8 よくある質問(FAQ)
1.9 Visiongainの関連レポート
1.10 Visiongainについて
2 エグゼクティブ・サマリー
3 市場の概要
3.1 主要な調査結果
3.2 市場ダイナミクス
3.2.1 市場牽引要因
3.2.1.1 送電網の近代化が市場成長を牽引
3.2.1.2 炭素排出量削減のために電化に賭ける商業・産業(C&I)セクターの増加
3.2.1.3 ストレージ投資への金融インセンティブ
3.2.2 市場抑制要因
3.2.2.1 グリッドスケール蓄電池に伴う安全性への懸念
3.2.2.2 グリッドスケール蓄電池の遠隔地への設置が市場成長を妨げる
3.2.2.3 グリッドスケール電池プロジェクトは、許可、相互接続基準、市場規則に関する規制上の課題に直面することが多い
3.2.3 市場機会
3.2.3.1 電池貯蔵は送電コストが低い
3.2.3.2 世界の再生可能エネルギー・キャンペーンは市場成長のチャンス
3.2.3.3 持続可能なエネルギー資源への投資拡大が市場にとっての機会
3.3 ポーターのファイブフォース分析
3.3.1 サプライヤーの交渉力(中)
3.3.2 買い手の交渉力(中)
3.3.3 競争ライバル(中〜高)
3.3.4 代替品による脅威(低)
3.3.5 新規参入の脅威(低~中)
3.4 COVID-19の影響分析
3.4.1 "V字回復"
3.4.2 "U字型回復"
3.4.3 "W字型回復"
3.4.4 "L字型回復"
3.5 PEST分析
4 グリッドスケール蓄電池技術市場分析:設置場所別
4.1 主要調査結果
4.2 設置セグメント 市場魅力度指数
4.3 設置場所別グリッドスケール蓄電池技術市場規模の推定と予測
4.4 独立型蓄電池
4.4.1 2023~2033年の地域別市場規模(US$ Million)
4.4.2 2023年・2033年の地域別市場シェア(%)
4.5 ハイブリッド蓄電システム
4.5.1 2023~2033年の地域別市場規模(US$ Million)
4.5.2 2023年~2033年の地域別市場シェア(%)
5 グリッドスケール蓄電池技術市場分析:エンドユーザー別
5.1 主要調査結果
5.2 エンドユーザーセグメント: 市場魅力度指数
5.3 グリッドスケール蓄電池技術のエンドユーザー別市場規模推定と予測
5.4 ユーティリティ・住宅分野
5.4.1 2023~2033年の地域別市場規模(US$ Million)
5.4.2 地域別市場シェア、2023年・2033年(%)
5.5 IPP(独立系発電事業者)
5.5.1 2023年~2033年の地域別市場規模(US$ Million)
5.5.2 地域別市場シェア、2023年・2033年(%)
5.6 商業・産業(C&I)セクター
5.6.1 2023年~2033年の地域別市場規模(US$ Million)
5.6.2 地域別市場シェア、2023年・2033年(%)
6 グリッドスケール蓄電池技術市場分析:タイプ別
6.1 主要調査結果
6.2 タイプ別セグメント 市場魅力度指数
6.3 グリッドスケール蓄電技術のタイプ別市場規模推定と予測
6.4 リチウムイオン電池
6.4.1 2023~2033年の地域別市場規模(US$ Million)
6.4.2 地域別市場シェア、2023年・2033年(%)
6.5 鉛蓄電池
6.5.1 2023~2033年の地域別市場規模(US$ Million)
6.5.2 地域別市場シェア、2023年・2033年(%)
6.6 レドックスフロー電池(RFBs)
6.6.1 2023~2033年の地域別市場規模(US$ Million)
6.6.2 地域別市場シェア、2023年・2033年(%)
6.7 ナトリウム系電池
6.7.1 2023~2033年の地域別市場規模(US$ Million)
6.7.2 地域別市場シェア、2023年・2033年(%)
6.8 その他の設置型
6.8.1 2023~2033年の地域別市場規模(US$ Million)
6.8.2 地域別市場シェア、2023年・2033年 (%)
7 グリッドスケール蓄電池技術市場分析:用途別
7.1 主要な調査結果
7.2 アプリケーション・セグメント 市場魅力度指数
7.3 グリッドスケール蓄電技術の用途別市場規模の推定と予測
7.4 ロードシフト
7.4.1 2023~2033年の地域別市場規模(US$ Million)
7.4.2 地域別市場シェア、2023年・2033年 (%)
7.5 再生可能エネルギー統合
7.5.1 2023~2033年の地域別市場規模(US$ Million)
7.5.2 地域別市場シェア、2023年・2033年 (%)
7.6 周波数調整
7.6.1 2023~2033年の地域別市場規模(US$ Million)
7.6.2 地域別市場シェア、2023年・2033年 (%)
7.7 系統安定化
7.7.1 2023~2033年の地域別市場規模(US$ Million)
7.7.2 地域別市場シェア、2023年・2033年 (%)
7.8 ピークカット
7.8.1 2023〜2033年の地域別市場規模(US$ Million)
7.8.2 地域別市場シェア、2023年・2033年 (%)
7.9 その他(アンシラリーサービス、マイクログリッド)
7.9.1 2023~2033年の地域別市場規模(US$ Million)
7.9.2 地域別市場シェア、2023年・2033年 (%)
8 グリッドスケール蓄電池市場分析:地域別
8.1 主要な調査結果
8.2 地域別市場規模の推定と予測
9 北米のグリッドスケール蓄電池市場分析
9.1 主要な調査結果
9.2 北米のグリッドスケール蓄電池技術市場魅力度指数
9.3 北米のグリッドスケール蓄電池技術の国別市場、2023年、2028年、2033年(US$ Million)
9.4 北米のグリッドスケール蓄電池技術市場規模推定と予測
9.5 北米のグリッドスケール蓄電池技術市場規模推定と予測:国別
9.6 北米のグリッドスケール蓄電池技術市場規模推計と予測:設置別
9.7 北米のグリッドスケール蓄電池技術市場規模推計と予測:エンドユーザー別
9.8 北米のグリッドスケール蓄電池技術市場規模推計と予測:タイプ別
9.9 北米のグリッドスケール蓄電池技術市場規模推定と予測:用途別
9.10 アメリカのグリッドスケール蓄電池技術市場分析
9.11 カナダのグリッドスケール蓄電技術市場分析
10 欧州のグリッドスケール蓄電池市場分析
10.1 主要な調査結果
10.2 欧州グリッドスケール蓄電技術市場魅力度指数
10.3 欧州のグリッドスケール蓄電池技術の国別市場、2023年、2028年、2033年(US$ Million)
10.4 欧州のグリッドスケール蓄電池技術市場規模推定と予測
10.5 欧州のグリッドスケール蓄電池技術市場規模推定と予測:国別
10.6 欧州のグリッドスケール蓄電池技術市場規模推定と予測:設置場所別予測
10.7 欧州のグリッドスケール蓄電池技術市場規模推計と予測:エンドユーザー別
10.8 欧州のグリッドスケール蓄電池技術市場規模推定と予測:タイプ別
10.9 欧州のグリッドスケール蓄電池技術市場規模推定と予測:用途別
10.10 ドイツのグリッドスケール蓄電池技術市場分析
10.11 イギリスのグリッドスケール蓄電池技術市場分析
10.12 フランスのグリッドスケール蓄電池技術市場分析
10.13 イタリアのグリッドスケール蓄電池技術市場分析
10.14 スペインのグリッドスケール蓄電池技術市場分析
10.15 その他の欧州のグリッドスケール蓄電池技術市場分析
11 アジア太平洋地域のグリッドスケール蓄電池市場分析
11.1 主要な調査結果
11.2 アジア太平洋地域のグリッドスケール蓄電池技術市場魅力度指数
11.3 アジア太平洋地域のグリッドスケール蓄電池技術の国別市場、2023年、2028年、2033年(US$ Million)
11.4 アジア太平洋地域のグリッドスケール蓄電池技術市場規模推定と予測
11.5 アジア太平洋地域のグリッドスケール蓄電池技術市場規模推定と予測:国別
11.6 アジア太平洋地域のグリッドスケール蓄電池技術市場規模推定と予測:設置場所別
11.7 アジア太平洋地域のグリッドスケール蓄電池技術市場規模推定と予測:エンドユーザー別
11.8 アジア太平洋地域のグリッドスケール蓄電池技術市場規模推定と予測:タイプ別
11.9 アジア太平洋地域のグリッドスケール蓄電池技術市場規模推定と予測:用途別
11.10 中国のグリッドスケール蓄電池技術市場分析
11.11 インドのグリッドスケール蓄電池技術市場分析
11.12 日本のグリッドスケール蓄電技術市場分析
11.13 韓国のグリッドスケール蓄電池技術市場分析
11.14 オーストラリアのグリッドスケール蓄電池技術市場分析
11.15 その他のアジア太平洋地域のグリッドスケール蓄電池技術市場分析
12 中東・アフリカのグリッドスケール蓄電池市場分析
12.1 主要な調査結果
12.2 中東・アフリカのグリッドスケール蓄電池技術市場魅力度指数
12.3 中東・アフリカのグリッドスケール蓄電池技術国別市場、2023年、2028年、2033年 (US$ Million)
12.4 中東・アフリカのグリッドスケール蓄電池技術市場規模推定と予測
12.5 中東・アフリカのグリッドスケール蓄電池技術市場規模推定と予測:国別
12.6 中東・アフリカのグリッドスケール蓄電池技術市場規模推定と予測:設置場所別
12.7 中東・アフリカのグリッドスケール蓄電池技術市場規模推定と予測:エンドユーザー別
12.8 中東・アフリカのグリッドスケール蓄電池技術市場規模推定と予測:タイプ別
12.9 中東・アフリカのグリッドスケール蓄電池技術市場規模推定と予測:用途別
12.10 GCCのグリッドスケール蓄電池技術市場分析
12.11 南アフリカのグリッドスケール蓄電池技術市場分析
12.12 その他の中東・アフリカ地域グリッドスケール蓄電技術市場分析
13 ラテンアメリカのグリッドスケール蓄電池市場分析
13.1 主要な調査結果
13.2 ラテンアメリカのグリッドスケール蓄電池技術市場魅力度指数
13.3 ラテンアメリカのグリッドスケール蓄電池技術国別市場、2023年、2028年、2033年(US$ Million)
13.4 ラテンアメリカのグリッドスケール蓄電池技術市場規模推定と予測
13.5 ラテンアメリカのグリッドスケール蓄電池技術市場規模推定と予測:国別
13.6 ラテンアメリカのグリッドスケール蓄電池技術市場規模推定と予測:設置場所別
13.7 ラテンアメリカのグリッドスケール蓄電池技術市場規模推定と予測:エンドユーザー別
13.8 ラテンアメリカのグリッドスケール蓄電池技術市場規模推定と予測:タイプ別
13.9 ラテンアメリカのグリッドスケール蓄電池技術市場規模推定と予測:用途別
13.10 ブラジルのグリッドスケール蓄電池技術市場分析
13.11 メキシコのグリッドスケール蓄電池技術市場分析
13.12 その他の中南米のグリッドスケール蓄電池技術市場分析
14 主要企業のプロファイル
14.1 競争環境、2022年
14.2 戦略的展望
14.3 Tesla Energy Operations, Inc.
14.3.1 会社概要
14.3.2 会社概要
14.3.3 財務分析
14.3.3.1 純収入、2018-2022年
14.3.3.2 R&D、2018-2022年
14.3.3.3 地域別収益シェア、2022年(%)
14.3.3.4 事業セグメント収益シェア、2022年(%)
14.3.4 製品ベンチマーク
14.3.5 戦略的展望
14.4 LG Chem
14.4.1 会社概要
14.4.2 会社概要
14.4.3 財務分析
14.4.3.1 純収入、2018-2022年
14.4.3.2 R&D、2018年~2022年
14.4.3.3 地域別収益シェア、2022年(%)
14.4.3.4 事業セグメント収益シェア、2022年(%)
14.4.4 製品ベンチマーク
14.4.5 戦略的展望
14.5 BYD Co.Ltd.
14.5.1 会社概要
14.5.2 会社概要
14.5.3 財務分析
14.5.3.1 純収入、2018年~2022年
14.5.3.2 R&D、2018-2022年
14.5.3.3 地域別収益シェア、2022年(%)
14.5.3.4 事業セグメント収益シェア、2022年(%)
14.5.4 製品ベンチマーク
14.5.5 戦略的展望
14.6 Samsung SDI Co., Ltd
14.6.1 会社概要
14.6.2 会社概要
14.6.3 財務分析
14.6.3.1 純収入、2018-2022年
14.6.3.2 R&D、2018年~2022年
14.6.3.3 地域別収益シェア、2022年(%)
14.6.3.4 事業セグメント収益シェア、2022年(%)
14.6.4 製品ベンチマーク
14.7 ABB Ltd.
14.7.1 会社概要
14.7.2 会社概要
14.7.3 財務分析
14.7.3.1 純収入、2018-2022年
14.7.3.2 R&D、2018年~2022年
14.7.3.3 地域別収益シェア、2022年(%)
14.7.3.4 事業セグメント収益シェア、2022年(%)
14.7.4 製品ベンチマーク
14.7.5 戦略的展望
14.8 Fluence Energy
14.8.1 会社概要
14.8.2 会社概要
14.8.3 財務分析
14.8.3.1 純収入、2018-2022年
14.8.3.2 R&D、2018年~2022年
14.8.3.3 事業セグメント収益シェア、2022年(%)
14.8.4 製品ベンチマーク
14.8.5 戦略的展望
14.9 Saft Groupe SAS
14.9.1 会社概要
14.9.2 会社概要
14.9.3 財務分析
14.9.3.1 純収入、2018-2022年
14.9.3.2 R&D、2018年〜2022年
14.9.3.3 地域別収益シェア、2022年(%)
14.9.3.4 事業セグメント収益シェア、2022年(%)
14.9.4 製品ベンチマーク
14.9.5 戦略的展望
14.10 Wärtsilä Corporation
14.10.1 会社概要
14.10.2 会社概要
14.10.3 財務分析
14.10.3.1 純収入、2018-2022年
14.10.3.2 R&D(2018年~2022年
14.10.3.3 地域別収入シェア、2022年(%)
14.10.3.4 事業セグメント収益シェア、2022年(%)
14.10.4 製品ベンチマーク
14.10.5 戦略的展望
14.11 Enphase Energy, Inc.
14.11.1 会社概要
14.11.2 会社概要
14.11.3 財務分析
14.11.3.1 純収入、2018-2022年
14.11.3.2 R&D、2018年〜2022年
14.11.3.3 地域別売上高シェア、2022年(%)
14.11.4 製品ベンチマーク
14.11.5 戦略的展望
14.12 The AES Corporation
14.12.1 会社概要
14.12.2 会社概要
14.12.3 財務分析
14.12.3.1 純収入、2018-2022年
14.12.4 製品ベンチマーク
14.12.5 戦略的展望
14.13 Sonnen GmbH
14.13.1 会社概要
14.13.2 会社概要
14.13.3 製品ベンチマーク
14.13.4 戦略的展望
14.14 NEC Corporation
14.14.1 会社概要
14.14.2 会社概要
14.14.3 財務分析
14.14.3.1 純収入、2018-2022年
14.14.3.2 R&D、2018年~2022年
14.14.3.3 地域別収益シェア、2022年(%)
14.14.4 製品ベンチマーク
14.14.5 戦略的展望
14.15 Primus Power
14.15.1 会社概要
14.15.2 会社概要
14.15.3 製品ベンチマーク
14.16 Kokam Co., Ltd.
14.16.1 会社概要
14.16.2 会社概要
14.16.3 製品ベンチマーク
14.16.4 戦略的展望
14.17 Powin Energy
14.17.1 会社概要
14.17.2 会社概要
14.17.3 製品ベンチマーク
14.17.4 戦略的展望
15 結論と提言
15.1 Visiongainからの結びの言葉
15.2 市場プレイヤーへの提言
ページTOPに戻る
図表リスト
表の一覧
Table 1 Grid-Scale Battery Storage Technologies Market Snapshot, 2023 & 2033 (US$ Million, CAGR %)
Table 2 Global Grid-Scale Battery Storage Technologies Market by Region, 2023-2033 (US$ Mn, AGR (%), CAGR (%)) (V-Shaped Recovery Scenario)
Table 3 Global Grid-Scale Battery Storage Technologies Market by Region, 2023-2033 (US$ Mn, AGR (%), CAGR (%)) (U-Shaped Recovery Scenario)
Table 4 Global Grid-Scale Battery Storage Technologies Market by Region, 2023-2033 (US$ Mn, AGR (%), CAGR (%)) (W-Shaped Recovery Scenario)
Table 5 Global Grid-Scale Battery Storage Technologies Market by Region, 2023-2033 (US$ Mn, AGR (%), CAGR (%)) (L-Shaped Recovery Scenario)
Table 6 Global Grid-Scale Battery Storage Technologies Market by Installation, 2023-2033 (US$ Mn, AGR (%), CAGR (%))
Table 7 Standalone Battery Storage Market by Region, 2023-2033 (US$ Mn, AGR (%), CAGR (%))
Table 8 Hybrid Energy Storage Systems Market by Region, 2023-2033 (US$ Mn, AGR (%), CAGR (%))
Table 9 Global Grid-Scale Battery Storage Technologies Market by End-User, 2023-2033 (US$ Mn, AGR (%), CAGR (%))
Table 10 Utility & Residential Sector Market by Region, 2023-2033 (US$ Mn, AGR (%), CAGR (%))
Table 11 Independent Power Producers (IPPs) Market by Region, 2023-2033 (US$ Mn, AGR (%), CAGR (%))
Table 12 Commercial & Industrial (C&I) Sector Market by Region, 2023-2033 (US$ Mn, AGR (%), CAGR (%))
Table 13 Global Grid-Scale Battery Storage Technologies Market by Type, 2023-2033 (US$ Mn, AGR (%), CAGR (%))
Table 14 Lithium-ion Batteries Market by Region, 2023-2033 (US$ Mn, AGR (%), CAGR (%))
Table 15 Lead–acid Batteries Market by Region, 2023-2033 (US$ Mn, AGR (%), CAGR (%))
Table 16 Redox Flow Batteries (RFBs) Market by Region, 2023-2033 (US$ Mn, AGR (%), CAGR (%))
Table 17 Sodium-Based Batteries Market by Region, 2023-2033 (US$ Mn, AGR (%), CAGR (%))
Table 18 Other Battery Types Market by Region, 2023-2033 (US$ Mn, AGR (%), CAGR (%))
Table 19 Global Grid-Scale Battery Storage Technologies Market by Application, 2023-2033 (US$ Mn, AGR (%), CAGR (%))
Table 20 Load Shifting Market by Region, 2023-2033 (US$ Mn, AGR (%), CAGR (%))
Table 21 Renewable Integration Market by Region, 2023-2033 (US$ Mn, AGR (%), CAGR (%))
Table 22 Frequency Regulation Market by Region, 2023-2033 (US$ Mn, AGR (%), CAGR (%))
Table 23 Grid Stabilization Market by Region, 2023-2033 (US$ Mn, AGR (%), CAGR (%))
Table 24 Peak Shaving Market by Region, 2023-2033 (US$ Mn, AGR (%), CAGR (%))
Table 25 Other Application Market by Region, 2023-2033 (US$ Mn, AGR (%), CAGR (%))
Table 26 Grid-Scale Battery Storage Technologies Market Forecast by Region, 2023-2033 (US$ Million, AGR%, CAGR%)
Table 27 North America Grid-Scale Battery Storage Technologies Market by Value, 2023-2033 (US$ Mn, AGR (%), CAGR (%))
Table 28 North America Grid-Scale Battery Storage Technologies Market by Cumulative Installed Capacity, 2023-2033 (MW, AGR (%), CAGR (%))
Table 29 North America Grid-Scale Battery Storage Technologies Market by Country, 2023-2033 (US$ Mn, AGR (%), CAGR (%))
Table 30 North America Grid-Scale Battery Storage Technologies Market Cumulative Installed Capacity by Country, 2023-2033 (MW, AGR (%), CAGR (%))
Table 31 North America Grid-Scale Battery Storage Technologies Market by Installation, 2023-2033 (US$ Mn, AGR (%), CAGR (%))
Table 32 North America Grid-Scale Battery Storage Technologies Market by End-User, 2023-2033 (US$ Mn, AGR (%), CAGR (%))
Table 33 North America Grid-Scale Battery Storage Technologies Market by Type, 2023-2033 (US$ Mn, AGR (%), CAGR (%))
Table 34 North America Grid-Scale Battery Storage Technologies Market by Application, 2023-2033 (US$ Mn, AGR (%), CAGR (%))
Table 35 US Grid-Scale Battery Storage Technologies Market by Value, 2023-2033 (US$ Mn, AGR (%), CAGR (%))
Table 36 US Grid-Scale Battery Storage Technologies Market by Volume, 2023-2033 (MW, AGR (%), CAGR (%))
Table 37 Canada Grid-Scale Battery Storage Technologies Market by Value, 2023-2033 (US$ Mn, AGR (%), CAGR (%))
Table 38 Canada Grid-Scale Battery Storage Technologies Market by Volume, 2023-2033 (MW, AGR (%), CAGR (%))
Table 39 Europe Grid-Scale Battery Storage Technologies Market by Value, 2023-2033 (US$ Mn, AGR (%), CAGR (%))
Table 40 Europe Grid-Scale Battery Storage Technologies Market by Cumulative Installed Capacity, 2023-2033 (MW, AGR (%), CAGR (%))
Table 41 Europe Grid-Scale Battery Storage Technologies Market by Country, 2023-2033 (US$ Mn, AGR (%), CAGR (%))
Table 42 Europe Grid-Scale Battery Storage Technologies Market Cumulative Installed Capacity by Country, 2023-2033 (MW, AGR (%), CAGR (%))
Table 43 Europe Grid-Scale Battery Storage Technologies Market by Installation, 2023-2033 (US$ Mn, AGR (%), CAGR (%))
Table 44 Europe Grid-Scale Battery Storage Technologies Market by End-User, 2023-2033 (US$ Mn, AGR (%), CAGR (%))
Table 45 Europe Grid-Scale Battery Storage Technologies Market by Type, 2023-2033 (US$ Mn, AGR (%), CAGR (%))
Table 46 Europe Grid-Scale Battery Storage Technologies Market by Application, 2023-2033 (US$ Mn, AGR (%), CAGR (%))
Table 47 Germany Grid-Scale Battery Storage Technologies Market by Value, 2023-2033 (US$ Mn, AGR (%), CAGR (%))
Table 48 Germany Grid-Scale Battery Storage Technologies Market by Volume, 2023-2033 (MW, AGR (%), CAGR (%))
Table 49 UK Grid-Scale Battery Storage Technologies Market by Value, 2023-2033 (US$ Mn, AGR (%), CAGR (%))
Table 50 UK Grid-Scale Battery Storage Technologies Market by Volume, 2023-2033 (MW, AGR (%), CAGR (%))
Table 51 France Grid-Scale Battery Storage Technologies Market by Value, 2023-2033 (US$ Mn, AGR (%), CAGR (%))
Table 52 France Grid-Scale Battery Storage Technologies Market by Volume, 2023-2033 (MW, AGR (%), CAGR (%))
Table 53 Italy Grid-Scale Battery Storage Technologies Market by Value, 2023-2033 (US$ Mn, AGR (%), CAGR (%))
Table 54 Italy Grid-Scale Battery Storage Technologies Market by Volume, 2023-2033 (MW, AGR (%), CAGR (%))
Table 55 Spain Grid-Scale Battery Storage Technologies Market by Value, 2023-2033 (US$ Mn, AGR (%), CAGR (%))
Table 56 Spain Grid-Scale Battery Storage Technologies Market by Volume, 2023-2033 (MW, AGR (%), CAGR (%))
Table 57 Rest of Europe Grid-Scale Battery Storage Technologies Market by Value, 2023-2033 (US$ Mn, AGR (%), CAGR (%))
Table 58 Rest of Europe Grid-Scale Battery Storage Technologies Market by Volume, 2023-2033 (MW, AGR (%), CAGR (%))
Table 59 Asia-Pacific Grid-Scale Battery Storage Technologies Market by Value, 2023-2033 (US$ Mn, AGR (%), CAGR (%))
Table 60 Asia-Pacific Grid-Scale Battery Storage Technologies Market by Cumulative Installed Capacity, 2023-2033 (MW, AGR (%), CAGR (%))
Table 61 Asia-Pacific Grid-Scale Battery Storage Technologies Market by Country, 2023-2033 (US$ Mn, AGR (%), CAGR (%))
Table 62 Asia-Pacific Grid-Scale Battery Storage Technologies Market Cumulative Installed Capacity by Country, 2023-2033 (MW, AGR (%), CAGR (%))
Table 63 Asia-Pacific Grid-Scale Battery Storage Technologies Market by Installation, 2023-2033 (US$ Mn, AGR (%), CAGR (%))
Table 64 Asia-Pacific Grid-Scale Battery Storage Technologies Market by End-User, 2023-2033 (US$ Mn, AGR (%), CAGR (%))
Table 65 Asia-Pacific Grid-Scale Battery Storage Technologies Market by Type, 2023-2033 (US$ Mn, AGR (%), CAGR (%))
Table 66 Asia-Pacific Grid-Scale Battery Storage Technologies Market by Application, 2023-2033 (US$ Mn, AGR (%), CAGR (%))
Table 67 China Grid-Scale Battery Storage Technologies Market by Value, 2023-2033 (US$ Mn, AGR (%), CAGR (%))
Table 68 China Grid-Scale Battery Storage Technologies Market by Volume, 2023-2033 (MW, AGR (%), CAGR (%))
Table 69 India Grid-Scale Battery Storage Technologies Market by Value, 2023-2033 (US$ Mn, AGR (%), CAGR (%))
Table 70 India Grid-Scale Battery Storage Technologies Market by Volume, 2023-2033 (MW, AGR (%), CAGR (%))
Table 71 Japan Grid-Scale Battery Storage Technologies Market by Value, 2023-2033 (US$ Mn, AGR (%), CAGR (%))
Table 72 Japan Grid-Scale Battery Storage Technologies Market by Volume, 2023-2033 (MW, AGR (%), CAGR (%))
Table 73 South Korea Grid-Scale Battery Storage Technologies Market by Value, 2023-2033 (US$ Mn, AGR (%), CAGR (%))
Table 74 South Korea Grid-Scale Battery Storage Technologies Market by Volume, 2023-2033 (MW, AGR (%), CAGR (%))
Table 75 Australia Grid-Scale Battery Storage Technologies Market by Value, 2023-2033 (US$ Mn, AGR (%), CAGR (%))
Table 76 Australia Grid-Scale Battery Storage Technologies Market by Volume, 2023-2033 (MW, AGR (%), CAGR (%))
Table 77 Rest of Asia-Pacific Grid-Scale Battery Storage Technologies Market by Value, 2023-2033 (US$ Mn, AGR (%), CAGR (%))
Table 78 Rest of Asia-Pacific Grid-Scale Battery Storage Technologies Market by Volume, 2023-2033 (MW, AGR (%), CAGR (%))
Table 79 Middle East & Africa Grid-Scale Battery Storage Technologies Market by Value, 2023-2033 (US$ Mn, AGR (%), CAGR (%))
Table 80 Middle East & Africa Grid-Scale Battery Storage Technologies Market by Cumulative Installed Capacity, 2023-2033 (MW, AGR (%), CAGR (%))
Table 81 Middle East & Africa Grid-Scale Battery Storage Technologies Market by Country, 2023-2033 (US$ Mn, AGR (%), CAGR (%))
Table 82 Middle East & Africa Grid-Scale Battery Storage Technologies Market Cumulative Installed Capacity by Country, 2023-2033 (MW, AGR (%), CAGR (%))
Table 83 Middle East & Africa Grid-Scale Battery Storage Technologies Market by Installation, 2023-2033 (US$ Mn, AGR (%), CAGR (%))
Table 84 Middle East & Africa Grid-Scale Battery Storage Technologies Market by End-User, 2023-2033 (US$ Mn, AGR (%), CAGR (%))
Table 85 Middle East & Africa Grid-Scale Battery Storage Technologies Market by Type, 2023-2033 (US$ Mn, AGR (%), CAGR (%))
Table 86 Middle East & Africa Grid-Scale Battery Storage Technologies Market by Application, 2023-2033 (US$ Mn, AGR (%), CAGR (%))
Table 87 GCC Grid-Scale Battery Storage Technologies Market by Value, 2023-2033 (US$ Mn, AGR (%), CAGR (%))
Table 88 GCC Grid-Scale Battery Storage Technologies Market by Volume, 2023-2033 (MW, AGR (%), CAGR (%))
Table 89 South Africa Grid-Scale Battery Storage Technologies Market by Value, 2023-2033 (US$ Mn, AGR (%), CAGR (%))
Table 90 South Africa Grid-Scale Battery Storage Technologies Market by Volume, 2023-2033 (MW, AGR (%), CAGR (%))
Table 91 Rest of Middle East & Africa Grid-Scale Battery Storage Technologies Market by Value, 2023-2033 (US$ Mn, AGR (%), CAGR (%))
Table 92 Rest of Middle East & Africa Grid-Scale Battery Storage Technologies Market by Volume, 2023-2033 (MW, AGR (%), CAGR (%))
Table 93 Latin America Grid-Scale Battery Storage Technologies Market by Value, 2023-2033 (US$ Mn, AGR (%), CAGR (%))
Table 94 Latin America Grid-Scale Battery Storage Technologies Market by Cumulative Installed Capacity, 2023-2033 (MW, AGR (%), CAGR (%))
Table 95 Latin America Grid-Scale Battery Storage Technologies Market by Country, 2023-2033 (US$ Mn, AGR (%), CAGR (%))
Table 96 Latin America Grid-Scale Battery Storage Technologies Market Cumulative Installed Capacity by Country, 2023-2033 (MW, AGR (%), CAGR (%))
Table 97 Latin America Grid-Scale Battery Storage Technologies Market by Installation, 2023-2033 (US$ Mn, AGR (%), CAGR (%))
Table 98 Latin America Grid-Scale Battery Storage Technologies Market by End-User, 2023-2033 (US$ Mn, AGR (%), CAGR (%))
Table 99 Latin America Grid-Scale Battery Storage Technologies Market by Type, 2023-2033 (US$ Mn, AGR (%), CAGR (%))
Table 100 Latin America Grid-Scale Battery Storage Technologies Market by Application, 2023-2033 (US$ Mn, AGR (%), CAGR (%))
Table 101 Brazil Grid-Scale Battery Storage Technologies Market by Value, 2023-2033 (US$ Mn, AGR (%), CAGR (%))
Table 102 Brazil Grid-Scale Battery Storage Technologies Market by Volume, 2023-2033 (MW, AGR (%), CAGR (%))
Table 103 Mexico Grid-Scale Battery Storage Technologies Market by Value, 2023-2033 (US$ Mn, AGR (%), CAGR (%))
Table 104 Mexico Grid-Scale Battery Storage Technologies Market by Volume, 2023-2033 (MW, AGR (%), CAGR (%))
Table 105 Rest of Latin America Grid-Scale Battery Storage Technologies Market by Value, 2023-2033 (US$ Mn, AGR (%), CAGR (%))
Table 106 Rest of Latin America Grid-Scale Battery Storage Technologies Market by Volume, 2023-2033 (MW, AGR (%), CAGR (%))
Table 107 Strategic Outlook - Contract
Table 108 Tesla Energy Operations, Inc: Key Details, (CEO, HQ, Revenue, Founded, No. of Employees, Company Type, Website, Business Segment)
Table 109 Tesla Energy Operations, Inc: Product Benchmarking
Table 110 Tesla Energy Operations, Inc: Strategic Outlook
Table 111 LG Chem: Key Details, (CEO, HQ, Revenue, Founded, No. of Employees, Company Type, Website, Business Segment)
Table 112 LG Chem: Product Benchmarking
Table 113 LG Chem: Strategic Outlook
Table 114 BYD Co. Ltd: Key Details, (CEO, HQ, Revenue, Founded, No. of Employees, Company Type, Website, Business Segment)
Table 115 BYD Co. Ltd: Product Benchmarking
Table 116 BYD Co. Ltd: Strategic Outlook
Table 117 Samsung SDI Co., Ltd: Key Details, (CEO, HQ, Revenue, Founded, No. of Employees, Company Type, Website, Business Segment)
Table 118 Samsung SDI Co., Ltd: Product Benchmarking
Table 119 ABB Ltd: Key Details, (CEO, HQ, Revenue, Founded, No. of Employees, Company Type, Website, Business Segment)
Table 120 ABB Ltd: Product Benchmarking
Table 121 ABB Ltd: Strategic Outlook
Table 122 Fluence Energy: Key Details, (CEO, HQ, Revenue, Founded, No. of Employees, Company Type, Website, Business Segment)
Table 123 Fluence Energy: Product Benchmarking
Table 124 Fluence Energy: Strategic Outlook
Table 125 Saft Groupe SAS: Key Details, (CEO, HQ, Revenue, Founded, No. of Employees, Company Type, Website, Business Segment)
Table 126 Saft Groupe SAS: Product Benchmarking
Table 127 Saft Groupe SAS: Strategic Outlook
Table 128 Wärtsilä Corporation: Key Details, (CEO, HQ, Revenue, Founded, No. of Employees, Company Type, Website, Business Segment)
Table 129 Wärtsilä Corporation: Product Benchmarking
Table 130 Wärtsilä Corporation: Strategic Outlook
Table 131 Enphase Energy, Inc.: Key Details, (CEO, HQ, Revenue, Founded, No. of Employees, Company Type, Website, Business Segment)
Table 132 Enphase Energy, Inc: Product Benchmarking
Table 133 Enphase Energy, Inc: Strategic Outlook
Table 134 The AES Corporation: Key Details, (CEO, HQ, Revenue, Founded, No. of Employees, Company Type, Website, Business Segment)
Table 135 The AES Corporation: Product Benchmarking
Table 136 The AES Corporation: Strategic Outlook
Table 137 sonnen GmbH: Key Details, (CEO, HQ, Revenue, Founded, No. of Employees, Company Type, Website, Business Segment)
Table 138 sonnen GmbH: Product Benchmarking
Table 139 sonnen GmbH: Strategic Outlook
Table 140 NEC Corporation: Key Details, (CEO, HQ, Revenue, Founded, No. of Employees, Company Type, Website, Business Segment)
Table 141 NEC Corporation: Product Benchmarking
Table 142 NEC Corporation: Strategic Outlook
Table 143 Primus Power: Key Details, (CEO, HQ, Revenue, Founded, No. of Employees, Company Type, Website, Business Segment)
Table 144 Primus Power: Product Benchmarking
Table 145 Kokam: Key Details, (CEO, HQ, Revenue, Founded, No. of Employees, Company Type, Website, Business Segment)
Table 146 Kokam: Product Benchmarking
Table 147 Kokam: Strategic Outlook
Table 148 Powin Energy: Key Details, (CEO, HQ, Revenue, Founded, No. of Employees, Company Type, Website, Business Segment)
Table 149 Powin Energy: Product Benchmarking
Table 150 Powin Energy: Strategic Outlook
図の一覧
Figure 1 Grid-Scale Battery Storage Technologies Market Segmentation
Figure 2 Grid-Scale Battery Storage Technologies Market by Installation: Market Attractiveness Index
Figure 3 Grid-Scale Battery Storage Technologies Market by End-User: Market Attractiveness Index
Figure 4 Grid-Scale Battery Storage Technologies Market by Type: Market Attractiveness Index
Figure 5 Grid-Scale Battery Storage Technologies Market by Application: Market Attractiveness Index
Figure 6 Grid-Scale Battery Storage Technologies Market Attractiveness Index by Region
Figure 7 Grid-Scale Battery Storage Technologies Market: Market Dynamics
Figure 8 Grid-Scale Battery Storage Technologies Market: Porter’s Five Forces Analysis
Figure 9 Global Grid-Scale Battery Storage Technologies Market Share Forecast by COVID, 2023-2033 (%)
Figure 10 Global Grid-Scale Battery Storage Technologies Market by Region, 2023-2033 (US$ Mn, AGR (%)) (V-Shaped Recovery Scenario)
Figure 11 Global Grid-Scale Battery Storage Technologies Market by Region, 2023-2033 (US$ Mn, AGR (%)) (U-Shaped Recovery Scenario)
Figure 12 Global Grid-Scale Battery Storage Technologies Market by Region, 2023-2033 (US$ Mn, AGR (%)) (W-Shaped Recovery Scenario)
Figure 13 Global Grid-Scale Battery Storage Technologies Market by Region, 2023-2033 (US$ Mn, AGR (%)) (L-Shaped Recovery Scenario)
Figure 14 Grid-Scale Battery Storage Technologies Market: PEST Analysis
Figure 15 Grid-Scale Battery Storage Technologies Market by Installation: Market Attractiveness Index
Figure 16 Global Grid-Scale Battery Storage Technologies Market by Installation, 2023-2033 (US$ Mn, AGR (%))
Figure 17 Grid-Scale Battery Storage Technologies Market Share Forecast by Installation, 2023, 2028, 2033 (%)
Figure 18 Standalone Battery Storage Market by Region, 2023-2033 (US$ Mn, AGR (%))
Figure 19 Standalone Battery Storage Market Share Forecast by Region, 2023 & 2033 (%)
Figure 20 Hybrid Energy Storage Systems Market by Region, 2023-2033 (US$ Mn, AGR (%))
Figure 21 Hybrid Energy Storage Systems Market Share Forecast by Region, 2023 & 2033 (%)
Figure 22 Grid-Scale Battery Storage Technologies Market by End-User: Market Attractiveness Index
Figure 23 Global Grid-Scale Battery Storage Technologies Market by End-User, 2023-2033 (US$ Mn, AGR (%))
Figure 24 Grid-Scale Battery Storage Technologies Market Share Forecast by End-User, 2023, 2028, 2033 (%)
Figure 25 Utility & Residential Sector Market by Region, 2023-2033 (US$ Mn, AGR (%))
Figure 26 Utility & Residential Sector Market Share Forecast by Region, 2023 & 2033 (%)
Figure 27 Independent Power Producers (IPPs) Market by Region, 2023-2033 (US$ Mn, AGR (%))
Figure 28 Independent Power Producers (IPPs) Market Share Forecast by Region, 2023 & 2033 (%)
Figure 29 Commercial & Industrial (C&I) Sector Market by Region, 2023-2033 (US$ Mn, AGR (%))
Figure 30 Commercial & Industrial (C&I) Sector Market Share Forecast by Region, 2023 & 2033 (%)
Figure 31 Grid-Scale Battery Storage Technologies Market by Type: Market Attractiveness Index
Figure 32 Global Grid-Scale Battery Storage Technologies Market by Type, 2023-2033 (US$ Mn, AGR (%))
Figure 33 Grid-Scale Battery Storage Technologies Market Share Forecast by Type, 2023, 2028, 2033 (%)
Figure 34 Lithium-ion Batteries Market by Region, 2023-2033 (US$ Mn, AGR (%))
Figure 35 Lithium-ion Batteries Market Share Forecast by Region, 2023 & 2033 (%)
Figure 36 Lead–acid Batteries Market by Region, 2023-2033 (US$ Mn, AGR (%))
Figure 37 Lead–acid Batteries Market Share Forecast by Region, 2023 & 2033 (%)
Figure 38 Redox Flow Batteries (RFBs) Market by Region, 2023-2033 (US$ Mn, AGR (%))
Figure 39 Redox Flow Batteries (RFBs) Market Share Forecast by Region, 2023 & 2033 (%)
Figure 40 Sodium-Based Batteries Market by Region, 2023-2033 (US$ Mn, AGR (%))
Figure 41 Sodium-Based Batteries Market Share Forecast by Region, 2023 & 2033 (%)
Figure 42 Other Battery Types Market by Region, 2023-2033 (US$ Mn, AGR (%))
Figure 43 Other Installation Market Share Forecast by Region, 2023 & 2033 (%)
Figure 44 Grid-Scale Battery Storage Technologies Market by Application: Market Attractiveness Index
Figure 45 Global Grid-Scale Battery Storage Technologies Market by Application, 2023-2033 (US$ Mn, AGR (%))
Figure 46 Grid-Scale Battery Storage Technologies Market Share Forecast by Application, 2023, 2028, 2033 (%)
Figure 47 Load Shifting Market by Region, 2023-2033 (US$ Mn, AGR (%))
Figure 48 Load Shifting Market Share Forecast by Region, 2023 & 2033 (%)
Figure 49 Renewable Integration Market by Region, 2023-2033 (US$ Mn, AGR (%))
Figure 50 Renewable Integration Market Share Forecast by Region, 2023 & 2033 (%)
Figure 51 Frequency Regulation Market by Region, 2023-2033 (US$ Mn, AGR (%))
Figure 52 Frequency Regulation Market Share Forecast by Region, 2023 & 2033 (%)
Figure 53 Grid Stabilization Market by Region, 2023-2033 (US$ Mn, AGR (%))
Figure 54 Grid Stabilization Market Share Forecast by Region, 2023 & 2033 (%)
Figure 55 Peak Shaving Market by Region, 2023-2033 (US$ Mn, AGR (%))
Figure 56 Peak Shaving Market Share Forecast by Region, 2023 & 2033 (%)
Figure 57 Other Application Market by Region, 2023-2033 (US$ Mn, AGR (%))
Figure 58 Others (Ancillary Services, Microgrids) Market Share Forecast by Region, 2023 & 2033 (%)
Figure 59 Grid-Scale Battery Storage Technologies Market Forecast by Region 2023 and 2033 (Revenue, CAGR%)
Figure 60 Grid-Scale Battery Storage Technologies Market Share Forecast by Region 2023, 2028, 2033 (%)
Figure 61 Grid-Scale Battery Storage Technologies Market by Region, 2023-2033 (US$ Million, AGR %)
Figure 62 North America Grid-Scale Battery Storage Technologies Market Attractiveness Index
Figure 63 North America Grid-Scale Battery Storage Technologies Market by Region, 2023, 2028 & 2033 (US$ Million)
Figure 64 North America Grid-Scale Battery Storage Technologies Market by Value, 2023-2033 (US$ Mn, AGR (%))
Figure 65 North America Grid-Scale Battery Storage Technologies Market by Cumulative Installed Capacity, 2023-2033 (MW, AGR (%))
Figure 66 North America Grid-Scale Battery Storage Technologies Market by Country, 2023-2033 (US$ Mn, AGR (%))
Figure 67 North America Grid-Scale Battery Storage Technologies Market Cumulative Installed Capacity by Country, 2023-2033 (MW, AGR (%))
Figure 68 North America Grid-Scale Battery Storage Technologies Market Share Forecast by Country, 2023 & 2033 (%)
Figure 69 North America Grid-Scale Battery Storage Technologies Market by Installation, 2023-2033 (US$ Mn, AGR (%))
Figure 70 North America Grid-Scale Battery Storage Technologies Market Share Forecast Installation, 2023 & 2033 (%)
Figure 71 North America Grid-Scale Battery Storage Technologies Market by End-User, 2023-2033 (US$ Mn, AGR (%))
Figure 72 North America Grid-Scale Battery Storage Technologies Market Share Forecast by End-User, 2023 & 2033 (%)
Figure 73 North America Grid-Scale Battery Storage Technologies Market by Type, 2023-2033 (US$ Mn, AGR (%))
Figure 74 North America Grid-Scale Battery Storage Technologies Market Share Forecast by Type, 2023 & 2033 (%)
Figure 75 North America Grid-Scale Battery Storage Technologies Market by Application, 2023-2033 (US$ Mn, AGR (%))
Figure 76 North America Grid-Scale Battery Storage Technologies Market Share Forecast by Application, 2023 & 2033 (%)
Figure 77 US Grid-Scale Battery Storage Technologies Market by Value, 2023-2033 (US$ Mn, AGR (%))
Figure 78 US Grid-Scale Battery Storage Technologies Market by Volume, 2023-2033 (MW, AGR (%))
Figure 79 Canada Grid-Scale Battery Storage Technologies Market by Value, 2023-2033 (US$ Mn, AGR (%))
Figure 80 Canada Grid-Scale Battery Storage Technologies Market by Volume, 2023-2033 (MW, AGR (%))
Figure 81 Europe Grid-Scale Battery Storage Technologies Market Attractiveness Index
Figure 82 Europe Grid-Scale Battery Storage Technologies Market by Region, 2023, 2028 & 2033 (US$ Million)
Figure 83 Europe Grid-Scale Battery Storage Technologies Market by Value, 2023-2033 (US$ Mn, AGR (%))
Figure 84 Europe Grid-Scale Battery Storage Technologies Market by Cumulative Installed Capacity, 2023-2033 (MW, AGR (%))
Figure 85 Europe Grid-Scale Battery Storage Technologies Market by Country, 2023-2033 (US$ Mn, AGR (%))
Figure 86 Europe Grid-Scale Battery Storage Technologies Market Cumulative Installed Capacity by Country, 2023-2033 (MW, AGR (%))
Figure 87 Europe Grid-Scale Battery Storage Technologies Market Share Forecast by Country, 2023 & 2033 (%)
Figure 88 Europe Grid-Scale Battery Storage Technologies Market by Installation, 2023-2033 (US$ Mn, AGR (%))
Figure 89 Europe Grid-Scale Battery Storage Technologies Market Share Forecast Installation, 2023 & 2033 (%)
Figure 90 Europe Grid-Scale Battery Storage Technologies Market by End-User, 2023-2033 (US$ Mn, AGR (%))
Figure 91 Europe Grid-Scale Battery Storage Technologies Market Share Forecast by End-User, 2023 & 2033 (%)
Figure 92 Europe Grid-Scale Battery Storage Technologies Market by Type, 2023-2033 (US$ Mn, AGR (%))
Figure 93 Europe Grid-Scale Battery Storage Technologies Market Share Forecast by Type, 2023 & 2033 (%)
Figure 94 Europe Grid-Scale Battery Storage Technologies Market by Application, 2023-2033 (US$ Mn, AGR (%))
Figure 95 Europe Grid-Scale Battery Storage Technologies Market Share Forecast by Application, 2023 & 2033 (%)
Figure 96 Germany Grid-Scale Battery Storage Technologies Market by Value, 2023-2033 (US$ Mn, AGR (%))
Figure 97 Germany Grid-Scale Battery Storage Technologies Market by Volume, 2023-2033 (MW, AGR (%))
Figure 98 UK Grid-Scale Battery Storage Technologies Market by Value, 2023-2033 (US$ Mn, AGR (%))
Figure 99 UK Grid-Scale Battery Storage Technologies Market by Volume, 2023-2033 (MW, AGR (%))
Figure 100 France Grid-Scale Battery Storage Technologies Market by Value, 2023-2033 (US$ Mn, AGR (%))
Figure 101 France Grid-Scale Battery Storage Technologies Market by Volume, 2023-2033 (MW, AGR (%))
Figure 102 Italy Grid-Scale Battery Storage Technologies Market by Value, 2023-2033 (US$ Mn, AGR (%))
Figure 103 Italy Grid-Scale Battery Storage Technologies Market by Volume, 2023-2033 (MW, AGR (%))
Figure 104 Spain Grid-Scale Battery Storage Technologies Market by Value, 2023-2033 (US$ Mn, AGR (%))
Figure 105 Spain Grid-Scale Battery Storage Technologies Market by Volume, 2023-2033 (MW, AGR (%))
Figure 106 Rest of Europe Grid-Scale Battery Storage Technologies Market by Value, 2023-2033 (US$ Mn, AGR (%))
Figure 107 Rest of Europe Grid-Scale Battery Storage Technologies Market by Volume, 2023-2033 (MW, AGR (%))
Figure 108 Asia-Pacific Grid-Scale Battery Storage Technologies Market Attractiveness Index
Figure 109 Asia-Pacific Grid-Scale Battery Storage Technologies Market by Region, 2023, 2028 & 2033 (US$ Million)
Figure 110 Asia-Pacific Grid-Scale Battery Storage Technologies Market by Value, 2023-2033 (US$ Mn, AGR (%))
Figure 111 Asia-Pacific Grid-Scale Battery Storage Technologies Market by Cumulative Installed Capacity, 2023-2033 (MW, AGR (%))
Figure 112 Asia-Pacific Grid-Scale Battery Storage Technologies Market by Country, 2023-2033 (US$ Mn, AGR (%))
Figure 113 Asia-Pacific Grid-Scale Battery Storage Technologies Market Cumulative Installed Capacity by Country, 2023-2033 (MW, AGR (%))
Figure 114 Asia-Pacific Grid-Scale Battery Storage Technologies Market Share Forecast by Country, 2023 & 2033 (%)
Figure 115 Asia-Pacific Grid-Scale Battery Storage Technologies Market by Installation, 2023-2033 (US$ Mn, AGR (%))
Figure 116 Asia-Pacific Grid-Scale Battery Storage Technologies Market Share Forecast Installation, 2023 & 2033 (%)
Figure 117 Asia-Pacific Grid-Scale Battery Storage Technologies Market by End-User, 2023-2033 (US$ Mn, AGR (%))
Figure 118 Asia-Pacific Grid-Scale Battery Storage Technologies Market Share Forecast by End-User, 2023 & 2033 (%)
Figure 119 Asia-Pacific Grid-Scale Battery Storage Technologies Market by Type, 2023-2033 (US$ Mn, AGR (%))
Figure 120 Asia-Pacific Grid-Scale Battery Storage Technologies Market Share Forecast by Type, 2023 & 2033 (%)
Figure 121 Asia-Pacific Grid-Scale Battery Storage Technologies Market by Application, 2023-2033 (US$ Mn, AGR (%))
Figure 122 Asia-Pacific Grid-Scale Battery Storage Technologies Market Share Forecast by Application, 2023 & 2033 (%)
Figure 123 China Grid-Scale Battery Storage Technologies Market by Value, 2023-2033 (US$ Mn, AGR (%))
Figure 124 China Grid-Scale Battery Storage Technologies Market by Volume, 2023-2033 (MW, AGR (%))
Figure 125 India Grid-Scale Battery Storage Technologies Market by Value, 2023-2033 (US$ Mn, AGR (%))
Figure 126 India Grid-Scale Battery Storage Technologies Market by Volume, 2023-2033 (MW, AGR (%))
Figure 127 Japan Grid-Scale Battery Storage Technologies Market by Value, 2023-2033 (US$ Mn, AGR (%))
Figure 128 Japan Grid-Scale Battery Storage Technologies Market by Volume, 2023-2033 (MW, AGR (%))
Figure 129 South Korea Grid-Scale Battery Storage Technologies Market by Value, 2023-2033 (US$ Mn, AGR (%))
Figure 130 South Korea Grid-Scale Battery Storage Technologies Market by Volume, 2023-2033 (MW, AGR (%))
Figure 131 Australia Grid-Scale Battery Storage Technologies Market by Value, 2023-2033 (US$ Mn, AGR (%))
Figure 132 Australia Grid-Scale Battery Storage Technologies Market by Volume, 2023-2033 (MW, AGR (%))
Figure 133 Rest of Asia-Pacific Grid-Scale Battery Storage Technologies Market by Value, 2023-2033 (US$ Mn, AGR (%))
Figure 134 Rest of Asia-Pacific Grid-Scale Battery Storage Technologies Market by Volume, 2023-2033 (MW, AGR (%))
Figure 135 Middle East and Africa Grid-Scale Battery Storage Technologies Market Attractiveness Index
Figure 136 Middle East and Africa Grid-Scale Battery Storage Technologies Market by Region, 2023, 2028 & 2033 (US$ Million)
Figure 137 Middle East & Africa Grid-Scale Battery Storage Technologies Market by Value, 2023-2033 (US$ Mn, AGR (%))
Figure 138 Middle East & Africa Grid-Scale Battery Storage Technologies Market by Cumulative Installed Capacity, 2023-2033 (MW, AGR (%))
Figure 139 Middle East & Africa Grid-Scale Battery Storage Technologies Market by Country, 2023-2033 (US$ Mn, AGR (%))
Figure 140 Middle East & Africa Grid-Scale Battery Storage Technologies Market Cumulative Installed Capacity by Country, 2023-2033 (MW, AGR (%))
Figure 141 Middle East and Africa Grid-Scale Battery Storage Technologies Market Share Forecast by Country, 2023 & 2033 (%)
Figure 142 Middle East & Africa Grid-Scale Battery Storage Technologies Market by Installation, 2023-2033 (US$ Mn, AGR (%))
Figure 143 Middle East and Africa Grid-Scale Battery Storage Technologies Market Share Forecast Installation, 2023 & 2033 (%)
Figure 144 Middle East & Africa Grid-Scale Battery Storage Technologies Market by End-User, 2023-2033 (US$ Mn, AGR (%))
Figure 145 Middle East and Africa Grid-Scale Battery Storage Technologies Market Share Forecast by End-User, 2023 & 2033 (%)
Figure 146 Middle East & Africa Grid-Scale Battery Storage Technologies Market by Type, 2023-2033 (US$ Mn, AGR (%))
Figure 147 Middle East and Africa Grid-Scale Battery Storage Technologies Market Share Forecast by Type, 2023 & 2033 (%)
Figure 148 Middle East & Africa Grid-Scale Battery Storage Technologies Market by Application, 2023-2033 (US$ Mn, AGR (%))
Figure 149 Middle East and Africa Grid-Scale Battery Storage Technologies Market Share Forecast by Application, 2023 & 2033 (%)
Figure 150 GCC Grid-Scale Battery Storage Technologies Market by Value, 2023-2033 (US$ Mn, AGR (%))
Figure 151 GCC Grid-Scale Battery Storage Technologies Market by Volume, 2023-2033 (MW, AGR (%))
Figure 152 South Africa Grid-Scale Battery Storage Technologies Market by Value, 2023-2033 (US$ Mn, AGR (%))
Figure 153 South Africa Grid-Scale Battery Storage Technologies Market by Volume, 2023-2033 (MW, AGR (%))
Figure 154 Rest of Middle East & Africa Grid-Scale Battery Storage Technologies Market by Value, 2023-2033 (US$ Mn, AGR (%))
Figure 155 Rest of Middle East & Africa Grid-Scale Battery Storage Technologies Market by Volume, 2023-2033 (MW, AGR (%))
Figure 156 Latin America Grid-Scale Battery Storage Technologies Market Attractiveness Index
Figure 157 Latin America Grid-Scale Battery Storage Technologies Market by Region, 2023, 2028 & 2033 (US$ Million)
Figure 158 Latin America Grid-Scale Battery Storage Technologies Market by Value, 2023-2033 (US$ Mn, AGR (%))
Figure 159 Latin America Grid-Scale Battery Storage Technologies Market by Cumulative Installed Capacity, 2023-2033 (MW, AGR (%))
Figure 160 Latin America Grid-Scale Battery Storage Technologies Market by Country, 2023-2033 (US$ Mn, AGR (%))
Figure 161 Latin America Grid-Scale Battery Storage Technologies Market Cumulative Installed Capacity by Country, 2023-2033 (MW, AGR (%))
Figure 162 Latin America Grid-Scale Battery Storage Technologies Market Share Forecast by Country, 2023 & 2033 (%)
Figure 163 Latin America Grid-Scale Battery Storage Technologies Market by Installation, 2023-2033 (US$ Mn, AGR (%))
Figure 164 Latin America Grid-Scale Battery Storage Technologies Market Share Forecast Installation, 2023 & 2033 (%)
Figure 165 Latin America Grid-Scale Battery Storage Technologies Market by End-User, 2023-2033 (US$ Mn, AGR (%))
Figure 166 Latin America Grid-Scale Battery Storage Technologies Market Share Forecast by End-User, 2023 & 2033 (%)
Figure 167 Latin America Grid-Scale Battery Storage Technologies Market by Type, 2023-2033 (US$ Mn, AGR (%))
Figure 168 Latin America Grid-Scale Battery Storage Technologies Market Share Forecast by Type, 2023 & 2033 (%)
Figure 169 Latin America Grid-Scale Battery Storage Technologies Market by Application, 2023-2033 (US$ Mn, AGR (%))
Figure 170 Latin America Grid-Scale Battery Storage Technologies Market Share Forecast by Application, 2023 & 2033 (%)
Figure 171 Brazil Grid-Scale Battery Storage Technologies Market by Value, 2023-2033 (US$ Mn, AGR (%))
Figure 172 Brazil Grid-Scale Battery Storage Technologies Market by Volume, 2023-2033 (MW, AGR (%))
Figure 173 Mexico Grid-Scale Battery Storage Technologies Market by Value, 2023-2033 (US$ Mn, AGR (%))
Figure 174 Mexico Grid-Scale Battery Storage Technologies Market by Volume, 2023-2033 (MW, AGR (%))
Figure 175 Rest of Latin America Grid-Scale Battery Storage Technologies Market by Value, 2023-2033 (US$ Mn, AGR (%))
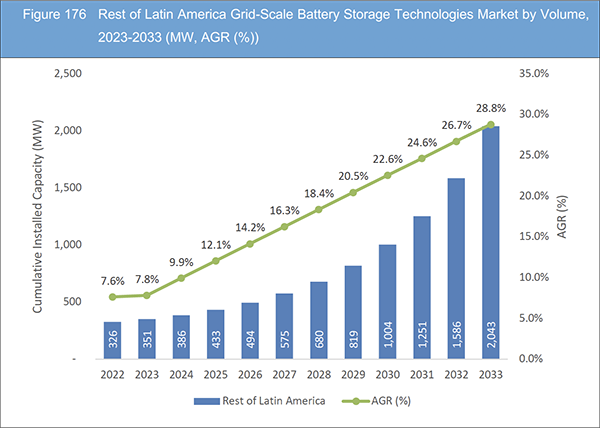
Figure 176 Rest of Latin America Grid-Scale Battery Storage Technologies Market by Volume, 2023-2033 (MW, AGR (%))
Figure 177 Grid-Scale Battery Storage Technologies Market: Company Share, 2022
Figure 178 Tesla Energy Operations, Inc.: Net Revenue, 2018-2022 (US$ Million, AGR%)
Figure 179 Tesla Energy Operations, Inc.: R&D, 2018-2022 (US$ Million, AGR%)
Figure 180 Tesla Energy Operations, Inc.: Regional Revenue Share, 2022 (%)
Figure 181 Tesla Energy Operations, Inc.: Business Segment Revenue Share, 2022 (%)
Figure 182 LG Chem.: Net Revenue, 2018-2022 (US$ Million, AGR%)
Figure 183 LG Chem.: R&D, 2018-2022 (US$ Million, AGR%)
Figure 184 LG Chem.: Regional Revenue Share, 2022 (%)
Figure 185 LG Chem.: Business Segment Revenue Share, 2022 (%)
Figure 186 BYD Co. Ltd.: Net Revenue, 2018-2022 (US$ Million, AGR%)
Figure 187 BYD Co. Ltd.: R&D, 2018-2022 (US$ Million, AGR%)
Figure 188 BYD Co. Ltd.: Regional Revenue Share, 2022 (%)
Figure 189 BYD Co. Ltd.: Business Segment Revenue Share, 2022 (%)
Figure 190 Samsung SDI Co., Ltd.: Net Revenue, 2018-2022 (US$ Million, AGR%)
Figure 191 Samsung SDI Co., Ltd.: R&D, 2018-2022 (US$ Million, AGR%)
Figure 192 Samsung SDI Co., Ltd.: Regional Revenue Share, 2022 (%)
Figure 193 Samsung SDI Co., Ltd.: Business Segment Revenue Share, 2022 (%)
Figure 194 ABB Ltd.: Net Revenue, 2018-2022 (US$ Million, AGR%)
Figure 195 ABB Ltd.: R&D, 2018-2022 (US$ Million, AGR%)
Figure 196 ABB Ltd.: Regional Revenue Share, 2022 (%)
Figure 197 ABB Ltd.: Business Segment Revenue Share, 2022 (%)
Figure 198 Fluence Energy.: Net Revenue, 2018-2022 (US$ Million, AGR%)
Figure 199 Fluence Energy.: R&D, 2018-2022 (US$ Million, AGR%)
Figure 200 Fluence Energy.: Business Segment Revenue Share, 2022 (%)
Figure 201 Saft Groupe SAS.: Net Revenue, 2018-2022 (US$ Million, AGR%)
Figure 202 Saft Groupe SAS.: R&D, 2018-2022 (US$ Million, AGR%)
Figure 203 Saft Groupe SAS.: Regional Revenue Share, 2022 (%)
Figure 204 Saft Groupe SAS.: Business Segment Revenue Share, 2022 (%)
Figure 205 Wärtsilä Corporation.: Net Revenue, 2018-2022 (US$ Million, AGR%)
Figure 206 Wärtsilä Corporation.: R&D, 2018-2022 (US$ Million, AGR%)
Figure 207 Wärtsilä Corporation.: Regional Revenue Share, 2022 (%)
Figure 208 Wärtsilä Corporation.: Business Segment Revenue Share, 2022 (%)
Figure 209 Enphase Energy, Inc.: Net Revenue, 2018-2022 (US$ Million, AGR%)
Figure 210 Enphase Energy, Inc.: R&D, 2018-2022 (US$ Million, AGR%)
Figure 211 Enphase Energy, Inc.: Regional Revenue Share, 2022 (%)
Figure 212 The AES Corporation.: Net Revenue, 2018-2022 (US$ Million, AGR%)
Figure 213 NEC Corporation.: Net Revenue, 2018-2022 (US$ Million, AGR%)
Figure 214 NEC Corporation.: R&D, 2018-2022 (US$ Million, AGR%)
Figure 215 NEC Corporation.: Regional Revenue Share, 2022 (%)
ページTOPに戻る
Summary
Report Details
The Grid-Scale Battery Storage Technologies Market Report 2023-2033: This report will prove invaluable to leading firms striving for new revenue pockets if they wish to better understand the industry and its underlying dynamics. It will be useful for companies that would like to expand into different industries or to expand their existing operations in a new region.
Renewable Energy Integration: Powering a Sustainable Future
The integration of renewable energy sources like solar and wind into the global energy grid is a fundamental driver of the grid-scale battery storage technologies market. These sources are inherently intermittent, meaning they generate electricity when the sun shines or the wind blows, making it critical to store excess energy for later use. Grid-scale batteries act as energy reservoirs, collecting surplus power during periods of high renewable energy production and discharging it when demand is high or renewable generation is low. This process helps balance the grid, ensuring a continuous and reliable energy supply, which is essential for transitioning to a sustainable, low-carbon energy future. The growth of grid-scale battery storage is thus closely tied to the expansion of renewable energy capacity and the reduction of greenhouse gas emissions.
Regulatory and Policy Support: Policy Paving the Way
Government incentives, subsidies, and regulatory frameworks are pivotal in shaping the grid-scale battery storage market. Policies that encourage the deployment of these systems, such as tax credits, feed-in tariffs, and capacity markets, create a favorable investment environment. They not only help offset the initial capital costs of battery installations but also provide revenue streams that make grid-scale storage economically viable. Furthermore, regulations mandating the integration of energy storage into grid planning and operations promote the widespread adoption of these technologies. As governments worldwide prioritize clean energy and grid modernization, regulatory support plays a crucial role in accelerating the development and deployment of grid-scale battery storage, ultimately facilitating a more reliable, efficient, and sustainable energy system.
What Questions Should You Ask before Buying a Market Research Report?
• How is the grid-scale battery storage technologies market evolving?
• What is driving and restraining the grid-scale battery storage technologies market?
• How will each grid-scale battery storage technologies submarket segment grow over the forecast period and how much revenue will these submarkets account for in 2033?
• How will the market shares for each grid-scale battery storage technologies submarket develop from 2023 to 2033?
• What will be the main driver for the overall market from 2023 to 2033?
• Will leading grid-scale battery storage technologies markets broadly follow the macroeconomic dynamics, or will individual national markets outperform others?
• How will the market shares of the national markets change by 2033 and which geographical region will lead the market in 2033?
• Who are the leading players and what are their prospects over the forecast period?
• What are the grid-scale battery storage technologies projects for these leading companies?
• How will the industry evolve during the period between 2023 and 2033? What are the implications of grid-scale battery storage technologies projects taking place now and over the next 10 years?
• Is there a greater need for product commercialisation to further scale the grid-scale battery storage technologies market?
• Where is the grid-scale battery storage technologies market heading and how can you ensure you are at the forefront of the market?
• What are the best investment options for new product and service lines?
• What are the key prospects for moving companies into a new growth path and C-suite?
You need to discover how this will impact the grid-scale battery storage technologies market today, and over the next 10 years:
• Our 422-page report provides 150 tables and 215 charts/graphs exclusively to you.
• The report highlights key lucrative areas in the industry so you can target them – NOW.
• It contains in-depth analysis of global, regional and national sales and growth.
• It highlights for you the key successful trends, changes and revenue projections made by your competitors.
This report tells you TODAY how the grid-scale battery storage technologies market will develop in the next 10 years, and in line with the variations in COVID-19 economic recession and bounce. This market is more critical now than at any point over the last 10 years.
Forecasts to 2033 and other analyses reveal commercial prospects
• In addition to revenue forecasting to 2033, our new study provides you with recent results, growth rates, and market shares.
• You will find original analyses, with business outlooks and developments.
• Discover qualitative analyses (including market dynamics, drivers, opportunities, restraints and challenges), cost structure, impact of rising grid-scale battery storage technologies prices and recent developments.
This report includes data analysis and invaluable insight into how COVID-19 will affect the industry and your company. Four COVID-19 recovery patterns and their impact, namely, “V”, “L”, “W” and “U” are discussed in this report.
Segments Covered in the Report
Market Segment by Installation
• Standalone Battery Storage
• Hybrid Energy Storage Systems
Market Segment by End-User
• Utility & Residential Sector
• Independent Power Producers (IPPs)
• Commercial & Industrial (C&I) Sector
Market Segment by Type
• Lithium-ion Batteries
• Lead–acid Batteries
• Redox Flow Batteries (RFBs)
• Sodium-Based Batteries
• Other Battery Types
Market Segment by Application
• Load Shifting
• Renewable Integration
• Frequency Regulation
• Grid Stabilization
• Peak Shaving
• Other Application
In addition to the revenue predictions for the overall world market and segments, you will also find revenue forecasts for four regional and 20 leading national markets:
North America
• U.S.
• Canada
Europe
• Germany
• Spain
• United Kingdom
• France
• Italy
• Rest of Europe
Asia Pacific
• China
• Japan
• India
• Australia
• South Korea
• Rest of Asia Pacific
Latin America
• Brazil
• Mexico
• Rest of Latin America
Middle East & Africa
• GCC
• South Africa
• Rest of Middle East & Africa
The report also includes profiles and for some of the leading companies in the Grid-Scale Battery Storage Technologies Market, 2023 to 2033, with a focus on this segment of these companies’ operations.
Leading companies profiled in the report
• ABB Ltd
• BYD Co. Ltd
• Enphase Energy, Inc.
• Fluence Energy
• Kokam Co., Ltd.
• LG Chem
• NEC Corporation
• Powin Energy
• Primus Power
• Saft Groupe SAS
• Samsung SDI Co., Ltd
• Sonnen GmbH
• Tesla Energy Operations, Inc.
• The AES Corporation
• Wärtsilä Corporation
Overall world revenue for Grid-Scale Battery Storage Technologies Market, 2023 to 2033 in terms of value the market will surpass US$3,709.3 million in 2023, our work calculates. We predict strong revenue growth through to 2033. Our work identifies which organizations hold the greatest potential. Discover their capabilities, progress, and commercial prospects, helping you stay ahead.
How will the Grid-Scale Battery Storage Technologies Market, 2023 to 2033 report help you?
In summary, our 420+ page report provides you with the following knowledge:
• Revenue forecasts to 2033 for Grid-Scale Battery Storage Technologies Market, 2023 to 2033 Market, with forecasts for installation, end-user, type, and application, each forecast at a global and regional level – discover the industry’s prospects, finding the most lucrative places for investments and revenues.
• Revenue forecasts to 2033 for four regional and 20 key national markets – See forecasts for the Grid-Scale Battery Storage Technologies Market, 2023 to 2033 market in North America, Europe, Asia-Pacific, Latin America and Middle East & Africa. Also forecasted is the market in the US, Canada, Brazil, Germany, France, UK, Italy, China, India, Japan, and Australia among other prominent economies.
• Prospects for established firms and those seeking to enter the market – including company profiles for 15 of the major companies involved in the Grid-Scale Battery Storage Technologies Market, 2023 to 2033.
Find quantitative and qualitative analyses with independent predictions. Receive information that only our report contains, staying informed with invaluable business intelligence.
Information found nowhere else
With our new report, you are less likely to fall behind in knowledge or miss out on opportunities. See how our work could benefit your research, analyses, and decisions. Visiongain’s study is for everybody needing commercial analyses for the Grid-Scale Battery Storage Technologies Market, 2023 to 2033, market-leading companies. You will find data, trends and predictions.
ページTOPに戻る
Table of Contents
Table of Contents
1 Report Overview
1.1 Objectives of the Study
1.2 Introduction to Grid-Scale Battery Storage Technologies Market
1.3 What This Report Delivers
1.4 Why You Should Read This Report
1.5 Key Questions Answered by This Analytical Report
1.6 Who Is This Report for?
1.7 Methodology
1.7.1 Market Definitions
1.7.2 Market Evaluation & Forecasting Methodology
1.7.3 Data Validation
1.7.3.1 Primary Research
1.7.3.2 Secondary Research
1.8 Frequently Asked Questions (FAQs)
1.9 Associated Visiongain Reports
1.10 About Visiongain
2 Executive Summary
3 Market Overview
3.1 Key Findings
3.2 Market Dynamics
3.2.1 Market Driving Factors
3.2.1.1 Grid Modernization is Driving the Market Growth
3.2.1.2 Commercial and Industrial (C&I) Sectors Increasingly Betting on Electrification to Reduce their Carbon Emissions
3.2.1.3 Financial Incentives for Storage Investment
3.2.2 Market Restraining Factors
3.2.2.1 Safety Concerns Associated with Grid Scale Battery Storage
3.2.2.2 Installation of Grid Scale Battery in Remote Locations Hinder the Market Growth
3.2.2.3 Grid-scale Battery Projects Often Face Regulatory Challenges Related to Permitting, Interconnection Standards, and Market Rules
3.2.3 Market Opportunities
3.2.3.1 Battery Storage has Lower Transmission Costs
3.2.3.2 Global Renewable Energy Campaign Opportunities for the Market Growth
3.2.3.3 Growing Investments towards Sustainable Energy Resources opportunity for the Market
3.3 Porter’s Five Forces Analysis
3.3.1 Bargaining Power of Suppliers (Medium)
3.3.2 Bargaining Power of Buyers (Medium)
3.3.3 Competitive Rivalry (Medium to High)
3.3.4 Threat from Substitutes (Low)
3.3.5 Threat of New Entrants (Low to medium)
3.4 COVID-19 Impact Analysis
3.4.1 “V-Shaped Recovery”
3.4.2 “U-Shaped Recovery”
3.4.3 “W-Shaped Recovery”
3.4.4 “L-Shaped Recovery”
3.5 PEST Analysis
4 Grid-Scale Battery Storage Technologies Market Analysis by Installation
4.1 Key Findings
4.2 Installation Segment: Market Attractiveness Index
4.3 Grid-Scale Battery Storage Technologies Market Size Estimation and Forecast by Installation
4.4 Standalone Battery Storage
4.4.1 Market Size by Region, 2023-2033 (US$ Million)
4.4.2 Market Share by Region, 2023 & 2033 (%)
4.5 Hybrid Energy Storage Systems
4.5.1 Market Size by Region, 2023-2033 (US$ Million)
4.5.2 Market Share by Region, 2023 & 2033 (%)
5 Grid-Scale Battery Storage Technologies Market Analysis by End-User
5.1 Key Findings
5.2 End-User Segment: Market Attractiveness Index
5.3 Grid-Scale Battery Storage Technologies Market Size Estimation and Forecast by End-User
5.4 Utility & Residential Sector
5.4.1 Market Size by Region, 2023-2033 (US$ Million)
5.4.2 Market Share by Region, 2023 & 2033 (%)
5.5 Independent Power Producers (IPPs)
5.5.1 Market Size by Region, 2023-2033 (US$ Million)
5.5.2 Market Share by Region, 2023 & 2033 (%)
5.6 Commercial & Industrial (C&I) Sector
5.6.1 Market Size by Region, 2023-2033 (US$ Million)
5.6.2 Market Share by Region, 2023 & 2033 (%)
6 Grid-Scale Battery Storage Technologies Market Analysis by Type
6.1 Key Findings
6.2 Type Segment: Market Attractiveness Index
6.3 Grid-Scale Battery Storage Technologies Market Size Estimation and Forecast by Type
6.4 Lithium-ion Batteries
6.4.1 Market Size by Region, 2023-2033 (US$ Million)
6.4.2 Market Share by Region, 2023 & 2033 (%)
6.5 Lead–acid Batteries
6.5.1 Market Size by Region, 2023-2033 (US$ Million)
6.5.2 Market Share by Region, 2023 & 2033 (%)
6.6 Redox Flow Batteries (RFBs)
6.6.1 Market Size by Region, 2023-2033 (US$ Million)
6.6.2 Market Share by Region, 2023 & 2033 (%)
6.7 Sodium-Based Batteries
6.7.1 Market Size by Region, 2023-2033 (US$ Million)
6.7.2 Market Share by Region, 2023 & 2033 (%)
6.8 Other Installation
6.8.1 Market Size by Region, 2023-2033 (US$ Million)
6.8.2 Market Share by Region, 2023 & 2033 (%)
7 Grid-Scale Battery Storage Technologies Market Analysis by Application
7.1 Key Findings
7.2 Application Segment: Market Attractiveness Index
7.3 Grid-Scale Battery Storage Technologies Market Size Estimation and Forecast by Application
7.4 Load Shifting
7.4.1 Market Size by Region, 2023-2033 (US$ Million)
7.4.2 Market Share by Region, 2023 & 2033 (%)
7.5 Renewable Integration
7.5.1 Market Size by Region, 2023-2033 (US$ Million)
7.5.2 Market Share by Region, 2023 & 2033 (%)
7.6 Frequency Regulation
7.6.1 Market Size by Region, 2023-2033 (US$ Million)
7.6.2 Market Share by Region, 2023 & 2033 (%)
7.7 Grid Stabilization
7.7.1 Market Size by Region, 2023-2033 (US$ Million)
7.7.2 Market Share by Region, 2023 & 2033 (%)
7.8 Peak Shaving
7.8.1 Market Size by Region, 2023-2033 (US$ Million)
7.8.2 Market Share by Region, 2023 & 2033 (%)
7.9 Others (Ancillary Services, Microgrids)
7.9.1 Market Size by Region, 2023-2033 (US$ Million)
7.9.2 Market Share by Region, 2023 & 2033 (%)
8 Grid-Scale Battery Storage Technologies Market Analysis by Region
8.1 Key Findings
8.2 Regional Market Size Estimation and Forecast
9 North America Grid-Scale Battery Storage Technologies Market Analysis
9.1 Key Findings
9.2 North America Grid-Scale Battery Storage Technologies Market Attractiveness Index
9.3 North America Grid-Scale Battery Storage Technologies Market by Country, 2023, 2028 & 2033 (US$ Million)
9.4 North America Grid-Scale Battery Storage Technologies Market Size Estimation and Forecast
9.5 North America Grid-Scale Battery Storage Technologies Market Size Estimation and Forecast by Country
9.6 North America Grid-Scale Battery Storage Technologies Market Size Estimation and Forecast by Installation
9.7 North America Grid-Scale Battery Storage Technologies Market Size Estimation and Forecast by End-User
9.8 North America Grid-Scale Battery Storage Technologies Market Size Estimation and Forecast by Type
9.9 North America Grid-Scale Battery Storage Technologies Market Size Estimation and Forecast by Application
9.10 U.S. Grid-Scale Battery Storage Technologies Market Analysis
9.11 Canada Grid-Scale Battery Storage Technologies Market Analysis
10 Europe Grid-Scale Battery Storage Technologies Market Analysis
10.1 Key Findings
10.2 Europe Grid-Scale Battery Storage Technologies Market Attractiveness Index
10.3 Europe Grid-Scale Battery Storage Technologies Market by Country, 2023, 2028 & 2033 (US$ Million)
10.4 Europe Grid-Scale Battery Storage Technologies Market Size Estimation and Forecast
10.5 Europe Grid-Scale Battery Storage Technologies Market Size Estimation and Forecast by Country
10.6 Europe Grid-Scale Battery Storage Technologies Market Size Estimation and Forecast by Installation
10.7 Europe Grid-Scale Battery Storage Technologies Market Size Estimation and Forecast by End-User
10.8 Europe Grid-Scale Battery Storage Technologies Market Size Estimation and Forecast by Type
10.9 Europe Grid-Scale Battery Storage Technologies Market Size Estimation and Forecast by Application
10.10 Germany Grid-Scale Battery Storage Technologies Market Analysis
10.11 UK Grid-Scale Battery Storage Technologies Market Analysis
10.12 France Grid-Scale Battery Storage Technologies Market Analysis
10.13 Italy Grid-Scale Battery Storage Technologies Market Analysis
10.14 Spain Grid-Scale Battery Storage Technologies Market Analysis
10.15 Rest of Europe Grid-Scale Battery Storage Technologies Market Analysis
11 Asia-Pacific Grid-Scale Battery Storage Technologies Market Analysis
11.1 Key Findings
11.2 Asia-Pacific Grid-Scale Battery Storage Technologies Market Attractiveness Index
11.3 Asia-Pacific Grid-Scale Battery Storage Technologies Market by Country, 2023, 2028 & 2033 (US$ Million)
11.4 Asia-Pacific Grid-Scale Battery Storage Technologies Market Size Estimation and Forecast
11.5 Asia-Pacific Grid-Scale Battery Storage Technologies Market Size Estimation and Forecast by Country
11.6 Asia-Pacific Grid-Scale Battery Storage Technologies Market Size Estimation and Forecast by Installation
11.7 Asia-Pacific Grid-Scale Battery Storage Technologies Market Size Estimation and Forecast by End-User
11.8 Asia-Pacific Grid-Scale Battery Storage Technologies Market Size Estimation and Forecast by Type
11.9 Asia-Pacific Grid-Scale Battery Storage Technologies Market Size Estimation and Forecast by Application
11.10 China Grid-Scale Battery Storage Technologies Market Analysis
11.11 India Grid-Scale Battery Storage Technologies Market Analysis
11.12 Japan Grid-Scale Battery Storage Technologies Market Analysis
11.13 South Korea Grid-Scale Battery Storage Technologies Market Analysis
11.14 Australia Grid-Scale Battery Storage Technologies Market Analysis
11.15 Rest of Asia-Pacific Grid-Scale Battery Storage Technologies Market Analysis
12 Middle East and Africa Grid-Scale Battery Storage Technologies Market Analysis
12.1 Key Findings
12.2 Middle East and Africa Grid-Scale Battery Storage Technologies Market Attractiveness Index
12.3 Middle East and Africa Grid-Scale Battery Storage Technologies Market by Country, 2023, 2028 & 2033 (US$ Million)
12.4 Middle East and Africa Grid-Scale Battery Storage Technologies Market Size Estimation and Forecast
12.5 Middle East and Africa Grid-Scale Battery Storage Technologies Market Size Estimation and Forecast by Country
12.6 Middle East and Africa Grid-Scale Battery Storage Technologies Market Size Estimation and Forecast by Installation
12.7 Middle East and Africa Grid-Scale Battery Storage Technologies Market Size Estimation and Forecast by End-User
12.8 Middle East and Africa Grid-Scale Battery Storage Technologies Market Size Estimation and Forecast by Type
12.9 Middle East and Africa Grid-Scale Battery Storage Technologies Market Size Estimation and Forecast by Application
12.10 GCC Grid-Scale Battery Storage Technologies Market Analysis
12.11 South Africa Grid-Scale Battery Storage Technologies Market Analysis
12.12 Rest of Middle East & Africa Grid-Scale Battery Storage Technologies Market Analysis
13 Latin America Grid-Scale Battery Storage Technologies Market Analysis
13.1 Key Findings
13.2 Latin America Grid-Scale Battery Storage Technologies Market Attractiveness Index
13.3 Latin America Grid-Scale Battery Storage Technologies Market by Country, 2023, 2028 & 2033 (US$ Million)
13.4 Latin America Grid-Scale Battery Storage Technologies Market Size Estimation and Forecast
13.5 Latin America Grid-Scale Battery Storage Technologies Market Size Estimation and Forecast by Country
13.6 Latin America Grid-Scale Battery Storage Technologies Market Size Estimation and Forecast by Installation
13.7 Latin America Grid-Scale Battery Storage Technologies Market Size Estimation and Forecast by End-User
13.8 Latin America Grid-Scale Battery Storage Technologies Market Size Estimation and Forecast by Type
13.9 Latin America Grid-Scale Battery Storage Technologies Market Size Estimation and Forecast by Application
13.10 Brazil Grid-Scale Battery Storage Technologies Market Analysis
13.11 Mexico Grid-Scale Battery Storage Technologies Market Analysis
13.12 Rest of Latin America Grid-Scale Battery Storage Technologies Market Analysis
14 Company Profiles
14.1 Competitive Landscape, 2022
14.2 Strategic Outlook
14.3 Tesla Energy Operations, Inc.
14.3.1 Company Snapshot
14.3.2 Company Overview
14.3.3 Financial Analysis
14.3.3.1 Net Revenue, 2018-2022
14.3.3.2 R&D, 2018-2022
14.3.3.3 Regional Revenue Share, 2022 (%)
14.3.3.4 Business Segment Revenue Share, 2022 (%)
14.3.4 Product Benchmarking
14.3.5 Strategic Outlook
14.4 LG Chem
14.4.1 Company Snapshot
14.4.2 Company Overview
14.4.3 Financial Analysis
14.4.3.1 Net Revenue, 2018-2022
14.4.3.2 R&D, 2018-2022
14.4.3.3 Regional Revenue Share, 2022 (%)
14.4.3.4 Business Segment Revenue Share, 2022 (%)
14.4.4 Product Benchmarking
14.4.5 Strategic Outlook
14.5 BYD Co. Ltd
14.5.1 Company Snapshot
14.5.2 Company Overview
14.5.3 Financial Analysis
14.5.3.1 Net Revenue, 2018-2022
14.5.3.2 R&D, 2018-2022
14.5.3.3 Regional Revenue Share, 2022 (%)
14.5.3.4 Business Segment Revenue Share, 2022 (%)
14.5.4 Product Benchmarking
14.5.5 Strategic Outlook
14.6 Samsung SDI Co., Ltd
14.6.1 Company Snapshot
14.6.2 Company Overview
14.6.3 Financial Analysis
14.6.3.1 Net Revenue, 2018-2022
14.6.3.2 R&D, 2018-2022
14.6.3.3 Regional Revenue Share, 2022 (%)
14.6.3.4 Business Segment Revenue Share, 2022 (%)
14.6.4 Product Benchmarking
14.7 ABB Ltd
14.7.1 Company Snapshot
14.7.2 Company Overview
14.7.3 Financial Analysis
14.7.3.1 Net Revenue, 2018-2022
14.7.3.2 R&D, 2018-2022
14.7.3.3 Regional Revenue Share, 2022 (%)
14.7.3.4 Business Segment Revenue Share, 2022 (%)
14.7.4 Product Benchmarking
14.7.5 Strategic Outlook
14.8 Fluence Energy
14.8.1 Company Snapshot
14.8.2 Company Overview
14.8.3 Financial Analysis
14.8.3.1 Net Revenue, 2018-2022
14.8.3.2 R&D, 2018-2022
14.8.3.3 Business Segment Revenue Share, 2022 (%)
14.8.4 Product Benchmarking
14.8.5 Strategic Outlook
14.9 Saft Groupe SAS
14.9.1 Company Snapshot
14.9.2 Company Overview
14.9.3 Financial Analysis
14.9.3.1 Net Revenue, 2018-2022
14.9.3.2 R&D, 2018-2022
14.9.3.3 Regional Revenue Share, 2022 (%)
14.9.3.4 Business Segment Revenue Share, 2022 (%)
14.9.4 Product Benchmarking
14.9.5 Strategic Outlook
14.10 Wärtsilä Corporation
14.10.1 Company Snapshot
14.10.2 Company Overview
14.10.3 Financial Analysis
14.10.3.1 Net Revenue, 2018-2022
14.10.3.2 R&D, 2018-2022
14.10.3.3 Regional Revenue Share, 2022 (%)
14.10.3.4 Business Segment Revenue Share, 2022 (%)
14.10.4 Product Benchmarking
14.10.5 Strategic Outlook
14.11 Enphase Energy, Inc.
14.11.1 Company Snapshot
14.11.2 Company Overview
14.11.3 Financial Analysis
14.11.3.1 Net Revenue, 2018-2022
14.11.3.2 R&D, 2018-2022
14.11.3.3 Regional Revenue Share, 2022 (%)
14.11.4 Product Benchmarking
14.11.5 Strategic Outlook
14.12 The AES Corporation
14.12.1 Company Snapshot
14.12.2 Company Overview
14.12.3 Financial Analysis
14.12.3.1 Net Revenue, 2018-2022
14.12.4 Product Benchmarking
14.12.5 Strategic Outlook
14.13 Sonnen GmbH
14.13.1 Company Snapshot
14.13.2 Company Overview
14.13.3 Product Benchmarking
14.13.4 Strategic Outlook
14.14 NEC Corporation
14.14.1 Company Snapshot
14.14.2 Company Overview
14.14.3 Financial Analysis
14.14.3.1 Net Revenue, 2018-2022
14.14.3.2 R&D, 2018-2022
14.14.3.3 Regional Revenue Share, 2022 (%)
14.14.4 Product Benchmarking
14.14.5 Strategic Outlook
14.15 Primus Power
14.15.1 Company Snapshot
14.15.2 Company Overview
14.15.3 Product Benchmarking
14.16 Kokam Co., Ltd.
14.16.1 Company Snapshot
14.16.2 Company Overview
14.16.3 Product Benchmarking
14.16.4 Strategic Outlook
14.17 Powin Energy
14.17.1 Company Snapshot
14.17.2 Company Overview
14.17.3 Product Benchmarking
14.17.4 Strategic Outlook
15 Conclusion and Recommendations
15.1 Concluding Remarks from Visiongain
15.2 Recommendations for Market Players
ページTOPに戻る
List of Tables/Graphs
List of Tables
Table 1 Grid-Scale Battery Storage Technologies Market Snapshot, 2023 & 2033 (US$ Million, CAGR %)
Table 2 Global Grid-Scale Battery Storage Technologies Market by Region, 2023-2033 (US$ Mn, AGR (%), CAGR (%)) (V-Shaped Recovery Scenario)
Table 3 Global Grid-Scale Battery Storage Technologies Market by Region, 2023-2033 (US$ Mn, AGR (%), CAGR (%)) (U-Shaped Recovery Scenario)
Table 4 Global Grid-Scale Battery Storage Technologies Market by Region, 2023-2033 (US$ Mn, AGR (%), CAGR (%)) (W-Shaped Recovery Scenario)
Table 5 Global Grid-Scale Battery Storage Technologies Market by Region, 2023-2033 (US$ Mn, AGR (%), CAGR (%)) (L-Shaped Recovery Scenario)
Table 6 Global Grid-Scale Battery Storage Technologies Market by Installation, 2023-2033 (US$ Mn, AGR (%), CAGR (%))
Table 7 Standalone Battery Storage Market by Region, 2023-2033 (US$ Mn, AGR (%), CAGR (%))
Table 8 Hybrid Energy Storage Systems Market by Region, 2023-2033 (US$ Mn, AGR (%), CAGR (%))
Table 9 Global Grid-Scale Battery Storage Technologies Market by End-User, 2023-2033 (US$ Mn, AGR (%), CAGR (%))
Table 10 Utility & Residential Sector Market by Region, 2023-2033 (US$ Mn, AGR (%), CAGR (%))
Table 11 Independent Power Producers (IPPs) Market by Region, 2023-2033 (US$ Mn, AGR (%), CAGR (%))
Table 12 Commercial & Industrial (C&I) Sector Market by Region, 2023-2033 (US$ Mn, AGR (%), CAGR (%))
Table 13 Global Grid-Scale Battery Storage Technologies Market by Type, 2023-2033 (US$ Mn, AGR (%), CAGR (%))
Table 14 Lithium-ion Batteries Market by Region, 2023-2033 (US$ Mn, AGR (%), CAGR (%))
Table 15 Lead–acid Batteries Market by Region, 2023-2033 (US$ Mn, AGR (%), CAGR (%))
Table 16 Redox Flow Batteries (RFBs) Market by Region, 2023-2033 (US$ Mn, AGR (%), CAGR (%))
Table 17 Sodium-Based Batteries Market by Region, 2023-2033 (US$ Mn, AGR (%), CAGR (%))
Table 18 Other Battery Types Market by Region, 2023-2033 (US$ Mn, AGR (%), CAGR (%))
Table 19 Global Grid-Scale Battery Storage Technologies Market by Application, 2023-2033 (US$ Mn, AGR (%), CAGR (%))
Table 20 Load Shifting Market by Region, 2023-2033 (US$ Mn, AGR (%), CAGR (%))
Table 21 Renewable Integration Market by Region, 2023-2033 (US$ Mn, AGR (%), CAGR (%))
Table 22 Frequency Regulation Market by Region, 2023-2033 (US$ Mn, AGR (%), CAGR (%))
Table 23 Grid Stabilization Market by Region, 2023-2033 (US$ Mn, AGR (%), CAGR (%))
Table 24 Peak Shaving Market by Region, 2023-2033 (US$ Mn, AGR (%), CAGR (%))
Table 25 Other Application Market by Region, 2023-2033 (US$ Mn, AGR (%), CAGR (%))
Table 26 Grid-Scale Battery Storage Technologies Market Forecast by Region, 2023-2033 (US$ Million, AGR%, CAGR%)
Table 27 North America Grid-Scale Battery Storage Technologies Market by Value, 2023-2033 (US$ Mn, AGR (%), CAGR (%))
Table 28 North America Grid-Scale Battery Storage Technologies Market by Cumulative Installed Capacity, 2023-2033 (MW, AGR (%), CAGR (%))
Table 29 North America Grid-Scale Battery Storage Technologies Market by Country, 2023-2033 (US$ Mn, AGR (%), CAGR (%))
Table 30 North America Grid-Scale Battery Storage Technologies Market Cumulative Installed Capacity by Country, 2023-2033 (MW, AGR (%), CAGR (%))
Table 31 North America Grid-Scale Battery Storage Technologies Market by Installation, 2023-2033 (US$ Mn, AGR (%), CAGR (%))
Table 32 North America Grid-Scale Battery Storage Technologies Market by End-User, 2023-2033 (US$ Mn, AGR (%), CAGR (%))
Table 33 North America Grid-Scale Battery Storage Technologies Market by Type, 2023-2033 (US$ Mn, AGR (%), CAGR (%))
Table 34 North America Grid-Scale Battery Storage Technologies Market by Application, 2023-2033 (US$ Mn, AGR (%), CAGR (%))
Table 35 US Grid-Scale Battery Storage Technologies Market by Value, 2023-2033 (US$ Mn, AGR (%), CAGR (%))
Table 36 US Grid-Scale Battery Storage Technologies Market by Volume, 2023-2033 (MW, AGR (%), CAGR (%))
Table 37 Canada Grid-Scale Battery Storage Technologies Market by Value, 2023-2033 (US$ Mn, AGR (%), CAGR (%))
Table 38 Canada Grid-Scale Battery Storage Technologies Market by Volume, 2023-2033 (MW, AGR (%), CAGR (%))
Table 39 Europe Grid-Scale Battery Storage Technologies Market by Value, 2023-2033 (US$ Mn, AGR (%), CAGR (%))
Table 40 Europe Grid-Scale Battery Storage Technologies Market by Cumulative Installed Capacity, 2023-2033 (MW, AGR (%), CAGR (%))
Table 41 Europe Grid-Scale Battery Storage Technologies Market by Country, 2023-2033 (US$ Mn, AGR (%), CAGR (%))
Table 42 Europe Grid-Scale Battery Storage Technologies Market Cumulative Installed Capacity by Country, 2023-2033 (MW, AGR (%), CAGR (%))
Table 43 Europe Grid-Scale Battery Storage Technologies Market by Installation, 2023-2033 (US$ Mn, AGR (%), CAGR (%))
Table 44 Europe Grid-Scale Battery Storage Technologies Market by End-User, 2023-2033 (US$ Mn, AGR (%), CAGR (%))
Table 45 Europe Grid-Scale Battery Storage Technologies Market by Type, 2023-2033 (US$ Mn, AGR (%), CAGR (%))
Table 46 Europe Grid-Scale Battery Storage Technologies Market by Application, 2023-2033 (US$ Mn, AGR (%), CAGR (%))
Table 47 Germany Grid-Scale Battery Storage Technologies Market by Value, 2023-2033 (US$ Mn, AGR (%), CAGR (%))
Table 48 Germany Grid-Scale Battery Storage Technologies Market by Volume, 2023-2033 (MW, AGR (%), CAGR (%))
Table 49 UK Grid-Scale Battery Storage Technologies Market by Value, 2023-2033 (US$ Mn, AGR (%), CAGR (%))
Table 50 UK Grid-Scale Battery Storage Technologies Market by Volume, 2023-2033 (MW, AGR (%), CAGR (%))
Table 51 France Grid-Scale Battery Storage Technologies Market by Value, 2023-2033 (US$ Mn, AGR (%), CAGR (%))
Table 52 France Grid-Scale Battery Storage Technologies Market by Volume, 2023-2033 (MW, AGR (%), CAGR (%))
Table 53 Italy Grid-Scale Battery Storage Technologies Market by Value, 2023-2033 (US$ Mn, AGR (%), CAGR (%))
Table 54 Italy Grid-Scale Battery Storage Technologies Market by Volume, 2023-2033 (MW, AGR (%), CAGR (%))
Table 55 Spain Grid-Scale Battery Storage Technologies Market by Value, 2023-2033 (US$ Mn, AGR (%), CAGR (%))
Table 56 Spain Grid-Scale Battery Storage Technologies Market by Volume, 2023-2033 (MW, AGR (%), CAGR (%))
Table 57 Rest of Europe Grid-Scale Battery Storage Technologies Market by Value, 2023-2033 (US$ Mn, AGR (%), CAGR (%))
Table 58 Rest of Europe Grid-Scale Battery Storage Technologies Market by Volume, 2023-2033 (MW, AGR (%), CAGR (%))
Table 59 Asia-Pacific Grid-Scale Battery Storage Technologies Market by Value, 2023-2033 (US$ Mn, AGR (%), CAGR (%))
Table 60 Asia-Pacific Grid-Scale Battery Storage Technologies Market by Cumulative Installed Capacity, 2023-2033 (MW, AGR (%), CAGR (%))
Table 61 Asia-Pacific Grid-Scale Battery Storage Technologies Market by Country, 2023-2033 (US$ Mn, AGR (%), CAGR (%))
Table 62 Asia-Pacific Grid-Scale Battery Storage Technologies Market Cumulative Installed Capacity by Country, 2023-2033 (MW, AGR (%), CAGR (%))
Table 63 Asia-Pacific Grid-Scale Battery Storage Technologies Market by Installation, 2023-2033 (US$ Mn, AGR (%), CAGR (%))
Table 64 Asia-Pacific Grid-Scale Battery Storage Technologies Market by End-User, 2023-2033 (US$ Mn, AGR (%), CAGR (%))
Table 65 Asia-Pacific Grid-Scale Battery Storage Technologies Market by Type, 2023-2033 (US$ Mn, AGR (%), CAGR (%))
Table 66 Asia-Pacific Grid-Scale Battery Storage Technologies Market by Application, 2023-2033 (US$ Mn, AGR (%), CAGR (%))
Table 67 China Grid-Scale Battery Storage Technologies Market by Value, 2023-2033 (US$ Mn, AGR (%), CAGR (%))
Table 68 China Grid-Scale Battery Storage Technologies Market by Volume, 2023-2033 (MW, AGR (%), CAGR (%))
Table 69 India Grid-Scale Battery Storage Technologies Market by Value, 2023-2033 (US$ Mn, AGR (%), CAGR (%))
Table 70 India Grid-Scale Battery Storage Technologies Market by Volume, 2023-2033 (MW, AGR (%), CAGR (%))
Table 71 Japan Grid-Scale Battery Storage Technologies Market by Value, 2023-2033 (US$ Mn, AGR (%), CAGR (%))
Table 72 Japan Grid-Scale Battery Storage Technologies Market by Volume, 2023-2033 (MW, AGR (%), CAGR (%))
Table 73 South Korea Grid-Scale Battery Storage Technologies Market by Value, 2023-2033 (US$ Mn, AGR (%), CAGR (%))
Table 74 South Korea Grid-Scale Battery Storage Technologies Market by Volume, 2023-2033 (MW, AGR (%), CAGR (%))
Table 75 Australia Grid-Scale Battery Storage Technologies Market by Value, 2023-2033 (US$ Mn, AGR (%), CAGR (%))
Table 76 Australia Grid-Scale Battery Storage Technologies Market by Volume, 2023-2033 (MW, AGR (%), CAGR (%))
Table 77 Rest of Asia-Pacific Grid-Scale Battery Storage Technologies Market by Value, 2023-2033 (US$ Mn, AGR (%), CAGR (%))
Table 78 Rest of Asia-Pacific Grid-Scale Battery Storage Technologies Market by Volume, 2023-2033 (MW, AGR (%), CAGR (%))
Table 79 Middle East & Africa Grid-Scale Battery Storage Technologies Market by Value, 2023-2033 (US$ Mn, AGR (%), CAGR (%))
Table 80 Middle East & Africa Grid-Scale Battery Storage Technologies Market by Cumulative Installed Capacity, 2023-2033 (MW, AGR (%), CAGR (%))
Table 81 Middle East & Africa Grid-Scale Battery Storage Technologies Market by Country, 2023-2033 (US$ Mn, AGR (%), CAGR (%))
Table 82 Middle East & Africa Grid-Scale Battery Storage Technologies Market Cumulative Installed Capacity by Country, 2023-2033 (MW, AGR (%), CAGR (%))
Table 83 Middle East & Africa Grid-Scale Battery Storage Technologies Market by Installation, 2023-2033 (US$ Mn, AGR (%), CAGR (%))
Table 84 Middle East & Africa Grid-Scale Battery Storage Technologies Market by End-User, 2023-2033 (US$ Mn, AGR (%), CAGR (%))
Table 85 Middle East & Africa Grid-Scale Battery Storage Technologies Market by Type, 2023-2033 (US$ Mn, AGR (%), CAGR (%))
Table 86 Middle East & Africa Grid-Scale Battery Storage Technologies Market by Application, 2023-2033 (US$ Mn, AGR (%), CAGR (%))
Table 87 GCC Grid-Scale Battery Storage Technologies Market by Value, 2023-2033 (US$ Mn, AGR (%), CAGR (%))
Table 88 GCC Grid-Scale Battery Storage Technologies Market by Volume, 2023-2033 (MW, AGR (%), CAGR (%))
Table 89 South Africa Grid-Scale Battery Storage Technologies Market by Value, 2023-2033 (US$ Mn, AGR (%), CAGR (%))
Table 90 South Africa Grid-Scale Battery Storage Technologies Market by Volume, 2023-2033 (MW, AGR (%), CAGR (%))
Table 91 Rest of Middle East & Africa Grid-Scale Battery Storage Technologies Market by Value, 2023-2033 (US$ Mn, AGR (%), CAGR (%))
Table 92 Rest of Middle East & Africa Grid-Scale Battery Storage Technologies Market by Volume, 2023-2033 (MW, AGR (%), CAGR (%))
Table 93 Latin America Grid-Scale Battery Storage Technologies Market by Value, 2023-2033 (US$ Mn, AGR (%), CAGR (%))
Table 94 Latin America Grid-Scale Battery Storage Technologies Market by Cumulative Installed Capacity, 2023-2033 (MW, AGR (%), CAGR (%))
Table 95 Latin America Grid-Scale Battery Storage Technologies Market by Country, 2023-2033 (US$ Mn, AGR (%), CAGR (%))
Table 96 Latin America Grid-Scale Battery Storage Technologies Market Cumulative Installed Capacity by Country, 2023-2033 (MW, AGR (%), CAGR (%))
Table 97 Latin America Grid-Scale Battery Storage Technologies Market by Installation, 2023-2033 (US$ Mn, AGR (%), CAGR (%))
Table 98 Latin America Grid-Scale Battery Storage Technologies Market by End-User, 2023-2033 (US$ Mn, AGR (%), CAGR (%))
Table 99 Latin America Grid-Scale Battery Storage Technologies Market by Type, 2023-2033 (US$ Mn, AGR (%), CAGR (%))
Table 100 Latin America Grid-Scale Battery Storage Technologies Market by Application, 2023-2033 (US$ Mn, AGR (%), CAGR (%))
Table 101 Brazil Grid-Scale Battery Storage Technologies Market by Value, 2023-2033 (US$ Mn, AGR (%), CAGR (%))
Table 102 Brazil Grid-Scale Battery Storage Technologies Market by Volume, 2023-2033 (MW, AGR (%), CAGR (%))
Table 103 Mexico Grid-Scale Battery Storage Technologies Market by Value, 2023-2033 (US$ Mn, AGR (%), CAGR (%))
Table 104 Mexico Grid-Scale Battery Storage Technologies Market by Volume, 2023-2033 (MW, AGR (%), CAGR (%))
Table 105 Rest of Latin America Grid-Scale Battery Storage Technologies Market by Value, 2023-2033 (US$ Mn, AGR (%), CAGR (%))
Table 106 Rest of Latin America Grid-Scale Battery Storage Technologies Market by Volume, 2023-2033 (MW, AGR (%), CAGR (%))
Table 107 Strategic Outlook - Contract
Table 108 Tesla Energy Operations, Inc: Key Details, (CEO, HQ, Revenue, Founded, No. of Employees, Company Type, Website, Business Segment)
Table 109 Tesla Energy Operations, Inc: Product Benchmarking
Table 110 Tesla Energy Operations, Inc: Strategic Outlook
Table 111 LG Chem: Key Details, (CEO, HQ, Revenue, Founded, No. of Employees, Company Type, Website, Business Segment)
Table 112 LG Chem: Product Benchmarking
Table 113 LG Chem: Strategic Outlook
Table 114 BYD Co. Ltd: Key Details, (CEO, HQ, Revenue, Founded, No. of Employees, Company Type, Website, Business Segment)
Table 115 BYD Co. Ltd: Product Benchmarking
Table 116 BYD Co. Ltd: Strategic Outlook
Table 117 Samsung SDI Co., Ltd: Key Details, (CEO, HQ, Revenue, Founded, No. of Employees, Company Type, Website, Business Segment)
Table 118 Samsung SDI Co., Ltd: Product Benchmarking
Table 119 ABB Ltd: Key Details, (CEO, HQ, Revenue, Founded, No. of Employees, Company Type, Website, Business Segment)
Table 120 ABB Ltd: Product Benchmarking
Table 121 ABB Ltd: Strategic Outlook
Table 122 Fluence Energy: Key Details, (CEO, HQ, Revenue, Founded, No. of Employees, Company Type, Website, Business Segment)
Table 123 Fluence Energy: Product Benchmarking
Table 124 Fluence Energy: Strategic Outlook
Table 125 Saft Groupe SAS: Key Details, (CEO, HQ, Revenue, Founded, No. of Employees, Company Type, Website, Business Segment)
Table 126 Saft Groupe SAS: Product Benchmarking
Table 127 Saft Groupe SAS: Strategic Outlook
Table 128 Wärtsilä Corporation: Key Details, (CEO, HQ, Revenue, Founded, No. of Employees, Company Type, Website, Business Segment)
Table 129 Wärtsilä Corporation: Product Benchmarking
Table 130 Wärtsilä Corporation: Strategic Outlook
Table 131 Enphase Energy, Inc.: Key Details, (CEO, HQ, Revenue, Founded, No. of Employees, Company Type, Website, Business Segment)
Table 132 Enphase Energy, Inc: Product Benchmarking
Table 133 Enphase Energy, Inc: Strategic Outlook
Table 134 The AES Corporation: Key Details, (CEO, HQ, Revenue, Founded, No. of Employees, Company Type, Website, Business Segment)
Table 135 The AES Corporation: Product Benchmarking
Table 136 The AES Corporation: Strategic Outlook
Table 137 sonnen GmbH: Key Details, (CEO, HQ, Revenue, Founded, No. of Employees, Company Type, Website, Business Segment)
Table 138 sonnen GmbH: Product Benchmarking
Table 139 sonnen GmbH: Strategic Outlook
Table 140 NEC Corporation: Key Details, (CEO, HQ, Revenue, Founded, No. of Employees, Company Type, Website, Business Segment)
Table 141 NEC Corporation: Product Benchmarking
Table 142 NEC Corporation: Strategic Outlook
Table 143 Primus Power: Key Details, (CEO, HQ, Revenue, Founded, No. of Employees, Company Type, Website, Business Segment)
Table 144 Primus Power: Product Benchmarking
Table 145 Kokam: Key Details, (CEO, HQ, Revenue, Founded, No. of Employees, Company Type, Website, Business Segment)
Table 146 Kokam: Product Benchmarking
Table 147 Kokam: Strategic Outlook
Table 148 Powin Energy: Key Details, (CEO, HQ, Revenue, Founded, No. of Employees, Company Type, Website, Business Segment)
Table 149 Powin Energy: Product Benchmarking
Table 150 Powin Energy: Strategic Outlook
List of Figures
Figure 1 Grid-Scale Battery Storage Technologies Market Segmentation
Figure 2 Grid-Scale Battery Storage Technologies Market by Installation: Market Attractiveness Index
Figure 3 Grid-Scale Battery Storage Technologies Market by End-User: Market Attractiveness Index
Figure 4 Grid-Scale Battery Storage Technologies Market by Type: Market Attractiveness Index
Figure 5 Grid-Scale Battery Storage Technologies Market by Application: Market Attractiveness Index
Figure 6 Grid-Scale Battery Storage Technologies Market Attractiveness Index by Region
Figure 7 Grid-Scale Battery Storage Technologies Market: Market Dynamics
Figure 8 Grid-Scale Battery Storage Technologies Market: Porter’s Five Forces Analysis
Figure 9 Global Grid-Scale Battery Storage Technologies Market Share Forecast by COVID, 2023-2033 (%)
Figure 10 Global Grid-Scale Battery Storage Technologies Market by Region, 2023-2033 (US$ Mn, AGR (%)) (V-Shaped Recovery Scenario)
Figure 11 Global Grid-Scale Battery Storage Technologies Market by Region, 2023-2033 (US$ Mn, AGR (%)) (U-Shaped Recovery Scenario)
Figure 12 Global Grid-Scale Battery Storage Technologies Market by Region, 2023-2033 (US$ Mn, AGR (%)) (W-Shaped Recovery Scenario)
Figure 13 Global Grid-Scale Battery Storage Technologies Market by Region, 2023-2033 (US$ Mn, AGR (%)) (L-Shaped Recovery Scenario)
Figure 14 Grid-Scale Battery Storage Technologies Market: PEST Analysis
Figure 15 Grid-Scale Battery Storage Technologies Market by Installation: Market Attractiveness Index
Figure 16 Global Grid-Scale Battery Storage Technologies Market by Installation, 2023-2033 (US$ Mn, AGR (%))
Figure 17 Grid-Scale Battery Storage Technologies Market Share Forecast by Installation, 2023, 2028, 2033 (%)
Figure 18 Standalone Battery Storage Market by Region, 2023-2033 (US$ Mn, AGR (%))
Figure 19 Standalone Battery Storage Market Share Forecast by Region, 2023 & 2033 (%)
Figure 20 Hybrid Energy Storage Systems Market by Region, 2023-2033 (US$ Mn, AGR (%))
Figure 21 Hybrid Energy Storage Systems Market Share Forecast by Region, 2023 & 2033 (%)
Figure 22 Grid-Scale Battery Storage Technologies Market by End-User: Market Attractiveness Index
Figure 23 Global Grid-Scale Battery Storage Technologies Market by End-User, 2023-2033 (US$ Mn, AGR (%))
Figure 24 Grid-Scale Battery Storage Technologies Market Share Forecast by End-User, 2023, 2028, 2033 (%)
Figure 25 Utility & Residential Sector Market by Region, 2023-2033 (US$ Mn, AGR (%))
Figure 26 Utility & Residential Sector Market Share Forecast by Region, 2023 & 2033 (%)
Figure 27 Independent Power Producers (IPPs) Market by Region, 2023-2033 (US$ Mn, AGR (%))
Figure 28 Independent Power Producers (IPPs) Market Share Forecast by Region, 2023 & 2033 (%)
Figure 29 Commercial & Industrial (C&I) Sector Market by Region, 2023-2033 (US$ Mn, AGR (%))
Figure 30 Commercial & Industrial (C&I) Sector Market Share Forecast by Region, 2023 & 2033 (%)
Figure 31 Grid-Scale Battery Storage Technologies Market by Type: Market Attractiveness Index
Figure 32 Global Grid-Scale Battery Storage Technologies Market by Type, 2023-2033 (US$ Mn, AGR (%))
Figure 33 Grid-Scale Battery Storage Technologies Market Share Forecast by Type, 2023, 2028, 2033 (%)
Figure 34 Lithium-ion Batteries Market by Region, 2023-2033 (US$ Mn, AGR (%))
Figure 35 Lithium-ion Batteries Market Share Forecast by Region, 2023 & 2033 (%)
Figure 36 Lead–acid Batteries Market by Region, 2023-2033 (US$ Mn, AGR (%))
Figure 37 Lead–acid Batteries Market Share Forecast by Region, 2023 & 2033 (%)
Figure 38 Redox Flow Batteries (RFBs) Market by Region, 2023-2033 (US$ Mn, AGR (%))
Figure 39 Redox Flow Batteries (RFBs) Market Share Forecast by Region, 2023 & 2033 (%)
Figure 40 Sodium-Based Batteries Market by Region, 2023-2033 (US$ Mn, AGR (%))
Figure 41 Sodium-Based Batteries Market Share Forecast by Region, 2023 & 2033 (%)
Figure 42 Other Battery Types Market by Region, 2023-2033 (US$ Mn, AGR (%))
Figure 43 Other Installation Market Share Forecast by Region, 2023 & 2033 (%)
Figure 44 Grid-Scale Battery Storage Technologies Market by Application: Market Attractiveness Index
Figure 45 Global Grid-Scale Battery Storage Technologies Market by Application, 2023-2033 (US$ Mn, AGR (%))
Figure 46 Grid-Scale Battery Storage Technologies Market Share Forecast by Application, 2023, 2028, 2033 (%)
Figure 47 Load Shifting Market by Region, 2023-2033 (US$ Mn, AGR (%))
Figure 48 Load Shifting Market Share Forecast by Region, 2023 & 2033 (%)
Figure 49 Renewable Integration Market by Region, 2023-2033 (US$ Mn, AGR (%))
Figure 50 Renewable Integration Market Share Forecast by Region, 2023 & 2033 (%)
Figure 51 Frequency Regulation Market by Region, 2023-2033 (US$ Mn, AGR (%))
Figure 52 Frequency Regulation Market Share Forecast by Region, 2023 & 2033 (%)
Figure 53 Grid Stabilization Market by Region, 2023-2033 (US$ Mn, AGR (%))
Figure 54 Grid Stabilization Market Share Forecast by Region, 2023 & 2033 (%)
Figure 55 Peak Shaving Market by Region, 2023-2033 (US$ Mn, AGR (%))
Figure 56 Peak Shaving Market Share Forecast by Region, 2023 & 2033 (%)
Figure 57 Other Application Market by Region, 2023-2033 (US$ Mn, AGR (%))
Figure 58 Others (Ancillary Services, Microgrids) Market Share Forecast by Region, 2023 & 2033 (%)
Figure 59 Grid-Scale Battery Storage Technologies Market Forecast by Region 2023 and 2033 (Revenue, CAGR%)
Figure 60 Grid-Scale Battery Storage Technologies Market Share Forecast by Region 2023, 2028, 2033 (%)
Figure 61 Grid-Scale Battery Storage Technologies Market by Region, 2023-2033 (US$ Million, AGR %)
Figure 62 North America Grid-Scale Battery Storage Technologies Market Attractiveness Index
Figure 63 North America Grid-Scale Battery Storage Technologies Market by Region, 2023, 2028 & 2033 (US$ Million)
Figure 64 North America Grid-Scale Battery Storage Technologies Market by Value, 2023-2033 (US$ Mn, AGR (%))
Figure 65 North America Grid-Scale Battery Storage Technologies Market by Cumulative Installed Capacity, 2023-2033 (MW, AGR (%))
Figure 66 North America Grid-Scale Battery Storage Technologies Market by Country, 2023-2033 (US$ Mn, AGR (%))
Figure 67 North America Grid-Scale Battery Storage Technologies Market Cumulative Installed Capacity by Country, 2023-2033 (MW, AGR (%))
Figure 68 North America Grid-Scale Battery Storage Technologies Market Share Forecast by Country, 2023 & 2033 (%)
Figure 69 North America Grid-Scale Battery Storage Technologies Market by Installation, 2023-2033 (US$ Mn, AGR (%))
Figure 70 North America Grid-Scale Battery Storage Technologies Market Share Forecast Installation, 2023 & 2033 (%)
Figure 71 North America Grid-Scale Battery Storage Technologies Market by End-User, 2023-2033 (US$ Mn, AGR (%))
Figure 72 North America Grid-Scale Battery Storage Technologies Market Share Forecast by End-User, 2023 & 2033 (%)
Figure 73 North America Grid-Scale Battery Storage Technologies Market by Type, 2023-2033 (US$ Mn, AGR (%))
Figure 74 North America Grid-Scale Battery Storage Technologies Market Share Forecast by Type, 2023 & 2033 (%)
Figure 75 North America Grid-Scale Battery Storage Technologies Market by Application, 2023-2033 (US$ Mn, AGR (%))
Figure 76 North America Grid-Scale Battery Storage Technologies Market Share Forecast by Application, 2023 & 2033 (%)
Figure 77 US Grid-Scale Battery Storage Technologies Market by Value, 2023-2033 (US$ Mn, AGR (%))
Figure 78 US Grid-Scale Battery Storage Technologies Market by Volume, 2023-2033 (MW, AGR (%))
Figure 79 Canada Grid-Scale Battery Storage Technologies Market by Value, 2023-2033 (US$ Mn, AGR (%))
Figure 80 Canada Grid-Scale Battery Storage Technologies Market by Volume, 2023-2033 (MW, AGR (%))
Figure 81 Europe Grid-Scale Battery Storage Technologies Market Attractiveness Index
Figure 82 Europe Grid-Scale Battery Storage Technologies Market by Region, 2023, 2028 & 2033 (US$ Million)
Figure 83 Europe Grid-Scale Battery Storage Technologies Market by Value, 2023-2033 (US$ Mn, AGR (%))
Figure 84 Europe Grid-Scale Battery Storage Technologies Market by Cumulative Installed Capacity, 2023-2033 (MW, AGR (%))
Figure 85 Europe Grid-Scale Battery Storage Technologies Market by Country, 2023-2033 (US$ Mn, AGR (%))
Figure 86 Europe Grid-Scale Battery Storage Technologies Market Cumulative Installed Capacity by Country, 2023-2033 (MW, AGR (%))
Figure 87 Europe Grid-Scale Battery Storage Technologies Market Share Forecast by Country, 2023 & 2033 (%)
Figure 88 Europe Grid-Scale Battery Storage Technologies Market by Installation, 2023-2033 (US$ Mn, AGR (%))
Figure 89 Europe Grid-Scale Battery Storage Technologies Market Share Forecast Installation, 2023 & 2033 (%)
Figure 90 Europe Grid-Scale Battery Storage Technologies Market by End-User, 2023-2033 (US$ Mn, AGR (%))
Figure 91 Europe Grid-Scale Battery Storage Technologies Market Share Forecast by End-User, 2023 & 2033 (%)
Figure 92 Europe Grid-Scale Battery Storage Technologies Market by Type, 2023-2033 (US$ Mn, AGR (%))
Figure 93 Europe Grid-Scale Battery Storage Technologies Market Share Forecast by Type, 2023 & 2033 (%)
Figure 94 Europe Grid-Scale Battery Storage Technologies Market by Application, 2023-2033 (US$ Mn, AGR (%))
Figure 95 Europe Grid-Scale Battery Storage Technologies Market Share Forecast by Application, 2023 & 2033 (%)
Figure 96 Germany Grid-Scale Battery Storage Technologies Market by Value, 2023-2033 (US$ Mn, AGR (%))
Figure 97 Germany Grid-Scale Battery Storage Technologies Market by Volume, 2023-2033 (MW, AGR (%))
Figure 98 UK Grid-Scale Battery Storage Technologies Market by Value, 2023-2033 (US$ Mn, AGR (%))
Figure 99 UK Grid-Scale Battery Storage Technologies Market by Volume, 2023-2033 (MW, AGR (%))
Figure 100 France Grid-Scale Battery Storage Technologies Market by Value, 2023-2033 (US$ Mn, AGR (%))
Figure 101 France Grid-Scale Battery Storage Technologies Market by Volume, 2023-2033 (MW, AGR (%))
Figure 102 Italy Grid-Scale Battery Storage Technologies Market by Value, 2023-2033 (US$ Mn, AGR (%))
Figure 103 Italy Grid-Scale Battery Storage Technologies Market by Volume, 2023-2033 (MW, AGR (%))
Figure 104 Spain Grid-Scale Battery Storage Technologies Market by Value, 2023-2033 (US$ Mn, AGR (%))
Figure 105 Spain Grid-Scale Battery Storage Technologies Market by Volume, 2023-2033 (MW, AGR (%))
Figure 106 Rest of Europe Grid-Scale Battery Storage Technologies Market by Value, 2023-2033 (US$ Mn, AGR (%))
Figure 107 Rest of Europe Grid-Scale Battery Storage Technologies Market by Volume, 2023-2033 (MW, AGR (%))
Figure 108 Asia-Pacific Grid-Scale Battery Storage Technologies Market Attractiveness Index
Figure 109 Asia-Pacific Grid-Scale Battery Storage Technologies Market by Region, 2023, 2028 & 2033 (US$ Million)
Figure 110 Asia-Pacific Grid-Scale Battery Storage Technologies Market by Value, 2023-2033 (US$ Mn, AGR (%))
Figure 111 Asia-Pacific Grid-Scale Battery Storage Technologies Market by Cumulative Installed Capacity, 2023-2033 (MW, AGR (%))
Figure 112 Asia-Pacific Grid-Scale Battery Storage Technologies Market by Country, 2023-2033 (US$ Mn, AGR (%))
Figure 113 Asia-Pacific Grid-Scale Battery Storage Technologies Market Cumulative Installed Capacity by Country, 2023-2033 (MW, AGR (%))
Figure 114 Asia-Pacific Grid-Scale Battery Storage Technologies Market Share Forecast by Country, 2023 & 2033 (%)
Figure 115 Asia-Pacific Grid-Scale Battery Storage Technologies Market by Installation, 2023-2033 (US$ Mn, AGR (%))
Figure 116 Asia-Pacific Grid-Scale Battery Storage Technologies Market Share Forecast Installation, 2023 & 2033 (%)
Figure 117 Asia-Pacific Grid-Scale Battery Storage Technologies Market by End-User, 2023-2033 (US$ Mn, AGR (%))
Figure 118 Asia-Pacific Grid-Scale Battery Storage Technologies Market Share Forecast by End-User, 2023 & 2033 (%)
Figure 119 Asia-Pacific Grid-Scale Battery Storage Technologies Market by Type, 2023-2033 (US$ Mn, AGR (%))
Figure 120 Asia-Pacific Grid-Scale Battery Storage Technologies Market Share Forecast by Type, 2023 & 2033 (%)
Figure 121 Asia-Pacific Grid-Scale Battery Storage Technologies Market by Application, 2023-2033 (US$ Mn, AGR (%))
Figure 122 Asia-Pacific Grid-Scale Battery Storage Technologies Market Share Forecast by Application, 2023 & 2033 (%)
Figure 123 China Grid-Scale Battery Storage Technologies Market by Value, 2023-2033 (US$ Mn, AGR (%))
Figure 124 China Grid-Scale Battery Storage Technologies Market by Volume, 2023-2033 (MW, AGR (%))
Figure 125 India Grid-Scale Battery Storage Technologies Market by Value, 2023-2033 (US$ Mn, AGR (%))
Figure 126 India Grid-Scale Battery Storage Technologies Market by Volume, 2023-2033 (MW, AGR (%))
Figure 127 Japan Grid-Scale Battery Storage Technologies Market by Value, 2023-2033 (US$ Mn, AGR (%))
Figure 128 Japan Grid-Scale Battery Storage Technologies Market by Volume, 2023-2033 (MW, AGR (%))
Figure 129 South Korea Grid-Scale Battery Storage Technologies Market by Value, 2023-2033 (US$ Mn, AGR (%))
Figure 130 South Korea Grid-Scale Battery Storage Technologies Market by Volume, 2023-2033 (MW, AGR (%))
Figure 131 Australia Grid-Scale Battery Storage Technologies Market by Value, 2023-2033 (US$ Mn, AGR (%))
Figure 132 Australia Grid-Scale Battery Storage Technologies Market by Volume, 2023-2033 (MW, AGR (%))
Figure 133 Rest of Asia-Pacific Grid-Scale Battery Storage Technologies Market by Value, 2023-2033 (US$ Mn, AGR (%))
Figure 134 Rest of Asia-Pacific Grid-Scale Battery Storage Technologies Market by Volume, 2023-2033 (MW, AGR (%))
Figure 135 Middle East and Africa Grid-Scale Battery Storage Technologies Market Attractiveness Index
Figure 136 Middle East and Africa Grid-Scale Battery Storage Technologies Market by Region, 2023, 2028 & 2033 (US$ Million)
Figure 137 Middle East & Africa Grid-Scale Battery Storage Technologies Market by Value, 2023-2033 (US$ Mn, AGR (%))
Figure 138 Middle East & Africa Grid-Scale Battery Storage Technologies Market by Cumulative Installed Capacity, 2023-2033 (MW, AGR (%))
Figure 139 Middle East & Africa Grid-Scale Battery Storage Technologies Market by Country, 2023-2033 (US$ Mn, AGR (%))
Figure 140 Middle East & Africa Grid-Scale Battery Storage Technologies Market Cumulative Installed Capacity by Country, 2023-2033 (MW, AGR (%))
Figure 141 Middle East and Africa Grid-Scale Battery Storage Technologies Market Share Forecast by Country, 2023 & 2033 (%)
Figure 142 Middle East & Africa Grid-Scale Battery Storage Technologies Market by Installation, 2023-2033 (US$ Mn, AGR (%))
Figure 143 Middle East and Africa Grid-Scale Battery Storage Technologies Market Share Forecast Installation, 2023 & 2033 (%)
Figure 144 Middle East & Africa Grid-Scale Battery Storage Technologies Market by End-User, 2023-2033 (US$ Mn, AGR (%))
Figure 145 Middle East and Africa Grid-Scale Battery Storage Technologies Market Share Forecast by End-User, 2023 & 2033 (%)
Figure 146 Middle East & Africa Grid-Scale Battery Storage Technologies Market by Type, 2023-2033 (US$ Mn, AGR (%))
Figure 147 Middle East and Africa Grid-Scale Battery Storage Technologies Market Share Forecast by Type, 2023 & 2033 (%)
Figure 148 Middle East & Africa Grid-Scale Battery Storage Technologies Market by Application, 2023-2033 (US$ Mn, AGR (%))
Figure 149 Middle East and Africa Grid-Scale Battery Storage Technologies Market Share Forecast by Application, 2023 & 2033 (%)
Figure 150 GCC Grid-Scale Battery Storage Technologies Market by Value, 2023-2033 (US$ Mn, AGR (%))
Figure 151 GCC Grid-Scale Battery Storage Technologies Market by Volume, 2023-2033 (MW, AGR (%))
Figure 152 South Africa Grid-Scale Battery Storage Technologies Market by Value, 2023-2033 (US$ Mn, AGR (%))
Figure 153 South Africa Grid-Scale Battery Storage Technologies Market by Volume, 2023-2033 (MW, AGR (%))
Figure 154 Rest of Middle East & Africa Grid-Scale Battery Storage Technologies Market by Value, 2023-2033 (US$ Mn, AGR (%))
Figure 155 Rest of Middle East & Africa Grid-Scale Battery Storage Technologies Market by Volume, 2023-2033 (MW, AGR (%))
Figure 156 Latin America Grid-Scale Battery Storage Technologies Market Attractiveness Index
Figure 157 Latin America Grid-Scale Battery Storage Technologies Market by Region, 2023, 2028 & 2033 (US$ Million)
Figure 158 Latin America Grid-Scale Battery Storage Technologies Market by Value, 2023-2033 (US$ Mn, AGR (%))
Figure 159 Latin America Grid-Scale Battery Storage Technologies Market by Cumulative Installed Capacity, 2023-2033 (MW, AGR (%))
Figure 160 Latin America Grid-Scale Battery Storage Technologies Market by Country, 2023-2033 (US$ Mn, AGR (%))
Figure 161 Latin America Grid-Scale Battery Storage Technologies Market Cumulative Installed Capacity by Country, 2023-2033 (MW, AGR (%))
Figure 162 Latin America Grid-Scale Battery Storage Technologies Market Share Forecast by Country, 2023 & 2033 (%)
Figure 163 Latin America Grid-Scale Battery Storage Technologies Market by Installation, 2023-2033 (US$ Mn, AGR (%))
Figure 164 Latin America Grid-Scale Battery Storage Technologies Market Share Forecast Installation, 2023 & 2033 (%)
Figure 165 Latin America Grid-Scale Battery Storage Technologies Market by End-User, 2023-2033 (US$ Mn, AGR (%))
Figure 166 Latin America Grid-Scale Battery Storage Technologies Market Share Forecast by End-User, 2023 & 2033 (%)
Figure 167 Latin America Grid-Scale Battery Storage Technologies Market by Type, 2023-2033 (US$ Mn, AGR (%))
Figure 168 Latin America Grid-Scale Battery Storage Technologies Market Share Forecast by Type, 2023 & 2033 (%)
Figure 169 Latin America Grid-Scale Battery Storage Technologies Market by Application, 2023-2033 (US$ Mn, AGR (%))
Figure 170 Latin America Grid-Scale Battery Storage Technologies Market Share Forecast by Application, 2023 & 2033 (%)
Figure 171 Brazil Grid-Scale Battery Storage Technologies Market by Value, 2023-2033 (US$ Mn, AGR (%))
Figure 172 Brazil Grid-Scale Battery Storage Technologies Market by Volume, 2023-2033 (MW, AGR (%))
Figure 173 Mexico Grid-Scale Battery Storage Technologies Market by Value, 2023-2033 (US$ Mn, AGR (%))
Figure 174 Mexico Grid-Scale Battery Storage Technologies Market by Volume, 2023-2033 (MW, AGR (%))
Figure 175 Rest of Latin America Grid-Scale Battery Storage Technologies Market by Value, 2023-2033 (US$ Mn, AGR (%))
Figure 176 Rest of Latin America Grid-Scale Battery Storage Technologies Market by Volume, 2023-2033 (MW, AGR (%))
Figure 177 Grid-Scale Battery Storage Technologies Market: Company Share, 2022
Figure 178 Tesla Energy Operations, Inc.: Net Revenue, 2018-2022 (US$ Million, AGR%)
Figure 179 Tesla Energy Operations, Inc.: R&D, 2018-2022 (US$ Million, AGR%)
Figure 180 Tesla Energy Operations, Inc.: Regional Revenue Share, 2022 (%)
Figure 181 Tesla Energy Operations, Inc.: Business Segment Revenue Share, 2022 (%)
Figure 182 LG Chem.: Net Revenue, 2018-2022 (US$ Million, AGR%)
Figure 183 LG Chem.: R&D, 2018-2022 (US$ Million, AGR%)
Figure 184 LG Chem.: Regional Revenue Share, 2022 (%)
Figure 185 LG Chem.: Business Segment Revenue Share, 2022 (%)
Figure 186 BYD Co. Ltd.: Net Revenue, 2018-2022 (US$ Million, AGR%)
Figure 187 BYD Co. Ltd.: R&D, 2018-2022 (US$ Million, AGR%)
Figure 188 BYD Co. Ltd.: Regional Revenue Share, 2022 (%)
Figure 189 BYD Co. Ltd.: Business Segment Revenue Share, 2022 (%)
Figure 190 Samsung SDI Co., Ltd.: Net Revenue, 2018-2022 (US$ Million, AGR%)
Figure 191 Samsung SDI Co., Ltd.: R&D, 2018-2022 (US$ Million, AGR%)
Figure 192 Samsung SDI Co., Ltd.: Regional Revenue Share, 2022 (%)
Figure 193 Samsung SDI Co., Ltd.: Business Segment Revenue Share, 2022 (%)
Figure 194 ABB Ltd.: Net Revenue, 2018-2022 (US$ Million, AGR%)
Figure 195 ABB Ltd.: R&D, 2018-2022 (US$ Million, AGR%)
Figure 196 ABB Ltd.: Regional Revenue Share, 2022 (%)
Figure 197 ABB Ltd.: Business Segment Revenue Share, 2022 (%)
Figure 198 Fluence Energy.: Net Revenue, 2018-2022 (US$ Million, AGR%)
Figure 199 Fluence Energy.: R&D, 2018-2022 (US$ Million, AGR%)
Figure 200 Fluence Energy.: Business Segment Revenue Share, 2022 (%)
Figure 201 Saft Groupe SAS.: Net Revenue, 2018-2022 (US$ Million, AGR%)
Figure 202 Saft Groupe SAS.: R&D, 2018-2022 (US$ Million, AGR%)
Figure 203 Saft Groupe SAS.: Regional Revenue Share, 2022 (%)
Figure 204 Saft Groupe SAS.: Business Segment Revenue Share, 2022 (%)
Figure 205 Wärtsilä Corporation.: Net Revenue, 2018-2022 (US$ Million, AGR%)
Figure 206 Wärtsilä Corporation.: R&D, 2018-2022 (US$ Million, AGR%)
Figure 207 Wärtsilä Corporation.: Regional Revenue Share, 2022 (%)
Figure 208 Wärtsilä Corporation.: Business Segment Revenue Share, 2022 (%)
Figure 209 Enphase Energy, Inc.: Net Revenue, 2018-2022 (US$ Million, AGR%)
Figure 210 Enphase Energy, Inc.: R&D, 2018-2022 (US$ Million, AGR%)
Figure 211 Enphase Energy, Inc.: Regional Revenue Share, 2022 (%)
Figure 212 The AES Corporation.: Net Revenue, 2018-2022 (US$ Million, AGR%)
Figure 213 NEC Corporation.: Net Revenue, 2018-2022 (US$ Million, AGR%)
Figure 214 NEC Corporation.: R&D, 2018-2022 (US$ Million, AGR%)
Figure 215 NEC Corporation.: Regional Revenue Share, 2022 (%)
ページTOPに戻る
本レポートと同分野(環境・エネルギー)の最新刊レポート
Visiongain社のエネルギーと資源分野での最新刊レポート
本レポートと同じKEY WORD(grid)の最新刊レポート
よくあるご質問
Visiongain社はどのような調査会社ですか?
英国の調査会社ヴィジョンゲイン社(Visiongain)は、通信とエネルギーのほか、自動車や化学・医薬品、金属など、広範な市場を対象に調査を行っています。自動車市場については、市場全般に関する調査のほ... もっと見る
調査レポートの納品までの日数はどの程度ですか?
在庫のあるものは速納となりますが、平均的には 3-4日と見て下さい。
但し、一部の調査レポートでは、発注を受けた段階で内容更新をして納品をする場合もあります。
発注をする前のお問合せをお願いします。
注文の手続きはどのようになっていますか?
1)お客様からの御問い合わせをいただきます。
2)見積書やサンプルの提示をいたします。
3)お客様指定、もしくは弊社の発注書をメール添付にて発送してください。
4)データリソース社からレポート発行元の調査会社へ納品手配します。
5) 調査会社からお客様へ納品されます。最近は、pdfにてのメール納品が大半です。
お支払方法の方法はどのようになっていますか?
納品と同時にデータリソース社よりお客様へ請求書(必要に応じて納品書も)を発送いたします。
お客様よりデータリソース社へ(通常は円払い)の御振り込みをお願いします。
請求書は、納品日の日付で発行しますので、翌月最終営業日までの当社指定口座への振込みをお願いします。振込み手数料は御社負担にてお願いします。
お客様の御支払い条件が60日以上の場合は御相談ください。
尚、初めてのお取引先や個人の場合、前払いをお願いすることもあります。ご了承のほど、お願いします。
データリソース社はどのような会社ですか?
当社は、世界各国の主要調査会社・レポート出版社と提携し、世界各国の市場調査レポートや技術動向レポートなどを日本国内の企業・公官庁及び教育研究機関に提供しております。
世界各国の「市場・技術・法規制などの」実情を調査・収集される時には、データリソース社にご相談ください。
お客様の御要望にあったデータや情報を抽出する為のレポート紹介や調査のアドバイスも致します。
|
|

