地熱発電市場レポート:2023-2033
Geothermal Power Market Report 2023-2033
レポート詳細
地熱発電市場レポート 2023-2033 : 本レポートは、業界とその基礎となる原動力をより良く理解することを望むなら、新たな収益ポケットを目指す大手企業にとって貴重なものとなる。異業... もっと見る
※上記価格は部署ライセンス(Departmental licence)価格です。
その他の価格についてはデータリソースまでお問合せください。
日本語のページは自動翻訳を利用し作成しています。
実際のレポートは英文のみでご納品いたします。

|

|
サマリー
レポート詳細
地熱発電市場レポート 2023-2033: 本レポートは、業界とその基礎となる原動力をより良く理解することを望むなら、新たな収益ポケットを目指す大手企業にとって貴重なものとなる。異業種への進出や新規地域での既存事業の拡大を目指す企業にも有用です。
地球のグリーンエネルギー貯蔵庫を利用する
世界の地熱発電市場の主な原動力のひとつは、再生可能エネルギーへの移行における地熱発電の役割である。地熱発電は、地表下にある地球の自然熱を利用し、信頼性の高い持続可能なエネルギー源を提供する。各国が化石燃料への依存を減らし、気候変動を緩和しようとしている中、地熱エネルギーはクリーンで安定した電力源を提供し、世界の再生可能エネルギーの中で重要な役割を担っている。
カーボンフットプリントを最小限に抑えたグリーンエネルギー
地熱発電は炭素排出量が少ないことで有名である。化石燃料とは異なり、地熱エネルギーシステムは発電中に発生する温室効果ガスや汚染物質を最小限に抑えることができる。世界が気候変動と闘うために二酸化炭素排出量の削減にますます力を入れる中、地熱発電の環境面での利点は、エネルギー部門の脱炭素化を目指す先進国と発展途上国の双方にとって魅力的な選択肢となっている。
市場調査レポートを購入する前にすべき質問とは?
- 地熱発電市場はどのように進化しているのか?
- 何が地熱発電市場を牽引し、また抑制しているのか?
- 地熱発電の各サブ市場セグメントは予測期間中にどのように成長し、2033 年にどれだけの売上を占めるのか?
- 各サブマーケットの市場シェアは、2023 年から 2033 年にかけてどのように成長するのか?
- 2023 年から 2033 年にかけて市場全体を牽引する主な要因は何か?
- 主要な地熱発電市場は、マクロ経済の動きにほぼ追随するのか、それとも個々の国の市場が他を凌駕するのか?
- 2033 年までに各国市場のシェアはどう変化し、どの地域が 2033 年の市場をリードするのか?
- また 2033 年にはどの地域が市場をリードするのか?
- これらの主要企業の地熱発電プロジェクトは?
- 2023 年から 2033 年の間に、地熱発電産業はどのように発展していくのか?現在、そして今後 10 年間の地熱発電プロジェクトの影響は?
- 地熱発電市場をさらに拡大するために、製品の商業化の必要性は高まっているのか?
- 地熱発電市場はどこに向かっているのか?
- 新しい製品やサービスのために、どのような投資がベストなのか?
- 企業を新たな成長軌道に乗せ、C-suite(経営幹部)にするための重要な展望は何か?
このことが地熱発電市場に現在、そして今後10年間にどのような影響を与えるかを知る必要がある:
- 377ページにわたる本レポートでは、120の表と185の図表を掲載しています。
- 本レポートは、業界における主要な有利分野にハイライトを当てているため、今すぐターゲットを絞ることができます。
- 世界、地域、国の売上と成長に関する詳細な分析が含まれています。
- 競合他社が成功した主なトレンド、変化、収益予測をハイライトしています。
本レポートは、地熱発電市場が今後10年間でどのように発展していくのか、またCOVID-19の景気後退と好転の変動に合わせてどのように発展していくのかをお伝えします。この市場は過去10年間のどの時点よりも今が重要である。
2033年までの予測やその他の分析から、商業的な展望が明らかになる
- 2033年までの収益予測に加え、直近の業績、成長率、市場シェアもご覧いただけます。
- ビジネスの展望と展開に関する独自の分析をご覧いただけます。
- 質的分析(市場力学、促進要因、機会、阻害要因、課題を含む)、コスト構造、地熱発電価格上昇の影響、最近の動向をご覧いただけます。
本レポートには、COVID-19が業界と貴社にどのような影響を与えるかについてのデータ分析と貴重な洞察が含まれている。本レポートでは、COVID-19の4つの回収パターンとその影響、すなわち「V」、「L」、「W」、「U」について論じている。
レポート対象セグメント
ステーションタイプ別市場セグメント
- 乾式蒸気発電所
- フラッシュ蒸気発電所
- バイナリーサイクル発電所
技術別市場セグメント
- 地上熱源ヒートポンプ
- 直接利用地熱
- 深部地熱システム
- 強化地熱システム
部品別市場セグメント
- タービンと発電機
- 発電設備とコンポーネント
- 熱交換器とコンデンサー
- 送電とグリッドインテグレーション
- その他のコンポーネント
資源タイプ別市場セグメント
- 対流熱水
- 堆積盆地
- 地圧型
- 放射性
- 固化した高温の乾燥岩石
- 溶融マグマ
世界市場全体とセグメント別の収益予測に加え、4つの地域と20の主要国市場の収益予測も掲載しています:
北米・中米
- アメリカ
- 中米
欧州
- ドイツ
- アイスランド
- フランス
- イタリア
- ロシア
- その他の欧州
アジア太平洋
- 中国
- インドネシア
- 日本
- フィリピン
- ニュージーランド
- その他のアジア太平洋地域
ラテンアメリカ
- チリ
- メキシコ
- その他のラテンアメリカ
中東・アフリカ
- GCC
- 南アフリカ
- その他の中東・アフリカ
本レポートはまた、2023年から2033年までの地熱発電市場の主要企業のプロファイルと、これらの企業の事業のこのセグメントに焦点を当てている。
主要企業と市場成長の可能性
・ Ansaldo Energia S.p.A.
・ Atlas Copco Group
・ Berkshire Hathaway Energy (BHE)
・ Calpine Corporation
・ Chevron Corporation
・ ElectraTherm
・ Enel S.p.A.
・ General Electric Company
・ Haliburton Corporation
・ Innergex Renewable Energy
・ Mitsubishi Corporation
・ Ormat Technologies, Inc.
・ PT Pertamina Geothermal Energy
・ Terra-Gen, LLC
・ Toshiba Corporation
2023年から2033年までの地熱発電市場全体の世界売上高(金額ベース)は、2023年に576億米ドルを突破する。2033年まで力強い収益成長を予測。当社の調査では、最も大きな可能性を秘めた企業を特定しています。彼らの能力、進歩、商業的展望を発見し、一歩先を行くお手伝いをします。
地熱発電市場、2023年から2033年までのレポートはどのように役立つのか?
要約すると、370ページを超えるこのレポートは、以下の知識を提供する:
- 地熱発電市場の2023年から2033年までの収益予測 世界と地域レベルでのステーションタイプ、技術、コンポーネント、資源タイプの各予測を掲載 - 業界の将来性を発見し、投資と収益に最も有利な場所を見つけます。
- 4つの地域と20の主要国市場の2033年までの収益予測 - 北米、欧州、アジア太平洋、ラテンアメリカ、中東・アフリカの地熱発電市場2023年から2033年までの市場予測をご覧ください。また、米国、中央アメリカ、チリ、ドイツ、アイスランド、イタリア、中国、インドネシア、日本、ニュージーランドの市場も予測しています。
- 既存企業や市場参入を目指す企業にとっての展望 - 2023年から2033年までの地熱発電市場に関わる主要企業15社の企業プロファイルを含む。
独自の予測による定量的・定性的分析をご覧ください。私たちのレポートだけに含まれる情報を入手し、貴重なビジネスインテリジェンスで情報を得ることができます。
他にはない情報
私たちの新しいレポートがあれば、知識に遅れをとったり、チャンスを逃したりする可能性が低くなります。弊社の調査レポートが貴社の調査、分析、意思決定にどのように役立つかをご覧ください。Visiongainの調査は、地熱発電市場、2023年から2033年、市場をリードする企業の商業分析を必要とするすべての人のためのものです。データ、トレンド、予測をご覧いただけます。
ページTOPに戻る
目次
目次
1 レポート概要
1.1 研究の目的
1.2 地熱発電市場の紹介
1.3 本レポートの特徴
1.4 本レポートを読むべき理由
1.5 本分析レポートが答える主な質問
1.6 本レポートは誰のためのものか?
1.7 方法論
1.7.1 市場の定義
1.7.2 市場評価・予測手法
1.7.3 データの検証
1.7.3.1 一次調査
1.7.3.2 セカンダリーリサーチ
1.8 よくある質問(FAQ)
1.9 Visiongainの関連レポート
1.10 Visiongainについて
2 エグゼクティブ・サマリー
3 市場概要
3.1 主要な調査結果
3.2 市場ダイナミクス
3.2.1 市場促進要因
3.2.1.1 暖房の電化は市場成長の中心的戦略である。
3.2.1.2 地熱エネルギーは、石炭や他の化石燃料のような従来の燃料源よりも環境に優しい
3.2.1.3 地熱エネルギーは直接冷暖房に利用できる
3.2.2 市場抑制要因
3.2.2.1 地熱エネルギーは場所に依存するため、市場にとって不利になる可能性がある。
3.2.2.2 地熱エネルギーは地震を誘発し、温室効果ガスの放出につながるリスクもある。
3.2.2.3 地熱エネルギーは高価で、より多くの資源が必要である。
3.2.3 市場機会
3.2.3.1 高効率な地熱発電システムの市場機会
3.2.3.2 エネルギープロセスを改善するための新しい技術の開発
3.2.3.3 政府のインセンティブと支援政策 市場の機会
3.3 ポーターのファイブフォース分析
3.3.1 サプライヤーの交渉力(中)
3.3.2 買い手の交渉力(低)
3.3.3 競争力(低)
3.3.4 代替品による脅威(中)
3.3.5 新規参入者の脅威(低)
3.4 COVID-19の影響分析
3.4.1 "V字型回復"
3.4.2 "U字型回復"
3.4.3 "W字型回復"
3.4.4 "L字型回復"
3.5 PEST分析
4 地熱発電市場分析:発電所タイプ別
4.1 主要な調査結果
4.2 発電所タイプ別セグメント 市場魅力度指数
4.3 発電所タイプ別地熱発電市場規模の推定と予測
4.4 乾式蒸気発電所
4.4.1 2023-2033 年の地域別市場規模(US$ Billion)
4.4.2 地域別市場シェア、2023年・2033年(%)
4.5 フラッシュスチーム発電所
4.5.1 2023~2033年の地域別市場規模(US$ Billion)
4.5.2 地域別市場シェア、2023年・2033年(%)
4.6 バイナリーサイクル発電所
4.6.1 2023~2033年の地域別市場規模(US$ Billion)
4.6.2 地域別市場シェア、2023年・2033年(%)
5 地熱発電市場分析:技術別
5.1 主な調査結果
5.2 技術セグメント 市場魅力度指数
5.3 技術別の地熱発電市場規模の推定と予測
5.4 地中熱源ヒートポンプ
5.4.1 2023~2033年の地域別市場規模(US$ Billion)
5.4.2 地域別市場シェア、2023年・2033年(%)
5.5 直接利用型地中熱
5.5.1 2023年~2033年の地域別市場規模(US$ Billion)
5.5.2 地域別市場シェア、2023年・2033年(%)
5.6 深部地熱システム
5.6.1 2023年~2033年の地域別市場規模(US$ Billion)
5.6.2 地域別市場シェア、2023年・2033年(%)
5.7 強化地熱システム
5.7.1 2023年~2033年の地域別市場規模(US$ Billion)
5.7.2 地域別市場シェア、2023年・2033年(%)
6 地熱発電市場分析:コンポーネント別
6.1 主要な調査結果
6.2 コンポーネント・セグメント 市場魅力度指数
6.3 コンポーネント別地熱発電市場規模の推定と予測
6.4 タービンと発電機
6.4.1 2023-2033 年の地域別市場規模(US$ Billion)
6.4.2 地域別市場シェア、2023年・2033年(%)
6.5 発電機器・コンポーネント
6.5.1 2023〜2033年の地域別市場規模(US$ Billion)
6.5.2 地域別市場シェア、2023年・2033年(%)
6.6 熱交換器とコンデンサー
6.6.1 2023〜2033年の地域別市場規模(US$ Billion)
6.6.2 地域別市場シェア、2023年・2033年(%)
6.7 送電とグリッド統合
6.7.1 2023~2033年の地域別市場規模(US$ Billion)
6.7.2 地域別市場シェア、2023年・2033年(%)
6.8 その他のコンポーネント
6.8.1 2023〜2033年の地域別市場規模(US$ Billion)
6.8.2 地域別市場シェア、2023年・2033年(%)
7 地熱発電市場分析:資源タイプ別
7.1 主要な調査結果
7.2 資源タイプ別セグメント 市場魅力度指数
7.3 資源タイプ別地熱発電市場規模の推定と予測
7.4 対流熱水力
7.4.1 2023-2033 年の地域別市場規模(US$ Billion)
7.4.2 地域別市場シェア、2023年・2033年(%)
7.5 堆積盆
7.5.1 2023〜2033年の地域別市場規模(US$ Billion)
7.5.2 地域別市場シェア、2023年・2033年(%)
7.6 ジオプレッシャー
7.6.1 2023~2033年の地域別市場規模(US$ Billion)
7.6.2 地域別市場シェア、2023年・2033年(%)
7.7 放射性
7.7.1 2023~2033年の地域別市場規模(US$ Billion)
7.7.2 地域別市場シェア、2023年・2033年(%)
7.8 固化高温乾性岩石
7.8.1 2023~2033年の地域別市場規模(US$ Billion)
7.8.2 地域別市場シェア、2023年・2033年(%)
7.9 一部静止した溶融マグマ
7.9.1 2023~2033年の地域別市場規模(US$ Billion)
7.9.2 地域別市場シェア、2023年・2033年(%)
8 地熱発電市場分析:地域別
8.1 主要な調査結果
8.2 地域別市場規模の推定と予測
9 北米・中米の地熱発電市場分析
9.1 主要な調査結果
9.2 北米・中米の地熱発電市場魅力度指数
9.3 北米・中米の地熱発電国別市場、2023 年、2028 年、2033 年 (US$ Billion)
9.4 北米・中米の地熱発電市場規模推定と予測
9.5 北米・中米の地熱発電市場規模推定と予測:国別
9.6 北米・中米の地熱発電市場規模推定と予測:発電所タイプ別
9.7 北米・中米の地熱発電市場規模推定と予測:技術別
9.8 北米・中米の地熱発電市場規模推定と予測:コンポーネント別
9.9 北米・中米の地熱発電市場規模推定と予測:資源タイプ別
9.10 アメリカの地熱発電市場分析
9.11 中米の地熱発電市場分析
10 欧州の地熱発電市場分析
10.1 主要な調査結果
10.2 欧州の地熱発電市場魅力度指数
10.3 欧州の国別地熱発電市場、2023 年、2028 年、2033 年 (US$ Billion)
10.4 欧州の地熱発電市場規模推定と予測
10.5 欧州の地熱発電市場規模推定と予測:国別
10.6 欧州の地熱発電市場規模推定と予測:発電所タイプ別
10.7 欧州の地熱発電市場規模推定と予測:技術別
10.8 欧州の地熱発電市場規模推定と予測:コンポーネント別
10.9 欧州の地熱発電市場規模推定と予測:資源タイプ別
10.10 ドイツの地熱発電市場分析
10.11 アイスランドの地熱発電市場分析
10.12 フランスの地熱発電市場分析
10.13 イタリアの地熱発電市場分析
10.14 ロシアの地熱発電市場分析
10.15 その他の欧州の地熱発電市場分析
11 アジア太平洋地域の地熱発電市場分析
11.1 主要な調査結果
11.2 アジア太平洋地域の地熱発電市場魅力度指数
11.3 アジア太平洋地域の国別地熱発電市場、2023年、2028年、2033年 (US$ Billion)
11.4 アジア太平洋地域の地熱発電市場規模推定と予測
11.5 アジア太平洋地域の地熱発電市場規模推定と予測:国別
11.6 アジア太平洋地域の地熱発電市場規模推定と予測:発電所タイプ別
11.7 アジア太平洋地域の地熱発電市場規模推定と予測:技術別
11.8 アジア太平洋地域の地熱発電市場規模推定と予測:コンポーネント別
11.9 アジア太平洋地域の地熱発電市場規模推定と予測:資源タイプ別
11.10 中国の地熱発電市場分析
11.11 インドネシアの地熱発電市場分析
11.12 日本の地熱発電市場分析
11.13 フィリピンの地熱発電市場分析
11.14 ニュージーランドの地熱発電市場分析
11.15 その他のアジア太平洋地域の地熱発電市場分析
12 中東とアフリカの地熱発電市場分析
12.1 主要な調査結果
12.2 中東・アフリカ地熱発電市場魅力度指数
12.3 中東・アフリカの国別地熱発電市場、2023年、2028年、2033年(US$ Billion)
12.4 中東・アフリカの地熱発電市場規模推定と予測
12.5 中東・アフリカの地熱発電市場規模推定と予測:国別
12.6 中東・アフリカの地熱発電市場規模推定と予測:発電所タイプ別
12.7 中東・アフリカの地熱発電市場規模推定と予測:技術別
12.8 中東・アフリカの地熱発電市場規模推定と予測:コンポーネント別
12.9 中東・アフリカの地熱発電市場規模推定と予測:資源タイプ別
12.10 GCCの地熱発電の市場分析
12.11 南アフリカの地熱発電市場分析
12.12 その他の中東・アフリカの地熱発電市場分析
13 ラテンアメリカの地熱発電市場分析
13.1 主要な調査結果
13.2 ラテンアメリカの地熱発電市場魅力度指数
13.3 ラテンアメリカの国別地熱発電市場、2023年、2028年、2033年 (US$ Billion)
13.4 ラテンアメリカの地熱発電市場規模推定と予測
13.5 ラテンアメリカの地熱発電市場規模推定と予測:国別
13.6 ラテンアメリカの地熱発電市場規模推定と予測:発電所タイプ別
13.7 ラテンアメリカの地熱発電市場規模推定と予測:技術別
13.8 ラテンアメリカの地熱発電市場規模推定と予測:コンポーネント別
13.9 ラテンアメリカの地熱発電市場規模推定と予測:資源タイプ別
13.10 チリの地熱発電市場分析
13.11 メキシコの地熱発電市場分析
13.12 その他のラテンアメリカの地熱発電市場分析
14 主要企業のプロファイル
14.1 競争環境、2022年
14.2 戦略的展望
14.3 Ansaldo Energia S.p.A.
14.3.1 会社概要
14.3.2 会社概要
14.3.3 製品ベンチマーク
14.3.4 戦略的展望
14.4 Atlas Copco Group
14.4.1 会社概要
14.4.2 会社概要
14.4.3 財務分析
14.4.3.1 純収入、2018年~2022年
14.4.3.2 R&D、2018年~2022年
14.4.3.3 地域別収益シェア、2022年(%)
14.4.3.4 事業セグメント収益シェア、2022年(%)
14.4.4 製品ベンチマーク
14.4.5 戦略的展望
14.5 Chevron Corporation
14.5.1 会社概要
14.5.2 会社概要
14.5.3 財務分析
14.5.3.1 純収入、2018-2022年
14.5.3.2 R&D、2018年~2022年
14.5.3.3 地域別収益シェア、2022年(%)
14.5.3.4 事業セグメント収益シェア、2022年(%)
14.5.4 製品ベンチマーク
14.5.5 戦略的展望
14.6 General Electric Company
14.6.1 会社概要
14.6.2 会社概要
14.6.3 財務分析
14.6.3.1 純収入、2018-2022年
14.6.3.2 R&D、2018年~2022年
14.6.3.3 地域別収益シェア、2022年(%)
14.6.3.4 事業セグメント収益シェア、2022年(%)
14.6.4 製品ベンチマーク
14.6.5 戦略的展望
14.7 Haliburton Corporation
14.7.1 会社概要
14.7.2 会社概要
14.7.3 財務分析
14.7.3.1 純収入、2018-2022年
14.7.3.2 R&D、2018年~2022年
14.7.3.3 地域別収益シェア、2022年(%)
14.7.3.4 事業セグメント収益シェア、2022年(%)
14.7.4 製品ベンチマーク
14.7.5 戦略的展望
14.8 Mitsubishi Corporation
14.8.1 会社概要
14.8.2 会社概要
14.8.3 財務分析
14.8.3.1 純収入、2018年~2022年
14.8.3.2 地域別収益シェア、2022年(%)
14.8.3.3 事業セグメント別収益シェア、2022年(%)
14.8.4 製品ベンチマーク
14.8.5 戦略的展望
14.9 Toshiba Corporation
14.9.1 会社概要
14.9.2 会社概要
14.9.3 財務分析
14.9.3.1 純収入、2018年~2022年
14.9.3.2 R&D、2018年~2022年
14.9.3.3 地域別収益シェア、2022年(%)
14.9.3.4 事業セグメント収益シェア、2022年(%)
14.9.4 製品ベンチマーク
14.10 Berkshire Hathaway Energy (BHE)
14.10.1 会社概要
14.10.2 会社概要
14.10.3 製品ベンチマーク
14.10.4 戦略的展望
14.11 Calpine Corporation
14.11.1 会社概要
14.11.2 会社概要
14.11.3 製品ベンチマーク
14.12 ElectraTherm
14.12.1 会社概要
14.12.2 会社概要
14.12.3 製品ベンチマーク
14.12.4 戦略的展望
14.13 Enel S.p.A.
14.13.1 会社概要
14.13.2 会社概要
14.13.3 財務分析
14.13.3.1 純収入、2018年~2022年
14.13.3.2 地域別収入シェア、2022年(%)
14.13.3.3 事業セグメント別売上シェア、2022年(%)
14.13.4 製品ベンチマーク
14.14 Innergex Renewable Energy
14.14.1 会社概要
14.14.2 会社概要
14.14.3 財務分析
14.14.3.1 純収入、2018-2022年
14.14.3.2 地域別収入シェア、2022年(%)
14.14.3.3 事業セグメント別売上シェア、2022年(%)
14.14.4 製品ベンチマーク
14.14.5 戦略的展望
14.15 Ormat Technologies, Inc.
14.15.1 会社概要
14.15.2 会社概要
14.15.3 財務分析
14.15.3.1 純収入、2018-2022年
14.15.3.2 R&D、2018年〜2022年
14.15.3.3 地域別収益シェア、2022年(%)
14.15.3.4 事業セグメント収益シェア、2022年(%)
14.15.4 製品ベンチマーク
14.15.5 戦略的展望
14.16 Terra-Gen, LLC
14.16.1 会社概要
14.16.2 会社概要
14.16.3 製品ベンチマーク
14.17 PT Pertamina
14.17.1 会社概要
14.17.2 会社概要
14.17.3 製品ベンチマーク
14.17.4 戦略的展望
15 結論と提言
15.1 Visiongainからの結びの言葉
15.2 市場プレイヤーへの提言
ページTOPに戻る
図表リスト
表の一覧
Table 1 Geothermal Power Market Snapshot, 2023 & 2033 (US$ Billion, CAGR %)
Table 2 Global Geothermal Power Market by Region, 2023-2033 (US$ Bn, AGR (%), CAGR (%)) (V-Shaped Recovery Scenario)
Table 3 Global Geothermal Power Market by Region, 2023-2033 (US$ Bn, AGR (%), CAGR (%)) (U-Shaped Recovery Scenario)
Table 4 Global Geothermal Power Market by Region, 2023-2033 (US$ Bn, AGR (%), CAGR (%)) (W-Shaped Recovery Scenario)
Table 5 Global Geothermal Power Market by Region, 2023-2033 (US$ Bn, AGR (%), CAGR (%)) (L-Shaped Recovery Scenario)
Table 6 Global Geothermal Power Market by Station Type, 2023-2033 (US$ Bn, AGR (%), CAGR (%))
Table 7 Dry Steam Power Stations Market by Region, 2023-2033 (US$ Bn, AGR (%), CAGR (%))
Table 8 Flash Steam Power Stations Market by Region, 2023-2033 (US$ Bn, AGR (%), CAGR (%))
Table 9 Binary Cycle Power Stations Market by Region, 2023-2033 (US$ Bn, AGR (%), CAGR (%))
Table 10 Global Geothermal Power Market by Technology, 2023-2033 (US$ Bn, AGR (%), CAGR (%))
Table 11 Ground Source Heat Pumps Market by Region, 2023-2033 (US$ Bn, AGR (%), CAGR (%))
Table 12 Direct-Use Geothermal Market by Region, 2023-2033 (US$ Bn, AGR (%), CAGR (%))
Table 13 Deep Geothermal Systems Market by Region, 2023-2033 (US$ Bn, AGR (%), CAGR (%))
Table 14 Enhanced Geothermal Systems Market by Region, 2023-2033 (US$ Bn, AGR (%), CAGR (%))
Table 15 Global Geothermal Power Market by Components, 2023-2033 (US$ Bn, AGR (%), CAGR (%))
Table 16 Turbines and Generators Market by Region, 2023-2033 (US$ Bn, AGR (%), CAGR (%))
Table 17 Power Generation Equipment and Components Market by Region, 2023-2033 (US$ Bn, AGR (%), CAGR (%))
Table 18 Heat Exchangers and Condensers Market by Region, 2023-2033 (US$ Bn, AGR (%), CAGR (%))
Table 19 Transmission and Grid Integration Market by Region, 2023-2033 (US$ Bn, AGR (%), CAGR (%))
Table 20 Other Components Market by Region, 2023-2033 (US$ Bn, AGR (%), CAGR (%))
Table 21 Global Geothermal Power Market by Resource Type, 2023-2033 (US$ Bn, AGR (%), CAGR (%))
Table 22 Convective Hydrothermal Market by Region, 2023-2033 (US$ Bn, AGR (%), CAGR (%))
Table 23 Sedimentary Basin Market by Region, 2023-2033 (US$ Bn, AGR (%), CAGR (%))
Table 24 Geopressured Market by Region, 2023-2033 (US$ Bn, AGR (%), CAGR (%))
Table 25 Radiogenic Market by Region, 2023-2033 (US$ Bn, AGR (%), CAGR (%))
Table 26 Solidified Hot Dry Rock Market by Region, 2023-2033 (US$ Bn, AGR (%), CAGR (%))
Table 27 Part Still Molten Magma Market by Region, 2023-2033 (US$ Bn, AGR (%), CAGR (%))
Table 28 Geothermal Power Market Forecast by Region, 2023-2033 (US$ Billion, AGR%, CAGR%)
Table 29 North & Central America Geothermal Power Market by Value, 2023-2033 (US$ Bn, AGR (%), CAGR (%))
Table 30 North & Central America Geothermal Power Market by Country, 2023-2033 (US$ Bn, AGR (%), CAGR (%))
Table 31 North & Central America Geothermal Power Market by Station Type, 2023-2033 (US$ Bn, AGR (%), CAGR (%))
Table 32 North & Central America Geothermal Power Market by Technology, 2023-2033 (US$ Bn, AGR (%), CAGR (%))
Table 33 North & Central America Geothermal Power Market by Components, 2023-2033 (US$ Bn, AGR (%), CAGR (%))
Table 34 North & Central America Geothermal Power Market by Resource Type, 2023-2033 (US$ Bn, AGR (%), CAGR (%))
Table 35 U.S. Geothermal Power Market by Value, 2023-2033 (US$ Bn, AGR (%), CAGR (%))
Table 36 Central America Geothermal Power Market by Value, 2023-2033 (US$ Bn, AGR (%), CAGR (%))
Table 37 Europe Geothermal Power Market by Value, 2023-2033 (US$ Bn, AGR (%), CAGR (%))
Table 38 Europe Geothermal Power Market by Country, 2023-2033 (US$ Bn, AGR (%), CAGR (%))
Table 39 Europe Geothermal Power Market by Station Type, 2023-2033 (US$ Bn, AGR (%), CAGR (%))
Table 40 Europe Geothermal Power Market by Technology, 2023-2033 (US$ Bn, AGR (%), CAGR (%))
Table 41 Europe Geothermal Power Market by Components, 2023-2033 (US$ Bn, AGR (%), CAGR (%))
Table 42 Europe Geothermal Power Market by Resource Type, 2023-2033 (US$ Bn, AGR (%), CAGR (%))
Table 43 Germany Geothermal Power Market by Value, 2023-2033 (US$ Bn, AGR (%), CAGR (%))
Table 44 Iceland Geothermal Power Market by Value, 2023-2033 (US$ Bn, AGR (%), CAGR (%))
Table 45 France Geothermal Power Market by Value, 2023-2033 (US$ Bn, AGR (%), CAGR (%))
Table 46 Italy Geothermal Power Market by Value, 2023-2033 (US$ Bn, AGR (%), CAGR (%))
Table 47 Russia Geothermal Power Market by Value, 2023-2033 (US$ Bn, AGR (%), CAGR (%))
Table 48 Rest of Europe Geothermal Power Market by Value, 2023-2033 (US$ Bn, AGR (%), CAGR (%))
Table 49 Asia-Pacific Geothermal Power Market by Value, 2023-2033 (US$ Bn, AGR (%), CAGR (%))
Table 50 Asia-Pacific Geothermal Power Market by Country, 2023-2033 (US$ Bn, AGR (%), CAGR (%))
Table 51 Asia-Pacific Geothermal Power Market by Station Type, 2023-2033 (US$ Bn, AGR (%), CAGR (%))
Table 52 Asia-Pacific Geothermal Power Market by Technology, 2023-2033 (US$ Bn, AGR (%), CAGR (%))
Table 53 Asia-Pacific Geothermal Power Market by Components, 2023-2033 (US$ Bn, AGR (%), CAGR (%))
Table 54 Asia-Pacific Geothermal Power Market by Resource Type, 2023-2033 (US$ Bn, AGR (%), CAGR (%))
Table 55 China Geothermal Power Market by Value, 2023-2033 (US$ Bn, AGR (%), CAGR (%))
Table 56 Indonesia Geothermal Power Market by Value, 2023-2033 (US$ Bn, AGR (%), CAGR (%))
Table 57 Japan Geothermal Power Market by Value, 2023-2033 (US$ Bn, AGR (%), CAGR (%))
Table 58 Philippines Geothermal Power Market by Value, 2023-2033 (US$ Bn, AGR (%), CAGR (%))
Table 59 New Zealand Geothermal Power Market by Value, 2023-2033 (US$ Bn, AGR (%), CAGR (%))
Table 60 Rest of Asia-Pacific Geothermal Power Market by Value, 2023-2033 (US$ Bn, AGR (%), CAGR (%))
Table 61 Middle East & Africa Geothermal Power Market by Value, 2023-2033 (US$ Bn, AGR (%), CAGR (%))
Table 62 Middle East & Africa Geothermal Power Market by Country, 2023-2033 (US$ Bn, AGR (%), CAGR (%))
Table 63 Middle East & Africa Geothermal Power Market by Station Type, 2023-2033 (US$ Bn, AGR (%), CAGR (%))
Table 64 Middle East & Africa Geothermal Power Market by Technology, 2023-2033 (US$ Bn, AGR (%), CAGR (%))
Table 65 Middle East & Africa Geothermal Power Market by Components, 2023-2033 (US$ Bn, AGR (%), CAGR (%))
Table 66 Middle East & Africa Geothermal Power Market by Resource Type, 2023-2033 (US$ Bn, AGR (%), CAGR (%))
Table 67 GCC Geothermal Power Market by Value, 2023-2033 (US$ Bn, AGR (%), CAGR (%))
Table 68 South Africa Geothermal Power Market by Value, 2023-2033 (US$ Bn, AGR (%), CAGR (%))
Table 69 Rest of Middle East & Africa Geothermal Power Market by Value, 2023-2033 (US$ Bn, AGR (%), CAGR (%))
Table 70 Latin America Geothermal Power Market by Value, 2023-2033 (US$ Bn, AGR (%), CAGR (%))
Table 71 Latin America Geothermal Power Market by Country, 2023-2033 (US$ Bn, AGR (%), CAGR (%))
Table 72 Latin America Geothermal Power Market by Station Type, 2023-2033 (US$ Bn, AGR (%), CAGR (%))
Table 73 Latin America Geothermal Power Market by Technology, 2023-2033 (US$ Bn, AGR (%), CAGR (%))
Table 74 Latin America Geothermal Power Market by Components, 2023-2033 (US$ Bn, AGR (%), CAGR (%))
Table 75 Latin America Geothermal Power Market by Resource Type, 2023-2033 (US$ Bn, AGR (%), CAGR (%))
Table 76 Chile Geothermal Power Market by Value, 2023-2033 (US$ Bn, AGR (%), CAGR (%))
Table 77 Mexico Geothermal Power Market by Value, 2023-2033 (US$ Bn, AGR (%), CAGR (%))
Table 78 Rest of Latin America Geothermal Power Market by Value, 2023-2033 (US$ Bn, AGR (%), CAGR (%))
Table 79 Strategic Outlook - Contract
Table 80 Ansaldo Energia S.p.A.: Key Details, (CEO, HQ, Revenue, Founded, No. of Employees, Company Type, Website, Business Segment)
Table 81 Ansaldo Energia S.p.A.: Product Benchmarking
Table 82 Ansaldo Energia S.p.A.: Strategic Outlook
Table 83 Atlas Copco Group: Key Details, (CEO, HQ, Revenue, Founded, No. of Employees, Company Type, Website, Business Segment)
Table 84 Atlas Copco Group: Product Benchmarking
Table 85 Atlas Copco Group: Strategic Outlook
Table 86 Chevron Corporation: Key Details, (CEO, HQ, Revenue, Founded, No. of Employees, Company Type, Website, Business Segment)
Table 87 Chevron Corporation: Product Benchmarking
Table 88 Chevron Corporation: Strategic Outlook
Table 89 General Electric Company: Key Details, (CEO, HQ, Revenue, Founded, No. of Employees, Company Type, Website, Business Segment)
Table 90 General Electric Company: Product Benchmarking
Table 91 General Electric Company: Strategic Outlook
Table 92 Haliburton Corporation: Key Details, (CEO, HQ, Revenue, Founded, No. of Employees, Company Type, Website, Business Segment)
Table 93 Haliburton Corporation: Product Benchmarking
Table 94 Haliburton Corporation: Strategic Outlook
Table 95 Mitsubishi Corporation: Key Details, (CEO, HQ, Revenue, Founded, No. of Employees, Company Type, Website, Business Segment)
Table 96 Mitsubishi Corporation: Product Benchmarking
Table 97 Mitsubishi Corporation: Strategic Outlook
Table 98 Toshiba Corporation: Key Details, (CEO, HQ, Revenue, Founded, No. of Employees, Company Type, Website, Business Segment)
Table 99 Toshiba Corporation: Product Benchmarking
Table 100 KKK: Key Details, (CEO, HQ, Revenue, Founded, No. of Employees, Company Type, Website, Business Segment)
Table 101 Berkshire Hathaway Energy: Product Benchmarking
Table 102 Berkshire Hathaway Energy: Strategic Outlook
Table 103 Calpine Corporation: Key Details, (CEO, HQ, Revenue, Founded, No. of Employees, Company Type, Website, Business Segment)
Table 104 Calpine Corporation: Product Benchmarking
Table 105 ElectraTherm: Key Details, (CEO, HQ, Revenue, Founded, No. of Employees, Company Type, Website, Business Segment)
Table 106 ElectraTherm: Product Benchmarking
Table 107 ElectraTherm: Strategic Outlook
Table 108 Enel S.p.A.: Key Details, (CEO, HQ, Revenue, Founded, No. of Employees, Company Type, Website, Business Segment)
Table 109 Enel S.p.A: Product Benchmarking
Table 110 Innergex Renewable Energy: Key Details, (CEO, HQ, Revenue, Founded, No. of Employees, Company Type, Website, Business Segment)
Table 111 Innergex Renewable Energy: Product Benchmarking
Table 112 Innergex Renewable Energy: Strategic Outlook
Table 113 Ormat Technologies, Inc.: Key Details, (CEO, HQ, Revenue, Founded, No. of Employees, Company Type, Website, Business Segment)
Table 114 Ormat Technologies, Inc: Product Benchmarking
Table 115 Ormat Technologies, Inc: Strategic Outlook
Table 116 Terra-Gen, LLC: Key Details, (CEO, HQ, Revenue, Founded, No. of Employees, Company Type, Website, Business Segment)
Table 117 Terra-Gen, LLC: Product Benchmarking
Table 118 PT PERTAMINA: Key Details, (CEO, HQ, Revenue, Founded, No. of Employees, Company Type, Website, Business Segment)
Table 119 : Product Benchmarking
Table 120 PT Pertamina: Strategic Outlook
図の一覧
Figure 1 Geothermal Power Market Segmentation
Figure 2 Geothermal Power Market by Station Type: Market Attractiveness Index
Figure 3 Geothermal Power Market by Technology: Market Attractiveness Index
Figure 4 Geothermal Power Market by Component: Market Attractiveness Index
Figure 5 Geothermal Power Market by Resource Type: Market Attractiveness Index
Figure 6 Geothermal Power Market Attractiveness Index by Region
Figure 7 Geothermal Power Market: Market Dynamics
Figure 8 U.S. Tax Credits and Incentives, 2022
Figure 9 Geothermal Power Market: Porter’s Five Forces Analysis
Figure 10 Global Geothermal Power Market Share Forecast by COVID, 2023-2033 (%)
Figure 11 Global Geothermal Power Market by Region, 2023-2033 (US$ Bn, AGR (%)) (V-Shaped Recovery Scenario)
Figure 12 Global Geothermal Power Market by Region, 2023-2033 (US$ Bn, AGR (%)) (U-Shaped Recovery Scenario)
Figure 13 Global Geothermal Power Market by Region, 2023-2033 (US$ Bn, AGR (%)) (W-Shaped Recovery Scenario)
Figure 14 Global Geothermal Power Market by Region, 2023-2033 (US$ Bn, AGR (%)) (L-Shaped Recovery Scenario)
Figure 15 Geothermal Power Market: PEST Analysis
Figure 16 Geothermal Power Market by Station Type: Market Attractiveness Index
Figure 17 Global Geothermal Power Market by Station Type, 2023-2033 (US$ Bn, AGR (%))
Figure 18 Geothermal Power Market Share Forecast by Station Type, 2023, 2028, 2033 (%)
Figure 19 Dry Steam Power Stations Market by Region, 2023-2033 (US$ Bn, AGR (%))
Figure 20 Dry Steam Power Stations Market Share Forecast by Region, 2023 & 2033 (%)
Figure 21 Flash Steam Power Stations Market by Region, 2023-2033 (US$ Bn, AGR (%))
Figure 22 Flash Steam Power Stations Market Share Forecast by Region, 2023 & 2033 (%)
Figure 23 Binary Cycle Power Stations Market by Region, 2023-2033 (US$ Bn, AGR (%))
Figure 24 Binary Cycle Power Stations Market Share Forecast by Region, 2023 & 2033 (%)
Figure 25 Geothermal Power Market by Technology: Market Attractiveness Index
Figure 26 Global Geothermal Power Market by Technology, 2023-2033 (US$ Bn, AGR (%))
Figure 27 Geothermal Power Market Share Forecast by Technology, 2023, 2028, 2033 (%)
Figure 28 Ground Source Heat Pumps Market by Region, 2023-2033 (US$ Bn, AGR (%))
Figure 29 Ground Source Heat Pumps Market Share Forecast by Region, 2023 & 2033 (%)
Figure 30 Direct-Use Geothermal Market by Region, 2023-2033 (US$ Bn, AGR (%))
Figure 31 Direct-Use Geothermal Market Share Forecast by Region, 2023 & 2033 (%)
Figure 32 Deep Geothermal Systems Market by Region, 2023-2033 (US$ Bn, AGR (%))
Figure 33 Deep Geothermal Systems Market Share Forecast by Region, 2023 & 2033 (%)
Figure 34 Enhanced Geothermal Systems Market by Region, 2023-2033 (US$ Bn, AGR (%))
Figure 35 Enhanced Geothermal Systems Market Share Forecast by Region, 2023 & 2033 (%)
Figure 36 Geothermal Power Market by Component: Market Attractiveness Index
Figure 37 Global Geothermal Power Market by Components, 2023-2033 (US$ Bn, AGR (%))
Figure 38 Geothermal Power Market Share Forecast by Component, 2023, 2028, 2033 (%)
Figure 39 Turbines and Generators Market by Region, 2023-2033 (US$ Bn, AGR (%))
Figure 40 Turbines and Generators Market Share Forecast by Region, 2023 & 2033 (%)
Figure 41 Power Generation Equipment and Components Market by Region, 2023-2033 (US$ Bn, AGR (%))
Figure 42 Power Generation Equipment and Components Market Share Forecast by Region, 2023 & 2033 (%)
Figure 43 Heat Exchangers and Condensers Market by Region, 2023-2033 (US$ Bn, AGR (%))
Figure 44 Heat Exchangers and Condensers Market Share Forecast by Region, 2023 & 2033 (%)
Figure 45 Transmission and Grid Integration Market by Region, 2023-2033 (US$ Bn, AGR (%))
Figure 46 Transmission and Grid Integration Market Share Forecast by Region, 2023 & 2033 (%)
Figure 47 Other Components Market by Region, 2023-2033 (US$ Bn, AGR (%))
Figure 48 Other Components Market Share Forecast by Region, 2023 & 2033 (%)
Figure 49 Geothermal Power Market by Resource Type: Market Attractiveness Index
Figure 50 Global Geothermal Power Market by Resource Type, 2023-2033 (US$ Bn, AGR (%))
Figure 51 Geothermal Power Market Share Forecast by Resource Type, 2023, 2028, 2033 (%)
Figure 52 Convective Hydrothermal Market by Region, 2023-2033 (US$ Bn, AGR (%))
Figure 53 Convective Hydrothermal Market Share Forecast by Region, 2023 & 2033 (%)
Figure 54 Sedimentary Basin Market by Region, 2023-2033 (US$ Bn, AGR (%))
Figure 55 Sedimentary Basin Market Share Forecast by Region, 2023 & 2033 (%)
Figure 56 Geopressured Market by Region, 2023-2033 (US$ Bn, AGR (%))
Figure 57 Geopressured Market Share Forecast by Region, 2023 & 2033 (%)
Figure 58 Radiogenic Market by Region, 2023-2033 (US$ Bn, AGR (%))
Figure 59 Radiogenic Market Share Forecast by Region, 2023 & 2033 (%)
Figure 60 Solidified Hot Dry Rock Market by Region, 2023-2033 (US$ Bn, AGR (%))
Figure 61 Solidified Hot Dry Rock Market Share Forecast by Region, 2023 & 2033 (%)
Figure 62 Part Still Molten Magma Market by Region, 2023-2033 (US$ Bn, AGR (%))
Figure 63 Part Still Molten Magma Market Share Forecast by Region, 2023 & 2033 (%)
Figure 64 Geothermal Power Market Forecast by Region 2023 and 2033 (Revenue, CAGR%)
Figure 65 Geothermal Power Market Share Forecast by Region 2023, 2028, 2033 (%)
Figure 66 Geothermal Power Market by Region, 2023-2033 (US$ Billion, AGR %)
Figure 67 North & Central America & Central America Geothermal Power Market Attractiveness Index
Figure 68 North & Central America & Central America Geothermal Power Market by Region, 2023, 2028 & 2033 (US$ Billion)
Figure 69 North & Central America Geothermal Power Market by Value, 2023-2033 (US$ Bn, AGR (%))
Figure 70 North & Central America Geothermal Power Market by Country, 2023-2033 (US$ Bn, AGR (%))
Figure 71 North & Central America & Central America Geothermal Power Market Share Forecast by Country, 2023 & 2033 (%)
Figure 72 North & Central America Geothermal Power Market by Station Type, 2023-2033 (US$ Bn, AGR (%))
Figure 73 North & Central America & Central America Geothermal Power Market Share Forecast Station Type, 2023 & 2033 (%)
Figure 74 North & Central America Geothermal Power Market by Technology, 2023-2033 (US$ Bn, AGR (%))
Figure 75 North & Central America & Central America Geothermal Power Market Share Forecast by Technology, 2023 & 2033 (%)
Figure 76 North & Central America Geothermal Power Market by Components, 2023-2033 (US$ Bn, AGR (%))
Figure 77 North & Central America & Central America Geothermal Power Market Share Forecast by Component, 2023 & 2033 (%)
Figure 78 North & Central America Geothermal Power Market by Resource Type, 2023-2033 (US$ Bn, AGR (%))
Figure 79 North & Central America & Central America Geothermal Power Market Share Forecast by Resource Type, 2023 & 2033 (%)
Figure 80 U.S. Geothermal Power Market by Value, 2023-2033 (US$ Bn, AGR (%))
Figure 81 Central America Geothermal Power Market by Value, 2023-2033 (US$ Bn, AGR (%))
Figure 82 Europe Geothermal Power Market Attractiveness Index
Figure 83 Europe Geothermal Power Market by Region, 2023, 2028 & 2033 (US$ Billion)
Figure 84 Europe Geothermal Power Market by Value, 2023-2033 (US$ Bn, AGR (%))
Figure 85 Europe Geothermal Power Market by Country, 2023-2033 (US$ Bn, AGR (%))
Figure 86 Europe Geothermal Power Market Share Forecast by Country, 2023 & 2033 (%)
Figure 87 Europe Geothermal Power Market by Station Type, 2023-2033 (US$ Bn, AGR (%))
Figure 88 Europe Geothermal Power Market Share Forecast Station Type, 2023 & 2033 (%)
Figure 89 Europe Geothermal Power Market by Technology, 2023-2033 (US$ Bn, AGR (%))
Figure 90 Europe Geothermal Power Market Share Forecast by Technology, 2023 & 2033 (%)
Figure 91 Europe Geothermal Power Market by Components, 2023-2033 (US$ Bn, AGR (%))
Figure 92 Europe Geothermal Power Market Share Forecast by Component, 2023 & 2033 (%)
Figure 93 Europe Geothermal Power Market by Resource Type, 2023-2033 (US$ Bn, AGR (%))
Figure 94 Europe Geothermal Power Market Share Forecast by Resource Type, 2023 & 2033 (%)
Figure 95 Germany Geothermal Power Market by Value, 2023-2033 (US$ Bn, AGR (%))
Figure 96 Iceland Geothermal Power Market by Value, 2023-2033 (US$ Bn, AGR (%))
Figure 97 France Geothermal Power Market by Value, 2023-2033 (US$ Bn, AGR (%))
Figure 98 Italy Geothermal Power Market by Value, 2023-2033 (US$ Bn, AGR (%))
Figure 99 Russia Geothermal Power Market by Value, 2023-2033 (US$ Bn, AGR (%))
Figure 100 Rest of Europe Geothermal Power Market by Value, 2023-2033 (US$ Bn, AGR (%))
Figure 101 Asia-Pacific Geothermal Power Market Attractiveness Index
Figure 102 Asia-Pacific Geothermal Power Market by Region, 2023, 2028 & 2033 (US$ Billion)
Figure 103 Asia-Pacific Geothermal Power Market by Value, 2023-2033 (US$ Bn, AGR (%))
Figure 104 Asia-Pacific Geothermal Power Market by Country, 2023-2033 (US$ Bn, AGR (%))
Figure 105 Asia-Pacific Geothermal Power Market Share Forecast by Country, 2023 & 2033 (%)
Figure 106 Asia-Pacific Geothermal Power Market by Station Type, 2023-2033 (US$ Bn, AGR (%))
Figure 107 Asia-Pacific Geothermal Power Market Share Forecast Station Type, 2023 & 2033 (%)
Figure 108 Asia-Pacific Geothermal Power Market by Technology, 2023-2033 (US$ Bn, AGR (%))
Figure 109 Asia-Pacific Geothermal Power Market Share Forecast by Technology, 2023 & 2033 (%)
Figure 110 Asia-Pacific Geothermal Power Market by Components, 2023-2033 (US$ Bn, AGR (%))
Figure 111 Asia-Pacific Geothermal Power Market Share Forecast by Component, 2023 & 2033 (%)
Figure 112 Asia-Pacific Geothermal Power Market by Resource Type, 2023-2033 (US$ Bn, AGR (%))
Figure 113 Asia-Pacific Geothermal Power Market Share Forecast by Resource Type, 2023 & 2033 (%)
Figure 114 China Geothermal Power Market by Value, 2023-2033 (US$ Bn, AGR (%))
Figure 115 Indonesia Geothermal Power Market by Value, 2023-2033 (US$ Bn, AGR (%))
Figure 116 Japan Geothermal Power Market by Value, 2023-2033 (US$ Bn, AGR (%))
Figure 117 Philippines Geothermal Power Market by Value, 2023-2033 (US$ Bn, AGR (%))
Figure 118 New Zealand Geothermal Power Market by Value, 2023-2033 (US$ Bn, AGR (%))
Figure 119 Rest of Asia-Pacific Geothermal Power Market by Value, 2023-2033 (US$ Bn, AGR (%))
Figure 120 Middle East and Africa Geothermal Power Market Attractiveness Index
Figure 121 Middle East and Africa Geothermal Power Market by Region, 2023, 2028 & 2033 (US$ Billion)
Figure 122 Middle East & Africa Geothermal Power Market by Value, 2023-2033 (US$ Bn, AGR (%))
Figure 123 Middle East & Africa Geothermal Power Market by Country, 2023-2033 (US$ Bn, AGR (%))
Figure 124 Middle East and Africa Geothermal Power Market Share Forecast by Country, 2023 & 2033 (%)
Figure 125 Middle East & Africa Geothermal Power Market by Station Type, 2023-2033 (US$ Bn, AGR (%))
Figure 126 Middle East and Africa Geothermal Power Market Share Forecast Station Type, 2023 & 2033 (%)
Figure 127 Middle East & Africa Geothermal Power Market by Technology, 2023-2033 (US$ Bn, AGR (%))
Figure 128 Middle East and Africa Geothermal Power Market Share Forecast by Technology, 2023 & 2033 (%)
Figure 129 Middle East & Africa Geothermal Power Market by Components, 2023-2033 (US$ Bn, AGR (%))
Figure 130 Middle East and Africa Geothermal Power Market Share Forecast by Component, 2023 & 2033 (%)
Figure 131 Middle East & Africa Geothermal Power Market by Resource Type, 2023-2033 (US$ Bn, AGR (%))
Figure 132 Middle East and Africa Geothermal Power Market Share Forecast by Resource Type, 2023 & 2033 (%)
Figure 133 GCC Geothermal Power Market by Value, 2023-2033 (US$ Bn, AGR (%))
Figure 134 South Africa Geothermal Power Market by Value, 2023-2033 (US$ Bn, AGR (%))
Figure 135 Rest of Middle East & Africa Geothermal Power Market by Value, 2023-2033 (US$ Bn, AGR (%))
Figure 136 Latin America Geothermal Power Market Attractiveness Index
Figure 137 Latin America Geothermal Power Market by Region, 2023, 2028 & 2033 (US$ Billion)
Figure 138 Latin America Geothermal Power Market by Value, 2023-2033 (US$ Bn, AGR (%))
Figure 139 Latin America Geothermal Power Market by Country, 2023-2033 (US$ Bn, AGR (%))
Figure 140 Latin America Geothermal Power Market Share Forecast by Country, 2023 & 2033 (%)
Figure 141 Latin America Geothermal Power Market by Station Type, 2023-2033 (US$ Bn, AGR (%))
Figure 142 Latin America Geothermal Power Market Share Forecast Station Type, 2023 & 2033 (%)
Figure 143 Latin America Geothermal Power Market by Technology, 2023-2033 (US$ Bn, AGR (%))
Figure 144 Latin America Geothermal Power Market Share Forecast by Technology, 2023 & 2033 (%)
Figure 145 Latin America Geothermal Power Market by Components, 2023-2033 (US$ Bn, AGR (%))
Figure 146 Latin America Geothermal Power Market Share Forecast by Component, 2023 & 2033 (%)
Figure 147 Latin America Geothermal Power Market by Resource Type, 2023-2033 (US$ Bn, AGR (%))
Figure 148 Latin America Geothermal Power Market Share Forecast by Resource Type, 2023 & 2033 (%)
Figure 149 Chile Geothermal Power Market by Value, 2023-2033 (US$ Bn, AGR (%))
Figure 150 Mexico Geothermal Power Market by Value, 2023-2033 (US$ Bn, AGR (%))
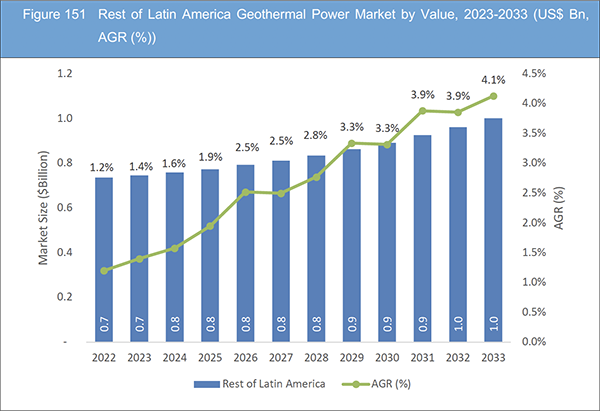
Figure 151 Rest of Latin America Geothermal Power Market by Value, 2023-2033 (US$ Bn, AGR (%))
Figure 152 Geothermal Power Market: Company Share, 2022
Figure 153 Atlas Copco Group.: Net Revenue, 2018-2022 (US$ Million, AGR%)
Figure 154 Atlas Copco Group.: R&D, 2018-2022 (US$ Million, AGR%)
Figure 155 Atlas Copco Group.: Regional Revenue Share, 2022 (%)
Figure 156 Atlas Copco Group.: Business Segment Revenue Share, 2022 (%)
Figure 157 Chevron Corporation.: Net Revenue, 2018-2022 (US$ Million, AGR%)
Figure 158 Chevron Corporation.: R&D, 2018-2022 (US$ Million, AGR%)
Figure 159 Chevron Corporation.: Regional Revenue Share, 2022 (%)
Figure 160 Chevron Corporation.: Business Segment Revenue Share, 2022 (%)
Figure 161 General Electric Company.: Net Revenue, 2018-2022 (US$ Million, AGR%)
Figure 162 General Electric Company.: R&D, 2018-2022 (US$ Million, AGR%)
Figure 163 General Electric Company.: Regional Revenue Share, 2022 (%)
Figure 164 General Electric Company.: Business Segment Revenue Share, 2022 (%)
Figure 165 Haliburton Corporation.: Net Revenue, 2018-2022 (US$ Million, AGR%)
Figure 166 Haliburton Corporation.: R&D, 2018-2022 (US$ Million, AGR%)
Figure 167 Haliburton Corporation.: Regional Revenue Share, 2022 (%)
Figure 168 Haliburton Corporation.: Business Segment Revenue Share, 2022 (%)
Figure 169 Mitsubishi Corporation.: Net Revenue, 2018-2022 (US$ Million, AGR%)
Figure 170 Mitsubishi Corporation.: Regional Revenue Share, 2022 (%)
Figure 171 Mitsubishi Corporation.: Business Segment Revenue Share, 2022 (%)
Figure 172 Toshiba Corporation.: Net Revenue, 2018-2022 (US$ Million, AGR%)
Figure 173 Toshiba Corporation.: R&D, 2018-2022 (US$ Million, AGR%)
Figure 174 Toshiba Corporation.: Regional Revenue Share, 2022 (%)
Figure 175 Toshiba Corporation.: Business Segment Revenue Share, 2022 (%)
Figure 176 Enel S.p.A.: Net Revenue, 2018-2022 (US$ Million, AGR%)
Figure 177 Enel S.p.A.: Regional Revenue Share, 2022 (%)
Figure 178 Enel S.p.A.: Business Segment Revenue Share, 2022 (%)
Figure 179 Innergex Renewable Energy.: Net Revenue, 2018-2022 (US$ Million, AGR%)
Figure 180 Innergex Renewable Energy.: Regional Revenue Share, 2022 (%)
Figure 181 Innergex Renewable Energy.: Business Segment Revenue Share, 2022 (%)
Figure 182 Ormat Technologies, Inc.: Net Revenue, 2018-2022 (US$ Million, AGR%)
Figure 183 Ormat Technologies, Inc.: R&D, 2018-2022 (US$ Million, AGR%)
Figure 184 Ormat Technologies, Inc.: Regional Revenue Share, 2022 (%)
Figure 185 Ormat Technologies, Inc.: Business Segment Revenue Share, 2022 (%)
ページTOPに戻る
Summary
Report Details
The Geothermal Power Market Report 2023-2033: This report will prove invaluable to leading firms striving for new revenue pockets if they wish to better understand the industry and its underlying dynamics. It will be useful for companies that would like to expand into different industries or to expand their existing operations in a new region.
Tapping into the Earth’s Green Energy Reservoir
One of the primary drivers for the global geothermal power market is its role in the transition to renewable energy sources. Geothermal power harnesses the Earth’s natural heat from beneath the surface, providing a reliable and sustainable energy source. As countries seek to reduce their reliance on fossil fuels and mitigate climate change, geothermal energy offers a clean and constant source of electricity, making it a key player in the global renewable energy landscape.
Green Energy with Minimal Carbon Footprint
Geothermal power is renowned for its low carbon emissions. Unlike fossil fuels, geothermal energy systems produce minimal greenhouse gases and pollutants during electricity generation. As the world becomes increasingly focused on reducing carbon emissions to combat climate change, the environmental benefits of geothermal power make it an attractive choice for both developed and developing economies looking to decarbonize their energy sectors.
What Questions Should You Ask before Buying a Market Research Report?
• How is the geothermal power market evolving?
• What is driving and restraining the geothermal power market?
• How will each geothermal power submarket segment grow over the forecast period and how much revenue will these submarkets account for in 2033?
• How will the market shares for each geothermal power submarket develop from 2023 to 2033?
• What will be the main driver for the overall market from 2023 to 2033?
• Will leading geothermal power markets broadly follow the macroeconomic dynamics, or will individual national markets outperform others?
• How will the market shares of the national markets change by 2033 and which geographical region will lead the market in 2033?
• Who are the leading players and what are their prospects over the forecast period?
• What are the geothermal power projects for these leading companies?
• How will the industry evolve during the period between 2023 and 2033? What are the implications of geothermal power projects taking place now and over the next 10 years?
• Is there a greater need for product commercialisation to further scale the geothermal power market?
• Where is the geothermal power market heading and how can you ensure you are at the forefront of the market?
• What are the best investment options for new product and service lines?
• What are the key prospects for moving companies into a new growth path and C-suite?
You need to discover how this will impact the geothermal power market today, and over the next 10 years:
• Our 377-page report provides 120 tables and 185 charts/graphs exclusively to you.
• The report highlights key lucrative areas in the industry so you can target them – NOW.
• It contains in-depth analysis of global, regional and national sales and growth.
• It highlights for you the key successful trends, changes and revenue projections made by your competitors.
This report tells you TODAY how the geothermal power market will develop in the next 10 years, and in line with the variations in COVID-19 economic recession and bounce. This market is more critical now than at any point over the last 10 years.
Forecasts to 2033 and other analyses reveal commercial prospects
• In addition to revenue forecasting to 2033, our new study provides you with recent results, growth rates, and market shares.
• You will find original analyses, with business outlooks and developments.
• Discover qualitative analyses (including market dynamics, drivers, opportunities, restraints and challenges), cost structure, impact of rising geothermal power prices and recent developments.
This report includes data analysis and invaluable insight into how COVID-19 will affect the industry and your company. Four COVID-19 recovery patterns and their impact, namely, “V”, “L”, “W” and “U” are discussed in this report.
Segments Covered in the Report
Market Segment by Station Type
• Dry Steam Power Stations
• Flash Steam Power Stations
• Binary Cycle Power Stations
Market Segment by Technology
• Ground Source Heat Pumps
• Direct-Use Geothermal
• Deep Geothermal Systems
• Enhanced Geothermal Systems
Market Segment by Components
• Turbines and Generators
• Power Generation Equipment and Components
• Heat Exchangers and Condensers
• Transmission and Grid Integration
• Other Components
Market Segment by Resource Type
• Convective Hydrothermal
• Sedimentary Basin
• Geopressured
• Radiogenic
• Solidified Hot Dry Rock
• Part Still Molten Magma
In addition to the revenue predictions for the overall world market and segments, you will also find revenue forecasts for four regional and 20 leading national markets:
North & Central America
• U.S.
• Central America
Europe
• Germany
• Iceland
• France
• Italy
• Russia
• Rest of Europe
Asia Pacific
• China
• Indonesia
• Japan
• Philippines
• New Zealand
• Rest of Asia Pacific
Latin America
• Chile
• Mexico
• Rest of Latin America
Middle East & Africa
• GCC
• South Africa
• Rest of Middle East & Africa
The report also includes profiles and for some of the leading companies in the Geothermal Power Market, 2023 to 2033, with a focus on this segment of these companies’ operations.
Leading companies and the potential for market growth
• Ansaldo Energia S.p.A.
• Atlas Copco Group
• Berkshire Hathaway Energy (BHE)
• Calpine Corporation
• Chevron Corporation
• ElectraTherm
• Enel S.p.A.
• General Electric Company
• Haliburton Corporation
• Innergex Renewable Energy
• Mitsubishi Corporation
• Ormat Technologies, Inc.
• PT Pertamina Geothermal Energy
• Terra-Gen, LLC
• Toshiba Corporation
Overall world revenue for Geothermal Power Market, 2023 to 2033 in terms of value the market will surpass US$57.6 billion in 2023, our work calculates. We predict strong revenue growth through to 2033. Our work identifies which organizations hold the greatest potential. Discover their capabilities, progress, and commercial prospects, helping you stay ahead.
How will the Geothermal Power Market, 2023 to 2033 report help you?
In summary, our 370+ page report provides you with the following knowledge:
• Revenue forecasts to 2033 for Geothermal Power Market, 2023 to 2033 Market, with forecasts for station type, technology, component, resource type, each forecast at a global and regional level – discover the industry’s prospects, finding the most lucrative places for investments and revenues.
• Revenue forecasts to 2033 for four regional and 20 key national markets – See forecasts for the Geothermal Power Market, 2023 to 2033 market in North America, Europe, Asia-Pacific, Latin America and Middle East & Africa. Also forecasted is the market in the US, Central America, Chile, Germany, Iceland, Italy, China, Indonesia, Japan, and New Zealand among other prominent economies.
• Prospects for established firms and those seeking to enter the market – including company profiles for 15 of the major companies involved in the Geothermal Power Market, 2023 to 2033.
Find quantitative and qualitative analyses with independent predictions. Receive information that only our report contains, staying informed with invaluable business intelligence.
Information found nowhere else
With our new report, you are less likely to fall behind in knowledge or miss out on opportunities. See how our work could benefit your research, analyses, and decisions. Visiongain’s study is for everybody needing commercial analyses for the Geothermal Power Market, 2023 to 2033, market-leading companies. You will find data, trends and predictions.
ページTOPに戻る
Table of Contents
Table of Contents
1 Report Overview
1.1 Objectives of the Study
1.2 Introduction to Geothermal Power Market
1.3 What This Report Delivers
1.4 Why You Should Read This Report
1.5 Key Questions Answered by This Analytical Report
1.6 Who Is This Report for?
1.7 Methodology
1.7.1 Market Definitions
1.7.2 Market Evaluation & Forecasting Methodology
1.7.3 Data Validation
1.7.3.1 Primary Research
1.7.3.2 Secondary Research
1.8 Frequently Asked Questions (FAQs)
1.9 Associated Visiongain Reports
1.10 About Visiongain
2 Executive Summary
3 Market Overview
3.1 Key Findings
3.2 Market Dynamics
3.2.1 Market Driving Factors
3.2.1.1 Electrification of Heating is Central Strategy for Market Growth
3.2.1.2 Geothermal Energy Is More Environmentally Friendly Than Conventional Fuel Sources Such as Coal and Other Fossil Fuels
3.2.1.3 Geothermal Energy Can be Harnessed for Direct Heating and Cooling Applications
3.2.2 Market Restraining Factors
3.2.2.1 Geothermal Energy is Location Specific Can be Disadvantage for the Market
3.2.2.2 Geothermal Energy Also Runs the Risk of Triggering Earthquakes and the Grounds Leads to a Release of Greenhouse Gases
3.2.2.3 Geothermal Energy Is an Expensive and Need More Resource
3.2.3 Market Opportunities
3.2.3.1 High Efficiency of Geothermal Systems Opportunities for the Market
3.2.3.2 Implying That New Technologies are Being Developed to Improve the Process of Energy
3.2.3.3 Government Incentives and Supportive Policies Opportunities for the Market
3.3 Porter’s Five Forces Analysis
3.3.1 Bargaining Power of Suppliers (Moderate)
3.3.2 Bargaining Power of Buyers (Low)
3.3.3 Competitive Rivalry (Low)
3.3.4 Threat from Substitutes (moderate)
3.3.5 Threat of New Entrants (Low)
3.4 COVID-19 Impact Analysis
3.4.1 “V-Shaped Recovery”
3.4.2 “U-Shaped Recovery”
3.4.3 “W-Shaped Recovery”
3.4.4 “L-Shaped Recovery”
3.5 PEST Analysis
4 Geothermal Power Market Analysis by Station Type
4.1 Key Findings
4.2 Station Type Segment: Market Attractiveness Index
4.3 Geothermal Power Market Size Estimation and Forecast by Station Type
4.4 Dry Steam Power Stations
4.4.1 Market Size by Region, 2023-2033 (US$ Billion)
4.4.2 Market Share by Region, 2023 & 2033 (%)
4.5 Flash Steam Power Stations
4.5.1 Market Size by Region, 2023-2033 (US$ Billion)
4.5.2 Market Share by Region, 2023 & 2033 (%)
4.6 Binary Cycle Power Stations
4.6.1 Market Size by Region, 2023-2033 (US$ Billion)
4.6.2 Market Share by Region, 2023 & 2033 (%)
5 Geothermal Power Market Analysis by Technology
5.1 Key Findings
5.2 Technology Segment: Market Attractiveness Index
5.3 Geothermal Power Market Size Estimation and Forecast by Technology
5.4 Ground Source Heat Pumps
5.4.1 Market Size by Region, 2023-2033 (US$ Billion)
5.4.2 Market Share by Region, 2023 & 2033 (%)
5.5 Direct-Use Geothermal
5.5.1 Market Size by Region, 2023-2033 (US$ Billion)
5.5.2 Market Share by Region, 2023 & 2033 (%)
5.6 Deep Geothermal Systems
5.6.1 Market Size by Region, 2023-2033 (US$ Billion)
5.6.2 Market Share by Region, 2023 & 2033 (%)
5.7 Enhanced Geothermal Systems
5.7.1 Market Size by Region, 2023-2033 (US$ Billion)
5.7.2 Market Share by Region, 2023 & 2033 (%)
6 Geothermal Power Market Analysis by Component
6.1 Key Findings
6.2 Component Segment: Market Attractiveness Index
6.3 Geothermal Power Market Size Estimation and Forecast by Component
6.4 Turbines and Generators
6.4.1 Market Size by Region, 2023-2033 (US$ Billion)
6.4.2 Market Share by Region, 2023 & 2033 (%)
6.5 Power Generation Equipment and Components
6.5.1 Market Size by Region, 2023-2033 (US$ Billion)
6.5.2 Market Share by Region, 2023 & 2033 (%)
6.6 Heat Exchangers and Condensers
6.6.1 Market Size by Region, 2023-2033 (US$ Billion)
6.6.2 Market Share by Region, 2023 & 2033 (%)
6.7 Transmission and Grid Integration
6.7.1 Market Size by Region, 2023-2033 (US$ Billion)
6.7.2 Market Share by Region, 2023 & 2033 (%)
6.8 Other Components
6.8.1 Market Size by Region, 2023-2033 (US$ Billion)
6.8.2 Market Share by Region, 2023 & 2033 (%)
7 Geothermal Power Market Analysis by Resource Type
7.1 Key Findings
7.2 Resource Type Segment: Market Attractiveness Index
7.3 Geothermal Power Market Size Estimation and Forecast by Resource Type
7.4 Convective Hydrothermal
7.4.1 Market Size by Region, 2023-2033 (US$ Billion)
7.4.2 Market Share by Region, 2023 & 2033 (%)
7.5 Sedimentary Basin
7.5.1 Market Size by Region, 2023-2033 (US$ Billion)
7.5.2 Market Share by Region, 2023 & 2033 (%)
7.6 Geopressured
7.6.1 Market Size by Region, 2023-2033 (US$ Billion)
7.6.2 Market Share by Region, 2023 & 2033 (%)
7.7 Radiogenic
7.7.1 Market Size by Region, 2023-2033 (US$ Billion)
7.7.2 Market Share by Region, 2023 & 2033 (%)
7.8 Solidified Hot Dry Rock
7.8.1 Market Size by Region, 2023-2033 (US$ Billion)
7.8.2 Market Share by Region, 2023 & 2033 (%)
7.9 Part Still Molten Magma
7.9.1 Market Size by Region, 2023-2033 (US$ Billion)
7.9.2 Market Share by Region, 2023 & 2033 (%)
8 Geothermal Power Market Analysis by Region
8.1 Key Findings
8.2 Regional Market Size Estimation and Forecast
9 North & Central America & Central America Geothermal Power Market Analysis
9.1 Key Findings
9.2 North & Central America & Central America Geothermal Power Market Attractiveness Index
9.3 North & Central America & Central America Geothermal Power Market by Country, 2023, 2028 & 2033 (US$ Billion)
9.4 North & Central America & Central America Geothermal Power Market Size Estimation and Forecast
9.5 North & Central America & Central America Geothermal Power Market Size Estimation and Forecast by Country
9.6 North & Central America & Central America Geothermal Power Market Size Estimation and Forecast by Station Type
9.7 North & Central America & Central America Geothermal Power Market Size Estimation and Forecast by Technology
9.8 North & Central America & Central America Geothermal Power Market Size Estimation and Forecast by Component
9.9 North & Central America & Central America Geothermal Power Market Size Estimation and Forecast by Resource Type
9.10 U.S. Geothermal Power Market Analysis
9.11 Central America Geothermal Power Market Analysis
10 Europe Geothermal Power Market Analysis
10.1 Key Findings
10.2 Europe Geothermal Power Market Attractiveness Index
10.3 Europe Geothermal Power Market by Country, 2023, 2028 & 2033 (US$ Billion)
10.4 Europe Geothermal Power Market Size Estimation and Forecast
10.5 Europe Geothermal Power Market Size Estimation and Forecast by Country
10.6 Europe Geothermal Power Market Size Estimation and Forecast by Station Type
10.7 Europe Geothermal Power Market Size Estimation and Forecast by Technology
10.8 Europe Geothermal Power Market Size Estimation and Forecast by Component
10.9 Europe Geothermal Power Market Size Estimation and Forecast by Resource Type
10.10 Germany Geothermal Power Market Analysis
10.11 Iceland Geothermal Power Market Analysis
10.12 France Geothermal Power Market Analysis
10.13 Italy Geothermal Power Market Analysis
10.14 Russia Geothermal Power Market Analysis
10.15 Rest of Europe Geothermal Power Market Analysis
11 Asia-Pacific Geothermal Power Market Analysis
11.1 Key Findings
11.2 Asia-Pacific Geothermal Power Market Attractiveness Index
11.3 Asia-Pacific Geothermal Power Market by Country, 2023, 2028 & 2033 (US$ Billion)
11.4 Asia-Pacific Geothermal Power Market Size Estimation and Forecast
11.5 Asia-Pacific Geothermal Power Market Size Estimation and Forecast by Country
11.6 Asia-Pacific Geothermal Power Market Size Estimation and Forecast by Station Type
11.7 Asia-Pacific Geothermal Power Market Size Estimation and Forecast by Technology
11.8 Asia-Pacific Geothermal Power Market Size Estimation and Forecast by Component
11.9 Asia-Pacific Geothermal Power Market Size Estimation and Forecast by Resource Type
11.10 China Geothermal Power Market Analysis
11.11 Indonesia Geothermal Power Market Analysis
11.12 Japan Geothermal Power Market Analysis
11.13 Philippines Geothermal Power Market Analysis
11.14 New Zealand Geothermal Power Market Analysis
11.15 Rest of Asia-Pacific Geothermal Power Market Analysis
12 Middle East and Africa Geothermal Power Market Analysis
12.1 Key Findings
12.2 Middle East and Africa Geothermal Power Market Attractiveness Index
12.3 Middle East and Africa Geothermal Power Market by Country, 2023, 2028 & 2033 (US$ Billion)
12.4 Middle East and Africa Geothermal Power Market Size Estimation and Forecast
12.5 Middle East and Africa Geothermal Power Market Size Estimation and Forecast by Country
12.6 Middle East and Africa Geothermal Power Market Size Estimation and Forecast by Station Type
12.7 Middle East and Africa Geothermal Power Market Size Estimation and Forecast by Technology
12.8 Middle East and Africa Geothermal Power Market Size Estimation and Forecast by Component
12.9 Middle East and Africa Geothermal Power Market Size Estimation and Forecast by Resource Type
12.10 GCC Geothermal Power Market Analysis
12.11 South Africa Geothermal Power Market Analysis
12.12 Rest of Middle East & Africa Geothermal Power Market Analysis
13 Latin America Geothermal Power Market Analysis
13.1 Key Findings
13.2 Latin America Geothermal Power Market Attractiveness Index
13.3 Latin America Geothermal Power Market by Country, 2023, 2028 & 2033 (US$ Billion)
13.4 Latin America Geothermal Power Market Size Estimation and Forecast
13.5 Latin America Geothermal Power Market Size Estimation and Forecast by Country
13.6 Latin America Geothermal Power Market Size Estimation and Forecast by Station Type
13.7 Latin America Geothermal Power Market Size Estimation and Forecast by Technology
13.8 Latin America Geothermal Power Market Size Estimation and Forecast by Component
13.9 Latin America Geothermal Power Market Size Estimation and Forecast by Resource Type
13.10 Chile Geothermal Power Market Analysis
13.11 Mexico Geothermal Power Market Analysis
13.12 Rest of Latin America Geothermal Power Market Analysis
14 Company Profiles
14.1 Competitive Landscape, 2022
14.2 Strategic Outlook
14.3 Ansaldo Energia S.p.A.
14.3.1 Company Snapshot
14.3.2 Company Overview
14.3.3 Product Benchmarking
14.3.4 Strategic Outlook
14.4 Atlas Copco Group
14.4.1 Company Snapshot
14.4.2 Company Overview
14.4.3 Financial Analysis
14.4.3.1 Net Revenue, 2018-2022
14.4.3.2 R&D, 2018-2022
14.4.3.3 Regional Revenue Share, 2022 (%)
14.4.3.4 Business Segment Revenue Share, 2022 (%)
14.4.4 Product Benchmarking
14.4.5 Strategic Outlook
14.5 Chevron Corporation
14.5.1 Company Snapshot
14.5.2 Company Overview
14.5.3 Financial Analysis
14.5.3.1 Net Revenue, 2018-2022
14.5.3.2 R&D, 2018-2022
14.5.3.3 Regional Revenue Share, 2022 (%)
14.5.3.4 Business Segment Revenue Share, 2022 (%)
14.5.4 Product Benchmarking
14.5.5 Strategic Outlook
14.6 General Electric Company
14.6.1 Company Snapshot
14.6.2 Company Overview
14.6.3 Financial Analysis
14.6.3.1 Net Revenue, 2018-2022
14.6.3.2 R&D, 2018-2022
14.6.3.3 Regional Revenue Share, 2022 (%)
14.6.3.4 Business Segment Revenue Share, 2022 (%)
14.6.4 Product Benchmarking
14.6.5 Strategic Outlook
14.7 Haliburton Corporation
14.7.1 Company Snapshot
14.7.2 Company Overview
14.7.3 Financial Analysis
14.7.3.1 Net Revenue, 2018-2022
14.7.3.2 R&D, 2018-2022
14.7.3.3 Regional Revenue Share, 2022 (%)
14.7.3.4 Business Segment Revenue Share, 2022 (%)
14.7.4 Product Benchmarking
14.7.5 Strategic Outlook
14.8 Mitsubishi Corporation
14.8.1 Company Snapshot
14.8.2 Company Overview
14.8.3 Financial Analysis
14.8.3.1 Net Revenue, 2018-2022
14.8.3.2 Regional Revenue Share, 2022 (%)
14.8.3.3 Business Segment Revenue Share, 2022 (%)
14.8.4 Product Benchmarking
14.8.5 Strategic Outlook
14.9 Toshiba Corporation
14.9.1 Company Snapshot
14.9.2 Company Overview
14.9.3 Financial Analysis
14.9.3.1 Net Revenue, 2018-2022
14.9.3.2 R&D, 2018-2022
14.9.3.3 Regional Revenue Share, 2022 (%)
14.9.3.4 Business Segment Revenue Share, 2022 (%)
14.9.4 Product Benchmarking
14.10 Berkshire Hathaway Energy (BHE)
14.10.1 Company Snapshot
14.10.2 Company Overview
14.10.3 Product Benchmarking
14.10.4 Strategic Outlook
14.11 Calpine Corporation
14.11.1 Company Snapshot
14.11.2 Company Overview
14.11.3 Product Benchmarking
14.12 ElectraTherm
14.12.1 Company Snapshot
14.12.2 Company Overview
14.12.3 Product Benchmarking
14.12.4 Strategic Outlook
14.13 Enel S.p.A.
14.13.1 Company Snapshot
14.13.2 Company Overview
14.13.3 Financial Analysis
14.13.3.1 Net Revenue, 2018-2022
14.13.3.2 Regional Revenue Share, 2022 (%)
14.13.3.3 Business Segment Revenue Share, 2022 (%)
14.13.4 Product Benchmarking
14.14 Innergex Renewable Energy
14.14.1 Company Snapshot
14.14.2 Company Overview
14.14.3 Financial Analysis
14.14.3.1 Net Revenue, 2018-2022
14.14.3.2 Regional Revenue Share, 2022 (%)
14.14.3.3 Business Segment Revenue Share, 2022 (%)
14.14.4 Product Benchmarking
14.14.5 Strategic Outlook
14.15 Ormat Technologies, Inc.
14.15.1 Company Snapshot
14.15.2 Company Overview
14.15.3 Financial Analysis
14.15.3.1 Net Revenue, 2018-2022
14.15.3.2 R&D, 2018-2022
14.15.3.3 Regional Revenue Share, 2022 (%)
14.15.3.4 Business Segment Revenue Share, 2022 (%)
14.15.4 Product Benchmarking
14.15.5 Strategic Outlook
14.16 Terra-Gen, LLC
14.16.1 Company Snapshot
14.16.2 Company Overview
14.16.3 Product Benchmarking
14.17 PT Pertamina
14.17.1 Company Snapshot
14.17.2 Company Overview
14.17.3 Product Benchmarking
14.17.4 Strategic Outlook
15 Conclusion and Recommendations
15.1 Concluding Remarks from Visiongain
15.2 Recommendations for Market Players
ページTOPに戻る
List of Tables/Graphs
List of Tables
Table 1 Geothermal Power Market Snapshot, 2023 & 2033 (US$ Billion, CAGR %)
Table 2 Global Geothermal Power Market by Region, 2023-2033 (US$ Bn, AGR (%), CAGR (%)) (V-Shaped Recovery Scenario)
Table 3 Global Geothermal Power Market by Region, 2023-2033 (US$ Bn, AGR (%), CAGR (%)) (U-Shaped Recovery Scenario)
Table 4 Global Geothermal Power Market by Region, 2023-2033 (US$ Bn, AGR (%), CAGR (%)) (W-Shaped Recovery Scenario)
Table 5 Global Geothermal Power Market by Region, 2023-2033 (US$ Bn, AGR (%), CAGR (%)) (L-Shaped Recovery Scenario)
Table 6 Global Geothermal Power Market by Station Type, 2023-2033 (US$ Bn, AGR (%), CAGR (%))
Table 7 Dry Steam Power Stations Market by Region, 2023-2033 (US$ Bn, AGR (%), CAGR (%))
Table 8 Flash Steam Power Stations Market by Region, 2023-2033 (US$ Bn, AGR (%), CAGR (%))
Table 9 Binary Cycle Power Stations Market by Region, 2023-2033 (US$ Bn, AGR (%), CAGR (%))
Table 10 Global Geothermal Power Market by Technology, 2023-2033 (US$ Bn, AGR (%), CAGR (%))
Table 11 Ground Source Heat Pumps Market by Region, 2023-2033 (US$ Bn, AGR (%), CAGR (%))
Table 12 Direct-Use Geothermal Market by Region, 2023-2033 (US$ Bn, AGR (%), CAGR (%))
Table 13 Deep Geothermal Systems Market by Region, 2023-2033 (US$ Bn, AGR (%), CAGR (%))
Table 14 Enhanced Geothermal Systems Market by Region, 2023-2033 (US$ Bn, AGR (%), CAGR (%))
Table 15 Global Geothermal Power Market by Components, 2023-2033 (US$ Bn, AGR (%), CAGR (%))
Table 16 Turbines and Generators Market by Region, 2023-2033 (US$ Bn, AGR (%), CAGR (%))
Table 17 Power Generation Equipment and Components Market by Region, 2023-2033 (US$ Bn, AGR (%), CAGR (%))
Table 18 Heat Exchangers and Condensers Market by Region, 2023-2033 (US$ Bn, AGR (%), CAGR (%))
Table 19 Transmission and Grid Integration Market by Region, 2023-2033 (US$ Bn, AGR (%), CAGR (%))
Table 20 Other Components Market by Region, 2023-2033 (US$ Bn, AGR (%), CAGR (%))
Table 21 Global Geothermal Power Market by Resource Type, 2023-2033 (US$ Bn, AGR (%), CAGR (%))
Table 22 Convective Hydrothermal Market by Region, 2023-2033 (US$ Bn, AGR (%), CAGR (%))
Table 23 Sedimentary Basin Market by Region, 2023-2033 (US$ Bn, AGR (%), CAGR (%))
Table 24 Geopressured Market by Region, 2023-2033 (US$ Bn, AGR (%), CAGR (%))
Table 25 Radiogenic Market by Region, 2023-2033 (US$ Bn, AGR (%), CAGR (%))
Table 26 Solidified Hot Dry Rock Market by Region, 2023-2033 (US$ Bn, AGR (%), CAGR (%))
Table 27 Part Still Molten Magma Market by Region, 2023-2033 (US$ Bn, AGR (%), CAGR (%))
Table 28 Geothermal Power Market Forecast by Region, 2023-2033 (US$ Billion, AGR%, CAGR%)
Table 29 North & Central America Geothermal Power Market by Value, 2023-2033 (US$ Bn, AGR (%), CAGR (%))
Table 30 North & Central America Geothermal Power Market by Country, 2023-2033 (US$ Bn, AGR (%), CAGR (%))
Table 31 North & Central America Geothermal Power Market by Station Type, 2023-2033 (US$ Bn, AGR (%), CAGR (%))
Table 32 North & Central America Geothermal Power Market by Technology, 2023-2033 (US$ Bn, AGR (%), CAGR (%))
Table 33 North & Central America Geothermal Power Market by Components, 2023-2033 (US$ Bn, AGR (%), CAGR (%))
Table 34 North & Central America Geothermal Power Market by Resource Type, 2023-2033 (US$ Bn, AGR (%), CAGR (%))
Table 35 U.S. Geothermal Power Market by Value, 2023-2033 (US$ Bn, AGR (%), CAGR (%))
Table 36 Central America Geothermal Power Market by Value, 2023-2033 (US$ Bn, AGR (%), CAGR (%))
Table 37 Europe Geothermal Power Market by Value, 2023-2033 (US$ Bn, AGR (%), CAGR (%))
Table 38 Europe Geothermal Power Market by Country, 2023-2033 (US$ Bn, AGR (%), CAGR (%))
Table 39 Europe Geothermal Power Market by Station Type, 2023-2033 (US$ Bn, AGR (%), CAGR (%))
Table 40 Europe Geothermal Power Market by Technology, 2023-2033 (US$ Bn, AGR (%), CAGR (%))
Table 41 Europe Geothermal Power Market by Components, 2023-2033 (US$ Bn, AGR (%), CAGR (%))
Table 42 Europe Geothermal Power Market by Resource Type, 2023-2033 (US$ Bn, AGR (%), CAGR (%))
Table 43 Germany Geothermal Power Market by Value, 2023-2033 (US$ Bn, AGR (%), CAGR (%))
Table 44 Iceland Geothermal Power Market by Value, 2023-2033 (US$ Bn, AGR (%), CAGR (%))
Table 45 France Geothermal Power Market by Value, 2023-2033 (US$ Bn, AGR (%), CAGR (%))
Table 46 Italy Geothermal Power Market by Value, 2023-2033 (US$ Bn, AGR (%), CAGR (%))
Table 47 Russia Geothermal Power Market by Value, 2023-2033 (US$ Bn, AGR (%), CAGR (%))
Table 48 Rest of Europe Geothermal Power Market by Value, 2023-2033 (US$ Bn, AGR (%), CAGR (%))
Table 49 Asia-Pacific Geothermal Power Market by Value, 2023-2033 (US$ Bn, AGR (%), CAGR (%))
Table 50 Asia-Pacific Geothermal Power Market by Country, 2023-2033 (US$ Bn, AGR (%), CAGR (%))
Table 51 Asia-Pacific Geothermal Power Market by Station Type, 2023-2033 (US$ Bn, AGR (%), CAGR (%))
Table 52 Asia-Pacific Geothermal Power Market by Technology, 2023-2033 (US$ Bn, AGR (%), CAGR (%))
Table 53 Asia-Pacific Geothermal Power Market by Components, 2023-2033 (US$ Bn, AGR (%), CAGR (%))
Table 54 Asia-Pacific Geothermal Power Market by Resource Type, 2023-2033 (US$ Bn, AGR (%), CAGR (%))
Table 55 China Geothermal Power Market by Value, 2023-2033 (US$ Bn, AGR (%), CAGR (%))
Table 56 Indonesia Geothermal Power Market by Value, 2023-2033 (US$ Bn, AGR (%), CAGR (%))
Table 57 Japan Geothermal Power Market by Value, 2023-2033 (US$ Bn, AGR (%), CAGR (%))
Table 58 Philippines Geothermal Power Market by Value, 2023-2033 (US$ Bn, AGR (%), CAGR (%))
Table 59 New Zealand Geothermal Power Market by Value, 2023-2033 (US$ Bn, AGR (%), CAGR (%))
Table 60 Rest of Asia-Pacific Geothermal Power Market by Value, 2023-2033 (US$ Bn, AGR (%), CAGR (%))
Table 61 Middle East & Africa Geothermal Power Market by Value, 2023-2033 (US$ Bn, AGR (%), CAGR (%))
Table 62 Middle East & Africa Geothermal Power Market by Country, 2023-2033 (US$ Bn, AGR (%), CAGR (%))
Table 63 Middle East & Africa Geothermal Power Market by Station Type, 2023-2033 (US$ Bn, AGR (%), CAGR (%))
Table 64 Middle East & Africa Geothermal Power Market by Technology, 2023-2033 (US$ Bn, AGR (%), CAGR (%))
Table 65 Middle East & Africa Geothermal Power Market by Components, 2023-2033 (US$ Bn, AGR (%), CAGR (%))
Table 66 Middle East & Africa Geothermal Power Market by Resource Type, 2023-2033 (US$ Bn, AGR (%), CAGR (%))
Table 67 GCC Geothermal Power Market by Value, 2023-2033 (US$ Bn, AGR (%), CAGR (%))
Table 68 South Africa Geothermal Power Market by Value, 2023-2033 (US$ Bn, AGR (%), CAGR (%))
Table 69 Rest of Middle East & Africa Geothermal Power Market by Value, 2023-2033 (US$ Bn, AGR (%), CAGR (%))
Table 70 Latin America Geothermal Power Market by Value, 2023-2033 (US$ Bn, AGR (%), CAGR (%))
Table 71 Latin America Geothermal Power Market by Country, 2023-2033 (US$ Bn, AGR (%), CAGR (%))
Table 72 Latin America Geothermal Power Market by Station Type, 2023-2033 (US$ Bn, AGR (%), CAGR (%))
Table 73 Latin America Geothermal Power Market by Technology, 2023-2033 (US$ Bn, AGR (%), CAGR (%))
Table 74 Latin America Geothermal Power Market by Components, 2023-2033 (US$ Bn, AGR (%), CAGR (%))
Table 75 Latin America Geothermal Power Market by Resource Type, 2023-2033 (US$ Bn, AGR (%), CAGR (%))
Table 76 Chile Geothermal Power Market by Value, 2023-2033 (US$ Bn, AGR (%), CAGR (%))
Table 77 Mexico Geothermal Power Market by Value, 2023-2033 (US$ Bn, AGR (%), CAGR (%))
Table 78 Rest of Latin America Geothermal Power Market by Value, 2023-2033 (US$ Bn, AGR (%), CAGR (%))
Table 79 Strategic Outlook - Contract
Table 80 Ansaldo Energia S.p.A.: Key Details, (CEO, HQ, Revenue, Founded, No. of Employees, Company Type, Website, Business Segment)
Table 81 Ansaldo Energia S.p.A.: Product Benchmarking
Table 82 Ansaldo Energia S.p.A.: Strategic Outlook
Table 83 Atlas Copco Group: Key Details, (CEO, HQ, Revenue, Founded, No. of Employees, Company Type, Website, Business Segment)
Table 84 Atlas Copco Group: Product Benchmarking
Table 85 Atlas Copco Group: Strategic Outlook
Table 86 Chevron Corporation: Key Details, (CEO, HQ, Revenue, Founded, No. of Employees, Company Type, Website, Business Segment)
Table 87 Chevron Corporation: Product Benchmarking
Table 88 Chevron Corporation: Strategic Outlook
Table 89 General Electric Company: Key Details, (CEO, HQ, Revenue, Founded, No. of Employees, Company Type, Website, Business Segment)
Table 90 General Electric Company: Product Benchmarking
Table 91 General Electric Company: Strategic Outlook
Table 92 Haliburton Corporation: Key Details, (CEO, HQ, Revenue, Founded, No. of Employees, Company Type, Website, Business Segment)
Table 93 Haliburton Corporation: Product Benchmarking
Table 94 Haliburton Corporation: Strategic Outlook
Table 95 Mitsubishi Corporation: Key Details, (CEO, HQ, Revenue, Founded, No. of Employees, Company Type, Website, Business Segment)
Table 96 Mitsubishi Corporation: Product Benchmarking
Table 97 Mitsubishi Corporation: Strategic Outlook
Table 98 Toshiba Corporation: Key Details, (CEO, HQ, Revenue, Founded, No. of Employees, Company Type, Website, Business Segment)
Table 99 Toshiba Corporation: Product Benchmarking
Table 100 KKK: Key Details, (CEO, HQ, Revenue, Founded, No. of Employees, Company Type, Website, Business Segment)
Table 101 Berkshire Hathaway Energy: Product Benchmarking
Table 102 Berkshire Hathaway Energy: Strategic Outlook
Table 103 Calpine Corporation: Key Details, (CEO, HQ, Revenue, Founded, No. of Employees, Company Type, Website, Business Segment)
Table 104 Calpine Corporation: Product Benchmarking
Table 105 ElectraTherm: Key Details, (CEO, HQ, Revenue, Founded, No. of Employees, Company Type, Website, Business Segment)
Table 106 ElectraTherm: Product Benchmarking
Table 107 ElectraTherm: Strategic Outlook
Table 108 Enel S.p.A.: Key Details, (CEO, HQ, Revenue, Founded, No. of Employees, Company Type, Website, Business Segment)
Table 109 Enel S.p.A: Product Benchmarking
Table 110 Innergex Renewable Energy: Key Details, (CEO, HQ, Revenue, Founded, No. of Employees, Company Type, Website, Business Segment)
Table 111 Innergex Renewable Energy: Product Benchmarking
Table 112 Innergex Renewable Energy: Strategic Outlook
Table 113 Ormat Technologies, Inc.: Key Details, (CEO, HQ, Revenue, Founded, No. of Employees, Company Type, Website, Business Segment)
Table 114 Ormat Technologies, Inc: Product Benchmarking
Table 115 Ormat Technologies, Inc: Strategic Outlook
Table 116 Terra-Gen, LLC: Key Details, (CEO, HQ, Revenue, Founded, No. of Employees, Company Type, Website, Business Segment)
Table 117 Terra-Gen, LLC: Product Benchmarking
Table 118 PT PERTAMINA: Key Details, (CEO, HQ, Revenue, Founded, No. of Employees, Company Type, Website, Business Segment)
Table 119 : Product Benchmarking
Table 120 PT Pertamina: Strategic Outlook
List of Figures
Figure 1 Geothermal Power Market Segmentation
Figure 2 Geothermal Power Market by Station Type: Market Attractiveness Index
Figure 3 Geothermal Power Market by Technology: Market Attractiveness Index
Figure 4 Geothermal Power Market by Component: Market Attractiveness Index
Figure 5 Geothermal Power Market by Resource Type: Market Attractiveness Index
Figure 6 Geothermal Power Market Attractiveness Index by Region
Figure 7 Geothermal Power Market: Market Dynamics
Figure 8 U.S. Tax Credits and Incentives, 2022
Figure 9 Geothermal Power Market: Porter’s Five Forces Analysis
Figure 10 Global Geothermal Power Market Share Forecast by COVID, 2023-2033 (%)
Figure 11 Global Geothermal Power Market by Region, 2023-2033 (US$ Bn, AGR (%)) (V-Shaped Recovery Scenario)
Figure 12 Global Geothermal Power Market by Region, 2023-2033 (US$ Bn, AGR (%)) (U-Shaped Recovery Scenario)
Figure 13 Global Geothermal Power Market by Region, 2023-2033 (US$ Bn, AGR (%)) (W-Shaped Recovery Scenario)
Figure 14 Global Geothermal Power Market by Region, 2023-2033 (US$ Bn, AGR (%)) (L-Shaped Recovery Scenario)
Figure 15 Geothermal Power Market: PEST Analysis
Figure 16 Geothermal Power Market by Station Type: Market Attractiveness Index
Figure 17 Global Geothermal Power Market by Station Type, 2023-2033 (US$ Bn, AGR (%))
Figure 18 Geothermal Power Market Share Forecast by Station Type, 2023, 2028, 2033 (%)
Figure 19 Dry Steam Power Stations Market by Region, 2023-2033 (US$ Bn, AGR (%))
Figure 20 Dry Steam Power Stations Market Share Forecast by Region, 2023 & 2033 (%)
Figure 21 Flash Steam Power Stations Market by Region, 2023-2033 (US$ Bn, AGR (%))
Figure 22 Flash Steam Power Stations Market Share Forecast by Region, 2023 & 2033 (%)
Figure 23 Binary Cycle Power Stations Market by Region, 2023-2033 (US$ Bn, AGR (%))
Figure 24 Binary Cycle Power Stations Market Share Forecast by Region, 2023 & 2033 (%)
Figure 25 Geothermal Power Market by Technology: Market Attractiveness Index
Figure 26 Global Geothermal Power Market by Technology, 2023-2033 (US$ Bn, AGR (%))
Figure 27 Geothermal Power Market Share Forecast by Technology, 2023, 2028, 2033 (%)
Figure 28 Ground Source Heat Pumps Market by Region, 2023-2033 (US$ Bn, AGR (%))
Figure 29 Ground Source Heat Pumps Market Share Forecast by Region, 2023 & 2033 (%)
Figure 30 Direct-Use Geothermal Market by Region, 2023-2033 (US$ Bn, AGR (%))
Figure 31 Direct-Use Geothermal Market Share Forecast by Region, 2023 & 2033 (%)
Figure 32 Deep Geothermal Systems Market by Region, 2023-2033 (US$ Bn, AGR (%))
Figure 33 Deep Geothermal Systems Market Share Forecast by Region, 2023 & 2033 (%)
Figure 34 Enhanced Geothermal Systems Market by Region, 2023-2033 (US$ Bn, AGR (%))
Figure 35 Enhanced Geothermal Systems Market Share Forecast by Region, 2023 & 2033 (%)
Figure 36 Geothermal Power Market by Component: Market Attractiveness Index
Figure 37 Global Geothermal Power Market by Components, 2023-2033 (US$ Bn, AGR (%))
Figure 38 Geothermal Power Market Share Forecast by Component, 2023, 2028, 2033 (%)
Figure 39 Turbines and Generators Market by Region, 2023-2033 (US$ Bn, AGR (%))
Figure 40 Turbines and Generators Market Share Forecast by Region, 2023 & 2033 (%)
Figure 41 Power Generation Equipment and Components Market by Region, 2023-2033 (US$ Bn, AGR (%))
Figure 42 Power Generation Equipment and Components Market Share Forecast by Region, 2023 & 2033 (%)
Figure 43 Heat Exchangers and Condensers Market by Region, 2023-2033 (US$ Bn, AGR (%))
Figure 44 Heat Exchangers and Condensers Market Share Forecast by Region, 2023 & 2033 (%)
Figure 45 Transmission and Grid Integration Market by Region, 2023-2033 (US$ Bn, AGR (%))
Figure 46 Transmission and Grid Integration Market Share Forecast by Region, 2023 & 2033 (%)
Figure 47 Other Components Market by Region, 2023-2033 (US$ Bn, AGR (%))
Figure 48 Other Components Market Share Forecast by Region, 2023 & 2033 (%)
Figure 49 Geothermal Power Market by Resource Type: Market Attractiveness Index
Figure 50 Global Geothermal Power Market by Resource Type, 2023-2033 (US$ Bn, AGR (%))
Figure 51 Geothermal Power Market Share Forecast by Resource Type, 2023, 2028, 2033 (%)
Figure 52 Convective Hydrothermal Market by Region, 2023-2033 (US$ Bn, AGR (%))
Figure 53 Convective Hydrothermal Market Share Forecast by Region, 2023 & 2033 (%)
Figure 54 Sedimentary Basin Market by Region, 2023-2033 (US$ Bn, AGR (%))
Figure 55 Sedimentary Basin Market Share Forecast by Region, 2023 & 2033 (%)
Figure 56 Geopressured Market by Region, 2023-2033 (US$ Bn, AGR (%))
Figure 57 Geopressured Market Share Forecast by Region, 2023 & 2033 (%)
Figure 58 Radiogenic Market by Region, 2023-2033 (US$ Bn, AGR (%))
Figure 59 Radiogenic Market Share Forecast by Region, 2023 & 2033 (%)
Figure 60 Solidified Hot Dry Rock Market by Region, 2023-2033 (US$ Bn, AGR (%))
Figure 61 Solidified Hot Dry Rock Market Share Forecast by Region, 2023 & 2033 (%)
Figure 62 Part Still Molten Magma Market by Region, 2023-2033 (US$ Bn, AGR (%))
Figure 63 Part Still Molten Magma Market Share Forecast by Region, 2023 & 2033 (%)
Figure 64 Geothermal Power Market Forecast by Region 2023 and 2033 (Revenue, CAGR%)
Figure 65 Geothermal Power Market Share Forecast by Region 2023, 2028, 2033 (%)
Figure 66 Geothermal Power Market by Region, 2023-2033 (US$ Billion, AGR %)
Figure 67 North & Central America & Central America Geothermal Power Market Attractiveness Index
Figure 68 North & Central America & Central America Geothermal Power Market by Region, 2023, 2028 & 2033 (US$ Billion)
Figure 69 North & Central America Geothermal Power Market by Value, 2023-2033 (US$ Bn, AGR (%))
Figure 70 North & Central America Geothermal Power Market by Country, 2023-2033 (US$ Bn, AGR (%))
Figure 71 North & Central America & Central America Geothermal Power Market Share Forecast by Country, 2023 & 2033 (%)
Figure 72 North & Central America Geothermal Power Market by Station Type, 2023-2033 (US$ Bn, AGR (%))
Figure 73 North & Central America & Central America Geothermal Power Market Share Forecast Station Type, 2023 & 2033 (%)
Figure 74 North & Central America Geothermal Power Market by Technology, 2023-2033 (US$ Bn, AGR (%))
Figure 75 North & Central America & Central America Geothermal Power Market Share Forecast by Technology, 2023 & 2033 (%)
Figure 76 North & Central America Geothermal Power Market by Components, 2023-2033 (US$ Bn, AGR (%))
Figure 77 North & Central America & Central America Geothermal Power Market Share Forecast by Component, 2023 & 2033 (%)
Figure 78 North & Central America Geothermal Power Market by Resource Type, 2023-2033 (US$ Bn, AGR (%))
Figure 79 North & Central America & Central America Geothermal Power Market Share Forecast by Resource Type, 2023 & 2033 (%)
Figure 80 U.S. Geothermal Power Market by Value, 2023-2033 (US$ Bn, AGR (%))
Figure 81 Central America Geothermal Power Market by Value, 2023-2033 (US$ Bn, AGR (%))
Figure 82 Europe Geothermal Power Market Attractiveness Index
Figure 83 Europe Geothermal Power Market by Region, 2023, 2028 & 2033 (US$ Billion)
Figure 84 Europe Geothermal Power Market by Value, 2023-2033 (US$ Bn, AGR (%))
Figure 85 Europe Geothermal Power Market by Country, 2023-2033 (US$ Bn, AGR (%))
Figure 86 Europe Geothermal Power Market Share Forecast by Country, 2023 & 2033 (%)
Figure 87 Europe Geothermal Power Market by Station Type, 2023-2033 (US$ Bn, AGR (%))
Figure 88 Europe Geothermal Power Market Share Forecast Station Type, 2023 & 2033 (%)
Figure 89 Europe Geothermal Power Market by Technology, 2023-2033 (US$ Bn, AGR (%))
Figure 90 Europe Geothermal Power Market Share Forecast by Technology, 2023 & 2033 (%)
Figure 91 Europe Geothermal Power Market by Components, 2023-2033 (US$ Bn, AGR (%))
Figure 92 Europe Geothermal Power Market Share Forecast by Component, 2023 & 2033 (%)
Figure 93 Europe Geothermal Power Market by Resource Type, 2023-2033 (US$ Bn, AGR (%))
Figure 94 Europe Geothermal Power Market Share Forecast by Resource Type, 2023 & 2033 (%)
Figure 95 Germany Geothermal Power Market by Value, 2023-2033 (US$ Bn, AGR (%))
Figure 96 Iceland Geothermal Power Market by Value, 2023-2033 (US$ Bn, AGR (%))
Figure 97 France Geothermal Power Market by Value, 2023-2033 (US$ Bn, AGR (%))
Figure 98 Italy Geothermal Power Market by Value, 2023-2033 (US$ Bn, AGR (%))
Figure 99 Russia Geothermal Power Market by Value, 2023-2033 (US$ Bn, AGR (%))
Figure 100 Rest of Europe Geothermal Power Market by Value, 2023-2033 (US$ Bn, AGR (%))
Figure 101 Asia-Pacific Geothermal Power Market Attractiveness Index
Figure 102 Asia-Pacific Geothermal Power Market by Region, 2023, 2028 & 2033 (US$ Billion)
Figure 103 Asia-Pacific Geothermal Power Market by Value, 2023-2033 (US$ Bn, AGR (%))
Figure 104 Asia-Pacific Geothermal Power Market by Country, 2023-2033 (US$ Bn, AGR (%))
Figure 105 Asia-Pacific Geothermal Power Market Share Forecast by Country, 2023 & 2033 (%)
Figure 106 Asia-Pacific Geothermal Power Market by Station Type, 2023-2033 (US$ Bn, AGR (%))
Figure 107 Asia-Pacific Geothermal Power Market Share Forecast Station Type, 2023 & 2033 (%)
Figure 108 Asia-Pacific Geothermal Power Market by Technology, 2023-2033 (US$ Bn, AGR (%))
Figure 109 Asia-Pacific Geothermal Power Market Share Forecast by Technology, 2023 & 2033 (%)
Figure 110 Asia-Pacific Geothermal Power Market by Components, 2023-2033 (US$ Bn, AGR (%))
Figure 111 Asia-Pacific Geothermal Power Market Share Forecast by Component, 2023 & 2033 (%)
Figure 112 Asia-Pacific Geothermal Power Market by Resource Type, 2023-2033 (US$ Bn, AGR (%))
Figure 113 Asia-Pacific Geothermal Power Market Share Forecast by Resource Type, 2023 & 2033 (%)
Figure 114 China Geothermal Power Market by Value, 2023-2033 (US$ Bn, AGR (%))
Figure 115 Indonesia Geothermal Power Market by Value, 2023-2033 (US$ Bn, AGR (%))
Figure 116 Japan Geothermal Power Market by Value, 2023-2033 (US$ Bn, AGR (%))
Figure 117 Philippines Geothermal Power Market by Value, 2023-2033 (US$ Bn, AGR (%))
Figure 118 New Zealand Geothermal Power Market by Value, 2023-2033 (US$ Bn, AGR (%))
Figure 119 Rest of Asia-Pacific Geothermal Power Market by Value, 2023-2033 (US$ Bn, AGR (%))
Figure 120 Middle East and Africa Geothermal Power Market Attractiveness Index
Figure 121 Middle East and Africa Geothermal Power Market by Region, 2023, 2028 & 2033 (US$ Billion)
Figure 122 Middle East & Africa Geothermal Power Market by Value, 2023-2033 (US$ Bn, AGR (%))
Figure 123 Middle East & Africa Geothermal Power Market by Country, 2023-2033 (US$ Bn, AGR (%))
Figure 124 Middle East and Africa Geothermal Power Market Share Forecast by Country, 2023 & 2033 (%)
Figure 125 Middle East & Africa Geothermal Power Market by Station Type, 2023-2033 (US$ Bn, AGR (%))
Figure 126 Middle East and Africa Geothermal Power Market Share Forecast Station Type, 2023 & 2033 (%)
Figure 127 Middle East & Africa Geothermal Power Market by Technology, 2023-2033 (US$ Bn, AGR (%))
Figure 128 Middle East and Africa Geothermal Power Market Share Forecast by Technology, 2023 & 2033 (%)
Figure 129 Middle East & Africa Geothermal Power Market by Components, 2023-2033 (US$ Bn, AGR (%))
Figure 130 Middle East and Africa Geothermal Power Market Share Forecast by Component, 2023 & 2033 (%)
Figure 131 Middle East & Africa Geothermal Power Market by Resource Type, 2023-2033 (US$ Bn, AGR (%))
Figure 132 Middle East and Africa Geothermal Power Market Share Forecast by Resource Type, 2023 & 2033 (%)
Figure 133 GCC Geothermal Power Market by Value, 2023-2033 (US$ Bn, AGR (%))
Figure 134 South Africa Geothermal Power Market by Value, 2023-2033 (US$ Bn, AGR (%))
Figure 135 Rest of Middle East & Africa Geothermal Power Market by Value, 2023-2033 (US$ Bn, AGR (%))
Figure 136 Latin America Geothermal Power Market Attractiveness Index
Figure 137 Latin America Geothermal Power Market by Region, 2023, 2028 & 2033 (US$ Billion)
Figure 138 Latin America Geothermal Power Market by Value, 2023-2033 (US$ Bn, AGR (%))
Figure 139 Latin America Geothermal Power Market by Country, 2023-2033 (US$ Bn, AGR (%))
Figure 140 Latin America Geothermal Power Market Share Forecast by Country, 2023 & 2033 (%)
Figure 141 Latin America Geothermal Power Market by Station Type, 2023-2033 (US$ Bn, AGR (%))
Figure 142 Latin America Geothermal Power Market Share Forecast Station Type, 2023 & 2033 (%)
Figure 143 Latin America Geothermal Power Market by Technology, 2023-2033 (US$ Bn, AGR (%))
Figure 144 Latin America Geothermal Power Market Share Forecast by Technology, 2023 & 2033 (%)
Figure 145 Latin America Geothermal Power Market by Components, 2023-2033 (US$ Bn, AGR (%))
Figure 146 Latin America Geothermal Power Market Share Forecast by Component, 2023 & 2033 (%)
Figure 147 Latin America Geothermal Power Market by Resource Type, 2023-2033 (US$ Bn, AGR (%))
Figure 148 Latin America Geothermal Power Market Share Forecast by Resource Type, 2023 & 2033 (%)
Figure 149 Chile Geothermal Power Market by Value, 2023-2033 (US$ Bn, AGR (%))
Figure 150 Mexico Geothermal Power Market by Value, 2023-2033 (US$ Bn, AGR (%))
Figure 151 Rest of Latin America Geothermal Power Market by Value, 2023-2033 (US$ Bn, AGR (%))
Figure 152 Geothermal Power Market: Company Share, 2022
Figure 153 Atlas Copco Group.: Net Revenue, 2018-2022 (US$ Million, AGR%)
Figure 154 Atlas Copco Group.: R&D, 2018-2022 (US$ Million, AGR%)
Figure 155 Atlas Copco Group.: Regional Revenue Share, 2022 (%)
Figure 156 Atlas Copco Group.: Business Segment Revenue Share, 2022 (%)
Figure 157 Chevron Corporation.: Net Revenue, 2018-2022 (US$ Million, AGR%)
Figure 158 Chevron Corporation.: R&D, 2018-2022 (US$ Million, AGR%)
Figure 159 Chevron Corporation.: Regional Revenue Share, 2022 (%)
Figure 160 Chevron Corporation.: Business Segment Revenue Share, 2022 (%)
Figure 161 General Electric Company.: Net Revenue, 2018-2022 (US$ Million, AGR%)
Figure 162 General Electric Company.: R&D, 2018-2022 (US$ Million, AGR%)
Figure 163 General Electric Company.: Regional Revenue Share, 2022 (%)
Figure 164 General Electric Company.: Business Segment Revenue Share, 2022 (%)
Figure 165 Haliburton Corporation.: Net Revenue, 2018-2022 (US$ Million, AGR%)
Figure 166 Haliburton Corporation.: R&D, 2018-2022 (US$ Million, AGR%)
Figure 167 Haliburton Corporation.: Regional Revenue Share, 2022 (%)
Figure 168 Haliburton Corporation.: Business Segment Revenue Share, 2022 (%)
Figure 169 Mitsubishi Corporation.: Net Revenue, 2018-2022 (US$ Million, AGR%)
Figure 170 Mitsubishi Corporation.: Regional Revenue Share, 2022 (%)
Figure 171 Mitsubishi Corporation.: Business Segment Revenue Share, 2022 (%)
Figure 172 Toshiba Corporation.: Net Revenue, 2018-2022 (US$ Million, AGR%)
Figure 173 Toshiba Corporation.: R&D, 2018-2022 (US$ Million, AGR%)
Figure 174 Toshiba Corporation.: Regional Revenue Share, 2022 (%)
Figure 175 Toshiba Corporation.: Business Segment Revenue Share, 2022 (%)
Figure 176 Enel S.p.A.: Net Revenue, 2018-2022 (US$ Million, AGR%)
Figure 177 Enel S.p.A.: Regional Revenue Share, 2022 (%)
Figure 178 Enel S.p.A.: Business Segment Revenue Share, 2022 (%)
Figure 179 Innergex Renewable Energy.: Net Revenue, 2018-2022 (US$ Million, AGR%)
Figure 180 Innergex Renewable Energy.: Regional Revenue Share, 2022 (%)
Figure 181 Innergex Renewable Energy.: Business Segment Revenue Share, 2022 (%)
Figure 182 Ormat Technologies, Inc.: Net Revenue, 2018-2022 (US$ Million, AGR%)
Figure 183 Ormat Technologies, Inc.: R&D, 2018-2022 (US$ Million, AGR%)
Figure 184 Ormat Technologies, Inc.: Regional Revenue Share, 2022 (%)
Figure 185 Ormat Technologies, Inc.: Business Segment Revenue Share, 2022 (%)
ページTOPに戻る
よくあるご質問
Visiongain社はどのような調査会社ですか?
英国の調査会社ヴィジョンゲイン社(Visiongain)は、通信とエネルギーのほか、自動車や化学・医薬品、金属など、広範な市場を対象に調査を行っています。自動車市場については、市場全般に関する調査のほ... もっと見る
調査レポートの納品までの日数はどの程度ですか?
在庫のあるものは速納となりますが、平均的には 3-4日と見て下さい。
但し、一部の調査レポートでは、発注を受けた段階で内容更新をして納品をする場合もあります。
発注をする前のお問合せをお願いします。
注文の手続きはどのようになっていますか?
1)お客様からの御問い合わせをいただきます。
2)見積書やサンプルの提示をいたします。
3)お客様指定、もしくは弊社の発注書をメール添付にて発送してください。
4)データリソース社からレポート発行元の調査会社へ納品手配します。
5) 調査会社からお客様へ納品されます。最近は、pdfにてのメール納品が大半です。
お支払方法の方法はどのようになっていますか?
納品と同時にデータリソース社よりお客様へ請求書(必要に応じて納品書も)を発送いたします。
お客様よりデータリソース社へ(通常は円払い)の御振り込みをお願いします。
請求書は、納品日の日付で発行しますので、翌月最終営業日までの当社指定口座への振込みをお願いします。振込み手数料は御社負担にてお願いします。
お客様の御支払い条件が60日以上の場合は御相談ください。
尚、初めてのお取引先や個人の場合、前払いをお願いすることもあります。ご了承のほど、お願いします。
データリソース社はどのような会社ですか?
当社は、世界各国の主要調査会社・レポート出版社と提携し、世界各国の市場調査レポートや技術動向レポートなどを日本国内の企業・公官庁及び教育研究機関に提供しております。
世界各国の「市場・技術・法規制などの」実情を調査・収集される時には、データリソース社にご相談ください。
お客様の御要望にあったデータや情報を抽出する為のレポート紹介や調査のアドバイスも致します。
|
|


