免疫腫瘍学臨床試験市場レポート:2023-2033
Immuno-Oncology Clinical Trials Market Report 2023-2033
レポート詳細
免疫腫瘍学臨床試験市場レポート 2023-2033 :本レポートは、新たな収益の柱を目指す大手企業にとって、業界とその根底にある力学をより深く理解する上で貴重なものとなるだろう。また、... もっと見る
※上記価格は部署ライセンス(Departmental licence)価格です。
その他の価格についてはデータリソースまでお問合せください。
日本語のページは自動翻訳を利用し作成しています。
実際のレポートは英文のみでご納品いたします。

|

|
サマリー
レポート詳細
免疫腫瘍学臨床試験市場レポート 2023-2033:本レポートは、新たな収益の柱を目指す大手企業にとって、業界とその根底にある力学をより深く理解する上で貴重なものとなるだろう。また、異業種への進出や既存事業の新地域への展開を目指す企業にとっても有用なものとなるでしょう。
インターベンショナル免疫腫瘍臨床試験の増加が市場成長を牽引
薬や医療技術のような新しい介入を評価する臨床試験は介入試験として知られている。免疫腫瘍学の臨床試験では、がんに対する全く新しい免疫療法の有効性が評価される。さらに、インターベンショナル・ラジオロジストは、病気を治すための腫瘍内焼灼術や、さまざまな経動脈的肝内治療法のための新しい手技や機器を開発し、患者の治療成績を絶えず向上させている。インターベンショナル・ラジオロジストは、免疫増強につながる治療を行い、切除術(ラジオ波やマイクロ波による焼灼術)や塞栓術などの免疫療法の役割を強化している。
2023年1月現在、インターベンショナル免疫腫瘍学の臨床試験件数は7,000件を超えている。これらの臨床試験のうち3,000件以上が第III相試験である。メラノーマ、NSCLC、結腸直腸癌は、免疫腫瘍学の臨床試験で最も頻繁に検討されている癌種である。チェックポイント阻害剤、CAR T細胞、オンコライトウイルスが、免疫腫瘍学の臨床試験で最も頻繁に検討されている免疫療法である。
深刻な問題と多額の医療費が業界の成長を阻む可能性
免疫療法は、がん細胞と闘うために身体の免疫系を利用する比較的最近のがん治療法である。高価ではあるが、いくつかの腫瘍の治療において大きな可能性を示している。免疫療法が高額であることにはいくつかの要因がある。免疫療法は複雑な治療法であり、多くの研究開発が必要である。第二に、製造が困難で高価な生物学的製剤を使用することが多い。第三に、免疫療法は需要が高いため、コストが高くなる。多くのがん患者は、免疫療法が高額であるために、免疫療法を受けることが困難であると感じるかもしれない。例えば、免疫療法は米国では通常年間10万ドル以上かかる。
さらに、医療費の高騰は世界中の患者にとって大きな問題である。コスト削減と価値の実証に対する強いプレッシャーがある。利用しやすい薬剤の不足は、低開発国の人々の健康に影響を与え、平均寿命を縮めている。免疫療法には、患者一人当たり平均年間10万ドル以上の費用がかかることが多く、医療保険の価値を考慮すると、この費用は患者一人当たり85万ドルにまで上昇する。免疫腫瘍治療の価格が高いため、免疫腫瘍治療薬の市場は緩やかに拡大すると予測されている。
市場調査レポートを購入する前にすべき質問とは?
市場調査レポートを購入する前にすべき質問とは?
- 免疫腫瘍学臨床試験市場はどのように進化しているのか?
- 免疫腫瘍学臨床試験市場の促進要因と抑制要因は何か?
- 免疫腫瘍学臨床試験の各サブ市場セグメントは予測期間中にどのように成長し、2033年にはどれくらいの売上高を占めるようになるのか?
- 2023年から2033年にかけて、免疫腫瘍学臨床試験の各サブマーケットの市場シェアはどのように推移するのか?
- 2023年から2033年にかけて市場全体を牽引する主な要因は何か?
- 主要な免疫腫瘍学臨床試験市場はマクロ経済の動きに概ね追随するのか、それとも個々の国市場が他を凌駕するのか。
- 2033年までに各国市場のシェアはどのように変化し、2033年に市場をリードするのはどの地域か?
- 主要プレイヤーは誰で、予測期間中の見通しは?
- 主要企業の免疫腫瘍学臨床試験プロジェクトは?
- 2023年から2033年にかけて、業界はどのように発展していくのか?現在および今後10年間に実施される免疫腫瘍学臨床試験プロジェクトにはどのような意味があるのか?
- 免疫腫瘍学臨床試験市場をさらに拡大するために、製品の商業化の必要性は高まっているか?
- 免疫腫瘍学臨床試験市場はどこに向かっているのか、そしてどのようにすれば市場の最前線に立つことができるのか?
- 新製品や新サービスへの最適な投資方法とは?
- 企業を新たな成長軌道に乗せ、C-suiteに移行させるための重要な展望とは?
このことが、現在および今後10年間の免疫腫瘍学臨床試験市場にどのような影響を与えるかを知る必要がある:
- 249ページにわたる本レポートでは、96の表と145の図表を掲載しています。
- 本レポートでは、業界における主要な有利分野を取り上げているため、今すぐターゲットを絞ることができます。
- 世界、地域、国の売上と成長に関する詳細な分析が含まれています。
- 競合他社が成功した主なトレンド、変化、収益予測をハイライトしています。
本レポートは、免疫腫瘍臨床試験市場が今後10年間にどのように発展し、COVID-19の景気後退と好転の変動にどのように対応していくかをお伝えします。この市場は過去10年間のどの時点よりも今が重要である。
2033年までの予測やその他の分析から、商業的な展望が明らかになる
- 2033年までの収益予測に加え、直近の業績、成長率、市場シェアもご覧いただけます。
- ビジネスの展望と展開に関する独自の分析をご覧いただけます。
- 定性的分析(市場ダイナミクス、促進要因、機会、阻害要因、課題を含む)、コスト構造、免疫腫瘍臨床試験価格上昇の影響、最近の動向をご覧いただけます。
本レポートには、COVID-19が業界と貴社にどのような影響を与えるかについてのデータ分析と貴重な洞察が含まれている。本レポートでは、COVID-19の4つの回収パターンとその影響、すなわち「V」、「L」、「W」、「U」について論じている。
レポート対象セグメント
フェーズ
- フェーズ I
- フェーズ II
- フェーズ III
- フェーズ IV
デザイン
- 介入試験
- 観察試験
- 拡張アクセス試験
適応症
- 固形がん
- 血液がん
世界市場全体とセグメント別の収益予測に加え、5つの地域と20の主要国市場の収益予測も掲載しています:
北米
- アメリカ
- カナダ
欧州
- ドイツ
- 英国
- フランス
- スペイン
- イタリア
- その他の欧州
アジア太平洋
- 中国
- 日本
- インド
- オーストラリア
- 韓国
- その他のアジア太平洋地域
ラテンアメリカ
- ブラジル
- メキシコ
- その他のラテンアメリカ
MEA
- GCC
- 南アフリカ
- その他のMEA
このレポートには、2023年から2033年までの免疫腫瘍学臨床試験市場における主要企業のプロファイルも含まれており、これらの企業の事業のこのセグメントに焦点を当てている。
主要企業と市場成長の可能性
・ AstraZeneca plc
・ BioNTech SE
・ Bristol-Myers Squibb Company
・ Exscientia plc
・ F. Hoffmann-La Roche AG
・ ICON plc
・ IO Biotech, Inc.
・ IQVIA Inc.
・ Medpace, Inc.
・ Merck & Co., Inc.
・ Novartis AG
・ Pfizer Inc.
・ Syneos Health
2023年から2033年にかけての免疫腫瘍学臨床試験市場全体の世界売上高は、金額ベースで2023年に68億米ドルを突破すると弊社では予測しています。2033年まで収益が力強く成長すると予測。本調査では、最も大きな可能性を秘めた組織を特定します。彼らの能力、進歩、商業的展望を発見し、一歩先を行くお手伝いをします。
免疫腫瘍学臨床試験市場、2023-2033年レポートはどのようにお役に立ちますか?
要約すると、240ページを超えるこのレポートは、以下の知識を提供する:
- 免疫腫瘍学臨床試験市場の2023年から2033年までの収益予測、フェーズ、デザイン、適応症の各予測を世界および地域レベルで掲載 - 業界の展望を発見し、投資と収益に最も有利な場所を見つけることができます。
- 5つの地域と20の主要国市場の2033年までの収益予測 - 北米、欧州、アジア太平洋、ラテンアメリカ、MEAの免疫腫瘍臨床試験市場2023年から2033年までの市場予測をご覧ください。また、米国、カナダ、メキシコ、ブラジル、ドイツ、フランス、英国、イタリア、中国、インド、日本、オーストラリアなどの主要国の市場も予測しています。
- 2023年から2033年までの免疫腫瘍学臨床試験市場に関わるメルク社、ブリストル・マイヤーズ スクイブ社、ノバルティス社、アストラゼネカ社、F.ホフマン・ラ・ロシュ社などの企業プロフィールを含む。
独自の予測による定量的・定性的分析をご覧ください。私たちのレポートだけに含まれる情報を入手し、貴重なビジネスインテリジェンスで情報を得ることができます。
他にはない情報
私たちの新しいレポートがあれば、知識に遅れをとったり、チャンスを逃したりする可能性が低くなります。Visiongainの調査レポートが貴社の調査、分析、意思決定にどのように役立つかをご覧ください。Visiongainの調査は、免疫腫瘍学臨床試験市場、2023年から2033年、市場をリードする企業の商業分析を必要とするすべての人のためのものです。データ、トレンド、予測をご覧いただけます。
ページTOPに戻る
目次
目次
1 レポート概要
1.1 研究の目的
1.2 免疫腫瘍学臨床試験市場の紹介
1.3 本レポートの内容
1.4 本レポートを読むべき理由
1.5 本分析レポートが回答する主な質問
1.6 本レポートの対象者
1.7 方法論
1.7.1 市場の定義
1.7.2 市場評価・予測手法
1.7.3 データの検証
1.7.3.1 一次調査
1.7.3.2 セカンダリーリサーチ
1.8 よくある質問(FAQ)
1.9 Visiongainの関連レポート
1.10 Visiongainについて
2 エグゼクティブ・サマリー
3 市場概要
3.1 主要な調査結果
3.2 市場ダイナミクス
3.2.1 市場促進要因
3.2.1.1 がん患者の増加により、バイオテクノロジー企業や製薬会社は免疫腫瘍臨床試験の実施を余儀なくされている
3.2.1.2 免疫腫瘍薬に対する薬事承認の増加
3.2.1.3 ヘルスケアの研究開発への投資拡大
3.2.2 市場抑制要因
3.2.2.1 深刻な問題と多額の医療費
3.2.2.2 規制上の課題
3.2.2.3 多様性の欠如
3.2.3 市場機会
3.2.3.1 有益な機会を提供するパートナーシップとコラボレーションの可能性
3.2.3.2 免疫腫瘍薬の臨床研究の増加
3.3 ポーターのファイブフォース分析
3.4 PEST分析
3.5 COVID-19影響分析
4 免疫腫瘍臨床試験市場分析:フェーズ別
4.1 主な調査結果
4.2 フェーズセグメント 市場魅力度指数
4.3 フェーズ別免疫腫瘍臨床試験市場規模の推定と予測
4.4 フェーズI
4.4.1 2023〜2033年の地域別市場規模(US$ Million)
4.4.2 地域別市場シェア、2023年・2033年(%)
4.5 フェーズII
4.5.1 2023年~2033年の地域別市場規模(US$ Million)
4.5.2 地域別市場シェア、2023年・2033年 (%)
4.6 フェーズ III
4.6.1 2023年~2033年の地域別市場規模(US$ Million)
4.6.2 地域別市場シェア、2023年・2033年(%)
4.7 フェーズⅣ
4.7.1 2023〜2033年の地域別市場規模(US$ Million)
4.7.2 地域別市場シェア、2023年・2033年(%)
5 免疫腫瘍臨床試験市場分析:デザイン別
5.1 主な調査結果
5.2 デザインセグメント 市場魅力度指数
5.3 デザイン別免疫腫瘍臨床試験市場規模推定と予測
5.4 インターベンショナル試験
5.4.1 2023〜2033年の地域別市場規模(US$ Million)
5.4.2 地域別市場シェア、2023年・2033年(%)
5.5 観察試験
5.5.1 2023~2033年の地域別市場規模(US$ Million)
5.5.2 地域別市場シェア、2023年・2033年(%)
5.6 拡張アクセス試験
5.6.1 2023~2033年の地域別市場規模(US$ Million)
5.6.2 地域別市場シェア、2023年・2033年(%)
6 免疫腫瘍臨床試験市場分析:適応症別
6.1 主な調査結果
6.2 適応症セグメント 市場魅力度指数
6.3 適応症別免疫腫瘍臨床試験市場規模の推定と予測
6.4 固形がん
6.4.1 2023〜2033年の地域別市場規模(US$ Million)
6.4.2 地域別市場シェア、2023年・2033年(%)
6.5 血液がん
6.5.1 2023〜2033年の地域別市場規模(US$ Million)
6.5.2 地域別市場シェア、2023年・2033年(%)
7 免疫腫瘍学臨床試験市場分析:地域別
7.1 主要な調査結果
7.2 地域別市場規模の推定と予測
8 北米の免疫腫瘍臨床試験市場分析
8.1 主要な調査結果
8.2 北米の免疫腫瘍学臨床試験市場魅力度指数
8.3 北米の免疫腫瘍学臨床試験国別市場、2023年、2028年、2033年(US$ Million)
8.4 北米の免疫腫瘍学臨床試験市場規模推定と予測:国別
8.5 北米の免疫腫瘍学臨床試験市場規模推定と予測:フェーズ別
8.6 北米の免疫腫瘍学臨床試験市場規模推定と予測:デザイン別
8.7 北米の免疫腫瘍学臨床試験市場規模推定と予測:適応症別
8.8 米国の免疫腫瘍学臨床試験市場分析
8.9 カナダの免疫腫瘍学臨床試験市場分析
9 欧州の免疫腫瘍臨床試験市場分析
9.1 主要な調査結果
9.2 欧州免疫腫瘍臨床試験市場魅力度指数
9.3 欧州の免疫腫瘍学臨床試験国別市場、2023年、2028年、2033年(US$ Million)
9.4 欧州の免疫腫瘍学臨床試験市場規模推定と予測:国別
9.5 欧州の免疫腫瘍学臨床試験市場規模推定と予測:フェーズ別
9.6 欧州の免疫腫瘍学臨床試験市場規模推定と予測:デザイン別
9.7 欧州の免疫腫瘍学臨床試験市場規模推定と予測:適応症別
9.8 ドイツの免疫腫瘍学臨床試験市場分析
9.9 イギリスの免疫腫瘍学臨床試験市場分析
9.10 フランスの免疫腫瘍学臨床試験市場の分析
9.11 イタリアの免疫腫瘍学臨床試験市場の分析
9.12 スペインの免疫腫瘍学臨床試験市場の分析
9.13 その他の欧州の免疫腫瘍学臨床試験市場の分析
10 アジア太平洋地域の免疫腫瘍臨床試験市場分析
10.1 主要な調査結果
10.2 アジア太平洋地域の免疫腫瘍臨床試験市場魅力度指数
10.3 アジア太平洋地域の免疫腫瘍学臨床試験国別市場、2023年、2028年、2033年(US$ Million)
10.4 アジア太平洋地域の免疫腫瘍学臨床試験市場規模推定と予測:国別
10.5 アジア太平洋地域の免疫腫瘍学臨床試験市場規模推定と予測:フェーズ別
10.6 アジア太平洋地域の免疫腫瘍学臨床試験市場規模推定と予測:デザイン別
10.7 アジア太平洋地域の免疫腫瘍学臨床試験市場規模推定と予測:適応症別
10.8 中国の免疫腫瘍学臨床試験市場分析
10.9 日本の免疫腫瘍学臨床試験市場分析
10.10 インドの免疫腫瘍学臨床試験市場分析
10.11 オーストラリアの免疫腫瘍学臨床試験市場分析
10.12 韓国の免疫腫瘍学臨床試験市場の分析
10.13 その他のアジア太平洋地域の免疫腫瘍学臨床試験市場分析
11 ラテンアメリカの免疫腫瘍臨床試験市場分析
11.1 主要な調査結果
11.2 ラテンアメリカの免疫腫瘍臨床試験市場魅力度指数
11.3 ラテンアメリカの免疫腫瘍臨床試験国別市場、2023年、2028年、2033年(US$ Million)
11.4 ラテンアメリカの免疫腫瘍学臨床試験市場規模推定と予測:国別
11.5 ラテンアメリカの免疫腫瘍学臨床試験市場規模推定と予測:フェーズ別
11.6 ラテンアメリカの免疫腫瘍学臨床試験市場規模推定と予測:デザイン別
11.7 ラテンアメリカの免疫腫瘍学臨床試験市場規模推定と予測:適応症別
11.8 ブラジルの免疫腫瘍学臨床試験市場分析
11.9 メキシコの免疫腫瘍学臨床試験市場分析
11.10 その他のラテンアメリカの免疫腫瘍学臨床試験市場分析
12 MEA免疫腫瘍臨床試験市場の分析
12.1 主要な調査結果
12.2 MEA免疫腫瘍臨床試験市場魅力度指数
12.3 MEAの免疫腫瘍臨床試験国別市場、2023年、2028年、2033年(US$ Million)
12.4 MEAの免疫腫瘍学臨床試験市場規模推定と予測:国別
12.5 MEAの免疫腫瘍学臨床試験市場規模推定と予測:フェーズ別
12.6 MEAの免疫腫瘍学臨床試験市場規模推定と予測:デザイン別
12.7 MEAの免疫腫瘍学臨床試験市場規模推定と予測:適応症別
12.8 南アフリカの免疫腫瘍学臨床試験市場分析
12.9 GCCの免疫腫瘍学臨床試験市場分析
12.10 その他のMEA免疫腫瘍学臨床試験市場分析
13 企業のプロフィール
13.1 競争環境
13.2 戦略的展望
13.3 Merck & Co., Inc.
13.3.1 会社概要
13.3.2 会社概要
13.3.3 財務分析
13.3.3.1 純収入、2017-2022年
13.3.3.2 売上高、2017-2022年
13.3.3.3 地域市場シェア、2022年
13.3.4 製品ベンチマーク
13.3.5 戦略的展望
13.4 Bristol-Myers Squibb Company
13.4.1 会社概要
13.4.2 会社概要
13.4.3 財務分析
13.4.3.1 純収入、2017-2022年
13.4.3.2 R&D、2017-2022年
13.4.3.3 地域市場シェア、2022年
13.4.4 製品ベンチマーク
13.4.5 戦略的展望
13.5 Medpace, Inc.
13.5.1 会社概要
13.5.2 会社概要
13.5.3 財務分析
13.5.3.1 純収入、2017-2022年
13.5.4 製品ベンチマーク
13.5.5 戦略的展望
13.6 Novartis AG
13.6.1 会社概要
13.6.2 会社概要
13.6.3 財務分析
13.6.3.1 純収入、2017-2022年
13.6.3.2 R&D、2017-2022年
13.6.3.3 地域市場シェア、2022年
13.6.4 製品ベンチマーク
13.6.5 戦略的展望
13.7 AstraZeneca plc
13.7.1 会社概要
13.7.2 会社概要
13.7.3 財務分析
13.7.3.1 純収入、2017-2022年
13.7.3.2 R&D、2017年〜2022年
13.7.3.3 地域市場シェア、2022年
13.7.4 製品ベンチマーク
13.8 BioNTech SE
13.8.1 会社概要
13.8.2 会社概要
13.8.3 財務分析
13.8.3.1 純収入、2017-2022年
13.8.3.2 売上高、2017-2022年
13.8.4 製品ベンチマーク
13.8.5 戦略的展望
13.9 Exscientia plc
13.9.1 会社概要
13.9.2 会社概要
13.9.3 財務分析
13.9.3.1 純収入、2020-2022年
13.9.3.2 R&D、2020-2022年
13.9.3.3 地域市場シェア、2022年
13.9.4 製品ベンチマーク
13.9.5 戦略的展望
13.10 F. Hoffmann-La Roche AG
13.10.1 会社概要
13.10.2 会社概要
13.10.3 財務分析
13.10.3.1 純収入、2017-2022年
13.10.3.2 R&D、2017年〜2022年
13.10.3.3 地域市場シェア、2022年
13.10.4 製品ベンチマーク
13.10.5 戦略的展望
13.11 Pfizer Inc.
13.11.1 会社概要
13.11.2 会社概要
13.11.3 財務分析
13.11.3.1 純収入、2017-2022年
13.11.3.2 R&D、2017-2022年
13.11.3.3 地域市場シェア、2022年
13.11.4 製品ベンチマーク
13.11.5 戦略的展望
13.12 Syneos Health
13.12.1 会社概要
13.12.2 会社概要
13.12.3 財務分析
13.12.3.1 純収入、2017-2022年
13.12.3.2 地域市場シェア、2021年
13.12.4 製品ベンチマーク
13.12.5 戦略的展望
13.13 IO Biotech, Inc.
13.13.1 会社概要
13.13.2 会社概要
13.13.3 製品ベンチマーク
13.13.4 戦略的展望
13.14 ICON plc
13.14.1 会社概要
13.14.2 会社概要
13.14.3 財務分析
13.14.3.1 純収入、2017-2022年
13.14.3.2 地域市場シェア、2022年
13.14.4 製品ベンチマーク
13.15 IQVIA Inc.
13.15.1 会社概要
13.15.2 会社概要
13.15.3 財務分析
13.15.3.1 純収入、2017-2022年
13.15.3.2 R&D、2017-2022年
13.15.3.3 地域市場シェア、2022年
13.15.4 製品ベンチマーク
14 結論と提言
14.1 Visiongainからの結びの言葉
14.2 市場プレイヤーへの提言
ページTOPに戻る
図表リスト
表の一覧
Table 1 Immuno Oncology Clinical Trials Market Snapshot, 2023 & 2033 (US$ Million, CAGR %)
Table 2 Regulatory Approval, 2022
Table 3 Immuno Oncology Clinical Trials Market Forecast by Region, 2023-2033 (US$ Million, AGR%): “V” Shaped Recovery
Table 4 Immuno Oncology Clinical Trials Market Forecast by Region, 2023-2033 (US$ Million, AGR%): “U” Shaped Recovery
Table 5 Immuno Oncology Clinical Trials Market Forecast by Region, 2023-2033 (US$ Million, AGR%): “W” Shaped Recovery
Table 6 Immuno Oncology Clinical Trials Market Forecast by Region, 2023-2033 (US$ Million, CAGR%): “L” Shaped Recovery
Table 7 Immuno Oncology Clinical Trials Market Forecast by Phase, 2023-2033 (US$ Million, CAGR %)
Table 8 Phase I Segment Market Forecast by Region, 2023-2033 (US$ Million, CAGR%)
Table 9 Phase II Segment Market Forecast by Region, 2023-2033 (US$ Million, CAGR%)
Table 10 Phase III Segment Market Forecast by Region, 2023-2033 (US$ Million, CAGR%)
Table 11 Phase IV Segment Market Forecast by Region, 2023-2033 (US$ Million, CAGR%)
Table 12 Immuno Oncology Clinical Trials Market Forecast by Design, 2023-2033 (US$ Million, CAGR %)
Table 13 Interventional Trials Segment Market Forecast by Region, 2023-2033 (US$ Million, CAGR%)
Table 14 Observational Trials Segment Market Forecast by Region, 2023-2033 (US$ Million, CAGR%)
Table 15 Expanded Access Trials Segment Market Forecast by Region, 2023-2033 (US$ Million, CAGR%)
Table 16 Immuno Oncology Clinical Trials Market Forecast by Indication, 2023-2033 (US$ Million, CAGR %)
Table 17 Solid Tumours Segment Market Forecast by Region, 2023-2033 (US$ Million, CAGR%)
Table 18 Hematological Cancer Segment Market Forecast by Region, 2023-2033 (US$ Million, CAGR %)
Table 19 Immuno Oncology Clinical Trials Market Forecast by Region, 2023-2033 (US$ Million, AGR %)
Table 20 North America Immuno Oncology Clinical Trials Market Forecast by Country, 2023-2033 (US$ Million, CAGR %)
Table 21 North America Immuno Oncology Clinical Trials Market Forecast by Phase, 2023-2033 (US$ Million, CAGR %)
Table 22 Immuno Oncology Clinical Trials Market Forecast by Design, 2023-2033 (US$ Million, CAGR %)
Table 23 North America Immuno Oncology Clinical Trials Market Forecast by Indication, 2023-2033 (US$ Million, CAGR %)
Table 24 U.S. Immuno Oncology Clinical Trials Market Forecast, 2023-2033 (US$ Million, CAGR %)
Table 25 Canada Immuno Oncology Clinical Trials Market Forecast, 2023-2033 (US$ Million, CAGR %)
Table 26 Europe Immuno Oncology Clinical Trials Market Forecast by Country, 2023-2033 (US$ Million, CAGR %)
Table 27 Europe Immuno Oncology Clinical Trials Market Forecast by Phase, 2023-2033 (US$ Million, CAGR %)
Table 28 Europe Immuno Oncology Clinical Trials Market Forecast by Design, 2023-2033 (US$ Million, CAGR %)
Table 29 Europe Immuno Oncology Clinical Trials Market Forecast by Indication, 2023-2033 (US$ Million, CAGR %)
Table 30 Germany Immuno Oncology Clinical Trials Market Forecast, 2023-2033 (US$ Million, CAGR %)
Table 31 UK Immuno Oncology Clinical Trials Market Forecast, 2023-2033 (US$ Million, CAGR %)
Table 32 France Immuno Oncology Clinical Trials Market Forecast, 2023-2033 (US$ Million, CAGR %)
Table 33 Italy Immuno Oncology Clinical Trials Market Forecast, 2023-2033 (US$ Million, CAGR %)
Table 34 Spain Immuno Oncology Clinical Trials Market Forecast, 2023-2033 (US$ Million, CAGR %)
Table 35 Rest of Europe Immuno Oncology Clinical Trials Market Forecast, 2023-2033 (US$ Million, CAGR %)
Table 36 Asia Pacific Immuno Oncology Clinical Trials Market Forecast by Country, 2023-2033 (US$ Million, CAGR %)
Table 37 Asia Pacific Immuno Oncology Clinical Trials Market Forecast by Phase, 2023-2033 (US$ Million, CAGR %)
Table 38 Asia Pacific Immuno Oncology Clinical Trials Market Forecast by Design, 2023-2033 (US$ Million, CAGR %)
Table 39 Asia Pacific Immuno Oncology Clinical Trials Market Forecast by Indication, 2023-2033 (US$ Million, CAGR %)
Table 40 China Immuno Oncology Clinical Trials Market Forecast, 2023-2033 (US$ Million, CAGR %)
Table 41 Japan Immuno Oncology Clinical Trials Market Forecast, 2023-2033 (US$ Million, CAGR %)
Table 42 India Immuno Oncology Clinical Trials Market Forecast, 2023-2033 (US$ Million, CAGR %)
Table 43 Australia Immuno Oncology Clinical Trials Market Forecast, 2023-2033 (US$ Million, CAGR %)
Table 44 South Korea Immuno Oncology Clinical Trials Market Forecast, 2023-2033 (US$ Million, CAGR %)
Table 45 Rest of Asia Pacific Immuno Oncology Clinical Trials Market Forecast, 2023-2033 (US$ Million, CAGR %)
Table 46 Latin America Immuno Oncology Clinical Trials Market Forecast by Country, 2023-2033 (US$ Million, CAGR %)
Table 47 Latin America Immuno Oncology Clinical Trials Market Forecast by Phase, 2023-2033 (US$ Million, CAGR %)
Table 48 Latin America Immuno Oncology Clinical Trials Market Forecast by Design, 2023-2033 (US$ Million, CAGR %)
Table 49 Latin America Immuno Oncology Clinical Trials Market Forecast by Indication, 2023-2033 (US$ Million, CAGR %)
Table 50 Brazil Immuno Oncology Clinical Trials Market Forecast, 2023-2033 (US$ Million, CAGR %)
Table 51 Mexico Immuno Oncology Clinical Trials Market Forecast, 2023-2033 (US$ Million, CAGR %)
Table 52 Rest of Latin America Immuno Oncology Clinical Trials Market Forecast, 2023-2033 (US$ Million, CAGR %)
Table 53 MEA Immuno Oncology Clinical Trials Market Forecast by Country, 2023-2033 (US$ Million, CAGR %)
Table 54 MEA Immuno Oncology Clinical Trials Market Forecast by Phase, 2023-2033 (US$ Million, CAGR %)
Table 55 MEA Immuno Oncology Clinical Trials Market Forecast by Design, 2023-2033 (US$ Million, CAGR %)
Table 56 MEA Immuno Oncology Clinical Trials Market Forecast by Indication, 2023-2033 (US$ Million, CAGR %)
Table 57 South Africa Immuno Oncology Clinical Trials Market Forecast, 2023-2033 (US$ Million, CAGR %)
Table 58 GCC Immuno Oncology Clinical Trials Market Forecast, 2023-2033 (US$ Million, CAGR %)
Table 59 Rest of MEA Immuno Oncology Clinical Trials Market Forecast, 2023-2033 (US$ Million, CAGR %)
Table 60 Strategic Outlook
Table 61 Merck & Co., Inc.: Key Details, (CEO, HQ, Revenue, Founded, No. of Employees, Company Type, Website, Business Segment)
Table 62 Merck & Co., Inc.: Product Benchmarking
Table 63 Merck & Co., Inc.: Strategic Outlook
Table 64 Bristol-Myers Squibb Company: Key Details, (CEO, HQ, Revenue, Founded, No. of Employees, Company Type, Website, Business Segment)
Table 65 Bristol-Myers Squibb Company: Product Benchmarking
Table 66 Bristol-Myers Squibb Company: Strategic Outlook
Table 67 Medpace, Inc.: Key Details, (CEO, HQ, Revenue, Founded, No. of Employees, Company Type, Website, Business Segment)
Table 68 Medpace, Inc.: Product Benchmarking
Table 69 Medpace, Inc.: Strategic Outlook
Table 70 Novartis AG: Key Details, (CEO, HQ, Revenue, Founded, No. of Employees, Company Type, Website, Business Segment)
Table 71 Novartis AG: Product Benchmarking
Table 72 Novartis AG: Strategic Outlook
Table 73 AstraZeneca plc: Key Details, (CEO, HQ, Revenue, Founded, No. of Employees, Company Type, Website, Business Segment)
Table 74 AstraZeneca plc: Product Benchmarking
Table 75 BioNTech SE: Key Details, (CEO, HQ, Revenue, Founded, No. of Employees, Company Type, Website, Business Segment)
Table 76 BioNTech SE: Product Benchmarking
Table 77 BioNTech SE: Strategic Outlook
Table 78 Exscientia plc: Key Details, (CEO, HQ, Revenue, Founded, No. of Employees, Company Type, Website, Business Segment)
Table 79 Exscientia plc: Product Benchmarking
Table 80 Exscientia plc: Strategic Outlook
Table 81 F. Hoffmann-La Roche AG: Key Details, (CEO, HQ, Revenue, Founded, No. of Employees, Company Type, Website, Business Segment)
Table 82 F. Hoffmann-La Roche AG: Product Benchmarking
Table 83 F. Hoffmann-La Roche AG: Strategic Outlook
Table 84 Pfizer Inc.: Key Details, (CEO, HQ, Revenue, Founded, No. of Employees, Company Type, Website, Business Segment)
Table 85 Pfizer Inc.: Product Benchmarking
Table 86 Pfizer Inc.: Strategic Outlook
Table 87 Syneos Health: Key Details, (CEO, HQ, Revenue, Founded, No. of Employees, Company Type, Website, Business Segment)
Table 88 Syneos Health: Product Benchmarking
Table 89 Syneos Health.: Strategic Outlook
Table 90 IO Biotech, Inc.: Key Details, (CEO, HQ, Revenue, Founded, No. of Employees, Company Type, Website, Business Segment)
Table 91 IO Biotech, Inc.: Product Benchmarking
Table 92 IO Biotech, Inc.: Strategic Outlook
Table 93 ICON plc: Key Details, (CEO, HQ, Revenue, Founded, No. of Employees, Company Type, Website, Business Segment)
Table 94 ICON plc: Product Benchmarking
Table 95 IQVIA Inc.: Key Details, (CEO, HQ, Revenue, Founded, No. of Employees, Company Type, Website, Business Segment)
Table 96 IQVIA INC.: Product Benchmarking
図の一覧
Figure 1 Immuno Oncology Clinical Trials Market Segmentation
Figure 2 Immuno Oncology Clinical Trials Market by Phase: Market Attractiveness Index
Figure 3 Immuno Oncology Clinical Trials Market by Design: Market Attractiveness Index
Figure 4 Immuno Oncology Clinical Trials Market by Indication: Market Attractiveness Index
Figure 5 Immuno Oncology Clinical Trials Market Attractiveness Index by Region
Figure 6 Immuno Oncology Clinical Trials Market: Market Dynamics
Figure 7 Global Cancer Cases, 2020
Figure 8 Top 10 Cancer Drugmakers by 2024
Figure 9 Immuno Oncology Clinical Trials Market by Region, 2023-2033 (US$ Million, AGR %): “V” Shaped Recovery
Figure 10 Immuno Oncology Clinical Trials Market by Region, 2023-2033 (US$ Million, AGR %): “U” Shaped Recovery
Figure 11 Immuno Oncology Clinical Trials Market by Region, 2023-2033 (US$ Million, AGR %): “W” Shaped Recovery
Figure 12 Immuno Oncology Clinical Trials Market by Region, 2023-2033 (US$ Million, AGR %): “L” Shaped Recovery
Figure 13 Immuno Oncology Clinical Trials Market by Phase: Market Attractiveness Index
Figure 14 Immuno Oncology Clinical Trials Market Forecast by Phase, 2023-2033 (US$ Million, AGR %)
Figure 15 Immuno Oncology Clinical Trials Market Share Forecast by Phase, 2023, 2028, 2033 (%)
Figure 16 Phase I Segment Market Forecast by Region, 2023-2033 (US$ Million, CAGR %)
Figure 17 Phase I Segment Market Share Forecast by Region, 2023 & 2033 (%)
Figure 18 Phase II Segment Market Forecast by Region, 2023-2033 (US$ Million, AGR %)
Figure 19 Phase II Segment Market Share Forecast by Region, 2023 & 2033 (%)
Figure 20 Phase III Segment Market Forecast by Region, 2023-2033 (US$ Million, AGR %)
Figure 21 Phase III Segment Market Share Forecast by Region, 2023 & 2033 (%)
Figure 22 Phase IV Segment Market Forecast by Region, 2023-2033 (US$ Million, AGR %)
Figure 23 Phase IV Segment Market Share Forecast by Region, 2023 & 2033 (%)
Figure 24 Immuno Oncology Clinical Trials Market by Design: Market Attractiveness Index
Figure 25 Immuno Oncology Clinical Trials Market Forecast by Design, 2023-2033 (US$ Million, AGR %)
Figure 26 Immuno Oncology Clinical Trials Market Share Forecast by Design, 2023, 2028, 2033 (%)
Figure 27 Interventional Trials Segment Market Forecast by Region, 2023-2033 (US$ Million, AGR %)
Figure 28 Interventional Trials Segment Market Share Forecast by Region, 2023 & 2033 (%)
Figure 29 Observational Trials Segment Market Forecast by Region, 2023-2033 (US$ Million, AGR %)
Figure 30 Observational Trials Segment Market Share Forecast by Region, 2023 & 2033 (%)
Figure 31 Expanded Access Trials Segment Market Forecast by Region, 2023-2033 (US$ Million, AGR %)
Figure 32 Expanded Access Trials Segment Market Share Forecast by Region, 2023 & 2033 (%)
Figure 33 Immuno Oncology Clinical Trials Market by Indication: Market Attractiveness Index
Figure 34 Immuno Oncology Clinical Trials Market Forecast by Indication, 2023-2033 (US$ Million, AGR %)
Figure 35 Immuno Oncology Clinical Trials Market Share Forecast by Indication, 2023, 2028, 2033 (%)
Figure 36 Solid Tumours Segment Market Forecast by Region, 2023-2033 (US$ Million, AGR %)
Figure 37 Solid Tumours Segment Market Share Forecast by Region, 2023 & 2033 (%)
Figure 38 Hematological Cancer Segment Market Forecast by Region, 2023-2033 (US$ Million, CAGR %)
Figure 39 Hematological Cancer Segment Market Share Forecast by Region, 2023 & 2033 (%)
Figure 40 Immuno Oncology Clinical Trials Market Forecast by Region 2023 and 2033 (Revenue, CAGR %)
Figure 41 Immuno Oncology Clinical Trials Market Share Forecast by Region 2023, 2028, 2033 (%)
Figure 42 Immuno Oncology Clinical Trials Market by Region, 2023-2033 (US$ Million, CAGR %)
Figure 43 North America Immuno Oncology Clinical Trials Market Attractiveness Index
Figure 44 North America Immuno Oncology Clinical Trials Market by Region, 2023, 2028 & 2033 (US$ Million)
Figure 45 North America Immuno Oncology Clinical Trials Market Forecast by Country, 2023-2033 (US$ Million, CAGR %)
Figure 46 North America Immuno Oncology Clinical Trials Market Share Forecast by Country, 2023 & 2033 (%)
Figure 47 North America Immuno Oncology Clinical Trials Market Forecast by Phase, 2023-2033 (US$ Million, AGR %)
Figure 48 North America Immuno Oncology Clinical Trials Market Share Forecast by Phase, 2023 & 2033 (%)
Figure 49 North America Immuno Oncology Clinical Trials Market Forecast by Design, 2023-2033 (US$ Million, AGR %)
Figure 50 North America Immuno Oncology Clinical Trials Market Share Forecast by Design, 2023 & 2033 (%)
Figure 51 North America Immuno Oncology Clinical Trials Market Forecast by Indication, 2023-2033 (US$ Million, AGR %)
Figure 52 North America Immuno Oncology Clinical Trials Market Share Forecast by Indication, 2023 & 2033 (%)
Figure 53 Immuno Oncology Clinical Trials in the United States
Figure 54 U.S. Immuno Oncology Clinical Trials Market Forecast, 2023-2033 (US$ Million, AGR %)
Figure 55 Canada Immuno Oncology Clinical Trials Market Forecast, 2023-2033 (US$ Million, AGR %)
Figure 56 Europe Immuno Oncology Clinical Trials Market Attractiveness Index
Figure 57 Europe Immuno Oncology Clinical Trials Market by Region, 2023, 2028 & 2033 (US$ Million)
Figure 58 Europe Immuno Oncology Clinical Trials Market Forecast by Country, 2023-2033 (US$ Million, AGR %)
Figure 59 Europe Immuno Oncology Clinical Trials Market Share Forecast by Country, 2023 & 2033 (%)
Figure 60 Europe Immuno Oncology Clinical Trials Market Forecast by Phase, 2023-2033 (US$ Million, AGR %)
Figure 61 Europe Immuno Oncology Clinical Trials Market Share Forecast by Phase, 2023 & 2033 (%)
Figure 62 Europe Immuno Oncology Clinical Trials Market Forecast by Design, 2023-2033 (US$ Million, AGR %)
Figure 63 Europe Immuno Oncology Clinical Trials Market Share Forecast by Design, 2023 & 2033 (%)
Figure 64 Europe Immuno Oncology Clinical Trials Market Forecast by Indication, 2023-2033 (US$ Million, AGR %)
Figure 65 Europe Immuno Oncology Clinical Trials Market Share Forecast by Indication, 2023 & 2033 (%)
Figure 66 Germany Immuno Oncology Clinical Trials Market Forecast, 2023-2033 (US$ Million, CAGR %)
Figure 67 UK Immuno Oncology Clinical Trials Market Forecast, 2023-2033 (US$ Million, AGR %)
Figure 68 France Immuno Oncology Clinical Trials Market Forecast, 2023-2033 (US$ Million, AGR %)
Figure 69 Italy Immuno Oncology Clinical Trials Market Forecast, 2023-2033 (US$ Million, AGR %)
Figure 70 Spain Immuno Oncology Clinical Trials Market Forecast, 2023-2033 (US$ Million, AGR %)
Figure 71 Rest of Europe Immuno Oncology Clinical Trials Market Forecast, 2023-2033 (US$ Million, AGR %)
Figure 72 Asia Pacific Immuno Oncology Clinical Trials Market Attractiveness Index
Figure 73 Asia Pacific Immuno Oncology Clinical Trials Market by Region, 2023, 2028 & 2033 (US$ Million)
Figure 74 Asia Pacific Immuno Oncology Clinical Trials Market Forecast by Country, 2023-2033 (US$ Million, AGR %)
Figure 75 Asia Pacific Immuno Oncology Clinical Trials Market Share Forecast by Country, 2023 & 2033 (%)
Figure 76 Asia Pacific Immuno Oncology Clinical Trials Market Forecast by Phase, 2023-2033 (US$ Million, AGR %)
Figure 77 Asia Pacific Immuno Oncology Clinical Trials Market Share Forecast by Phase, 2023 & 2033 (%)
Figure 78 Asia Pacific Immuno Oncology Clinical Trials Market Forecast by Design, 2023-2033 (US$ Million, AGR %)
Figure 79 Asia Pacific Immuno Oncology Clinical Trials Market Share Forecast by Design, 2023 & 2033 (%)
Figure 80 Asia Pacific Immuno Oncology Clinical Trials Market Forecast by Indication, 2023-2033 (US$ Million, AGR %)
Figure 81 Asia Pacific Immuno Oncology Clinical Trials Market Share Forecast by Indication, 2023 & 2033 (%)
Figure 82 China Immuno Oncology Clinical Trials Market Forecast, 2023-2033 (US$ Million, AGR %)
Figure 83 Japan Immuno Oncology Clinical Trials Market Forecast, 2023-2033 (US$ Million, AGR %)
Figure 84 India Immuno Oncology Clinical Trials Market Forecast, 2023-2033 (US$ Million, AGR %)
Figure 85 Australia Immuno Oncology Clinical Trials Market Forecast, 2023-2033 (US$ Million, AGR %)
Figure 86 South Korea Immuno Oncology Clinical Trials Market Forecast, 2023-2033 (US$ Million, AGR %)
Figure 87 Rest of Asia Pacific Immuno Oncology Clinical Trials Market Forecast, 2023-2033 (US$ Million, AGR %)
Figure 88 Latin America Immuno Oncology Clinical Trials Market Attractiveness Index
Figure 89 Latin America Immuno Oncology Clinical Trials Market by Region, 2023, 2028 & 2033 (US$ Million)
Figure 90 Latin America Immuno Oncology Clinical Trials Market Forecast by Country, 2023-2033 (US$ Million, CAGR %)
Figure 91 Latin America Immuno Oncology Clinical Trials Market Share Forecast by Country, 2023 & 2033 (%)
Figure 92 Latin America Immuno Oncology Clinical Trials Market Forecast by Phase, 2023-2033 (US$ Million, AGR %)
Figure 93 Latin America Immuno Oncology Clinical Trials Market Share Forecast by Phase, 2023 & 2033 (%)
Figure 94 Latin America Immuno Oncology Clinical Trials Market Forecast by Design, 2023-2033 (US$ Million, AGR %)
Figure 95 Latin America Immuno Oncology Clinical Trials Market Share Forecast by Design, 2023 & 2033 (%)
Figure 96 Latin America Immuno Oncology Clinical Trials Market Forecast by Indication, 2023-2033 (US$ Million, AGR %)
Figure 97 Latin America Immuno Oncology Clinical Trials Market Share Forecast by Indication, 2023 & 2033 (%)
Figure 98 Brazil Immuno Oncology Clinical Trials Market Forecast, 2023-2033 (US$ Million, AGR %)
Figure 99 Mexico Immuno Oncology Clinical Trials Market Forecast, 2023-2033 (US$ Million, CAGR %)
Figure 100 Rest of Latin America Immuno Oncology Clinical Trials Market Forecast, 2023-2033 (US$ Million, AGR %)
Figure 101 MEA Immuno Oncology Clinical Trials Market Attractiveness Index
Figure 102 MEA Immuno Oncology Clinical Trials Market by Region, 2023, 2028 & 2033 (US$ Million)
Figure 103 MEA Immuno Oncology Clinical Trials Market Forecast by Country, 2023-2033 (US$ Million, CAGR %)
Figure 104 MEA Immuno Oncology Clinical Trials Market Share Forecast by Country, 2023 & 2033 (%)
Figure 105 MEA Immuno Oncology Clinical Trials Market Forecast by Phase, 2023-2033 (US$ Million, AGR %)
Figure 106 MEA Immuno Oncology Clinical Trials Market Share Forecast by Phase, 2023 & 2033 (%)
Figure 107 MEA Immuno Oncology Clinical Trials Market Forecast by Design, 2023-2033 (US$ Million, AGR %)
Figure 108 MEA Immuno Oncology Clinical Trials Market Share Forecast by Design, 2023 & 2033 (%)
Figure 109 MEA Immuno Oncology Clinical Trials Market Forecast by Indication, 2023-2033 (US$ Million, AGR %)
Figure 110 MEA Immuno Oncology Clinical Trials Market Share Forecast by Indication, 2023 & 2033 (%)
Figure 111 South Africa Immuno Oncology Clinical Trials Market Forecast, 2023-2033 (US$ Million, AGR %)
Figure 112 GCC Immuno Oncology Clinical Trials Market Forecast, 2023-2033 (US$ Million, AGR %)
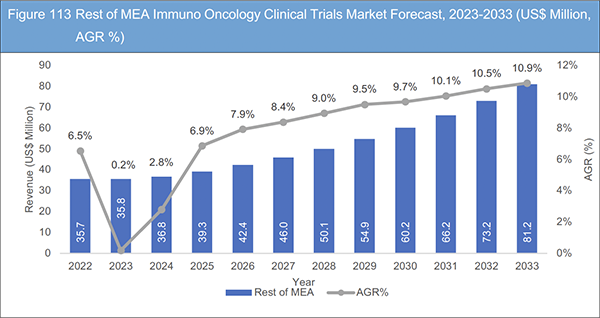
Figure 113 Rest of MEA Immuno Oncology Clinical Trials Market Forecast, 2023-2033 (US$ Million, AGR %)
Figure 114 Immuno Oncology Clinical Trials Market: Company Share Analysis
Figure 115 Merck & Co., Inc.: Net Revenue, 2017-2022 (US$ Million, AGR%)
Figure 116 Merck & Co., Inc.: R&D, 2017-2022 (US$ Million, AGR%)
Figure 117 Merck & Co., Inc.: Regional Market Shares, 2022
Figure 118 Bristol-Myers Squibb Company: Net Revenue, 2017-2022 (US$ Million, AGR%)
Figure 119 Bristol-Myers Squibb Company: R&D, 2017-2022 (US$ Million, AGR%)
Figure 120 Bristol-Myers Squibb Company: Regional Market Shares, 2022
Figure 121 Medpace, Inc.: Net Revenue, 2017-2022 (US$ Million, AGR%)
Figure 122 Novartis AG: Net Revenue, 2017-2022 (US$ Million, AGR%)
Figure 123 Novartis AG: R&D, 2017-2022 (US$ Million, AGR%)
Figure 124 Novartis AG: Regional Market Shares, 2022
Figure 125 AstraZeneca plc: Net Revenue, 2017-2022 (US$ Million, AGR%)
Figure 126 AstraZeneca plc: R&D, 2017-2022 (US$ Million, AGR%)
Figure 127 AstraZeneca plc: Regional Market Shares, 2022
Figure 128 BioNTech SE: Net Revenue, 2017-2022 (US$ Million, AGR%)
Figure 129 BioNTech SE: R&D, 2017-2022 (US$ Million, AGR%)
Figure 130 Exscientia plc: Net Revenue, 2020-2022 (US$ Million, AGR%)
Figure 131 Exscientia plc: R&D, 2020-2022 (US$ Million, AGR%)
Figure 132 Exscientia plc: Regional Market Shares, 2022
Figure 133 F. Hoffmann-La Roche AG: Net Revenue, 2017-2022 (US$ Million, AGR%)
Figure 134 F. Hoffmann-La Roche AG: R&D, 2017-2022 (US$ Million, AGR%)
Figure 135 F. Hoffmann-La Roche AG: Regional Market Shares, 2022
Figure 136 Pfizer Inc.: Net Revenue, 2017-2022 (US$ Million, AGR%)
Figure 137 Pfizer Inc.: R&D, 2017-2022 (US$ Million, AGR%)
Figure 138 Pfizer Inc.: Regional Market Shares, 2022
Figure 139 Syneos Health.: Net Revenue, 2017-2022 (US$ Million, AGR%)
Figure 140 Syneos Health: Regional Market Shares, 2021
Figure 141 ICON plc: Net Revenue, 2017-2022 (US$ Million, AGR%)
Figure 142 ICON plc: Regional Market Shares, 2022
Figure 143 IQVIA Inc.: Net Revenue, 2017-2022 (US$ Million, AGR%)
Figure 144 IQVIA Inc.: R&D, 2017-2022 (US$ Million, AGR%)
Figure 145 IQVIA Inc.: Regional Market Shares, 2022
ページTOPに戻る
Summary
Report Details
The Immuno-Oncology Clinical Trials Market Report 2023-2033: This report will prove invaluable to leading firms striving for new revenue pockets if they wish to understand the industry and its underlying dynamics better. It will be useful for companies that want to expand into different industries or their existing operations in a new region.
Increasing Number of Interventional Immuno Oncology Clinical Trials Driving Market Growth
Clinical studies that evaluate a new intervention, like a medicine or a medical technology, are known as interventional trials. Clinical trials in immuno oncology evaluate the efficacy of brand-new immunotherapies for cancer. Furthermore, interventional radiologists have created new procedures and equipment for both intratumor ablative techniques to cure disease and a variety of transarterial intrahepatic therapeutic alternatives, continually improving patient results. Interventional radiologists undertake treatments that can result in immune augmentation, strengthening the role of immunotherapies, such as ablative (radiofrequency and microwave ablation) or embolic.
The number of interventional immuno oncology clinical trials was over 7,000 as of January 2023. More than 3,000 of these trials fell under Phase III. Melanoma, NSCLC, and colorectal cancer are the cancer types that are examined in immuno oncology clinical trials the most frequently. Checkpoint inhibitors, CAR T cells, and oncolytic viruses are the immunotherapies most frequently investigated in immuno oncology clinical trials.
Serious Issues and Substantial Medical Costs Likely to Challenge Industry Growth
Immunotherapy is a relatively recent type of cancer treatment using the body’s immune system to combat cancer cells. Although it is expensive, it has shown significant potential in treating several tumors. There are a few factors that contribute to immunotherapy’s high cost. It is a complicated treatment that necessitates much research and development. Second, it is frequently produced using pricey biologic medications that are challenging to produce. Third, immunotherapy is in high demand, which raises the cost. Many cancer patients may find it difficult to get immunotherapy due to its high cost. Immunotherapy, for instance, typically costs more than $100,000 a year in the United States.
Further, high medical costs are a big issue for patients worldwide. There is intense pressure to reduce costs and demonstrate value. The lack of accessible drugs has impacted population health in underdeveloped nations and shortened average life expectancy. Immunotherapy often involves an average annual cost of above $100,000 per patient; if the worth of medical insurance were considered, this cost would rise to $850,000 per patient. As a result of the high price of immuno oncology therapy, it is projected that the market for immuno oncology medications will expand slowly.
What Questions Should You Ask Before Buying a Market Research Report?
• How is immuno oncology clinical trials market evolving?
• What is driving and restraining immuno oncology clinical trials market?
• How will each immuno oncology clinical trials submarket segment grow over the forecast period, and how much revenue will these submarkets account for in 2033?
• How will the market shares for each immuno oncology clinical trials submarket develop from 2023 to 2033?
• What will be the main driver for the overall market from 2023 to 2033?
• Will leading immuno oncology clinical trials markets broadly follow the macroeconomic dynamics, or will individual national markets outperform others?
• How will the market shares of the national markets change by 2033, and which geographical region will lead the market in 2033?
• Who are the leading players, and what are their prospects over the forecast period?
• What are the immuno oncology clinical trials projects for these leading companies?
• How will the industry evolve during the period between 2023 and 2033? What are the implications of immuno oncology clinical trials projects taking place now and over the next 10 years?
• Is there a greater need for product commercialization to further scale immuno oncology clinical trials market?
• Where is the immuno oncology clinical trials market heading and how can you ensure you are at the forefront of the market?
• What are the best investment options for new product and service lines?
• What are the key prospects for moving companies into a new growth path and C-suite?
You need to discover how this will impact the Immuno Oncology Clinical Trials market today, and over the next 10 years:
• Our 249-page report provides 96 tables and 145 charts/graphs exclusively to you.
• The report highlights key lucrative areas in the industry so you can target them – NOW.
• It contains in-depth analysis of global, regional and national sales and growth.
• It highlights for you the key successful trends, changes and revenue projections made by your competitors.
This report tells you TODAY how the immuno oncology clinical trials market will develop in the next 10 years, and in line with the variations in COVID-19 economic recession and bounce. This market is more critical now than at any point over the last 10 years.
Forecasts to 2033 and other analyses reveal commercial prospects
• In addition to revenue forecasting to 2033, our new study provides you with recent results, growth rates, and market shares.
• You will find original analyses, with business outlooks and developments.
• Discover qualitative analyses (including market dynamics, drivers, opportunities, restraints and challenges), cost structure, impact of rising Immuno Oncology Clinical Trials prices and recent developments.
This report includes data analysis and invaluable insight into how COVID-19 will affect the industry and your company. Four COVID-19 recovery patterns and their impact, namely, “V”, “L”, “W” and “U” are discussed in this report.
Segments Covered in the Report
Phase
• Phase I
• Phase II
• Phase III
• Phase IV
Design
• Interventional Trials
• Observational Trials
• Expanded Access Trials
Indication
• Solid Tumours
• Hematological Cancer
In addition to the revenue predictions for the overall world market and segments, you will also find revenue forecasts for five regional and 20 leading national markets:
North America
• U.S.
• Canada
Europe
• Germany
• UK
• France
• Spain
• Italy
• Rest of Europe
Asia Pacific
• China
• Japan
• India
• Australia
• South Korea
• Rest of Asia Pacific
Latin America
• Brazil
• Mexico
• Rest of Latin America
MEA
• GCC
• South Africa
• Rest of MEA
The report also includes profiles and for some of the leading companies in the Immuno Oncology Clinical Trials Market, 2023 to 2033, with a focus on this segment of these companies’ operations.
Leading Companies and the Potential for market growth
• AstraZeneca plc
• BioNTech SE
• Bristol-Myers Squibb Company
• Exscientia plc
• F. Hoffmann-La Roche AG
• ICON plc
• IO Biotech, Inc.
• IQVIA Inc.
• Medpace, Inc.
• Merck & Co., Inc.
• Novartis AG
• Pfizer Inc.
• Syneos Health
Overall world revenue for Immuno Oncology Clinical Trials Market, 2023 to 2033 in terms of value the market will surpass US$6,800 million in 2023, our work calculates. We predict strong revenue growth through to 2033. Our work identifies which organizations hold the greatest potential. Discover their capabilities, progress, and commercial prospects, helping you stay ahead.
How will the Immuno Oncology Clinical Trials Market, 2023 to 2033 report help you?
In summary, our 240+ page report provides you with the following knowledge:
• Revenue forecasts to 2033 for Immuno Oncology Clinical Trials Market 2023 to 2033, with forecasts for phase, design, and indication, each forecast at a global and regional level – discover the industry’s prospects, finding the most lucrative places for investments and revenues.
• Revenue forecasts to 2033 for five regional and 20 key national markets – See forecasts for the Immuno Oncology Clinical Trials Market, 2023 to 2033 market in North America, Europe, Asia-Pacific, Latin America, and MEA. Also forecasted is the market in the US, Canada, Mexico, Brazil, Germany, France, UK, Italy, China, India, Japan, and Australia among other prominent economies.
• Prospects for established firms and those seeking to enter the market – including company profiles for Merck & Co., Inc., Bristol-Myers Squibb Company, Novartis AG, AstraZeneca plc, and F. Hoffmann-La Roche AG among others involved in the Immuno Oncology Clinical Trials Market, 2023 to 2033.
Find quantitative and qualitative analyses with independent predictions. Receive information that only our report contains, staying informed with invaluable business intelligence.
Information found nowhere else
With our new report, you are less likely to fall behind in knowledge or miss out on opportunities. See how our work could benefit your research, analyses, and decisions. Visiongain’s study is for everybody needing commercial analyses for the Immuno Oncology Clinical Trials Market, 2023 to 2033, market-leading companies. You will find data, trends and predictions.
ページTOPに戻る
Table of Contents
Table of Contents
1 Report Overview
1.1 Objectives of the Study
1.2 Introduction to Immuno Oncology Clinical Trials Market
1.3 What This Report Delivers
1.4 Why You Should Read This Report
1.5 Key Questions Answered by This Analytical Report
1.6 Who is This Report for?
1.7 Methodology
1.7.1 Market Definitions
1.7.2 Market Evaluation & Forecasting Methodology
1.7.3 Data Validation
1.7.3.1 Primary Research
1.7.3.2 Secondary Research
1.8 Frequently Asked Questions (FAQs)
1.9 Associated Visiongain Reports
1.10 About Visiongain
2 Executive Summary
3 Market Overview
3.1 Key Findings
3.2 Market Dynamics
3.2.1 Market Driving Factors
3.2.1.1 Increase in Cancer Cases Has Compelled Biotech and Pharmaceutical Companies to Conduct More Clinical Immuno Oncology Tests
3.2.1.2 Increasing Regulatory Approval for Immuno Oncology Drug
3.2.1.3 Greater Investment in Healthcare R&D
3.2.2 Market Restraining Factors
3.2.2.1 Serious Issues and Substantial Medical Costs
3.2.2.2 Regulatory Challenges
3.2.2.3 Lack of Diversity
3.2.3 Market Opportunities
3.2.3.1 Potential for Partnership and Collaborations Offering Lucrative Opportunity
3.2.3.2 Growing Number of Immuno Oncology Medication Clinical Studies
3.3 Porter’s Five Forces Analysis
3.4 PEST Analysis
3.5 COVID-19 Impact Analysis
4 Immuno Oncology Clinical Trials Market Analysis by Phase
4.1 Key Findings
4.2 Phase Segment: Market Attractiveness Index
4.3 Immuno Oncology Clinical Trials Market Size Estimation and Forecast by Phase
4.4 Phase I
4.4.1 Market Size by Region, 2023-2033 (US$ Million)
4.4.2 Market Share by Region, 2023 & 2033 (%)
4.5 Phase II
4.5.1 Market Size by Region, 2023-2033 (US$ Million)
4.5.2 Market Share by Region, 2023 & 2033 (%)
4.6 Phase III
4.6.1 Market Size by Region, 2023-2033 (US$ Million)
4.6.2 Market Share by Region, 2023 & 2033 (%)
4.7 Phase IV
4.7.1 Market Size by Region, 2023-2033 (US$ Million)
4.7.2 Market Share by Region, 2023 & 2033 (%)
5 Immuno Oncology Clinical Trials Market Analysis by Design
5.1 Key Findings
5.2 Design Segment: Market Attractiveness Index
5.3 Immuno Oncology Clinical Trials Market Size Estimation and Forecast by Design
5.4 Interventional Trials
5.4.1 Market Size by Region, 2023-2033 (US$ Million)
5.4.2 Market Share by Region, 2023 & 2033 (%)
5.5 Observational Trials
5.5.1 Market Size by Region, 2023-2033 (US$ Million)
5.5.2 Market Share by Region, 2023 & 2033 (%)
5.6 Expanded Access Trials
5.6.1 Market Size by Region, 2023-2033 (US$ Million)
5.6.2 Market Share by Region, 2023 & 2033 (%)
6 Immuno Oncology Clinical Trials Market Analysis by Indication
6.1 Key Findings
6.2 Indication Segment: Market Attractiveness Index
6.3 Immuno Oncology Clinical Trials Market Size Estimation and Forecast by Indication
6.4 Solid Tumours
6.4.1 Market Size by Region, 2023-2033 (US$ Million)
6.4.2 Market Share by Region, 2023 & 2033 (%)
6.5 Hematological Cancer
6.5.1 Market Size by Region, 2023-2033 (US$ Million)
6.5.2 Market Share by Region, 2023 & 2033 (%)
7 Immuno Oncology Clinical Trials Market Analysis by Region
7.1 Key Findings
7.2 Regional Market Size Estimation and Forecast
8 North America Immuno Oncology Clinical Trials Market Analysis
8.1 Key Findings
8.2 North America Immuno Oncology Clinical Trials Market Attractiveness Index
8.3 North America Immuno Oncology Clinical Trials Market by Country, 2023, 2028 & 2033 (US$ Million)
8.4 North America Immuno Oncology Clinical Trials Market Size Estimation and Forecast by Country
8.5 North America Immuno Oncology Clinical Trials Market Size Estimation and Forecast by Phase
8.6 North America Immuno Oncology Clinical Trials Market Size Estimation and Forecast by Design
8.7 North America Immuno Oncology Clinical Trials Market Size Estimation and Forecast by Indication
8.8 U.S. Immuno Oncology Clinical Trials Market Analysis
8.9 Canada Immuno Oncology Clinical Trials Market Analysis
9 Europe Immuno Oncology Clinical Trials Market Analysis
9.1 Key Findings
9.2 Europe Immuno Oncology Clinical Trials Market Attractiveness Index
9.3 Europe Immuno Oncology Clinical Trials Market by Country, 2023, 2028 & 2033 (US$ Million)
9.4 Europe Immuno Oncology Clinical Trials Market Size Estimation and Forecast by Country
9.5 Europe Immuno Oncology Clinical Trials Market Size Estimation and Forecast by Phase
9.6 Europe Immuno Oncology Clinical Trials Market Size Estimation and Forecast by Design
9.7 Europe Immuno Oncology Clinical Trials Market Size Estimation and Forecast by Indication
9.8 Germany Immuno Oncology Clinical Trials Market Analysis
9.9 UK Immuno Oncology Clinical Trials Market Analysis
9.10 France Immuno Oncology Clinical Trials Market Analysis
9.11 Italy Immuno Oncology Clinical Trials Market Analysis
9.12 Spain Immuno Oncology Clinical Trials Market Analysis
9.13 Rest of Europe Immuno Oncology Clinical Trials Market Analysis
10 Asia Pacific Immuno Oncology Clinical Trials Market Analysis
10.1 Key Findings
10.2 Asia Pacific Immuno Oncology Clinical Trials Market Attractiveness Index
10.3 Asia Pacific Immuno Oncology Clinical Trials Market by Country, 2023, 2028 & 2033 (US$ Million)
10.4 Asia Pacific Immuno Oncology Clinical Trials Market Size Estimation and Forecast by Country
10.5 Asia Pacific Immuno Oncology Clinical Trials Market Size Estimation and Forecast by Phase
10.6 Asia Pacific Immuno Oncology Clinical Trials Market Size Estimation and Forecast by Design
10.7 Asia Pacific Immuno Oncology Clinical Trials Market Size Estimation and Forecast by Indication
10.8 China Immuno Oncology Clinical Trials Market Analysis
10.9 Japan Immuno Oncology Clinical Trials Market Analysis
10.10 India Immuno Oncology Clinical Trials Market Analysis
10.11 Australia Immuno Oncology Clinical Trials Market Analysis
10.12 South Korea Immuno Oncology Clinical Trials Market Analysis
10.13 Rest of Asia Pacific Immuno Oncology Clinical Trials Market Analysis
11 Latin America Immuno Oncology Clinical Trials Market Analysis
11.1 Key Findings
11.2 Latin America Immuno Oncology Clinical Trials Market Attractiveness Index
11.3 Latin America Immuno Oncology Clinical Trials Market by Country, 2023, 2028 & 2033 (US$ Million)
11.4 Latin America Immuno Oncology Clinical Trials Market Size Estimation and Forecast by Country
11.5 Latin America Immuno Oncology Clinical Trials Market Size Estimation and Forecast by Phase
11.6 Latin America Immuno Oncology Clinical Trials Market Size Estimation and Forecast by Design
11.7 Latin America Immuno Oncology Clinical Trials Market Size Estimation and Forecast by Indication
11.8 Brazil Immuno Oncology Clinical Trials Market Analysis
11.9 Mexico Immuno Oncology Clinical Trials Market Analysis
11.10 Rest of Latin America Immuno Oncology Clinical Trials Market Analysis
12 MEA Immuno Oncology Clinical Trials Market Analysis
12.1 Key Findings
12.2 MEA Immuno Oncology Clinical Trials Market Attractiveness Index
12.3 MEA Immuno Oncology Clinical Trials Market by Country, 2023, 2028 & 2033 (US$ Million)
12.4 MEA Immuno Oncology Clinical Trials Market Size Estimation and Forecast by Country
12.5 MEA Immuno Oncology Clinical Trials Market Size Estimation and Forecast by Phase
12.6 MEA Immuno Oncology Clinical Trials Market Size Estimation and Forecast by Design
12.7 MEA Immuno Oncology Clinical Trials Market Size Estimation and Forecast by Indication
12.8 South Africa Immuno Oncology Clinical Trials Market Analysis
12.9 GCC Immuno Oncology Clinical Trials Market Analysis
12.10 Rest of MEA Immuno Oncology Clinical Trials Market Analysis
13 Company Profiles
13.1 Competitive Landscape
13.2 Strategic Outlook
13.3 Merck & Co., Inc.
13.3.1 Company Snapshot
13.3.2 Company Overview
13.3.3 Financial Analysis
13.3.3.1 Net Revenue, 2017-2022
13.3.3.2 R&D, 2017-2022
13.3.3.3 Regional Market Shares, 2022
13.3.4 Product Benchmarking
13.3.5 Strategic Outlook
13.4 Bristol-Myers Squibb Company
13.4.1 Company Snapshot
13.4.2 Company Overview
13.4.3 Financial Analysis
13.4.3.1 Net Revenue, 2017-2022
13.4.3.2 R&D, 2017-2022
13.4.3.3 Regional Market Shares, 2022
13.4.4 Product Benchmarking
13.4.5 Strategic Outlook
13.5 Medpace, Inc.
13.5.1 Company Snapshot
13.5.2 Company Overview
13.5.3 Financial Analysis
13.5.3.1 Net Revenue, 2017-2022
13.5.4 Product Benchmarking
13.5.5 Strategic Outlook
13.6 Novartis AG
13.6.1 Company Snapshot
13.6.2 Company Overview
13.6.3 Financial Analysis
13.6.3.1 Net Revenue, 2017-2022
13.6.3.2 R&D, 2017-2022
13.6.3.3 Regional Market Shares, 2022
13.6.4 Product Benchmarking
13.6.5 Strategic Outlook
13.7 AstraZeneca plc
13.7.1 Company Snapshot
13.7.2 Company Overview
13.7.3 Financial Analysis
13.7.3.1 Net Revenue, 2017-2022
13.7.3.2 R&D, 2017-2022
13.7.3.3 Regional Market Shares, 2022
13.7.4 Product Benchmarking
13.8 BioNTech SE
13.8.1 Company Snapshot
13.8.2 Company Overview
13.8.3 Financial Analysis
13.8.3.1 Net Revenue, 2017-2022
13.8.3.2 R&D, 2017-2022
13.8.4 Product Benchmarking
13.8.5 Strategic Outlook
13.9 Exscientia plc
13.9.1 Company Snapshot
13.9.2 Company Overview
13.9.3 Financial Analysis
13.9.3.1 Net Revenue, 2020-2022
13.9.3.2 R&D, 2020-2022
13.9.3.3 Regional Market Shares, 2022
13.9.4 Product Benchmarking
13.9.5 Strategic Outlook
13.10 F. Hoffmann-La Roche AG
13.10.1 Company Snapshot
13.10.2 Company Overview
13.10.3 Financial Analysis
13.10.3.1 Net Revenue, 2017-2022
13.10.3.2 R&D, 2017-2022
13.10.3.3 Regional Market Shares, 2022
13.10.4 Product Benchmarking
13.10.5 Strategic Outlook
13.11 Pfizer Inc.
13.11.1 Company Snapshot
13.11.2 Company Overview
13.11.3 Financial Analysis
13.11.3.1 Net Revenue, 2017-2022
13.11.3.2 R&D, 2017-2022
13.11.3.3 Regional Market Shares, 2022
13.11.4 Product Benchmarking
13.11.5 Strategic Outlook
13.12 Syneos Health
13.12.1 Company Snapshot
13.12.2 Company Overview
13.12.3 Financial Analysis
13.12.3.1 Net Revenue, 2017-2022
13.12.3.2 Regional Market Shares, 2021
13.12.4 Product Benchmarking
13.12.5 Strategic Outlook
13.13 IO Biotech, Inc.
13.13.1 Company Snapshot
13.13.2 Company Overview
13.13.3 Product Benchmarking
13.13.4 Strategic Outlook
13.14 ICON plc
13.14.1 Company Snapshot
13.14.2 Company Overview
13.14.3 Financial Analysis
13.14.3.1 Net Revenue, 2017-2022
13.14.3.2 Regional Market Shares, 2022
13.14.4 Product Benchmarking
13.15 IQVIA Inc.
13.15.1 Company Snapshot
13.15.2 Company Overview
13.15.3 Financial Analysis
13.15.3.1 Net Revenue, 2017-2022
13.15.3.2 R&D, 2017-2022
13.15.3.3 Regional Market Shares, 2022
13.15.4 Product Benchmarking
14 Conclusion and Recommendations
14.1 Concluding Remarks from Visiongain
14.2 Recommendations for Market Players
ページTOPに戻る
List of Tables/Graphs
List of Tables
Table 1 Immuno Oncology Clinical Trials Market Snapshot, 2023 & 2033 (US$ Million, CAGR %)
Table 2 Regulatory Approval, 2022
Table 3 Immuno Oncology Clinical Trials Market Forecast by Region, 2023-2033 (US$ Million, AGR%): “V” Shaped Recovery
Table 4 Immuno Oncology Clinical Trials Market Forecast by Region, 2023-2033 (US$ Million, AGR%): “U” Shaped Recovery
Table 5 Immuno Oncology Clinical Trials Market Forecast by Region, 2023-2033 (US$ Million, AGR%): “W” Shaped Recovery
Table 6 Immuno Oncology Clinical Trials Market Forecast by Region, 2023-2033 (US$ Million, CAGR%): “L” Shaped Recovery
Table 7 Immuno Oncology Clinical Trials Market Forecast by Phase, 2023-2033 (US$ Million, CAGR %)
Table 8 Phase I Segment Market Forecast by Region, 2023-2033 (US$ Million, CAGR%)
Table 9 Phase II Segment Market Forecast by Region, 2023-2033 (US$ Million, CAGR%)
Table 10 Phase III Segment Market Forecast by Region, 2023-2033 (US$ Million, CAGR%)
Table 11 Phase IV Segment Market Forecast by Region, 2023-2033 (US$ Million, CAGR%)
Table 12 Immuno Oncology Clinical Trials Market Forecast by Design, 2023-2033 (US$ Million, CAGR %)
Table 13 Interventional Trials Segment Market Forecast by Region, 2023-2033 (US$ Million, CAGR%)
Table 14 Observational Trials Segment Market Forecast by Region, 2023-2033 (US$ Million, CAGR%)
Table 15 Expanded Access Trials Segment Market Forecast by Region, 2023-2033 (US$ Million, CAGR%)
Table 16 Immuno Oncology Clinical Trials Market Forecast by Indication, 2023-2033 (US$ Million, CAGR %)
Table 17 Solid Tumours Segment Market Forecast by Region, 2023-2033 (US$ Million, CAGR%)
Table 18 Hematological Cancer Segment Market Forecast by Region, 2023-2033 (US$ Million, CAGR %)
Table 19 Immuno Oncology Clinical Trials Market Forecast by Region, 2023-2033 (US$ Million, AGR %)
Table 20 North America Immuno Oncology Clinical Trials Market Forecast by Country, 2023-2033 (US$ Million, CAGR %)
Table 21 North America Immuno Oncology Clinical Trials Market Forecast by Phase, 2023-2033 (US$ Million, CAGR %)
Table 22 Immuno Oncology Clinical Trials Market Forecast by Design, 2023-2033 (US$ Million, CAGR %)
Table 23 North America Immuno Oncology Clinical Trials Market Forecast by Indication, 2023-2033 (US$ Million, CAGR %)
Table 24 U.S. Immuno Oncology Clinical Trials Market Forecast, 2023-2033 (US$ Million, CAGR %)
Table 25 Canada Immuno Oncology Clinical Trials Market Forecast, 2023-2033 (US$ Million, CAGR %)
Table 26 Europe Immuno Oncology Clinical Trials Market Forecast by Country, 2023-2033 (US$ Million, CAGR %)
Table 27 Europe Immuno Oncology Clinical Trials Market Forecast by Phase, 2023-2033 (US$ Million, CAGR %)
Table 28 Europe Immuno Oncology Clinical Trials Market Forecast by Design, 2023-2033 (US$ Million, CAGR %)
Table 29 Europe Immuno Oncology Clinical Trials Market Forecast by Indication, 2023-2033 (US$ Million, CAGR %)
Table 30 Germany Immuno Oncology Clinical Trials Market Forecast, 2023-2033 (US$ Million, CAGR %)
Table 31 UK Immuno Oncology Clinical Trials Market Forecast, 2023-2033 (US$ Million, CAGR %)
Table 32 France Immuno Oncology Clinical Trials Market Forecast, 2023-2033 (US$ Million, CAGR %)
Table 33 Italy Immuno Oncology Clinical Trials Market Forecast, 2023-2033 (US$ Million, CAGR %)
Table 34 Spain Immuno Oncology Clinical Trials Market Forecast, 2023-2033 (US$ Million, CAGR %)
Table 35 Rest of Europe Immuno Oncology Clinical Trials Market Forecast, 2023-2033 (US$ Million, CAGR %)
Table 36 Asia Pacific Immuno Oncology Clinical Trials Market Forecast by Country, 2023-2033 (US$ Million, CAGR %)
Table 37 Asia Pacific Immuno Oncology Clinical Trials Market Forecast by Phase, 2023-2033 (US$ Million, CAGR %)
Table 38 Asia Pacific Immuno Oncology Clinical Trials Market Forecast by Design, 2023-2033 (US$ Million, CAGR %)
Table 39 Asia Pacific Immuno Oncology Clinical Trials Market Forecast by Indication, 2023-2033 (US$ Million, CAGR %)
Table 40 China Immuno Oncology Clinical Trials Market Forecast, 2023-2033 (US$ Million, CAGR %)
Table 41 Japan Immuno Oncology Clinical Trials Market Forecast, 2023-2033 (US$ Million, CAGR %)
Table 42 India Immuno Oncology Clinical Trials Market Forecast, 2023-2033 (US$ Million, CAGR %)
Table 43 Australia Immuno Oncology Clinical Trials Market Forecast, 2023-2033 (US$ Million, CAGR %)
Table 44 South Korea Immuno Oncology Clinical Trials Market Forecast, 2023-2033 (US$ Million, CAGR %)
Table 45 Rest of Asia Pacific Immuno Oncology Clinical Trials Market Forecast, 2023-2033 (US$ Million, CAGR %)
Table 46 Latin America Immuno Oncology Clinical Trials Market Forecast by Country, 2023-2033 (US$ Million, CAGR %)
Table 47 Latin America Immuno Oncology Clinical Trials Market Forecast by Phase, 2023-2033 (US$ Million, CAGR %)
Table 48 Latin America Immuno Oncology Clinical Trials Market Forecast by Design, 2023-2033 (US$ Million, CAGR %)
Table 49 Latin America Immuno Oncology Clinical Trials Market Forecast by Indication, 2023-2033 (US$ Million, CAGR %)
Table 50 Brazil Immuno Oncology Clinical Trials Market Forecast, 2023-2033 (US$ Million, CAGR %)
Table 51 Mexico Immuno Oncology Clinical Trials Market Forecast, 2023-2033 (US$ Million, CAGR %)
Table 52 Rest of Latin America Immuno Oncology Clinical Trials Market Forecast, 2023-2033 (US$ Million, CAGR %)
Table 53 MEA Immuno Oncology Clinical Trials Market Forecast by Country, 2023-2033 (US$ Million, CAGR %)
Table 54 MEA Immuno Oncology Clinical Trials Market Forecast by Phase, 2023-2033 (US$ Million, CAGR %)
Table 55 MEA Immuno Oncology Clinical Trials Market Forecast by Design, 2023-2033 (US$ Million, CAGR %)
Table 56 MEA Immuno Oncology Clinical Trials Market Forecast by Indication, 2023-2033 (US$ Million, CAGR %)
Table 57 South Africa Immuno Oncology Clinical Trials Market Forecast, 2023-2033 (US$ Million, CAGR %)
Table 58 GCC Immuno Oncology Clinical Trials Market Forecast, 2023-2033 (US$ Million, CAGR %)
Table 59 Rest of MEA Immuno Oncology Clinical Trials Market Forecast, 2023-2033 (US$ Million, CAGR %)
Table 60 Strategic Outlook
Table 61 Merck & Co., Inc.: Key Details, (CEO, HQ, Revenue, Founded, No. of Employees, Company Type, Website, Business Segment)
Table 62 Merck & Co., Inc.: Product Benchmarking
Table 63 Merck & Co., Inc.: Strategic Outlook
Table 64 Bristol-Myers Squibb Company: Key Details, (CEO, HQ, Revenue, Founded, No. of Employees, Company Type, Website, Business Segment)
Table 65 Bristol-Myers Squibb Company: Product Benchmarking
Table 66 Bristol-Myers Squibb Company: Strategic Outlook
Table 67 Medpace, Inc.: Key Details, (CEO, HQ, Revenue, Founded, No. of Employees, Company Type, Website, Business Segment)
Table 68 Medpace, Inc.: Product Benchmarking
Table 69 Medpace, Inc.: Strategic Outlook
Table 70 Novartis AG: Key Details, (CEO, HQ, Revenue, Founded, No. of Employees, Company Type, Website, Business Segment)
Table 71 Novartis AG: Product Benchmarking
Table 72 Novartis AG: Strategic Outlook
Table 73 AstraZeneca plc: Key Details, (CEO, HQ, Revenue, Founded, No. of Employees, Company Type, Website, Business Segment)
Table 74 AstraZeneca plc: Product Benchmarking
Table 75 BioNTech SE: Key Details, (CEO, HQ, Revenue, Founded, No. of Employees, Company Type, Website, Business Segment)
Table 76 BioNTech SE: Product Benchmarking
Table 77 BioNTech SE: Strategic Outlook
Table 78 Exscientia plc: Key Details, (CEO, HQ, Revenue, Founded, No. of Employees, Company Type, Website, Business Segment)
Table 79 Exscientia plc: Product Benchmarking
Table 80 Exscientia plc: Strategic Outlook
Table 81 F. Hoffmann-La Roche AG: Key Details, (CEO, HQ, Revenue, Founded, No. of Employees, Company Type, Website, Business Segment)
Table 82 F. Hoffmann-La Roche AG: Product Benchmarking
Table 83 F. Hoffmann-La Roche AG: Strategic Outlook
Table 84 Pfizer Inc.: Key Details, (CEO, HQ, Revenue, Founded, No. of Employees, Company Type, Website, Business Segment)
Table 85 Pfizer Inc.: Product Benchmarking
Table 86 Pfizer Inc.: Strategic Outlook
Table 87 Syneos Health: Key Details, (CEO, HQ, Revenue, Founded, No. of Employees, Company Type, Website, Business Segment)
Table 88 Syneos Health: Product Benchmarking
Table 89 Syneos Health.: Strategic Outlook
Table 90 IO Biotech, Inc.: Key Details, (CEO, HQ, Revenue, Founded, No. of Employees, Company Type, Website, Business Segment)
Table 91 IO Biotech, Inc.: Product Benchmarking
Table 92 IO Biotech, Inc.: Strategic Outlook
Table 93 ICON plc: Key Details, (CEO, HQ, Revenue, Founded, No. of Employees, Company Type, Website, Business Segment)
Table 94 ICON plc: Product Benchmarking
Table 95 IQVIA Inc.: Key Details, (CEO, HQ, Revenue, Founded, No. of Employees, Company Type, Website, Business Segment)
Table 96 IQVIA INC.: Product Benchmarking
List of Figures
Figure 1 Immuno Oncology Clinical Trials Market Segmentation
Figure 2 Immuno Oncology Clinical Trials Market by Phase: Market Attractiveness Index
Figure 3 Immuno Oncology Clinical Trials Market by Design: Market Attractiveness Index
Figure 4 Immuno Oncology Clinical Trials Market by Indication: Market Attractiveness Index
Figure 5 Immuno Oncology Clinical Trials Market Attractiveness Index by Region
Figure 6 Immuno Oncology Clinical Trials Market: Market Dynamics
Figure 7 Global Cancer Cases, 2020
Figure 8 Top 10 Cancer Drugmakers by 2024
Figure 9 Immuno Oncology Clinical Trials Market by Region, 2023-2033 (US$ Million, AGR %): “V” Shaped Recovery
Figure 10 Immuno Oncology Clinical Trials Market by Region, 2023-2033 (US$ Million, AGR %): “U” Shaped Recovery
Figure 11 Immuno Oncology Clinical Trials Market by Region, 2023-2033 (US$ Million, AGR %): “W” Shaped Recovery
Figure 12 Immuno Oncology Clinical Trials Market by Region, 2023-2033 (US$ Million, AGR %): “L” Shaped Recovery
Figure 13 Immuno Oncology Clinical Trials Market by Phase: Market Attractiveness Index
Figure 14 Immuno Oncology Clinical Trials Market Forecast by Phase, 2023-2033 (US$ Million, AGR %)
Figure 15 Immuno Oncology Clinical Trials Market Share Forecast by Phase, 2023, 2028, 2033 (%)
Figure 16 Phase I Segment Market Forecast by Region, 2023-2033 (US$ Million, CAGR %)
Figure 17 Phase I Segment Market Share Forecast by Region, 2023 & 2033 (%)
Figure 18 Phase II Segment Market Forecast by Region, 2023-2033 (US$ Million, AGR %)
Figure 19 Phase II Segment Market Share Forecast by Region, 2023 & 2033 (%)
Figure 20 Phase III Segment Market Forecast by Region, 2023-2033 (US$ Million, AGR %)
Figure 21 Phase III Segment Market Share Forecast by Region, 2023 & 2033 (%)
Figure 22 Phase IV Segment Market Forecast by Region, 2023-2033 (US$ Million, AGR %)
Figure 23 Phase IV Segment Market Share Forecast by Region, 2023 & 2033 (%)
Figure 24 Immuno Oncology Clinical Trials Market by Design: Market Attractiveness Index
Figure 25 Immuno Oncology Clinical Trials Market Forecast by Design, 2023-2033 (US$ Million, AGR %)
Figure 26 Immuno Oncology Clinical Trials Market Share Forecast by Design, 2023, 2028, 2033 (%)
Figure 27 Interventional Trials Segment Market Forecast by Region, 2023-2033 (US$ Million, AGR %)
Figure 28 Interventional Trials Segment Market Share Forecast by Region, 2023 & 2033 (%)
Figure 29 Observational Trials Segment Market Forecast by Region, 2023-2033 (US$ Million, AGR %)
Figure 30 Observational Trials Segment Market Share Forecast by Region, 2023 & 2033 (%)
Figure 31 Expanded Access Trials Segment Market Forecast by Region, 2023-2033 (US$ Million, AGR %)
Figure 32 Expanded Access Trials Segment Market Share Forecast by Region, 2023 & 2033 (%)
Figure 33 Immuno Oncology Clinical Trials Market by Indication: Market Attractiveness Index
Figure 34 Immuno Oncology Clinical Trials Market Forecast by Indication, 2023-2033 (US$ Million, AGR %)
Figure 35 Immuno Oncology Clinical Trials Market Share Forecast by Indication, 2023, 2028, 2033 (%)
Figure 36 Solid Tumours Segment Market Forecast by Region, 2023-2033 (US$ Million, AGR %)
Figure 37 Solid Tumours Segment Market Share Forecast by Region, 2023 & 2033 (%)
Figure 38 Hematological Cancer Segment Market Forecast by Region, 2023-2033 (US$ Million, CAGR %)
Figure 39 Hematological Cancer Segment Market Share Forecast by Region, 2023 & 2033 (%)
Figure 40 Immuno Oncology Clinical Trials Market Forecast by Region 2023 and 2033 (Revenue, CAGR %)
Figure 41 Immuno Oncology Clinical Trials Market Share Forecast by Region 2023, 2028, 2033 (%)
Figure 42 Immuno Oncology Clinical Trials Market by Region, 2023-2033 (US$ Million, CAGR %)
Figure 43 North America Immuno Oncology Clinical Trials Market Attractiveness Index
Figure 44 North America Immuno Oncology Clinical Trials Market by Region, 2023, 2028 & 2033 (US$ Million)
Figure 45 North America Immuno Oncology Clinical Trials Market Forecast by Country, 2023-2033 (US$ Million, CAGR %)
Figure 46 North America Immuno Oncology Clinical Trials Market Share Forecast by Country, 2023 & 2033 (%)
Figure 47 North America Immuno Oncology Clinical Trials Market Forecast by Phase, 2023-2033 (US$ Million, AGR %)
Figure 48 North America Immuno Oncology Clinical Trials Market Share Forecast by Phase, 2023 & 2033 (%)
Figure 49 North America Immuno Oncology Clinical Trials Market Forecast by Design, 2023-2033 (US$ Million, AGR %)
Figure 50 North America Immuno Oncology Clinical Trials Market Share Forecast by Design, 2023 & 2033 (%)
Figure 51 North America Immuno Oncology Clinical Trials Market Forecast by Indication, 2023-2033 (US$ Million, AGR %)
Figure 52 North America Immuno Oncology Clinical Trials Market Share Forecast by Indication, 2023 & 2033 (%)
Figure 53 Immuno Oncology Clinical Trials in the United States
Figure 54 U.S. Immuno Oncology Clinical Trials Market Forecast, 2023-2033 (US$ Million, AGR %)
Figure 55 Canada Immuno Oncology Clinical Trials Market Forecast, 2023-2033 (US$ Million, AGR %)
Figure 56 Europe Immuno Oncology Clinical Trials Market Attractiveness Index
Figure 57 Europe Immuno Oncology Clinical Trials Market by Region, 2023, 2028 & 2033 (US$ Million)
Figure 58 Europe Immuno Oncology Clinical Trials Market Forecast by Country, 2023-2033 (US$ Million, AGR %)
Figure 59 Europe Immuno Oncology Clinical Trials Market Share Forecast by Country, 2023 & 2033 (%)
Figure 60 Europe Immuno Oncology Clinical Trials Market Forecast by Phase, 2023-2033 (US$ Million, AGR %)
Figure 61 Europe Immuno Oncology Clinical Trials Market Share Forecast by Phase, 2023 & 2033 (%)
Figure 62 Europe Immuno Oncology Clinical Trials Market Forecast by Design, 2023-2033 (US$ Million, AGR %)
Figure 63 Europe Immuno Oncology Clinical Trials Market Share Forecast by Design, 2023 & 2033 (%)
Figure 64 Europe Immuno Oncology Clinical Trials Market Forecast by Indication, 2023-2033 (US$ Million, AGR %)
Figure 65 Europe Immuno Oncology Clinical Trials Market Share Forecast by Indication, 2023 & 2033 (%)
Figure 66 Germany Immuno Oncology Clinical Trials Market Forecast, 2023-2033 (US$ Million, CAGR %)
Figure 67 UK Immuno Oncology Clinical Trials Market Forecast, 2023-2033 (US$ Million, AGR %)
Figure 68 France Immuno Oncology Clinical Trials Market Forecast, 2023-2033 (US$ Million, AGR %)
Figure 69 Italy Immuno Oncology Clinical Trials Market Forecast, 2023-2033 (US$ Million, AGR %)
Figure 70 Spain Immuno Oncology Clinical Trials Market Forecast, 2023-2033 (US$ Million, AGR %)
Figure 71 Rest of Europe Immuno Oncology Clinical Trials Market Forecast, 2023-2033 (US$ Million, AGR %)
Figure 72 Asia Pacific Immuno Oncology Clinical Trials Market Attractiveness Index
Figure 73 Asia Pacific Immuno Oncology Clinical Trials Market by Region, 2023, 2028 & 2033 (US$ Million)
Figure 74 Asia Pacific Immuno Oncology Clinical Trials Market Forecast by Country, 2023-2033 (US$ Million, AGR %)
Figure 75 Asia Pacific Immuno Oncology Clinical Trials Market Share Forecast by Country, 2023 & 2033 (%)
Figure 76 Asia Pacific Immuno Oncology Clinical Trials Market Forecast by Phase, 2023-2033 (US$ Million, AGR %)
Figure 77 Asia Pacific Immuno Oncology Clinical Trials Market Share Forecast by Phase, 2023 & 2033 (%)
Figure 78 Asia Pacific Immuno Oncology Clinical Trials Market Forecast by Design, 2023-2033 (US$ Million, AGR %)
Figure 79 Asia Pacific Immuno Oncology Clinical Trials Market Share Forecast by Design, 2023 & 2033 (%)
Figure 80 Asia Pacific Immuno Oncology Clinical Trials Market Forecast by Indication, 2023-2033 (US$ Million, AGR %)
Figure 81 Asia Pacific Immuno Oncology Clinical Trials Market Share Forecast by Indication, 2023 & 2033 (%)
Figure 82 China Immuno Oncology Clinical Trials Market Forecast, 2023-2033 (US$ Million, AGR %)
Figure 83 Japan Immuno Oncology Clinical Trials Market Forecast, 2023-2033 (US$ Million, AGR %)
Figure 84 India Immuno Oncology Clinical Trials Market Forecast, 2023-2033 (US$ Million, AGR %)
Figure 85 Australia Immuno Oncology Clinical Trials Market Forecast, 2023-2033 (US$ Million, AGR %)
Figure 86 South Korea Immuno Oncology Clinical Trials Market Forecast, 2023-2033 (US$ Million, AGR %)
Figure 87 Rest of Asia Pacific Immuno Oncology Clinical Trials Market Forecast, 2023-2033 (US$ Million, AGR %)
Figure 88 Latin America Immuno Oncology Clinical Trials Market Attractiveness Index
Figure 89 Latin America Immuno Oncology Clinical Trials Market by Region, 2023, 2028 & 2033 (US$ Million)
Figure 90 Latin America Immuno Oncology Clinical Trials Market Forecast by Country, 2023-2033 (US$ Million, CAGR %)
Figure 91 Latin America Immuno Oncology Clinical Trials Market Share Forecast by Country, 2023 & 2033 (%)
Figure 92 Latin America Immuno Oncology Clinical Trials Market Forecast by Phase, 2023-2033 (US$ Million, AGR %)
Figure 93 Latin America Immuno Oncology Clinical Trials Market Share Forecast by Phase, 2023 & 2033 (%)
Figure 94 Latin America Immuno Oncology Clinical Trials Market Forecast by Design, 2023-2033 (US$ Million, AGR %)
Figure 95 Latin America Immuno Oncology Clinical Trials Market Share Forecast by Design, 2023 & 2033 (%)
Figure 96 Latin America Immuno Oncology Clinical Trials Market Forecast by Indication, 2023-2033 (US$ Million, AGR %)
Figure 97 Latin America Immuno Oncology Clinical Trials Market Share Forecast by Indication, 2023 & 2033 (%)
Figure 98 Brazil Immuno Oncology Clinical Trials Market Forecast, 2023-2033 (US$ Million, AGR %)
Figure 99 Mexico Immuno Oncology Clinical Trials Market Forecast, 2023-2033 (US$ Million, CAGR %)
Figure 100 Rest of Latin America Immuno Oncology Clinical Trials Market Forecast, 2023-2033 (US$ Million, AGR %)
Figure 101 MEA Immuno Oncology Clinical Trials Market Attractiveness Index
Figure 102 MEA Immuno Oncology Clinical Trials Market by Region, 2023, 2028 & 2033 (US$ Million)
Figure 103 MEA Immuno Oncology Clinical Trials Market Forecast by Country, 2023-2033 (US$ Million, CAGR %)
Figure 104 MEA Immuno Oncology Clinical Trials Market Share Forecast by Country, 2023 & 2033 (%)
Figure 105 MEA Immuno Oncology Clinical Trials Market Forecast by Phase, 2023-2033 (US$ Million, AGR %)
Figure 106 MEA Immuno Oncology Clinical Trials Market Share Forecast by Phase, 2023 & 2033 (%)
Figure 107 MEA Immuno Oncology Clinical Trials Market Forecast by Design, 2023-2033 (US$ Million, AGR %)
Figure 108 MEA Immuno Oncology Clinical Trials Market Share Forecast by Design, 2023 & 2033 (%)
Figure 109 MEA Immuno Oncology Clinical Trials Market Forecast by Indication, 2023-2033 (US$ Million, AGR %)
Figure 110 MEA Immuno Oncology Clinical Trials Market Share Forecast by Indication, 2023 & 2033 (%)
Figure 111 South Africa Immuno Oncology Clinical Trials Market Forecast, 2023-2033 (US$ Million, AGR %)
Figure 112 GCC Immuno Oncology Clinical Trials Market Forecast, 2023-2033 (US$ Million, AGR %)
Figure 113 Rest of MEA Immuno Oncology Clinical Trials Market Forecast, 2023-2033 (US$ Million, AGR %)
Figure 114 Immuno Oncology Clinical Trials Market: Company Share Analysis
Figure 115 Merck & Co., Inc.: Net Revenue, 2017-2022 (US$ Million, AGR%)
Figure 116 Merck & Co., Inc.: R&D, 2017-2022 (US$ Million, AGR%)
Figure 117 Merck & Co., Inc.: Regional Market Shares, 2022
Figure 118 Bristol-Myers Squibb Company: Net Revenue, 2017-2022 (US$ Million, AGR%)
Figure 119 Bristol-Myers Squibb Company: R&D, 2017-2022 (US$ Million, AGR%)
Figure 120 Bristol-Myers Squibb Company: Regional Market Shares, 2022
Figure 121 Medpace, Inc.: Net Revenue, 2017-2022 (US$ Million, AGR%)
Figure 122 Novartis AG: Net Revenue, 2017-2022 (US$ Million, AGR%)
Figure 123 Novartis AG: R&D, 2017-2022 (US$ Million, AGR%)
Figure 124 Novartis AG: Regional Market Shares, 2022
Figure 125 AstraZeneca plc: Net Revenue, 2017-2022 (US$ Million, AGR%)
Figure 126 AstraZeneca plc: R&D, 2017-2022 (US$ Million, AGR%)
Figure 127 AstraZeneca plc: Regional Market Shares, 2022
Figure 128 BioNTech SE: Net Revenue, 2017-2022 (US$ Million, AGR%)
Figure 129 BioNTech SE: R&D, 2017-2022 (US$ Million, AGR%)
Figure 130 Exscientia plc: Net Revenue, 2020-2022 (US$ Million, AGR%)
Figure 131 Exscientia plc: R&D, 2020-2022 (US$ Million, AGR%)
Figure 132 Exscientia plc: Regional Market Shares, 2022
Figure 133 F. Hoffmann-La Roche AG: Net Revenue, 2017-2022 (US$ Million, AGR%)
Figure 134 F. Hoffmann-La Roche AG: R&D, 2017-2022 (US$ Million, AGR%)
Figure 135 F. Hoffmann-La Roche AG: Regional Market Shares, 2022
Figure 136 Pfizer Inc.: Net Revenue, 2017-2022 (US$ Million, AGR%)
Figure 137 Pfizer Inc.: R&D, 2017-2022 (US$ Million, AGR%)
Figure 138 Pfizer Inc.: Regional Market Shares, 2022
Figure 139 Syneos Health.: Net Revenue, 2017-2022 (US$ Million, AGR%)
Figure 140 Syneos Health: Regional Market Shares, 2021
Figure 141 ICON plc: Net Revenue, 2017-2022 (US$ Million, AGR%)
Figure 142 ICON plc: Regional Market Shares, 2022
Figure 143 IQVIA Inc.: Net Revenue, 2017-2022 (US$ Million, AGR%)
Figure 144 IQVIA Inc.: R&D, 2017-2022 (US$ Million, AGR%)
Figure 145 IQVIA Inc.: Regional Market Shares, 2022
ページTOPに戻る
関連レポート(キーワード「免疫」)
よくあるご質問
Visiongain社はどのような調査会社ですか?
英国の調査会社ヴィジョンゲイン社(Visiongain)は、通信とエネルギーのほか、自動車や化学・医薬品、金属など、広範な市場を対象に調査を行っています。自動車市場については、市場全般に関する調査のほ... もっと見る
調査レポートの納品までの日数はどの程度ですか?
在庫のあるものは速納となりますが、平均的には 3-4日と見て下さい。
但し、一部の調査レポートでは、発注を受けた段階で内容更新をして納品をする場合もあります。
発注をする前のお問合せをお願いします。
注文の手続きはどのようになっていますか?
1)お客様からの御問い合わせをいただきます。
2)見積書やサンプルの提示をいたします。
3)お客様指定、もしくは弊社の発注書をメール添付にて発送してください。
4)データリソース社からレポート発行元の調査会社へ納品手配します。
5) 調査会社からお客様へ納品されます。最近は、pdfにてのメール納品が大半です。
お支払方法の方法はどのようになっていますか?
納品と同時にデータリソース社よりお客様へ請求書(必要に応じて納品書も)を発送いたします。
お客様よりデータリソース社へ(通常は円払い)の御振り込みをお願いします。
請求書は、納品日の日付で発行しますので、翌月最終営業日までの当社指定口座への振込みをお願いします。振込み手数料は御社負担にてお願いします。
お客様の御支払い条件が60日以上の場合は御相談ください。
尚、初めてのお取引先や個人の場合、前払いをお願いすることもあります。ご了承のほど、お願いします。
データリソース社はどのような会社ですか?
当社は、世界各国の主要調査会社・レポート出版社と提携し、世界各国の市場調査レポートや技術動向レポートなどを日本国内の企業・公官庁及び教育研究機関に提供しております。
世界各国の「市場・技術・法規制などの」実情を調査・収集される時には、データリソース社にご相談ください。
お客様の御要望にあったデータや情報を抽出する為のレポート紹介や調査のアドバイスも致します。
|
|


