原子炉冷却システム市場レポート:2023-2033
Reactor Cooling Systems Market Report 2023-2033
レポート詳細
原子炉冷却システム市場レポート 2023-2033 :本レポートは、新たな収益の柱を目指す大手企業にとって、業界とその根底にある力学をより深く理解する上で貴重なものとなろう。異業種への... もっと見る
※上記価格は部署ライセンス(Departmental licence)価格です。
その他の価格についてはデータリソースまでお問合せください。
日本語のページは自動翻訳を利用し作成しています。
実際のレポートは英文のみでご納品いたします。

|

|
サマリー
レポート詳細
原子炉冷却システム市場レポート 2023-2033:本レポートは、新たな収益の柱を目指す大手企業にとって、業界とその根底にある力学をより深く理解する上で貴重なものとなろう。異業種への進出や、新たな地域での既存事業の拡大を希望する企業にとっても有用であろう。
世界のエネルギー需要に安全かつ持続的に応える
急速な都市化、工業化、デジタル化によって世界的に高まる電力需要は、各国に多様なエネルギー源の探求を迫っている。原子力発電は、この需要を満たすための信頼性が高く低炭素なソリューションを提供し、原子炉冷却システム市場の拡大に拍車をかけている。原子炉冷却システムは、原子力発電所の安全性と効率を維持し、クリーンなエネルギーの安定供給を確保する上で極めて重要な役割を果たしている。エネルギー需要が増加し続ける中、原子炉の過熱を防ぐ効率的な冷却システムの必要性はさらに高まっている。
クリーンで効率的な原子力エネルギーで未来を支える
数多くの国が、エネルギー安全保障と環境目標を達成するために原子力を導入している。各国が原子力発電所の新設や既存施設の近代化に投資する中、先進的な原子炉冷却システムの需要が顕著に高まっている。これらのシステムは、原子炉の最適な性能を確保し、過熱リスクを軽減し、廃熱を効果的に管理するために不可欠である。原子力のインフラが拡大するにつれ、原子炉冷却システム市場は、安全性と運転効率を維持する信頼性の高い冷却ソリューションに対する需要の増加により、勢いを増している。
市場調査レポートを購入する前にすべき質問とは?
- 原子炉冷却システム市場はどのように進化しているのか?
- 原子炉冷却システム市場の推進要因と抑制要因は何か?
- 原子炉冷却システムの各サブ市場セグメントは予測期間中にどのように成長し、2033年にどれくらいの収益を占めるようになるのか?
- 2023年から2033年にかけて、原子炉冷却システムの各サブマーケットの市場シェアはどのように推移するのか?
- 2023年から2033年にかけて市場全体を牽引する主な要因は何か?
- 主要な原子炉冷却システム市場はマクロ経済の動きに大枠で追随するのか、それとも個々の国内市場が他を上回るのか?
- 2033年までに各国市場のシェアはどう変化し、2033年に市場をリードするのはどの地域か?
- 主要プレーヤーと予測期間中の見通しは?
- 主要企業の原子炉冷却システムプロジェクトは?
- 2023年から2033年にかけて、業界はどのように発展していくのか?現在および今後10年間の原子炉冷却システムプロジェクトにはどのような意味があるのでしょうか?
- 原子炉冷却システム市場をさらに拡大するために、製品の商業化の必要性は高まっていますか?
- 原子炉冷却システム市場の方向性と、市場の最前線に立つにはどうすればよいか?
- 新製品やサービスラインに対する最適な投資オプションは何か?
- 企業を新たな成長軌道に乗せ、C-suiteに移行させるための重要な展望とは?
このことが原子炉冷却システム市場に現在、そして今後10年間でどのような影響を与えるかを見極める必要がある:
- 359ページにわたる本レポートでは、138の表と208の図表を掲載しています。
- 本レポートは、業界における主要な有利分野にハイライトを当てているため、今すぐターゲットを絞ることができます。
- 本レポートには、世界、地域、国の売上と成長に関する詳細な分析が含まれています。
- 競合他社が成功した主なトレンド、変化、収益予測をハイライトしています。
本レポートは、原子炉冷却システム市場が今後10年間でどのように発展するか、またCOVID-19の景気後退と好転の変動に合わせてどのように発展するかをお伝えします。この市場は、過去10年間のどの時点よりも今が重要です。
2033年までの予測やその他の分析から、商業的な展望が明らかになる
- 2033年までの収益予測に加え、直近の業績、成長率、市場シェアもご覧いただけます。
- ビジネスの展望と展開に関する独自の分析をご覧いただけます。
- 定性的分析(市場ダイナミクス、促進要因、機会、阻害要因、課題など)、コスト構造、原子炉冷却システム価格上昇の影響、最近の動向などをご覧いただけます。
本レポートには、COVID-19が業界と貴社にどのような影響を与えるかについてのデータ分析と貴重な洞察が含まれている。本レポートでは、COVID-19の4つの回収パターンとその影響、すなわち「V」、「L」、「W」、「U」について論じている。
レポート対象セグメント
容量別市場セグメント
- 小型/中型炉
- 大型炉
構成別市場セグメント
- 貫流冷却
- クローズドサイクル冷却
- ハイブリッド冷却
メカニズム別市場セグメント
- 直接冷却
- 間接冷却
- パッシブ冷却
- アクティブ冷却
システムタイプ別市場セグメント
- 加圧水型原子炉(PWR)冷却システム
- 沸騰水型原子炉(BWR)冷却システム
- 先進ガス冷却炉(AGCR)冷却システム
- 加圧水型重水炉(PHWR)冷却システム
- その他のシステムタイプ
コンポーネント別市場セグメント
- 熱交換器
- 冷却塔
- ポンプとバルブ
- コンデンサー
- 冷却水処理システム
- その他のコンポーネント
世界市場全体とセグメント別の収益予測に加え、4つの地域と20の主要国市場の収益予測も掲載しています:
北米
- アメリカ
- カナダ
欧州
- ドイツ
- スペイン
- イギリス
- フランス
- ロシア
- その他の欧州
アジア太平洋
- 中国
- 日本
- インド
- オーストラリア
- 韓国
- その他のアジア太平洋地域
ラテンアメリカ
- ブラジル
- アルゼンチン
- その他のラテンアメリカ
中東・アフリカ
- GCC
- 南アフリカ
- その他の中東・アフリカ
このレポートには、原子炉冷却システム市場の2023年から2033年にかけての主要企業のプロファイルも含まれており、これらの企業の事業のこのセグメントに焦点を当てています。
主要企業と市場成長の可能性
・ Areva S.A.
・ Babcock International Group plc
・ Bharat Heavy Electricals Limited (BHEL)
・ China Nuclear Power Engineering Co Ltd
・ Dongfang Electric Corporation
・ General Electric Company
・ Harbin Electric Company Limited
・ IHI Corporation
・ KSB SE & Co. KGaA
・ Mitsubishi Heavy Industries, Ltd
・ Rolls-Royce Limited
・ Rosatom State Nuclear Energy Corporation
・ Shanghai Electric Group Company Limited
・ Sulzer Ltd.
・ Westinghouse Electric Company LLC
原子炉冷却システム市場の2023年~2033年の世界全体売上高(金額ベース)は、2023年に91億8530万米ドルを超えると予測。2033年まで力強い収益成長を予測。当研究所では、最大の可能性を秘めた組織を特定しています。彼らの能力、進歩、商業的展望を発見し、一歩先を行くお手伝いをします。
原子炉冷却システム市場、2023-2033年レポートはどのようにお役に立ちますか?
要約すると、350ページを超えるこのレポートは、以下の知識を提供する:
- 原子炉冷却システム市場の2023年から2033年までの収益予測 世界および地域レベルでの容量、構成、メカニズム、システムタイプ、コンポーネント、各予測による、原子炉冷却システム市場の2033年までの収益予測 - 業界の展望を発見し、投資と収益に最も有利な場所を見つけます。
- 4つの地域と20の主要国市場の2033年までの収益予測 - 原子炉冷却システム市場の2023年から2033年までの北米、ヨーロッパ、アジア太平洋、ラテンアメリカ、中東&アフリカの市場予測をご覧ください。また、米国、カナダ、ブラジル、ドイツ、フランス、英国、ロシア、中国、インド、日本、オーストラリアなどの著名な経済圏の市場も予測しています。
- 既存企業および市場参入を目指す企業の展望 - 原子炉冷却システム市場に関わる主要企業15社の企業プロファイルを含む、2023年から2033年までの展望。
独自の予測による定量的・定性的分析をご覧ください。私たちのレポートだけに含まれる情報を入手し、貴重なビジネスインテリジェンスで情報を得ることができます。
他にはない情報
私たちの新しいレポートがあれば、知識に遅れをとったり、チャンスを逃したりする可能性が低くなります。弊社の調査レポートが貴社の調査、分析、意思決定にどのように役立つかをご覧ください。Visiongainの調査は、原子炉冷却システム市場、2023年から2033年、市場をリードする企業の商業分析を必要とするすべての人のためのものです。データ、トレンド、予測をご覧いただけます。
ページTOPに戻る
目次
目次
1 レポート概要
1.1 研究の目的
1.2 原子炉冷却システム市場の紹介
1.3 本レポートの内容
1.4 本レポートを読むべき理由
1.5 本分析レポートが回答する主な質問
1.6 本レポートの対象者
1.7 調査方法
1.7.1 市場の定義
1.7.2 市場評価・予測手法
1.7.3 データ検証
1.7.3.1 一次調査
1.7.3.2 セカンダリーリサーチ
1.8 よくある質問(FAQ)
1.9 Visiongainの関連レポート
1.10 Visiongainについて
2 エグゼクティブ・サマリー
2.1 セグメント分析
2.1.1 容量セグメント市場魅力度指数
2.1.2 構成セグメント:市場魅力度指数
2.1.3 メカニズムセグメント市場魅力度指数
2.1.4 システムタイプ別セグメント市場魅力度指数
2.1.5 コンポーネントセグメント市場魅力度指数
2.2 地域別分析
3 市場概要
3.1 主要な調査結果
3.2 市場ダイナミクス
3.2.1 市場促進要因
3.2.1.1 原子力需要の増加
3.2.1.2 新しい原子炉技術の開発
3.2.1.3 安全性と効率性の重視
3.2.2 市場の阻害要因
3.2.2.1 原子炉冷却システムの高コスト
3.2.2.2 熟練労働者の不足
3.2.2.3 原子力発電所は厳しい規制監督下にある
3.2.3 市場機会
3.2.3.1 新興市場における需要の増大
3.2.3.2 新しい冷却剤の開発
3.2.3.3 研究開発投資の増加
3.3 COVID-19の影響分析
3.3.1 V字型回収
3.3.2 W字型回復
3.3.3 U字型回収
3.3.4 L字型回復
3.4 ポーターのファイブフォース分析
3.4.1 サプライヤーの交渉力(低い)
3.4.2 買い手の交渉力(中程度)
3.4.3 競争力(高)
3.4.4 代替品による脅威(中程度)
3.4.5 新規参入企業の脅威(低)
3.5 PEST分析
3.5.1 政治的要因
3.5.2 経済的要因
3.5.3 社会的要因
3.5.4 技術的要因
4 原子炉冷却システム市場分析:容量別
4.1 主要な調査結果
4.2 容量セグメント 市場魅力度指数
4.3 原子炉冷却システムの容量別市場規模推定と予測
4.4 小型/中型原子炉市場
4.4.1 2023年~2033年の地域別市場規模(US$ Million)
4.4.2 地域別市場シェア、2023年・2033年(%)
4.5 大型原子炉市場
4.5.1 2023~2033年の地域別市場規模(US$ Million)
4.5.2 地域別市場シェア、2023年・2033年(%)
5 原子炉冷却システム市場分析:構成別
5.1 主要調査結果
5.2 構成セグメント 市場魅力度指数
5.3 原子炉冷却システムの構成別市場規模推定と予測
5.4 ワンススルー冷却市場
5.4.1 2023〜2033年の地域別市場規模(US$ Million)
5.4.2 地域別市場シェア、2023年・2033年(%)
5.5 クローズドサイクル冷却市場
5.5.1 2023~2033年の地域別市場規模(US$ Million)
5.5.2 地域別市場シェア、2023年・2033年(%)
5.6 ハイブリッド冷却市場
5.6.1 2023〜2033年の地域別市場規模(US$ Million)
5.6.2 地域別市場シェア、2023年・2033年 (%)
6 原子炉冷却システム市場分析:メカニズム別
6.1 主要な調査結果
6.2 メカニズムセグメント 市場魅力度指数
6.3 原子炉冷却システムのメカニズム別市場規模推定と予測
6.4 直接冷却市場
6.4.1 2023〜2033年の地域別市場規模(US$ Million)
6.4.2 地域別市場シェア、2023年・2033年(%)
6.5 間接冷却市場
6.5.1 2023~2033年の地域別市場規模(US$ Million)
6.5.2 地域別市場シェア、2023年・2033年(%)
6.6 パッシブ冷却市場
6.6.1 2023〜2033年の地域別市場規模(US$ Million)
6.6.2 地域別市場シェア、2023年・2033年(%)
6.7 アクティブ冷却市場
6.7.1 2023〜2033年の地域別市場規模(US$ Million)
6.7.2 地域別市場シェア、2023年・2033年(%)
7 原子炉冷却システム市場分析:システムタイプ別
7.1 主要な調査結果
7.2 システムタイプ別セグメント 市場魅力度指数
7.3 原子炉冷却システムのシステムタイプ別市場規模推定と予測
7.4 加圧水型原子炉(PWR)冷却システム市場
7.4.1 2023~2033年の地域別市場規模(US$ Million)
7.4.2 地域別市場シェア、2023年・2033年(%)
7.5 沸騰水型原子炉(BWR)冷却システム市場
7.5.1 2023~2033年の地域別市場規模(US$ Million)
7.5.2 地域別市場シェア、2023年・2033年(%)
7.6 先進ガス冷却炉(AGCR)冷却システム市場
7.6.1 2023~2033年の地域別市場規模(US$ Million)
7.6.2 地域別市場シェア、2023年・2033年(%)
7.7 加圧水型重水炉(PHWR)冷却システム市場
7.7.1 2023~2033年の地域別市場規模(US$ Million)
7.7.2 地域別市場シェア、2023年・2033年(%)
7.8 その他のシステムタイプ市場
7.8.1 2023~2033年の地域別市場規模(US$ Million)
7.8.2 地域別市場シェア、2023年・2033年(%)
8 原子炉冷却システム市場分析:コンポーネント別
8.1 主要な調査結果
8.2 コンポーネントセグメント 市場魅力度指数
8.3 原子炉冷却システムのコンポーネント別市場規模推定と予測
8.4 熱交換器市場
8.4.1 2023〜2033年の地域別市場規模(US$ Million)
8.4.2 地域別市場シェア、2023年・2033年(%)
8.5 冷却塔市場
8.5.1 2023~2033年の地域別市場規模(US$ Million)
8.5.2 地域別市場シェア、2023年・2033年(%)
8.6 ポンプ・バルブ市場
8.6.1 2023~2033年の地域別市場規模(US$ Million)
8.6.2 地域別市場シェア、2023年・2033年(%)
8.7 コンデンサ市場
8.7.1 2023~2033年の地域別市場規模(US$ Million)
8.7.2 地域別市場シェア、2023年・2033年(%)
8.8 冷却水処理システム市場
8.8.1 2023~2033年の地域別市場規模(US$ Million)
8.8.2 地域別市場シェア、2023年・2033年(%)
8.9 その他のコンポーネント市場
8.9.1 2023〜2033年の地域別市場規模(US$ Million)
8.9.2 地域別市場シェア、2023年・2033年(%)
9 原子炉冷却システム市場分析:地域別
9.1 主要な調査結果
9.2 地域別市場規模の推定と予測
10 北米の原子炉冷却システム市場分析
10.1 主要な調査結果
10.2 北米原子炉冷却システム市場魅力度指数
10.3 北米の原子炉冷却システム市場:国別、2023年、2028年、2033年 (US$ Million)
10.4 北米の原子炉冷却システム市場規模推定と予測:金額ベース
10.5 北米の原子炉冷却システム市場:国別
10.6 北米の原子炉冷却システム市場:容量別
10.7 北米の原子炉冷却システム市場:構成別
10.8 北米の原子炉冷却システム市場:メカニズム別
10.9 北米の原子炉冷却システム市場:システムタイプ別
10.10 北米の原子炉冷却システム市場:コンポーネント別
10.11 米国の原子炉冷却システム市場
10.12 カナダの原子炉冷却システム市場
11 欧州の原子炉冷却システム市場分析
11.1 主要な調査結果
11.2 欧州原子炉冷却システム市場魅力度指数
11.3 欧州の原子炉冷却システム国別市場:2023年、2028年、2033年(US$ Million)
11.4 欧州の原子炉冷却システム市場規模推定と予測:金額ベース
11.5 欧州の原子炉冷却システム市場:国別
11.6 欧州の原子炉冷却システム市場:容量別
11.7 欧州の原子炉冷却システム市場:構成別
11.8 欧州の原子炉冷却システム市場:メカニズム別
11.9 欧州の原子炉冷却システム市場:システムタイプ別
11.10 欧州の原子炉冷却システム市場:コンポーネント別
11.11 ドイツの原子炉冷却システム市場
11.12 イギリスの原子炉冷却システム市場
11.13 フランスの原子炉冷却システム市場
11.14 ロシアの原子炉冷却システム市場
11.15 スペインの原子炉冷却システム市場
11.16 その他の欧州原子炉冷却システム市場
12 アジア太平洋の原子炉冷却システム市場分析
12.1 主要な調査結果
12.2 アジア太平洋原子炉冷却システム市場魅力度指数
12.3 アジア太平洋地域の原子炉冷却システムの国別市場、2023年、2028年、2033年 (US$ Million)
12.4 アジア太平洋地域の原子炉冷却システム市場規模推定と予測:金額ベース
12.5 アジア太平洋地域の原子炉冷却システム市場:国別
12.6 アジア太平洋地域の原子炉冷却システム市場:容量別
12.7 アジア太平洋地域の原子炉冷却システム市場:構成別
12.8 アジア太平洋地域の原子炉冷却システム市場:メカニズム別
12.9 アジア太平洋地域の原子炉冷却システム市場:システムタイプ別
12.10 アジア太平洋地域の原子炉冷却システム市場:コンポーネント別
12.11 中国の原子炉冷却システム市場
12.12 インドの原子炉冷却システム市場
12.13 日本の原子炉冷却システム市場
12.14 韓国の原子炉冷却システム市場
12.15 オーストラリアの原子炉冷却システム市場
12.16 その他のアジア太平洋地域原子炉冷却システム市場
13 中東・アフリカの原子炉冷却システム市場分析
13.1 主要な調査結果
13.2 中東・アフリカの原子炉冷却システム市場魅力度指数
13.3 中東・アフリカの原子炉冷却システムの国別市場、2023年、2028年、2033年 (US$ Million)
13.4 中東・アフリカの原子炉冷却システム市場規模推定と予測:金額ベース
13.5 中東・アフリカの原子炉冷却システム市場:国別
13.6 中東・アフリカの原子炉冷却システム市場:容量別
13.7 中東・アフリカの原子炉冷却システム市場:構成別
13.8 中東・アフリカの原子炉冷却システム市場:メカニズム別
13.9 中東・アフリカの原子炉冷却システム市場:システムタイプ別
13.10 中東・アフリカの原子炉冷却システム市場:コンポーネント別
13.11 GCCの原子炉冷却システム市場
13.12 南アフリカの原子炉冷却システム市場
13.13 その他の中東・アフリカ原子炉冷却システム市場
14 ラテンアメリカの原子炉冷却システム市場分析
14.1 主要な調査結果
14.2 ラテンアメリカ原子炉冷却システム市場魅力度指数
14.3 ラテンアメリカの原子炉冷却システム市場国別、2023年、2028年、2033年 (US$ Million)
14.4 ラテンアメリカの原子炉冷却システム市場規模推定と予測:金額ベース
14.5 ラテンアメリカの原子炉冷却システム市場:国別
14.6 ラテンアメリカの原子炉冷却システム市場:容量別
14.7 ラテンアメリカの原子炉冷却システム市場:構成別
14.8 ラテンアメリカの原子炉冷却システム市場:メカニズム別
14.9 ラテンアメリカの原子炉冷却システム市場:システムタイプ別
14.10 ラテンアメリカの原子炉冷却システム市場:コンポーネント別
14.11 ブラジルの原子炉冷却システム市場
14.12 アルゼンチンの原子炉冷却システム市場
14.13 その他のラテンアメリカの原子炉冷却システム市場
15 会社概要
15.1 競争環境、2022年
15.2 戦略的展望
15.3 Areva S.A.
15.3.1 会社概要
15.3.2 会社概要
15.3.3 製品ベンチマーク
15.3.4 戦略的展望
15.4 General Electric Company
15.4.1 会社概要
15.4.2 会社概要
15.4.3 財務分析
15.4.3.1 純収入、2018-2022年
15.4.3.2 R&D、2018-2022年
15.4.3.3 地域別収益シェア、2022年(%)
15.4.3.4 事業セグメント収益シェア、2022年(%)
15.4.4 製品ベンチマーク
15.4.5 戦略的展望
15.5 Westinghouse Electric Company LLC
15.5.1 会社概要
15.5.2 会社概要
15.5.3 製品ベンチマーク
15.5.4 戦略的展望
15.6 Mitsubishi Heavy Industries, Ltd
15.6.1 会社概要
15.6.2 会社概要
15.6.3 財務分析
15.6.3.1 純収入、2018-2022年
15.6.3.2 R&D、2018年~2022年
15.6.3.3 地域別収益シェア、2022年(%)
15.6.3.4 事業セグメント収益シェア、2022年(%)
15.6.4 製品ベンチマーク
15.6.5 戦略的展望
15.7 Babcock International Group plc
15.7.1 会社概要
15.7.2 会社概要
15.7.3 財務分析
15.7.3.1 純収入、2018年~2022年
15.7.3.2 地域別収益シェア、2022年(%)
15.7.3.3 事業セグメント別売上シェア、2022年(%)
15.7.4 製品ベンチマーク
15.8 Harbin Electric Company Limited
15.8.1 会社概要
15.8.2 会社概要
15.8.3 財務分析
15.8.3.1 純収入、2018-2022年
15.8.3.2 R&D、2018年~2022年
15.8.3.3 地域別収益シェア、2022年(%)
15.8.3.4 事業セグメント収益シェア、2022年(%)
15.8.4 製品ベンチマーク
15.9 Dongfang Electric Corporation
15.9.1 会社概要
15.9.2 会社概要
15.9.3 財務分析
15.9.3.1 純収入、2018-2022年
15.9.3.2 R&D、2018年~2022年
15.9.3.3 地域別収益シェア、2022年(%)
15.9.3.4 事業セグメント収益シェア、2022年(%)
15.9.4 製品ベンチマーク
15.9.5 戦略的展望
15.10 China Nuclear Power Engineering Co Ltd
15.10.1 会社概要
15.10.2 会社概要
15.10.3 製品ベンチマーク
15.10.4 戦略的展望
15.11 Bharat Heavy Electricals Limited (BHEL)
15.11.1 会社概要
15.11.2 会社概要
15.11.3 財務分析
15.11.3.1 純収入、2018年~2022年
15.11.3.2 R&D、2018年~2022年
15.11.3.3 地域別収益シェア、2022年(%)
15.11.3.4 事業セグメント収益シェア、2022年(%)
15.11.4 製品ベンチマーク
15.11.5 戦略的展望
15.12 Rosatom State Nuclear Energy Corporation
15.12.1 会社概要
15.12.2 会社概要
15.12.3 製品ベンチマーク
15.12.4 戦略的展望
15.13 Sulzer Ltd.
15.13.1 会社概要
15.13.2 会社概要
15.13.3 財務分析
15.13.3.1 純収入、2018年~2022年
15.13.3.2 R&D、2018年~2022年
15.13.3.3 地域別収益シェア、2022年(%)
15.13.3.4 事業セグメント収益シェア、2022年(%)
15.13.4 製品ベンチマーク
15.14 Shanghai Electric Group Company Limited
15.14.1 会社概要
15.14.2 会社概要
15.14.3 財務分析
15.14.3.1 純収入、2018-2022年
15.14.3.2 R&D、2018-2022年
15.14.3.3 地域別収益シェア、2022年(%)
15.14.3.4 事業セグメント収益シェア、2022年(%)
15.14.4 製品ベンチマーク
15.14.5 戦略的展望
15.15 KSB SE & Co.KGaA
15.15.1 会社概要
15.15.2 会社概要
15.15.3 製品ベンチマーク
15.16 Rolls-Royce Limited
15.16.1 会社概要
15.16.2 会社概要
15.16.3 財務分析
15.16.3.1 純収入、2018-2022年
15.16.3.2 R&D、2018年〜2022年
15.16.3.3 地域別収入シェア、2022年(%)
15.16.3.4 事業セグメント収益シェア、2022年(%)
15.16.4 製品ベンチマーク
15.16.5 戦略的展望
15.17 IHI Corporation
15.17.1 会社概要
15.17.2 会社概要
15.17.3 財務分析
15.17.3.1 純収入、2018年~2022年
15.17.3.2 R&D、2018年~2022年
15.17.3.3 地域別売上シェア、2022年(%)
15.17.3.4 事業セグメント収益シェア、2022年(%)
15.17.4 製品ベンチマーク
15.17.5 戦略的展望
16 結論と提言
16.1 Visiongainからの結びの言葉
16.2 市場プレイヤーへの提言
ページTOPに戻る
図表リスト
表の一覧
Table 1 Reactor Cooling Systems Market Snapshot, 2023 & 2033 (US$ Million, CAGR %)
Table 2 Global Reactor Cooling Systems Market Forecast, 2023-2033 (US$ Mn, AGR (%), CAGR (%)) (V-Shaped Recovery Scenario)
Table 3 Global Reactor Cooling Systems Market by Region, 2023-2033 (US$ Mn, AGR (%), CAGR (%)) (V-Shaped Recovery Scenario)
Table 4 Global Reactor Cooling Systems Market Forecast, 2023-2033 (US$ Mn, AGR (%), CAGR (%)) (W-Shaped Recovery Scenario)
Table 5 Global Reactor Cooling Systems Market by Region, 2023-2033 (US$ Mn, AGR (%), CAGR (%)) (W-Shaped Recovery Scenario)
Table 6 Global Reactor Cooling Systems Market Forecast, 2023-2033 (US$ Mn, AGR (%), CAGR (%)) (U-Shaped Recovery Scenario)
Table 7 Global Reactor Cooling Systems Market by Region, 2023-2033 (US$ Mn, AGR (%), CAGR (%)) (U-Shaped Recovery Scenario)
Table 8 Global Reactor Cooling Systems Market Forecast, 2023-2033 (US$ Mn, AGR (%), CAGR (%)) (L-Shaped Recovery Scenario)
Table 9 Global Reactor Cooling Systems Market by Region, 2023-2033 (US$ Mn, AGR (%), CAGR (%)) (L-Shaped Recovery Scenario)
Table 10 Global Reactor Cooling Systems Market by Capacity, 2023-2033 (US$ Mn, AGR (%), CAGR (%))
Table 11 Small/Medium Reactor Market by Region, 2023-2033 (US$ Mn, AGR (%), CAGR (%))
Table 12 Large Reactor Market by Region, 2023-2033 (US$ Mn, AGR (%), CAGR (%))
Table 13 Global Reactor Cooling Systems Market by Configuration, 2023-2033 (US$ Mn, AGR (%), CAGR (%))
Table 14 Once-Through Cooling Market by Region, 2023-2033 (US$ Mn, AGR (%), CAGR (%))
Table 15 Closed-Cycle Cooling Market by Region, 2023-2033 (US$ Mn, AGR (%), CAGR (%))
Table 16 Hybrid Cooling Market by Region, 2023-2033 (US$ Mn, AGR (%), CAGR (%))
Table 17 Global Reactor Cooling Systems Market by Mechanism, 2023-2033 (US$ Mn, AGR (%), CAGR (%))
Table 18 Direct Cooling Market by Region, 2023-2033 (US$ Mn, AGR (%), CAGR (%))
Table 19 Indirect Cooling Market by Region, 2023-2033 (US$ Mn, AGR (%), CAGR (%))
Table 20 Passive Cooling Market by Region, 2023-2033 (US$ Mn, AGR (%), CAGR (%))
Table 21 Active Cooling Market by Region, 2023-2033 (US$ Mn, AGR (%), CAGR (%))
Table 22 Global Reactor Cooling Systems Market by System Type, 2023-2033 (US$ Mn, AGR (%), CAGR (%))
Table 23 Pressurized Water Reactor (PWR) Cooling System Market by Region, 2023-2033 (US$ Mn, AGR (%), CAGR (%))
Table 24 Boiling Water Reactor (BWR) Cooling System Market by Region, 2023-2033 (US$ Mn, AGR (%), CAGR (%))
Table 25 Advanced Gas-Cooled Reactor (AGCR) Cooling System Market by Region, 2023-2033 (US$ Mn, AGR (%), CAGR (%))
Table 26 Pressurized Heavy Water Reactor (PHWR) Cooling System Market by Region, 2023-2033 (US$ Mn, AGR (%), CAGR (%))
Table 27 Other System Type Market by Region, 2023-2033 (US$ Mn, AGR (%), CAGR (%))
Table 28 Global Reactor Cooling Systems Market by Component, 2023-2033 (US$ Mn, AGR (%), CAGR (%))
Table 29 Heat Exchangers Market by Region, 2023-2033 (US$ Mn, AGR (%), CAGR (%))
Table 30 Cooling Towers Market by Region, 2023-2033 (US$ Mn, AGR (%), CAGR (%))
Table 31 Pumps and Valves Market by Region, 2023-2033 (US$ Mn, AGR (%), CAGR (%))
Table 32 Condensers Market by Region, 2023-2033 (US$ Mn, AGR (%), CAGR (%))
Table 33 Cooling Water Treatment Systems Market by Region, 2023-2033 (US$ Mn, AGR (%), CAGR (%))
Table 34 Other Components Market by Region, 2023-2033 (US$ Mn, AGR (%), CAGR (%))
Table 35 Global Reactor Cooling Systems Market Forecast, 2023-2033 (US$ Mn, AGR (%), CAGR (%))
Table 36 Global Reactor Cooling Systems Market by Region, 2023-2033 (US$ Mn, AGR (%), CAGR (%))
Table 37 Global Reactor Cooling Systems Market by Capacity, 2023-2033 (US$ Mn, AGR (%), CAGR (%))
Table 38 Global Reactor Cooling Systems Market by Configuration, 2023-2033 (US$ Mn, AGR (%), CAGR (%))
Table 39 Global Reactor Cooling Systems Market by Mechanism, 2023-2033 (US$ Mn, AGR (%), CAGR (%))
Table 40 Global Reactor Cooling Systems Market by System Type, 2023-2033 (US$ Mn, AGR (%), CAGR (%))
Table 41 Global Reactor Cooling Systems Market by Component, 2023-2033 (US$ Mn, AGR (%), CAGR (%))
Table 42 North America Reactor Cooling Systems Market by Value, 2023-2033 (US$ Mn, AGR (%), CAGR (%))
Table 43 North America Reactor Cooling Systems Market by Country, 2023-2033 (US$ Mn, AGR (%), CAGR (%))
Table 44 North America Reactor Cooling Systems Market by Capacity, 2023-2033 (US$ Mn, AGR (%), CAGR (%))
Table 45 North America Reactor Cooling Systems Market by Configuration, 2023-2033 (US$ Mn, AGR (%), CAGR (%))
Table 46 North America Reactor Cooling Systems Market by Mechanism, 2023-2033 (US$ Mn, AGR (%), CAGR (%))
Table 47 North America Reactor Cooling Systems Market by System Type, 2023-2033 (US$ Mn, AGR (%), CAGR (%))
Table 48 North America Reactor Cooling Systems Market by Component, 2023-2033 (US$ Mn, AGR (%), CAGR (%))
Table 49 US Reactor Cooling Systems Market by Value, 2023-2033 (US$ Mn, AGR (%), CAGR (%))
Table 50 Canada Reactor Cooling Systems Market by Value, 2023-2033 (US$ Mn, AGR (%), CAGR (%))
Table 51 Europe Reactor Cooling Systems Market by Value, 2023-2033 (US$ Mn, AGR (%), CAGR (%))
Table 52 Europe Reactor Cooling Systems Market by Country, 2023-2033 (US$ Mn, AGR (%), CAGR (%))
Table 53 Europe Reactor Cooling Systems Market by Capacity, 2023-2033 (US$ Mn, AGR (%), CAGR (%))
Table 54 Europe Reactor Cooling Systems Market by Configuration, 2023-2033 (US$ Mn, AGR (%), CAGR (%))
Table 55 Europe Reactor Cooling Systems Market by Mechanism, 2023-2033 (US$ Mn, AGR (%), CAGR (%))
Table 56 Europe Reactor Cooling Systems Market by System Type, 2023-2033 (US$ Mn, AGR (%), CAGR (%))
Table 57 Europe Reactor Cooling Systems Market by Component, 2023-2033 (US$ Mn, AGR (%), CAGR (%))
Table 58 Germany Reactor Cooling Systems Market by Value, 2023-2033 (US$ Mn, AGR (%), CAGR (%))
Table 59 UK Reactor Cooling Systems Market by Value, 2023-2033 (US$ Mn, AGR (%), CAGR (%))
Table 60 France Reactor Cooling Systems Market by Value, 2023-2033 (US$ Mn, AGR (%), CAGR (%))
Table 61 Russia Reactor Cooling Systems Market by Value, 2023-2033 (US$ Mn, AGR (%), CAGR (%))
Table 62 Spain Reactor Cooling Systems Market by Value, 2023-2033 (US$ Mn, AGR (%), CAGR (%))
Table 63 Rest of Europe Reactor Cooling Systems Market by Value, 2023-2033 (US$ Mn, AGR (%), CAGR (%))
Table 64 Asia-Pacific Reactor Cooling Systems Market by Value, 2023-2033 (US$ Mn, AGR (%), CAGR (%))
Table 65 Asia-Pacific Reactor Cooling Systems Market by Country, 2023-2033 (US$ Mn, AGR (%), CAGR (%))
Table 66 Asia-Pacific Reactor Cooling Systems Market by Capacity, 2023-2033 (US$ Mn, AGR (%), CAGR (%))
Table 67 Asia-Pacific Reactor Cooling Systems Market by Configuration, 2023-2033 (US$ Mn, AGR (%), CAGR (%))
Table 68 Asia-Pacific Reactor Cooling Systems Market by Mechanism, 2023-2033 (US$ Mn, AGR (%), CAGR (%))
Table 69 Asia-Pacific Reactor Cooling Systems Market by System Type, 2023-2033 (US$ Mn, AGR (%), CAGR (%))
Table 70 Asia-Pacific Reactor Cooling Systems Market by Component, 2023-2033 (US$ Mn, AGR (%), CAGR (%))
Table 71 China Reactor Cooling Systems Market by Value, 2023-2033 (US$ Mn, AGR (%), CAGR (%))
Table 72 India Reactor Cooling Systems Market by Value, 2023-2033 (US$ Mn, AGR (%), CAGR (%))
Table 73 Japan Reactor Cooling Systems Market by Value, 2023-2033 (US$ Mn, AGR (%), CAGR (%))
Table 74 South Korea Reactor Cooling Systems Market by Value, 2023-2033 (US$ Mn, AGR (%), CAGR (%))
Table 75 Australia Reactor Cooling Systems Market by Value, 2023-2033 (US$ Mn, AGR (%), CAGR (%))
Table 76 Rest of Asia-Pacific Reactor Cooling Systems Market by Value, 2023-2033 (US$ Mn, AGR (%), CAGR (%))
Table 77 Middle East & Africa Reactor Cooling Systems Market by Value, 2023-2033 (US$ Mn, AGR (%), CAGR (%))
Table 78 Middle East & Africa Reactor Cooling Systems Market by Country, 2023-2033 (US$ Mn, AGR (%), CAGR (%))
Table 79 Middle East & Africa Reactor Cooling Systems Market by Capacity, 2023-2033 (US$ Mn, AGR (%), CAGR (%))
Table 80 Middle East & Africa Reactor Cooling Systems Market by Configuration, 2023-2033 (US$ Mn, AGR (%), CAGR (%))
Table 81 Middle East & Africa Reactor Cooling Systems Market by Mechanism, 2023-2033 (US$ Mn, AGR (%), CAGR (%))
Table 82 Middle East & Africa Reactor Cooling Systems Market by System Type, 2023-2033 (US$ Mn, AGR (%), CAGR (%))
Table 83 Middle East & Africa Reactor Cooling Systems Market by Component, 2023-2033 (US$ Mn, AGR (%), CAGR (%))
Table 84 GCC Reactor Cooling Systems Market by Value, 2023-2033 (US$ Mn, AGR (%), CAGR (%))
Table 85 South Africa Reactor Cooling Systems Market by Value, 2023-2033 (US$ Mn, AGR (%), CAGR (%))
Table 86 Rest of Middle East & Africa Reactor Cooling Systems Market by Value, 2023-2033 (US$ Mn, AGR (%), CAGR (%))
Table 87 Latin America Reactor Cooling Systems Market by Value, 2023-2033 (US$ Mn, AGR (%), CAGR (%))
Table 88 Latin America Reactor Cooling Systems Market by Country, 2023-2033 (US$ Mn, AGR (%), CAGR (%))
Table 89 Latin America Reactor Cooling Systems Market by Capacity, 2023-2033 (US$ Mn, AGR (%), CAGR (%))
Table 90 Latin America Reactor Cooling Systems Market by Configuration, 2023-2033 (US$ Mn, AGR (%), CAGR (%))
Table 91 Latin America Reactor Cooling Systems Market by Mechanism, 2023-2033 (US$ Mn, AGR (%), CAGR (%))
Table 92 Latin America Reactor Cooling Systems Market by System Type, 2023-2033 (US$ Mn, AGR (%), CAGR (%))
Table 93 Latin America Reactor Cooling Systems Market by Component, 2023-2033 (US$ Mn, AGR (%), CAGR (%))
Table 94 Brazil Reactor Cooling Systems Market by Value, 2023-2033 (US$ Mn, AGR (%), CAGR (%))
Table 95 Argentina Reactor Cooling Systems Market by Value, 2023-2033 (US$ Mn, AGR (%), CAGR (%))
Table 96 Rest of Latin America Reactor Cooling Systems Market by Value, 2023-2033 (US$ Mn, AGR (%), CAGR (%))
Table 97 Strategic Outlook
Table 98 Areva S.A.: Key Details, (CEO, HQ, Revenue, Founded, No. of Employees, Company Type, Website, Business Segment)
Table 99 Areva S.A.: Product Benchmarking
Table 100 Areva S.A.: Strategic Outlook
Table 101 General Electric Company: Key Details, (CEO, HQ, Revenue, Founded, No. of Employees, Company Type, Website, Business Segment)
Table 102 General Electric Company: Product Benchmarking
Table 103 General Electric Company: Strategic Outlook
Table 104 Westinghouse Electric Company LLC: Key Details, (CEO, HQ, Revenue, Founded, No. of Employees, Company Type, Website, Business Segment)
Table 105 Westinghouse Electric Company LLC: Product Benchmarking
Table 106 Westinghouse Electric Company LLC: Strategic Outlook
Table 107 Mitsubishi Heavy Industries, Ltd : Key Details, (CEO, HQ, Revenue, Founded, No. of Employees, Company Type, Website, Business Segment)
Table 108 Mitsubishi Heavy Industries, Ltd: Product Benchmarking
Table 109 Mitsubishi Heavy Industries, Ltd: Strategic Outlook
Table 110 Babcock International Group plc: Key Details, (CEO, HQ, Revenue, Founded, No. of Employees, Company Type, Website, Business Segment)
Table 111 Babcock International Group plc: Product Benchmarking
Table 112 Harbin Electric Company Limited: Key Details, (CEO, HQ, Revenue, Founded, No. of Employees, Company Type, Website, Business Segment)
Table 113 Harbin Electric Company Limited: Product Benchmarking
Table 114 Dongfang Electric Corporation: Key Details, (CEO, HQ, Revenue, Founded, No. of Employees, Company Type, Website, Business Segment)
Table 115 Dongfang Electric Corporation: Product Benchmarking
Table 116 Dongfang Electric Corporation: Strategic Outlook
Table 117 China Nuclear Power Engineering Co Ltd: Key Details, (CEO, HQ, Revenue, Founded, No. of Employees, Company Type, Website, Business Segment)
Table 118 China Nuclear Power Engineering Co Ltd: Product Benchmarking
Table 119 China Nuclear Power Engineering Co Ltd: Strategic Outlook
Table 120 Bharat Heavy Electricals Limited (BHEL): Key Details, (CEO, HQ, Revenue, Founded, No. of Employees, Company Type, Website, Business Segment)
Table 121 Bharat Heavy Electricals Limited (BHEL): Product Benchmarking
Table 122 Bharat Heavy Electricals Limited (BHEL): Strategic Outlook
Table 123 Rosatom State Nuclear Energy Corporation: Key Details, (CEO, HQ, Revenue, Founded, No. of Employees, Company Type, Website, Business Segment)
Table 124 Rosatom State Nuclear Energy Corporation: Product Benchmarking
Table 125 Rosatom State Nuclear Energy Corporation: Strategic Outlook
Table 126 Sulzer Ltd.: Key Details, (CEO, HQ, Revenue, Founded, No. of Employees, Company Type, Website, Business Segment)
Table 127 Sulzer Ltd: Product Benchmarking
Table 128 , Founded, No. of Employees Shanghai Electric Group Company Limited: Key Details, (CEO, HQ, Revenue, Company Type, Website, Business Segment)
Table 129 Shanghai Electric Group Company Limited: Product Benchmarking
Table 130 Shanghai Electric Group Company Limited: Strategic Outlook
Table 131 KSB SE & Co. KGaA: Key Details, (CEO, HQ, Revenue, Founded, No. of Employees, Company Type, Website, Business Segment)
Table 132 KSB SE & Co. KGaA: Product Benchmarking
Table 133 Rolls-Royce Limited: Key Details, (CEO, HQ, Revenue, Founded, No. of Employees, Company Type, Website, Business Segment)
Table 134 Rolls-Royce Limited: Product Benchmarking
Table 135 Rolls-Royce Limited: Strategic Outlook
Table 136 IHI Corporation: Key Details, (CEO, HQ, Revenue, Founded, No. of Employees, Company Type, Website, Business Segment)
Table 137 IHI Corporation: Product Benchmarking
Table 138 IHI Corporation: Strategic Outlook
図の一覧
Figure 1 Reactor Cooling Systems Market Segmentation
Figure 2 Reactor Cooling Systems Market by Capacity: Market Attractiveness Index
Figure 3 Reactor Cooling Systems Market by Configuration: Market Attractiveness Index
Figure 4 Reactor Cooling Systems Market by Mechanism: Market Attractiveness Index
Figure 5 Reactor Cooling Systems Market by System Type: Market Attractiveness Index
Figure 6 Reactor Cooling Systems Market by Component: Market Attractiveness Index
Figure 7 Reactor Cooling Systems Market Attractiveness Index by Region
Figure 8 Reactor Cooling Systems Market: Market Dynamics
Figure 9 Global Reactor Cooling Systems Market Forecast, 2023-2033 (US$ Mn, AGR (%)) (V-Shaped Recovery Scenario)
Figure 10 Global Reactor Cooling Systems Market by Region, 2023-2033 (US$ Mn, AGR (%)) (V-Shaped Recovery Scenario)
Figure 11 Global Reactor Cooling Systems Market Forecast, 2023-2033 (US$ Mn, AGR (%)) (W-Shaped Recovery Scenario)
Figure 12 Global Reactor Cooling Systems Market by Region, 2023-2033 (US$ Mn, AGR (%)) (W-Shaped Recovery Scenario)
Figure 13 Global Reactor Cooling Systems Market Forecast, 2023-2033 (US$ Mn, AGR (%)) (U-Shaped Recovery Scenario)
Figure 14 Global Reactor Cooling Systems Market by Region, 2023-2033 (US$ Mn, AGR (%)) (U-Shaped Recovery Scenario)
Figure 15 Global Reactor Cooling Systems Market Forecast, 2023-2033 (US$ Mn, AGR (%)) (L-Shaped Recovery Scenario)
Figure 16 Global Reactor Cooling Systems Market by Region, 2023-2033 (US$ Mn, AGR (%)) (L-Shaped Recovery Scenario)
Figure 17 Reactor Cooling Systems Market: Porter’s Five Forces Analysis
Figure 18 Reactor Cooling Systems Market: PEST Analysis
Figure 19 Reactor Cooling Systems Market by Capacity: Market Attractiveness Index
Figure 20 Global Reactor Cooling Systems Market by Capacity, 2023-2033 (US$ Mn, AGR (%))
Figure 21 Small/Medium Reactor Market by Region, 2023-2033 (US$ Mn, AGR (%))
Figure 22 Capacity Segment Market Share Forecast by Region, 2023 & 2033 (%)
Figure 23 Large Reactor Market by Region, 2023-2033 (US$ Mn, AGR (%))
Figure 24 Capacity Segment Market Share Forecast by Region, 2023 & 2033 (%)
Figure 25 Reactor Cooling Systems Market by Configuration: Market Attractiveness Index
Figure 26 Global Reactor Cooling Systems Market by Configuration, 2023-2033 (US$ Mn, AGR (%))
Figure 27 Once-Through Cooling Market by Region, 2023-2033 (US$ Mn, AGR (%))
Figure 28 Configuration Segment Market Share Forecast by Region, 2023 & 2033 (%)
Figure 29 Closed-Cycle Cooling Market by Region, 2023-2033 (US$ Mn, AGR (%))
Figure 30 Configuration Segment Market Share Forecast by Region, 2023 & 2033 (%)
Figure 31 Hybrid Cooling Market by Region, 2023-2033 (US$ Mn, AGR (%))
Figure 32 Configuration Segment Market Share Forecast by Region, 2023 & 2033 (%)
Figure 33 Reactor Cooling Systems Market by Mechanism: Market Attractiveness Index
Figure 34 Global Reactor Cooling Systems Market by Mechanism, 2023-2033 (US$ Mn, AGR (%))
Figure 35 Direct Cooling Market by Region, 2023-2033 (US$ Mn, AGR (%))
Figure 36 Mechanism Segment Market Share Forecast by Region, 2023 & 2033 (%)
Figure 37 Indirect Cooling Market by Region, 2023-2033 (US$ Mn, AGR (%))
Figure 38 Mechanism Segment Market Share Forecast by Region, 2023 & 2033 (%)
Figure 39 Passive Cooling Market by Region, 2023-2033 (US$ Mn, AGR (%))
Figure 40 Mechanism Segment Market Share Forecast by Region, 2023 & 2033 (%)
Figure 41 Active Cooling Market by Region, 2023-2033 (US$ Mn, AGR (%))
Figure 42 Mechanism Segment Market Share Forecast by Region, 2023 & 2033 (%)
Figure 43 Reactor Cooling Systems Market by System Type: Market Attractiveness Index
Figure 44 Global Reactor Cooling Systems Market by System Type, 2023-2033 (US$ Mn, AGR (%))
Figure 45 Pressurized Water Reactor (PWR) Cooling System Market by Region, 2023-2033 (US$ Mn, AGR (%))
Figure 46 System Type Segment Market Share Forecast by Region, 2023 & 2033 (%)
Figure 47 Boiling Water Reactor (BWR) Cooling System Market by Region, 2023-2033 (US$ Mn, AGR (%))
Figure 48 System Type Segment Market Share Forecast by Region, 2023 & 2033 (%)
Figure 49 Advanced Gas-Cooled Reactor (AGCR) Cooling System Market by Region, 2023-2033 (US$ Mn, AGR (%))
Figure 50 System Type Segment Market Share Forecast by Region, 2023 & 2033 (%)
Figure 51 Pressurized Heavy Water Reactor (PHWR) Cooling System Market by Region, 2023-2033 (US$ Mn, AGR (%))
Figure 52 System Type Segment Market Share Forecast by Region, 2023 & 2033 (%)
Figure 53 Other System Type Market by Region, 2023-2033 (US$ Mn, AGR (%))
Figure 54 System Type Segment Market Share Forecast by Region, 2023 & 2033 (%)
Figure 55 Reactor Cooling Systems Market by Component: Market Attractiveness Index
Figure 56 Global Reactor Cooling Systems Market by Component, 2023-2033 (US$ Mn, AGR (%))
Figure 57 Heat Exchangers Market by Region, 2023-2033 (US$ Mn, AGR (%))
Figure 58 Component Segment Market Share Forecast by Region, 2023 & 2033 (%)
Figure 59 Cooling Towers Market by Region, 2023-2033 (US$ Mn, AGR (%))
Figure 60 Component Segment Market Share Forecast by Region, 2023 & 2033 (%)
Figure 61 Pumps and Valves Market by Region, 2023-2033 (US$ Mn, AGR (%))
Figure 62 Component Segment Market Share Forecast by Region, 2023 & 2033 (%)
Figure 63 Condensers Market by Region, 2023-2033 (US$ Mn, AGR (%))
Figure 64 Component Segment Market Share Forecast by Region, 2023 & 2033 (%)
Figure 65 Cooling Water Treatment Systems Market by Region, 2023-2033 (US$ Mn, AGR (%))
Figure 66 Component Segment Market Share Forecast by Region, 2023 & 2033 (%)
Figure 67 Other Components Market by Region, 2023-2033 (US$ Mn, AGR (%))
Figure 68 Component Segment Market Share Forecast by Region, 2023 & 2033 (%)
Figure 69 Global Reactor Cooling Systems Market Forecast, 2023-2033 (US$ Mn, AGR (%))
Figure 70 Global Reactor Cooling Systems Market by Region, 2023-2033 (US$ Mn, AGR (%))
Figure 71 Global Reactor Cooling Systems Market by Capacity, 2023-2033 (US$ Mn, AGR (%))
Figure 72 Global Reactor Cooling Systems Market by Configuration, 2023-2033 (US$ Mn, AGR (%))
Figure 73 Global Reactor Cooling Systems Market by Mechanism, 2023-2033 (US$ Mn, AGR (%))
Figure 74 Global Reactor Cooling Systems Market by System Type, 2023-2033 (US$ Mn, AGR (%))
Figure 75 Global Reactor Cooling Systems Market by Component, 2023-2033 (US$ Mn, AGR (%))
Figure 76 North America Reactor Cooling Systems Market Attractiveness Index
Figure 77 North America Reactor Cooling Systems Market by Region, 2023, 2028 & 2033 (US$ Million)
Figure 78 North America Reactor Cooling Systems Market by Value, 2023-2033 (US$ Mn, AGR (%))
Figure 79 North America Reactor Cooling Systems Market by Country, 2023-2033 (US$ Mn, AGR (%))
Figure 80 North America Reactor Cooling Systems Market Forecast by Country, 2023-2033 (%)
Figure 81 North America Reactor Cooling Systems Market by Capacity, 2023-2033 (US$ Mn, AGR (%))
Figure 82 North America Reactor Cooling Systems Market Forecast by Capacity 2023-2033 (%)
Figure 83 North America Reactor Cooling Systems Market by Configuration, 2023-2033 (US$ Mn, AGR (%))
Figure 84 North America Reactor Cooling Systems Market Forecast by Configuration, 2023-2033 (%)
Figure 85 North America Reactor Cooling Systems Market by Mechanism, 2023-2033 (US$ Mn, AGR (%))
Figure 86 North America Reactor Cooling Systems Market Forecast by Mechanism 2023-2033 (%)
Figure 87 North America Reactor Cooling Systems Market by System Type, 2023-2033 (US$ Mn, AGR (%))
Figure 88 North America Reactor Cooling Systems Market Forecast by System Type, 2023-2033 (%)
Figure 89 North America Reactor Cooling Systems Market by Component, 2023-2033 (US$ Mn, AGR (%))
Figure 90 North America Reactor Cooling Systems Market Forecast by Component, 2023-2033 (%)
Figure 91 US Reactor Cooling Systems Market by Value, 2023-2033 (US$ Mn, AGR (%))
Figure 92 Canada Reactor Cooling Systems Market by Value, 2023-2033 (US$ Mn, AGR (%))
Figure 93 Europe Reactor Cooling Systems Market Attractiveness Index
Figure 94 Europe Reactor Cooling Systems Market by Region, 2023, 2028 & 2033 (US$ Million)
Figure 95 Europe Reactor Cooling Systems Market by Value, 2023-2033 (US$ Mn, AGR (%))
Figure 96 Europe Reactor Cooling Systems Market by Country, 2023-2033 (US$ Mn, AGR (%))
Figure 97 Europe Reactor Cooling Systems Market Forecast by Country, 2023-2033 (%)
Figure 98 Europe Reactor Cooling Systems Market by Capacity, 2023-2033 (US$ Mn, AGR (%))
Figure 99 Europe Reactor Cooling Systems Market Forecast by Capacity 2023-2033 (%)
Figure 100 Europe Reactor Cooling Systems Market by Configuration, 2023-2033 (US$ Mn, AGR (%))
Figure 101 Europe Reactor Cooling Systems Market Forecast by Configuration, 2023-2033 (%)
Figure 102 Europe Reactor Cooling Systems Market by Mechanism, 2023-2033 (US$ Mn, AGR (%))
Figure 103 Europe Reactor Cooling Systems Market Forecast by Mechanism 2023-2033 (%)
Figure 104 Europe Reactor Cooling Systems Market by System Type, 2023-2033 (US$ Mn, AGR (%))
Figure 105 Europe Reactor Cooling Systems Market Forecast by System Type, 2023-2033 (%)
Figure 106 Europe Reactor Cooling Systems Market by Component, 2023-2033 (US$ Mn, AGR (%))
Figure 107 Europe Reactor Cooling Systems Market Forecast by Component, 2023-2033 (%)
Figure 108 Germany Reactor Cooling Systems Market by Value, 2023-2033 (US$ Mn, AGR (%))
Figure 109 UK Reactor Cooling Systems Market by Value, 2023-2033 (US$ Mn, AGR (%))
Figure 110 France Reactor Cooling Systems Market by Value, 2023-2033 (US$ Mn, AGR (%))
Figure 111 Russia Reactor Cooling Systems Market by Value, 2023-2033 (US$ Mn, AGR (%))
Figure 112 Spain Reactor Cooling Systems Market by Value, 2023-2033 (US$ Mn, AGR (%))
Figure 113 Rest of Europe Reactor Cooling Systems Market by Value, 2023-2033 (US$ Mn, AGR (%))
Figure 114 Asia Pacific Reactor Cooling Systems Market Attractiveness Index
Figure 115 Asia Pacific Reactor Cooling Systems Market by Region, 2023, 2028 & 2033 (US$ Million)
Figure 116 Asia-Pacific Reactor Cooling Systems Market by Value, 2023-2033 (US$ Mn, AGR (%))
Figure 117 Asia-Pacific Reactor Cooling Systems Market by Country, 2023-2033 (US$ Mn, AGR (%))
Figure 118 Asia-Pacific Reactor Cooling Systems Market by Capacity, 2023-2033 (US$ Mn, AGR (%))
Figure 119 Asia-Pacific Reactor Cooling Systems Market Forecast by Capacity 2023-2033 (%)
Figure 120 Asia-Pacific Reactor Cooling Systems Market by Configuration, 2023-2033 (US$ Mn, AGR (%))
Figure 121 Asia-Pacific Reactor Cooling Systems Market Forecast by Configuration, 2023-2033 (%)
Figure 122 Asia-Pacific Reactor Cooling Systems Market by Mechanism, 2023-2033 (US$ Mn, AGR (%))
Figure 123 Asia-Pacific Reactor Cooling Systems Market Forecast by Mechanism 2023-2033 (%)
Figure 124 Asia-Pacific Reactor Cooling Systems Market by System Type, 2023-2033 (US$ Mn, AGR (%))
Figure 125 Asia-Pacific Reactor Cooling Systems Market Forecast by System Type, 2023-2033 (%)
Figure 126 Asia-Pacific Reactor Cooling Systems Market by Component, 2023-2033 (US$ Mn, AGR (%))
Figure 127 Asia-Pacific Reactor Cooling Systems Market Forecast by Component, 2023-2033 (%)
Figure 128 China Reactor Cooling Systems Market by Value, 2023-2033 (US$ Mn, AGR (%))
Figure 129 India Reactor Cooling Systems Market by Value, 2023-2033 (US$ Mn, AGR (%))
Figure 130 Japan Reactor Cooling Systems Market by Value, 2023-2033 (US$ Mn, AGR (%))
Figure 131 South Korea Reactor Cooling Systems Market by Value, 2023-2033 (US$ Mn, AGR (%))
Figure 132 Australia Reactor Cooling Systems Market by Value, 2023-2033 (US$ Mn, AGR (%))
Figure 133 Rest of Asia-Pacific Reactor Cooling Systems Market by Value, 2023-2033 (US$ Mn, AGR (%))
Figure 134 Middle East & Africa Reactor Cooling Systems Market Attractiveness Index
Figure 135 Middle East & Africa Reactor Cooling Systems Market by Region, 2023, 2028 & 2033 (US$ Million)
Figure 136 Middle East & Africa Reactor Cooling Systems Market by Value, 2023-2033 (US$ Mn, AGR (%))
Figure 137 Middle East & Africa Reactor Cooling Systems Market by Country, 2023-2033 (US$ Mn, AGR (%))
Figure 138 Middle East & Africa Reactor Cooling Systems Market by Capacity, 2023-2033 (US$ Mn, AGR (%))
Figure 139 Middle East & Africa Reactor Cooling Systems Market Forecast by Capacity 2023-2033 (%)
Figure 140 Middle East & Africa Reactor Cooling Systems Market by Configuration, 2023-2033 (US$ Mn, AGR (%))
Figure 141 Middle East & Africa Reactor Cooling Systems Market Forecast by Configuration, 2023-2033 (%)
Figure 142 Middle East & Africa Reactor Cooling Systems Market by Mechanism, 2023-2033 (US$ Mn, AGR (%))
Figure 143 Middle East & Africa Reactor Cooling Systems Market Forecast by Mechanism 2023-2033 (%)
Figure 144 Middle East & Africa Reactor Cooling Systems Market by System Type, 2023-2033 (US$ Mn, AGR (%))
Figure 145 Middle East & Africa Reactor Cooling Systems Market Forecast by System Type, 2023-2033 (%)
Figure 146 Middle East & Africa Reactor Cooling Systems Market by Component, 2023-2033 (US$ Mn, AGR (%))
Figure 147 Middle East & Africa Reactor Cooling Systems Market Forecast by Component, 2023-2033 (%)
Figure 148 GCC Reactor Cooling Systems Market by Value, 2023-2033 (US$ Mn, AGR (%))
Figure 149 South Africa Reactor Cooling Systems Market by Value, 2023-2033 (US$ Mn, AGR (%))
Figure 150 Rest of Middle East & Africa Reactor Cooling Systems Market by Value, 2023-2033 (US$ Mn, AGR (%))
Figure 151 Latin America Reactor Cooling Systems Market Attractiveness Index
Figure 152 Latin America Reactor Cooling Systems Market by Region, 2023, 2028 & 2033 (US$ Million)
Figure 153 Latin America Reactor Cooling Systems Market by Value, 2023-2033 (US$ Mn, AGR (%))
Figure 154 Latin America Reactor Cooling Systems Market by Country, 2023-2033 (US$ Mn, AGR (%))
Figure 155 Latin America Reactor Cooling Systems Market Forecast by Country, 2023-2033 (%)
Figure 156 Latin America Reactor Cooling Systems Market by Capacity, 2023-2033 (US$ Mn, AGR (%))
Figure 157 Latin America Reactor Cooling Systems Market Forecast by Capacity 2023-2033 (%)
Figure 158 Latin America Reactor Cooling Systems Market by Configuration, 2023-2033 (US$ Mn, AGR (%))
Figure 159 Latin America Reactor Cooling Systems Market Forecast by Configuration, 2023-2033 (%)
Figure 160 Latin America Reactor Cooling Systems Market by Mechanism, 2023-2033 (US$ Mn, AGR (%))
Figure 161 Latin America Reactor Cooling Systems Market Forecast by Mechanism 2023-2033 (%)
Figure 162 Latin America Reactor Cooling Systems Market by System Type, 2023-2033 (US$ Mn, AGR (%))
Figure 163 Latin America Reactor Cooling Systems Market Forecast by System Type, 2023-2033 (%)
Figure 164 Latin America Reactor Cooling Systems Market by Component, 2023-2033 (US$ Mn, AGR (%))
Figure 165 Latin America Reactor Cooling Systems Market Forecast by Component, 2023-2033 (%)
Figure 166 Brazil Reactor Cooling Systems Market by Value, 2023-2033 (US$ Mn, AGR (%))
Figure 167 Argentina Reactor Cooling Systems Market by Value, 2023-2033 (US$ Mn, AGR (%))
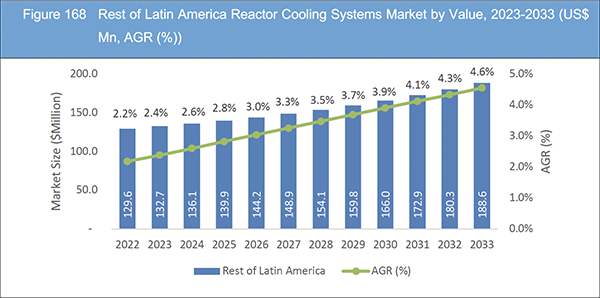
Figure 168 Rest of Latin America Reactor Cooling Systems Market by Value, 2023-2033 (US$ Mn, AGR (%))
Figure 169 Reactor Cooling Systems Market: Company Share, 2022
Figure 170 General Electric Company. Net Revenue, 2018-2022 (US$ Million, AGR%)
Figure 171 General Electric Company.: R&D, 2018-2022 (US$ Million, AGR%)
Figure 172 General Electric Company.: Regional Revenue Share, 2022 (%)
Figure 173 General Electric Company.: Business Segment Revenue Share, 2022 (%)
Figure 174 Mitsubishi Heavy Industries, Ltd.: Net Revenue, 2018-2022 (US$ Million, AGR%)
Figure 175 Mitsubishi Heavy Industries, Ltd.: R&D, 2018-2022 (US$ Million, AGR%)
Figure 176 Mitsubishi Heavy Industries, Ltd.: Regional Revenue Share, 2022 (%)
Figure 177 Mitsubishi Heavy Industries, Ltd.: Business Segment Revenue Share, 2022 (%)
Figure 178 Babcock International Group plc.: Net Revenue, 2018-2022 (US$ Million, AGR%)
Figure 179 Babcock International Group plc.: Regional Revenue Share, 2022 (%)
Figure 180 Babcock International Group plc.: Business Segment Revenue Share, 2022 (%)
Figure 181 Harbin Electric Company Limited. Net Revenue, 2018-2022 (US$ Million, AGR%)
Figure 182 Harbin Electric Company Limited. R&D, 2018-2022 (US$ Million, AGR%)
Figure 183 Harbin Electric Company Limited. Regional Revenue Share, 2022 (%)
Figure 184 Harbin Electric Company Limited. Business Segment Revenue Share, 2022 (%)
Figure 185 Dongfang Electric Corporation. Net Revenue, 2018-2022 (US$ Million, AGR%)
Figure 186 Dongfang Electric Corporation. R&D, 2018-2022 (US$ Million, AGR%)
Figure 187 Dongfang Electric Corporation. Regional Revenue Share, 2022 (%)
Figure 188 Dongfang Electric Corporation. Business Segment Revenue Share, 2022 (%)
Figure 189 Bharat Heavy Electricals Limited (BHEL).: Net Revenue, 2018-2022 (US$ Million, AGR%)
Figure 190 Bharat Heavy Electricals Limited (BHEL).: R&D, 2018-2022 (US$ Million, AGR%)
Figure 191 Bharat Heavy Electricals Limited (BHEL): Regional Revenue Share, 2022 (%)
Figure 192 Bharat Heavy Electricals Limited (BHEL): Business Segment Revenue Share, 2022 (%)
Figure 193 Sulzer Ltd.: Net Revenue, 2018-2022 (US$ Million, AGR%)
Figure 194 Sulzer Ltd.: R&D, 2018-2022 (US$ Million, AGR%)
Figure 195 Sulzer Ltd.: Regional Revenue Share, 2022 (%)
Figure 196 Sulzer Ltd.: Business Segment Revenue Share, 2022 (%)
Figure 197 Shanghai Electric Group Company Limited. Net Revenue, 2018-2022 (US$ Million, AGR%)
Figure 198 Shanghai Electric Group Company Limited. R&D, 2018-2022 (US$ Million, AGR%)
Figure 199 Shanghai Electric Group Company Limited. Regional Revenue Share, 2022 (%)
Figure 200 Shanghai Electric Group Company Limited. Business Segment Revenue Share, 2022 (%)
Figure 201 Rolls-Royce Limited. Net Revenue, 2018-2022 (US$ Million, AGR%)
Figure 202 Rolls-Royce Limited. R&D, 2018-2022 (US$ Million, AGR%)
Figure 203 Rolls-Royce Limited. Regional Revenue Share, 2022 (%)
Figure 204 Rolls-Royce Limited. Business Segment Revenue Share, 2022 (%)
Figure 205 IHI Corporation. Net Revenue, 2018-2022 (US$ Million, AGR%)
Figure 206 IHI Corporation.: R&D, 2018-2022 (US$ Million, AGR%)
Figure 207 IHI Corporation.: Regional Revenue Share, 2022 (%)
Figure 208 IHI Corporation.: Business Segment Revenue Share, 2022 (%)
ページTOPに戻る
Summary
Report Details
The Reactor Cooling Systems Market Report 2023-2033: This report will prove invaluable to leading firms striving for new revenue pockets if they wish to better understand the industry and its underlying dynamics. It will be useful for companies that would like to expand into different industries or to expand their existing operations in a new region.
Meeting the Global Energy Appetite Safely and Sustainably
The escalating global demand for electricity, fuelled by rapid urbanization, industrialization, and digitalization, is compelling nations to explore diverse energy sources. Nuclear power generation offers a reliable and low-carbon solution to meet this demand, which in turn fuels the expansion of the reactor cooling systems market. Reactor cooling systems play a pivotal role in maintaining the safety and efficiency of nuclear power plants, ensuring a consistent supply of clean energy. As the energy demand continues to rise, the need for efficient cooling systems that prevent reactor overheating becomes even more crucial.
Powering the Future with Clean and Efficient Nuclear Energy
Numerous countries are embracing nuclear energy to achieve their energy security and environmental goals. As countries invest in the construction of new nuclear power plants and the modernization of existing facilities, the demand for advanced reactor cooling systems experiences a notable upsurge. These systems are vital to ensuring optimal reactor performance, mitigating overheating risks, and managing waste heat effectively. As nuclear energy infrastructure expands, the reactor cooling systems market gains momentum due to the increased demand for reliable cooling solutions that maintain safety and operational efficiency.
What Questions Should You Ask before Buying a Market Research Report?
• How is the reactor cooling systems market evolving?
• What is driving and restraining the reactor cooling systems market?
• How will each reactor cooling systems submarket segment grow over the forecast period and how much revenue will these submarkets account for in 2033?
• How will the market shares for each reactor cooling systems submarket develop from 2023 to 2033?
• What will be the main driver for the overall market from 2023 to 2033?
• Will leading reactor cooling systems markets broadly follow the macroeconomic dynamics, or will individual national markets outperform others?
• How will the market shares of the national markets change by 2033 and which geographical region will lead the market in 2033?
• Who are the leading players and what are their prospects over the forecast period?
• What are the reactor cooling systems projects for these leading companies?
• How will the industry evolve during the period between 2023 and 2033? What are the implications of reactor cooling systems projects taking place now and over the next 10 years?
• Is there a greater need for product commercialisation to further scale the reactor cooling systems market?
• Where is the reactor cooling systems market heading and how can you ensure you are at the forefront of the market?
• What are the best investment options for new product and service lines?
• What are the key prospects for moving companies into a new growth path and C-suite?
You need to discover how this will impact the reactor cooling systems market today, and over the next 10 years:
• Our 359-page report provides 138 tables and 208 charts/graphs exclusively to you.
• The report highlights key lucrative areas in the industry so you can target them – NOW.
• It contains in-depth analysis of global, regional and national sales and growth.
• It highlights for you the key successful trends, changes and revenue projections made by your competitors.
This report tells you TODAY how the reactor cooling systems market will develop in the next 10 years, and in line with the variations in COVID-19 economic recession and bounce. This market is more critical now than at any point over the last 10 years.
Forecasts to 2033 and other analyses reveal commercial prospects
• In addition to revenue forecasting to 2033, our new study provides you with recent results, growth rates, and market shares.
• You will find original analyses, with business outlooks and developments.
• Discover qualitative analyses (including market dynamics, drivers, opportunities, restraints and challenges), cost structure, impact of rising reactor cooling systems prices and recent developments.
This report includes data analysis and invaluable insight into how COVID-19 will affect the industry and your company. Four COVID-19 recovery patterns and their impact, namely, “V”, “L”, “W” and “U” are discussed in this report.
Segments Covered in the Report
Market Segment by Capacity
• Small/Medium Reactor
• Large Reactor
Market Segment by Configuration
• Once-Through Cooling
• Closed-Cycle Cooling
• Hybrid Cooling
Market Segment by Mechanism
• Direct Cooling
• Indirect Cooling
• Passive Cooling
• Active Cooling
Market Segment by System Type
• Pressurized Water Reactor (PWR) Cooling System
• Boiling Water Reactor (BWR) Cooling System
• Advanced Gas-Cooled Reactor (AGCR) Cooling System
• Pressurized Heavy Water Reactor (PHWR) Cooling System
• Other System Type
Market Segment by Component
• Heat Exchangers
• Cooling Towers
• Pumps and Valves
• Condensers
• Cooling Water Treatment Systems
• Other Components
In addition to the revenue predictions for the overall world market and segments, you will also find revenue forecasts for four regional and 20 leading national markets:
North America
• U.S.
• Canada
Europe
• Germany
• Spain
• United Kingdom
• France
• Russia
• Rest of Europe
Asia Pacific
• China
• Japan
• India
• Australia
• South Korea
• Rest of Asia Pacific
Latin America
• Brazil
• Argentina
• Rest of Latin America
Middle East & Africa
• GCC
• South Africa
• Rest of Middle East & Africa
The report also includes profiles and for some of the leading companies in the Reactor Cooling Systems Market, 2023 to 2033, with a focus on this segment of these companies’ operations.
Leading companies and the potential for market growth
• Areva S.A.
• Babcock International Group plc
• Bharat Heavy Electricals Limited (BHEL)
• China Nuclear Power Engineering Co Ltd
• Dongfang Electric Corporation
• General Electric Company
• Harbin Electric Company Limited
• IHI Corporation
• KSB SE & Co. KGaA
• Mitsubishi Heavy Industries, Ltd
• Rolls-Royce Limited
• Rosatom State Nuclear Energy Corporation
• Shanghai Electric Group Company Limited
• Sulzer Ltd.
• Westinghouse Electric Company LLC
Overall world revenue for Reactor Cooling Systems Market, 2023 to 2033 in terms of value the market will surpass US$9,185.3 million in 2023, our work calculates. We predict strong revenue growth through to 2033. Our work identifies which organizations hold the greatest potential. Discover their capabilities, progress, and commercial prospects, helping you stay ahead.
How will the Reactor Cooling Systems Market, 2023 to 2033 report help you?
In summary, our 350+ page report provides you with the following knowledge:
• Revenue forecasts to 2033 for Reactor Cooling Systems Market, 2023 to 2033 Market, with forecasts for capacity, configuration, mechanism, system type, component and, each forecast at a global and regional level – discover the industry’s prospects, finding the most lucrative places for investments and revenues.
• Revenue forecasts to 2033 for four regional and 20 key national markets – See forecasts for the Reactor Cooling Systems Market, 2023 to 2033 market in North America, Europe, Asia-Pacific, Latin America and Middle East & Africa. Also forecasted is the market in the US, Canada, Brazil, Germany, France, UK, Russia, China, India, Japan, and Australia among other prominent economies.
• Prospects for established firms and those seeking to enter the market – including company profiles for 15 of the major companies involved in the Reactor Cooling Systems Market, 2023 to 2033.
Find quantitative and qualitative analyses with independent predictions. Receive information that only our report contains, staying informed with invaluable business intelligence.
Information found nowhere else
With our new report, you are less likely to fall behind in knowledge or miss out on opportunities. See how our work could benefit your research, analyses, and decisions. Visiongain’s study is for everybody needing commercial analyses for the Reactor Cooling Systems Market, 2023 to 2033, market-leading companies. You will find data, trends and predictions.
ページTOPに戻る
Table of Contents
Table of Contents
1 Report Overview
1.1 Objectives of the Study
1.2 Introduction to Reactor Cooling Systems Market
1.3 What This Report Delivers
1.4 Why You Should Read This Report
1.5 Key Questions Answered by This Analytical Report
1.6 Who Is This Report for?
1.7 Research Methodology
1.7.1 Market Definitions
1.7.2 Market Evaluation & Forecasting Methodology
1.7.3 Data Validation
1.7.3.1 Primary Research
1.7.3.2 Secondary Research
1.8 Frequently Asked Questions (FAQs)
1.9 Associated Visiongain Reports
1.10 About Visiongain
2 Executive Summary
2.1 Segment Analysis
2.1.1 Capacity Segment: Market Attractiveness Index
2.1.2 Configuration Segment: Market Attractiveness Index
2.1.3 Mechanism Segment: Market Attractiveness Index
2.1.4 System Type Segment: Market Attractiveness Index
2.1.5 Component Segment: Market Attractiveness Index
2.2 Regional Analysis
3 Market Overview
3.1 Key Findings
3.2 Market Dynamics
3.2.1 Market Driving Factors
3.2.1.1 Increasing Demand for Nuclear Power
3.2.1.2 Development of New Reactor Technologies
3.2.1.3 Focus on Safety and Efficiency
3.2.2 Market Restraints
3.2.2.1 High Cost of Reactor Cooling Systems
3.2.2.2 Shortage of Skilled Labour
3.2.2.3 Nuclear Power Plants Are Subject To Strict Regulatory Oversight
3.2.3 Market Opportunities
3.2.3.1 Growing Demand in Emerging Markets
3.2.3.2 Development of New Coolants
3.2.3.3 Increased Investment in Research and Development
3.3 COVID-19 Impact Analysis
3.3.1 V-Shaped Recovery
3.3.2 W-Shaped Recovery
3.3.3 U-Shaped Recovery
3.3.4 L-Shaped Recovery
3.4 Porter’s Five Forces Analysis
3.4.1 Bargaining Power of Suppliers (Low)
3.4.2 Bargaining Power of Buyers (Moderate)
3.4.3 Competitive Rivalry (High)
3.4.4 Threat from Substitutes (Moderate)
3.4.5 Threat of New Entrants (Low)
3.5 PEST Analysis
3.5.1 Political Factors
3.5.2 Economic Factors
3.5.3 Social Factors
3.5.4 Technological Factors
4 Reactor Cooling Systems Market Analysis by Capacity
4.1 Key Findings
4.2 Capacity Segment: Market Attractiveness Index
4.3 Reactor Cooling Systems Market Size Estimation and Forecast by Capacity
4.4 Small/Medium Reactor Market
4.4.1 Market Size by Region, 2023-2033 (US$ Million)
4.4.2 Market Share by Region, 2023 & 2033 (%)
4.5 Large Reactor Market
4.5.1 Market Size by Region, 2023-2033 (US$ Million)
4.5.2 Market Share by Region, 2023 & 2033 (%)
5 Reactor Cooling Systems Market Analysis by Configuration
5.1 Key Findings
5.2 Configuration Segment: Market Attractiveness Index
5.3 Reactor Cooling Systems Market Size Estimation and Forecast by Configuration
5.4 Once-Through Cooling Market
5.4.1 Market Size by Region, 2023-2033 (US$ Million)
5.4.2 Market Share by Region, 2023 & 2033 (%)
5.5 Closed-Cycle Cooling Market
5.5.1 Market Size by Region, 2023-2033 (US$ Million)
5.5.2 Market Share by Region, 2023 & 2033 (%)
5.6 Hybrid Cooling Market
5.6.1 Market Size by Region, 2023-2033 (US$ Million)
5.6.2 Market Share by Region, 2023 & 2033 (%)
6 Reactor Cooling Systems Market Analysis by Mechanism
6.1 Key Findings
6.2 Mechanism Segment: Market Attractiveness Index
6.3 Reactor Cooling Systems Market Size Estimation and Forecast by Mechanism
6.4 Direct Cooling Market
6.4.1 Market Size by Region, 2023-2033 (US$ Million)
6.4.2 Market Share by Region, 2023 & 2033 (%)
6.5 Indirect Cooling Market
6.5.1 Market Size by Region, 2023-2033 (US$ Million)
6.5.2 Market Share by Region, 2023 & 2033 (%)
6.6 Passive Cooling Market
6.6.1 Market Size by Region, 2023-2033 (US$ Million)
6.6.2 Market Share by Region, 2023 & 2033 (%)
6.7 Active Cooling Market
6.7.1 Market Size by Region, 2023-2033 (US$ Million)
6.7.2 Market Share by Region, 2023 & 2033 (%)
7 Reactor Cooling Systems Market Analysis by System Type
7.1 Key Findings
7.2 System Type Segment: Market Attractiveness Index
7.3 Reactor Cooling Systems Market Size Estimation and Forecast by System Type
7.4 Pressurized Water Reactor (PWR) Cooling System Market
7.4.1 Market Size by Region, 2023-2033 (US$ Million)
7.4.2 Market Share by Region, 2023 & 2033 (%)
7.5 Boiling Water Reactor (BWR) Cooling System Market
7.5.1 Market Size by Region, 2023-2033 (US$ Million)
7.5.2 Market Share by Region, 2023 & 2033 (%)
7.6 Advanced Gas-Cooled Reactor (AGCR) Cooling System Market
7.6.1 Market Size by Region, 2023-2033 (US$ Million)
7.6.2 Market Share by Region, 2023 & 2033 (%)
7.7 Pressurized Heavy Water Reactor (PHWR) Cooling System Market
7.7.1 Market Size by Region, 2023-2033 (US$ Million)
7.7.2 Market Share by Region, 2023 & 2033 (%)
7.8 Other System Type Market
7.8.1 Market Size by Region, 2023-2033 (US$ Million)
7.8.2 Market Share by Region, 2023 & 2033 (%)
8 Reactor Cooling Systems Market Analysis by Component
8.1 Key Findings
8.2 Component Segment: Market Attractiveness Index
8.3 Reactor Cooling Systems Market Size Estimation and Forecast by Component
8.4 Heat Exchangers Market
8.4.1 Market Size by Region, 2023-2033 (US$ Million)
8.4.2 Market Share by Region, 2023 & 2033 (%)
8.5 Cooling Towers Market
8.5.1 Market Size by Region, 2023-2033 (US$ Million)
8.5.2 Market Share by Region, 2023 & 2033 (%)
8.6 Pumps and Valves Market
8.6.1 Market Size by Region, 2023-2033 (US$ Million)
8.6.2 Market Share by Region, 2023 & 2033 (%)
8.7 Condensers Market
8.7.1 Market Size by Region, 2023-2033 (US$ Million)
8.7.2 Market Share by Region, 2023 & 2033 (%)
8.8 Cooling Water Treatment Systems Market
8.8.1 Market Size by Region, 2023-2033 (US$ Million)
8.8.2 Market Share by Region, 2023 & 2033 (%)
8.9 Other Components Market
8.9.1 Market Size by Region, 2023-2033 (US$ Million)
8.9.2 Market Share by Region, 2023 & 2033 (%)
9 Reactor Cooling Systems Market Analysis by Region
9.1 Key Findings
9.2 Regional Market Size Estimation and Forecast
10 North America Reactor Cooling Systems Market Analysis
10.1 Key Findings
10.2 North America Reactor Cooling Systems Market Attractiveness Index
10.3 North America Reactor Cooling Systems Market by Country, 2023, 2028 & 2033 (US$ Million)
10.4 North America Reactor Cooling Systems Market Size Estimation and Forecast by Value
10.5 North America Reactor Cooling Systems Market by Country
10.6 North America Reactor Cooling Systems Market by Capacity
10.7 North America Reactor Cooling Systems Market by Configuration
10.8 North America Reactor Cooling Systems Market by Mechanism
10.9 North America Reactor Cooling Systems Market by System Type
10.10 North America Reactor Cooling Systems Market by Component
10.11 US Reactor Cooling Systems Market
10.12 Canada Reactor Cooling Systems Market
11 Europe Reactor Cooling Systems Market Analysis
11.1 Key Findings
11.2 Europe Reactor Cooling Systems Market Attractiveness Index
11.3 Europe Reactor Cooling Systems Market by Country, 2023, 2028 & 2033 (US$ Million)
11.4 Europe Reactor Cooling Systems Market Size Estimation and Forecast by Value
11.5 Europe Reactor Cooling Systems Market by Country
11.6 Europe Reactor Cooling Systems Market by Capacity
11.7 Europe Reactor Cooling Systems Market by Configuration
11.8 Europe Reactor Cooling Systems Market by Mechanism
11.9 Europe Reactor Cooling Systems Market by System Type
11.10 Europe Reactor Cooling Systems Market by Component
11.11 Germany Reactor Cooling Systems Market
11.12 UK Reactor Cooling Systems Market
11.13 France Reactor Cooling Systems Market
11.14 Russia Reactor Cooling Systems Market
11.15 Spain Reactor Cooling Systems Market
11.16 Rest of Europe Reactor Cooling Systems Market
12 Asia Pacific Reactor Cooling Systems Market Analysis
12.1 Key Findings
12.2 Asia Pacific Reactor Cooling Systems Market Attractiveness Index
12.3 Asia Pacific Reactor Cooling Systems Market by Country, 2023, 2028 & 2033 (US$ Million)
12.4 Asia Pacific Reactor Cooling Systems Market Size Estimation and Forecast by Value
12.5 Asia-Pacific Reactor Cooling Systems Market by Country
12.6 Asia-Pacific Reactor Cooling Systems Market by Capacity
12.7 Asia-Pacific Reactor Cooling Systems Market by Configuration
12.8 Asia-Pacific Reactor Cooling Systems Market by Mechanism
12.9 Asia-Pacific Reactor Cooling Systems Market by System Type
12.10 Asia-Pacific Reactor Cooling Systems Market by Component
12.11 China Reactor Cooling Systems Market
12.12 India Reactor Cooling Systems Market
12.13 Japan Reactor Cooling Systems Market
12.14 South Korea Reactor Cooling Systems Market
12.15 Australia Reactor Cooling Systems Market
12.16 Rest of Asia-Pacific Reactor Cooling Systems Market
13 Middle East & Africa Reactor Cooling Systems Market Analysis
13.1 Key Findings
13.2 Middle East & Africa Reactor Cooling Systems Market Attractiveness Index
13.3 Middle East & Africa Reactor Cooling Systems Market by Country, 2023, 2028 & 2033 (US$ Million)
13.4 Middle East & Africa Reactor Cooling Systems Market Size Estimation and Forecast by Value
13.5 Middle East & Africa Reactor Cooling Systems Market by Country
13.6 Middle East & Africa Reactor Cooling Systems Market by Capacity
13.7 Middle East & Africa Reactor Cooling Systems Market by Configuration
13.8 Middle East & Africa Reactor Cooling Systems Market by Mechanism
13.9 Middle East & Africa Reactor Cooling Systems Market by System Type
13.10 Middle East & Africa Reactor Cooling Systems Market by Component
13.11 GCC Reactor Cooling Systems Market
13.12 South Africa Reactor Cooling Systems Market
13.13 Rest of Middle East & Africa Reactor Cooling Systems Market
14 Latin America Reactor Cooling Systems Market Analysis
14.1 Key Findings
14.2 Latin America Reactor Cooling Systems Market Attractiveness Index
14.3 Latin America Reactor Cooling Systems Market by Country, 2023, 2028 & 2033 (US$ Million)
14.4 Latin America Reactor Cooling Systems Market Size Estimation and Forecast by Value
14.5 Latin America Reactor Cooling Systems Market by Country
14.6 Latin America Reactor Cooling Systems Market by Capacity
14.7 Latin America Reactor Cooling Systems Market by Configuration
14.8 Latin America Reactor Cooling Systems Market by Mechanism
14.9 Latin America Reactor Cooling Systems Market by System Type
14.10 Latin America Reactor Cooling Systems Market by Component
14.11 Brazil Reactor Cooling Systems Market
14.12 Argentina Reactor Cooling Systems Market
14.13 Rest of Latin America Reactor Cooling Systems
15 Company Profiles
15.1 Competitive Landscape, 2022
15.2 Strategic Outlook
15.3 Areva S.A.
15.3.1 Company Snapshot
15.3.2 Company Overview
15.3.3 Product Benchmarking
15.3.4 Strategic Outlook
15.4 General Electric Company
15.4.1 Company Snapshot
15.4.2 Company Overview
15.4.3 Financial Analysis
15.4.3.1 Net Revenue, 2018-2022
15.4.3.2 R&D, 2018-2022
15.4.3.3 Regional Revenue Share, 2022 (%)
15.4.3.4 Business Segment Revenue Share, 2022 (%)
15.4.4 Product Benchmarking
15.4.5 Strategic Outlook
15.5 Westinghouse Electric Company LLC
15.5.1 Company Snapshot
15.5.2 Company Overview
15.5.3 Product Benchmarking
15.5.4 Strategic Outlook
15.6 Mitsubishi Heavy Industries, Ltd
15.6.1 Company Snapshot
15.6.2 Company Overview
15.6.3 Financial Analysis
15.6.3.1 Net Revenue, 2018-2022
15.6.3.2 R&D, 2018-2022
15.6.3.3 Regional Revenue Share, 2022 (%)
15.6.3.4 Business Segment Revenue Share, 2022 (%)
15.6.4 Product Benchmarking
15.6.5 Strategic Outlook
15.7 Babcock International Group plc
15.7.1 Company Snapshot
15.7.2 Company Overview
15.7.3 Financial Analysis
15.7.3.1 Net Revenue, 2018-2022
15.7.3.2 Regional Revenue Share, 2022 (%)
15.7.3.3 Business Segment Revenue Share, 2022 (%)
15.7.4 Product Benchmarking
15.8 Harbin Electric Company Limited
15.8.1 Company Snapshot
15.8.2 Company Overview
15.8.3 Financial Analysis
15.8.3.1 Net Revenue, 2018-2022
15.8.3.2 R&D, 2018-2022
15.8.3.3 Regional Revenue Share, 2022 (%)
15.8.3.4 Business Segment Revenue Share, 2022 (%)
15.8.4 Product Benchmarking
15.9 Dongfang Electric Corporation
15.9.1 Company Snapshot
15.9.2 Company Overview
15.9.3 Financial Analysis
15.9.3.1 Net Revenue, 2018-2022
15.9.3.2 R&D, 2018-2022
15.9.3.3 Regional Revenue Share, 2022 (%)
15.9.3.4 Business Segment Revenue Share, 2022 (%)
15.9.4 Product Benchmarking
15.9.5 Strategic Outlook
15.10 China Nuclear Power Engineering Co Ltd
15.10.1 Company Snapshot
15.10.2 Company Overview
15.10.3 Product Benchmarking
15.10.4 Strategic Outlook
15.11 Bharat Heavy Electricals Limited (BHEL)
15.11.1 Company Snapshot
15.11.2 Company Overview
15.11.3 Financial Analysis
15.11.3.1 Net Revenue, 2018-2022
15.11.3.2 R&D, 2018-2022
15.11.3.3 Regional Revenue Share, 2022 (%)
15.11.3.4 Business Segment Revenue Share, 2022 (%)
15.11.4 Product Benchmarking
15.11.5 Strategic Outlook
15.12 Rosatom State Nuclear Energy Corporation
15.12.1 Company Snapshot
15.12.2 Company Overview
15.12.3 Product Benchmarking
15.12.4 Strategic Outlook
15.13 Sulzer Ltd.
15.13.1 Company Snapshot
15.13.2 Company Overview
15.13.3 Financial Analysis
15.13.3.1 Net Revenue, 2018-2022
15.13.3.2 R&D, 2018-2022
15.13.3.3 Regional Revenue Share, 2022 (%)
15.13.3.4 Business Segment Revenue Share, 2022 (%)
15.13.4 Product Benchmarking
15.14 Shanghai Electric Group Company Limited
15.14.1 Company Snapshot
15.14.2 Company Overview
15.14.3 Financial Analysis
15.14.3.1 Net Revenue, 2018-2022
15.14.3.2 R&D, 2018-2022
15.14.3.3 Regional Revenue Share, 2022 (%)
15.14.3.4 Business Segment Revenue Share, 2022 (%)
15.14.4 Product Benchmarking
15.14.5 Strategic Outlook
15.15 KSB SE & Co. KGaA
15.15.1 Company Snapshot
15.15.2 Company Overview
15.15.3 Product Benchmarking
15.16 Rolls-Royce Limited
15.16.1 Company Snapshot
15.16.2 Company Overview
15.16.3 Financial Analysis
15.16.3.1 Net Revenue, 2018-2022
15.16.3.2 R&D, 2018-2022
15.16.3.3 Regional Revenue Share, 2022 (%)
15.16.3.4 Business Segment Revenue Share, 2022 (%)
15.16.4 Product Benchmarking
15.16.5 Strategic Outlook
15.17 IHI Corporation
15.17.1 Company Snapshot
15.17.2 Company Overview
15.17.3 Financial Analysis
15.17.3.1 Net Revenue, 2018-2022
15.17.3.2 R&D, 2018-2022
15.17.3.3 Regional Revenue Share, 2022 (%)
15.17.3.4 Business Segment Revenue Share, 2022 (%)
15.17.4 Product Benchmarking
15.17.5 Strategic Outlook
16 Conclusion and Recommendations
16.1 Concluding Remarks from Visiongain
16.2 Recommendations for Market Players
ページTOPに戻る
List of Tables/Graphs
List of Tables
Table 1 Reactor Cooling Systems Market Snapshot, 2023 & 2033 (US$ Million, CAGR %)
Table 2 Global Reactor Cooling Systems Market Forecast, 2023-2033 (US$ Mn, AGR (%), CAGR (%)) (V-Shaped Recovery Scenario)
Table 3 Global Reactor Cooling Systems Market by Region, 2023-2033 (US$ Mn, AGR (%), CAGR (%)) (V-Shaped Recovery Scenario)
Table 4 Global Reactor Cooling Systems Market Forecast, 2023-2033 (US$ Mn, AGR (%), CAGR (%)) (W-Shaped Recovery Scenario)
Table 5 Global Reactor Cooling Systems Market by Region, 2023-2033 (US$ Mn, AGR (%), CAGR (%)) (W-Shaped Recovery Scenario)
Table 6 Global Reactor Cooling Systems Market Forecast, 2023-2033 (US$ Mn, AGR (%), CAGR (%)) (U-Shaped Recovery Scenario)
Table 7 Global Reactor Cooling Systems Market by Region, 2023-2033 (US$ Mn, AGR (%), CAGR (%)) (U-Shaped Recovery Scenario)
Table 8 Global Reactor Cooling Systems Market Forecast, 2023-2033 (US$ Mn, AGR (%), CAGR (%)) (L-Shaped Recovery Scenario)
Table 9 Global Reactor Cooling Systems Market by Region, 2023-2033 (US$ Mn, AGR (%), CAGR (%)) (L-Shaped Recovery Scenario)
Table 10 Global Reactor Cooling Systems Market by Capacity, 2023-2033 (US$ Mn, AGR (%), CAGR (%))
Table 11 Small/Medium Reactor Market by Region, 2023-2033 (US$ Mn, AGR (%), CAGR (%))
Table 12 Large Reactor Market by Region, 2023-2033 (US$ Mn, AGR (%), CAGR (%))
Table 13 Global Reactor Cooling Systems Market by Configuration, 2023-2033 (US$ Mn, AGR (%), CAGR (%))
Table 14 Once-Through Cooling Market by Region, 2023-2033 (US$ Mn, AGR (%), CAGR (%))
Table 15 Closed-Cycle Cooling Market by Region, 2023-2033 (US$ Mn, AGR (%), CAGR (%))
Table 16 Hybrid Cooling Market by Region, 2023-2033 (US$ Mn, AGR (%), CAGR (%))
Table 17 Global Reactor Cooling Systems Market by Mechanism, 2023-2033 (US$ Mn, AGR (%), CAGR (%))
Table 18 Direct Cooling Market by Region, 2023-2033 (US$ Mn, AGR (%), CAGR (%))
Table 19 Indirect Cooling Market by Region, 2023-2033 (US$ Mn, AGR (%), CAGR (%))
Table 20 Passive Cooling Market by Region, 2023-2033 (US$ Mn, AGR (%), CAGR (%))
Table 21 Active Cooling Market by Region, 2023-2033 (US$ Mn, AGR (%), CAGR (%))
Table 22 Global Reactor Cooling Systems Market by System Type, 2023-2033 (US$ Mn, AGR (%), CAGR (%))
Table 23 Pressurized Water Reactor (PWR) Cooling System Market by Region, 2023-2033 (US$ Mn, AGR (%), CAGR (%))
Table 24 Boiling Water Reactor (BWR) Cooling System Market by Region, 2023-2033 (US$ Mn, AGR (%), CAGR (%))
Table 25 Advanced Gas-Cooled Reactor (AGCR) Cooling System Market by Region, 2023-2033 (US$ Mn, AGR (%), CAGR (%))
Table 26 Pressurized Heavy Water Reactor (PHWR) Cooling System Market by Region, 2023-2033 (US$ Mn, AGR (%), CAGR (%))
Table 27 Other System Type Market by Region, 2023-2033 (US$ Mn, AGR (%), CAGR (%))
Table 28 Global Reactor Cooling Systems Market by Component, 2023-2033 (US$ Mn, AGR (%), CAGR (%))
Table 29 Heat Exchangers Market by Region, 2023-2033 (US$ Mn, AGR (%), CAGR (%))
Table 30 Cooling Towers Market by Region, 2023-2033 (US$ Mn, AGR (%), CAGR (%))
Table 31 Pumps and Valves Market by Region, 2023-2033 (US$ Mn, AGR (%), CAGR (%))
Table 32 Condensers Market by Region, 2023-2033 (US$ Mn, AGR (%), CAGR (%))
Table 33 Cooling Water Treatment Systems Market by Region, 2023-2033 (US$ Mn, AGR (%), CAGR (%))
Table 34 Other Components Market by Region, 2023-2033 (US$ Mn, AGR (%), CAGR (%))
Table 35 Global Reactor Cooling Systems Market Forecast, 2023-2033 (US$ Mn, AGR (%), CAGR (%))
Table 36 Global Reactor Cooling Systems Market by Region, 2023-2033 (US$ Mn, AGR (%), CAGR (%))
Table 37 Global Reactor Cooling Systems Market by Capacity, 2023-2033 (US$ Mn, AGR (%), CAGR (%))
Table 38 Global Reactor Cooling Systems Market by Configuration, 2023-2033 (US$ Mn, AGR (%), CAGR (%))
Table 39 Global Reactor Cooling Systems Market by Mechanism, 2023-2033 (US$ Mn, AGR (%), CAGR (%))
Table 40 Global Reactor Cooling Systems Market by System Type, 2023-2033 (US$ Mn, AGR (%), CAGR (%))
Table 41 Global Reactor Cooling Systems Market by Component, 2023-2033 (US$ Mn, AGR (%), CAGR (%))
Table 42 North America Reactor Cooling Systems Market by Value, 2023-2033 (US$ Mn, AGR (%), CAGR (%))
Table 43 North America Reactor Cooling Systems Market by Country, 2023-2033 (US$ Mn, AGR (%), CAGR (%))
Table 44 North America Reactor Cooling Systems Market by Capacity, 2023-2033 (US$ Mn, AGR (%), CAGR (%))
Table 45 North America Reactor Cooling Systems Market by Configuration, 2023-2033 (US$ Mn, AGR (%), CAGR (%))
Table 46 North America Reactor Cooling Systems Market by Mechanism, 2023-2033 (US$ Mn, AGR (%), CAGR (%))
Table 47 North America Reactor Cooling Systems Market by System Type, 2023-2033 (US$ Mn, AGR (%), CAGR (%))
Table 48 North America Reactor Cooling Systems Market by Component, 2023-2033 (US$ Mn, AGR (%), CAGR (%))
Table 49 US Reactor Cooling Systems Market by Value, 2023-2033 (US$ Mn, AGR (%), CAGR (%))
Table 50 Canada Reactor Cooling Systems Market by Value, 2023-2033 (US$ Mn, AGR (%), CAGR (%))
Table 51 Europe Reactor Cooling Systems Market by Value, 2023-2033 (US$ Mn, AGR (%), CAGR (%))
Table 52 Europe Reactor Cooling Systems Market by Country, 2023-2033 (US$ Mn, AGR (%), CAGR (%))
Table 53 Europe Reactor Cooling Systems Market by Capacity, 2023-2033 (US$ Mn, AGR (%), CAGR (%))
Table 54 Europe Reactor Cooling Systems Market by Configuration, 2023-2033 (US$ Mn, AGR (%), CAGR (%))
Table 55 Europe Reactor Cooling Systems Market by Mechanism, 2023-2033 (US$ Mn, AGR (%), CAGR (%))
Table 56 Europe Reactor Cooling Systems Market by System Type, 2023-2033 (US$ Mn, AGR (%), CAGR (%))
Table 57 Europe Reactor Cooling Systems Market by Component, 2023-2033 (US$ Mn, AGR (%), CAGR (%))
Table 58 Germany Reactor Cooling Systems Market by Value, 2023-2033 (US$ Mn, AGR (%), CAGR (%))
Table 59 UK Reactor Cooling Systems Market by Value, 2023-2033 (US$ Mn, AGR (%), CAGR (%))
Table 60 France Reactor Cooling Systems Market by Value, 2023-2033 (US$ Mn, AGR (%), CAGR (%))
Table 61 Russia Reactor Cooling Systems Market by Value, 2023-2033 (US$ Mn, AGR (%), CAGR (%))
Table 62 Spain Reactor Cooling Systems Market by Value, 2023-2033 (US$ Mn, AGR (%), CAGR (%))
Table 63 Rest of Europe Reactor Cooling Systems Market by Value, 2023-2033 (US$ Mn, AGR (%), CAGR (%))
Table 64 Asia-Pacific Reactor Cooling Systems Market by Value, 2023-2033 (US$ Mn, AGR (%), CAGR (%))
Table 65 Asia-Pacific Reactor Cooling Systems Market by Country, 2023-2033 (US$ Mn, AGR (%), CAGR (%))
Table 66 Asia-Pacific Reactor Cooling Systems Market by Capacity, 2023-2033 (US$ Mn, AGR (%), CAGR (%))
Table 67 Asia-Pacific Reactor Cooling Systems Market by Configuration, 2023-2033 (US$ Mn, AGR (%), CAGR (%))
Table 68 Asia-Pacific Reactor Cooling Systems Market by Mechanism, 2023-2033 (US$ Mn, AGR (%), CAGR (%))
Table 69 Asia-Pacific Reactor Cooling Systems Market by System Type, 2023-2033 (US$ Mn, AGR (%), CAGR (%))
Table 70 Asia-Pacific Reactor Cooling Systems Market by Component, 2023-2033 (US$ Mn, AGR (%), CAGR (%))
Table 71 China Reactor Cooling Systems Market by Value, 2023-2033 (US$ Mn, AGR (%), CAGR (%))
Table 72 India Reactor Cooling Systems Market by Value, 2023-2033 (US$ Mn, AGR (%), CAGR (%))
Table 73 Japan Reactor Cooling Systems Market by Value, 2023-2033 (US$ Mn, AGR (%), CAGR (%))
Table 74 South Korea Reactor Cooling Systems Market by Value, 2023-2033 (US$ Mn, AGR (%), CAGR (%))
Table 75 Australia Reactor Cooling Systems Market by Value, 2023-2033 (US$ Mn, AGR (%), CAGR (%))
Table 76 Rest of Asia-Pacific Reactor Cooling Systems Market by Value, 2023-2033 (US$ Mn, AGR (%), CAGR (%))
Table 77 Middle East & Africa Reactor Cooling Systems Market by Value, 2023-2033 (US$ Mn, AGR (%), CAGR (%))
Table 78 Middle East & Africa Reactor Cooling Systems Market by Country, 2023-2033 (US$ Mn, AGR (%), CAGR (%))
Table 79 Middle East & Africa Reactor Cooling Systems Market by Capacity, 2023-2033 (US$ Mn, AGR (%), CAGR (%))
Table 80 Middle East & Africa Reactor Cooling Systems Market by Configuration, 2023-2033 (US$ Mn, AGR (%), CAGR (%))
Table 81 Middle East & Africa Reactor Cooling Systems Market by Mechanism, 2023-2033 (US$ Mn, AGR (%), CAGR (%))
Table 82 Middle East & Africa Reactor Cooling Systems Market by System Type, 2023-2033 (US$ Mn, AGR (%), CAGR (%))
Table 83 Middle East & Africa Reactor Cooling Systems Market by Component, 2023-2033 (US$ Mn, AGR (%), CAGR (%))
Table 84 GCC Reactor Cooling Systems Market by Value, 2023-2033 (US$ Mn, AGR (%), CAGR (%))
Table 85 South Africa Reactor Cooling Systems Market by Value, 2023-2033 (US$ Mn, AGR (%), CAGR (%))
Table 86 Rest of Middle East & Africa Reactor Cooling Systems Market by Value, 2023-2033 (US$ Mn, AGR (%), CAGR (%))
Table 87 Latin America Reactor Cooling Systems Market by Value, 2023-2033 (US$ Mn, AGR (%), CAGR (%))
Table 88 Latin America Reactor Cooling Systems Market by Country, 2023-2033 (US$ Mn, AGR (%), CAGR (%))
Table 89 Latin America Reactor Cooling Systems Market by Capacity, 2023-2033 (US$ Mn, AGR (%), CAGR (%))
Table 90 Latin America Reactor Cooling Systems Market by Configuration, 2023-2033 (US$ Mn, AGR (%), CAGR (%))
Table 91 Latin America Reactor Cooling Systems Market by Mechanism, 2023-2033 (US$ Mn, AGR (%), CAGR (%))
Table 92 Latin America Reactor Cooling Systems Market by System Type, 2023-2033 (US$ Mn, AGR (%), CAGR (%))
Table 93 Latin America Reactor Cooling Systems Market by Component, 2023-2033 (US$ Mn, AGR (%), CAGR (%))
Table 94 Brazil Reactor Cooling Systems Market by Value, 2023-2033 (US$ Mn, AGR (%), CAGR (%))
Table 95 Argentina Reactor Cooling Systems Market by Value, 2023-2033 (US$ Mn, AGR (%), CAGR (%))
Table 96 Rest of Latin America Reactor Cooling Systems Market by Value, 2023-2033 (US$ Mn, AGR (%), CAGR (%))
Table 97 Strategic Outlook
Table 98 Areva S.A.: Key Details, (CEO, HQ, Revenue, Founded, No. of Employees, Company Type, Website, Business Segment)
Table 99 Areva S.A.: Product Benchmarking
Table 100 Areva S.A.: Strategic Outlook
Table 101 General Electric Company: Key Details, (CEO, HQ, Revenue, Founded, No. of Employees, Company Type, Website, Business Segment)
Table 102 General Electric Company: Product Benchmarking
Table 103 General Electric Company: Strategic Outlook
Table 104 Westinghouse Electric Company LLC: Key Details, (CEO, HQ, Revenue, Founded, No. of Employees, Company Type, Website, Business Segment)
Table 105 Westinghouse Electric Company LLC: Product Benchmarking
Table 106 Westinghouse Electric Company LLC: Strategic Outlook
Table 107 Mitsubishi Heavy Industries, Ltd : Key Details, (CEO, HQ, Revenue, Founded, No. of Employees, Company Type, Website, Business Segment)
Table 108 Mitsubishi Heavy Industries, Ltd: Product Benchmarking
Table 109 Mitsubishi Heavy Industries, Ltd: Strategic Outlook
Table 110 Babcock International Group plc: Key Details, (CEO, HQ, Revenue, Founded, No. of Employees, Company Type, Website, Business Segment)
Table 111 Babcock International Group plc: Product Benchmarking
Table 112 Harbin Electric Company Limited: Key Details, (CEO, HQ, Revenue, Founded, No. of Employees, Company Type, Website, Business Segment)
Table 113 Harbin Electric Company Limited: Product Benchmarking
Table 114 Dongfang Electric Corporation: Key Details, (CEO, HQ, Revenue, Founded, No. of Employees, Company Type, Website, Business Segment)
Table 115 Dongfang Electric Corporation: Product Benchmarking
Table 116 Dongfang Electric Corporation: Strategic Outlook
Table 117 China Nuclear Power Engineering Co Ltd: Key Details, (CEO, HQ, Revenue, Founded, No. of Employees, Company Type, Website, Business Segment)
Table 118 China Nuclear Power Engineering Co Ltd: Product Benchmarking
Table 119 China Nuclear Power Engineering Co Ltd: Strategic Outlook
Table 120 Bharat Heavy Electricals Limited (BHEL): Key Details, (CEO, HQ, Revenue, Founded, No. of Employees, Company Type, Website, Business Segment)
Table 121 Bharat Heavy Electricals Limited (BHEL): Product Benchmarking
Table 122 Bharat Heavy Electricals Limited (BHEL): Strategic Outlook
Table 123 Rosatom State Nuclear Energy Corporation: Key Details, (CEO, HQ, Revenue, Founded, No. of Employees, Company Type, Website, Business Segment)
Table 124 Rosatom State Nuclear Energy Corporation: Product Benchmarking
Table 125 Rosatom State Nuclear Energy Corporation: Strategic Outlook
Table 126 Sulzer Ltd.: Key Details, (CEO, HQ, Revenue, Founded, No. of Employees, Company Type, Website, Business Segment)
Table 127 Sulzer Ltd: Product Benchmarking
Table 128 , Founded, No. of Employees Shanghai Electric Group Company Limited: Key Details, (CEO, HQ, Revenue, Company Type, Website, Business Segment)
Table 129 Shanghai Electric Group Company Limited: Product Benchmarking
Table 130 Shanghai Electric Group Company Limited: Strategic Outlook
Table 131 KSB SE & Co. KGaA: Key Details, (CEO, HQ, Revenue, Founded, No. of Employees, Company Type, Website, Business Segment)
Table 132 KSB SE & Co. KGaA: Product Benchmarking
Table 133 Rolls-Royce Limited: Key Details, (CEO, HQ, Revenue, Founded, No. of Employees, Company Type, Website, Business Segment)
Table 134 Rolls-Royce Limited: Product Benchmarking
Table 135 Rolls-Royce Limited: Strategic Outlook
Table 136 IHI Corporation: Key Details, (CEO, HQ, Revenue, Founded, No. of Employees, Company Type, Website, Business Segment)
Table 137 IHI Corporation: Product Benchmarking
Table 138 IHI Corporation: Strategic Outlook
List of Figures
Figure 1 Reactor Cooling Systems Market Segmentation
Figure 2 Reactor Cooling Systems Market by Capacity: Market Attractiveness Index
Figure 3 Reactor Cooling Systems Market by Configuration: Market Attractiveness Index
Figure 4 Reactor Cooling Systems Market by Mechanism: Market Attractiveness Index
Figure 5 Reactor Cooling Systems Market by System Type: Market Attractiveness Index
Figure 6 Reactor Cooling Systems Market by Component: Market Attractiveness Index
Figure 7 Reactor Cooling Systems Market Attractiveness Index by Region
Figure 8 Reactor Cooling Systems Market: Market Dynamics
Figure 9 Global Reactor Cooling Systems Market Forecast, 2023-2033 (US$ Mn, AGR (%)) (V-Shaped Recovery Scenario)
Figure 10 Global Reactor Cooling Systems Market by Region, 2023-2033 (US$ Mn, AGR (%)) (V-Shaped Recovery Scenario)
Figure 11 Global Reactor Cooling Systems Market Forecast, 2023-2033 (US$ Mn, AGR (%)) (W-Shaped Recovery Scenario)
Figure 12 Global Reactor Cooling Systems Market by Region, 2023-2033 (US$ Mn, AGR (%)) (W-Shaped Recovery Scenario)
Figure 13 Global Reactor Cooling Systems Market Forecast, 2023-2033 (US$ Mn, AGR (%)) (U-Shaped Recovery Scenario)
Figure 14 Global Reactor Cooling Systems Market by Region, 2023-2033 (US$ Mn, AGR (%)) (U-Shaped Recovery Scenario)
Figure 15 Global Reactor Cooling Systems Market Forecast, 2023-2033 (US$ Mn, AGR (%)) (L-Shaped Recovery Scenario)
Figure 16 Global Reactor Cooling Systems Market by Region, 2023-2033 (US$ Mn, AGR (%)) (L-Shaped Recovery Scenario)
Figure 17 Reactor Cooling Systems Market: Porter’s Five Forces Analysis
Figure 18 Reactor Cooling Systems Market: PEST Analysis
Figure 19 Reactor Cooling Systems Market by Capacity: Market Attractiveness Index
Figure 20 Global Reactor Cooling Systems Market by Capacity, 2023-2033 (US$ Mn, AGR (%))
Figure 21 Small/Medium Reactor Market by Region, 2023-2033 (US$ Mn, AGR (%))
Figure 22 Capacity Segment Market Share Forecast by Region, 2023 & 2033 (%)
Figure 23 Large Reactor Market by Region, 2023-2033 (US$ Mn, AGR (%))
Figure 24 Capacity Segment Market Share Forecast by Region, 2023 & 2033 (%)
Figure 25 Reactor Cooling Systems Market by Configuration: Market Attractiveness Index
Figure 26 Global Reactor Cooling Systems Market by Configuration, 2023-2033 (US$ Mn, AGR (%))
Figure 27 Once-Through Cooling Market by Region, 2023-2033 (US$ Mn, AGR (%))
Figure 28 Configuration Segment Market Share Forecast by Region, 2023 & 2033 (%)
Figure 29 Closed-Cycle Cooling Market by Region, 2023-2033 (US$ Mn, AGR (%))
Figure 30 Configuration Segment Market Share Forecast by Region, 2023 & 2033 (%)
Figure 31 Hybrid Cooling Market by Region, 2023-2033 (US$ Mn, AGR (%))
Figure 32 Configuration Segment Market Share Forecast by Region, 2023 & 2033 (%)
Figure 33 Reactor Cooling Systems Market by Mechanism: Market Attractiveness Index
Figure 34 Global Reactor Cooling Systems Market by Mechanism, 2023-2033 (US$ Mn, AGR (%))
Figure 35 Direct Cooling Market by Region, 2023-2033 (US$ Mn, AGR (%))
Figure 36 Mechanism Segment Market Share Forecast by Region, 2023 & 2033 (%)
Figure 37 Indirect Cooling Market by Region, 2023-2033 (US$ Mn, AGR (%))
Figure 38 Mechanism Segment Market Share Forecast by Region, 2023 & 2033 (%)
Figure 39 Passive Cooling Market by Region, 2023-2033 (US$ Mn, AGR (%))
Figure 40 Mechanism Segment Market Share Forecast by Region, 2023 & 2033 (%)
Figure 41 Active Cooling Market by Region, 2023-2033 (US$ Mn, AGR (%))
Figure 42 Mechanism Segment Market Share Forecast by Region, 2023 & 2033 (%)
Figure 43 Reactor Cooling Systems Market by System Type: Market Attractiveness Index
Figure 44 Global Reactor Cooling Systems Market by System Type, 2023-2033 (US$ Mn, AGR (%))
Figure 45 Pressurized Water Reactor (PWR) Cooling System Market by Region, 2023-2033 (US$ Mn, AGR (%))
Figure 46 System Type Segment Market Share Forecast by Region, 2023 & 2033 (%)
Figure 47 Boiling Water Reactor (BWR) Cooling System Market by Region, 2023-2033 (US$ Mn, AGR (%))
Figure 48 System Type Segment Market Share Forecast by Region, 2023 & 2033 (%)
Figure 49 Advanced Gas-Cooled Reactor (AGCR) Cooling System Market by Region, 2023-2033 (US$ Mn, AGR (%))
Figure 50 System Type Segment Market Share Forecast by Region, 2023 & 2033 (%)
Figure 51 Pressurized Heavy Water Reactor (PHWR) Cooling System Market by Region, 2023-2033 (US$ Mn, AGR (%))
Figure 52 System Type Segment Market Share Forecast by Region, 2023 & 2033 (%)
Figure 53 Other System Type Market by Region, 2023-2033 (US$ Mn, AGR (%))
Figure 54 System Type Segment Market Share Forecast by Region, 2023 & 2033 (%)
Figure 55 Reactor Cooling Systems Market by Component: Market Attractiveness Index
Figure 56 Global Reactor Cooling Systems Market by Component, 2023-2033 (US$ Mn, AGR (%))
Figure 57 Heat Exchangers Market by Region, 2023-2033 (US$ Mn, AGR (%))
Figure 58 Component Segment Market Share Forecast by Region, 2023 & 2033 (%)
Figure 59 Cooling Towers Market by Region, 2023-2033 (US$ Mn, AGR (%))
Figure 60 Component Segment Market Share Forecast by Region, 2023 & 2033 (%)
Figure 61 Pumps and Valves Market by Region, 2023-2033 (US$ Mn, AGR (%))
Figure 62 Component Segment Market Share Forecast by Region, 2023 & 2033 (%)
Figure 63 Condensers Market by Region, 2023-2033 (US$ Mn, AGR (%))
Figure 64 Component Segment Market Share Forecast by Region, 2023 & 2033 (%)
Figure 65 Cooling Water Treatment Systems Market by Region, 2023-2033 (US$ Mn, AGR (%))
Figure 66 Component Segment Market Share Forecast by Region, 2023 & 2033 (%)
Figure 67 Other Components Market by Region, 2023-2033 (US$ Mn, AGR (%))
Figure 68 Component Segment Market Share Forecast by Region, 2023 & 2033 (%)
Figure 69 Global Reactor Cooling Systems Market Forecast, 2023-2033 (US$ Mn, AGR (%))
Figure 70 Global Reactor Cooling Systems Market by Region, 2023-2033 (US$ Mn, AGR (%))
Figure 71 Global Reactor Cooling Systems Market by Capacity, 2023-2033 (US$ Mn, AGR (%))
Figure 72 Global Reactor Cooling Systems Market by Configuration, 2023-2033 (US$ Mn, AGR (%))
Figure 73 Global Reactor Cooling Systems Market by Mechanism, 2023-2033 (US$ Mn, AGR (%))
Figure 74 Global Reactor Cooling Systems Market by System Type, 2023-2033 (US$ Mn, AGR (%))
Figure 75 Global Reactor Cooling Systems Market by Component, 2023-2033 (US$ Mn, AGR (%))
Figure 76 North America Reactor Cooling Systems Market Attractiveness Index
Figure 77 North America Reactor Cooling Systems Market by Region, 2023, 2028 & 2033 (US$ Million)
Figure 78 North America Reactor Cooling Systems Market by Value, 2023-2033 (US$ Mn, AGR (%))
Figure 79 North America Reactor Cooling Systems Market by Country, 2023-2033 (US$ Mn, AGR (%))
Figure 80 North America Reactor Cooling Systems Market Forecast by Country, 2023-2033 (%)
Figure 81 North America Reactor Cooling Systems Market by Capacity, 2023-2033 (US$ Mn, AGR (%))
Figure 82 North America Reactor Cooling Systems Market Forecast by Capacity 2023-2033 (%)
Figure 83 North America Reactor Cooling Systems Market by Configuration, 2023-2033 (US$ Mn, AGR (%))
Figure 84 North America Reactor Cooling Systems Market Forecast by Configuration, 2023-2033 (%)
Figure 85 North America Reactor Cooling Systems Market by Mechanism, 2023-2033 (US$ Mn, AGR (%))
Figure 86 North America Reactor Cooling Systems Market Forecast by Mechanism 2023-2033 (%)
Figure 87 North America Reactor Cooling Systems Market by System Type, 2023-2033 (US$ Mn, AGR (%))
Figure 88 North America Reactor Cooling Systems Market Forecast by System Type, 2023-2033 (%)
Figure 89 North America Reactor Cooling Systems Market by Component, 2023-2033 (US$ Mn, AGR (%))
Figure 90 North America Reactor Cooling Systems Market Forecast by Component, 2023-2033 (%)
Figure 91 US Reactor Cooling Systems Market by Value, 2023-2033 (US$ Mn, AGR (%))
Figure 92 Canada Reactor Cooling Systems Market by Value, 2023-2033 (US$ Mn, AGR (%))
Figure 93 Europe Reactor Cooling Systems Market Attractiveness Index
Figure 94 Europe Reactor Cooling Systems Market by Region, 2023, 2028 & 2033 (US$ Million)
Figure 95 Europe Reactor Cooling Systems Market by Value, 2023-2033 (US$ Mn, AGR (%))
Figure 96 Europe Reactor Cooling Systems Market by Country, 2023-2033 (US$ Mn, AGR (%))
Figure 97 Europe Reactor Cooling Systems Market Forecast by Country, 2023-2033 (%)
Figure 98 Europe Reactor Cooling Systems Market by Capacity, 2023-2033 (US$ Mn, AGR (%))
Figure 99 Europe Reactor Cooling Systems Market Forecast by Capacity 2023-2033 (%)
Figure 100 Europe Reactor Cooling Systems Market by Configuration, 2023-2033 (US$ Mn, AGR (%))
Figure 101 Europe Reactor Cooling Systems Market Forecast by Configuration, 2023-2033 (%)
Figure 102 Europe Reactor Cooling Systems Market by Mechanism, 2023-2033 (US$ Mn, AGR (%))
Figure 103 Europe Reactor Cooling Systems Market Forecast by Mechanism 2023-2033 (%)
Figure 104 Europe Reactor Cooling Systems Market by System Type, 2023-2033 (US$ Mn, AGR (%))
Figure 105 Europe Reactor Cooling Systems Market Forecast by System Type, 2023-2033 (%)
Figure 106 Europe Reactor Cooling Systems Market by Component, 2023-2033 (US$ Mn, AGR (%))
Figure 107 Europe Reactor Cooling Systems Market Forecast by Component, 2023-2033 (%)
Figure 108 Germany Reactor Cooling Systems Market by Value, 2023-2033 (US$ Mn, AGR (%))
Figure 109 UK Reactor Cooling Systems Market by Value, 2023-2033 (US$ Mn, AGR (%))
Figure 110 France Reactor Cooling Systems Market by Value, 2023-2033 (US$ Mn, AGR (%))
Figure 111 Russia Reactor Cooling Systems Market by Value, 2023-2033 (US$ Mn, AGR (%))
Figure 112 Spain Reactor Cooling Systems Market by Value, 2023-2033 (US$ Mn, AGR (%))
Figure 113 Rest of Europe Reactor Cooling Systems Market by Value, 2023-2033 (US$ Mn, AGR (%))
Figure 114 Asia Pacific Reactor Cooling Systems Market Attractiveness Index
Figure 115 Asia Pacific Reactor Cooling Systems Market by Region, 2023, 2028 & 2033 (US$ Million)
Figure 116 Asia-Pacific Reactor Cooling Systems Market by Value, 2023-2033 (US$ Mn, AGR (%))
Figure 117 Asia-Pacific Reactor Cooling Systems Market by Country, 2023-2033 (US$ Mn, AGR (%))
Figure 118 Asia-Pacific Reactor Cooling Systems Market by Capacity, 2023-2033 (US$ Mn, AGR (%))
Figure 119 Asia-Pacific Reactor Cooling Systems Market Forecast by Capacity 2023-2033 (%)
Figure 120 Asia-Pacific Reactor Cooling Systems Market by Configuration, 2023-2033 (US$ Mn, AGR (%))
Figure 121 Asia-Pacific Reactor Cooling Systems Market Forecast by Configuration, 2023-2033 (%)
Figure 122 Asia-Pacific Reactor Cooling Systems Market by Mechanism, 2023-2033 (US$ Mn, AGR (%))
Figure 123 Asia-Pacific Reactor Cooling Systems Market Forecast by Mechanism 2023-2033 (%)
Figure 124 Asia-Pacific Reactor Cooling Systems Market by System Type, 2023-2033 (US$ Mn, AGR (%))
Figure 125 Asia-Pacific Reactor Cooling Systems Market Forecast by System Type, 2023-2033 (%)
Figure 126 Asia-Pacific Reactor Cooling Systems Market by Component, 2023-2033 (US$ Mn, AGR (%))
Figure 127 Asia-Pacific Reactor Cooling Systems Market Forecast by Component, 2023-2033 (%)
Figure 128 China Reactor Cooling Systems Market by Value, 2023-2033 (US$ Mn, AGR (%))
Figure 129 India Reactor Cooling Systems Market by Value, 2023-2033 (US$ Mn, AGR (%))
Figure 130 Japan Reactor Cooling Systems Market by Value, 2023-2033 (US$ Mn, AGR (%))
Figure 131 South Korea Reactor Cooling Systems Market by Value, 2023-2033 (US$ Mn, AGR (%))
Figure 132 Australia Reactor Cooling Systems Market by Value, 2023-2033 (US$ Mn, AGR (%))
Figure 133 Rest of Asia-Pacific Reactor Cooling Systems Market by Value, 2023-2033 (US$ Mn, AGR (%))
Figure 134 Middle East & Africa Reactor Cooling Systems Market Attractiveness Index
Figure 135 Middle East & Africa Reactor Cooling Systems Market by Region, 2023, 2028 & 2033 (US$ Million)
Figure 136 Middle East & Africa Reactor Cooling Systems Market by Value, 2023-2033 (US$ Mn, AGR (%))
Figure 137 Middle East & Africa Reactor Cooling Systems Market by Country, 2023-2033 (US$ Mn, AGR (%))
Figure 138 Middle East & Africa Reactor Cooling Systems Market by Capacity, 2023-2033 (US$ Mn, AGR (%))
Figure 139 Middle East & Africa Reactor Cooling Systems Market Forecast by Capacity 2023-2033 (%)
Figure 140 Middle East & Africa Reactor Cooling Systems Market by Configuration, 2023-2033 (US$ Mn, AGR (%))
Figure 141 Middle East & Africa Reactor Cooling Systems Market Forecast by Configuration, 2023-2033 (%)
Figure 142 Middle East & Africa Reactor Cooling Systems Market by Mechanism, 2023-2033 (US$ Mn, AGR (%))
Figure 143 Middle East & Africa Reactor Cooling Systems Market Forecast by Mechanism 2023-2033 (%)
Figure 144 Middle East & Africa Reactor Cooling Systems Market by System Type, 2023-2033 (US$ Mn, AGR (%))
Figure 145 Middle East & Africa Reactor Cooling Systems Market Forecast by System Type, 2023-2033 (%)
Figure 146 Middle East & Africa Reactor Cooling Systems Market by Component, 2023-2033 (US$ Mn, AGR (%))
Figure 147 Middle East & Africa Reactor Cooling Systems Market Forecast by Component, 2023-2033 (%)
Figure 148 GCC Reactor Cooling Systems Market by Value, 2023-2033 (US$ Mn, AGR (%))
Figure 149 South Africa Reactor Cooling Systems Market by Value, 2023-2033 (US$ Mn, AGR (%))
Figure 150 Rest of Middle East & Africa Reactor Cooling Systems Market by Value, 2023-2033 (US$ Mn, AGR (%))
Figure 151 Latin America Reactor Cooling Systems Market Attractiveness Index
Figure 152 Latin America Reactor Cooling Systems Market by Region, 2023, 2028 & 2033 (US$ Million)
Figure 153 Latin America Reactor Cooling Systems Market by Value, 2023-2033 (US$ Mn, AGR (%))
Figure 154 Latin America Reactor Cooling Systems Market by Country, 2023-2033 (US$ Mn, AGR (%))
Figure 155 Latin America Reactor Cooling Systems Market Forecast by Country, 2023-2033 (%)
Figure 156 Latin America Reactor Cooling Systems Market by Capacity, 2023-2033 (US$ Mn, AGR (%))
Figure 157 Latin America Reactor Cooling Systems Market Forecast by Capacity 2023-2033 (%)
Figure 158 Latin America Reactor Cooling Systems Market by Configuration, 2023-2033 (US$ Mn, AGR (%))
Figure 159 Latin America Reactor Cooling Systems Market Forecast by Configuration, 2023-2033 (%)
Figure 160 Latin America Reactor Cooling Systems Market by Mechanism, 2023-2033 (US$ Mn, AGR (%))
Figure 161 Latin America Reactor Cooling Systems Market Forecast by Mechanism 2023-2033 (%)
Figure 162 Latin America Reactor Cooling Systems Market by System Type, 2023-2033 (US$ Mn, AGR (%))
Figure 163 Latin America Reactor Cooling Systems Market Forecast by System Type, 2023-2033 (%)
Figure 164 Latin America Reactor Cooling Systems Market by Component, 2023-2033 (US$ Mn, AGR (%))
Figure 165 Latin America Reactor Cooling Systems Market Forecast by Component, 2023-2033 (%)
Figure 166 Brazil Reactor Cooling Systems Market by Value, 2023-2033 (US$ Mn, AGR (%))
Figure 167 Argentina Reactor Cooling Systems Market by Value, 2023-2033 (US$ Mn, AGR (%))
Figure 168 Rest of Latin America Reactor Cooling Systems Market by Value, 2023-2033 (US$ Mn, AGR (%))
Figure 169 Reactor Cooling Systems Market: Company Share, 2022
Figure 170 General Electric Company. Net Revenue, 2018-2022 (US$ Million, AGR%)
Figure 171 General Electric Company.: R&D, 2018-2022 (US$ Million, AGR%)
Figure 172 General Electric Company.: Regional Revenue Share, 2022 (%)
Figure 173 General Electric Company.: Business Segment Revenue Share, 2022 (%)
Figure 174 Mitsubishi Heavy Industries, Ltd.: Net Revenue, 2018-2022 (US$ Million, AGR%)
Figure 175 Mitsubishi Heavy Industries, Ltd.: R&D, 2018-2022 (US$ Million, AGR%)
Figure 176 Mitsubishi Heavy Industries, Ltd.: Regional Revenue Share, 2022 (%)
Figure 177 Mitsubishi Heavy Industries, Ltd.: Business Segment Revenue Share, 2022 (%)
Figure 178 Babcock International Group plc.: Net Revenue, 2018-2022 (US$ Million, AGR%)
Figure 179 Babcock International Group plc.: Regional Revenue Share, 2022 (%)
Figure 180 Babcock International Group plc.: Business Segment Revenue Share, 2022 (%)
Figure 181 Harbin Electric Company Limited. Net Revenue, 2018-2022 (US$ Million, AGR%)
Figure 182 Harbin Electric Company Limited. R&D, 2018-2022 (US$ Million, AGR%)
Figure 183 Harbin Electric Company Limited. Regional Revenue Share, 2022 (%)
Figure 184 Harbin Electric Company Limited. Business Segment Revenue Share, 2022 (%)
Figure 185 Dongfang Electric Corporation. Net Revenue, 2018-2022 (US$ Million, AGR%)
Figure 186 Dongfang Electric Corporation. R&D, 2018-2022 (US$ Million, AGR%)
Figure 187 Dongfang Electric Corporation. Regional Revenue Share, 2022 (%)
Figure 188 Dongfang Electric Corporation. Business Segment Revenue Share, 2022 (%)
Figure 189 Bharat Heavy Electricals Limited (BHEL).: Net Revenue, 2018-2022 (US$ Million, AGR%)
Figure 190 Bharat Heavy Electricals Limited (BHEL).: R&D, 2018-2022 (US$ Million, AGR%)
Figure 191 Bharat Heavy Electricals Limited (BHEL): Regional Revenue Share, 2022 (%)
Figure 192 Bharat Heavy Electricals Limited (BHEL): Business Segment Revenue Share, 2022 (%)
Figure 193 Sulzer Ltd.: Net Revenue, 2018-2022 (US$ Million, AGR%)
Figure 194 Sulzer Ltd.: R&D, 2018-2022 (US$ Million, AGR%)
Figure 195 Sulzer Ltd.: Regional Revenue Share, 2022 (%)
Figure 196 Sulzer Ltd.: Business Segment Revenue Share, 2022 (%)
Figure 197 Shanghai Electric Group Company Limited. Net Revenue, 2018-2022 (US$ Million, AGR%)
Figure 198 Shanghai Electric Group Company Limited. R&D, 2018-2022 (US$ Million, AGR%)
Figure 199 Shanghai Electric Group Company Limited. Regional Revenue Share, 2022 (%)
Figure 200 Shanghai Electric Group Company Limited. Business Segment Revenue Share, 2022 (%)
Figure 201 Rolls-Royce Limited. Net Revenue, 2018-2022 (US$ Million, AGR%)
Figure 202 Rolls-Royce Limited. R&D, 2018-2022 (US$ Million, AGR%)
Figure 203 Rolls-Royce Limited. Regional Revenue Share, 2022 (%)
Figure 204 Rolls-Royce Limited. Business Segment Revenue Share, 2022 (%)
Figure 205 IHI Corporation. Net Revenue, 2018-2022 (US$ Million, AGR%)
Figure 206 IHI Corporation.: R&D, 2018-2022 (US$ Million, AGR%)
Figure 207 IHI Corporation.: Regional Revenue Share, 2022 (%)
Figure 208 IHI Corporation.: Business Segment Revenue Share, 2022 (%)
ページTOPに戻る
よくあるご質問
Visiongain社はどのような調査会社ですか?
英国の調査会社ヴィジョンゲイン社(Visiongain)は、通信とエネルギーのほか、自動車や化学・医薬品、金属など、広範な市場を対象に調査を行っています。自動車市場については、市場全般に関する調査のほ... もっと見る
調査レポートの納品までの日数はどの程度ですか?
在庫のあるものは速納となりますが、平均的には 3-4日と見て下さい。
但し、一部の調査レポートでは、発注を受けた段階で内容更新をして納品をする場合もあります。
発注をする前のお問合せをお願いします。
注文の手続きはどのようになっていますか?
1)お客様からの御問い合わせをいただきます。
2)見積書やサンプルの提示をいたします。
3)お客様指定、もしくは弊社の発注書をメール添付にて発送してください。
4)データリソース社からレポート発行元の調査会社へ納品手配します。
5) 調査会社からお客様へ納品されます。最近は、pdfにてのメール納品が大半です。
お支払方法の方法はどのようになっていますか?
納品と同時にデータリソース社よりお客様へ請求書(必要に応じて納品書も)を発送いたします。
お客様よりデータリソース社へ(通常は円払い)の御振り込みをお願いします。
請求書は、納品日の日付で発行しますので、翌月最終営業日までの当社指定口座への振込みをお願いします。振込み手数料は御社負担にてお願いします。
お客様の御支払い条件が60日以上の場合は御相談ください。
尚、初めてのお取引先や個人の場合、前払いをお願いすることもあります。ご了承のほど、お願いします。
データリソース社はどのような会社ですか?
当社は、世界各国の主要調査会社・レポート出版社と提携し、世界各国の市場調査レポートや技術動向レポートなどを日本国内の企業・公官庁及び教育研究機関に提供しております。
世界各国の「市場・技術・法規制などの」実情を調査・収集される時には、データリソース社にご相談ください。
お客様の御要望にあったデータや情報を抽出する為のレポート紹介や調査のアドバイスも致します。
|
|

