マイクロリアクターとラボスケールリアクターの市場レポート:2023-2033
Microreactors and Lab-scale Reactors Market Report 2023-2033
レポート詳細
マイクロリアクターとラボスケールリアクターの市場レポート 2023-2033 :本レポートは、新たな収益の柱を目指す大手企業にとって、業界とその根底にある力学をより深く理解する上で貴重... もっと見る
※上記価格は部署ライセンス(Departmental licence)価格です。
その他の価格についてはデータリソースまでお問合せください。
日本語のページは自動翻訳を利用し作成しています。
実際のレポートは英文のみでご納品いたします。

|

|
サマリー
レポート詳細
マイクロリアクターとラボスケールリアクターの市場レポート 2023-2033:本レポートは、新たな収益の柱を目指す大手企業にとって、業界とその根底にある力学をより深く理解する上で貴重なものとなろう。異業種への進出や、新たな地域での既存事業の拡大を希望する企業にとっても有用であろう。
環境に優しいソリューションの開拓
持続可能で環境に優しい化学の実践に向けた世界的なシフトは、マイクロリアクターとラボスケールリアクター市場の成長を支える大きな原動力となっている。産業界が環境フットプリントの削減に努め、厳しい規制を遵守する中、マイクロリアクターとラボスケールリアクターは、環境に優しいプロセスを開発するための多目的プラットフォームを提供する。これらのコンパクトなリアクターは、反応条件の正確な制御を可能にし、廃棄物やエネルギー消費を最小限に抑える。小規模な化学反応の効率的な合成、最適化、テストを促進することで、医薬品、化学品、石油化学などのセクターにおいて、よりクリーンで持続可能なプロセスの開発に貢献します。
研究開発(R&D)活動の促進
マイクロリアクターとラボスケールリアクターは、研究開発活動の迅速化において極めて重要な役割を果たします。反応容積が小さく、反応速度が速いこれらのリアクターにより、研究者は様々な反応条件を迅速に探索し、複数の反応経路をスクリーニングすることができる。このような研究開発の加速により、新製品、プロセス、触媒の迅速な開発が可能になる。産業界は、大量生産にスケールアップする前に、効率的に仮説をテストし、検証することができる。この原動力は、医薬品や特殊化学品のような、タイムリーな技術革新が競争力を維持し、市場の要求に応えるために不可欠な産業において、特に重要であります。
市場調査レポートを購入する前にすべき質問とは?
- マイクロリアクターとラボスケールリアクター市場はどのように進化しているのか?
- マイクロリアクターとラボスケールリアクター市場の推進要因と抑制要因は何か?
- マイクロリアクターとラボスケールリアクターの各サブマーケットセグメントは予測期間中にどのように成長し、これらのサブマーケットが2033年にどれくらいの収益を占めるようになるのか?
- 2023年から2033年にかけて、マイクロリアクターとラボスケールリアクターの各サブマーケットの市場シェアはどのように推移するのか?
- 2023年から2033年にかけて、市場全体の主な牽引役は何になるのか?
- マイクロリアクターとラボスケールリアクターの主要市場はマクロ経済の動きに大枠で追随するのか、それとも個々の国内市場が他を凌駕するのか?
- 2033年までに各国市場のシェアはどう変化し、2033年に市場をリードするのはどの地域か?
- 主要プレイヤーは誰で、予測期間中の見通しは?
- これらの主要企業によるマイクロリアクターとラボスケールリアクターのプロジェクトとは?
- 2023年から2033年の間に、業界はどのように発展していくのか?マイクロリアクターとラボスケールリアクターのプロジェクトは、現在、そして今後10年間でどのような意味を持つのか?
- マイクロリアクターとラボスケールリアクター市場をさらに拡大するために、製品の商業化の必要性は高まっているか?
- マイクロリアクターとラボスケールリアクター市場はどこに向かっているのか、そしてどのようにすれば市場の最前線に立てるのか?
- 新製品やサービスラインに対する最適な投資オプションは何か?
- 企業を新たな成長軌道に乗せ、C-suiteに移行させるための重要な展望とは?
マイクロリアクターとラボスケールリアクターの市場が、現在、そして今後10年間でどのような影響を受けるかを知る必要がある:
- 358ページにわたる本レポートでは、123の表と155の図表を掲載しています。
- 本レポートでは、業界における主要な有利分野を取り上げているため、今すぐターゲットを絞ることができます。
- 本レポートには、世界、地域、国の売上と成長に関する詳細な分析が含まれています。
- 競合他社が成功した主なトレンド、変化、収益予測をハイライトしています。
本レポートは、マイクロリアクターとラボスケールリアクター市場が今後10年間でどのように発展するか、またCOVID-19の景気後退と好転の変動に合わせてどのように発展するかをお伝えします。この市場は、過去10年間のどの時点よりも今が重要である。
2033年までの予測やその他の分析から、商業的な展望が明らかになる
- 2033年までの収益予測に加え、直近の業績、成長率、市場シェアもご覧いただけます。
- ビジネスの展望と展開に関する独自の分析をご覧いただけます。
- 定性的分析(市場ダイナミクス、促進要因、機会、阻害要因、課題を含む)、コスト構造、マイクロリアクターとラボスケールリアクターの価格上昇の影響、最近の動向をご覧いただけます。
本レポートには、COVID-19が業界と貴社にどのような影響を与えるかについてのデータ分析と貴重な洞察が含まれている。本レポートでは、COVID-19の4つの回収パターンとその影響、すなわち「V」、「L」、「W」、「U」について論じている。
レポート対象セグメント
サイズ別市場セグメント
- マイクロリアクター
- ラボスケールリアクター
燃料タイプ別市場セグメント
- TRISO燃料
- UO2燃料
- ウラン・ジルコニウム(UZr)
- その他の燃料タイプ
用途別市場セグメント
- 孤立運転
- 分散型エネルギー
- 耐障害性都市アプリケーション
- 海洋推進
- 災害救援
タイプ別市場セグメント
- 軽水炉(LWR)
- 溶融塩炉(MSR)
- ガス冷却炉(GCRs)
- 金属冷却高速炉(MFR)
- ヒートパイプ炉
- その他のタイプ
世界市場全体とセグメント別の収益予測に加え、4つの地域と20の主要国市場の収益予測も掲載しています:
北米
- アメリカ
- カナダ
欧州
- ドイツ
- ロシア
- イギリス
- フランス
- イタリア
- その他の欧州
アジア太平洋
- 中国
- 日本
- インド
- インドネシア
- 韓国
- その他のアジア太平洋地域
ラテンアメリカ
- ブラジル
- メキシコ
- その他のラテンアメリカ
中東・アフリカ
- GCC
- 南アフリカ
- その他の中東・アフリカ
本レポートには、マイクロリアクターとラボスケールリアクター市場の2023年から2033年にかけての主要企業のプロファイルも含まれており、これらの企業の事業のこのセグメントに焦点を当てている。
主要企業と市場成長の可能性
・ BWX Technologies, Inc.
・ Gen4 Energy, Inc.
・ Holosgen LLC
・ LeadCold
・ MicroNuclear LLC
・ Nano Nuclear Energy Inc.
・ NuGen LLC
・ NuScale Power Corporation
・ Oklo
・ Radiant
・ StarCore Nuclear
・ UltraSafe Nuclear Corporation (USNC)
・ Urenco Limited
・ Westinghouse Electric Company LLC
・ X Energy, LLC
マイクロリアクターとラボスケールリアクター市場の2023年から2033年にかけての世界全体の売上高は、金額ベースで2023年に1億9,160万米ドルを突破することが我々の研究で計算された。2033年まで力強い収益成長を予測。当研究所では、最大の可能性を秘めた組織を特定しています。彼らの能力、進歩、商業的展望を発見し、一歩先を行くお手伝いをします。
マイクロリアクターとラボスケールリアクターの市場、2023年から2033年までのレポートはどのようにお役に立ちますか?
要約すると、350ページを超えるこのレポートは、以下の知識を提供する:
- マイクロリアクターとラボスケールリアクター市場の2023年から2033年までの収益予測 市場規模、燃料タイプ、用途、タイプ、それぞれの予測を世界レベルと地域レベルで掲載 - 業界の展望を発見し、投資と収益に最も有利な場所を見つけます。
- 4つの地域と20の主要国市場の2033年までの収益予測 - マイクロリアクターとラボスケールリアクター市場、北米、欧州、アジア太平洋、ラテンアメリカ、中東&アフリカの2023年から2033年までの市場予測をご覧ください。また、米国、カナダ、ブラジル、ドイツ、フランス、英国、ロシア、イタリア、中国、インド、日本、オーストラリアなどの著名経済圏の市場も予測しています。
- マイクロリアクターとラボスケールリアクター市場に関わる主要企業15社の企業プロファイルを含む、2023年から2033年までの既存企業と市場参入を目指す企業の展望。
独自の予測による定量的・定性的分析をご覧ください。私たちのレポートだけに含まれる情報を入手し、貴重なビジネスインテリジェンスで情報を得ることができます。
他にはない情報
私たちの新しいレポートがあれば、知識に遅れをとったり、チャンスを逃したりする可能性が低くなります。弊社の調査レポートが貴社の調査、分析、意思決定にどのように役立つかをご覧ください。Visiongainの調査は、マイクロリアクターとラボスケールリアクター市場、2023年から2033年、市場をリードする企業の商業分析を必要とするすべての人のためのものです。データ、トレンド、予測をご覧いただけます。
ページTOPに戻る
目次
目次
1 レポート概要
1.1 研究の目的
1.2 マイクロリアクターとラボスケールリアクター市場の紹介
1.3 本レポートの特徴
1.4 本レポートを読むべき理由
1.5 本分析レポートが回答する主な質問
1.6 本レポートは誰のためのものか?
1.7 方法論
1.7.1 市場の定義
1.7.2 市場評価・予測手法
1.7.3 データの検証
1.7.3.1 一次調査
1.7.3.2 セカンダリーリサーチ
1.8 よくある質問(FAQ)
1.9 Visiongainの関連レポート
1.10 Visiongainについて
2 エグゼクティブ・サマリー
3 市場概要
3.1 主要な調査結果
3.2 市場ダイナミクス
3.2.1 市場促進要因
3.2.1.1 原子力は重要かつ持続可能なエネルギー源として台頭してきた
3.2.1.2 世界人口の継続的増加と経済の拡大により、電力需要は増加傾向にある
3.2.1.3 特定のエネルギーニーズに応じてマイクロリアクターやラボスケールリアクターをスケールアップできるため、様々な用途に適応できる
3.2.2 市場抑制要因
3.2.2.1 廃炉とそれに伴う長期的負債の管理が大きな課題となる
3.2.2.2 マイクロリアクターとラボスケールリアクターの高い資本コストが市場成長を妨げる
3.2.2.3 遠隔地やオフグリッドでのマイクロリアクターの展開には、適切なインフラとサポートシステムの構築が必要となる可能性がある
3.2.3 市場機会
3.2.3.1 設計、材料、製造技術により、マイクロリアクターとラボスケールリアクターはより効率的で、安全で、経済的に有効な市場機会となっている
3.2.3.2 民間企業や投資家による小型・先進リアクター開発への関心の高まり
3.2.3.3 マイクロリアクターとラボスケールリアクターを開発・商業化する国は輸出の可能性があり、経済成長の機会を開く
3.3 ポーターのファイブフォース分析
3.3.1 サプライヤーの交渉力(中)
3.3.2 買い手の交渉力(低~中)
3.3.3 競争上のライバル(低)
3.3.4 代替品による脅威(低)
3.3.5 新規参入の脅威(低)
3.4 COVID-19の影響分析
3.4.1 "V字型回復"
3.4.2 "U字型回復"
3.4.3 "W字型回復"
3.4.4 "L字型回復"
3.5 PEST分析
4 マイクロリアクターとラボスケールリアクター市場分析:規模別
4.1 主要調査結果
4.2 サイズセグメント 市場魅力度指数
4.3 マイクロリアクターとラボスケールリアクターのサイズ別市場規模推定と予測
4.4 マイクロリアクター
4.4.1 2023〜2033年の地域別市場規模(US$ Million)
4.4.2 地域別市場シェア、2023年・2033年(%)
4.5 ラボスケールリアクター
4.5.1 2023~2033年の地域別市場規模(US$ Million)
4.5.2 地域別市場シェア、2023年・2033年(%)
5 マイクロリアクターとラボスケールリアクター市場分析:燃料タイプ別
5.1 主要な調査結果
5.2 燃料タイプ別セグメント 市場魅力度指数
5.3 マイクロリアクターとラボスケールリアクターの燃料タイプ別市場規模推定と予測
5.4 TRi-structuralイソトロピック[TRISO]
5.4.1 2023~2033年の地域別市場規模(US$ Million)
5.4.2 地域別市場シェア、2023年・2033年(%)
5.5 UO2燃料
5.5.1 2023~2033年の地域別市場規模(US$ Million)
5.5.2 地域別市場シェア、2023年・2033年(%)
5.6 ウランジルコニウム(UZr)
5.6.1 2023~2033年の地域別市場規模(US$ Million)
5.6.2 地域別市場シェア、2023年・2033年(%)
5.7 その他の燃料タイプ
5.7.1 2023〜2033年の地域別市場規模(US$ Million)
5.7.2 地域別市場シェア、2023年・2033年(%)
6 マイクロリアクターとラボスケールリアクター市場分析:用途別
6.1 主要な調査結果
6.2 アプリケーションセグメント 市場魅力度指数
6.3 マイクロリアクターとラボスケールリアクターの用途別市場規模推定と予測
6.4 分離操作
6.4.1 2023~2033年の地域別市場規模(US$ Million)
6.4.2 地域別市場シェア、2023年・2033年(%)
6.5 分散型エネルギー
6.5.1 2023~2033年の地域別市場規模(US$ Million)
6.5.2 2023年及び2033年の地域別市場シェア(%)
6.6 レジリエントな都市アプリケーション
6.6.1 2023〜2033年の地域別市場規模(US$ Million)
6.6.2 地域別市場シェア、2023年及び2033年(%)
6.7 海洋推進
6.7.1 2023~2033年の地域別市場規模(US$ Million)
6.7.2 地域別市場シェア、2023年および2033年 (%)
6.8 災害救援
6.8.1 2023〜2033年の地域別市場規模(US$ Million)
6.8.2 2023年および2033年の地域別市場シェア(%)
7 マイクロリアクターとラボスケールリアクター市場分析:タイプ別
7.1 主要な調査結果
7.2 タイプ別セグメント 市場魅力度指数
7.3 マイクロリアクターとラボスケールリアクターのタイプ別市場規模推定と予測
7.4 軽水炉(LWR)
7.4.1 2023~2033年の地域別市場規模(US$ Million)
7.4.2 地域別市場シェア、2023年・2033年(%)
7.5 溶融塩炉(MSR)
7.5.1 2023~2033年の地域別市場規模(US$ Million)
7.5.2 地域別市場シェア、2023年及び2033年(%)
7.6 ガス冷却炉(GCR)
7.6.1 2023~2033年の地域別市場規模(US$ Million)
7.6.2 地域別市場シェア、2023年・2033年(%)
7.7 金属冷却高速炉(MFR)
7.7.1 2023~2033年の地域別市場規模(US$ Million)
7.7.2 地域別市場シェア、2023年・2033年(%)
7.8 ヒートパイプリアクター
7.8.1 2023~2033年の地域別市場規模(US$ Million)
7.8.2 地域別市場シェア、2023年・2033年(%)
7.9 その他のタイプ
7.9.1 2023~2033年の地域別市場規模(US$ Million)
7.9.2 地域別市場シェア、2023年・2033年(%)
8 マイクロリアクターとラボスケールリアクター市場分析:地域別
8.1 主要な調査結果
8.2 地域別市場規模の推定と予測
9 北米のマイクロリアクターとラボスケールリアクター市場分析
9.1 主要な調査結果
9.2 北米のマイクロリアクターとラボスケールリアクター市場魅力度指数
9.3 北米のマイクロリアクターとラボスケールリアクターの国別市場、2023年、2028年、2033年 (US$ Million)
9.4 北米のマイクロリアクターとラボスケールリアクター市場規模推定と予測
9.5 北米のマイクロリアクターとラボスケールリアクター市場規模推定と予測:国別
9.6 北米のマイクロリアクターとラボスケールリアクター市場規模推定と予測:規模別
9.7 北米のマイクロリアクターとラボスケールリアクター市場規模推定と予測:燃料タイプ別
9.8 北米のマイクロリアクターとラボスケールリアクター市場規模推定と予測:用途別
9.9 北米のマイクロリアクターとラボスケールリアクター市場規模推定と予測:タイプ別
9.10 米国マイクロリアクターとラボスケールリアクター市場分析
9.11 カナダのマイクロリアクターとラボスケールリアクターの市場分析
10 欧州のマイクロリアクターとラボスケールリアクターの市場分析
10.1 主要な調査結果
10.2 マイクロリアクターとラボスケールリアクターの欧州市場魅力度指数
10.3 欧州のマイクロリアクターとラボスケールリアクターの国別市場、2023年、2028年、2033年 (US$ Million)
10.4 欧州のマイクロリアクターとラボスケールリアクター市場規模推定と予測
10.5 欧州のマイクロリアクターとラボスケールリアクター市場規模推定と予測:国別
10.6 欧州のマイクロリアクターとラボスケールリアクター市場規模推定と予測:規模別
10.7 欧州のマイクロリアクターとラボスケールリアクター市場規模推定と予測:燃料タイプ別
10.8 欧州のマイクロリアクターとラボスケールリアクター市場規模推定と予測:用途別
10.9 欧州のマイクロリアクターとラボスケールリアクター市場規模推定と予測:タイプ別
10.10 ドイツのマイクロリアクターとラボスケールリアクターの市場分析
10.11 イギリスのマイクロリアクターとラボスケールリアクターの市場分析
10.12 フランスのマイクロリアクターとラボスケールリアクターの市場分析
10.13 イタリアのマイクロリアクターとラボスケールリアクターの市場分析
10.14 ロシアのマイクロリアクターとラボスケールリアクターの市場分析
10.15 その他の欧州のマイクロリアクターとラボスケールリアクターの市場分析
11 アジア太平洋地域のマイクロリアクターとラボスケールリアクター市場分析
11.1 主要な調査結果
11.2 アジア太平洋地域のマイクロリアクターとラボスケールリアクター市場魅力度指数
11.3 アジア太平洋地域のマイクロリアクターとラボスケールリアクター国別市場:2023年、2028年、2033年 (US$ Million)
11.4 アジア太平洋地域のマイクロリアクターとラボスケールリアクター市場規模推定と予測
11.5 アジア太平洋地域のマイクロリアクターとラボスケールリアクター市場規模推定と予測:国別
11.6 アジア太平洋地域のマイクロリアクターとラボスケールリアクター市場規模推定と予測:規模別
11.7 アジア太平洋地域のマイクロリアクターとラボスケールリアクター市場規模推定と予測:燃料タイプ別
11.8 アジア太平洋地域のマイクロリアクターとラボスケールリアクター市場規模推定と予測:用途別
11.9 アジア太平洋地域のマイクロリアクターとラボスケールリアクター市場規模推定と予測:タイプ別
11.10 中国のマイクロリアクターとラボスケールリアクターの市場分析
11.11 インドネシアのマイクロリアクターとラボスケールリアクターの市場分析
11.12 日本マイクロリアクターとラボスケールリアクターの市場分析
11.13 韓国マイクロリアクターとラボスケールリアクターの市場分析
11.14 インドのマイクロリアクターとラボスケールリアクターの市場分析
11.15 その他のアジア太平洋地域のマイクロリアクターとラボスケールリアクターの市場分析
12 中東・アフリカのマイクロリアクターとラボスケールリアクター市場分析
12.1 主要な調査結果
12.2 マイクロリアクターとラボスケールリアクターの中東・アフリカ市場魅力度指数
12.3 中東・アフリカのマイクロリアクターとラボスケールリアクターの国別市場:2023年、2028年、2033年 (US$ Million)
12.4 中東・アフリカのマイクロリアクターとラボスケールリアクター市場規模推定と予測
12.5 中東・アフリカのマイクロリアクターとラボスケールリアクター市場規模推定と予測:国別
12.6 中東・アフリカのマイクロリアクターとラボスケールリアクター市場規模推定と予測:規模別
12.7 中東・アフリカのマイクロリアクターとラボスケールリアクター市場規模推定と予測:燃料タイプ別
12.8 中東・アフリカのマイクロリアクターとラボスケールリアクター市場規模推定と予測:用途別
12.9 中東・アフリカのマイクロリアクターとラボスケールリアクター市場規模推定と予測:タイプ別
12.10 GCCマイクロリアクターとラボスケールリアクターの市場分析
12.11 南アフリカのマイクロリアクターとラボスケールリアクターの市場分析
12.12 その他の中東・アフリカ地域のマイクロリアクターとラボスケールリアクターの市場分析
13 ラテンアメリカのマイクロリアクターとラボスケールリアクター市場分析
13.1 主要な調査結果
13.2 ラテンアメリカのマイクロリアクターとラボスケールリアクター市場魅力度指数
13.3 ラテンアメリカのマイクロリアクターとラボスケールリアクターの国別市場:2023年、2028年、2033年 (US$ Million)
13.4 ラテンアメリカのマイクロリアクターとラボスケールリアクターの市場規模推定と予測
13.5 ラテンアメリカのマイクロリアクターとラボスケールリアクターの市場規模推定と予測:国別
13.6 ラテンアメリカのマイクロリアクターとラボスケールリアクターの市場規模推定と予測:規模別
13.7 ラテンアメリカのマイクロリアクターとラボスケールリアクターの市場規模推定と予測:燃料タイプ別
13.8 ラテンアメリカのマイクロリアクターとラボスケールリアクターの市場規模推定と予測:用途別
13.9 ラテンアメリカのマイクロリアクターとラボスケールリアクターの市場規模推定と予測:タイプ別
13.10 ブラジルのマイクロリアクターとラボスケールリアクターの市場分析
13.11 アルゼンチンのマイクロリアクターとラボスケールリアクターの市場分析
13.12 その他のラテンアメリカのマイクロリアクターとラボスケールリアクターの市場分析
14 主要企業のプロファイル
14.1 戦略的展望
14.2 BWX Technologies, Inc.
14.2.1 会社概要
14.2.2 会社概要
14.2.3 財務分析
14.2.3.1 純収入、2018-2022年
14.2.3.2 R&D、2018-2022年
14.2.4 製品ベンチマーク
14.2.5 戦略的展望
14.3 MicroNuclear LLC
14.3.1 会社概要
14.3.2 会社概要
14.3.3 製品ベンチマーク
14.4 Nano Nuclear Energy Inc.
14.4.1 会社概要
14.4.2 会社概要
14.4.3 製品ベンチマーク
14.4.4 戦略的展望
14.5 NuGen LLC
14.5.1 会社概要
14.5.2 会社概要
14.5.3 製品ベンチマーク
14.6 Radiant
14.6.1 会社概要
14.6.2 会社概要
14.6.3 製品ベンチマーク
14.6.4 戦略的展望
14.7 Urenco Limited
14.7.1 会社概要
14.7.2 会社概要
14.7.3 製品ベンチマーク
14.7.4 戦略的展望
14.8 StarCore Nuclear
14.8.1 会社概要
14.8.2 会社概要
14.8.3 製品ベンチマーク
14.8.4 戦略的展望
14.9 UltraSafe Nuclear
14.9.1 会社概要
14.9.2 会社概要
14.9.3 製品ベンチマーク
14.9.4 戦略的展望
14.10 Holosgen LLC
14.10.1 会社概要
14.10.2 会社概要
14.10.3 製品ベンチマーク
14.11 Gen4 Energy, Inc.
14.11.1 会社概要
14.11.2 会社概要
14.11.3 製品ベンチマーク
14.12 X Energy, LLC
14.12.1 会社概要
14.12.2 会社概要
14.12.3 製品ベンチマーク
14.12.4 戦略的展望
14.13 LeadCold
14.13.1 会社概要
14.13.2 会社概要
14.13.3 製品ベンチマーク
14.13.4 戦略的展望
14.14 Westinghouse Electric Company LLC
14.14.1 会社概要
14.14.2 会社概要
14.14.3 製品ベンチマーク
14.14.4 戦略的展望
14.15 NuScale Power Corporation
14.15.1 会社概要
14.15.2 会社概要
14.15.3 財務分析
14.15.3.1 純収入、2018-2022年
14.15.3.2 R&D、2018年~2022年
14.15.4 製品ベンチマーク
14.15.5 戦略的展望
14.16 Oklo
14.16.1 会社概要
14.16.2 会社概要
14.16.3 製品ベンチマーク
15 結論と提言
15.1 Visiongainからの結びの言葉
15.2 市場プレイヤーへの提言
ページTOPに戻る
図表リスト
表の一覧
Table 1 Microreactors and Lab-Scale Reactors Market Snapshot, 2023 & 2033 (US$ Million, CAGR %)
Table 2 Nuclear Statistics by U.S (End of 2021)
Table 3 Grid Connections in 2023
Table 4 Grid Connection’s Construction Started
Table 5 World Population 2015- 2020
Table 6 Global Microreactors and Lab-scale Reactors Market by Region, 2023-2033 (US$ Mn, AGR (%), CAGR (%)) (V-Shaped Recovery Scenario)
Table 7 Global Microreactors and Lab-scale Reactors Market by Region, 2023-2033 (US$ Mn, AGR (%), CAGR (%)) (U-Shaped Recovery Scenario)
Table 8 Global Microreactors and Lab-scale Reactors Market by Region, 2023-2033 (US$ Mn, AGR (%), CAGR (%)) (W-Shaped Recovery Scenario)
Table 9 Global Microreactors and Lab-scale Reactors Market by Region, 2023-2033 (US$ Mn, AGR (%), CAGR (%)) (L-Shaped Recovery Scenario)
Table 10 Global Microreactors and Lab-scale Reactors Market by Size, 2023-2033 (US$ Mn, AGR (%), CAGR (%))
Table 11 Micro Reactors Market by Region, 2023-2033 (US$ Mn, AGR (%), CAGR (%))
Table 12 Lab-scale Reactors Market by Region, 2023-2033 (US$ Mn, AGR (%), CAGR (%))
Table 13 Global Microreactors and Lab-scale Reactors Market by Fuel Type, 2023-2033 (US$ Mn, AGR (%), CAGR (%))
Table 14 TRi-structural ISOtropic [TRISO] Market by Region, 2023-2033 (US$ Mn, AGR (%), CAGR (%))
Table 15 UO2 fuel Market by Region, 2023-2033 (US$ Mn, AGR (%), CAGR (%))
Table 16 Uranium Zirconium (UZr) Market by Region, 2023-2033 (US$ Mn, AGR (%), CAGR (%))
Table 17 Other Fuel Type Market by Region, 2023-2033 (US$ Mn, AGR (%), CAGR (%))
Table 18 Global Microreactors and Lab-scale Reactors Market by Application, 2023-2033 (US$ Mn, AGR (%), CAGR (%))
Table 19 Isolated Operations Market by Region, 2023-2033 (US$ Mn, AGR (%), CAGR (%))
Table 20 Distributed Energy Market by Region, 2023-2033 (US$ Mn, AGR (%), CAGR (%))
Table 21 Resilient Urban Applications Market by Region, 2023-2033 (US$ Mn, AGR (%), CAGR (%))
Table 22 Marine Propulsion Market by Region, 2023-2033 (US$ Mn, AGR (%), CAGR (%))
Table 23 Disaster Relief Market by Region, 2023-2033 (US$ Mn, AGR (%), CAGR (%))
Table 24 Global Microreactors and Lab-scale Reactors Market by Type, 2023-2033 (US$ Mn, AGR (%), CAGR (%))
Table 25 Light-Water Reactors (LWRs) Market by Region, 2023-2033 (US$ Mn, AGR (%), CAGR (%))
Table 26 Molten Salt Reactors (MSRs) Market by Region, 2023-2033 (US$ Mn, AGR (%), CAGR (%))
Table 27 Gas-Cooled Reactors (GCRs) Market by Region, 2023-2033 (US$ Mn, AGR (%), CAGR (%))
Table 28 Metal-Cooled Fast Reactors (MFRs) Market by Region, 2023-2033 (US$ Mn, AGR (%), CAGR (%))
Table 29 Heat Pipe Reactors Market by Region, 2023-2033 (US$ Mn, AGR (%), CAGR (%))
Table 30 Other Type Market by Region, 2023-2033 (US$ Mn, AGR (%), CAGR (%))
Table 31 Global Microreactors and Lab-scale Reactors Market Forecast, 2023-2033 (US$ Mn, AGR (%), CAGR (%))
Table 32 Microreactors and Lab-Scale Reactors Market Forecast by Region, 2023-2033 (US$ Million, AGR%, CAGR%)
Table 33 North America Microreactors and Lab-scale Reactors Market by Value, 2023-2033 (US$ Mn, AGR (%), CAGR (%))
Table 34 North America Microreactors and Lab-scale Reactors Market by Country, 2023-2033 (US$ Mn, AGR (%), CAGR (%))
Table 35 North America Microreactors and Lab-scale Reactors Market by Size, 2023-2033 (US$ Mn, AGR (%), CAGR (%))
Table 36 North America Microreactors and Lab-scale Reactors Market by Fuel Type, 2023-2033 (US$ Mn, AGR (%), CAGR (%))
Table 37 North America Microreactors and Lab-scale Reactors Market by Application, 2023-2033 (US$ Mn, AGR (%), CAGR (%))
Table 38 North America Microreactors and Lab-scale Reactors Market by Type, 2023-2033 (US$ Mn, AGR (%), CAGR (%))
Table 39 US Microreactors and Lab-scale Reactors Market by Value, 2023-2033 (US$ Mn, AGR (%), CAGR (%))
Table 40 Canada Microreactors and Lab-scale Reactors Market by Value, 2023-2033 (US$ Mn, AGR (%), CAGR (%))
Table 41 Europe Microreactors and Lab-scale Reactors Market by Value, 2023-2033 (US$ Mn, AGR (%), CAGR (%))
Table 42 Europe Microreactors and Lab-scale Reactors Market by Country, 2023-2033 (US$ Mn, AGR (%), CAGR (%))
Table 43 Europe Microreactors and Lab-scale Reactors Market by Size, 2023-2033 (US$ Mn, AGR (%), CAGR (%))
Table 44 Europe Microreactors and Lab-scale Reactors Market by Fuel Type, 2023-2033 (US$ Mn, AGR (%), CAGR (%))
Table 45 Europe Microreactors and Lab-scale Reactors Market by Application, 2023-2033 (US$ Mn, AGR (%), CAGR (%))
Table 46 Europe Microreactors and Lab-scale Reactors Market by Type, 2023-2033 (US$ Mn, AGR (%), CAGR (%))
Table 47 Germany Microreactors and Lab-scale Reactors Market by Value, 2023-2033 (US$ Mn, AGR (%), CAGR (%))
Table 48 UK Microreactors and Lab-scale Reactors Market by Value, 2023-2033 (US$ Mn, AGR (%), CAGR (%))
Table 49 France Microreactors and Lab-scale Reactors Market by Value, 2023-2033 (US$ Mn, AGR (%), CAGR (%))
Table 50 Italy Microreactors and Lab-scale Reactors Market by Value, 2023-2033 (US$ Mn, AGR (%), CAGR (%))
Table 51 Russia Microreactors and Lab-scale Reactors Market by Value, 2023-2033 (US$ Mn, AGR (%), CAGR (%))
Table 52 Rest of Europe Microreactors and Lab-scale Reactors Market by Value, 2023-2033 (US$ Mn, AGR (%), CAGR (%))
Table 53 Asia-Pacific Microreactors and Lab-scale Reactors Market by Value, 2023-2033 (US$ Mn, AGR (%), CAGR (%))
Table 54 Asia-Pacific Microreactors and Lab-scale Reactors Market by Country, 2023-2033 (US$ Mn, AGR (%), CAGR (%))
Table 55 Asia-Pacific Microreactors and Lab-scale Reactors Market by Size, 2023-2033 (US$ Mn, AGR (%), CAGR (%))
Table 56 Asia-Pacific Microreactors and Lab-scale Reactors Market by Fuel Type, 2023-2033 (US$ Mn, AGR (%), CAGR (%))
Table 57 Asia-Pacific Microreactors and Lab-scale Reactors Market by Application, 2023-2033 (US$ Mn, AGR (%), CAGR (%))
Table 58 Asia-Pacific Microreactors and Lab-scale Reactors Market by Type, 2023-2033 (US$ Mn, AGR (%), CAGR (%))
Table 59 China Microreactors and Lab-scale Reactors Market by Value, 2023-2033 (US$ Mn, AGR (%), CAGR (%))
Table 60 Indonesia Microreactors and Lab-scale Reactors Market by Value, 2023-2033 (US$ Mn, AGR (%), CAGR (%))
Table 61 Japan Microreactors and Lab-scale Reactors Market by Value, 2023-2033 (US$ Mn, AGR (%), CAGR (%))
Table 62 South Korea Microreactors and Lab-scale Reactors Market by Value, 2023-2033 (US$ Mn, AGR (%), CAGR (%))
Table 63 India Microreactors and Lab-scale Reactors Market by Value, 2023-2033 (US$ Mn, AGR (%), CAGR (%))
Table 64 Rest of Asia-Pacific Microreactors and Lab-scale Reactors Market by Value, 2023-2033 (US$ Mn, AGR (%), CAGR (%))
Table 65 Middle East & Africa Microreactors and Lab-scale Reactors Market by Value, 2023-2033 (US$ Mn, AGR (%), CAGR (%))
Table 66 Middle East & Africa Microreactors and Lab-scale Reactors Market by Country, 2023-2033 (US$ Mn, AGR (%), CAGR (%))
Table 67 Middle East & Africa Microreactors and Lab-scale Reactors Market by Size, 2023-2033 (US$ Mn, AGR (%), CAGR (%))
Table 68 Middle East & Africa Microreactors and Lab-scale Reactors Market by Fuel Type, 2023-2033 (US$ Mn, AGR (%), CAGR (%))
Table 69 Middle East & Africa Microreactors and Lab-scale Reactors Market by Application, 2023-2033 (US$ Mn, AGR (%), CAGR (%))
Table 70 Middle East & Africa Microreactors and Lab-scale Reactors Market by Type, 2023-2033 (US$ Mn, AGR (%), CAGR (%))
Table 71 GCC Microreactors and Lab-scale Reactors Market by Value, 2023-2033 (US$ Mn, AGR (%), CAGR (%))
Table 72 South Africa Microreactors and Lab-scale Reactors Market by Value, 2023-2033 (US$ Mn, AGR (%), CAGR (%))
Table 73 Rest of Middle East & Africa Microreactors and Lab-scale Reactors Market by Value, 2023-2033 (US$ Mn, AGR (%), CAGR (%))
Table 74 Latin America Microreactors and Lab-scale Reactors Market by Value, 2023-2033 (US$ Mn, AGR (%), CAGR (%))
Table 75 Latin America Microreactors and Lab-scale Reactors Market by Country, 2023-2033 (US$ Mn, AGR (%), CAGR (%))
Table 76 Latin America Microreactors and Lab-scale Reactors Market by Size, 2023-2033 (US$ Mn, AGR (%), CAGR (%))
Table 77 Latin America Microreactors and Lab-scale Reactors Market by Fuel Type, 2023-2033 (US$ Mn, AGR (%), CAGR (%))
Table 78 Latin America Microreactors and Lab-scale Reactors Market by Application, 2023-2033 (US$ Mn, AGR (%), CAGR (%))
Table 79 Latin America Microreactors and Lab-scale Reactors Market by Type, 2023-2033 (US$ Mn, AGR (%), CAGR (%))
Table 80 Brazil Microreactors and Lab-scale Reactors Market by Value, 2023-2033 (US$ Mn, AGR (%), CAGR (%))
Table 81 Argentina Microreactors and Lab-scale Reactors Market by Value, 2023-2033 (US$ Mn, AGR (%), CAGR (%))
Table 82 Rest of Latin America Microreactors and Lab-scale Reactors Market by Value, 2023-2033 (US$ Mn, AGR (%), CAGR (%))
Table 83 Strategic Outlook Analysis
Table 84 BWX Technologies, Inc.: Key Details, (CEO, HQ, Revenue, Founded, No. of Employees, Company Type, Website, Business Segment)
Table 85 BWX Technologies, Inc: Product Benchmarking
Table 86 BWX Technologies, Inc: Strategic Outlook
Table 87 MicroNuclear LLC: Key Details, (CEO, HQ, Revenue, Founded, No. of Employees, Company Type, Website, Business Segment)
Table 88 MicroNuclear LLC: Product Benchmarking
Table 89 Nano Nuclear Energy Inc.: Key Details, (CEO, HQ, Revenue, Founded, No. of Employees, Company Type, Website, Business Segment)
Table 90 Nano Nuclear Energy Inc.: Product Benchmarking
Table 91 Nano Nuclear Energy Inc.: Strategic Outlook
Table 92 NuGen LLC: Key Details, (CEO, HQ, Revenue, Founded, No. of Employees, Company Type, Website, Business Segment)
Table 93 NuGen LLC: Product Benchmarking
Table 94 Radiant: Key Details, (CEO, HQ, Revenue, Founded, No. of Employees, Company Type, Website, Business Segment)
Table 95 Radiant: Product Benchmarking
Table 96 Radiant: Strategic Outlook
Table 97 Urenco Limited: Key Details, (CEO, HQ, Revenue, Founded, No. of Employees, Company Type, Website, Business Segment)
Table 98 Urenco Limited: Product Benchmarking
Table 99 Urenco Limited: Strategic Outlook
Table 100 StarCore Nuclear: Key Details, (CEO, HQ, Revenue, Founded, No. of Employees, Company Type, Website, Business Segment)
Table 101 StarCore Nuclear: Product Benchmarking
Table 102 StarCore Nuclear: Strategic Outlook
Table 103 UltraSafe Nuclear : Key Details, (CEO, HQ, Revenue, Founded, No. of Employees, Company Type, Website, Business Segment)
Table 104 UltraSafe Nuclear: Product Benchmarking
Table 105 UltraSafe Nuclear: Strategic Outlook
Table 106 Holosgen LLC: Key Details, (CEO, HQ, Revenue, Founded, No. of Employees, Company Type, Website, Business Segment)
Table 107 Holosgen LLC: Product Benchmarking
Table 108 Gen4 Energy, Inc : Key Details, (CEO, HQ, Revenue, Founded, No. of Employees, Company Type, Website, Business Segment)
Table 109 Gen4 Energy, Inc: Product Benchmarking
Table 110 X Energy, LLC: Key Details, (CEO, HQ, Revenue, Founded, No. of Employees, Company Type, Website, Business Segment)
Table 111 X Energy, LLC: Product Benchmarking
Table 112 X Energy, LLC: Strategic Outlook
Table 113 LeadCold : Key Details, (CEO, HQ, Revenue, Founded, No. of Employees, Company Type, Website, Business Segment)
Table 114 LeadCold: Product Benchmarking
Table 115 LeadCold: Strategic Outlook
Table 116 Westinghouse Electric Company LLC: Key Details, (CEO, HQ, Revenue, Founded, No. of Employees, Company Type, Website, Business Segment)
Table 117 Westinghouse Electric Company LLC: Product Benchmarking
Table 118 Westinghouse Electric Company LLC: Strategic Outlook
Table 119 NuScale Power Corporation: Key Details, (CEO, HQ, Revenue, Founded, No. of Employees, Company Type, Website, Business Segment)
Table 120 NuScale Power Corporation: Product Benchmarking
Table 121 NuScale Power Corporation: Strategic Outlook
Table 122 Oklo: Key Details, (CEO, HQ, Revenue, Founded, No. of Employees, Company Type, Website, Business Segment)
Table 123 Oklo: Product Benchmarking
図の一覧
Figure 1 Microreactors and Lab-Scale Reactors Market Segmentation
Figure 2 Microreactors and Lab-Scale Reactors Market by Size: Market Attractiveness Index
Figure 3 Microreactors and Lab-Scale Reactors Market by Fuel Type: Market Attractiveness Index
Figure 4 Microreactors and Lab-Scale Reactors Market by Application: Market Attractiveness Index
Figure 5 Microreactors and Lab-Scale Reactors Market by Type: Market Attractiveness Index
Figure 6 Microreactors and Lab-Scale Reactors Market Attractiveness Index by Region
Figure 7 Microreactors and Lab-Scale Reactors Market: Market Dynamics
Figure 8 Global changes in electricity demand, 2017-2022
Figure 9 Capital Cost Comparison,2020
Figure 10 Microreactors and Lab-Scale Reactors Market: Porter’s Five Forces Analysis
Figure 11 Global Microreactors and Lab-Scale Reactors Market Share Forecast by COVID, 2023-2033 (%)
Figure 12 Global Microreactors and Lab-scale Reactors Market by Region, 2023-2033 (US$ Mn, AGR (%)) (V-Shaped Recovery Scenario)
Figure 13 Global Microreactors and Lab-scale Reactors Market by Region, 2023-2033 (US$ Mn, AGR (%)) (U-Shaped Recovery Scenario)
Figure 14 Global Microreactors and Lab-scale Reactors Market by Region, 2023-2033 (US$ Mn, AGR (%)) (W-Shaped Recovery Scenario)
Figure 15 Global Microreactors and Lab-scale Reactors Market by Region, 2023-2033 (US$ Mn, AGR (%)) (L-Shaped Recovery Scenario)
Figure 16 Microreactors and Lab-Scale Reactors Market: PEST Analysis
Figure 17 Microreactors and Lab-Scale Reactors Market by Size: Market Attractiveness Index
Figure 18 Global Microreactors and Lab-scale Reactors Market by Size, 2023-2033 (US$ Mn, AGR (%))
Figure 19 Microreactors and Lab-Scale Reactors Market Share Forecast by Size, 2023, 2028, 2033 (%)
Figure 20 Micro Reactors Market by Region, 2023-2033 (US$ Mn, AGR (%))
Figure 21 Micro Reactors Market Share Forecast by Region, 2023 & 2033 (%)
Figure 22 Lab-scale Reactors Market by Region, 2023-2033 (US$ Mn, AGR (%))
Figure 23 Lab-scale Reactors Market Share Forecast by Region, 2023 & 2033 (%)
Figure 24 Microreactors and Lab-Scale Reactors Market by Fuel Type: Market Attractiveness Index
Figure 25 Global Microreactors and Lab-scale Reactors Market by Fuel Type, 2023-2033 (US$ Mn, AGR (%))
Figure 26 Microreactors and Lab-Scale Reactors Market Share Forecast by Fuel Type, 2023, 2028, 2033 (%)
Figure 27 TRi-structural ISOtropic [TRISO] Market by Region, 2023-2033 (US$ Mn, AGR (%))
Figure 28 TRi-structural ISOtropic [TRISO] Market Share Forecast by Region, 2023 & 2033 (%)
Figure 29 UO2 fuel Market by Region, 2023-2033 (US$ Mn, AGR (%))
Figure 30 UO2 fuel Market Share Forecast by Region, 2023 & 2033 (%)
Figure 31 Uranium Zirconium (UZr) Market by Region, 2023-2033 (US$ Mn, AGR (%))
Figure 32 Uranium Zirconium (UZr) Market Share Forecast by Region, 2023 & 2033 (%)
Figure 33 Other Fuel Type Market by Region, 2023-2033 (US$ Mn, AGR (%))
Figure 34 Other Fuel Type Market Share Forecast by Region, 2023 & 2033 (%)
Figure 35 Microreactors and Lab-Scale Reactors Market by Application: Market Attractiveness Index
Figure 36 Global Microreactors and Lab-scale Reactors Market by Application, 2023-2033 (US$ Mn, AGR (%))
Figure 37 Microreactors and Lab-Scale Reactors Market Share Forecast by Application, 2023, 2028, 2033 (%)
Figure 38 Isolated Operations Market by Region, 2023-2033 (US$ Mn, AGR (%))
Figure 39 Isolated Operations Market Share Forecast by Region, 2023 & 2033 (%)
Figure 40 Distributed Energy Market by Region, 2023-2033 (US$ Mn, AGR (%))
Figure 41 Distributed Energy Market Share Forecast by Region, 2023 & 2033 (%)
Figure 42 Resilient Urban Applications Market by Region, 2023-2033 (US$ Mn, AGR (%))
Figure 43 Resilient Urban Applications Market Share Forecast by Region, 2023 & 2033 (%)
Figure 44 Marine Propulsion Market by Region, 2023-2033 (US$ Mn, AGR (%))
Figure 45 Marine Propulsion Market Share Forecast by Region, 2023 & 2033 (%)
Figure 46 Disaster Relief Market by Region, 2023-2033 (US$ Mn, AGR (%))
Figure 47 Disaster Relief Market Share Forecast by Region, 2023 & 2033 (%)
Figure 48 Microreactors and Lab-Scale Reactors Market by Type: Market Attractiveness Index
Figure 49 Global Microreactors and Lab-scale Reactors Market by Type, 2023-2033 (US$ Mn, AGR (%))
Figure 50 Microreactors and Lab-Scale Reactors Market Share Forecast by Type, 2023, 2028, 2033 (%)
Figure 51 Light-Water Reactors (LWRs) Market by Region, 2023-2033 (US$ Mn, AGR (%))
Figure 52 Light-Water Reactors (LWRs) Market Share Forecast by Region, 2023 & 2033 (%)
Figure 53 Molten Salt Reactors (MSRs) Market by Region, 2023-2033 (US$ Mn, AGR (%))
Figure 54 Molten Salt Reactors (MSRs) Market Share Forecast by Region, 2023 & 2033 (%)
Figure 55 Gas-Cooled Reactors (GCRs) Market by Region, 2023-2033 (US$ Mn, AGR (%))
Figure 56 Gas-Cooled Reactors (GCRs) Market Share Forecast by Region, 2023 & 2033 (%)
Figure 57 Metal-Cooled Fast Reactors (MFRs) Market by Region, 2023-2033 (US$ Mn, AGR (%))
Figure 58 Metal-Cooled Fast Reactors (MFRs) Market Share Forecast by Region, 2023 & 2033 (%)
Figure 59 Heat Pipe Reactors Market by Region, 2023-2033 (US$ Mn, AGR (%))
Figure 60 Heat Pipe Reactors Market Share Forecast by Region, 2023 & 2033 (%)
Figure 61 Other Type Market by Region, 2023-2033 (US$ Mn, AGR (%))
Figure 62 Other Type Market Share Forecast by Region, 2023 & 2033 (%)
Figure 63 Microreactors and Lab-Scale Reactors Market Forecast by Region 2023 and 2033 (Revenue, CAGR%)
Figure 64 Global Microreactors and Lab-scale Reactors Market Forecast, 2023-2033 (US$ Mn, AGR (%))
Figure 65 Microreactors and Lab-Scale Reactors Market Share Forecast by Region 2023, 2028, 2033 (%)
Figure 66 Microreactors and Lab-Scale Reactors Market by Region, 2023-2033 (US$ Million, AGR %)
Figure 67 North America Microreactors and Lab-Scale Reactors Market Attractiveness Index
Figure 68 North America Microreactors and Lab-Scale Reactors Market by Region, 2023, 2028 & 2033 (US$ Million)
Figure 69 North America Microreactors and Lab-scale Reactors Market by Value, 2023-2033 (US$ Mn, AGR (%))
Figure 70 North America Microreactors and Lab-scale Reactors Market by Country, 2023-2033 (US$ Mn, AGR (%))
Figure 71 North America Microreactors and Lab-Scale Reactors Market Share Forecast by Country, 2023 & 2033 (%)
Figure 72 North America Microreactors and Lab-scale Reactors Market by Size, 2023-2033 (US$ Mn, AGR (%))
Figure 73 North America Microreactors and Lab-Scale Reactors Market Share Forecast Size, 2023 & 2033 (%)
Figure 74 North America Microreactors and Lab-scale Reactors Market by Fuel Type, 2023-2033 (US$ Mn, AGR (%))
Figure 75 North America Microreactors and Lab-Scale Reactors Market Share Forecast by Fuel Type, 2023 & 2033 (%)
Figure 76 North America Microreactors and Lab-scale Reactors Market by Application, 2023-2033 (US$ Mn, AGR (%))
Figure 77 North America Microreactors and Lab-Scale Reactors Market Share Forecast by Application, 2023 & 2033 (%)
Figure 78 North America Microreactors and Lab-scale Reactors Market by Type, 2023-2033 (US$ Mn, AGR (%))
Figure 79 North America Microreactors and Lab-Scale Reactors Market Share Forecast by Type, 2023 & 2033 (%)
Figure 80 US Microreactors and Lab-scale Reactors Market by Value, 2023-2033 (US$ Mn, AGR (%))
Figure 81 Canada Microreactors and Lab-scale Reactors Market by Value, 2023-2033 (US$ Mn, AGR (%))
Figure 82 Europe Microreactors and Lab-Scale Reactors Market Attractiveness Index
Figure 83 Europe Microreactors and Lab-Scale Reactors Market by Region, 2023, 2028 & 2033 (US$ Million)
Figure 84 Europe Microreactors and Lab-scale Reactors Market by Value, 2023-2033 (US$ Mn, AGR (%))
Figure 85 Europe Microreactors and Lab-scale Reactors Market by Country, 2023-2033 (US$ Mn, AGR (%))
Figure 86 Europe Microreactors and Lab-Scale Reactors Market Share Forecast by Country, 2023 & 2033 (%)
Figure 87 Europe Microreactors and Lab-scale Reactors Market by Size, 2023-2033 (US$ Mn, AGR (%))
Figure 88 Europe Microreactors and Lab-Scale Reactors Market Share Forecast Size, 2023 & 2033 (%)
Figure 89 Europe Microreactors and Lab-scale Reactors Market by Fuel Type, 2023-2033 (US$ Mn, AGR (%))
Figure 90 Europe Microreactors and Lab-Scale Reactors Market Share Forecast by Fuel Type, 2023 & 2033 (%)
Figure 91 Europe Microreactors and Lab-scale Reactors Market by Application, 2023-2033 (US$ Mn, AGR (%))
Figure 92 Europe Microreactors and Lab-Scale Reactors Market Share Forecast by Application, 2023 & 2033 (%)
Figure 93 Europe Microreactors and Lab-scale Reactors Market by Type, 2023-2033 (US$ Mn, AGR (%))
Figure 94 Europe Microreactors and Lab-Scale Reactors Market Share Forecast by Type, 2023 & 2033 (%)
Figure 95 Germany Microreactors and Lab-scale Reactors Market by Value, 2023-2033 (US$ Mn, AGR (%))
Figure 96 UK Microreactors and Lab-scale Reactors Market by Value, 2023-2033 (US$ Mn, AGR (%))
Figure 97 France Microreactors and Lab-scale Reactors Market by Value, 2023-2033 (US$ Mn, AGR (%))
Figure 98 Italy Microreactors and Lab-scale Reactors Market by Value, 2023-2033 (US$ Mn, AGR (%))
Figure 99 Russia Microreactors and Lab-scale Reactors Market by Value, 2023-2033 (US$ Mn, AGR (%))
Figure 100 Rest of Europe Microreactors and Lab-scale Reactors Market by Value, 2023-2033 (US$ Mn, AGR (%))
Figure 101 Asia-Pacific Microreactors and Lab-Scale Reactors Market Attractiveness Index
Figure 102 Asia-Pacific Microreactors and Lab-Scale Reactors Market by Region, 2023, 2028 & 2033 (US$ Million)
Figure 103 Asia-Pacific Microreactors and Lab-scale Reactors Market by Value, 2023-2033 (US$ Mn, AGR (%))
Figure 104 Asia-Pacific Microreactors and Lab-scale Reactors Market by Country, 2023-2033 (US$ Mn, AGR (%))
Figure 105 Asia-Pacific Microreactors and Lab-Scale Reactors Market Share Forecast by Country, 2023 & 2033 (%)
Figure 106 Asia-Pacific Microreactors and Lab-scale Reactors Market by Size, 2023-2033 (US$ Mn, AGR (%))
Figure 107 Asia-Pacific Microreactors and Lab-Scale Reactors Market Share Forecast Size, 2023 & 2033 (%)
Figure 108 Asia-Pacific Microreactors and Lab-scale Reactors Market by Fuel Type, 2023-2033 (US$ Mn, AGR (%))
Figure 109 Asia-Pacific Microreactors and Lab-Scale Reactors Market Share Forecast by Fuel Type, 2023 & 2033 (%)
Figure 110 Asia-Pacific Microreactors and Lab-scale Reactors Market by Application, 2023-2033 (US$ Mn, AGR (%))
Figure 111 Asia-Pacific Microreactors and Lab-Scale Reactors Market Share Forecast by Application, 2023 & 2033 (%)
Figure 112 Asia-Pacific Microreactors and Lab-scale Reactors Market by Type, 2023-2033 (US$ Mn, AGR (%))
Figure 113 Asia-Pacific Microreactors and Lab-Scale Reactors Market Share Forecast by Type, 2023 & 2033 (%)
Figure 114 China Microreactors and Lab-scale Reactors Market by Value, 2023-2033 (US$ Mn, AGR (%))
Figure 115 Indonesia Microreactors and Lab-scale Reactors Market by Value, 2023-2033 (US$ Mn, AGR (%))
Figure 116 Japan Microreactors and Lab-scale Reactors Market by Value, 2023-2033 (US$ Mn, AGR (%))
Figure 117 South Korea Microreactors and Lab-scale Reactors Market by Value, 2023-2033 (US$ Mn, AGR (%))
Figure 118 India Microreactors and Lab-scale Reactors Market by Value, 2023-2033 (US$ Mn, AGR (%))
Figure 119 Rest of Asia-Pacific Microreactors and Lab-scale Reactors Market by Value, 2023-2033 (US$ Mn, AGR (%))
Figure 120 Middle East and Africa Microreactors and Lab-Scale Reactors Market Attractiveness Index
Figure 121 Middle East and Africa Microreactors and Lab-Scale Reactors Market by Region, 2023, 2028 & 2033 (US$ Million)
Figure 122 Middle East & Africa Microreactors and Lab-scale Reactors Market by Value, 2023-2033 (US$ Mn, AGR (%))
Figure 123 Middle East & Africa Microreactors and Lab-scale Reactors Market by Country, 2023-2033 (US$ Mn, AGR (%))
Figure 124 Middle East and Africa Microreactors and Lab-Scale Reactors Market Share Forecast by Country, 2023 & 2033 (%)
Figure 125 Middle East & Africa Microreactors and Lab-scale Reactors Market by Size, 2023-2033 (US$ Mn, AGR (%))
Figure 126 Middle East and Africa Microreactors and Lab-Scale Reactors Market Share Forecast Size, 2023 & 2033 (%)
Figure 127 Middle East & Africa Microreactors and Lab-scale Reactors Market by Fuel Type, 2023-2033 (US$ Mn, AGR (%))
Figure 128 Middle East and Africa Microreactors and Lab-Scale Reactors Market Share Forecast by Fuel Type, 2023 & 2033 (%)
Figure 129 Middle East & Africa Microreactors and Lab-scale Reactors Market by Application, 2023-2033 (US$ Mn, AGR (%))
Figure 130 Middle East and Africa Microreactors and Lab-Scale Reactors Market Share Forecast by Application, 2023 & 2033 (%)
Figure 131 Middle East & Africa Microreactors and Lab-scale Reactors Market by Type, 2023-2033 (US$ Mn, AGR (%))
Figure 132 Middle East and Africa Microreactors and Lab-Scale Reactors Market Share Forecast by Type, 2023 & 2033 (%)
Figure 133 GCC Microreactors and Lab-scale Reactors Market by Value, 2023-2033 (US$ Mn, AGR (%))
Figure 134 South Africa Microreactors and Lab-scale Reactors Market by Value, 2023-2033 (US$ Mn, AGR (%))
Figure 135 Rest of Middle East & Africa Microreactors and Lab-scale Reactors Market by Value, 2023-2033 (US$ Mn, AGR (%))
Figure 136 Latin America Microreactors and Lab-Scale Reactors Market Attractiveness Index
Figure 137 Latin America Microreactors and Lab-Scale Reactors Market by Region, 2023, 2028 & 2033 (US$ Million)
Figure 138 Latin America Microreactors and Lab-scale Reactors Market by Value, 2023-2033 (US$ Mn, AGR (%))
Figure 139 Latin America Microreactors and Lab-scale Reactors Market by Country, 2023-2033 (US$ Mn, AGR (%))
Figure 140 Latin America Microreactors and Lab-Scale Reactors Market Share Forecast by Country, 2023 & 2033 (%)
Figure 141 Latin America Microreactors and Lab-scale Reactors Market by Size, 2023-2033 (US$ Mn, AGR (%))
Figure 142 Latin America Microreactors and Lab-Scale Reactors Market Share Forecast Size, 2023 & 2033 (%)
Figure 143 Latin America Microreactors and Lab-scale Reactors Market by Fuel Type, 2023-2033 (US$ Mn, AGR (%))
Figure 144 Latin America Microreactors and Lab-Scale Reactors Market Share Forecast by Fuel Type, 2023 & 2033 (%)
Figure 145 Latin America Microreactors and Lab-scale Reactors Market by Application, 2023-2033 (US$ Mn, AGR (%))
Figure 146 Latin America Microreactors and Lab-Scale Reactors Market Share Forecast by Application, 2023 & 2033 (%)
Figure 147 Latin America Microreactors and Lab-scale Reactors Market by Type, 2023-2033 (US$ Mn, AGR (%))
Figure 148 Latin America Microreactors and Lab-Scale Reactors Market Share Forecast by Type, 2023 & 2033 (%)
Figure 149 Brazil Microreactors and Lab-scale Reactors Market by Value, 2023-2033 (US$ Mn, AGR (%))
Figure 150 Argentina Microreactors and Lab-scale Reactors Market by Value, 2023-2033 (US$ Mn, AGR (%))
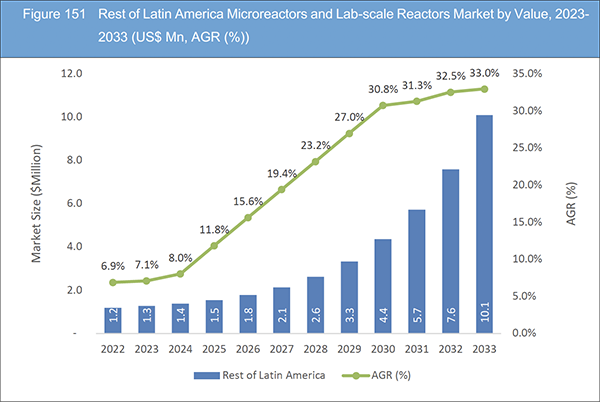
Figure 151 Rest of Latin America Microreactors and Lab-scale Reactors Market by Value, 2023-2033 (US$ Mn, AGR (%))
Figure 152 BWX Technologies, Inc.: Net Revenue, 2018-2022 (US$ Million, AGR%)
Figure 153 BWX Technologies, Inc.: R&D, 2018-2022 (US$ Million, AGR%)
Figure 154 NuScale Power Corporation.: Net Revenue, 2018-2022 (US$ Million, AGR%)
Figure 155 NuScale Power Corporation.: R&D, 2018-2022 (US$ Million, AGR%)
ページTOPに戻る
Summary
Report Details
The Microreactors and Lab-scale Reactors Market Report 2023-2033: This report will prove invaluable to leading firms striving for new revenue pockets if they wish to better understand the industry and its underlying dynamics. It will be useful for companies that would like to expand into different industries or to expand their existing operations in a new region.
Pioneering Eco-Friendly Solutions
The global shift towards sustainable and green chemistry practices is a major driving force behind the growth of the microreactors and lab-scale reactors market. As industries strive to reduce their environmental footprint and adhere to stringent regulations, microreactors and lab-scale reactors provide a versatile platform for developing eco-friendly processes. These compact reactors enable precise control over reaction conditions, minimizing waste and energy consumption. By facilitating efficient synthesis, optimization, and testing of chemical reactions on a smaller scale, they contribute to the development of cleaner and more sustainable processes across sectors such as pharmaceuticals, chemicals, and petrochemicals.
Accelerated Research and Development (R&D) Activities
Microreactors and lab-scale reactors play a pivotal role in expediting research and development activities. With their reduced reaction volumes and faster reaction kinetics, these reactors allow researchers to quickly explore various reaction conditions and screen multiple reaction pathways. This acceleration of R&D efforts enables the rapid development of new products, processes, and catalysts. Industries can efficiently test and validate hypotheses before scaling up to larger production volumes. This driver is particularly relevant in industries like pharmaceuticals and specialty chemicals, where timely innovation is critical to staying competitive and meeting market demands.
What Questions Should You Ask before Buying a Market Research Report?
• How is the microreactors and lab-scale reactors market evolving?
• What is driving and restraining the microreactors and lab-scale reactors market?
• How will each microreactors and lab-scale reactors submarket segment grow over the forecast period and how much revenue will these submarkets account for in 2033?
• How will the market shares for each microreactors and lab-scale reactors submarket develop from 2023 to 2033?
• What will be the main driver for the overall market from 2023 to 2033?
• Will leading microreactors and lab-scale reactors markets broadly follow the macroeconomic dynamics, or will individual national markets outperform others?
• How will the market shares of the national markets change by 2033 and which geographical region will lead the market in 2033?
• Who are the leading players and what are their prospects over the forecast period?
• What are the microreactors and lab-scale reactors projects for these leading companies?
• How will the industry evolve during the period between 2023 and 2033? What are the implications of microreactors and lab-scale reactors projects taking place now and over the next 10 years?
• Is there a greater need for product commercialisation to further scale the microreactors and lab-scale reactors market?
• Where is the microreactors and lab-scale reactors market heading and how can you ensure you are at the forefront of the market?
• What are the best investment options for new product and service lines?
• What are the key prospects for moving companies into a new growth path and C-suite?
You need to discover how this will impact the microreactors and lab-scale reactors market today, and over the next 10 years:
• Our 358-page report provides 123 tables and 155 charts/graphs exclusively to you.
• The report highlights key lucrative areas in the industry so you can target them – NOW.
• It contains in-depth analysis of global, regional and national sales and growth.
• It highlights for you the key successful trends, changes and revenue projections made by your competitors.
This report tells you TODAY how the microreactors and lab-scale reactors market will develop in the next 10 years, and in line with the variations in COVID-19 economic recession and bounce. This market is more critical now than at any point over the last 10 years.
Forecasts to 2033 and other analyses reveal commercial prospects
• In addition to revenue forecasting to 2033, our new study provides you with recent results, growth rates, and market shares.
• You will find original analyses, with business outlooks and developments.
• Discover qualitative analyses (including market dynamics, drivers, opportunities, restraints and challenges), cost structure, impact of rising microreactors and lab-scale reactors prices and recent developments.
This report includes data analysis and invaluable insight into how COVID-19 will affect the industry and your company. Four COVID-19 recovery patterns and their impact, namely, “V”, “L”, “W” and “U” are discussed in this report.
Segments Covered in the Report
Market Segment by Size
• Micro Reactors
• Lab-scale Reactors
Market Segment by Fuel Type
• TRi-structural ISOtropic (TRISO)
• UO2 fuel
• Uranium Zirconium (UZr)
• Other Fuel Type
Market Segment by Application
• Isolated Operations
• Distributed Energy
• Resilient Urban Applications
• Marine Propulsion
• Disaster Relief
Market Segment by Type
• Light-Water Reactors (LWRs)
• Molten Salt Reactors (MSRs)
• Gas-Cooled Reactors (GCRs)
• Metal-Cooled Fast Reactors (MFRs)
• Heat Pipe Reactors
• Other Type
In addition to the revenue predictions for the overall world market and segments, you will also find revenue forecasts for four regional and 20 leading national markets:
North America
• U.S.
• Canada
Europe
• Germany
• Russia
• United Kingdom
• France
• Italy
• Rest of Europe
Asia Pacific
• China
• Japan
• India
• Indonesia
• South Korea
• Rest of Asia Pacific
Latin America
• Brazil
• Mexico
• Rest of Latin America
Middle East & Africa
• GCC
• South Africa
• Rest of Middle East & Africa
The report also includes profiles and for some of the leading companies in the Microreactors and Lab-scale Reactors Market, 2023 to 2033, with a focus on this segment of these companies’ operations.
Leading companies and the potential for market growth
• BWX Technologies, Inc.
• Gen4 Energy, Inc.
• Holosgen LLC
• LeadCold
• MicroNuclear LLC
• Nano Nuclear Energy Inc.
• NuGen LLC
• NuScale Power Corporation
• Oklo
• Radiant
• StarCore Nuclear
• UltraSafe Nuclear Corporation (USNC)
• Urenco Limited
• Westinghouse Electric Company LLC
• X Energy, LLC
Overall world revenue for Microreactors and Lab-scale Reactors Market, 2023 to 2033 in terms of value the market will surpass US$191.6 million in 2023, our work calculates. We predict strong revenue growth through to 2033. Our work identifies which organizations hold the greatest potential. Discover their capabilities, progress, and commercial prospects, helping you stay ahead.
How will the Microreactors and Lab-scale Reactors Market, 2023 to 2033 report help you?
In summary, our 350+ page report provides you with the following knowledge:
• Revenue forecasts to 2033 for Microreactors and Lab-scale Reactors Market, 2023 to 2033 Market, with forecasts for size, fuel type, application, type, each forecast at a global and regional level – discover the industry’s prospects, finding the most lucrative places for investments and revenues.
• Revenue forecasts to 2033 for four regional and 20 key national markets – See forecasts for the Microreactors and Lab-scale Reactors Market, 2023 to 2033 market in North America, Europe, Asia-Pacific, Latin America and Middle East & Africa. Also forecasted is the market in the US, Canada, Brazil, Germany, France, UK, Russia, Italy, China, India, Japan, and Australia among other prominent economies.
• Prospects for established firms and those seeking to enter the market – including company profiles for 15 of the major companies involved in the Microreactors and Lab-scale Reactors Market, 2023 to 2033.
Find quantitative and qualitative analyses with independent predictions. Receive information that only our report contains, staying informed with invaluable business intelligence.
Information found nowhere else
With our new report, you are less likely to fall behind in knowledge or miss out on opportunities. See how our work could benefit your research, analyses, and decisions. Visiongain’s study is for everybody needing commercial analyses for the Microreactors and Lab-scale Reactors Market, 2023 to 2033, market-leading companies. You will find data, trends and predictions.
ページTOPに戻る
Table of Contents
Table of Contents
1 Report Overview
1.1 Objectives of the Study
1.2 Introduction to Microreactors and Lab-Scale Reactors Market
1.3 What This Report Delivers
1.4 Why You Should Read This Report
1.5 Key Questions Answered by This Analytical Report
1.6 Who Is This Report for?
1.7 Methodology
1.7.1 Market Definitions
1.7.2 Market Evaluation & Forecasting Methodology
1.7.3 Data Validation
1.7.3.1 Primary Research
1.7.3.2 Secondary Research
1.8 Frequently Asked Questions (FAQs)
1.9 Associated Visiongain Reports
1.10 About Visiongain
2 Executive Summary
3 Market Overview
3.1 Key Findings
3.2 Market Dynamics
3.2.1 Market Driving Factors
3.2.1.1 Nuclear Power Has Emerged as a Pivotal and Sustainable Source of Energy
3.2.1.2 The Global Population Continues to Grow, and Economies Expand, The Demand for Electricity Is on The Rise
3.2.1.3 The Ability to Scale Microreactors and Lab-Scale Reactors According to Specific Energy Needs Makes Them Adaptable to Various Applications
3.2.2 Market Restraining Factors
3.2.2.1 Decommissioning and Managing the Associated Long-Term Liabilities Become Significant Challenges
3.2.2.2 High Capital Costs in Micro Reactors and Lab Scale Reactor Hinder the Market Growth
3.2.2.3 Deploying Microreactors in Remote or Off-Grid Locations may Require Building Suitable Infrastructure and Support Systems
3.2.3 Market Opportunities
3.2.3.1 Design, Materials, and Manufacturing Technologies have Made Microreactors and Lab-Scale Reactors More Efficient, Safer, and Economically Viable opportunities in Market
3.2.3.2 Increasing Interest from Private Companies and Investors in the Development of Small and Advanced Reactors
3.2.3.3 Countries That Develop and Commercialize Microreactors and Lab-Scale Reactors have Export Potential, Opening Opportunities for Economic Growth
3.3 Porter’s Five Forces Analysis
3.3.1 Bargaining Power of Suppliers (Medium)
3.3.2 Bargaining Power of Buyers (Low to Medium)
3.3.3 Competitive Rivalry (Low)
3.3.4 Threat from Substitutes (Low)
3.3.5 Threat of New Entrants (Low)
3.4 COVID-19 Impact Analysis
3.4.1 “V-Shaped Recovery”
3.4.2 “U-Shaped Recovery”
3.4.3 “W-Shaped Recovery”
3.4.4 “L-Shaped Recovery”
3.5 PEST Analysis
4 Microreactors and Lab-Scale Reactors Market Analysis by Size
4.1 Key Findings
4.2 Size Segment: Market Attractiveness Index
4.3 Microreactors and Lab-Scale Reactors Market Size Estimation and Forecast by Size
4.4 Micro Reactors
4.4.1 Market Size by Region, 2023-2033 (US$ Million)
4.4.2 Market Share by Region, 2023 & 2033 (%)
4.5 Lab-scale Reactors
4.5.1 Market Size by Region, 2023-2033 (US$ Million)
4.5.2 Market Share by Region, 2023 & 2033 (%)
5 Microreactors and Lab-Scale Reactors Market Analysis by Fuel Type
5.1 Key Findings
5.2 Fuel Type Segment: Market Attractiveness Index
5.3 Microreactors and Lab-Scale Reactors Market Size Estimation and Forecast by Fuel Type
5.4 TRi-structural ISOtropic [TRISO]
5.4.1 Market Size by Region, 2023-2033 (US$ Million)
5.4.2 Market Share by Region, 2023 & 2033 (%)
5.5 UO2 fuel
5.5.1 Market Size by Region, 2023-2033 (US$ Million)
5.5.2 Market Share by Region, 2023 & 2033 (%)
5.6 Uranium Zirconium (UZr)
5.6.1 Market Size by Region, 2023-2033 (US$ Million)
5.6.2 Market Share by Region, 2023 & 2033 (%)
5.7 Other Fuel Type
5.7.1 Market Size by Region, 2023-2033 (US$ Million)
5.7.2 Market Share by Region, 2023 & 2033 (%)
6 Microreactors and Lab-Scale Reactors Market Analysis by Application
6.1 Key Findings
6.2 Application Segment: Market Attractiveness Index
6.3 Microreactors and Lab-Scale Reactors Market Size Estimation and Forecast by Application
6.4 Isolated Operations
6.4.1 Market Size by Region, 2023-2033 (US$ Million)
6.4.2 Market Share by Region, 2023 & 2033 (%)
6.5 Distributed Energy
6.5.1 Market Size by Region, 2023-2033 (US$ Million)
6.5.2 Market Share by Region, 2023 & 2033 (%)
6.6 Resilient Urban Applications
6.6.1 Market Size by Region, 2023-2033 (US$ Million)
6.6.2 Market Share by Region, 2023 & 2033 (%)
6.7 Marine Propulsion
6.7.1 Market Size by Region, 2023-2033 (US$ Million)
6.7.2 Market Share by Region, 2023 & 2033 (%)
6.8 Disaster Relief
6.8.1 Market Size by Region, 2023-2033 (US$ Million)
6.8.2 Market Share by Region, 2023 & 2033 (%)
7 Microreactors and Lab-Scale Reactors Market Analysis by Type
7.1 Key Findings
7.2 Type Segment: Market Attractiveness Index
7.3 Microreactors and Lab-Scale Reactors Market Size Estimation and Forecast by Type
7.4 Light-Water Reactors (LWRs)
7.4.1 Market Size by Region, 2023-2033 (US$ Million)
7.4.2 Market Share by Region, 2023 & 2033 (%)
7.5 Molten Salt Reactors (MSRs)
7.5.1 Market Size by Region, 2023-2033 (US$ Million)
7.5.2 Market Share by Region, 2023 & 2033 (%)
7.6 Gas-Cooled Reactors (GCRs)
7.6.1 Market Size by Region, 2023-2033 (US$ Million)
7.6.2 Market Share by Region, 2023 & 2033 (%)
7.7 Metal-Cooled Fast Reactors (MFRs)
7.7.1 Market Size by Region, 2023-2033 (US$ Million)
7.7.2 Market Share by Region, 2023 & 2033 (%)
7.8 Heat Pipe Reactors
7.8.1 Market Size by Region, 2023-2033 (US$ Million)
7.8.2 Market Share by Region, 2023 & 2033 (%)
7.9 Other Type
7.9.1 Market Size by Region, 2023-2033 (US$ Million)
7.9.2 Market Share by Region, 2023 & 2033 (%)
8 Microreactors and Lab-Scale Reactors Market Analysis by Region
8.1 Key Findings
8.2 Regional Market Size Estimation and Forecast
9 North America Microreactors and Lab-Scale Reactors Market Analysis
9.1 Key Findings
9.2 North America Microreactors and Lab-Scale Reactors Market Attractiveness Index
9.3 North America Microreactors and Lab-Scale Reactors Market by Country, 2023, 2028 & 2033 (US$ Million)
9.4 North America Microreactors and Lab-Scale Reactors Market Size Estimation and Forecast
9.5 North America Microreactors and Lab-Scale Reactors Market Size Estimation and Forecast by Country
9.6 North America Microreactors and Lab-Scale Reactors Market Size Estimation and Forecast by Size
9.7 North America Microreactors and Lab-Scale Reactors Market Size Estimation and Forecast by Fuel Type
9.8 North America Microreactors and Lab-Scale Reactors Market Size Estimation and Forecast by Application
9.9 North America Microreactors and Lab-Scale Reactors Market Size Estimation and Forecast by Type
9.10 U.S. Microreactors and Lab-Scale Reactors Market Analysis
9.11 Canada Microreactors and Lab-Scale Reactors Market Analysis
10 Europe Microreactors and Lab-Scale Reactors Market Analysis
10.1 Key Findings
10.2 Europe Microreactors and Lab-Scale Reactors Market Attractiveness Index
10.3 Europe Microreactors and Lab-Scale Reactors Market by Country, 2023, 2028 & 2033 (US$ Million)
10.4 Europe Microreactors and Lab-Scale Reactors Market Size Estimation and Forecast
10.5 Europe Microreactors and Lab-Scale Reactors Market Size Estimation and Forecast by Country
10.6 Europe Microreactors and Lab-Scale Reactors Market Size Estimation and Forecast by Size
10.7 Europe Microreactors and Lab-Scale Reactors Market Size Estimation and Forecast by Fuel Type
10.8 Europe Microreactors and Lab-Scale Reactors Market Size Estimation and Forecast by Application
10.9 Europe Microreactors and Lab-Scale Reactors Market Size Estimation and Forecast by Type
10.10 Germany Microreactors and Lab-Scale Reactors Market Analysis
10.11 UK Microreactors and Lab-Scale Reactors Market Analysis
10.12 France Microreactors and Lab-Scale Reactors Market Analysis
10.13 Italy Microreactors and Lab-Scale Reactors Market Analysis
10.14 Russia Microreactors and Lab-Scale Reactors Market Analysis
10.15 Rest of Europe Microreactors and Lab-Scale Reactors Market Analysis
11 Asia-Pacific Microreactors and Lab-Scale Reactors Market Analysis
11.1 Key Findings
11.2 Asia-Pacific Microreactors and Lab-Scale Reactors Market Attractiveness Index
11.3 Asia-Pacific Microreactors and Lab-Scale Reactors Market by Country, 2023, 2028 & 2033 (US$ Million)
11.4 Asia-Pacific Microreactors and Lab-Scale Reactors Market Size Estimation and Forecast
11.5 Asia-Pacific Microreactors and Lab-Scale Reactors Market Size Estimation and Forecast by Country
11.6 Asia-Pacific Microreactors and Lab-Scale Reactors Market Size Estimation and Forecast by Size
11.7 Asia-Pacific Microreactors and Lab-Scale Reactors Market Size Estimation and Forecast by Fuel Type
11.8 Asia-Pacific Microreactors and Lab-Scale Reactors Market Size Estimation and Forecast by Application
11.9 Asia-Pacific Microreactors and Lab-Scale Reactors Market Size Estimation and Forecast by Type
11.10 China Microreactors and Lab-Scale Reactors Market Analysis
11.11 Indonesia Microreactors and Lab-Scale Reactors Market Analysis
11.12 Japan Microreactors and Lab-Scale Reactors Market Analysis
11.13 South Korea Microreactors and Lab-Scale Reactors Market Analysis
11.14 India Microreactors and Lab-Scale Reactors Market Analysis
11.15 Rest of Asia-Pacific Microreactors and Lab-Scale Reactors Market Analysis
12 Middle East and Africa Microreactors and Lab-Scale Reactors Market Analysis
12.1 Key Findings
12.2 Middle East and Africa Microreactors and Lab-Scale Reactors Market Attractiveness Index
12.3 Middle East and Africa Microreactors and Lab-Scale Reactors Market by Country, 2023, 2028 & 2033 (US$ Million)
12.4 Middle East and Africa Microreactors and Lab-Scale Reactors Market Size Estimation and Forecast
12.5 Middle East and Africa Microreactors and Lab-Scale Reactors Market Size Estimation and Forecast by Country
12.6 Middle East and Africa Microreactors and Lab-Scale Reactors Market Size Estimation and Forecast by Size
12.7 Middle East and Africa Microreactors and Lab-Scale Reactors Market Size Estimation and Forecast by Fuel Type
12.8 Middle East and Africa Microreactors and Lab-Scale Reactors Market Size Estimation and Forecast by Application
12.9 Middle East and Africa Microreactors and Lab-Scale Reactors Market Size Estimation and Forecast by Type
12.10 GCC Microreactors and Lab-Scale Reactors Market Analysis
12.11 South Africa Microreactors and Lab-Scale Reactors Market Analysis
12.12 Rest of Middle East & Africa Microreactors and Lab-Scale Reactors Market Analysis
13 Latin America Microreactors and Lab-Scale Reactors Market Analysis
13.1 Key Findings
13.2 Latin America Microreactors and Lab-Scale Reactors Market Attractiveness Index
13.3 Latin America Microreactors and Lab-Scale Reactors Market by Country, 2023, 2028 & 2033 (US$ Million)
13.4 Latin America Microreactors and Lab-Scale Reactors Market Size Estimation and Forecast
13.5 Latin America Microreactors and Lab-Scale Reactors Market Size Estimation and Forecast by Country
13.6 Latin America Microreactors and Lab-Scale Reactors Market Size Estimation and Forecast by Size
13.7 Latin America Microreactors and Lab-Scale Reactors Market Size Estimation and Forecast by Fuel Type
13.8 Latin America Microreactors and Lab-Scale Reactors Market Size Estimation and Forecast by Application
13.9 Latin America Microreactors and Lab-Scale Reactors Market Size Estimation and Forecast by Type
13.10 Brazil Microreactors and Lab-Scale Reactors Market Analysis
13.11 Argentina Microreactors and Lab-Scale Reactors Market Analysis
13.12 Rest of Latin America Microreactors and Lab-Scale Reactors Market Analysis
14 Company Profiles
14.1 Strategic Outlook
14.2 BWX Technologies, Inc.
14.2.1 Company Snapshot
14.2.2 Company Overview
14.2.3 Financial Analysis
14.2.3.1 Net Revenue, 2018-2022
14.2.3.2 R&D, 2018-2022
14.2.4 Product Benchmarking
14.2.5 Strategic Outlook
14.3 MicroNuclear LLC
14.3.1 Company Snapshot
14.3.2 Company Overview
14.3.3 Product Benchmarking
14.4 Nano Nuclear Energy Inc.
14.4.1 Company Snapshot
14.4.2 Company Overview
14.4.3 Product Benchmarking
14.4.4 Strategic Outlook
14.5 NuGen LLC
14.5.1 Company Snapshot
14.5.2 Company Overview
14.5.3 Product Benchmarking
14.6 Radiant
14.6.1 Company Snapshot
14.6.2 Company Overview
14.6.3 Product Benchmarking
14.6.4 Strategic Outlook
14.7 Urenco Limited
14.7.1 Company Snapshot
14.7.2 Company Overview
14.7.3 Product Benchmarking
14.7.4 Strategic Outlook
14.8 StarCore Nuclear
14.8.1 Company Snapshot
14.8.2 Company Overview
14.8.3 Product Benchmarking
14.8.4 Strategic Outlook
14.9 UltraSafe Nuclear
14.9.1 Company Snapshot
14.9.2 Company Overview
14.9.3 Product Benchmarking
14.9.4 Strategic Outlook
14.10 Holosgen LLC
14.10.1 Company Snapshot
14.10.2 Company Overview
14.10.3 Product Benchmarking
14.11 Gen4 Energy, Inc
14.11.1 Company Snapshot
14.11.2 Company Overview
14.11.3 Product Benchmarking
14.12 X Energy, LLC
14.12.1 Company Snapshot
14.12.2 Company Overview
14.12.3 Product Benchmarking
14.12.4 Strategic Outlook
14.13 LeadCold
14.13.1 Company Snapshot
14.13.2 Company Overview
14.13.3 Product Benchmarking
14.13.4 Strategic Outlook
14.14 Westinghouse Electric Company LLC
14.14.1 Company Snapshot
14.14.2 Company Overview
14.14.3 Product Benchmarking
14.14.4 Strategic Outlook
14.15 NuScale Power Corporation
14.15.1 Company Snapshot
14.15.2 Company Overview
14.15.3 Financial Analysis
14.15.3.1 Net Revenue, 2018-2022
14.15.3.2 R&D, 2018-2022
14.15.4 Product Benchmarking
14.15.5 Strategic Outlook
14.16 Oklo
14.16.1 Company Snapshot
14.16.2 Company Overview
14.16.3 Product Benchmarking
15 Conclusion and Recommendations
15.1 Concluding Remarks from Visiongain
15.2 Recommendations for Market Players
ページTOPに戻る
List of Tables/Graphs
List of Tables
Table 1 Microreactors and Lab-Scale Reactors Market Snapshot, 2023 & 2033 (US$ Million, CAGR %)
Table 2 Nuclear Statistics by U.S (End of 2021)
Table 3 Grid Connections in 2023
Table 4 Grid Connection’s Construction Started
Table 5 World Population 2015- 2020
Table 6 Global Microreactors and Lab-scale Reactors Market by Region, 2023-2033 (US$ Mn, AGR (%), CAGR (%)) (V-Shaped Recovery Scenario)
Table 7 Global Microreactors and Lab-scale Reactors Market by Region, 2023-2033 (US$ Mn, AGR (%), CAGR (%)) (U-Shaped Recovery Scenario)
Table 8 Global Microreactors and Lab-scale Reactors Market by Region, 2023-2033 (US$ Mn, AGR (%), CAGR (%)) (W-Shaped Recovery Scenario)
Table 9 Global Microreactors and Lab-scale Reactors Market by Region, 2023-2033 (US$ Mn, AGR (%), CAGR (%)) (L-Shaped Recovery Scenario)
Table 10 Global Microreactors and Lab-scale Reactors Market by Size, 2023-2033 (US$ Mn, AGR (%), CAGR (%))
Table 11 Micro Reactors Market by Region, 2023-2033 (US$ Mn, AGR (%), CAGR (%))
Table 12 Lab-scale Reactors Market by Region, 2023-2033 (US$ Mn, AGR (%), CAGR (%))
Table 13 Global Microreactors and Lab-scale Reactors Market by Fuel Type, 2023-2033 (US$ Mn, AGR (%), CAGR (%))
Table 14 TRi-structural ISOtropic [TRISO] Market by Region, 2023-2033 (US$ Mn, AGR (%), CAGR (%))
Table 15 UO2 fuel Market by Region, 2023-2033 (US$ Mn, AGR (%), CAGR (%))
Table 16 Uranium Zirconium (UZr) Market by Region, 2023-2033 (US$ Mn, AGR (%), CAGR (%))
Table 17 Other Fuel Type Market by Region, 2023-2033 (US$ Mn, AGR (%), CAGR (%))
Table 18 Global Microreactors and Lab-scale Reactors Market by Application, 2023-2033 (US$ Mn, AGR (%), CAGR (%))
Table 19 Isolated Operations Market by Region, 2023-2033 (US$ Mn, AGR (%), CAGR (%))
Table 20 Distributed Energy Market by Region, 2023-2033 (US$ Mn, AGR (%), CAGR (%))
Table 21 Resilient Urban Applications Market by Region, 2023-2033 (US$ Mn, AGR (%), CAGR (%))
Table 22 Marine Propulsion Market by Region, 2023-2033 (US$ Mn, AGR (%), CAGR (%))
Table 23 Disaster Relief Market by Region, 2023-2033 (US$ Mn, AGR (%), CAGR (%))
Table 24 Global Microreactors and Lab-scale Reactors Market by Type, 2023-2033 (US$ Mn, AGR (%), CAGR (%))
Table 25 Light-Water Reactors (LWRs) Market by Region, 2023-2033 (US$ Mn, AGR (%), CAGR (%))
Table 26 Molten Salt Reactors (MSRs) Market by Region, 2023-2033 (US$ Mn, AGR (%), CAGR (%))
Table 27 Gas-Cooled Reactors (GCRs) Market by Region, 2023-2033 (US$ Mn, AGR (%), CAGR (%))
Table 28 Metal-Cooled Fast Reactors (MFRs) Market by Region, 2023-2033 (US$ Mn, AGR (%), CAGR (%))
Table 29 Heat Pipe Reactors Market by Region, 2023-2033 (US$ Mn, AGR (%), CAGR (%))
Table 30 Other Type Market by Region, 2023-2033 (US$ Mn, AGR (%), CAGR (%))
Table 31 Global Microreactors and Lab-scale Reactors Market Forecast, 2023-2033 (US$ Mn, AGR (%), CAGR (%))
Table 32 Microreactors and Lab-Scale Reactors Market Forecast by Region, 2023-2033 (US$ Million, AGR%, CAGR%)
Table 33 North America Microreactors and Lab-scale Reactors Market by Value, 2023-2033 (US$ Mn, AGR (%), CAGR (%))
Table 34 North America Microreactors and Lab-scale Reactors Market by Country, 2023-2033 (US$ Mn, AGR (%), CAGR (%))
Table 35 North America Microreactors and Lab-scale Reactors Market by Size, 2023-2033 (US$ Mn, AGR (%), CAGR (%))
Table 36 North America Microreactors and Lab-scale Reactors Market by Fuel Type, 2023-2033 (US$ Mn, AGR (%), CAGR (%))
Table 37 North America Microreactors and Lab-scale Reactors Market by Application, 2023-2033 (US$ Mn, AGR (%), CAGR (%))
Table 38 North America Microreactors and Lab-scale Reactors Market by Type, 2023-2033 (US$ Mn, AGR (%), CAGR (%))
Table 39 US Microreactors and Lab-scale Reactors Market by Value, 2023-2033 (US$ Mn, AGR (%), CAGR (%))
Table 40 Canada Microreactors and Lab-scale Reactors Market by Value, 2023-2033 (US$ Mn, AGR (%), CAGR (%))
Table 41 Europe Microreactors and Lab-scale Reactors Market by Value, 2023-2033 (US$ Mn, AGR (%), CAGR (%))
Table 42 Europe Microreactors and Lab-scale Reactors Market by Country, 2023-2033 (US$ Mn, AGR (%), CAGR (%))
Table 43 Europe Microreactors and Lab-scale Reactors Market by Size, 2023-2033 (US$ Mn, AGR (%), CAGR (%))
Table 44 Europe Microreactors and Lab-scale Reactors Market by Fuel Type, 2023-2033 (US$ Mn, AGR (%), CAGR (%))
Table 45 Europe Microreactors and Lab-scale Reactors Market by Application, 2023-2033 (US$ Mn, AGR (%), CAGR (%))
Table 46 Europe Microreactors and Lab-scale Reactors Market by Type, 2023-2033 (US$ Mn, AGR (%), CAGR (%))
Table 47 Germany Microreactors and Lab-scale Reactors Market by Value, 2023-2033 (US$ Mn, AGR (%), CAGR (%))
Table 48 UK Microreactors and Lab-scale Reactors Market by Value, 2023-2033 (US$ Mn, AGR (%), CAGR (%))
Table 49 France Microreactors and Lab-scale Reactors Market by Value, 2023-2033 (US$ Mn, AGR (%), CAGR (%))
Table 50 Italy Microreactors and Lab-scale Reactors Market by Value, 2023-2033 (US$ Mn, AGR (%), CAGR (%))
Table 51 Russia Microreactors and Lab-scale Reactors Market by Value, 2023-2033 (US$ Mn, AGR (%), CAGR (%))
Table 52 Rest of Europe Microreactors and Lab-scale Reactors Market by Value, 2023-2033 (US$ Mn, AGR (%), CAGR (%))
Table 53 Asia-Pacific Microreactors and Lab-scale Reactors Market by Value, 2023-2033 (US$ Mn, AGR (%), CAGR (%))
Table 54 Asia-Pacific Microreactors and Lab-scale Reactors Market by Country, 2023-2033 (US$ Mn, AGR (%), CAGR (%))
Table 55 Asia-Pacific Microreactors and Lab-scale Reactors Market by Size, 2023-2033 (US$ Mn, AGR (%), CAGR (%))
Table 56 Asia-Pacific Microreactors and Lab-scale Reactors Market by Fuel Type, 2023-2033 (US$ Mn, AGR (%), CAGR (%))
Table 57 Asia-Pacific Microreactors and Lab-scale Reactors Market by Application, 2023-2033 (US$ Mn, AGR (%), CAGR (%))
Table 58 Asia-Pacific Microreactors and Lab-scale Reactors Market by Type, 2023-2033 (US$ Mn, AGR (%), CAGR (%))
Table 59 China Microreactors and Lab-scale Reactors Market by Value, 2023-2033 (US$ Mn, AGR (%), CAGR (%))
Table 60 Indonesia Microreactors and Lab-scale Reactors Market by Value, 2023-2033 (US$ Mn, AGR (%), CAGR (%))
Table 61 Japan Microreactors and Lab-scale Reactors Market by Value, 2023-2033 (US$ Mn, AGR (%), CAGR (%))
Table 62 South Korea Microreactors and Lab-scale Reactors Market by Value, 2023-2033 (US$ Mn, AGR (%), CAGR (%))
Table 63 India Microreactors and Lab-scale Reactors Market by Value, 2023-2033 (US$ Mn, AGR (%), CAGR (%))
Table 64 Rest of Asia-Pacific Microreactors and Lab-scale Reactors Market by Value, 2023-2033 (US$ Mn, AGR (%), CAGR (%))
Table 65 Middle East & Africa Microreactors and Lab-scale Reactors Market by Value, 2023-2033 (US$ Mn, AGR (%), CAGR (%))
Table 66 Middle East & Africa Microreactors and Lab-scale Reactors Market by Country, 2023-2033 (US$ Mn, AGR (%), CAGR (%))
Table 67 Middle East & Africa Microreactors and Lab-scale Reactors Market by Size, 2023-2033 (US$ Mn, AGR (%), CAGR (%))
Table 68 Middle East & Africa Microreactors and Lab-scale Reactors Market by Fuel Type, 2023-2033 (US$ Mn, AGR (%), CAGR (%))
Table 69 Middle East & Africa Microreactors and Lab-scale Reactors Market by Application, 2023-2033 (US$ Mn, AGR (%), CAGR (%))
Table 70 Middle East & Africa Microreactors and Lab-scale Reactors Market by Type, 2023-2033 (US$ Mn, AGR (%), CAGR (%))
Table 71 GCC Microreactors and Lab-scale Reactors Market by Value, 2023-2033 (US$ Mn, AGR (%), CAGR (%))
Table 72 South Africa Microreactors and Lab-scale Reactors Market by Value, 2023-2033 (US$ Mn, AGR (%), CAGR (%))
Table 73 Rest of Middle East & Africa Microreactors and Lab-scale Reactors Market by Value, 2023-2033 (US$ Mn, AGR (%), CAGR (%))
Table 74 Latin America Microreactors and Lab-scale Reactors Market by Value, 2023-2033 (US$ Mn, AGR (%), CAGR (%))
Table 75 Latin America Microreactors and Lab-scale Reactors Market by Country, 2023-2033 (US$ Mn, AGR (%), CAGR (%))
Table 76 Latin America Microreactors and Lab-scale Reactors Market by Size, 2023-2033 (US$ Mn, AGR (%), CAGR (%))
Table 77 Latin America Microreactors and Lab-scale Reactors Market by Fuel Type, 2023-2033 (US$ Mn, AGR (%), CAGR (%))
Table 78 Latin America Microreactors and Lab-scale Reactors Market by Application, 2023-2033 (US$ Mn, AGR (%), CAGR (%))
Table 79 Latin America Microreactors and Lab-scale Reactors Market by Type, 2023-2033 (US$ Mn, AGR (%), CAGR (%))
Table 80 Brazil Microreactors and Lab-scale Reactors Market by Value, 2023-2033 (US$ Mn, AGR (%), CAGR (%))
Table 81 Argentina Microreactors and Lab-scale Reactors Market by Value, 2023-2033 (US$ Mn, AGR (%), CAGR (%))
Table 82 Rest of Latin America Microreactors and Lab-scale Reactors Market by Value, 2023-2033 (US$ Mn, AGR (%), CAGR (%))
Table 83 Strategic Outlook Analysis
Table 84 BWX Technologies, Inc.: Key Details, (CEO, HQ, Revenue, Founded, No. of Employees, Company Type, Website, Business Segment)
Table 85 BWX Technologies, Inc: Product Benchmarking
Table 86 BWX Technologies, Inc: Strategic Outlook
Table 87 MicroNuclear LLC: Key Details, (CEO, HQ, Revenue, Founded, No. of Employees, Company Type, Website, Business Segment)
Table 88 MicroNuclear LLC: Product Benchmarking
Table 89 Nano Nuclear Energy Inc.: Key Details, (CEO, HQ, Revenue, Founded, No. of Employees, Company Type, Website, Business Segment)
Table 90 Nano Nuclear Energy Inc.: Product Benchmarking
Table 91 Nano Nuclear Energy Inc.: Strategic Outlook
Table 92 NuGen LLC: Key Details, (CEO, HQ, Revenue, Founded, No. of Employees, Company Type, Website, Business Segment)
Table 93 NuGen LLC: Product Benchmarking
Table 94 Radiant: Key Details, (CEO, HQ, Revenue, Founded, No. of Employees, Company Type, Website, Business Segment)
Table 95 Radiant: Product Benchmarking
Table 96 Radiant: Strategic Outlook
Table 97 Urenco Limited: Key Details, (CEO, HQ, Revenue, Founded, No. of Employees, Company Type, Website, Business Segment)
Table 98 Urenco Limited: Product Benchmarking
Table 99 Urenco Limited: Strategic Outlook
Table 100 StarCore Nuclear: Key Details, (CEO, HQ, Revenue, Founded, No. of Employees, Company Type, Website, Business Segment)
Table 101 StarCore Nuclear: Product Benchmarking
Table 102 StarCore Nuclear: Strategic Outlook
Table 103 UltraSafe Nuclear : Key Details, (CEO, HQ, Revenue, Founded, No. of Employees, Company Type, Website, Business Segment)
Table 104 UltraSafe Nuclear: Product Benchmarking
Table 105 UltraSafe Nuclear: Strategic Outlook
Table 106 Holosgen LLC: Key Details, (CEO, HQ, Revenue, Founded, No. of Employees, Company Type, Website, Business Segment)
Table 107 Holosgen LLC: Product Benchmarking
Table 108 Gen4 Energy, Inc : Key Details, (CEO, HQ, Revenue, Founded, No. of Employees, Company Type, Website, Business Segment)
Table 109 Gen4 Energy, Inc: Product Benchmarking
Table 110 X Energy, LLC: Key Details, (CEO, HQ, Revenue, Founded, No. of Employees, Company Type, Website, Business Segment)
Table 111 X Energy, LLC: Product Benchmarking
Table 112 X Energy, LLC: Strategic Outlook
Table 113 LeadCold : Key Details, (CEO, HQ, Revenue, Founded, No. of Employees, Company Type, Website, Business Segment)
Table 114 LeadCold: Product Benchmarking
Table 115 LeadCold: Strategic Outlook
Table 116 Westinghouse Electric Company LLC: Key Details, (CEO, HQ, Revenue, Founded, No. of Employees, Company Type, Website, Business Segment)
Table 117 Westinghouse Electric Company LLC: Product Benchmarking
Table 118 Westinghouse Electric Company LLC: Strategic Outlook
Table 119 NuScale Power Corporation: Key Details, (CEO, HQ, Revenue, Founded, No. of Employees, Company Type, Website, Business Segment)
Table 120 NuScale Power Corporation: Product Benchmarking
Table 121 NuScale Power Corporation: Strategic Outlook
Table 122 Oklo: Key Details, (CEO, HQ, Revenue, Founded, No. of Employees, Company Type, Website, Business Segment)
Table 123 Oklo: Product Benchmarking
List of Figures
Figure 1 Microreactors and Lab-Scale Reactors Market Segmentation
Figure 2 Microreactors and Lab-Scale Reactors Market by Size: Market Attractiveness Index
Figure 3 Microreactors and Lab-Scale Reactors Market by Fuel Type: Market Attractiveness Index
Figure 4 Microreactors and Lab-Scale Reactors Market by Application: Market Attractiveness Index
Figure 5 Microreactors and Lab-Scale Reactors Market by Type: Market Attractiveness Index
Figure 6 Microreactors and Lab-Scale Reactors Market Attractiveness Index by Region
Figure 7 Microreactors and Lab-Scale Reactors Market: Market Dynamics
Figure 8 Global changes in electricity demand, 2017-2022
Figure 9 Capital Cost Comparison,2020
Figure 10 Microreactors and Lab-Scale Reactors Market: Porter’s Five Forces Analysis
Figure 11 Global Microreactors and Lab-Scale Reactors Market Share Forecast by COVID, 2023-2033 (%)
Figure 12 Global Microreactors and Lab-scale Reactors Market by Region, 2023-2033 (US$ Mn, AGR (%)) (V-Shaped Recovery Scenario)
Figure 13 Global Microreactors and Lab-scale Reactors Market by Region, 2023-2033 (US$ Mn, AGR (%)) (U-Shaped Recovery Scenario)
Figure 14 Global Microreactors and Lab-scale Reactors Market by Region, 2023-2033 (US$ Mn, AGR (%)) (W-Shaped Recovery Scenario)
Figure 15 Global Microreactors and Lab-scale Reactors Market by Region, 2023-2033 (US$ Mn, AGR (%)) (L-Shaped Recovery Scenario)
Figure 16 Microreactors and Lab-Scale Reactors Market: PEST Analysis
Figure 17 Microreactors and Lab-Scale Reactors Market by Size: Market Attractiveness Index
Figure 18 Global Microreactors and Lab-scale Reactors Market by Size, 2023-2033 (US$ Mn, AGR (%))
Figure 19 Microreactors and Lab-Scale Reactors Market Share Forecast by Size, 2023, 2028, 2033 (%)
Figure 20 Micro Reactors Market by Region, 2023-2033 (US$ Mn, AGR (%))
Figure 21 Micro Reactors Market Share Forecast by Region, 2023 & 2033 (%)
Figure 22 Lab-scale Reactors Market by Region, 2023-2033 (US$ Mn, AGR (%))
Figure 23 Lab-scale Reactors Market Share Forecast by Region, 2023 & 2033 (%)
Figure 24 Microreactors and Lab-Scale Reactors Market by Fuel Type: Market Attractiveness Index
Figure 25 Global Microreactors and Lab-scale Reactors Market by Fuel Type, 2023-2033 (US$ Mn, AGR (%))
Figure 26 Microreactors and Lab-Scale Reactors Market Share Forecast by Fuel Type, 2023, 2028, 2033 (%)
Figure 27 TRi-structural ISOtropic [TRISO] Market by Region, 2023-2033 (US$ Mn, AGR (%))
Figure 28 TRi-structural ISOtropic [TRISO] Market Share Forecast by Region, 2023 & 2033 (%)
Figure 29 UO2 fuel Market by Region, 2023-2033 (US$ Mn, AGR (%))
Figure 30 UO2 fuel Market Share Forecast by Region, 2023 & 2033 (%)
Figure 31 Uranium Zirconium (UZr) Market by Region, 2023-2033 (US$ Mn, AGR (%))
Figure 32 Uranium Zirconium (UZr) Market Share Forecast by Region, 2023 & 2033 (%)
Figure 33 Other Fuel Type Market by Region, 2023-2033 (US$ Mn, AGR (%))
Figure 34 Other Fuel Type Market Share Forecast by Region, 2023 & 2033 (%)
Figure 35 Microreactors and Lab-Scale Reactors Market by Application: Market Attractiveness Index
Figure 36 Global Microreactors and Lab-scale Reactors Market by Application, 2023-2033 (US$ Mn, AGR (%))
Figure 37 Microreactors and Lab-Scale Reactors Market Share Forecast by Application, 2023, 2028, 2033 (%)
Figure 38 Isolated Operations Market by Region, 2023-2033 (US$ Mn, AGR (%))
Figure 39 Isolated Operations Market Share Forecast by Region, 2023 & 2033 (%)
Figure 40 Distributed Energy Market by Region, 2023-2033 (US$ Mn, AGR (%))
Figure 41 Distributed Energy Market Share Forecast by Region, 2023 & 2033 (%)
Figure 42 Resilient Urban Applications Market by Region, 2023-2033 (US$ Mn, AGR (%))
Figure 43 Resilient Urban Applications Market Share Forecast by Region, 2023 & 2033 (%)
Figure 44 Marine Propulsion Market by Region, 2023-2033 (US$ Mn, AGR (%))
Figure 45 Marine Propulsion Market Share Forecast by Region, 2023 & 2033 (%)
Figure 46 Disaster Relief Market by Region, 2023-2033 (US$ Mn, AGR (%))
Figure 47 Disaster Relief Market Share Forecast by Region, 2023 & 2033 (%)
Figure 48 Microreactors and Lab-Scale Reactors Market by Type: Market Attractiveness Index
Figure 49 Global Microreactors and Lab-scale Reactors Market by Type, 2023-2033 (US$ Mn, AGR (%))
Figure 50 Microreactors and Lab-Scale Reactors Market Share Forecast by Type, 2023, 2028, 2033 (%)
Figure 51 Light-Water Reactors (LWRs) Market by Region, 2023-2033 (US$ Mn, AGR (%))
Figure 52 Light-Water Reactors (LWRs) Market Share Forecast by Region, 2023 & 2033 (%)
Figure 53 Molten Salt Reactors (MSRs) Market by Region, 2023-2033 (US$ Mn, AGR (%))
Figure 54 Molten Salt Reactors (MSRs) Market Share Forecast by Region, 2023 & 2033 (%)
Figure 55 Gas-Cooled Reactors (GCRs) Market by Region, 2023-2033 (US$ Mn, AGR (%))
Figure 56 Gas-Cooled Reactors (GCRs) Market Share Forecast by Region, 2023 & 2033 (%)
Figure 57 Metal-Cooled Fast Reactors (MFRs) Market by Region, 2023-2033 (US$ Mn, AGR (%))
Figure 58 Metal-Cooled Fast Reactors (MFRs) Market Share Forecast by Region, 2023 & 2033 (%)
Figure 59 Heat Pipe Reactors Market by Region, 2023-2033 (US$ Mn, AGR (%))
Figure 60 Heat Pipe Reactors Market Share Forecast by Region, 2023 & 2033 (%)
Figure 61 Other Type Market by Region, 2023-2033 (US$ Mn, AGR (%))
Figure 62 Other Type Market Share Forecast by Region, 2023 & 2033 (%)
Figure 63 Microreactors and Lab-Scale Reactors Market Forecast by Region 2023 and 2033 (Revenue, CAGR%)
Figure 64 Global Microreactors and Lab-scale Reactors Market Forecast, 2023-2033 (US$ Mn, AGR (%))
Figure 65 Microreactors and Lab-Scale Reactors Market Share Forecast by Region 2023, 2028, 2033 (%)
Figure 66 Microreactors and Lab-Scale Reactors Market by Region, 2023-2033 (US$ Million, AGR %)
Figure 67 North America Microreactors and Lab-Scale Reactors Market Attractiveness Index
Figure 68 North America Microreactors and Lab-Scale Reactors Market by Region, 2023, 2028 & 2033 (US$ Million)
Figure 69 North America Microreactors and Lab-scale Reactors Market by Value, 2023-2033 (US$ Mn, AGR (%))
Figure 70 North America Microreactors and Lab-scale Reactors Market by Country, 2023-2033 (US$ Mn, AGR (%))
Figure 71 North America Microreactors and Lab-Scale Reactors Market Share Forecast by Country, 2023 & 2033 (%)
Figure 72 North America Microreactors and Lab-scale Reactors Market by Size, 2023-2033 (US$ Mn, AGR (%))
Figure 73 North America Microreactors and Lab-Scale Reactors Market Share Forecast Size, 2023 & 2033 (%)
Figure 74 North America Microreactors and Lab-scale Reactors Market by Fuel Type, 2023-2033 (US$ Mn, AGR (%))
Figure 75 North America Microreactors and Lab-Scale Reactors Market Share Forecast by Fuel Type, 2023 & 2033 (%)
Figure 76 North America Microreactors and Lab-scale Reactors Market by Application, 2023-2033 (US$ Mn, AGR (%))
Figure 77 North America Microreactors and Lab-Scale Reactors Market Share Forecast by Application, 2023 & 2033 (%)
Figure 78 North America Microreactors and Lab-scale Reactors Market by Type, 2023-2033 (US$ Mn, AGR (%))
Figure 79 North America Microreactors and Lab-Scale Reactors Market Share Forecast by Type, 2023 & 2033 (%)
Figure 80 US Microreactors and Lab-scale Reactors Market by Value, 2023-2033 (US$ Mn, AGR (%))
Figure 81 Canada Microreactors and Lab-scale Reactors Market by Value, 2023-2033 (US$ Mn, AGR (%))
Figure 82 Europe Microreactors and Lab-Scale Reactors Market Attractiveness Index
Figure 83 Europe Microreactors and Lab-Scale Reactors Market by Region, 2023, 2028 & 2033 (US$ Million)
Figure 84 Europe Microreactors and Lab-scale Reactors Market by Value, 2023-2033 (US$ Mn, AGR (%))
Figure 85 Europe Microreactors and Lab-scale Reactors Market by Country, 2023-2033 (US$ Mn, AGR (%))
Figure 86 Europe Microreactors and Lab-Scale Reactors Market Share Forecast by Country, 2023 & 2033 (%)
Figure 87 Europe Microreactors and Lab-scale Reactors Market by Size, 2023-2033 (US$ Mn, AGR (%))
Figure 88 Europe Microreactors and Lab-Scale Reactors Market Share Forecast Size, 2023 & 2033 (%)
Figure 89 Europe Microreactors and Lab-scale Reactors Market by Fuel Type, 2023-2033 (US$ Mn, AGR (%))
Figure 90 Europe Microreactors and Lab-Scale Reactors Market Share Forecast by Fuel Type, 2023 & 2033 (%)
Figure 91 Europe Microreactors and Lab-scale Reactors Market by Application, 2023-2033 (US$ Mn, AGR (%))
Figure 92 Europe Microreactors and Lab-Scale Reactors Market Share Forecast by Application, 2023 & 2033 (%)
Figure 93 Europe Microreactors and Lab-scale Reactors Market by Type, 2023-2033 (US$ Mn, AGR (%))
Figure 94 Europe Microreactors and Lab-Scale Reactors Market Share Forecast by Type, 2023 & 2033 (%)
Figure 95 Germany Microreactors and Lab-scale Reactors Market by Value, 2023-2033 (US$ Mn, AGR (%))
Figure 96 UK Microreactors and Lab-scale Reactors Market by Value, 2023-2033 (US$ Mn, AGR (%))
Figure 97 France Microreactors and Lab-scale Reactors Market by Value, 2023-2033 (US$ Mn, AGR (%))
Figure 98 Italy Microreactors and Lab-scale Reactors Market by Value, 2023-2033 (US$ Mn, AGR (%))
Figure 99 Russia Microreactors and Lab-scale Reactors Market by Value, 2023-2033 (US$ Mn, AGR (%))
Figure 100 Rest of Europe Microreactors and Lab-scale Reactors Market by Value, 2023-2033 (US$ Mn, AGR (%))
Figure 101 Asia-Pacific Microreactors and Lab-Scale Reactors Market Attractiveness Index
Figure 102 Asia-Pacific Microreactors and Lab-Scale Reactors Market by Region, 2023, 2028 & 2033 (US$ Million)
Figure 103 Asia-Pacific Microreactors and Lab-scale Reactors Market by Value, 2023-2033 (US$ Mn, AGR (%))
Figure 104 Asia-Pacific Microreactors and Lab-scale Reactors Market by Country, 2023-2033 (US$ Mn, AGR (%))
Figure 105 Asia-Pacific Microreactors and Lab-Scale Reactors Market Share Forecast by Country, 2023 & 2033 (%)
Figure 106 Asia-Pacific Microreactors and Lab-scale Reactors Market by Size, 2023-2033 (US$ Mn, AGR (%))
Figure 107 Asia-Pacific Microreactors and Lab-Scale Reactors Market Share Forecast Size, 2023 & 2033 (%)
Figure 108 Asia-Pacific Microreactors and Lab-scale Reactors Market by Fuel Type, 2023-2033 (US$ Mn, AGR (%))
Figure 109 Asia-Pacific Microreactors and Lab-Scale Reactors Market Share Forecast by Fuel Type, 2023 & 2033 (%)
Figure 110 Asia-Pacific Microreactors and Lab-scale Reactors Market by Application, 2023-2033 (US$ Mn, AGR (%))
Figure 111 Asia-Pacific Microreactors and Lab-Scale Reactors Market Share Forecast by Application, 2023 & 2033 (%)
Figure 112 Asia-Pacific Microreactors and Lab-scale Reactors Market by Type, 2023-2033 (US$ Mn, AGR (%))
Figure 113 Asia-Pacific Microreactors and Lab-Scale Reactors Market Share Forecast by Type, 2023 & 2033 (%)
Figure 114 China Microreactors and Lab-scale Reactors Market by Value, 2023-2033 (US$ Mn, AGR (%))
Figure 115 Indonesia Microreactors and Lab-scale Reactors Market by Value, 2023-2033 (US$ Mn, AGR (%))
Figure 116 Japan Microreactors and Lab-scale Reactors Market by Value, 2023-2033 (US$ Mn, AGR (%))
Figure 117 South Korea Microreactors and Lab-scale Reactors Market by Value, 2023-2033 (US$ Mn, AGR (%))
Figure 118 India Microreactors and Lab-scale Reactors Market by Value, 2023-2033 (US$ Mn, AGR (%))
Figure 119 Rest of Asia-Pacific Microreactors and Lab-scale Reactors Market by Value, 2023-2033 (US$ Mn, AGR (%))
Figure 120 Middle East and Africa Microreactors and Lab-Scale Reactors Market Attractiveness Index
Figure 121 Middle East and Africa Microreactors and Lab-Scale Reactors Market by Region, 2023, 2028 & 2033 (US$ Million)
Figure 122 Middle East & Africa Microreactors and Lab-scale Reactors Market by Value, 2023-2033 (US$ Mn, AGR (%))
Figure 123 Middle East & Africa Microreactors and Lab-scale Reactors Market by Country, 2023-2033 (US$ Mn, AGR (%))
Figure 124 Middle East and Africa Microreactors and Lab-Scale Reactors Market Share Forecast by Country, 2023 & 2033 (%)
Figure 125 Middle East & Africa Microreactors and Lab-scale Reactors Market by Size, 2023-2033 (US$ Mn, AGR (%))
Figure 126 Middle East and Africa Microreactors and Lab-Scale Reactors Market Share Forecast Size, 2023 & 2033 (%)
Figure 127 Middle East & Africa Microreactors and Lab-scale Reactors Market by Fuel Type, 2023-2033 (US$ Mn, AGR (%))
Figure 128 Middle East and Africa Microreactors and Lab-Scale Reactors Market Share Forecast by Fuel Type, 2023 & 2033 (%)
Figure 129 Middle East & Africa Microreactors and Lab-scale Reactors Market by Application, 2023-2033 (US$ Mn, AGR (%))
Figure 130 Middle East and Africa Microreactors and Lab-Scale Reactors Market Share Forecast by Application, 2023 & 2033 (%)
Figure 131 Middle East & Africa Microreactors and Lab-scale Reactors Market by Type, 2023-2033 (US$ Mn, AGR (%))
Figure 132 Middle East and Africa Microreactors and Lab-Scale Reactors Market Share Forecast by Type, 2023 & 2033 (%)
Figure 133 GCC Microreactors and Lab-scale Reactors Market by Value, 2023-2033 (US$ Mn, AGR (%))
Figure 134 South Africa Microreactors and Lab-scale Reactors Market by Value, 2023-2033 (US$ Mn, AGR (%))
Figure 135 Rest of Middle East & Africa Microreactors and Lab-scale Reactors Market by Value, 2023-2033 (US$ Mn, AGR (%))
Figure 136 Latin America Microreactors and Lab-Scale Reactors Market Attractiveness Index
Figure 137 Latin America Microreactors and Lab-Scale Reactors Market by Region, 2023, 2028 & 2033 (US$ Million)
Figure 138 Latin America Microreactors and Lab-scale Reactors Market by Value, 2023-2033 (US$ Mn, AGR (%))
Figure 139 Latin America Microreactors and Lab-scale Reactors Market by Country, 2023-2033 (US$ Mn, AGR (%))
Figure 140 Latin America Microreactors and Lab-Scale Reactors Market Share Forecast by Country, 2023 & 2033 (%)
Figure 141 Latin America Microreactors and Lab-scale Reactors Market by Size, 2023-2033 (US$ Mn, AGR (%))
Figure 142 Latin America Microreactors and Lab-Scale Reactors Market Share Forecast Size, 2023 & 2033 (%)
Figure 143 Latin America Microreactors and Lab-scale Reactors Market by Fuel Type, 2023-2033 (US$ Mn, AGR (%))
Figure 144 Latin America Microreactors and Lab-Scale Reactors Market Share Forecast by Fuel Type, 2023 & 2033 (%)
Figure 145 Latin America Microreactors and Lab-scale Reactors Market by Application, 2023-2033 (US$ Mn, AGR (%))
Figure 146 Latin America Microreactors and Lab-Scale Reactors Market Share Forecast by Application, 2023 & 2033 (%)
Figure 147 Latin America Microreactors and Lab-scale Reactors Market by Type, 2023-2033 (US$ Mn, AGR (%))
Figure 148 Latin America Microreactors and Lab-Scale Reactors Market Share Forecast by Type, 2023 & 2033 (%)
Figure 149 Brazil Microreactors and Lab-scale Reactors Market by Value, 2023-2033 (US$ Mn, AGR (%))
Figure 150 Argentina Microreactors and Lab-scale Reactors Market by Value, 2023-2033 (US$ Mn, AGR (%))
Figure 151 Rest of Latin America Microreactors and Lab-scale Reactors Market by Value, 2023-2033 (US$ Mn, AGR (%))
Figure 152 BWX Technologies, Inc.: Net Revenue, 2018-2022 (US$ Million, AGR%)
Figure 153 BWX Technologies, Inc.: R&D, 2018-2022 (US$ Million, AGR%)
Figure 154 NuScale Power Corporation.: Net Revenue, 2018-2022 (US$ Million, AGR%)
Figure 155 NuScale Power Corporation.: R&D, 2018-2022 (US$ Million, AGR%)
ページTOPに戻る
本レポートと同じKEY WORD()の最新刊レポート
- 本レポートと同じKEY WORDの最新刊レポートはありません。
よくあるご質問
Visiongain社はどのような調査会社ですか?
英国の調査会社ヴィジョンゲイン社(Visiongain)は、通信とエネルギーのほか、自動車や化学・医薬品、金属など、広範な市場を対象に調査を行っています。自動車市場については、市場全般に関する調査のほ... もっと見る
調査レポートの納品までの日数はどの程度ですか?
在庫のあるものは速納となりますが、平均的には 3-4日と見て下さい。
但し、一部の調査レポートでは、発注を受けた段階で内容更新をして納品をする場合もあります。
発注をする前のお問合せをお願いします。
注文の手続きはどのようになっていますか?
1)お客様からの御問い合わせをいただきます。
2)見積書やサンプルの提示をいたします。
3)お客様指定、もしくは弊社の発注書をメール添付にて発送してください。
4)データリソース社からレポート発行元の調査会社へ納品手配します。
5) 調査会社からお客様へ納品されます。最近は、pdfにてのメール納品が大半です。
お支払方法の方法はどのようになっていますか?
納品と同時にデータリソース社よりお客様へ請求書(必要に応じて納品書も)を発送いたします。
お客様よりデータリソース社へ(通常は円払い)の御振り込みをお願いします。
請求書は、納品日の日付で発行しますので、翌月最終営業日までの当社指定口座への振込みをお願いします。振込み手数料は御社負担にてお願いします。
お客様の御支払い条件が60日以上の場合は御相談ください。
尚、初めてのお取引先や個人の場合、前払いをお願いすることもあります。ご了承のほど、お願いします。
データリソース社はどのような会社ですか?
当社は、世界各国の主要調査会社・レポート出版社と提携し、世界各国の市場調査レポートや技術動向レポートなどを日本国内の企業・公官庁及び教育研究機関に提供しております。
世界各国の「市場・技術・法規制などの」実情を調査・収集される時には、データリソース社にご相談ください。
お客様の御要望にあったデータや情報を抽出する為のレポート紹介や調査のアドバイスも致します。
|
|


