小型モジュール炉市場レポート:2023-2033
Small Modular Reactor Market Report 2023-2033
レポート詳細
小型モジュール炉市場レポート 2023-2033年 :本レポートは、業界とその基礎となるダイナミクスをより良く理解したい場合、新たな収益ポケットを目指している大手企業にとって貴重なも... もっと見る
※上記価格は部署ライセンス(Departmental licence)価格です。
その他の価格についてはデータリソースまでお問合せください。
日本語のページは自動翻訳を利用し作成しています。
実際のレポートは英文のみでご納品いたします。

|

|
サマリー
レポート詳細
小型モジュール炉市場レポート 2023-2033年:本レポートは、業界とその基礎となるダイナミクスをより良く理解したい場合、新たな収益ポケットを目指している大手企業にとって貴重なものとなるでしょう。異業種への進出や新規地域での既存事業の拡大を目指す企業にも有用です。
カーボンフリーエネルギーへの需要の拡大
気候変動に対する世界的な関心の高まりと温室効果ガス排出量削減の必要性により、クリーンで持続可能なエネルギー源に対する需要が高まっている。小型モジュール炉(SMR)は、実質的に炭素排出ゼロで電力を生産するため、有望なソリューションとなる。各国が野心的な気候変動目標に取り組む中、電力部門の脱炭素化において、SMRを含む原子力の役割はますます重要になっている。炭素を排出しないエネルギーに対する需要の高まりにより、SMRは環境への影響を緩和しながら電力需要を満たす実行可能な選択肢として位置づけられている。
柔軟性とグリッドの回復力
SMRの主な利点のひとつは、発電とグリッド統合における柔軟性である。従来の大型原子力発電所では、変動するエネルギー需要に基づいて出力を調整する柔軟性が限られていた。一方、SMRは出力をより迅速に上下させることができるため、変化する送電網の要件に適応することができる。この柔軟性により、SMRは太陽光や風力のような断続的な再生可能エネルギーを補完するのに適しており、特に需要のピーク時に送電網の安定性と回復力を提供する。
市場調査レポートを購入する前にすべき質問とは?
- 小型モジュール炉市場はどのように進化しているのか?
- 小型モジュール炉市場の推進要因と抑制要因は何か?
- 小型モジュール炉の各サブマーケットセグメントは予測期間中にどのように成長し、2033年にどれくらいの収益を占めるようになるのか?
- 2023年から2033年にかけて、各小型モジュール炉サブマーケットの市場シェアはどのように推移するのか?
- 2023年から2033年にかけて市場全体を牽引する主な要因は何か?
- 主要な小型モジュール炉市場はマクロ経済の動きに大枠で追随するのか、それとも個々の国別市場が他を凌駕するのか。
- 2033年までに各国市場のシェアはどう変化し、2033年に市場をリードするのはどの地域か?
- 主要プレーヤーは誰で、予測期間中の見通しは?
- これらの主要企業の小型モジュール炉プロジェクトは?
- 2023年から2033年の間に、産業はどのように発展していくのか?現在および今後10年間に行われる小型モジュール炉プロジェクトにはどのような意味があるのか?
- 小型モジュール炉市場をさらに拡大するために、製品の商業化の必要性は高まっているか?
- 小型モジュール炉市場はどこに向かっているのか、そして市場の最前線に立つにはどうすればいいのか?
- 新製品やサービスラインに対する最適な投資オプションは何か?
- 企業を新たな成長軌道に乗せ、C-suiteに移行させるための重要な展望とは?
このことが、現在、そして今後10年間の小型モジュール炉市場にどのような影響を与えるかを見極める必要がある:
- 386ページにわたる本レポートでは、127の表と170の図表を掲載しています。
- 本レポートは、業界における主要な有利分野にハイライトを当てているため、今すぐターゲットを絞ることができます。
- 本レポートには、世界、地域、国の売上と成長に関する詳細な分析が含まれています。
- 競合他社が成功した主なトレンド、変化、収益予測をハイライトしています。
本レポートは、小型モジュール炉市場が今後10年間にどのように発展するか、またCOVID-19の景気後退と好転の変動に合わせて、TODAYに伝えます。この市場は、過去10年間のどの時点よりも今が重要です。
2033年までの予測やその他の分析から、商業的な展望が明らかになる
- 2033年までの収益予測に加え、直近の業績、成長率、市場シェアもご覧いただけます。
- ビジネスの展望と展開に関する独自の分析をご覧いただけます。
- 定性的分析(市場ダイナミクス、促進要因、機会、阻害要因、課題など)、コスト構造、小型モジュール炉価格上昇の影響、最近の動向などをご覧いただけます。
本レポートには、COVID-19が業界と貴社にどのような影響を与えるかについてのデータ分析と貴重な洞察が含まれている。本レポートでは、COVID-19の4つの回収パターンとその影響、すなわち「V」、「L」、「W」、「U」について論じている。
レポート対象セグメント
配置別市場セグメント
- 陸上プラント
- 海上プラント
設計別市場セグメント
- 一体型原子炉設計
- 二重炉設計
- その他の原子炉設計
冷却材タイプ別市場セグメント
- 溶融塩炉(MSR)
- ガス冷却炉(GCR)
- 液体金属炉(LMR)
- その他の冷却材タイプ
タイプ別市場セグメント
- 加圧水型原子炉(PWR)
- 加圧水型重水炉(PHWR)
- 高温ガス炉(HTR)
- 高速中性子炉(FNR)
- その他のタイプ
用途別市場セグメント
- 発電
- 脱塩
- プロセス熱供給
- 産業用途
- 地域暖房
- その他の用途
世界市場全体とセグメント別の収益予測に加え、4つの地域と20の主要国市場の収益予測も掲載しています:
北米
- アメリカ
- カナダ
欧州
- ロシア
- 英国
- フランス
- ルクセンブルク
- スウェーデン
- その他の欧州
アジア太平洋
- 中国
- 日本
- インド
- インドネシア
- 韓国
- その他のアジア太平洋地域
ラテンアメリカ
- ブラジル
- メキシコ
- その他のラテンアメリカ
中東・アフリカ
- GCC
- 南アフリカ
- その他の中東・アフリカ
このレポートには、2023年から2033年までの小型モジュラーリアクター市場のいくつかの主要企業のプロフィールも含まれており、これらの企業の事業のこのセグメントに焦点を当てています。
報告書に掲載されている主要企業
・ ARC Clean Energy
・ China National Nuclear Corporation (CNNC)
・ Framatome
・ GE Hitachi Nuclear Energy (GEH)
・ General Atomics (GA)
・ LeadCold Reactors
・ Moltex Energy
・ NuScale Power Corporation
・ Rolls-Royce Limited
・ SNC-Lavalin Group Inc.
・ Terrestrial Energy Inc.
・ Tokamak Energy Ltd
・ Ultra-Safe Nuclear (USNC)
・ Westinghouse Electric Company LLC
・ X Energy, LLC
2023年から2033年までの小型モジュール炉市場の世界全体売上高(金額ベース)は、2023年に866億米ドルを突破する。2033年まで力強い収益成長を予測。当社の調査では、最も大きな可能性を秘めた組織を特定しています。彼らの能力、進歩、商業的展望を発見し、一歩先を行くお手伝いをします。
小型モジュール炉市場、2023年から2033年までのレポートはどのようにお役に立ちますか?
要約すると、380ページを超えるこのレポートは、以下の知識を提供する:
- 小型モジュール原子炉市場、2023年から2033年までの収益予測 世界および地域レベルで、設計、タイプ、冷却材タイプ、用途、展開の各予測を掲載 - 業界の展望を発見し、投資と収益に最も有利な場所を見つけます。
- 4つの地域と20の主要国市場の2033年までの収益予測 - 北米、欧州、アジア太平洋、ラテンアメリカ、中東・アフリカの小型モジュール炉市場2023年から2033年までの市場予測をご覧ください。また、米国、カナダ、ブラジル、ドイツ、フランス、英国、スウェーデン、ルクセンブルク、中国、インド、日本、オーストラリアなどの主要経済圏の市場も予測しています。
- 既存企業および市場参入を目指す企業の展望 - 2023年から2033年までの小型モジュール炉市場に関わる主要企業15社の企業プロファイルを含む。
独自の予測による定量的・定性的分析をご覧ください。私たちのレポートだけに含まれる情報を入手し、貴重なビジネスインテリジェンスで情報を得ることができます。
他にはない情報
私たちの新しいレポートがあれば、知識に遅れをとったり、チャンスを逃したりする可能性が低くなります。弊社のレポートが貴社の調査、分析、意思決定にどのように役立つかをご覧ください。Visiongainの調査は、小型モジュール原子炉市場、2023年から2033年、市場をリードする企業の商業分析を必要とするすべての人のためのものです。データ、トレンド、予測をご覧いただけます。
ページTOPに戻る
目次
目次
1 レポート概要
1.1 研究の目的
1.2 小型モジュール炉市場の紹介
1.3 本レポートの内容
1.4 本レポートを読むべき理由
1.5 本分析レポートが回答する主な質問
1.6 本レポートは誰のためのものか?
1.7 調査方法
1.7.1 市場の定義
1.7.2 市場評価・予測手法
1.7.3 データ検証
1.7.3.1 一次調査
1.7.3.2 セカンダリーリサーチ
1.8 よくある質問(FAQ)
1.9 Visiongainの関連レポート
1.10 Visiongainについて
2 エグゼクティブ・サマリー
3 市場の概要
3.1 主要な調査結果
3.2 市場ダイナミクス
3.2.1 市場牽引要因
3.2.1.1 SMR は分散型発電のアプローチを提供する
3.2.1.2 SMR は化石燃料に伴う温室効果ガス排出を伴わない、クリーンで持続可能な発電の選択肢を提供する
3.2.1.3 SMR は、その規模の小ささにより、原子力発電所の代替及び拡張のための有効 な解決策を提供する
3.2.1.4 新材料、高度な制御システム、受動的安全メカニズムが SMR の安全性と効率を高めている
3.2.2 市場抑制要因
3.2.2.1 プロジェクト期間の長期化とコストの増大が潜在的投資家の意欲をそぎ、SMR の普及を妨げる
3.2.2.2 世界初の SMR の開発は、研究、ライセンス供与、規制遵守の課題によ るコスト超過に直面する可能性がある。
3.2.2.3 SMR を含む原子力エネルギーは、安全性、廃棄物処理、潜在的事故について、しばし ば公衆の不安と懸念にさらされている
3.2.2.4 再生可能技術のコスト低下によりクリーンエネルギープロジェクトへの投資が増加し、SMR との市場シェア争いが生じている。
3.2.3 市場機会
3.2.3.1 急速な都市化と工業化を特徴とする発展途上国は、小型モジュール型原子炉 (SMR)にとって大きな市場機会である。
3.2.3.2 SMR は分散型発電の選択肢として機能し、安定したクリーンなエネルギー源を提 供して地域社会、産業、重要なサービスを支えることができる。
3.2.3.3 既存の原子力施設に SMR を統合することにより、開発者は確立されたインフラを 活用し、資本コストを削減し、規制当局の承認プロセスを合理化することができる。
3.2.3.4 複数のエネルギー源を組み合わせたハイブリッドエネルギーシステムの概念は、エ ネルギー安全保障の強化において SMR が重要な役割を果たす機会を提供する。
3.3 COVID-19 影響分析
3.3.1 V字型回復シナリオ
3.3.2 W字型回復シナリオ
3.3.3 U字型回復シナリオ
3.3.4 L字型回復シナリオ
3.4 ポーターのファイブフォース分析
3.4.1 新規参入の脅威
3.4.2 買い手の交渉力
3.4.3 供給者の交渉力
3.4.4 代替品の脅威
3.4.5 競争上のライバル関係
3.5 PEST分析
3.5.1 政治的要因
3.5.2 経済的要因
3.5.3 社会的要因
3.5.4 技術的要因
4 小型モジュール炉市場分析:配置別
4.1 主要な調査結果
4.2 展開セグメント 市場魅力度指数
4.3 配置別小型モジュール炉市場
4.4 陸上プラント
4.4.1 2023〜2033年の地域別市場(US$ Bn)
4.4.2 地域別市場シェア、2023年・2033年(%)
4.5 海洋ベースプラント
4.5.1 2023〜2033年の地域別市場(US$ Bn)
4.5.2 地域別市場シェア、2023年・2033年(%)
5 小型モジュール炉市場分析:設計別
5.1 主な調査結果
5.2 設計セグメント 市場魅力度指数
5.3 設計別小型モジュール炉市場
5.4 一体型原子炉設計
5.4.1 2023〜2033年の地域別市場(US$ Bn)
5.4.2 地域別市場シェア、2023年・2033年(%)
5.5 二重炉設計
5.5.1 2023~2033年の地域別市場(US$ Bn)
5.5.2 地域別市場シェア、2023年・2033年(%)
5.6 その他の原子炉設計
5.6.1 2023~2033年の地域別市場(US$ Bn)
5.6.2 地域別市場シェア、2023年・2033年(%)
6 小型モジュール炉市場分析:冷却材タイプ別
6.1 主要な調査結果
6.2 冷却材タイプセグメント 市場魅力度指数
6.3 冷却材タイプ別小型モジュール炉市場
6.4 溶融塩炉(MSR)
6.4.1 2023〜2033年の地域別市場(US$ Bn)
6.4.2 地域別市場シェア、2023年・2033年(%)
6.5 ガス冷却炉(GCR)
6.5.1 2023~2033年の地域別市場(US$ Bn)
6.5.2 地域別市場シェア、2023年・2033年(%)
6.6 液体金属リアクター(LMR)
6.6.1 2023~2033年の地域別市場(US$ Bn)
6.6.2 地域別市場シェア、2023年・2033年(%)
6.7 その他の冷却材タイプ
6.7.1 2023〜2033年の地域別市場(US$ Bn)
6.7.2 地域別市場シェア、2023年・2033年 (%)
7 小型モジュール炉市場分析:タイプ別
7.1 主要な調査結果
7.2 タイプ別セグメント 市場魅力度指数
7.3 小型モジュール炉のタイプ別市場
7.4 加圧水型原子炉(PWR)
7.4.1 2023〜2033年の地域別市場(US$ Bn)
7.4.2 地域別市場シェア、2023年・2033年(%)
7.5 加圧水型重水炉(PHWR)
7.5.1 2023~2033年の地域別市場(US$ Bn)
7.5.2 地域別市場シェア、2023年及び2033年(%)
7.6 高温ガス炉(HTR)
7.6.1 2023~2033年の地域別市場(US$ Bn)
7.6.2 地域別市場シェア、2023年及び2033年(%)
7.7 高速中性子炉(FNR)
7.7.1 2023~2033年の地域別市場(US$ Bn)
7.7.2 地域別市場シェア、2023年及び2033年(%)
7.8 その他のタイプ
7.8.1 2023-2033年地域別市場(US$ Bn)
7.8.2 地域別市場シェア、2023年および2033年 (%)
8 小型モジュール炉市場分析:用途別
8.1 主要な調査結果
8.2 用途別セグメント 市場魅力度指数
8.3 用途別小型モジュール炉市場
8.4 発電
8.4.1 2023年~2033年の地域別市場(US$ Bn)
8.4.2 地域別市場シェア、2023年・2033年(%)
8.5 脱塩
8.5.1 2023年~2033年の地域別市場(US$ Bn)
8.5.2 地域別市場シェア、2023年・2033年(%)
8.6 プロセス熱供給
8.6.1 2023〜2033年の地域別市場(US$ Bn)
8.6.2 地域別市場シェア、2023年・033年(%)
8.7 産業用アプリケーション
8.7.1 2023年~2033年の地域別市場(US$ Bn)
8.7.2 地域別市場シェア、2023年・2033年(%)
8.8 地域暖房
8.8.1 2023~2033年の地域別市場(US$ Bn)
8.8.2 地域別市場シェア、2023年・2033年(%)
8.9 その他の用途
8.9.1 2023年~2033年の地域別市場(US$ Bn)
8.9.2 地域別市場シェア、2023年・2033年 (%)
9 小型モジュール炉市場分析:地域別
9.1 主要な調査結果
9.2 地域別市場規模の推定と予測
10 北米の小型モジュール炉市場分析
10.1 主要な調査結果
10.2 北米の小型モジュール炉市場魅力度指数
10.3 北米の小型モジュール炉国別市場、2023年、2028年、2033年(US$ Billion)
10.4 北米の小型モジュール炉市場:金額ベース
10.5 北米の小型モジュール炉市場:国別
10.6 北米の小型モジュール炉市場:配置別
10.7 北米の小型モジュール炉市場:設計別
10.8 北米の小型モジュール炉市場:冷却材タイプ別
10.9 北米の小型モジュール炉市場:タイプ別
10.10 北米の小型モジュール炉市場:用途別
10.11 アメリカの小型モジュール炉市場分析
10.12 カナダの小型モジュール炉市場分析
11 欧州の小型モジュール炉市場分析
11.1 主要な調査結果
11.2 欧州小型モジュール炉市場魅力度指数
11.3 欧州の小型モジュール炉国別市場、2023年、2028年、2033年(US$ Billion)
11.4 欧州の小型モジュール炉市場:金額ベース
11.5 欧州の小型モジュール炉市場:国別
11.6 欧州の小型モジュール炉市場:配置別
11.7 欧州の小型モジュール炉市場:設計別
11.8 欧州の小型モジュール炉市場:冷却材タイプ別
11.9 欧州の小型モジュール炉市場:タイプ別
11.10 欧州の小型モジュール炉市場:用途別
11.11 ロシアの小型モジュール炉市場分析
11.12 イギリスの小型モジュール炉市場の分析
11.13 フランスの小型モジュール炉市場の分析
11.14 ルクセンブルクの小型モジュール炉市場の分析
11.15 スウェーデンの小型モジュール炉市場の分析
11.16 その他の欧州の小型モジュール炉市場の分析
12 アジア太平洋地域の小型モジュール炉市場分析
12.1 主要な調査結果
12.2 アジア太平洋地域の小型モジュール炉市場魅力度指数
12.3 アジア太平洋地域の小型モジュール炉国別市場、2023年、2028年、2033年(US$ Billion)
12.4 アジア太平洋地域の小型モジュール炉市場:金額ベース
12.5 アジア太平洋地域の小型モジュール炉市場:国別
12.6 アジア太平洋地域の小型モジュール炉市場:配置別
12.7 アジア太平洋地域の小型モジュール炉市場:設計別
12.8 アジア太平洋地域の小型モジュール炉市場:冷却材タイプ別
12.9 アジア太平洋地域の小型モジュール炉市場:タイプ別
12.10 アジア太平洋地域の小型モジュール炉市場:用途別
12.11 中国の小型モジュール炉市場分析
12.12 インドネシアの小型モジュール炉市場の分析
12.13 日本の小型モジュール炉市場の分析
12.14 韓国の小型モジュール炉市場の分析
12.15 インドの小型モジュール炉市場の分析
12.16 その他のアジア太平洋地域の小型モジュール炉市場の分析
13 中東・アフリカの小型モジュール炉市場分析
13.1 主要な調査結果
13.2 中東・アフリカの小型モジュール炉市場魅力度指数
13.3 中東・アフリカの小型モジュール炉国別市場、2023年、2028年、2033年(US$ Billion)
13.4 中東・アフリカの小型モジュール炉市場:金額ベース
13.5 中東・アフリカの小型モジュール炉市場:国別
13.6 中東・アフリカの小型モジュール炉市場:配置別
13.7 中東・アフリカの小型モジュール炉市場:設計別
13.8 中東・アフリカの小型モジュール炉市場:冷却材タイプ別
13.9 中東・アフリカの小型モジュール炉市場:タイプ別
13.10 中東・アフリカの小型モジュール炉市場:用途別
13.11 GCCの小型モジュラーリアクターの市場分析
13.12 南アフリカの小型モジュール炉市場の分析
13.13 その他の中東・アフリカ地域の小型モジュール炉市場の分析
14 ラテンアメリカの小型モジュール炉市場分析
14.1 主要な調査結果
14.2 ラテンアメリカの小型モジュール炉市場魅力度指数
14.3 ラテンアメリカの小型モジュール炉国別市場、2023年、2028年、2033年(US$ Billion)
14.4 ラテンアメリカの小型モジュール炉市場:金額ベース
14.5 ラテンアメリカの小型モジュール炉市場:国別
14.6 ラテンアメリカの小型モジュール炉市場:配置別
14.7 ラテンアメリカの小型モジュール炉市場:設計別
14.8 ラテンアメリカの小型モジュール炉市場:冷却材タイプ別
14.9 ラテンアメリカの小型モジュール炉市場:タイプ別
14.10 ラテンアメリカの小型モジュール炉市場:用途別
14.11 ブラジルの小型モジュール炉市場分析
14.12 アルゼンチンの小型モジュール炉市場分析
14.13 その他のラテンアメリカの小型モジュール炉市場分析
15 会社概要
15.1 競争環境、2022年
15.2 戦略的展望
15.3 Westinghouse Electric Company LLC
15.3.1 会社概要
15.3.2 会社概要
15.3.3 製品ベンチマーク
15.3.4 戦略的展望
15.4 NuScale Power Corporation
15.4.1 会社概要
15.4.2 会社概要
15.4.3 財務分析
15.4.3.1 純収入、2020-2022年
15.4.3.2 R&D、2020-2022年
15.4.4 製品ベンチマーク
15.4.5 戦略的展望
15.5 Terrestrial Energy
15.5.1 会社概要
15.5.2 会社概要
15.5.3 製品ベンチマーク
15.5.4 戦略的展望
15.6 Moltex Energy
15.6.1 会社概要
15.6.2 会社概要
15.6.3 製品ベンチマーク
15.7 GE Hitachi Nuclear Energy
15.7.1 会社概要
15.7.2 会社概要
15.7.3 製品ベンチマーク
15.7.4 戦略的展望
15.8 X Energy, LLC
15.8.1 会社概要
15.8.2 会社概要
15.8.3 製品ベンチマーク
15.8.4 戦略的展望
15.9 General Atomics
15.9.1 会社概要
15.9.2 会社概要
15.9.3 製品ベンチマーク
15.9.4 戦略的展望
15.10 ARC Clean Energy
15.10.1 会社概要
15.10.2 会社概要
15.10.3 製品ベンチマーク
15.10.4 戦略的展望
15.11 Rolls-Royce Limited
15.11.1 会社概要
15.11.2 会社概要
15.11.3 財務分析
15.11.3.1 純収入、2018-2022年
15.11.3.2 R&D、2018年〜2022年
15.11.3.3 地域別収益シェア、2022年(%)
15.11.3.4 事業セグメント収益シェア、2022年(%)
15.11.4 製品ベンチマーク
15.11.5 戦略的展望
15.12 LeadCold Reactors
15.12.1 会社概要
15.12.2 会社概要
15.12.3 製品ベンチマーク
15.12.4 戦略的展望
15.13 Ultra-Safe Nuclear Corporation
15.13.1 会社概要
15.13.2 会社概要
15.13.3 製品ベンチマーク
15.13.4 戦略的展望
15.14 Tokamak Energy Ltd
15.14.1 会社概要
15.14.2 会社概要
15.14.3 製品ベンチマーク
15.15 SNC-Lavalin Group Inc
15.15.1 会社概要
15.15.2 会社概要
15.15.3 財務分析
15.15.3.1 純収入、2018年〜2022年
15.15.3.2 地域別収益シェア、2022年(%)
15.15.3.3 事業セグメント別売上高シェア、2022年(%)
15.15.4 製品ベンチマーク
15.16 China National Nuclear Corporation
15.16.1 会社概要
15.16.2 会社概要
15.16.3 製品ベンチマーク
15.16.4 戦略的展望
15.17 Framatome
15.17.1 会社概要
15.17.2 会社概要
15.17.3 製品ベンチマーク
15.17.4 戦略的展望
16 結論と提言
16.1 Visiongainからの結びの言葉
16.2 市場プレイヤーへの提言
ページTOPに戻る
図表リスト
表の一覧
Table 1 Small Modular Reactor Market Snapshot, 2023 & 2033 (US$ Billion, CAGR %)
Table 2 Small Modular Reactor Market by Region, 2023-2033 (US$ Bn, AGR (%), CAGR (%)) (V-Shaped Recovery Scenario)
Table 3 Small Modular Reactor Market by Region, 2023-2033 (US$ Bn, AGR (%), CAGR (%)) (W-Shaped Recovery Scenario)
Table 4 Small Modular Reactor Market by Region, 2023-2033 (US$ Bn, AGR (%), CAGR (%)) (U-Shaped Recovery Scenario)
Table 5 Small Modular Reactor Market by Region, 2023-2033 (US$ Bn, AGR (%), CAGR (%)) (L-Shaped Recovery Scenario)
Table 6 Small Modular Reactor Market by Deployment, 2023-2033 (US$ Bn, AGR (%), CAGR (%))
Table 7 Land-based Plant Market by Region, 2023-2033 (US$ Bn, AGR (%), CAGR (%))
Table 8 Marine-based Plant Market by Region, 2023-2033 (US$ Bn, AGR (%), CAGR (%))
Table 9 Small Modular Reactor Market by Design, 2023-2033 (US$ Bn, AGR (%), CAGR (%))
Table 10 Integral Reactor Design Market by Region, 2023-2033 (US$ Bn, AGR (%), CAGR (%))
Table 11 Twin Reactor Design Market by Region, 2023-2033 (US$ Bn, AGR (%), CAGR (%))
Table 12 Other Reactor Design Market by Region, 2023-2033 (US$ Bn, AGR (%), CAGR (%))
Table 13 Small Modular Reactor Market by Coolant Type, 2023-2033 (US$ Bn, AGR (%), CAGR (%))
Table 14 Molten Salt Reactors (MSR) Market by Region, 2023-2033 (US$ Bn, AGR (%), CAGR (%))
Table 15 Gas-Cooled Reactors (GCR) Market by Region, 2023-2033 (US$ Bn, AGR (%), CAGR (%))
Table 16 Liquid Metal Reactors (LMR) Market by Region, 2023-2033 (US$ Bn, AGR (%), CAGR (%))
Table 17 Other Coolant Type Market by Region, 2023-2033 (US$ Bn, AGR (%), CAGR (%))
Table 18 Small Modular Reactor Market by Type, 2023-2033 (US$ Bn, AGR (%), CAGR (%))
Table 19 Pressurized Water Reactor (PWR) Market by Region, 2023-2033 (US$ Bn, AGR (%), CAGR (%))
Table 20 Pressurized Heavy Water Reactor (PHWR) Market by Region, 2023-2033 (US$ Bn, AGR (%), CAGR (%))
Table 21 High-Temperature Reactor (HTR) Market by Region, 2023-2033 (US$ Bn, AGR (%), CAGR (%))
Table 22 Fast Neutron Reactor (FNR) Market by Region, 2023-2033 (US$ Bn, AGR (%), CAGR (%))
Table 23 Other Type Market by Region, 2023-2033 (US$ Bn, AGR (%), CAGR (%))
Table 24 Small Modular Reactor Market by Application, 2023-2033 (US$ Bn, AGR (%), CAGR (%))
Table 25 Power Generation Market by Region, 2023-2033 (US$ Bn, AGR (%), CAGR (%))
Table 26 Desalination Market by Region, 2023-2033 (US$ Bn, AGR (%), CAGR (%))
Table 27 Process Heat Supply Market by Region, 2023-2033 (US$ Bn, AGR (%), CAGR (%))
Table 28 Industrial Applications Market by Region, 2023-2033 (US$ Bn, AGR (%), CAGR (%))
Table 29 District Heating Market by Region, 2023-2033 (US$ Bn, AGR (%), CAGR (%))
Table 30 Other Applications Market by Region, 2023-2033 (US$ Bn, AGR (%), CAGR (%))
Table 31 Small Modular Reactor Market by Region, 2023-2033 (US$ Bn, AGR (%), CAGR (%))
Table 32 North America Small Modular Reactor Market by Value, 2023-2033 (US$ Bn, AGR (%), CAGR (%))
Table 33 North America Small Modular Reactor Market by Country, 2023-2033 (US$ Bn, AGR (%), CAGR (%))
Table 34 North America Small Modular Reactor Market by Deployment, 2023-2033 (US$ Bn, AGR (%), CAGR (%))
Table 35 North America Small Modular Reactor Market by Design, 2023-2033 (US$ Bn, AGR (%), CAGR (%))
Table 36 North America Small Modular Reactor Market by Coolant Type, 2023-2033 (US$ Bn, AGR (%), CAGR (%))
Table 37 North America Small Modular Reactor Market by Type, 2023-2033 (US$ Bn, AGR (%), CAGR (%))
Table 38 North America Small Modular Reactor Market by Application, 2023-2033 (US$ Bn, AGR (%), CAGR (%))
Table 39 US Small Modular Reactor Market by Value, 2023-2033 (US$ Bn, AGR (%), CAGR (%))
Table 40 Canada Small Modular Reactor Market by Value, 2023-2033 (US$ Bn, AGR (%), CAGR (%))
Table 41 Europe Small Modular Reactor Market by Value, 2023-2033 (US$ Bn, AGR (%), CAGR (%))
Table 42 Europe Small Modular Reactor Market by Country, 2023-2033 (US$ Bn, AGR (%), CAGR (%))
Table 43 Europe Small Modular Reactor Market by Deployment, 2023-2033 (US$ Bn, AGR (%), CAGR (%))
Table 44 Europe Small Modular Reactor Market by Design, 2023-2033 (US$ Bn, AGR (%), CAGR (%))
Table 45 Europe Small Modular Reactor Market by Coolant Type, 2023-2033 (US$ Bn, AGR (%), CAGR (%))
Table 46 Europe Small Modular Reactor Market by Type, 2023-2033 (US$ Bn, AGR (%), CAGR (%))
Table 47 Europe Small Modular Reactor Market by Application, 2023-2033 (US$ Bn, AGR (%), CAGR (%))
Table 48 Russia Small Modular Reactor Market by Value, 2023-2033 (US$ Bn, AGR (%), CAGR (%))
Table 49 UK Small Modular Reactor Market by Value, 2023-2033 (US$ Bn, AGR (%), CAGR (%))
Table 50 France Small Modular Reactor Market by Value, 2023-2033 (US$ Bn, AGR (%), CAGR (%))
Table 51 Luxembourg Small Modular Reactor Market by Value, 2023-2033 (US$ Bn, AGR (%), CAGR (%))
Table 52 Sweden Small Modular Reactor Market by Value, 2023-2033 (US$ Bn, AGR (%), CAGR (%))
Table 53 Rest of Europe Small Modular Reactor Market by Value, 2023-2033 (US$ Bn, AGR (%), CAGR (%))
Table 54 Asia-Pacific Small Modular Reactor Market by Value, 2023-2033 (US$ Bn, AGR (%), CAGR (%))
Table 55 Asia-Pacific Small Modular Reactor Market by Country, 2023-2033 (US$ Bn, AGR (%), CAGR (%))
Table 56 Asia-Pacific Small Modular Reactor Market by Deployment, 2023-2033 (US$ Bn, AGR (%), CAGR (%))
Table 57 Asia-Pacific Small Modular Reactor Market by Design, 2023-2033 (US$ Bn, AGR (%), CAGR (%))
Table 58 Asia-Pacific Small Modular Reactor Market by Coolant Type, 2023-2033 (US$ Bn, AGR (%), CAGR (%))
Table 59 Asia-Pacific Small Modular Reactor Market by Type, 2023-2033 (US$ Bn, AGR (%), CAGR (%))
Table 60 Asia-Pacific Small Modular Reactor Market by Application, 2023-2033 (US$ Bn, AGR (%), CAGR (%))
Table 61 China Small Modular Reactor Market by Value, 2023-2033 (US$ Bn, AGR (%), CAGR (%))
Table 62 Indonesia Small Modular Reactor Market by Value, 2023-2033 (US$ Bn, AGR (%), CAGR (%))
Table 63 Japan Small Modular Reactor Market by Value, 2023-2033 (US$ Bn, AGR (%), CAGR (%))
Table 64 South Korea Small Modular Reactor Market by Value, 2023-2033 (US$ Bn, AGR (%), CAGR (%))
Table 65 India Small Modular Reactor Market by Value, 2023-2033 (US$ Bn, AGR (%), CAGR (%))
Table 66 Rest of Asia-Pacific Small Modular Reactor Market by Value, 2023-2033 (US$ Bn, AGR (%), CAGR (%))
Table 67 Middle East & Africa Small Modular Reactor Market by Value, 2023-2033 (US$ Bn, AGR (%), CAGR (%))
Table 68 Middle East & Africa Small Modular Reactor Market by Country, 2023-2033 (US$ Bn, AGR (%), CAGR (%))
Table 69 Middle East & Africa Small Modular Reactor Market by Deployment, 2023-2033 (US$ Bn, AGR (%), CAGR (%))
Table 70 Middle East & Africa Small Modular Reactor Market by Design, 2023-2033 (US$ Bn, AGR (%), CAGR (%))
Table 71 Middle East & Africa Small Modular Reactor Market by Coolant Type, 2023-2033 (US$ Bn, AGR (%), CAGR (%))
Table 72 Middle East & Africa Small Modular Reactor Market by Type, 2023-2033 (US$ Bn, AGR (%), CAGR (%))
Table 73 Middle East & Africa Small Modular Reactor Market by Application, 2023-2033 (US$ Bn, AGR (%), CAGR (%))
Table 74 GCC Small Modular Reactor Market by Value, 2023-2033 (US$ Bn, AGR (%), CAGR (%))
Table 75 South Africa Small Modular Reactor Market by Value, 2023-2033 (US$ Bn, AGR (%), CAGR (%))
Table 76 Rest of Middle East & Africa Small Modular Reactor Market by Value, 2023-2033 (US$ Bn, AGR (%), CAGR (%))
Table 77 Latin America Small Modular Reactor Market by Value, 2023-2033 (US$ Bn, AGR (%), CAGR (%))
Table 78 Latin America Small Modular Reactor Market by Country, 2023-2033 (US$ Bn, AGR (%), CAGR (%))
Table 79 Latin America Small Modular Reactor Market by Deployment, 2023-2033 (US$ Bn, AGR (%), CAGR (%))
Table 80 Latin America Small Modular Reactor Market by Design, 2023-2033 (US$ Bn, AGR (%), CAGR (%))
Table 81 Latin America Small Modular Reactor Market by Coolant Type, 2023-2033 (US$ Bn, AGR (%), CAGR (%))
Table 82 Latin America Small Modular Reactor Market by Type, 2023-2033 (US$ Bn, AGR (%), CAGR (%))
Table 83 Latin America Small Modular Reactor Market by Application, 2023-2033 (US$ Bn, AGR (%), CAGR (%))
Table 84 Brazil Small Modular Reactor Market by Value, 2023-2033 (US$ Bn, AGR (%), CAGR (%))
Table 85 Argentina Small Modular Reactor Market by Value, 2023-2033 (US$ Bn, AGR (%), CAGR (%))
Table 86 Rest of Latin America Small Modular Reactor Market by Value, 2023-2033 (US$ Bn, AGR (%), CAGR (%))
Table 87 Strategic Outlook
Table 88 Westinghouse Electric Company LLC: Key Details, (CEO, HQ, Revenue, Founded, No. of Employees, Company Type, Website, Business Segment)
Table 89 Westinghouse Electric Company LLC: Product Benchmarking
Table 90 Westinghouse Electric Company LLC: Strategic Outlook
Table 91 NuScale Power Corporation: Key Details, (CEO, HQ, Revenue, Founded, No. of Employees, Company Type, Website, Business Segment)
Table 92 NuScale Power Corporation: Product Benchmarking
Table 93 NuScale Power Corporation: Strategic Outlook
Table 94 Terrestrial Energy : Key Details, (CEO, HQ, Revenue, Founded, No. of Employees, Company Type, Website, Business Segment)
Table 95 Terrestrial Energy: Product Benchmarking
Table 96 Terrestrial Energy: Strategic Outlook
Table 97 Moltex Energy: Key Details, (CEO, HQ, Revenue, Founded, No. of Employees, Company Type, Website, Business Segment)
Table 98 Moltex Energy: Product Benchmarking
Table 99 GE Hitachi Nuclear Energy: Key Details, (CEO, HQ, Revenue, Founded, No. of Employees, Company Type, Website, Business Segment)
Table 100 GE Hitachi Nuclear Energy: Product Benchmarking
Table 101 GE Hitachi Nuclear Energy: Strategic Outlook
Table 102 X Energy, LLC: Key Details, (CEO, HQ, Revenue, Founded, No. of Employees, Company Type, Website, Business Segment)
Table 103 X Energy, LLC: Product Benchmarking
Table 104 X Energy, LLC: Strategic Outlook
Table 105 General Atomics: Key Details, (CEO, HQ, Revenue, Founded, No. of Employees, Company Type, Website, Business Segment)
Table 106 General Atomics: Product Benchmarking
Table 107 General Atomics: Strategic Outlook
Table 108 ARC Clean Energy: Key Details, (CEO, HQ, Revenue, Founded, No. of Employees, Company Type, Website, Business Segment)
Table 109 ARC Clean Energy: Product Benchmarking
Table 110 ARC Clean Energy: Strategic Outlook
Table 111 Rolls-Royce Limited: Key Details, (CEO, HQ, Revenue, Founded, No. of Employees, Company Type, Website, Business Segment)
Table 112 Rolls-Royce Limited: Product Benchmarking
Table 113 Rolls-Royce Limited: Strategic Outlook
Table 114 LeadCold Reactors : Key Details, (CEO, HQ, Revenue, Founded, No. of Employees, Company Type, Website, Business Segment)
Table 115 LeadCold Reactors: Product Benchmarking
Table 116 LeadCold Reactors: Strategic Outlook
Table 117 Ultra Safe Nuclear Corporation : Key Details, (CEO, HQ, Revenue, Founded, No. of Employees, Company Type, Website, Business Segment)
Table 118 Ultra Safe Nuclear Corporation: Product Benchmarking
Table 119 Ultra Safe Nuclear Corporation: Strategic Outlook
Table 120 Tokamak Energy Ltd: Key Details, (CEO, HQ, Revenue, Founded, No. of Employees, Company Type, Website, Business Segment)
Table 121 SNC-Lavalin Group Inc: Key Details, (CEO, HQ, Revenue, Founded, No. of Employees, Company Type, Website, Business Segment)
Table 122 SNC-Lavalin Group Inc.: Product Benchmarking
Table 123 China National Nuclear Corporation: Key Details, (CEO, HQ, Revenue, Founded, No. of Employees, Company Type, Website, Business Segment)
Table 124 China National Nuclear Corporation: Product Benchmarking
Table 125 China National Nuclear Corporation: Strategic Outlook
Table 126 Framatome: Key Details, (CEO, HQ, Revenue, Founded, No. of Employees, Company Type, Website, Business Segment)
Table 127 Framatome: Strategic Outlook
図の一覧
Figure 1 Small Modular Reactor Market Segmentation
Figure 2 Small Modular Reactor Market by Deployment: Market Attractiveness Index
Figure 3 Small Modular Reactor Market by Design: Market Attractiveness Index
Figure 4 Small Modular Reactor Market by Coolant Type: Market Attractiveness Index
Figure 5 Small Modular Reactor Market by Type: Market Attractiveness Index
Figure 6 Small Modular Reactor Market by Application: Market Attractiveness Index
Figure 7 Small Modular Reactor Market Attractiveness Index by Region
Figure 8 Small Modular Reactor Market: Market Dynamics
Figure 9 Small Modular Reactor Market by Region, 2023-2033 (US$ Bn, AGR (%)) (V-Shaped Recovery Scenario)
Figure 10 Small Modular Reactor Market by Region, 2023-2033 (US$ Bn, AGR (%)) (W-Shaped Recovery Scenario)
Figure 11 Small Modular Reactor Market by Region, 2023-2033 (US$ Bn, AGR (%)) (U-Shaped Recovery Scenario)
Figure 12 Small Modular Reactor Market by Region, 2023-2033 (US$ Bn, AGR (%)) (L-Shaped Recovery Scenario)
Figure 13 Small Modular Reactor Market: Porter’s Five Forces Analysis
Figure 14 Small Modular Reactor Market by Deployment: Market Attractiveness Index
Figure 15 Small Modular Reactor Market by Deployment, 2023-2033 (US$ Bn, AGR (%))
Figure 16 Land-based Plant Market by Region, 2023-2033 (US$ Bn, AGR (%))
Figure 17 Land-Based Plant Segment Market Share Forecast by Region, 2023 & 2033 (%)
Figure 18 Marine-based Plant Market by Region, 2023-2033 (US$ Bn, AGR (%))
Figure 19 Marine-based Plant Segment Market Share Forecast by Region, 2023 & 2033 (%)
Figure 20 Small Modular Reactor Market by Design: Market Attractiveness Index
Figure 21 Small Modular Reactor Market by Design, 2023-2033 (US$ Bn, AGR (%))
Figure 22 Integral Reactor Design Market by Region, 2023-2033 (US$ Bn, AGR (%))
Figure 23 Integral Reactor Design Segment Market Share Forecast by Region, 2023 & 2033 (%)
Figure 24 Twin Reactor Design Market by Region, 2023-2033 (US$ Bn, AGR (%))
Figure 25 Twin Reactor Design Segment Market Share Forecast by Region, 2023 & 2033 (%)
Figure 26 Other Reactor Design Market by Region, 2023-2033 (US$ Bn, AGR (%))
Figure 27 Other Reactor Design Segment Market Share Forecast by Region, 2023 & 2033 (%)
Figure 28 Small Modular Reactor Market by Coolant Type: Market Attractiveness Index
Figure 29 Small Modular Reactor Market by Coolant Type, 2023-2033 (US$ Bn, AGR (%))
Figure 30 Molten Salt Reactors (MSR) Market by Region, 2023-2033 (US$ Bn, AGR (%))
Figure 31 Molten Salt Reactors (MSR) Segment Market Share Forecast by Region, 2023 & 2033 (%)
Figure 32 Gas-Cooled Reactors (GCR) Market by Region, 2023-2033 (US$ Bn, AGR (%))
Figure 33 Gas-Cooled Reactors (GCR) Segment Market Share Forecast by Region, 2023 & 2033 (%)
Figure 34 Liquid Metal Reactors (LMR) Market by Region, 2023-2033 (US$ Bn, AGR (%))
Figure 35 Liquid Metal Reactors (LMR) Segment Market Share Forecast by Region, 2023 & 2033 (%)
Figure 36 Other Coolant Type Market by Region, 2023-2033 (US$ Bn, AGR (%))
Figure 37 Other Coolant Type Segment Market Share Forecast by Region, 2023 & 2033 (%)
Figure 38 Small Modular Reactor Market by Type: Market Attractiveness Index
Figure 39 Global Small Modular Reactor Market by Type, 2023-2033 (US$ Bn, AGR (%))
Figure 40 Pressurized Water Reactor (PWR) Market by Region, 2023-2033 (US$ Bn, AGR (%))
Figure 41 Pressurized Water Reactor (PWR) Segment Market Share Forecast by Region, 2023 & 2033 (%)
Figure 42 Pressurized Heavy Water Reactor (PHWR) Market by Region, 2023-2033 (US$ Bn, AGR (%))
Figure 43 Pressurized Heavy Water Reactor (PHWR) Segment Market Share Forecast by Region, 2023 & 2033 (%)
Figure 44 High-Temperature Reactor (HTR) Market by Region, 2023-2033 (US$ Bn, AGR (%))
Figure 45 High-Temperature Reactor (HTR) Segment Market Share Forecast by Region, 2023 & 2033 (%)
Figure 46 Fast Neutron Reactor (FNR) Market by Region, 2023-2033 (US$ Bn, AGR (%))
Figure 47 Fast Neutron Reactor (FNR) Segment Market Share Forecast by Region, 2023 & 2033 (%)
Figure 48 Other Type Market by Region, 2023-2033 (US$ Bn, AGR (%))
Figure 49 Other Type Segment Market Share Forecast by Region, 2023 & 2033 (%)
Figure 50 Small Modular Reactor Market by Application: Market Attractiveness Index
Figure 51 Small Modular Reactor Market by Application, 2023-2033 (US$ Bn, AGR (%))
Figure 52 Power Generation Market by Region, 2023-2033 (US$ Bn, AGR (%))
Figure 53 Power Generation Segment Market Share Forecast by Region, 2023 & 2033 (%)
Figure 54 Desalination Market by Region, 2023-2033 (US$ Bn, AGR (%))
Figure 55 Desalination Segment Market Share Forecast by Region, 2023 & 2033 (%)
Figure 56 Process Heat Supply Market by Region, 2023-2033 (US$ Bn, AGR (%))
Figure 57 Process Heat Supply Segment Market Share Forecast by Region, 2023 & 2033 (%)
Figure 58 Industrial Applications Market by Region, 2023-2033 (US$ Bn, AGR (%))
Figure 59 Industrial Applications Segment Market Share Forecast by Region, 2023 & 2033 (%)
Figure 60 District Heating Market by Region, 2023-2033 (US$ Bn, AGR (%))
Figure 61 District Heating Segment Market Share Forecast by Region, 2023 & 2033 (%)
Figure 62 Other Applications Market by Region, 2023-2033 (US$ Bn, AGR (%))
Figure 63 Other Applications Segment Market Share Forecast by Region, 2023 & 2033 (%)
Figure 64 Small Modular Reactor Market Forecast by Region 2023 and 2033 (Revenue, CAGR%)
Figure 65 Small Modular Reactor Market by Region, 2023-2033 (US$ Bn, AGR (%))
Figure 66 North America Small Modular Reactor Market Attractiveness Index
Figure 67 North America Small Modular Reactor Market by Region, 2023, 2028 & 2033 (US$ Billion)
Figure 68 North America Small Modular Reactor Market by Value, 2023-2033 (US$ Bn, AGR (%))
Figure 69 North America Small Modular Reactor Market by Country, 2023-2033 (US$ Bn, AGR (%))
Figure 70 North America Small Modular Reactor Market Share Forecast by Country, 2023 & 2033 (%)
Figure 71 North America Small Modular Reactor Market by Deployment, 2023-2033 (US$ Bn, AGR (%))
Figure 72 North America Small Modular Reactor Market Share Forecast by Deployment, 2023 & 2033 (%)
Figure 73 North America Small Modular Reactor Market by Design, 2023-2033 (US$ Bn, AGR (%))
Figure 74 North America Small Modular Reactor Market Share Forecast by Design, 2023 & 2033 (%)
Figure 75 North America Small Modular Reactor Market by Coolant Type, 2023-2033 (US$ Bn, AGR (%))
Figure 76 North America Small Modular Reactor Market Share Forecast by Coolant Type, 2023 & 2033 (%)
Figure 77 North America Small Modular Reactor Market by Type, 2023-2033 (US$ Bn, AGR (%))
Figure 78 North America Small Modular Reactor Market Share Forecast by Type, 2023 & 2033 (%)
Figure 79 North America Small Modular Reactor Market by Application, 2023-2033 (US$ Bn, AGR (%))
Figure 80 North America Small Modular Reactor Market Share Forecast by Application, 2023 & 2033 (%)
Figure 81 US Small Modular Reactor Market by Value, 2023-2033 (US$ Bn, AGR (%))
Figure 82 Canada Small Modular Reactor Market by Value, 2023-2033 (US$ Bn, AGR (%))
Figure 83 Europe Small Modular Reactor Market Attractiveness Index
Figure 84 Europe Small Modular Reactor Market by Region, 2023, 2028 & 2033 (US$ Billion)
Figure 85 Europe Small Modular Reactor Market by Value, 2023-2033 (US$ Bn, AGR (%))
Figure 86 Europe Small Modular Reactor Market by Country, 2023-2033 (US$ Bn, AGR (%))
Figure 87 Europe Small Modular Reactor Market Share Forecast by Country, 2023 & 2033 (%)
Figure 88 Europe Small Modular Reactor Market by Deployment, 2023-2033 (US$ Bn, AGR (%))
Figure 89 Europe Small Modular Reactor Market Share Forecast by Deployment, 2023 & 2033 (%)
Figure 90 Europe Small Modular Reactor Market by Design, 2023-2033 (US$ Bn, AGR (%))
Figure 91 Europe Small Modular Reactor Market Share Forecast by Design, 2023 & 2033 (%)
Figure 92 Europe Small Modular Reactor Market by Coolant Type, 2023-2033 (US$ Bn, AGR (%))
Figure 93 Europe Small Modular Reactor Market Share Forecast by Coolant Type, 2023 & 2033 (%)
Figure 94 Europe Small Modular Reactor Market by Type, 2023-2033 (US$ Bn, AGR (%))
Figure 95 Europe Small Modular Reactor Market Share Forecast by Type, 2023 & 2033 (%)
Figure 96 Europe Small Modular Reactor Market by Application, 2023-2033 (US$ Bn, AGR (%))
Figure 97 Europe Small Modular Reactor Market Share Forecast by Application, 2023 & 2033 (%)
Figure 98 Russia Small Modular Reactor Market by Value, 2023-2033 (US$ Bn, AGR (%))
Figure 99 UK Small Modular Reactor Market by Value, 2023-2033 (US$ Bn, AGR (%))
Figure 100 France Small Modular Reactor Market by Value, 2023-2033 (US$ Bn, AGR (%))
Figure 101 Luxembourg Small Modular Reactor Market by Value, 2023-2033 (US$ Bn, AGR (%))
Figure 102 Sweden Small Modular Reactor Market by Value, 2023-2033 (US$ Bn, AGR (%))
Figure 103 Rest of Europe Small Modular Reactor Market by Value, 2023-2033 (US$ Bn, AGR (%))
Figure 104 Asia Pacific Small Modular Reactor Market Attractiveness Index
Figure 105 Asia Pacific Small Modular Reactor Market by Region, 2023, 2028 & 2033 (US$ Billion)
Figure 106 Asia-Pacific Small Modular Reactor Market by Value, 2023-2033 (US$ Bn, AGR (%))
Figure 107 Asia-Pacific Small Modular Reactor Market by Country, 2023-2033 (US$ Bn, AGR (%))
Figure 108 Asia Pacific Small Modular Reactor Market Share Forecast by Country, 2023 & 2033 (%)
Figure 109 Asia-Pacific Small Modular Reactor Market by Deployment, 2023-2033 (US$ Bn, AGR (%))
Figure 110 Asia Pacific Small Modular Reactor Market Share Forecast by Deployment, 2023 & 2033 (%)
Figure 111 Asia-Pacific Small Modular Reactor Market by Design, 2023-2033 (US$ Bn, AGR (%))
Figure 112 Asia Pacific Small Modular Reactor Market Share Forecast by Design, 2023 & 2033 (%)
Figure 113 Asia-Pacific Small Modular Reactor Market by Coolant Type, 2023-2033 (US$ Bn, AGR (%))
Figure 114 North America Small Modular Reactor Market Share Forecast by Coolant Type, 2023 & 2033 (%)
Figure 115 Asia-Pacific Small Modular Reactor Market by Type, 2023-2033 (US$ Bn, AGR (%))
Figure 116 North America Small Modular Reactor Market Share Forecast by Type, 2023 & 2033 (%)
Figure 117 Asia-Pacific Small Modular Reactor Market by Application, 2023-2033 (US$ Bn, AGR (%))
Figure 118 North America Small Modular Reactor Market Share Forecast by Application, 2023 & 2033 (%)
Figure 119 China Small Modular Reactor Market by Value, 2023-2033 (US$ Bn, AGR (%))
Figure 120 Indonesia Small Modular Reactor Market by Value, 2023-2033 (US$ Bn, AGR (%))
Figure 121 Japan Small Modular Reactor Market by Value, 2023-2033 (US$ Bn, AGR (%))
Figure 122 South Korea Small Modular Reactor Market by Value, 2023-2033 (US$ Bn, AGR (%))
Figure 123 India Small Modular Reactor Market by Value, 2023-2033 (US$ Bn, AGR (%))
Figure 124 Rest of Asia-Pacific Small Modular Reactor Market by Value, 2023-2033 (US$ Bn, AGR (%))
Figure 125 Middle East & Africa Small Modular Reactor Market Attractiveness Index
Figure 126 Middle East & Africa Small Modular Reactor Market by Region, 2023, 2028 & 2033 (US$ Billion)
Figure 127 Middle East & Africa Small Modular Reactor Market by Value, 2023-2033 (US$ Bn, AGR (%))
Figure 128 Middle East & Africa Small Modular Reactor Market by Country, 2023-2033 (US$ Bn, AGR (%))
Figure 129 Middle East & Africa Small Modular Reactor Market Share Forecast by Country, 2023 & 2033 (%)
Figure 130 Middle East & Africa Small Modular Reactor Market by Deployment, 2023-2033 (US$ Bn, AGR (%))
Figure 131 Middle East & Africa Small Modular Reactor Market Share Forecast by Deployment, 2023 & 2033 (%)
Figure 132 Middle East & Africa Small Modular Reactor Market by Design, 2023-2033 (US$ Bn, AGR (%))
Figure 133 Middle East & Africa Small Modular Reactor Market Share Forecast by Design, 2023 & 2033 (%)
Figure 134 Middle East & Africa Small Modular Reactor Market by Coolant Type, 2023-2033 (US$ Bn, AGR (%))
Figure 135 Middle East & Africa Small Modular Reactor Market Share Forecast by Coolant Type, 2023 & 2033 (%)
Figure 136 Middle East & Africa Small Modular Reactor Market by Type, 2023-2033 (US$ Bn, AGR (%))
Figure 137 Middle East & Africa Small Modular Reactor Market Share Forecast by Type, 2023 & 2033 (%)
Figure 138 Middle East & Africa Small Modular Reactor Market by Application, 2023-2033 (US$ Bn, AGR (%))
Figure 139 Middle East & Africa Small Modular Reactor Market Share Forecast by Application, 2023 & 2033 (%)
Figure 140 GCC Small Modular Reactor Market by Value, 2023-2033 (US$ Bn, AGR (%))
Figure 141 South Africa Small Modular Reactor Market by Value, 2023-2033 (US$ Bn, AGR (%))
Figure 142 Rest of Middle East & Africa Small Modular Reactor Market by Value, 2023-2033 (US$ Bn, AGR (%))
Figure 143 Latin America Small Modular Reactor Market Attractiveness Index
Figure 144 Latin America Small Modular Reactor Market by Region, 2023, 2028 & 2033 (US$ Billion)
Figure 145 Latin America Small Modular Reactor Market by Value, 2023-2033 (US$ Bn, AGR (%))
Figure 146 Latin America Small Modular Reactor Market by Country, 2023-2033 (US$ Bn, AGR (%))
Figure 147 Latin America Small Modular Reactor Market Share Forecast by Country, 2023 & 2033 (%)
Figure 148 Latin America Small Modular Reactor Market by Deployment, 2023-2033 (US$ Bn, AGR (%))
Figure 149 Latin America Small Modular Reactor Market Share Forecast by Deployment, 2023 & 2033 (%)
Figure 150 Latin America Small Modular Reactor Market by Design, 2023-2033 (US$ Bn, AGR (%))
Figure 151 Latin America Small Modular Reactor Market Share Forecast by Design, 2023 & 2033 (%)
Figure 152 Latin America Small Modular Reactor Market by Coolant Type, 2023-2033 (US$ Bn, AGR (%))
Figure 153 Latin America Small Modular Reactor Market Share Forecast by Coolant Type, 2023 & 2033 (%)
Figure 154 Latin America Small Modular Reactor Market by Type, 2023-2033 (US$ Bn, AGR (%))
Figure 155 Latin America Small Modular Reactor Market Share Forecast by Type, 2023 & 2033 (%)
Figure 156 Latin America Small Modular Reactor Market by Application, 2023-2033 (US$ Bn, AGR (%))
Figure 157 Latin America Small Modular Reactor Market Share Forecast by Application, 2023 & 2033 (%)
Figure 158 Brazil Small Modular Reactor Market by Value, 2023-2033 (US$ Bn, AGR (%))
Figure 159 Argentina Small Modular Reactor Market by Value, 2023-2033 (US$ Bn, AGR (%))
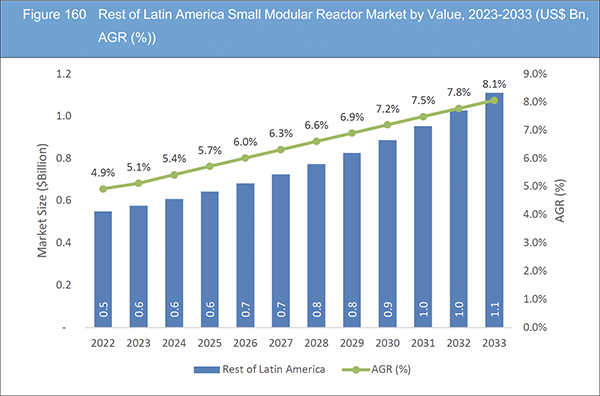
Figure 160 Rest of Latin America Small Modular Reactor Market by Value, 2023-2033 (US$ Bn, AGR (%))
Figure 161 Small Modular Reactor Market: Company Share, 2022
Figure 162 NuScale Power Corporation.: Net Revenue, 2018-2022 (US$ Million, AGR%)
Figure 163 NuScale Power Corporation.: R&D, 2018-2022 (US$ Million, AGR%)
Figure 164 Rolls-Royce Limited.: Net Revenue, 2018-2022 (US$ Million, AGR%)
Figure 165 Rolls-Royce Limited.: R&D, 2018-2022 (US$ Million, AGR%)
Figure 166 Rolls-Royce Limited.: Regional Revenue Share, 2022 (%)
Figure 167 Rolls-Royce Limited.: Business Segment Revenue Share, 2022 (%)
Figure 168 SNC-Lavalin Group Inc.: Net Revenue, 2018-2022 (US$ Million, AGR%)
Figure 169 SNC-Lavalin Group Inc.: Regional Revenue Share, 2022 (%)
Figure 170 SNC-Lavalin Group Inc.: Business Segment Revenue Share, 2022 (%)
ページTOPに戻る
Summary
Report Details
The Small Modular Reactor Market Report 2023-2033: This report will prove invaluable to leading firms striving for new revenue pockets if they wish to better understand the industry and its underlying dynamics. It will be useful for companies that would like to expand into different industries or to expand their existing operations in a new region.
Growing Demand for Carbon-Free Energy
The increasing global concern about climate change and the need to reduce greenhouse gas emissions have spurred the demand for clean and sustainable energy sources. Small Modular Reactors (SMRs) offer a promising solution as they produce electricity with virtually zero carbon emissions. As countries commit to ambitious climate targets, the role of nuclear energy, including SMRs, becomes more critical in decarbonizing the power sector. The growing demand for carbon-free energy has positioned SMRs as a viable option to meet electricity needs while mitigating the environmental impact.
Flexibility and Grid Resilience
One of the key advantages of SMRs is their flexibility in power generation and grid integration. Traditional large-scale nuclear power plants have limited flexibility in adjusting their output based on fluctuating energy demands. SMRs, on the other hand, can ramp their power output up or down more rapidly, allowing them to adapt to changing grid requirements. This flexibility makes SMRs suitable for complementing intermittent renewable energy sources like solar and wind, providing grid stability and resilience, especially during peak demand periods.
What Questions Should You Ask before Buying a Market Research Report?
• How is the small modular reactor market evolving?
• What is driving and restraining the small modular reactor market?
• How will each small modular reactor submarket segment grow over the forecast period and how much revenue will these submarkets account for in 2033?
• How will the market shares for each small modular reactor submarket develop from 2023 to 2033?
• What will be the main driver for the overall market from 2023 to 2033?
• Will leading small modular reactor markets broadly follow the macroeconomic dynamics, or will individual national markets outperform others?
• How will the market shares of the national markets change by 2033 and which geographical region will lead the market in 2033?
• Who are the leading players and what are their prospects over the forecast period?
• What are the small modular reactor projects for these leading companies?
• How will the industry evolve during the period between 2023 and 2033? What are the implications of small modular reactor projects taking place now and over the next 10 years?
• Is there a greater need for product commercialisation to further scale the small modular reactor market?
• Where is the small modular reactor market heading and how can you ensure you are at the forefront of the market?
• What are the best investment options for new product and service lines?
• What are the key prospects for moving companies into a new growth path and C-suite?
You need to discover how this will impact the small modular reactor market today, and over the next 10 years:
• Our 386-page report provides 127 tables and 170 charts/graphs exclusively to you.
• The report highlights key lucrative areas in the industry so you can target them – NOW.
• It contains in-depth analysis of global, regional and national sales and growth.
• It highlights for you the key successful trends, changes and revenue projections made by your competitors.
This report tells you TODAY how the small modular reactor market will develop in the next 10 years, and in line with the variations in COVID-19 economic recession and bounce. This market is more critical now than at any point over the last 10 years.
Forecasts to 2033 and other analyses reveal commercial prospects
• In addition to revenue forecasting to 2033, our new study provides you with recent results, growth rates, and market shares.
• You will find original analyses, with business outlooks and developments.
• Discover qualitative analyses (including market dynamics, drivers, opportunities, restraints and challenges), cost structure, impact of rising small modular reactor prices and recent developments.
This report includes data analysis and invaluable insight into how COVID-19 will affect the industry and your company. Four COVID-19 recovery patterns and their impact, namely, “V”, “L”, “W” and “U” are discussed in this report.
Segments Covered in the Report
Market Segment by Deployment
• Land-based Plant
• Marine-based Plant
Market Segment by Design
• Integral Reactor Design
• Twin Reactor Design
• Other Reactor Design
Market Segment by Coolant Type
• Molten Salt Reactors (MSR)
• Gas-Cooled Reactors (GCR)
• Liquid Metal Reactors (LMR)
• Other Coolant Type
Market Segment by Type
• Pressurized Water Reactor (PWR)
• Pressurized Heavy Water Reactor (PHWR)
• High-Temperature Reactor (HTR)
• Fast Neutron Reactor (FNR)
• Other Type
Market Segment by Application
• Power Generation
• Desalination
• Process Heat Supply
• Industrial Applications
• District Heating
• Other Applications
In addition to the revenue predictions for the overall world market and segments, you will also find revenue forecasts for four regional and 20 leading national markets:
North America
• U.S.
• Canada
Europe
• Russia
• UK
• France
• Luxembourg
• Sweden
• Rest of Europe
Asia Pacific
• China
• Japan
• India
• Indonesia
• South Korea
• Rest of Asia Pacific
Latin America
• Brazil
• Mexico
• Rest of Latin America
Middle East & Africa
• GCC
• South Africa
• Rest of Middle East & Africa
The report also includes profiles and for some of the leading companies in the Small Modular Reactor Market, 2023 to 2033, with a focus on this segment of these companies’ operations.
Leading companies profiled in the report
• ARC Clean Energy
• China National Nuclear Corporation (CNNC)
• Framatome
• GE Hitachi Nuclear Energy (GEH)
• General Atomics (GA)
• LeadCold Reactors
• Moltex Energy
• NuScale Power Corporation
• Rolls-Royce Limited
• SNC-Lavalin Group Inc.
• Terrestrial Energy Inc.
• Tokamak Energy Ltd
• Ultra-Safe Nuclear (USNC)
• Westinghouse Electric Company LLC
• X Energy, LLC
Overall world revenue for Small Modular Reactor Market, 2023 to 2033 in terms of value the market will surpass US$86.6 billion in 2023, our work calculates. We predict strong revenue growth through to 2033. Our work identifies which organizations hold the greatest potential. Discover their capabilities, progress, and commercial prospects, helping you stay ahead.
How will the Small Modular Reactor Market, 2023 to 2033 report help you?
In summary, our 380+ page report provides you with the following knowledge:
• Revenue forecasts to 2033 for Small Modular Reactor Market, 2023 to 2033 Market, with forecasts for design, type, coolant type, application, and deployment, each forecast at a global and regional level – discover the industry’s prospects, finding the most lucrative places for investments and revenues.
• Revenue forecasts to 2033 for four regional and 20 key national markets – See forecasts for the Small Modular Reactor Market, 2023 to 2033 market in North America, Europe, Asia-Pacific, Latin America and Middle East & Africa. Also forecasted is the market in the US, Canada, Brazil, Germany, France, UK, Sweden, Luxemburg, China, India, Japan, and Australia among other prominent economies.
• Prospects for established firms and those seeking to enter the market – including company profiles for 15 of the major companies involved in the Small Modular Reactor Market, 2023 to 2033.
Find quantitative and qualitative analyses with independent predictions. Receive information that only our report contains, staying informed with invaluable business intelligence.
Information found nowhere else
With our new report, you are less likely to fall behind in knowledge or miss out on opportunities. See how our work could benefit your research, analyses, and decisions. Visiongain’s study is for everybody needing commercial analyses for the Small Modular Reactor Market, 2023 to 2033, market-leading companies. You will find data, trends and predictions.
ページTOPに戻る
Table of Contents
Table of Contents
1 Report Overview
1.1 Objectives of the Study
1.2 Introduction to Small Modular Reactor Market
1.3 What This Report Delivers
1.4 Why You Should Read This Report
1.5 Key Questions Answered by This Analytical Report
1.6 Who Is This Report for?
1.7 Research Methodology
1.7.1 Market Definitions
1.7.2 Market Evaluation & Forecasting Methodology
1.7.3 Data Validation
1.7.3.1 Primary Research
1.7.3.2 Secondary Research
1.8 Frequently Asked Questions (FAQs)
1.9 Associated Visiongain Reports
1.10 About Visiongain
2 Executive Summary
3 Market Overview
3.1 Key Findings
3.2 Market Dynamics
3.2.1 Market Driving Factors
3.2.1.1 SMRs Offer a Decentralized and Distributed Power Generation Approach
3.2.1.2 SMRs Offer a Clean and Sustainable Option for Electricity Generation Without the Greenhouse Gas Emissions Associated with Fossil Fuels
3.2.1.3 SMRs Offer a Viable Solution for Nuclear Power Plant Replacement and Expansion Due to their Smaller Size
3.2.1.4 New Materials, Advanced Control Systems, and Passive Safety Mechanisms have Enhanced the Safety and Efficiency of SMRs
3.2.2 Market Restraining Factors
3.2.2.1 Prolonged Project Timelines and Increased Costs, Discouraging Potential Investors and Hindering the Widespread Adoption of SMRs
3.2.2.2 The Development of First-of-a-Kind SMRs May Still Face Cost Overruns Due to Research, Licensing, and Regulatory Compliance Challenges
3.2.2.3 Nuclear Energy, Including SMRs, Is Often Met with Public Apprehension and Concerns About Safety, Waste Disposal, and Potential Accidents
3.2.2.4 The Declining Costs of Renewable Technologies have Led to Increased Investments in Clean Energy Projects, Creating Competition for Market Share with SMRs
3.2.3 Market Opportunities
3.2.3.1 Developing Economies, Characterized by Rapid Urbanization and Industrialization, Present a Significant Market Opportunity for Small Modular Reactors (SMRs)
3.2.3.2 SMRs Can Serve as a Decentralized Power Generation Option, providing a Stable and Clean Energy Source to Support Local Communities, Industries, and Essential Services
3.2.3.3 By Integrating SMRs in to Existing Nuclear Sites, Developers Can Capitalize on Established Infrastructure, Reducing Capital Costs and Streamlining Regulatory Approval Processes
3.2.3.4 The Concept of Hybrid Energy Systems, Combining Multiple Energy Sources, Presents an Opportunity for SMRs to Play a Crucial Role in Enhancing Energy Security
3.3 COVID-19 Impact Analysis
3.3.1 V-Shaped Recovery Scenario
3.3.2 W-Shaped Recovery Scenario
3.3.3 U-Shaped Recovery Scenario
3.3.4 L-Shaped Recovery Scenario
3.4 Porter’s Five Forces Analysis
3.4.1 Threat of New Entrants
3.4.2 Bargaining Power of Buyers
3.4.3 Bargaining Power of Suppliers
3.4.4 Threat of Substitutes
3.4.5 Competitive Rivalry
3.5 PEST Analysis
3.5.1 Political Factors
3.5.2 Economic Factors
3.5.3 Social Factors
3.5.4 Technological Factors
4 Small Modular Reactor Market Analysis by Deployment
4.1 Key Findings
4.2 Deployment Segment: Market Attractiveness Index
4.3 Small Modular Reactor Market by Deployment
4.4 Land-Based Plant
4.4.1 Market by Region, 2023-2033 (US$ Bn)
4.4.2 Market Share by Region, 2023 & 2033 (%)
4.5 Marine-Based Plant
4.5.1 Market by Region, 2023-2033 (US$ Bn)
4.5.2 Market Share by Region, 2023 & 2033 (%)
5 Small Modular Reactor Market Analysis by Design
5.1 Key Findings
5.2 Design Segment: Market Attractiveness Index
5.3 Small Modular Reactor Market by Design
5.4 Integral Reactor Design
5.4.1 Market by Region, 2023-2033 (US$ Bn)
5.4.2 Market Share by Region, 2023 & 2033 (%)
5.5 Twin Reactor Design
5.5.1 Market by Region, 2023-2033 (US$ Bn)
5.5.2 Market Share by Region, 2023 & 2033 (%)
5.6 Other Reactor Design
5.6.1 Market by Region, 2023-2033 (US$ Bn)
5.6.2 Market Share by Region, 2023 & 2033 (%)
6 Small Modular Reactor Market Analysis by Coolant Type
6.1 Key Findings
6.2 Coolant Type Segment: Market Attractiveness Index
6.3 Small Modular Reactor Market by Coolant Type
6.4 Molten Salt Reactors (MSRs)
6.4.1 Market by Region, 2023-2033 (US$ Bn)
6.4.2 Market Share by Region, 2023 & 2033 (%)
6.5 Gas-Cooled Reactors (GCR)
6.5.1 Market by Region, 2023-2033 (US$ Bn)
6.5.2 Market Share by Region, 2023 & 2033 (%)
6.6 Liquid Metal Reactors (LMR)
6.6.1 Market by Region, 2023-2033 (US$ Bn)
6.6.2 Market Share by Region, 2023 & 2033 (%)
6.7 Other Coolant Type
6.7.1 Market by Region, 2023-2033 (US$ Bn)
6.7.2 Market Share by Region, 2023 & 2033 (%)
7 Small Modular Reactor Market Analysis by Type
7.1 Key Findings
7.2 Type Segment: Market Attractiveness Index
7.3 Small Modular Reactor Market by Type
7.4 Pressurized Water Reactor (PWR)
7.4.1 Market by Region, 2023-2033 (US$ Bn)
7.4.2 Market Share by Region, 2023 & 2033 (%)
7.5 Pressurized Heavy Water Reactor (PHWR)
7.5.1 Market by Region, 2023-2033 (US$ Bn)
7.5.2 Market Share by Region, 2023 & 2033 (%)
7.6 High-Temperature Reactor (HTR)
7.6.1 Market by Region, 2023-2033 (US$ Bn)
7.6.2 Market Share by Region, 2023 & 2033 (%)
7.7 Fast Neutron Reactor (FNR)
7.7.1 Market by Region, 2023-2033 (US$ Bn)
7.7.2 Market Share by Region, 2023 & 2033 (%)
7.8 Other Type
7.8.1 Market by Region, 2023-2033 (US$ Bn)
7.8.2 Market Share by Region, 2023 & 2033 (%)
8 Small Modular Reactor Market Analysis by Application
8.1 Key Findings
8.2 Application Segment: Market Attractiveness Index
8.3 Small Modular Reactor Market by Application
8.4 Power Generation
8.4.1 Market by Region, 2023-2033 (US$ Bn)
8.4.2 Market Share by Region, 2023 & 2033 (%)
8.5 Desalination
8.5.1 Market by Region, 2023-2033 (US$ Bn)
8.5.2 Market Share by Region, 2023 & 2033 (%)
8.6 Process Heat Supply
8.6.1 Market by Region, 2023-2033 (US$ Bn)
8.6.2 Market Share by Region, 2023 & 2033 (%)
8.7 Industrial Applications
8.7.1 Market by Region, 2023-2033 (US$ Bn)
8.7.2 Market Share by Region, 2023 & 2033 (%)
8.8 District Heating
8.8.1 Market by Region, 2023-2033 (US$ Bn)
8.8.2 Market Share by Region, 2023 & 2033 (%)
8.9 Other Applications
8.9.1 Market by Region, 2023-2033 (US$ Bn)
8.9.2 Market Share by Region, 2023 & 2033 (%)
9 Small Modular Reactor Market Analysis by Region
9.1 Key Findings
9.2 Regional Market Size Estimation and Forecast
10 North America Small Modular Reactor Market Analysis
10.1 Key Findings
10.2 North America Small Modular Reactor Market Attractiveness Index
10.3 North America Small Modular Reactor Market by Country, 2023, 2028 & 2033 (US$ Billion)
10.4 North America Small Modular Reactor Market by Value
10.5 North America Small Modular Reactor Market by Country
10.6 North America Small Modular Reactor Market by Deployment
10.7 North America Small Modular Reactor Market by Design
10.8 North America Small Modular Reactor Market by Coolant Type
10.9 North America Small Modular Reactor Market by Type
10.10 North America Small Modular Reactor Market by Application
10.11 U.S. Small Modular Reactor Market Analysis
10.12 Canada Small Modular Reactor Market Analysis
11 Europe Small Modular Reactor Market Analysis
11.1 Key Findings
11.2 Europe Small Modular Reactor Market Attractiveness Index
11.3 Europe Small Modular Reactor Market by Country, 2023, 2028 & 2033 (US$ Billion)
11.4 Europe Small Modular Reactor Market by Value
11.5 Europe Small Modular Reactor Market by Country
11.6 Europe Small Modular Reactor Market by Deployment
11.7 Europe Small Modular Reactor Market by Design
11.8 Europe Small Modular Reactor Market by Coolant Type
11.9 Europe Small Modular Reactor Market by Type
11.10 Europe Small Modular Reactor Market by Application
11.11 Russia Small Modular Reactor Market Analysis
11.12 UK Small Modular Reactor Market Analysis
11.13 France Small Modular Reactor Market Analysis
11.14 Luxembourg Small Modular Reactor Market Analysis
11.15 Sweden Small Modular Reactor Market Analysis
11.16 Rest of Europe Small Modular Reactor Market Analysis
12 Asia Pacific Small Modular Reactor Market Analysis
12.1 Key Findings
12.2 Asia Pacific Small Modular Reactor Market Attractiveness Index
12.3 Asia Pacific Small Modular Reactor Market by Country, 2023, 2028 & 2033 (US$ Billion)
12.4 Asia-Pacific Small Modular Reactor Market by Value
12.5 Asia-Pacific Small Modular Reactor Market by Country
12.6 Asia-Pacific Small Modular Reactor Market by Deployment
12.7 Asia-Pacific Small Modular Reactor Market by Design
12.8 Asia-Pacific Small Modular Reactor Market by Coolant Type
12.9 Asia-Pacific Small Modular Reactor Market by Type
12.10 Asia-Pacific Small Modular Reactor Market by Application
12.11 China Small Modular Reactor Market Analysis
12.12 Indonesia Small Modular Reactor Market Analysis
12.13 Japan Small Modular Reactor Market Analysis
12.14 South Korea Small Modular Reactor Market Analysis
12.15 India Small Modular Reactor Market Analysis
12.16 Rest of Asia Pacific Small Modular Reactor Market Analysis
13 Middle East & Africa Small Modular Reactor Market Analysis
13.1 Key Findings
13.2 Middle East & Africa Small Modular Reactor Market Attractiveness Index
13.3 Middle East & Africa Small Modular Reactor Market by Country, 2023, 2028 & 2033 (US$ Billion)
13.4 Middle East & Africa Small Modular Reactor Market by Value
13.5 Middle East & Africa Small Modular Reactor Market by Country
13.6 Middle East & Africa Small Modular Reactor Market by Deployment
13.7 Middle East & Africa Small Modular Reactor Market by Design
13.8 Middle East & Africa Small Modular Reactor Market by Coolant Type
13.9 Middle East & Africa Small Modular Reactor Market by Type
13.10 Middle East & Africa Small Modular Reactor Market by Application
13.11 GCC Small Modular Reactor Market Analysis
13.12 South Africa Small Modular Reactor Market Analysis
13.13 Rest of the Middle East & Africa Small Modular Reactor Market Analysis
14 Latin America Small Modular Reactor Market Analysis
14.1 Key Findings
14.2 Latin America Small Modular Reactor Market Attractiveness Index
14.3 Latin America Small Modular Reactor Market by Country, 2023, 2028 & 2033 (US$ Billion)
14.4 Latin America Small Modular Reactor Market by Value
14.5 Latin America Small Modular Reactor Market by Country
14.6 Latin America Small Modular Reactor Market by Deployment
14.7 Latin America Small Modular Reactor Market by Design
14.8 Latin America Small Modular Reactor Market by Coolant Type
14.9 Latin America Small Modular Reactor Market by Type
14.10 Latin America Small Modular Reactor Market by Application
14.11 Brazil Small Modular Reactor Market Analysis
14.12 Argentina Small Modular Reactor Market Analysis
14.13 Rest of Latin America Small Modular Reactor Market Analysis
15 Company Profiles
15.1 Competitive Landscape, 2022
15.2 Strategic Outlook
15.3 Westinghouse Electric Company LLC
15.3.1 Company Snapshot
15.3.2 Company Overview
15.3.3 Product Benchmarking
15.3.4 Strategic Outlook
15.4 NuScale Power Corporation
15.4.1 Company Snapshot
15.4.2 Company Overview
15.4.3 Financial Analysis
15.4.3.1 Net Revenue, 2020-2022
15.4.3.2 R&D, 2020-2022
15.4.4 Product Benchmarking
15.4.5 Strategic Outlook
15.5 Terrestrial Energy
15.5.1 Company Snapshot
15.5.2 Company Overview
15.5.3 Product Benchmarking
15.5.4 Strategic Outlook
15.6 Moltex Energy
15.6.1 Company Snapshot
15.6.2 Company Overview
15.6.3 Product Benchmarking
15.7 GE Hitachi Nuclear Energy
15.7.1 Company Snapshot
15.7.2 Company Overview
15.7.3 Product Benchmarking
15.7.4 Strategic Outlook
15.8 X Energy, LLC
15.8.1 Company Snapshot
15.8.2 Company Overview
15.8.3 Product Benchmarking
15.8.4 Strategic Outlook
15.9 General Atomics
15.9.1 Company Snapshot
15.9.2 Company Overview
15.9.3 Product Benchmarking
15.9.4 Strategic Outlook
15.10 ARC Clean Energy
15.10.1 Company Snapshot
15.10.2 Company Overview
15.10.3 Product Benchmarking
15.10.4 Strategic Outlook
15.11 Rolls-Royce Limited
15.11.1 Company Snapshot
15.11.2 Company Overview
15.11.3 Financial Analysis
15.11.3.1 Net Revenue, 2018-2022
15.11.3.2 R&D, 2018-2022
15.11.3.3 Regional Revenue Share, 2022 (%)
15.11.3.4 Business Segment Revenue Share, 2022 (%)
15.11.4 Product Benchmarking
15.11.5 Strategic Outlook
15.12 LeadCold Reactors
15.12.1 Company Snapshot
15.12.2 Company Overview
15.12.3 Product Benchmarking
15.12.4 Strategic Outlook
15.13 Ultra-Safe Nuclear Corporation
15.13.1 Company Snapshot
15.13.2 Company Overview
15.13.3 Product Benchmarking
15.13.4 Strategic Outlook
15.14 Tokamak Energy Ltd
15.14.1 Company Snapshot
15.14.2 Company Overview
15.14.3 Product Benchmarking
15.15 SNC-Lavalin Group Inc
15.15.1 Company Snapshot
15.15.2 Company Overview
15.15.3 Financial Analysis
15.15.3.1 Net Revenue, 2018-2022
15.15.3.2 Regional Revenue Share, 2022 (%)
15.15.3.3 Business Segment Revenue Share, 2022 (%)
15.15.4 Product Benchmarking
15.16 China National Nuclear Corporation
15.16.1 Company Snapshot
15.16.2 Company Overview
15.16.3 Product Benchmarking
15.16.4 Strategic Outlook
15.17 Framatome
15.17.1 Company Snapshot
15.17.2 Company Overview
15.17.3 Product Benchmarking
15.17.4 Strategic Outlook
16 Conclusion and Recommendations
16.1 Concluding Remarks from Visiongain
16.2 Recommendations for Market Players
ページTOPに戻る
List of Tables/Graphs
List of Tables
Table 1 Small Modular Reactor Market Snapshot, 2023 & 2033 (US$ Billion, CAGR %)
Table 2 Small Modular Reactor Market by Region, 2023-2033 (US$ Bn, AGR (%), CAGR (%)) (V-Shaped Recovery Scenario)
Table 3 Small Modular Reactor Market by Region, 2023-2033 (US$ Bn, AGR (%), CAGR (%)) (W-Shaped Recovery Scenario)
Table 4 Small Modular Reactor Market by Region, 2023-2033 (US$ Bn, AGR (%), CAGR (%)) (U-Shaped Recovery Scenario)
Table 5 Small Modular Reactor Market by Region, 2023-2033 (US$ Bn, AGR (%), CAGR (%)) (L-Shaped Recovery Scenario)
Table 6 Small Modular Reactor Market by Deployment, 2023-2033 (US$ Bn, AGR (%), CAGR (%))
Table 7 Land-based Plant Market by Region, 2023-2033 (US$ Bn, AGR (%), CAGR (%))
Table 8 Marine-based Plant Market by Region, 2023-2033 (US$ Bn, AGR (%), CAGR (%))
Table 9 Small Modular Reactor Market by Design, 2023-2033 (US$ Bn, AGR (%), CAGR (%))
Table 10 Integral Reactor Design Market by Region, 2023-2033 (US$ Bn, AGR (%), CAGR (%))
Table 11 Twin Reactor Design Market by Region, 2023-2033 (US$ Bn, AGR (%), CAGR (%))
Table 12 Other Reactor Design Market by Region, 2023-2033 (US$ Bn, AGR (%), CAGR (%))
Table 13 Small Modular Reactor Market by Coolant Type, 2023-2033 (US$ Bn, AGR (%), CAGR (%))
Table 14 Molten Salt Reactors (MSR) Market by Region, 2023-2033 (US$ Bn, AGR (%), CAGR (%))
Table 15 Gas-Cooled Reactors (GCR) Market by Region, 2023-2033 (US$ Bn, AGR (%), CAGR (%))
Table 16 Liquid Metal Reactors (LMR) Market by Region, 2023-2033 (US$ Bn, AGR (%), CAGR (%))
Table 17 Other Coolant Type Market by Region, 2023-2033 (US$ Bn, AGR (%), CAGR (%))
Table 18 Small Modular Reactor Market by Type, 2023-2033 (US$ Bn, AGR (%), CAGR (%))
Table 19 Pressurized Water Reactor (PWR) Market by Region, 2023-2033 (US$ Bn, AGR (%), CAGR (%))
Table 20 Pressurized Heavy Water Reactor (PHWR) Market by Region, 2023-2033 (US$ Bn, AGR (%), CAGR (%))
Table 21 High-Temperature Reactor (HTR) Market by Region, 2023-2033 (US$ Bn, AGR (%), CAGR (%))
Table 22 Fast Neutron Reactor (FNR) Market by Region, 2023-2033 (US$ Bn, AGR (%), CAGR (%))
Table 23 Other Type Market by Region, 2023-2033 (US$ Bn, AGR (%), CAGR (%))
Table 24 Small Modular Reactor Market by Application, 2023-2033 (US$ Bn, AGR (%), CAGR (%))
Table 25 Power Generation Market by Region, 2023-2033 (US$ Bn, AGR (%), CAGR (%))
Table 26 Desalination Market by Region, 2023-2033 (US$ Bn, AGR (%), CAGR (%))
Table 27 Process Heat Supply Market by Region, 2023-2033 (US$ Bn, AGR (%), CAGR (%))
Table 28 Industrial Applications Market by Region, 2023-2033 (US$ Bn, AGR (%), CAGR (%))
Table 29 District Heating Market by Region, 2023-2033 (US$ Bn, AGR (%), CAGR (%))
Table 30 Other Applications Market by Region, 2023-2033 (US$ Bn, AGR (%), CAGR (%))
Table 31 Small Modular Reactor Market by Region, 2023-2033 (US$ Bn, AGR (%), CAGR (%))
Table 32 North America Small Modular Reactor Market by Value, 2023-2033 (US$ Bn, AGR (%), CAGR (%))
Table 33 North America Small Modular Reactor Market by Country, 2023-2033 (US$ Bn, AGR (%), CAGR (%))
Table 34 North America Small Modular Reactor Market by Deployment, 2023-2033 (US$ Bn, AGR (%), CAGR (%))
Table 35 North America Small Modular Reactor Market by Design, 2023-2033 (US$ Bn, AGR (%), CAGR (%))
Table 36 North America Small Modular Reactor Market by Coolant Type, 2023-2033 (US$ Bn, AGR (%), CAGR (%))
Table 37 North America Small Modular Reactor Market by Type, 2023-2033 (US$ Bn, AGR (%), CAGR (%))
Table 38 North America Small Modular Reactor Market by Application, 2023-2033 (US$ Bn, AGR (%), CAGR (%))
Table 39 US Small Modular Reactor Market by Value, 2023-2033 (US$ Bn, AGR (%), CAGR (%))
Table 40 Canada Small Modular Reactor Market by Value, 2023-2033 (US$ Bn, AGR (%), CAGR (%))
Table 41 Europe Small Modular Reactor Market by Value, 2023-2033 (US$ Bn, AGR (%), CAGR (%))
Table 42 Europe Small Modular Reactor Market by Country, 2023-2033 (US$ Bn, AGR (%), CAGR (%))
Table 43 Europe Small Modular Reactor Market by Deployment, 2023-2033 (US$ Bn, AGR (%), CAGR (%))
Table 44 Europe Small Modular Reactor Market by Design, 2023-2033 (US$ Bn, AGR (%), CAGR (%))
Table 45 Europe Small Modular Reactor Market by Coolant Type, 2023-2033 (US$ Bn, AGR (%), CAGR (%))
Table 46 Europe Small Modular Reactor Market by Type, 2023-2033 (US$ Bn, AGR (%), CAGR (%))
Table 47 Europe Small Modular Reactor Market by Application, 2023-2033 (US$ Bn, AGR (%), CAGR (%))
Table 48 Russia Small Modular Reactor Market by Value, 2023-2033 (US$ Bn, AGR (%), CAGR (%))
Table 49 UK Small Modular Reactor Market by Value, 2023-2033 (US$ Bn, AGR (%), CAGR (%))
Table 50 France Small Modular Reactor Market by Value, 2023-2033 (US$ Bn, AGR (%), CAGR (%))
Table 51 Luxembourg Small Modular Reactor Market by Value, 2023-2033 (US$ Bn, AGR (%), CAGR (%))
Table 52 Sweden Small Modular Reactor Market by Value, 2023-2033 (US$ Bn, AGR (%), CAGR (%))
Table 53 Rest of Europe Small Modular Reactor Market by Value, 2023-2033 (US$ Bn, AGR (%), CAGR (%))
Table 54 Asia-Pacific Small Modular Reactor Market by Value, 2023-2033 (US$ Bn, AGR (%), CAGR (%))
Table 55 Asia-Pacific Small Modular Reactor Market by Country, 2023-2033 (US$ Bn, AGR (%), CAGR (%))
Table 56 Asia-Pacific Small Modular Reactor Market by Deployment, 2023-2033 (US$ Bn, AGR (%), CAGR (%))
Table 57 Asia-Pacific Small Modular Reactor Market by Design, 2023-2033 (US$ Bn, AGR (%), CAGR (%))
Table 58 Asia-Pacific Small Modular Reactor Market by Coolant Type, 2023-2033 (US$ Bn, AGR (%), CAGR (%))
Table 59 Asia-Pacific Small Modular Reactor Market by Type, 2023-2033 (US$ Bn, AGR (%), CAGR (%))
Table 60 Asia-Pacific Small Modular Reactor Market by Application, 2023-2033 (US$ Bn, AGR (%), CAGR (%))
Table 61 China Small Modular Reactor Market by Value, 2023-2033 (US$ Bn, AGR (%), CAGR (%))
Table 62 Indonesia Small Modular Reactor Market by Value, 2023-2033 (US$ Bn, AGR (%), CAGR (%))
Table 63 Japan Small Modular Reactor Market by Value, 2023-2033 (US$ Bn, AGR (%), CAGR (%))
Table 64 South Korea Small Modular Reactor Market by Value, 2023-2033 (US$ Bn, AGR (%), CAGR (%))
Table 65 India Small Modular Reactor Market by Value, 2023-2033 (US$ Bn, AGR (%), CAGR (%))
Table 66 Rest of Asia-Pacific Small Modular Reactor Market by Value, 2023-2033 (US$ Bn, AGR (%), CAGR (%))
Table 67 Middle East & Africa Small Modular Reactor Market by Value, 2023-2033 (US$ Bn, AGR (%), CAGR (%))
Table 68 Middle East & Africa Small Modular Reactor Market by Country, 2023-2033 (US$ Bn, AGR (%), CAGR (%))
Table 69 Middle East & Africa Small Modular Reactor Market by Deployment, 2023-2033 (US$ Bn, AGR (%), CAGR (%))
Table 70 Middle East & Africa Small Modular Reactor Market by Design, 2023-2033 (US$ Bn, AGR (%), CAGR (%))
Table 71 Middle East & Africa Small Modular Reactor Market by Coolant Type, 2023-2033 (US$ Bn, AGR (%), CAGR (%))
Table 72 Middle East & Africa Small Modular Reactor Market by Type, 2023-2033 (US$ Bn, AGR (%), CAGR (%))
Table 73 Middle East & Africa Small Modular Reactor Market by Application, 2023-2033 (US$ Bn, AGR (%), CAGR (%))
Table 74 GCC Small Modular Reactor Market by Value, 2023-2033 (US$ Bn, AGR (%), CAGR (%))
Table 75 South Africa Small Modular Reactor Market by Value, 2023-2033 (US$ Bn, AGR (%), CAGR (%))
Table 76 Rest of Middle East & Africa Small Modular Reactor Market by Value, 2023-2033 (US$ Bn, AGR (%), CAGR (%))
Table 77 Latin America Small Modular Reactor Market by Value, 2023-2033 (US$ Bn, AGR (%), CAGR (%))
Table 78 Latin America Small Modular Reactor Market by Country, 2023-2033 (US$ Bn, AGR (%), CAGR (%))
Table 79 Latin America Small Modular Reactor Market by Deployment, 2023-2033 (US$ Bn, AGR (%), CAGR (%))
Table 80 Latin America Small Modular Reactor Market by Design, 2023-2033 (US$ Bn, AGR (%), CAGR (%))
Table 81 Latin America Small Modular Reactor Market by Coolant Type, 2023-2033 (US$ Bn, AGR (%), CAGR (%))
Table 82 Latin America Small Modular Reactor Market by Type, 2023-2033 (US$ Bn, AGR (%), CAGR (%))
Table 83 Latin America Small Modular Reactor Market by Application, 2023-2033 (US$ Bn, AGR (%), CAGR (%))
Table 84 Brazil Small Modular Reactor Market by Value, 2023-2033 (US$ Bn, AGR (%), CAGR (%))
Table 85 Argentina Small Modular Reactor Market by Value, 2023-2033 (US$ Bn, AGR (%), CAGR (%))
Table 86 Rest of Latin America Small Modular Reactor Market by Value, 2023-2033 (US$ Bn, AGR (%), CAGR (%))
Table 87 Strategic Outlook
Table 88 Westinghouse Electric Company LLC: Key Details, (CEO, HQ, Revenue, Founded, No. of Employees, Company Type, Website, Business Segment)
Table 89 Westinghouse Electric Company LLC: Product Benchmarking
Table 90 Westinghouse Electric Company LLC: Strategic Outlook
Table 91 NuScale Power Corporation: Key Details, (CEO, HQ, Revenue, Founded, No. of Employees, Company Type, Website, Business Segment)
Table 92 NuScale Power Corporation: Product Benchmarking
Table 93 NuScale Power Corporation: Strategic Outlook
Table 94 Terrestrial Energy : Key Details, (CEO, HQ, Revenue, Founded, No. of Employees, Company Type, Website, Business Segment)
Table 95 Terrestrial Energy: Product Benchmarking
Table 96 Terrestrial Energy: Strategic Outlook
Table 97 Moltex Energy: Key Details, (CEO, HQ, Revenue, Founded, No. of Employees, Company Type, Website, Business Segment)
Table 98 Moltex Energy: Product Benchmarking
Table 99 GE Hitachi Nuclear Energy: Key Details, (CEO, HQ, Revenue, Founded, No. of Employees, Company Type, Website, Business Segment)
Table 100 GE Hitachi Nuclear Energy: Product Benchmarking
Table 101 GE Hitachi Nuclear Energy: Strategic Outlook
Table 102 X Energy, LLC: Key Details, (CEO, HQ, Revenue, Founded, No. of Employees, Company Type, Website, Business Segment)
Table 103 X Energy, LLC: Product Benchmarking
Table 104 X Energy, LLC: Strategic Outlook
Table 105 General Atomics: Key Details, (CEO, HQ, Revenue, Founded, No. of Employees, Company Type, Website, Business Segment)
Table 106 General Atomics: Product Benchmarking
Table 107 General Atomics: Strategic Outlook
Table 108 ARC Clean Energy: Key Details, (CEO, HQ, Revenue, Founded, No. of Employees, Company Type, Website, Business Segment)
Table 109 ARC Clean Energy: Product Benchmarking
Table 110 ARC Clean Energy: Strategic Outlook
Table 111 Rolls-Royce Limited: Key Details, (CEO, HQ, Revenue, Founded, No. of Employees, Company Type, Website, Business Segment)
Table 112 Rolls-Royce Limited: Product Benchmarking
Table 113 Rolls-Royce Limited: Strategic Outlook
Table 114 LeadCold Reactors : Key Details, (CEO, HQ, Revenue, Founded, No. of Employees, Company Type, Website, Business Segment)
Table 115 LeadCold Reactors: Product Benchmarking
Table 116 LeadCold Reactors: Strategic Outlook
Table 117 Ultra Safe Nuclear Corporation : Key Details, (CEO, HQ, Revenue, Founded, No. of Employees, Company Type, Website, Business Segment)
Table 118 Ultra Safe Nuclear Corporation: Product Benchmarking
Table 119 Ultra Safe Nuclear Corporation: Strategic Outlook
Table 120 Tokamak Energy Ltd: Key Details, (CEO, HQ, Revenue, Founded, No. of Employees, Company Type, Website, Business Segment)
Table 121 SNC-Lavalin Group Inc: Key Details, (CEO, HQ, Revenue, Founded, No. of Employees, Company Type, Website, Business Segment)
Table 122 SNC-Lavalin Group Inc.: Product Benchmarking
Table 123 China National Nuclear Corporation: Key Details, (CEO, HQ, Revenue, Founded, No. of Employees, Company Type, Website, Business Segment)
Table 124 China National Nuclear Corporation: Product Benchmarking
Table 125 China National Nuclear Corporation: Strategic Outlook
Table 126 Framatome: Key Details, (CEO, HQ, Revenue, Founded, No. of Employees, Company Type, Website, Business Segment)
Table 127 Framatome: Strategic Outlook
List of Figures
Figure 1 Small Modular Reactor Market Segmentation
Figure 2 Small Modular Reactor Market by Deployment: Market Attractiveness Index
Figure 3 Small Modular Reactor Market by Design: Market Attractiveness Index
Figure 4 Small Modular Reactor Market by Coolant Type: Market Attractiveness Index
Figure 5 Small Modular Reactor Market by Type: Market Attractiveness Index
Figure 6 Small Modular Reactor Market by Application: Market Attractiveness Index
Figure 7 Small Modular Reactor Market Attractiveness Index by Region
Figure 8 Small Modular Reactor Market: Market Dynamics
Figure 9 Small Modular Reactor Market by Region, 2023-2033 (US$ Bn, AGR (%)) (V-Shaped Recovery Scenario)
Figure 10 Small Modular Reactor Market by Region, 2023-2033 (US$ Bn, AGR (%)) (W-Shaped Recovery Scenario)
Figure 11 Small Modular Reactor Market by Region, 2023-2033 (US$ Bn, AGR (%)) (U-Shaped Recovery Scenario)
Figure 12 Small Modular Reactor Market by Region, 2023-2033 (US$ Bn, AGR (%)) (L-Shaped Recovery Scenario)
Figure 13 Small Modular Reactor Market: Porter’s Five Forces Analysis
Figure 14 Small Modular Reactor Market by Deployment: Market Attractiveness Index
Figure 15 Small Modular Reactor Market by Deployment, 2023-2033 (US$ Bn, AGR (%))
Figure 16 Land-based Plant Market by Region, 2023-2033 (US$ Bn, AGR (%))
Figure 17 Land-Based Plant Segment Market Share Forecast by Region, 2023 & 2033 (%)
Figure 18 Marine-based Plant Market by Region, 2023-2033 (US$ Bn, AGR (%))
Figure 19 Marine-based Plant Segment Market Share Forecast by Region, 2023 & 2033 (%)
Figure 20 Small Modular Reactor Market by Design: Market Attractiveness Index
Figure 21 Small Modular Reactor Market by Design, 2023-2033 (US$ Bn, AGR (%))
Figure 22 Integral Reactor Design Market by Region, 2023-2033 (US$ Bn, AGR (%))
Figure 23 Integral Reactor Design Segment Market Share Forecast by Region, 2023 & 2033 (%)
Figure 24 Twin Reactor Design Market by Region, 2023-2033 (US$ Bn, AGR (%))
Figure 25 Twin Reactor Design Segment Market Share Forecast by Region, 2023 & 2033 (%)
Figure 26 Other Reactor Design Market by Region, 2023-2033 (US$ Bn, AGR (%))
Figure 27 Other Reactor Design Segment Market Share Forecast by Region, 2023 & 2033 (%)
Figure 28 Small Modular Reactor Market by Coolant Type: Market Attractiveness Index
Figure 29 Small Modular Reactor Market by Coolant Type, 2023-2033 (US$ Bn, AGR (%))
Figure 30 Molten Salt Reactors (MSR) Market by Region, 2023-2033 (US$ Bn, AGR (%))
Figure 31 Molten Salt Reactors (MSR) Segment Market Share Forecast by Region, 2023 & 2033 (%)
Figure 32 Gas-Cooled Reactors (GCR) Market by Region, 2023-2033 (US$ Bn, AGR (%))
Figure 33 Gas-Cooled Reactors (GCR) Segment Market Share Forecast by Region, 2023 & 2033 (%)
Figure 34 Liquid Metal Reactors (LMR) Market by Region, 2023-2033 (US$ Bn, AGR (%))
Figure 35 Liquid Metal Reactors (LMR) Segment Market Share Forecast by Region, 2023 & 2033 (%)
Figure 36 Other Coolant Type Market by Region, 2023-2033 (US$ Bn, AGR (%))
Figure 37 Other Coolant Type Segment Market Share Forecast by Region, 2023 & 2033 (%)
Figure 38 Small Modular Reactor Market by Type: Market Attractiveness Index
Figure 39 Global Small Modular Reactor Market by Type, 2023-2033 (US$ Bn, AGR (%))
Figure 40 Pressurized Water Reactor (PWR) Market by Region, 2023-2033 (US$ Bn, AGR (%))
Figure 41 Pressurized Water Reactor (PWR) Segment Market Share Forecast by Region, 2023 & 2033 (%)
Figure 42 Pressurized Heavy Water Reactor (PHWR) Market by Region, 2023-2033 (US$ Bn, AGR (%))
Figure 43 Pressurized Heavy Water Reactor (PHWR) Segment Market Share Forecast by Region, 2023 & 2033 (%)
Figure 44 High-Temperature Reactor (HTR) Market by Region, 2023-2033 (US$ Bn, AGR (%))
Figure 45 High-Temperature Reactor (HTR) Segment Market Share Forecast by Region, 2023 & 2033 (%)
Figure 46 Fast Neutron Reactor (FNR) Market by Region, 2023-2033 (US$ Bn, AGR (%))
Figure 47 Fast Neutron Reactor (FNR) Segment Market Share Forecast by Region, 2023 & 2033 (%)
Figure 48 Other Type Market by Region, 2023-2033 (US$ Bn, AGR (%))
Figure 49 Other Type Segment Market Share Forecast by Region, 2023 & 2033 (%)
Figure 50 Small Modular Reactor Market by Application: Market Attractiveness Index
Figure 51 Small Modular Reactor Market by Application, 2023-2033 (US$ Bn, AGR (%))
Figure 52 Power Generation Market by Region, 2023-2033 (US$ Bn, AGR (%))
Figure 53 Power Generation Segment Market Share Forecast by Region, 2023 & 2033 (%)
Figure 54 Desalination Market by Region, 2023-2033 (US$ Bn, AGR (%))
Figure 55 Desalination Segment Market Share Forecast by Region, 2023 & 2033 (%)
Figure 56 Process Heat Supply Market by Region, 2023-2033 (US$ Bn, AGR (%))
Figure 57 Process Heat Supply Segment Market Share Forecast by Region, 2023 & 2033 (%)
Figure 58 Industrial Applications Market by Region, 2023-2033 (US$ Bn, AGR (%))
Figure 59 Industrial Applications Segment Market Share Forecast by Region, 2023 & 2033 (%)
Figure 60 District Heating Market by Region, 2023-2033 (US$ Bn, AGR (%))
Figure 61 District Heating Segment Market Share Forecast by Region, 2023 & 2033 (%)
Figure 62 Other Applications Market by Region, 2023-2033 (US$ Bn, AGR (%))
Figure 63 Other Applications Segment Market Share Forecast by Region, 2023 & 2033 (%)
Figure 64 Small Modular Reactor Market Forecast by Region 2023 and 2033 (Revenue, CAGR%)
Figure 65 Small Modular Reactor Market by Region, 2023-2033 (US$ Bn, AGR (%))
Figure 66 North America Small Modular Reactor Market Attractiveness Index
Figure 67 North America Small Modular Reactor Market by Region, 2023, 2028 & 2033 (US$ Billion)
Figure 68 North America Small Modular Reactor Market by Value, 2023-2033 (US$ Bn, AGR (%))
Figure 69 North America Small Modular Reactor Market by Country, 2023-2033 (US$ Bn, AGR (%))
Figure 70 North America Small Modular Reactor Market Share Forecast by Country, 2023 & 2033 (%)
Figure 71 North America Small Modular Reactor Market by Deployment, 2023-2033 (US$ Bn, AGR (%))
Figure 72 North America Small Modular Reactor Market Share Forecast by Deployment, 2023 & 2033 (%)
Figure 73 North America Small Modular Reactor Market by Design, 2023-2033 (US$ Bn, AGR (%))
Figure 74 North America Small Modular Reactor Market Share Forecast by Design, 2023 & 2033 (%)
Figure 75 North America Small Modular Reactor Market by Coolant Type, 2023-2033 (US$ Bn, AGR (%))
Figure 76 North America Small Modular Reactor Market Share Forecast by Coolant Type, 2023 & 2033 (%)
Figure 77 North America Small Modular Reactor Market by Type, 2023-2033 (US$ Bn, AGR (%))
Figure 78 North America Small Modular Reactor Market Share Forecast by Type, 2023 & 2033 (%)
Figure 79 North America Small Modular Reactor Market by Application, 2023-2033 (US$ Bn, AGR (%))
Figure 80 North America Small Modular Reactor Market Share Forecast by Application, 2023 & 2033 (%)
Figure 81 US Small Modular Reactor Market by Value, 2023-2033 (US$ Bn, AGR (%))
Figure 82 Canada Small Modular Reactor Market by Value, 2023-2033 (US$ Bn, AGR (%))
Figure 83 Europe Small Modular Reactor Market Attractiveness Index
Figure 84 Europe Small Modular Reactor Market by Region, 2023, 2028 & 2033 (US$ Billion)
Figure 85 Europe Small Modular Reactor Market by Value, 2023-2033 (US$ Bn, AGR (%))
Figure 86 Europe Small Modular Reactor Market by Country, 2023-2033 (US$ Bn, AGR (%))
Figure 87 Europe Small Modular Reactor Market Share Forecast by Country, 2023 & 2033 (%)
Figure 88 Europe Small Modular Reactor Market by Deployment, 2023-2033 (US$ Bn, AGR (%))
Figure 89 Europe Small Modular Reactor Market Share Forecast by Deployment, 2023 & 2033 (%)
Figure 90 Europe Small Modular Reactor Market by Design, 2023-2033 (US$ Bn, AGR (%))
Figure 91 Europe Small Modular Reactor Market Share Forecast by Design, 2023 & 2033 (%)
Figure 92 Europe Small Modular Reactor Market by Coolant Type, 2023-2033 (US$ Bn, AGR (%))
Figure 93 Europe Small Modular Reactor Market Share Forecast by Coolant Type, 2023 & 2033 (%)
Figure 94 Europe Small Modular Reactor Market by Type, 2023-2033 (US$ Bn, AGR (%))
Figure 95 Europe Small Modular Reactor Market Share Forecast by Type, 2023 & 2033 (%)
Figure 96 Europe Small Modular Reactor Market by Application, 2023-2033 (US$ Bn, AGR (%))
Figure 97 Europe Small Modular Reactor Market Share Forecast by Application, 2023 & 2033 (%)
Figure 98 Russia Small Modular Reactor Market by Value, 2023-2033 (US$ Bn, AGR (%))
Figure 99 UK Small Modular Reactor Market by Value, 2023-2033 (US$ Bn, AGR (%))
Figure 100 France Small Modular Reactor Market by Value, 2023-2033 (US$ Bn, AGR (%))
Figure 101 Luxembourg Small Modular Reactor Market by Value, 2023-2033 (US$ Bn, AGR (%))
Figure 102 Sweden Small Modular Reactor Market by Value, 2023-2033 (US$ Bn, AGR (%))
Figure 103 Rest of Europe Small Modular Reactor Market by Value, 2023-2033 (US$ Bn, AGR (%))
Figure 104 Asia Pacific Small Modular Reactor Market Attractiveness Index
Figure 105 Asia Pacific Small Modular Reactor Market by Region, 2023, 2028 & 2033 (US$ Billion)
Figure 106 Asia-Pacific Small Modular Reactor Market by Value, 2023-2033 (US$ Bn, AGR (%))
Figure 107 Asia-Pacific Small Modular Reactor Market by Country, 2023-2033 (US$ Bn, AGR (%))
Figure 108 Asia Pacific Small Modular Reactor Market Share Forecast by Country, 2023 & 2033 (%)
Figure 109 Asia-Pacific Small Modular Reactor Market by Deployment, 2023-2033 (US$ Bn, AGR (%))
Figure 110 Asia Pacific Small Modular Reactor Market Share Forecast by Deployment, 2023 & 2033 (%)
Figure 111 Asia-Pacific Small Modular Reactor Market by Design, 2023-2033 (US$ Bn, AGR (%))
Figure 112 Asia Pacific Small Modular Reactor Market Share Forecast by Design, 2023 & 2033 (%)
Figure 113 Asia-Pacific Small Modular Reactor Market by Coolant Type, 2023-2033 (US$ Bn, AGR (%))
Figure 114 North America Small Modular Reactor Market Share Forecast by Coolant Type, 2023 & 2033 (%)
Figure 115 Asia-Pacific Small Modular Reactor Market by Type, 2023-2033 (US$ Bn, AGR (%))
Figure 116 North America Small Modular Reactor Market Share Forecast by Type, 2023 & 2033 (%)
Figure 117 Asia-Pacific Small Modular Reactor Market by Application, 2023-2033 (US$ Bn, AGR (%))
Figure 118 North America Small Modular Reactor Market Share Forecast by Application, 2023 & 2033 (%)
Figure 119 China Small Modular Reactor Market by Value, 2023-2033 (US$ Bn, AGR (%))
Figure 120 Indonesia Small Modular Reactor Market by Value, 2023-2033 (US$ Bn, AGR (%))
Figure 121 Japan Small Modular Reactor Market by Value, 2023-2033 (US$ Bn, AGR (%))
Figure 122 South Korea Small Modular Reactor Market by Value, 2023-2033 (US$ Bn, AGR (%))
Figure 123 India Small Modular Reactor Market by Value, 2023-2033 (US$ Bn, AGR (%))
Figure 124 Rest of Asia-Pacific Small Modular Reactor Market by Value, 2023-2033 (US$ Bn, AGR (%))
Figure 125 Middle East & Africa Small Modular Reactor Market Attractiveness Index
Figure 126 Middle East & Africa Small Modular Reactor Market by Region, 2023, 2028 & 2033 (US$ Billion)
Figure 127 Middle East & Africa Small Modular Reactor Market by Value, 2023-2033 (US$ Bn, AGR (%))
Figure 128 Middle East & Africa Small Modular Reactor Market by Country, 2023-2033 (US$ Bn, AGR (%))
Figure 129 Middle East & Africa Small Modular Reactor Market Share Forecast by Country, 2023 & 2033 (%)
Figure 130 Middle East & Africa Small Modular Reactor Market by Deployment, 2023-2033 (US$ Bn, AGR (%))
Figure 131 Middle East & Africa Small Modular Reactor Market Share Forecast by Deployment, 2023 & 2033 (%)
Figure 132 Middle East & Africa Small Modular Reactor Market by Design, 2023-2033 (US$ Bn, AGR (%))
Figure 133 Middle East & Africa Small Modular Reactor Market Share Forecast by Design, 2023 & 2033 (%)
Figure 134 Middle East & Africa Small Modular Reactor Market by Coolant Type, 2023-2033 (US$ Bn, AGR (%))
Figure 135 Middle East & Africa Small Modular Reactor Market Share Forecast by Coolant Type, 2023 & 2033 (%)
Figure 136 Middle East & Africa Small Modular Reactor Market by Type, 2023-2033 (US$ Bn, AGR (%))
Figure 137 Middle East & Africa Small Modular Reactor Market Share Forecast by Type, 2023 & 2033 (%)
Figure 138 Middle East & Africa Small Modular Reactor Market by Application, 2023-2033 (US$ Bn, AGR (%))
Figure 139 Middle East & Africa Small Modular Reactor Market Share Forecast by Application, 2023 & 2033 (%)
Figure 140 GCC Small Modular Reactor Market by Value, 2023-2033 (US$ Bn, AGR (%))
Figure 141 South Africa Small Modular Reactor Market by Value, 2023-2033 (US$ Bn, AGR (%))
Figure 142 Rest of Middle East & Africa Small Modular Reactor Market by Value, 2023-2033 (US$ Bn, AGR (%))
Figure 143 Latin America Small Modular Reactor Market Attractiveness Index
Figure 144 Latin America Small Modular Reactor Market by Region, 2023, 2028 & 2033 (US$ Billion)
Figure 145 Latin America Small Modular Reactor Market by Value, 2023-2033 (US$ Bn, AGR (%))
Figure 146 Latin America Small Modular Reactor Market by Country, 2023-2033 (US$ Bn, AGR (%))
Figure 147 Latin America Small Modular Reactor Market Share Forecast by Country, 2023 & 2033 (%)
Figure 148 Latin America Small Modular Reactor Market by Deployment, 2023-2033 (US$ Bn, AGR (%))
Figure 149 Latin America Small Modular Reactor Market Share Forecast by Deployment, 2023 & 2033 (%)
Figure 150 Latin America Small Modular Reactor Market by Design, 2023-2033 (US$ Bn, AGR (%))
Figure 151 Latin America Small Modular Reactor Market Share Forecast by Design, 2023 & 2033 (%)
Figure 152 Latin America Small Modular Reactor Market by Coolant Type, 2023-2033 (US$ Bn, AGR (%))
Figure 153 Latin America Small Modular Reactor Market Share Forecast by Coolant Type, 2023 & 2033 (%)
Figure 154 Latin America Small Modular Reactor Market by Type, 2023-2033 (US$ Bn, AGR (%))
Figure 155 Latin America Small Modular Reactor Market Share Forecast by Type, 2023 & 2033 (%)
Figure 156 Latin America Small Modular Reactor Market by Application, 2023-2033 (US$ Bn, AGR (%))
Figure 157 Latin America Small Modular Reactor Market Share Forecast by Application, 2023 & 2033 (%)
Figure 158 Brazil Small Modular Reactor Market by Value, 2023-2033 (US$ Bn, AGR (%))
Figure 159 Argentina Small Modular Reactor Market by Value, 2023-2033 (US$ Bn, AGR (%))
Figure 160 Rest of Latin America Small Modular Reactor Market by Value, 2023-2033 (US$ Bn, AGR (%))
Figure 161 Small Modular Reactor Market: Company Share, 2022
Figure 162 NuScale Power Corporation.: Net Revenue, 2018-2022 (US$ Million, AGR%)
Figure 163 NuScale Power Corporation.: R&D, 2018-2022 (US$ Million, AGR%)
Figure 164 Rolls-Royce Limited.: Net Revenue, 2018-2022 (US$ Million, AGR%)
Figure 165 Rolls-Royce Limited.: R&D, 2018-2022 (US$ Million, AGR%)
Figure 166 Rolls-Royce Limited.: Regional Revenue Share, 2022 (%)
Figure 167 Rolls-Royce Limited.: Business Segment Revenue Share, 2022 (%)
Figure 168 SNC-Lavalin Group Inc.: Net Revenue, 2018-2022 (US$ Million, AGR%)
Figure 169 SNC-Lavalin Group Inc.: Regional Revenue Share, 2022 (%)
Figure 170 SNC-Lavalin Group Inc.: Business Segment Revenue Share, 2022 (%)
ページTOPに戻る
よくあるご質問
Visiongain社はどのような調査会社ですか?
英国の調査会社ヴィジョンゲイン社(Visiongain)は、通信とエネルギーのほか、自動車や化学・医薬品、金属など、広範な市場を対象に調査を行っています。自動車市場については、市場全般に関する調査のほ... もっと見る
調査レポートの納品までの日数はどの程度ですか?
在庫のあるものは速納となりますが、平均的には 3-4日と見て下さい。
但し、一部の調査レポートでは、発注を受けた段階で内容更新をして納品をする場合もあります。
発注をする前のお問合せをお願いします。
注文の手続きはどのようになっていますか?
1)お客様からの御問い合わせをいただきます。
2)見積書やサンプルの提示をいたします。
3)お客様指定、もしくは弊社の発注書をメール添付にて発送してください。
4)データリソース社からレポート発行元の調査会社へ納品手配します。
5) 調査会社からお客様へ納品されます。最近は、pdfにてのメール納品が大半です。
お支払方法の方法はどのようになっていますか?
納品と同時にデータリソース社よりお客様へ請求書(必要に応じて納品書も)を発送いたします。
お客様よりデータリソース社へ(通常は円払い)の御振り込みをお願いします。
請求書は、納品日の日付で発行しますので、翌月最終営業日までの当社指定口座への振込みをお願いします。振込み手数料は御社負担にてお願いします。
お客様の御支払い条件が60日以上の場合は御相談ください。
尚、初めてのお取引先や個人の場合、前払いをお願いすることもあります。ご了承のほど、お願いします。
データリソース社はどのような会社ですか?
当社は、世界各国の主要調査会社・レポート出版社と提携し、世界各国の市場調査レポートや技術動向レポートなどを日本国内の企業・公官庁及び教育研究機関に提供しております。
世界各国の「市場・技術・法規制などの」実情を調査・収集される時には、データリソース社にご相談ください。
お客様の御要望にあったデータや情報を抽出する為のレポート紹介や調査のアドバイスも致します。
|
|

