NASH治療と治療薬市場レポート:2023-2033
NASH Treatment & Therapeutics Market Report 2023-2033
レポート詳細
NASH治療・治療薬市場レポート 2023-2033年 : 本レポートは、業界とその基礎となるダイナミクスをより良く理解したい場合、新たな収益ポケットを目指している大手企業にとって非常に貴... もっと見る
※上記価格は部署ライセンス(Departmental licence)価格です。
その他の価格についてはデータリソースまでお問合せください。
日本語のページは自動翻訳を利用し作成しています。
実際のレポートは英文のみでご納品いたします。

|

|
サマリー
レポート詳細
NASH治療・治療薬市場レポート 2023-2033年: 本レポートは、業界とその基礎となるダイナミクスをより良く理解したい場合、新たな収益ポケットを目指している大手企業にとって非常に貴重なものとなります。異業種への進出や新地域での既存事業の拡大を目指す企業にも有用です。
非アルコール性脂肪性肝炎(NASH)の有病率の増加が市場成長を牽引
NASH治療・治療薬市場を牽引する主な要因としては、特に発展途上国におけるNASHの有病率の増加が挙げられます。さらに、NASHの発生率と有病率の大幅な上昇を示す研究により、NASHは公衆衛生上の重要な問題となっており、これが市場の成長をさらに促進すると予想されています。一方、米国や欧州などの先進国では、NASHがC型肝炎を上回る慢性肝疾患の主要な原因となっています。NASHの危険因子である肥満、2型糖尿病、メタボリックシンドロームの有病率は着実に増加しており、NASH症例の増加に寄与しています。加えて、急速な都市化、座りがちなライフスタイル、高カロリーで加工された食品の摂取を含む食事パターンの変化が、この流行にさらに拍車をかけ、市場の成長を後押ししている。
さらに、NASHは先進国に限ったことではなく、発展途上国でも関心が高まっている。これらの国々が急速な経済成長を遂げ、都市化が進み、欧米化されたライフスタイルを採用するにつれ、NASHの有病率も同時に増加している。
承認された治療法の欠如が業界の成長を妨げる
NASHに対する承認された治療法の欠如は近年の持続的な課題であり、患者や医療提供者は限られた治療選択肢しか残されていない。しかし、現在NASHの治療薬として規制当局から承認されている特定の薬剤はない。潜在的な治療法を検討する臨床試験は大きな課題に直面しており、その多くが主要評価項目を達成できなかったり、有効性が限定的であったりする。臨床薬物開発プログラム全体にわたって読影プロセスが標準化されていないことが、試験に失敗する主な原因の一つである。炎症、線維化、代謝経路など、NASH発症に関与する様々なメカニズムを標的とする有望な薬剤候補は、臨床試験から得られた説得力のあるエビデンスが不足しているため、規制当局の承認はまだ得られていないです。
市場調査レポートを購入する前にすべき質問とは?
- NASH治療・治療薬市場はどのように進化しているのか?
- NASH治療・治療薬市場の促進要因と抑制要因は何か?
- NASH治療・治療薬の各サブ市場セグメントは予測期間中にどのように成長し、2033年にはどれくらいの売上を占めるようになるのか?
- 2023年から2033年にかけて、NASH治療・治療薬の各サブマーケットの市場シェアはどのように推移するのか?
- 2023年から2033年にかけて、市場全体の主な牽引役となるのは何か?
- 主要なNASH治療・治療薬市場はマクロ経済の動きに大枠で追随するのか、それとも個々の国内市場が他を凌駕するのか?
- 2033年までに各国市場のシェアはどう変化し、2033年に市場をリードするのはどの地域か?
- 主要プレイヤーは誰で、予測期間中の見通しは?
- これらの大手企業のNASH治療・治療薬プロジェクトは?
- 2023年から2033年にかけて、業界はどのように発展していくのでしょうか?現在および今後10年間に実施されるNASH治療・治療薬プロジェクトにはどのような意味があるのでしょうか?
- NASH治療・治療薬市場をさらに拡大するために、製品化の必要性は高まっているか?
- NASH治療・治療薬市場はどこへ向かい、どのようにすれば市場の最前線に立てるのか?
- 新製品やサービスラインに対する最適な投資オプションは何か?
- 企業を新たな成長軌道に乗せ、C-suiteに移行させるための重要な展望とは?
このことがNASH治療・治療薬市場に現在、そして今後10年間でどのような影響を与えるかを明らかにする必要があります:
- 本レポートは224ページにわたり、78の表と111の図表で構成されています。
- 本レポートでは、業界における主要な有利分野をハイライトしているため、今すぐターゲットを絞ることができます。
- 世界、地域、国の売上と成長に関する詳細な分析が含まれています。
- 競合他社が成功した主なトレンド、変化、収益予測をハイライトしています。
本レポートは、NASH治療・治療薬市場が今後10年間にどのように発展するか、またCOVID-19の景気後退と好転の変動に合わせてどのように発展するかをお伝えします。
2033年までの予測やその他の分析から、商業的な展望が明らかになる
- 2033年までの収益予測に加え、直近の業績、成長率、市場シェアもご覧いただけます。
- ビジネスの展望と展開に関する独自の分析をご覧いただけます。
- 定性的分析(市場ダイナミクス、促進要因、機会、阻害要因、課題など)、コスト構造、NASH治療・治療薬価格上昇の影響、最近の動向などをご覧いただけます。
本レポートには、COVID-19が業界と貴社にどのような影響を与えるかについてのデータ分析と貴重な洞察が含まれている。本レポートでは、COVID-19の4つの回収パターンとその影響、すなわち「V」、「L」、「W」、「U」について論じている。
レポート対象セグメント
製品タイプ
- ビタミンEとピオグリタゾン
- オカリバ
- エラフィブラノール
- セロンセルティブ
- セニクリビロク
- その他
用途
- 治療
- 診断
販売チャネル
- 病院薬局
- オンラインプロバイダー
- 小売薬局
- その他
世界市場全体と各分野の収益予測に加え、5つの地域と24の主要国市場の収益予測も掲載している:
北米
- アメリカ
- カナダ
欧州
- ドイツ
- フランス
- 英国
- イタリア
- スペイン
- ロシア
- その他の欧州
アジア太平洋
- 日本
- 中国
- インド
- オーストラリア
- 韓国
- シンガポール
- その他のアジア太平洋地域
ラテンアメリカ
- ブラジル
- メキシコ
- アルゼンチン
- コロンビア
- その他のラテンアメリカ
MEA
- GCC
- 南アフリカ
- その他のMEA
また、NASH治療・治療薬市場(パイプライン分析)、2023年~2033年における主要企業のプロファイルも掲載しており、これらの企業の事業のこのセグメントに焦点を当てています。
主要企業と市場成長の可能性
・ AbbVie Inc.
・ BioPredictive S.A.S
・ Cadila Pharmaceuticals
・ Enanta
・ Galmed Pharmaceuticals
・ Genentech
・ Genfit
・ Gilead Sciences
・ Intercept Pharmaceuticals
・ Prometheus Laboratories
NASH治療・治療薬市場(パイプライン分析)、2023~2033年の世界全体の売上高は、金額ベースで2023年に46億5,000万米ドルを超えると当研究所は算出した。2033年まで力強い収益成長を予測しています。当研究所では、最大の可能性を秘めた組織を特定する。彼らの能力、進歩、商業的展望を発見し、一歩先を行くお手伝いをします。
2023年から2033年までのNASH治療・治療薬市場(パイプライン分析)レポートはどのようにお役に立ちますか?
要約すると、弊社の220ページ以上のレポートは以下の知識を提供します:
- NASH治療・治療薬市場(パイプライン分析)、2023年から2033年までの収益予測 製品タイプ、用途、販売チャネル、世界・地域レベルの各予測による、NASH治療・治療薬市場の2033年までの収益予測 - 業界の展望を発見し、投資と収益に最も有利な場所を見つけます。
- 5つの地域と24の主要国市場の2033年までの収益予測 - 北米、欧州、アジア太平洋、ラテンアメリカ、MEAのNASH治療・治療薬市場(パイプライン分析)、2023年から2033年までの市場予測をご覧ください。また、米国、カナダ、メキシコ、ブラジル、ドイツ、フランス、英国、イタリア、中国、インド、日本、オーストラリアなどの著名経済圏の市場も予測しています。
- 既存企業および市場参入を目指す企業の展望 - NASH治療・治療薬市場(パイプライン分析)に関与する主要企業10社の企業プロファイルを含む、2023年から2033年までの展望。
独自の予測による定量的・定性的分析をご覧ください。私たちのレポートだけに含まれる情報を入手し、貴重なビジネスインテリジェンスで情報を得ることができます。
他にはない情報
私たちの新しいレポートがあれば、知識に遅れをとったり、チャンスを逃したりする可能性が低くなります。Visiongainの調査レポートが貴社の調査、分析、意思決定にどのように役立つかをご覧ください。Visiongainの調査は、NASH治療・治療薬市場(パイプライン分析)、2023年から2033年、市場をリードする企業の商業分析を必要とするすべての人のためのものです。データ、動向、予測をご覧いただけます。
ページTOPに戻る
目次
目次
1 レポートの概要
1.1 研究の目的
1.2 NASH治療・治療薬市場の紹介(パイプライン分析)
1.3 本レポートの内容
1.4 本レポートを読むべき理由
1.5 本分析レポートが回答する主な質問
1.6 本レポートは誰のためのものか?
1.7 方法論
1.7.1 市場の定義
1.7.2 市場評価・予測手法
1.7.3 データの検証
1.7.3.1 一次調査
1.7.3.2 セカンダリーリサーチ
1.8 よくある質問(FAQ)
1.9 Visiongainの関連レポート
1.10 Visiongainについて
2 エグゼクティブ・サマリー
3 市場概要
3.1 主要な調査結果
3.2 市場ダイナミクス
3.2.1 市場促進要因
3.2.1.1 NASHの有病率の増加
3.2.1.2 意識と診断の高まり
3.2.1.3 医療費の増加
3.2.2 市場抑制要因
3.2.2.1 承認された治療法の欠如
3.2.2.2 複雑な病態
3.2.2.3 臨床試験の失敗
3.2.3 市場機会
3.2.3.1 技術的進歩
3.2.3.2 共同研究およびパートナーシップ
3.2.3.3 診断ツールとバイオマーカー
3.3 COVID-19の影響分析
3.4 ポーターのファイブフォース分析
3.4.1 サプライヤーの交渉力
3.4.2 バイヤーの交渉力
3.4.3 競争相手のライバル関係
3.4.4 代替品による脅威
3.4.5 新規参入企業の脅威
3.5 PEST分析
3.6 医薬品パイプライン分析
4 NASH治療・治療薬市場分析:製品タイプ別
4.1 主要な調査結果
4.2 製品タイプ別NASH治療・治療薬市場(パイプライン分析)規模推定と予測
4.3 ビタミンEとピオグリタゾン
4.4 オカリバ
4.5 エラフィブラノール
4.6 セロンセルティブ
4.7 セニクリビロク
4.8 その他
5 NASH治療・治療薬の用途別市場分析
5.1 主な調査結果
5.2 アプリケーションセグメント 市場魅力度指数
5.3 用途別NASH治療・治療薬市場(パイプライン分析)規模推定と予測
5.4 治療薬
5.4.1 2023〜2033年の地域別市場規模(US$ Million)
5.4.2 地域別市場シェア、2023年・2033年 (%)
5.5 診断
5.5.1 2023~2033年の地域別市場規模(US$ Million)
5.5.2 地域別市場シェア、2023年・2033年 (%)
6 NASH治療・治療薬市場分析:販売チャネル別
6.1 主要調査結果
6.2 販売チャネルセグメント 市場魅力度指数
6.3 販売チャネル別NASH治療・治療薬市場(パイプライン分析)市場規模推定と予測
6.4 病院薬局
6.4.1 2023〜2033年の地域別市場規模(US$ Million)
6.4.2 地域別市場シェア、2023年・2033年(%)
6.5 オンラインプロバイダー
6.5.1 2023~2033年の地域別市場規模(US$ Million)
6.5.2 地域別市場シェア、2023年・2033年(%)
6.6 小売薬局
6.6.1 2023〜2033年の地域別市場規模(US$ Million)
6.6.2 地域別市場シェア、2023年・2033年(%)
6.7 その他
6.7.1 2023〜2033年の地域別市場規模(US$ Million)
6.7.2 地域別市場シェア、2023年・2033年 (%)
7 NASH治療・治療薬市場分析:地域別
7.1 主要な調査結果
7.2 地域別市場規模の推定と予測
8 北米のNASH治療・治療薬市場分析
8.1 主要な調査結果
8.2 北米のNASH治療・治療薬市場(パイプライン分析)魅力度指数
8.3 北米のNASH治療・治療薬市場(パイプライン分析):国別、2023年、2028年、2033年(US$ Million)
8.4 北米のNASH治療・治療薬市場(パイプライン分析)規模推定と予測:国別
8.5 北米のNASH治療・治療薬市場(パイプライン分析)規模推定と予測:用途別
8.6 北米のNASH治療・治療薬市場(パイプライン分析)規模推定と予測:販売チャンネル別
8.7 アメリカのNASH治療・治療薬市場分析
8.8 カナダのNASH治療・治療薬市場分析
9 欧州のNASH治療・治療薬市場分析
9.1 主要な調査結果
9.2 欧州のNASH治療・治療薬市場(パイプライン分析)魅力度指数
9.3 欧州のNASH治療・治療薬市場(パイプライン分析):国別、2023年、2028年、2033年(US$ Million)
9.4 欧州のNASH治療・治療薬市場(パイプライン分析)規模推定と予測:国別
9.5 欧州のNASH治療・治療薬市場(パイプライン分析)規模推定と予測:用途別
9.6 欧州のNASH治療・治療薬市場(パイプライン分析)規模推定と予測:販売チャンネル別
9.7 ドイツのNASH治療・治療薬市場分析
9.8 フランスのNASH治療・治療薬市場分析
9.9 イギリスのNASH治療・治療薬市場分析
9.10 イタリアのNASH治療・治療薬市場分析
9.11 スペインのNASH治療・治療薬市場分析
9.12 ロシアのNASH治療・治療薬市場分析
9.13 その他の欧州のNASH治療・治療薬市場(パイプライン分析)分析
10 アジア太平洋地域のNASH治療・治療薬市場(パイプライン分析)分析
10.1 主要な調査結果
10.2 アジア太平洋地域のNASH治療・治療薬市場(パイプライン分析)魅力度指数
10.3 アジア太平洋地域のNASH治療・治療薬市場(パイプライン分析):国別、2023年、2028年、2033年(US$ Million)
10.4 アジア太平洋地域のNASH治療・治療薬市場(パイプライン分析)規模推定と予測:国別
10.5 アジア太平洋地域のNASH治療・治療薬市場(パイプライン分析)規模推定と予測:用途別
10.6 アジア太平洋地域のNASH治療・治療薬市場(パイプライン分析)規模推定と予測:販売チャンネル別
10.7 日本のNASH治療・治療薬市場分析
10.8 中国のNASH治療・治療薬市場分析
10.9 インドのNASH治療・治療薬市場分析
10.10 オーストラリアのNASH治療・治療薬市場(パイプライン分析)分析
10.11 韓国のNASH治療・治療薬市場分析
10.12 シンガポールのNASH治療・治療薬市場分析
10.13 その他のアジア太平洋地域のNASH治療・治療薬市場分析
11 ラテンアメリカのNASH治療・治療薬市場分析
11.1 主要な調査結果
11.2 ラテンアメリカのNASH治療・治療薬市場(パイプライン分析)魅力度指数
11.3 ラテンアメリカのNASH治療・治療薬市場(パイプライン分析):国別、2023年、2028年、2033年 (US$ Million)
11.4 ラテンアメリカのNASH治療・治療薬市場(パイプライン分析)規模推定と予測:国別
11.5 ラテンアメリカのNASH治療・治療薬市場(パイプライン分析)規模推定と予測:用途別
11.6 ラテンアメリカのNASH治療・治療薬市場(パイプライン分析)規模推定と予測:販売チャンネル別
11.7 ブラジルのNASH治療・治療薬市場分析
11.8 メキシコのNASH治療・治療薬市場分析
11.9 アルゼンチンのNASH治療・治療薬市場分析
11.10 コロンビアのNASH治療・治療薬市場分析
11.11 その他のラテンアメリカのNASH治療・治療薬市場分析
12 中東・アフリカのNASH治療・治療薬市場分析
12.1 主要な調査結果
12.2 中東・アフリカのNASH治療・治療薬市場(パイプライン分析)魅力度指数
12.3 中東・アフリカのNASH治療・治療薬市場(パイプライン分析):国別、2023年、2028年、2033年 (US$ Million)
12.4 中東・アフリカのNASH治療・治療薬市場(パイプライン分析)規模推定と予測:国別
12.5 中東・アフリカのNASH治療・治療薬市場(パイプライン分析)規模推定と予測:用途別
12.6 中東・アフリカのNASH治療・治療薬市場(パイプライン分析)規模推定と予測:販売チャンネル別
12.7 GCCのNASH治療・治療薬市場分析
12.8 南アフリカのNASH治療・治療薬市場分析
12.9 その他の中東・アフリカのNASH治療・治療薬市場分析
13 企業のプロフィール
13.1 競争環境、2022年
13.2 戦略的展望
13.3 Intercept Pharmaceuticals, Inc.
13.3.1 会社概要
13.3.2 会社概要
13.3.3 財務分析
13.3.3.1 純収入、2017-2022年
13.3.3.2 売上高、2017-2022年
13.3.4 製品ベンチマーク
13.3.5 戦略的展望
13.4 Gilead Sciences Inc.
13.4.1 会社概要
13.4.2 会社概要
13.4.3 財務分析
13.4.3.1 .Net収入、2017-2022年
13.4.3.2 R&D、2017-2022年
13.4.3.3 地域市場シェア、2022年
13.4.4 製品ベンチマーク
13.5 Genfit Pharma S.A.S
13.5.1 会社概要
13.5.2 会社概要
13.5.3 財務分析
13.5.3.1 純収入、2017-2022年
13.5.3.2 売上高、2017-2022年
13.5.4 製品ベンチマーク
13.6 BioPredictive S.A.S
13.6.1 会社概要
13.6.2 会社概要
13.6.3 製品ベンチマーク
13.7 Galmed Pharmaceuticals Ltd.
13.7.1 会社概要
13.7.2 会社概要
13.7.3 製品ベンチマーク
13.7.4 戦略的展望
13.8 Cadila Pharmaceuticals Ltd.
13.8.1 会社概要
13.8.2 会社概要
13.8.3 製品ベンチマーク
13.9 Prometheus Laboratories Inc.
13.9.1 会社概要
13.9.2 会社概要
13.9.3 製品ベンチマーク
13.10 AbbVie Inc.
13.10.1 会社概要
13.10.2 会社概要
13.10.3 財務分析
13.10.3.1 純収入、2017-2022年
13.10.3.2 R&D、2017年~2022年
13.10.3.3 地域市場シェア、2022年
13.10.4 製品ベンチマーク
13.10.5 戦略的展望
13.11 Enanta Pharmaceuticals Inc.
13.11.1 会社概要
13.11.2 会社概要
13.11.3 財務分析
13.11.3.1 純収入、2017-2022年
13.11.4 製品ベンチマーク
13.12 Genentech, Inc.
13.12.1 企業スナップショット
13.12.2 会社概要
13.12.3 製品ベンチマーク
14 結論と提言
14.1 Visiongainからの結びの言葉
14.2 市場プレイヤーへの提言
ページTOPに戻る
図表リスト
表の一覧
Table 1 NASH Treatment & Therapeutics Market (Pipeline Analysis) Snapshot, 2023 & 2033 (US$ Million, CAGR %)
Table 2 NASH Treatment & Therapeutics Market (Pipeline Analysis) Forecast by Region, 2023-2033 (US$ Million, AGR%, CAGR%): “V” Shaped Recovery
Table 3 NASH Treatment & Therapeutics Market (Pipeline Analysis) Forecast by Region, 2023-2033 (US$ Million, AGR%, CAGR%): “U” Shaped Recovery
Table 4 NASH Treatment & Therapeutics Market (Pipeline Analysis) Forecast by Region, 2023-2033 (US$ Million, AGR%, CAGR%): “W” Shaped Recovery
Table 5 NASH Treatment & Therapeutics Market (Pipeline Analysis) Forecast by Region, 2023-2033 (US$ Million, AGR%, CAGR%): “L” Shaped Recovery
Table 6 NASH Treatment & Therapeutics Market (Pipeline Analysis) Forecast by Product Type, 2023-2033 (US$ Million, AGR%, CAGR%)
Table 7 NASH Treatment & Therapeutics Market (Pipeline Analysis) Forecast by Application, 2023-2033 (US$ Million, AGR%, CAGR%)
Table 8 Treatment Segment Market Forecast by Region, 2023-2033 (US$ Million, AGR%, CAGR%)
Table 9 Diagnosis Segment Market Forecast by Region, 2023-2033 (US$ Million, AGR%, CAGR%)
Table 10 NASH Treatment & Therapeutics Market (Pipeline Analysis) Forecast by Sales Channel, 2023-2033 (US$ Million, AGR%, CAGR%)
Table 11 Hospital Pharmacy Segment Market Forecast by Region, 2023-2033 (US$ Million, AGR%, CAGR%)
Table 12 Online Provider Segment Market Forecast by Region, 2023-2033 (US$ Million, AGR%, CAGR%)
Table 13 Retail Pharmacy Segment Market Forecast by Region, 2023-2033 (US$ Million, AGR%, CAGR%)
Table 14 Others Segment Market Forecast by Region, 2023-2033 (US$ Million, AGR%, CAGR%)
Table 15 NASH Treatment & Therapeutics Market (Pipeline Analysis) Forecast by Region, 2023-2033 (US$ Million, AGR%, CAGR%)
Table 16 North America NASH Treatment & Therapeutics Market (Pipeline Analysis) Forecast by Country, 2023-2033 (US$ Million, AGR%, CAGR%)
Table 17 North America NASH Treatment & Therapeutics Market (Pipeline Analysis) Forecast by Application, 2023-2033 (US$ Million, AGR%, CAGR%)
Table 18 North America NASH Treatment & Therapeutics Market (Pipeline Analysis) Forecast by Sales Channel, 2023-2033 (US$ Million, AGR%, CAGR%)
Table 19 U.S. NASH Treatment & Therapeutics Market (Pipeline Analysis) Forecast, 2023-2033 (US$ Million, AGR%, CAGR%)
Table 20 Canada NASH Treatment & Therapeutics Market (Pipeline Analysis) Forecast, 2023-2033 (US$ Million, AGR%, CAGR%)
Table 21 Europe NASH Treatment & Therapeutics Market (Pipeline Analysis) Forecast by Country, 2023-2033 (US$ Million, AGR%, CAGR%)
Table 22 Europe NASH Treatment & Therapeutics Market (Pipeline Analysis) Forecast by Application, 2023-2033 (US$ Million, AGR%, CAGR%)
Table 23 Europe NASH Treatment & Therapeutics Market (Pipeline Analysis) Forecast by Sales Channel, 2023-2033 (US$ Million, AGR%, CAGR%)
Table 24 Germany NASH Treatment & Therapeutics Market (Pipeline Analysis) Forecast, 2023-2033 (US$ Million, AGR%, CAGR%)
Table 25 France NASH Treatment & Therapeutics Market (Pipeline Analysis) Forecast, 2023-2033 (US$ Million, AGR%, CAGR%)
Table 26 UK NASH Treatment & Therapeutics Market (Pipeline Analysis) Forecast, 2023-2033 (US$ Million, AGR%, CAGR%)
Table 27 Italy NASH Treatment & Therapeutics Market (Pipeline Analysis) Forecast, 2023-2033 (US$ Million, AGR%, CAGR%)
Table 28 Spain NASH Treatment & Therapeutics Market (Pipeline Analysis) Forecast, 2023-2033 (US$ Million, AGR%, CAGR%)
Table 29 Russia NASH Treatment & Therapeutics Market (Pipeline Analysis) Forecast, 2023-2033 (US$ Million, AGR%, CAGR%)
Table 30 Rest of Europe NASH Treatment & Therapeutics Market (Pipeline Analysis) Forecast, 2023-2033 (US$ Million, AGR%, CAGR%)
Table 31 Asia Pacific NASH Treatment & Therapeutics Market (Pipeline Analysis) Forecast by Country, 2023-2033 (US$ Million, AGR%, CAGR%)
Table 32 Asia Pacific NASH Treatment & Therapeutics Market (Pipeline Analysis) Forecast by Application, 2023-2033 (US$ Million, AGR%, CAGR%)
Table 33 Asia Pacific NASH Treatment & Therapeutics Market (Pipeline Analysis) Forecast by Sales Channel, 2023-2033 (US$ Million, AGR%, CAGR%)
Table 34 Japan NASH Treatment & Therapeutics Market (Pipeline Analysis) Forecast, 2023-2033 (US$ Million, AGR%, CAGR%)
Table 35 China NASH Treatment & Therapeutics Market (Pipeline Analysis) Forecast, 2023-2033 (US$ Million, AGR%, CAGR%)
Table 36 India NASH Treatment & Therapeutics Market (Pipeline Analysis) Forecast, 2023-2033 (US$ Million, AGR%, CAGR%)
Table 37 Australia NASH Treatment & Therapeutics Market (Pipeline Analysis) Forecast, 2023-2033 (US$ Million, AGR%, CAGR%)
Table 38 South Korea NASH Treatment & Therapeutics Market (Pipeline Analysis) Forecast, 2023-2033 (US$ Million, AGR%, CAGR%)
Table 39 Singapore NASH Treatment & Therapeutics Market (Pipeline Analysis) Forecast, 2023-2033 (US$ Million, AGR%, CAGR%)
Table 40 Rest of Asia Pacific NASH Treatment & Therapeutics Market (Pipeline Analysis) Forecast, 2023-2033 (US$ Million, AGR%, CAGR%)
Table 41 Latin America NASH Treatment & Therapeutics Market (Pipeline Analysis) Forecast by Country, 2023-2033 (US$ Million, AGR%, CAGR%)
Table 42 Latin America NASH Treatment & Therapeutics Market (Pipeline Analysis) Forecast by Application, 2023-2033 (US$ Million, AGR%, CAGR%)
Table 43 Latin America NASH Treatment & Therapeutics Market (Pipeline Analysis) Forecast by Sales Channel, 2023-2033 (US$ Million, AGR%, CAGR%)
Table 44 Brazil NASH Treatment & Therapeutics Market (Pipeline Analysis) Forecast, 2023-2033 (US$ Million, AGR%, CAGR%)
Table 45 Mexico NASH Treatment & Therapeutics Market (Pipeline Analysis) Forecast, 2023-2033 (US$ Million, AGR%, CAGR%)
Table 46 Argentina NASH Treatment & Therapeutics Market (Pipeline Analysis) Forecast, 2023-2033 (US$ Million, AGR%, CAGR%)
Table 47 Colombia NASH Treatment & Therapeutics Market (Pipeline Analysis) Forecast, 2023-2033 (US$ Million, AGR%, CAGR%)
Table 48 Rest of Latin America NASH Treatment & Therapeutics Market (Pipeline Analysis) Forecast, 2023-2033 (US$ Million, AGR%, CAGR%)
Table 49 Middle East and Africa NASH Treatment & Therapeutics Market (Pipeline Analysis) Forecast by Country, 2023-2033 (US$ Million, AGR%, CAGR%)
Table 50 Middle East and Africa NASH Treatment & Therapeutics Market (Pipeline Analysis) Forecast by Application, 2023-2033 (US$ Million, AGR%, CAGR%)
Table 51 Middle East and Africa NASH Treatment & Therapeutics Market (Pipeline Analysis) Forecast by Sales Channel, 2023-2033 (US$ Million, AGR%, CAGR%)
Table 52 GCC NASH Treatment & Therapeutics Market (Pipeline Analysis) Forecast, 2023-2033 (US$ Million, AGR%, CAGR%)
Table 53 South Africa NASH Treatment & Therapeutics Market (Pipeline Analysis) Forecast, 2023-2033 (US$ Million, AGR%, CAGR%)
Table 54 Rest of Middle East and Africa NASH Treatment & Therapeutics Market (Pipeline Analysis) Forecast, 2023-2033 (US$ Million, AGR%, CAGR%)
Table 55 Strategic Outlook
Table 56 Intercept Pharmaceuticals, Inc.: Key Details, (CEO, HQ, Revenue, Founded, No. of Employees, Company Type, Website, Business Segment)
Table 57 Intercept Pharmaceuticals, Inc.: Product Benchmarking
Table 58 Intercept Pharmaceuticals, Inc.: Strategic Outlook
Table 59 Gilead Sciences Inc.: Key Details, (CEO, HQ, Revenue, Founded, No. of Employees, Company Type, Website, Business Segment)
Table 60 Gilead Sciences Inc.: Product Benchmarking
Table 61 Genfit Pharma S.A.S: Key Details, (CEO, HQ, Revenue, Founded, No. of Employees, Company Type, Website, Business Segment)
Table 62 Genfit Pharma S.A.S: Product Benchmarking
Table 63 BioPredictive S.A.S: Key Details, (HQ, Company Type, Website, Business Segment)
Table 64 BioPredictive S.A.S: Product Benchmarking
Table 65 Galmed Pharmaceuticals Ltd.: Key Details, (CEO, HQ, Founded, Company Type, Website, Business Segment)
Table 66 Galmed Pharmaceuticals Ltd.: Product Benchmarking
Table 67 Galmed Pharmaceuticals Ltd.: Strategic Outlook
Table 68 Cadila Pharmaceuticals Ltd.: Key Details, (CEO, HQ, Founded, No. of Employees, Company Type, Website, Business Segment)
Table 69 Cadila Pharmaceuticals Ltd.: Product Benchmarking
Table 70 Prometheus Laboratories Inc.: Key Details, (CEO, HQ, Founded, No. of Employees, Company Type, Website, Business Segment)
Table 71 Prometheus Laboratories Inc.: Product Benchmarking
Table 72 AbbVie Inc.: Key Details, (CEO, HQ, Revenue, Founded, No. of Employees, Company Type, Website, Business Segment)
Table 73 AbbVie Inc.: Product Benchmarking
Table 74 AbbVie Inc.: Strategic Outlook
Table 75 Enanta Pharmaceuticals Inc.: Key Details, (CEO, HQ, Revenue, Founded, No. of Employees, Company Type, Website, Business Segment)
Table 76 Enanta Pharmaceuticals Inc.: Product Benchmarking
Table 77 Genentech, Inc.: Key Details, (CEO, HQ, Founded, No. of Employees, Company Type, Website, Business Segment)
Table 78 Genentech, Inc.: Product Benchmarking
図の一覧
Figure 1 NASH Treatment & Therapeutics Market (Pipeline Analysis) Segmentation
Figure 2 NASH Treatment & Therapeutics Market (Pipeline Analysis) by Application: Market Attractiveness Index
Figure 3 NASH Treatment & Therapeutics Market (Pipeline Analysis) by Sales Channel: Market Attractiveness Index
Figure 4 NASH Treatment & Therapeutics Market (Pipeline Analysis) Attractiveness Index by Region
Figure 5 NASH Treatment & Therapeutics Market (Pipeline Analysis): Market Dynamics
Figure 6 NASH Treatment & Therapeutics Market (Pipeline Analysis) by Region, 2023-2033 (US$ Million, AGR %): “V” Shaped Recovery
Figure 7 NASH Treatment & Therapeutics Market (Pipeline Analysis) by Region, 2023-2033 (US$ Million, AGR %): “U” Shaped Recovery
Figure 8 NASH Treatment & Therapeutics Market (Pipeline Analysis) by Region, 2023-2033 (US$ Million, AGR %): “W” Shaped Recovery
Figure 9 NASH Treatment & Therapeutics Market (Pipeline Analysis) by Region, 2023-2033 (US$ Million, AGR %): “L” Shaped Recovery
Figure 10 NASH Treatment & Therapeutics Market (Pipeline Analysis): Porter’s Five Forces Analysis
Figure 11 NASH Treatment & Therapeutics Market (Pipeline Analysis): PEST Analysis
Figure 12 NASH Treatment & Therapeutics Market (Pipeline Analysis): Drug Pipeline Analysis
Figure 13 NASH Treatment & Therapeutics Market (Pipeline Analysis) Forecast by Product Type, 2023-2033 (US$ Million, AGR %)
Figure 14 NASH Treatment & Therapeutics Market (Pipeline Analysis) Share Forecast by Product Type, 2023, 2028, 2033 (%)
Figure 15 NASH Treatment & Therapeutics Market (Pipeline Analysis) by Application: Market Attractiveness Index
Figure 16 NASH Treatment & Therapeutics Market (Pipeline Analysis) Forecast by Application, 2023-2033 (US$ Million, AGR %)
Figure 17 NASH Treatment & Therapeutics Market (Pipeline Analysis) Share Forecast by Application, 2023, 2028, 2033 (%)
Figure 18 Treatment Segment Market Forecast by Region, 2023-2033 (US$ Million, AGR %)
Figure 19 Treatment Segment Market Share Forecast by Region, 2023 & 2033 (%)
Figure 20 Diagnosis Segment Market Forecast by Region, 2023-2033 (US$ Million, AGR %)
Figure 21 Diagnosis Segment Market Share Forecast by Region, 2023 & 2033 (%)
Figure 22 NASH Treatment & Therapeutics Market (Pipeline Analysis) by Sales Channel: Market Attractiveness Index
Figure 23 NASH Treatment & Therapeutics Market (Pipeline Analysis) Forecast by Sales Channel, 2023-2033 (US$ Million, AGR %)
Figure 24 NASH Treatment & Therapeutics Market (Pipeline Analysis) Share Forecast by Sales Channel, 2023, 2028, 2033 (%)
Figure 25 Hospital Pharmacy Segment Market Forecast by Region, 2023-2033 (US$ Million, AGR %)
Figure 26 Hospital Pharmacy Segment Market Share Forecast by Region, 2023 & 2033 (%)
Figure 27 Online Provider Segment Market Forecast by Region, 2023-2033 (US$ Million, AGR %)
Figure 28 Online Provider Segment Market Share Forecast by Region, 2023 & 2033 (%)
Figure 29 Retail Pharmacy Segment Market Forecast by Region, 2023-2033 (US$ Million, AGR %)
Figure 30 Retail Pharmacy Segment Market Share Forecast by Region, 2023 & 2033 (%)
Figure 31 Others Segment Market Forecast by Region, 2023-2033 (US$ Million, AGR %)
Figure 32 Others Segment Market Share Forecast by Region, 2023 & 2033 (%)
Figure 33 NASH Treatment & Therapeutics Market (Pipeline Analysis) Forecast by Region 2023 and 2033 (Revenue, CAGR%)
Figure 34 NASH Treatment & Therapeutics Market (Pipeline Analysis) Share Forecast by Region 2023, 2028, 2033 (%)
Figure 35 NASH Treatment & Therapeutics Market (Pipeline Analysis) by Region, 2023-2033 (US$ Million, AGR %)
Figure 36 North America NASH Treatment & Therapeutics Market (Pipeline Analysis) Attractiveness Index
Figure 37 North America NASH Treatment & Therapeutics Market (Pipeline Analysis) by Region, 2023, 2028 & 2033 (US$ Million)
Figure 38 North America NASH Treatment & Therapeutics Market (Pipeline Analysis) Forecast by Country, 2023-2033 (US$ Million, AGR %)
Figure 39 North America NASH Treatment & Therapeutics Market (Pipeline Analysis) Share Forecast by Country, 2023 & 2033 (%)
Figure 40 North America NASH Treatment & Therapeutics Market (Pipeline Analysis) Forecast by Application, 2023-2033 (US$ Million, AGR %)
Figure 41 North America NASH Treatment & Therapeutics Market (Pipeline Analysis) Share Forecast by Application, 2023 & 2033 (%)
Figure 42 North America NASH Treatment & Therapeutics Market (Pipeline Analysis) Forecast by Sales Channel, 2023-2033 (US$ Million, AGR %)
Figure 43 North America NASH Treatment & Therapeutics Market (Pipeline Analysis) Share Forecast by Sales Channel, 2023 & 2033 (%)
Figure 44 U.S. NASH Treatment & Therapeutics Market (Pipeline Analysis) Forecast, 2023-2033 (US$ Million, AGR %)
Figure 45 Canada NASH Treatment & Therapeutics Market (Pipeline Analysis) Forecast, 2023-2033 (US$ Million, AGR %)
Figure 46 Europe NASH Treatment & Therapeutics Market (Pipeline Analysis) Attractiveness Index
Figure 47 Europe NASH Treatment & Therapeutics Market (Pipeline Analysis) by Region, 2023, 2028 & 2033 (US$ Million)
Figure 48 Europe NASH Treatment & Therapeutics Market (Pipeline Analysis) Forecast by Country, 2023-2033 (US$ Million, AGR %)
Figure 49 Europe NASH Treatment & Therapeutics Market (Pipeline Analysis) Share Forecast by Country, 2023 & 2033 (%)
Figure 50 Europe NASH Treatment & Therapeutics Market (Pipeline Analysis) Forecast by Application, 2023-2033 (US$ Million, AGR %)
Figure 51 Europe NASH Treatment & Therapeutics Market (Pipeline Analysis) Share Forecast by Application, 2023 & 2033 (%)
Figure 52 Europe NASH Treatment & Therapeutics Market (Pipeline Analysis) Forecast by Sales Channel, 2023-2033 (US$ Million, AGR %)
Figure 53 Europe NASH Treatment & Therapeutics Market (Pipeline Analysis) Share Forecast by Sales Channel, 2023 & 2033 (%)
Figure 54 Germany NASH Treatment & Therapeutics Market (Pipeline Analysis) Forecast, 2023-2033 (US$ Million, AGR %)
Figure 55 France NASH Treatment & Therapeutics Market (Pipeline Analysis) Forecast, 2023-2033 (US$ Million, AGR %)
Figure 56 UK NASH Treatment & Therapeutics Market (Pipeline Analysis) Forecast, 2023-2033 (US$ Million, AGR %)
Figure 57 Italy NASH Treatment & Therapeutics Market (Pipeline Analysis) Forecast, 2023-2033 (US$ Million, AGR %)
Figure 58 Spain NASH Treatment & Therapeutics Market (Pipeline Analysis) Forecast, 2023-2033 (US$ Million, AGR %)
Figure 59 Russia NASH Treatment & Therapeutics Market (Pipeline Analysis) Forecast, 2023-2033 (US$ Million, AGR %)
Figure 60 Rest of Europe NASH Treatment & Therapeutics Market (Pipeline Analysis) Forecast, 2023-2033 (US$ Million, AGR %)
Figure 61 Asia Pacific NASH Treatment & Therapeutics Market (Pipeline Analysis) Attractiveness Index
Figure 62 Asia Pacific NASH Treatment & Therapeutics Market (Pipeline Analysis) by Region, 2023, 2028 & 2033 (US$ Million)
Figure 63 Asia Pacific NASH Treatment & Therapeutics Market (Pipeline Analysis) Forecast by Country, 2023-2033 (US$ Million, AGR %)
Figure 64 Asia Pacific NASH Treatment & Therapeutics Market (Pipeline Analysis) Share Forecast by Country, 2023 & 2033 (%)
Figure 65 Asia Pacific NASH Treatment & Therapeutics Market (Pipeline Analysis) Forecast by Application, 2023-2033 (US$ Million, AGR %)
Figure 66 Asia Pacific NASH Treatment & Therapeutics Market (Pipeline Analysis) Share Forecast by Application, 2023 & 2033 (%)
Figure 67 Asia Pacific NASH Treatment & Therapeutics Market (Pipeline Analysis) Forecast by Sales Channel, 2023-2033 (US$ Million, AGR %)
Figure 68 Asia Pacific NASH Treatment & Therapeutics Market (Pipeline Analysis) Share Forecast by Sales Channel, 2023 & 2033 (%)
Figure 69 Japan NASH Treatment & Therapeutics Market (Pipeline Analysis) Forecast, 2023-2033 (US$ Million, AGR %)
Figure 70 China NASH Treatment & Therapeutics Market (Pipeline Analysis) Forecast, 2023-2033 (US$ Million, AGR %)
Figure 71 India NASH Treatment & Therapeutics Market (Pipeline Analysis) Forecast, 2023-2033 (US$ Million, AGR %)
Figure 72 Australia NASH Treatment & Therapeutics Market (Pipeline Analysis) Forecast, 2023-2033 (US$ Million, AGR %)
Figure 73 South Korea NASH Treatment & Therapeutics Market (Pipeline Analysis) Forecast, 2023-2033 (US$ Million, AGR %)
Figure 74 Singapore NASH Treatment & Therapeutics Market (Pipeline Analysis) Forecast, 2023-2033 (US$ Million, AGR %)
Figure 75 Rest of Asia Pacific NASH Treatment & Therapeutics Market (Pipeline Analysis) Forecast, 2023-2033 (US$ Million, AGR %)
Figure 76 Latin America NASH Treatment & Therapeutics Market (Pipeline Analysis) Attractiveness Index
Figure 77 Latin America NASH Treatment & Therapeutics Market (Pipeline Analysis) by Region, 2023, 2028 & 2033 (US$ Million)
Figure 78 Latin America NASH Treatment & Therapeutics Market (Pipeline Analysis) Forecast by Country, 2023-2033 (US$ Million, AGR %)
Figure 79 Latin America NASH Treatment & Therapeutics Market (Pipeline Analysis) Share Forecast by Country, 2023 & 2033 (%)
Figure 80 Latin America NASH Treatment & Therapeutics Market (Pipeline Analysis) Forecast by Application, 2023-2033 (US$ Million, AGR %)
Figure 81 Latin America NASH Treatment & Therapeutics Market (Pipeline Analysis) Share Forecast by Application, 2023 & 2033 (%)
Figure 82 Latin America NASH Treatment & Therapeutics Market (Pipeline Analysis) Forecast by Sales Channel, 2023-2033 (US$ Million, AGR %)
Figure 83 Latin America NASH Treatment & Therapeutics Market (Pipeline Analysis) Share Forecast by Sales Channel, 2023 & 2033 (%)
Figure 84 Brazil NASH Treatment & Therapeutics Market (Pipeline Analysis) Forecast, 2023-2033 (US$ Million, AGR %)
Figure 85 Mexico NASH Treatment & Therapeutics Market (Pipeline Analysis) Forecast, 2023-2033 (US$ Million, AGR %)
Figure 86 Argentina NASH Treatment & Therapeutics Market (Pipeline Analysis) Forecast, 2023-2033 (US$ Million, AGR %)
Figure 87 Colombia NASH Treatment & Therapeutics Market (Pipeline Analysis) Forecast, 2023-2033 (US$ Million, AGR %)
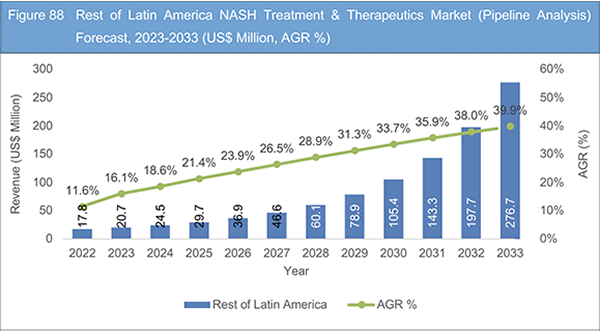
Figure 88 Rest of Latin America NASH Treatment & Therapeutics Market (Pipeline Analysis) Forecast, 2023-2033 (US$ Million, AGR %)
Figure 89 Middle East and Africa NASH Treatment & Therapeutics Market (Pipeline Analysis) Attractiveness Index
Figure 90 Middle East and Africa NASH Treatment & Therapeutics Market (Pipeline Analysis) by Region, 2023, 2028 & 2033 (US$ Million)
Figure 91 Middle East and Africa NASH Treatment & Therapeutics Market (Pipeline Analysis) Forecast by Country, 2023-2033 (US$ Million, AGR %)
Figure 92 Middle East and Africa NASH Treatment & Therapeutics Market (Pipeline Analysis) Share Forecast by Country, 2023 & 2033 (%)
Figure 93 Middle East and Africa NASH Treatment & Therapeutics Market (Pipeline Analysis) Forecast by Application, 2023-2033 (US$ Million, AGR %)
Figure 94 Middle East and Africa NASH Treatment & Therapeutics Market (Pipeline Analysis) Share Forecast by Application, 2023 & 2033 (%)
Figure 95 Middle East and Africa NASH Treatment & Therapeutics Market (Pipeline Analysis) Forecast by Sales Channel, 2023-2033 (US$ Million, AGR %)
Figure 96 Middle East and Africa NASH Treatment & Therapeutics Market (Pipeline Analysis) Share Forecast by Sales Channel, 2023 & 2033 (%)
Figure 97 GCC NASH Treatment & Therapeutics Market (Pipeline Analysis) Forecast, 2023-2033 (US$ Million, AGR %)
Figure 98 South Africa NASH Treatment & Therapeutics Market (Pipeline Analysis) Forecast, 2023-2033 (US$ Million, AGR %)
Figure 99 Rest of Middle East and Africa NASH Treatment & Therapeutics Market (Pipeline Analysis) Forecast, 2023-2033 (US$ Million, AGR %)
Figure 100 NASH Treatment & Therapeutics Market (Pipeline Analysis): Company Share/Ranking, 2022
Figure 101 Intercept Pharmaceuticals, Inc.: Net Revenue, 2017-2022 (US$ Million, AGR%)
Figure 102 Intercept Pharmaceuticals, Inc.: R&D, 2017-2022 (US$ Million, AGR%)
Figure 103 Gilead Sciences Inc.: Net Revenue, 2017-2022 (US$ Million, AGR%)
Figure 104 Gilead Sciences Inc.: R&D, 2017-2022 (US$ Million, AGR%)
Figure 105 Gilead Sciences Inc.: Regional Market Shares, 2022
Figure 106 Genfit Pharma S.A.S: Net Revenue, 2017-2022 (US$ Million, AGR%)
Figure 107 Genfit Pharma S.A.S: R&D, 2017-2022 (US$ Million, AGR%)
Figure 108 AbbVie Inc.: Net Revenue, 2017-2022 (US$ Million, AGR%)
Figure 109 AbbVie Inc.: R&D, 2017-2022 (US$ Million, AGR%)
Figure 110 AbbVie Inc.: Regional Market Shares, 2022
Figure 111 Enanta Pharmaceuticals Inc.: Net Revenue, 2017-2022 (US$ Million, AGR%)
ページTOPに戻る
Summary
Report Details
The NASH Treatment & Therapeutics Market Report 2023-2033: This report will prove invaluable to leading firms striving for new revenue pockets if they wish to better understand the industry and its underlying dynamics. It will be useful for companies that would like to expand into different industries or to expand their existing operations in a new region.
Increasing Prevalence of Non-alcoholic Steatohepatitis (NASH) Driving Market Growth
Some of the major forces propelling the NASH Treatment & Therapeutics market include increasing prevalence of NASH among the population, especially in developing countries. Moreover, Studies indicate a substantial rise in the incidence and prevalence of NASH, making it a significant public health issues, which is further expected to propel market growth. On the other hand, in developed countries such as the United States and Europe, NASH has emerged as the leading cause of chronic liver disease, surpassing hepatitis C. The prevalence of obesity, type 2 diabetes, and metabolic syndrome, all risk factors for NASH, has been steadily increasing, contributing to the rise in NASH cases. In addition, rapid urbanization, sedentary lifestyles, and changes in dietary patterns, including the consumption of high-calorie, processed foods, have further fuelled the epidemic and bolstered market growth.
Furthermore, NASH is not limited to developed nations but has also become a growing concern in developing countries. As these countries undergo rapid economic growth, urbanization, and the adoption of Westernized lifestyles, there has been a simultaneous increase in the prevalence of NASH.
Lack of Approved Therapies to Hamper Industry Growth
The lack of approved therapies for NASH has been a persistent challenge in recent years, leaving patients and healthcare providers with limited treatment options. However, there are currently no specific medications approved by regulatory authorities for the treatment of NASH. Clinical trials investigating potential treatments have faced significant challenges, with many failing to meet primary endpoints or demonstrating limited efficacy. Lack of standardization of the reading process across clinical drug development programs is one of the main reasons for failing trials. Promising drug candidates targeting various mechanisms involved in NASH pathogenesis, such as inflammation, fibrosis, and metabolic pathways, have not yet received regulatory approval due to a lack of compelling evidence from clinical studies.
What Questions Should You Ask before Buying a Market Research Report?
• How is the NASH Treatment & Therapeutics market evolving?
• What is driving and restraining the NASH Treatment & Therapeutics market?
• How will each NASH Treatment & Therapeutics submarket segment grow over the forecast period and how much revenue will these submarkets account for in 2033?
• How will the market shares for each NASH Treatment & Therapeutics submarket develop from 2023 to 2033?
• What will be the main driver for the overall market from 2023 to 2033?
• Will leading NASH Treatment & Therapeutics markets broadly follow the macroeconomic dynamics, or will individual national markets outperform others?
• How will the market shares of the national markets change by 2033 and which geographical region will lead the market in 2033?
• Who are the leading players and what are their prospects over the forecast period?
• What are the NASH Treatment & Therapeutics projects for these leading companies?
• How will the industry evolve during the period between 2023 and 2033? What are the implications of NASH Treatment & Therapeutics projects taking place now and over the next 10 years?
• Is there a greater need for product commercialisation to further scale the NASH Treatment & Therapeutics market?
• Where is the NASH Treatment & Therapeutics market heading and how can you ensure you are at the forefront of the market?
• What are the best investment options for new product and service lines?
• What are the key prospects for moving companies into a new growth path and C-suite?
You need to discover how this will impact the NASH Treatment & Therapeutics market today, and over the next 10 years:
• Our 224-page report provides 78 tables and 111 charts/graphs exclusively to you.
• The report highlights key lucrative areas in the industry so you can target them – NOW.
• It contains in-depth analysis of global, regional and national sales and growth.
• It highlights for you the key successful trends, changes and revenue projections made by your competitors.
This report tells you TODAY how the NASH Treatment & Therapeutics market will develop in the next 10 years, and in line with the variations in COVID-19 economic recession and bounce. This market is more critical now than at any point over the last 10 years.
Forecasts to 2033 and other analyses reveal commercial prospects
• In addition to revenue forecasting to 2033, our new study provides you with recent results, growth rates, and market shares.
• You will find original analyses, with business outlooks and developments.
• Discover qualitative analyses (including market dynamics, drivers, opportunities, restraints and challenges), cost structure, impact of rising NASH Treatment & Therapeutics prices and recent developments.
This report includes data analysis and invaluable insight into how COVID-19 will affect the industry and your company. Four COVID-19 recovery patterns and their impact, namely, “V”, “L”, “W” and “U” are discussed in this report.
Segments Covered in the Report
Product Type
• Vitamin E and Pioglitazone
• Ocaliva
• Elafibranor
• Selonsertib
• Cenicriviroc
• Others
Application
• Treatment
• Diagnosis
Sales Channel
• Hospital Pharmacy
• Online Provider
• Retail Pharmacy
• Others
In addition to the revenue predictions for the overall world market and segments, you will also find revenue forecasts for five regional and 24 leading national markets:
North America
• U.S.
• Canada
Europe
• Germany
• France
• UK
• Italy
• Spain
• Russia
• Rest of Europe
Asia Pacific
• Japan
• China
• India
• Australia
• South Korea
• Singapore
• Rest of Asia Pacific
Latin America
• Brazil
• Mexico
• Argentina
• Colombia
• Rest of Latin America
MEA
• GCC
• South Africa
• Rest of MEA
The report also includes profiles and for some of the leading companies in the NASH Treatment & Therapeutics Market (Pipeline Analysis), 2023 to 2033, with a focus on this segment of these companies’ operations.
Leading companies and the potential for market growth
• AbbVie Inc.
• BioPredictive S.A.S
• Cadila Pharmaceuticals
• Enanta
• Galmed Pharmaceuticals
• Genentech
• Genfit
• Gilead Sciences
• Intercept Pharmaceuticals
• Prometheus Laboratories
Overall world revenue for NASH Treatment & Therapeutics Market (Pipeline Analysis), 2023 to 2033 in terms of value the market will surpass US$4,650 million in 2023, our work calculates. We predict strong revenue growth through to 2033. Our work identifies which organizations hold the greatest potential. Discover their capabilities, progress, and commercial prospects, helping you stay ahead.
How will the NASH Treatment & Therapeutics Market (Pipeline Analysis), 2023 to 2033 report help you?
In summary, our 220+ page report provides you with the following knowledge:
• Revenue forecasts to 2033 for NASH Treatment & Therapeutics Market (Pipeline Analysis), 2023 to 2033 Market, with forecasts for product type, application, sales channel, each forecast at a global and regional level – discover the industry’s prospects, finding the most lucrative places for investments and revenues.
• Revenue forecasts to 2033 for five regional and 24 key national markets – See forecasts for the NASH Treatment & Therapeutics Market (Pipeline Analysis), 2023 to 2033 market in North America, Europe, Asia-Pacific, Latin America, and MEA. Also forecasted is the market in the US, Canada, Mexico, Brazil, Germany, France, UK, Italy, China, India, Japan, and Australia among other prominent economies.
• Prospects for established firms and those seeking to enter the market – including company profiles for 10 of the major companies involved in the NASH Treatment & Therapeutics Market (Pipeline Analysis), 2023 to 2033.
Find quantitative and qualitative analyses with independent predictions. Receive information that only our report contains, staying informed with invaluable business intelligence.
Information found nowhere else
With our new report, you are less likely to fall behind in knowledge or miss out on opportunities. See how our work could benefit your research, analyses, and decisions. Visiongain’s study is for everybody needing commercial analyses for the NASH Treatment & Therapeutics Market (Pipeline Analysis), 2023 to 2033, market-leading companies. You will find data, trends and predictions.
ページTOPに戻る
Table of Contents
Table of Contents
1 Report Overview
1.1 Objectives of the Study
1.2 Introduction to NASH Treatment & Therapeutics Market (Pipeline Analysis)
1.3 What This Report Delivers
1.4 Why You Should Read This Report
1.5 Key Questions Answered by This Analytical Report
1.6 Who is This Report for?
1.7 Methodology
1.7.1 Market Definitions
1.7.2 Market Evaluation & Forecasting Methodology
1.7.3 Data Validation
1.7.3.1 Primary Research
1.7.3.2 Secondary Research
1.8 Frequently Asked Questions (FAQs)
1.9 Associated Visiongain Reports
1.10 About Visiongain
2 Executive Summary
3 Market Overview
3.1 Key Findings
3.2 Market Dynamics
3.2.1 Market Driving Factors
3.2.1.1 Increasing Prevalence of NASH
3.2.1.2 Growing Awareness and Diagnosis
3.2.1.3 Increasing Healthcare Expenditure
3.2.2 Market Restraining Factors
3.2.2.1 Lack of Approved Therapies
3.2.2.2 Complex Disease Pathogenesis
3.2.2.3 Clinical Trial Failures
3.2.3 Market Opportunities
3.2.3.1 Technological Advancements
3.2.3.2 Collaborations and Partnerships
3.2.3.3 Diagnostic Tools and Biomarkers
3.3 COVID-19 Impact Analysis
3.4 Porter’s Five Forces Analysis
3.4.1 Bargaining Power of Suppliers
3.4.2 Bargaining Power of Buyers
3.4.3 Competitive Rivalry
3.4.4 Threat from Substitutes
3.4.5 Threat of New Entrants
3.5 PEST Analysis
3.6 Drug Pipeline Analysis
4 NASH Treatment & Therapeutics Market Analysis by Product Type
4.1 Key Findings
4.2 NASH Treatment & Therapeutics Market (Pipeline Analysis) Size Estimation and Forecast by Product Type
4.3 Vitamin E and Pioglitazone
4.4 Ocaliva
4.5 Elafibranor
4.6 Selonsertib
4.7 Cenicriviroc
4.8 Others
5 NASH Treatment & Therapeutics Market Analysis by Application
5.1 Key Findings
5.2 Application Segment: Market Attractiveness Index
5.3 NASH Treatment & Therapeutics Market (Pipeline Analysis) Size Estimation and Forecast by Application
5.4 Treatment
5.4.1 Market Size by Region, 2023-2033 (US$ Million)
5.4.2 Market Share by Region, 2023 & 2033 (%)
5.5 Diagnosis
5.5.1 Market Size by Region, 2023-2033 (US$ Million)
5.5.2 Market Share by Region, 2023 & 2033 (%)
6 NASH Treatment & Therapeutics Market Analysis by Sales Channel
6.1 Key Findings
6.2 Sales Channel Segment: Market Attractiveness Index
6.3 NASH Treatment & Therapeutics Market (Pipeline Analysis) Size Estimation and Forecast by Sales Channel
6.4 Hospital Pharmacy
6.4.1 Market Size by Region, 2023-2033 (US$ Million)
6.4.2 Market Share by Region, 2023 & 2033 (%)
6.5 Online Provider
6.5.1 Market Size by Region, 2023-2033 (US$ Million)
6.5.2 Market Share by Region, 2023 & 2033 (%)
6.6 Retail Pharmacy
6.6.1 Market Size by Region, 2023-2033 (US$ Million)
6.6.2 Market Share by Region, 2023 & 2033 (%)
6.7 Others
6.7.1 Market Size by Region, 2023-2033 (US$ Million)
6.7.2 Market Share by Region, 2023 & 2033 (%)
7 NASH Treatment & Therapeutics Market Analysis by Region
7.1 Key Findings
7.2 Regional Market Size Estimation and Forecast
8 North America NASH Treatment & Therapeutics Market Analysis
8.1 Key Findings
8.2 North America NASH Treatment & Therapeutics Market (Pipeline Analysis) Attractiveness Index
8.3 North America NASH Treatment & Therapeutics Market (Pipeline Analysis) by Country, 2023, 2028 & 2033 (US$ Million)
8.4 North America NASH Treatment & Therapeutics Market (Pipeline Analysis) Size Estimation and Forecast by Country
8.5 North America NASH Treatment & Therapeutics Market (Pipeline Analysis) Size Estimation and Forecast by Application
8.6 North America NASH Treatment & Therapeutics Market (Pipeline Analysis) Size Estimation and Forecast by Sales Channel
8.7 U.S. NASH Treatment & Therapeutics Market Analysis
8.8 Canada NASH Treatment & Therapeutics Market Analysis
9 Europe NASH Treatment & Therapeutics Market Analysis
9.1 Key Findings
9.2 Europe NASH Treatment & Therapeutics Market (Pipeline Analysis) Attractiveness Index
9.3 Europe NASH Treatment & Therapeutics Market (Pipeline Analysis) by Country, 2023, 2028 & 2033 (US$ Million)
9.4 Europe NASH Treatment & Therapeutics Market (Pipeline Analysis) Size Estimation and Forecast by Country
9.5 Europe NASH Treatment & Therapeutics Market (Pipeline Analysis) Size Estimation and Forecast by Application
9.6 Europe NASH Treatment & Therapeutics Market (Pipeline Analysis) Size Estimation and Forecast by Sales Channel
9.7 Germany NASH Treatment & Therapeutics Market Analysis
9.8 France NASH Treatment & Therapeutics Market Analysis
9.9 UK NASH Treatment & Therapeutics Market Analysis
9.10 Italy NASH Treatment & Therapeutics Market Analysis
9.11 Spain NASH Treatment & Therapeutics Market Analysis
9.12 Russia NASH Treatment & Therapeutics Market Analysis
9.13 Rest of Europe NASH Treatment & Therapeutics Market (Pipeline Analysis) Analysis
10 Asia Pacific NASH Treatment & Therapeutics Market (Pipeline Analysis) analysis
10.1 Key Findings
10.2 Asia Pacific NASH Treatment & Therapeutics Market (Pipeline Analysis) Attractiveness Index
10.3 Asia Pacific NASH Treatment & Therapeutics Market (Pipeline Analysis) by Country, 2023, 2028 & 2033 (US$ Million)
10.4 Asia Pacific NASH Treatment & Therapeutics Market (Pipeline Analysis) Size Estimation and Forecast by Country
10.5 Asia Pacific NASH Treatment & Therapeutics Market (Pipeline Analysis) Size Estimation and Forecast by Application
10.6 Asia Pacific NASH Treatment & Therapeutics Market (Pipeline Analysis) Size Estimation and Forecast by Sales Channel
10.7 Japan NASH Treatment & Therapeutics Market Analysis
10.8 China NASH Treatment & Therapeutics Market Analysis
10.9 India NASH Treatment & Therapeutics Market Analysis
10.10 Australia NASH Treatment & Therapeutics Market (Pipeline Analysis) Analysis
10.11 South Korea NASH Treatment & Therapeutics Market Analysis
10.12 Singapore NASH Treatment & Therapeutics Market Analysis
10.13 Rest of Asia Pacific NASH Treatment & Therapeutics Market Analysis
11 Latin America NASH Treatment & Therapeutics Market Analysis
11.1 Key Findings
11.2 Latin America NASH Treatment & Therapeutics Market (Pipeline Analysis) Attractiveness Index
11.3 Latin America NASH Treatment & Therapeutics Market (Pipeline Analysis) by Country, 2023, 2028 & 2033 (US$ Million)
11.4 Latin America NASH Treatment & Therapeutics Market (Pipeline Analysis) Size Estimation and Forecast by Country
11.5 Latin America NASH Treatment & Therapeutics Market (Pipeline Analysis) Size Estimation and Forecast by Application
11.6 Latin America NASH Treatment & Therapeutics Market (Pipeline Analysis) Size Estimation and Forecast by Sales Channel
11.7 Brazil NASH Treatment & Therapeutics Market Analysis
11.8 Mexico NASH Treatment & Therapeutics Market Analysis
11.9 Argentina NASH Treatment & Therapeutics Market Analysis
11.10 Colombia NASH Treatment & Therapeutics Market Analysis
11.11 Rest of Latin America NASH Treatment & Therapeutics Market Analysis
12 Middle East and Africa NASH Treatment & Therapeutics Market Analysis
12.1 Key Findings
12.2 Middle East and Africa NASH Treatment & Therapeutics Market (Pipeline Analysis) Attractiveness Index
12.3 Middle East and Africa NASH Treatment & Therapeutics Market (Pipeline Analysis) by Country, 2023, 2028 & 2033 (US$ Million)
12.4 Middle East and Africa NASH Treatment & Therapeutics Market (Pipeline Analysis) Size Estimation and Forecast by Country
12.5 Middle East and Africa NASH Treatment & Therapeutics Market (Pipeline Analysis) Size Estimation and Forecast by Application
12.6 Middle East and Africa NASH Treatment & Therapeutics Market (Pipeline Analysis) Size Estimation and Forecast by Sales Channel
12.7 GCC NASH Treatment & Therapeutics Market Analysis
12.8 South Africa NASH Treatment & Therapeutics Market Analysis
12.9 Rest of Middle East and Africa NASH Treatment & Therapeutics Market Analysis
13 Company Profiles
13.1 Competitive Landscape, 2022
13.2 Strategic Outlook
13.3 Intercept Pharmaceuticals, Inc.
13.3.1 Company Snapshot
13.3.2 Company Overview
13.3.3 Financial Analysis
13.3.3.1 Net Revenue, 2017-2022
13.3.3.2 R&D, 2017-2022
13.3.4 Product Benchmarking
13.3.5 Strategic Outlook
13.4 Gilead Sciences Inc.
13.4.1 Company Snapshot
13.4.2 Company Overview
13.4.3 Financial Analysis
13.4.3.1 .Net Revenue, 2017-2022
13.4.3.2 R&D, 2017-2022
13.4.3.3 Regional Market Shares, 2022
13.4.4 Product Benchmarking
13.5 Genfit Pharma S.A.S
13.5.1 Company Snapshot
13.5.2 Company Overview
13.5.3 Financial Analysis
13.5.3.1 Net Revenue, 2017-2022
13.5.3.2 R&D, 2017-2022
13.5.4 Product Benchmarking
13.6 BioPredictive S.A.S
13.6.1 Company Snapshot
13.6.2 Company Overview
13.6.3 Product Benchmarking
13.7 Galmed Pharmaceuticals Ltd.
13.7.1 Company Snapshot
13.7.2 Company Overview
13.7.3 Product Benchmarking
13.7.4 Strategic Outlook
13.8 Cadila Pharmaceuticals Ltd.
13.8.1 Company Snapshot
13.8.2 Company Overview
13.8.3 Product Benchmarking
13.9 Prometheus Laboratories Inc.
13.9.1 Company Snapshot
13.9.2 Company Overview
13.9.3 Product Benchmarking
13.10 AbbVie Inc.
13.10.1 Company Snapshot
13.10.2 Company Overview
13.10.3 Financial Analysis
13.10.3.1 Net Revenue, 2017-2022
13.10.3.2 R&D, 2017-2022
13.10.3.3 Regional Market Shares, 2022
13.10.4 Product Benchmarking
13.10.5 Strategic Outlook
13.11 Enanta Pharmaceuticals Inc.
13.11.1 Company Snapshot
13.11.2 Company Overview
13.11.3 Financial Analysis
13.11.3.1 Net Revenue, 2017-2022
13.11.4 Product Benchmarking
13.12 Genentech, Inc.
13.12.1 Company Snapshot
13.12.2 Company Overview
13.12.3 Product Benchmarking
14 Conclusion and Recommendations
14.1 Concluding Remarks from Visiongain
14.2 Recommendations for Market Players
ページTOPに戻る
List of Tables/Graphs
List of Tables
Table 1 NASH Treatment & Therapeutics Market (Pipeline Analysis) Snapshot, 2023 & 2033 (US$ Million, CAGR %)
Table 2 NASH Treatment & Therapeutics Market (Pipeline Analysis) Forecast by Region, 2023-2033 (US$ Million, AGR%, CAGR%): “V” Shaped Recovery
Table 3 NASH Treatment & Therapeutics Market (Pipeline Analysis) Forecast by Region, 2023-2033 (US$ Million, AGR%, CAGR%): “U” Shaped Recovery
Table 4 NASH Treatment & Therapeutics Market (Pipeline Analysis) Forecast by Region, 2023-2033 (US$ Million, AGR%, CAGR%): “W” Shaped Recovery
Table 5 NASH Treatment & Therapeutics Market (Pipeline Analysis) Forecast by Region, 2023-2033 (US$ Million, AGR%, CAGR%): “L” Shaped Recovery
Table 6 NASH Treatment & Therapeutics Market (Pipeline Analysis) Forecast by Product Type, 2023-2033 (US$ Million, AGR%, CAGR%)
Table 7 NASH Treatment & Therapeutics Market (Pipeline Analysis) Forecast by Application, 2023-2033 (US$ Million, AGR%, CAGR%)
Table 8 Treatment Segment Market Forecast by Region, 2023-2033 (US$ Million, AGR%, CAGR%)
Table 9 Diagnosis Segment Market Forecast by Region, 2023-2033 (US$ Million, AGR%, CAGR%)
Table 10 NASH Treatment & Therapeutics Market (Pipeline Analysis) Forecast by Sales Channel, 2023-2033 (US$ Million, AGR%, CAGR%)
Table 11 Hospital Pharmacy Segment Market Forecast by Region, 2023-2033 (US$ Million, AGR%, CAGR%)
Table 12 Online Provider Segment Market Forecast by Region, 2023-2033 (US$ Million, AGR%, CAGR%)
Table 13 Retail Pharmacy Segment Market Forecast by Region, 2023-2033 (US$ Million, AGR%, CAGR%)
Table 14 Others Segment Market Forecast by Region, 2023-2033 (US$ Million, AGR%, CAGR%)
Table 15 NASH Treatment & Therapeutics Market (Pipeline Analysis) Forecast by Region, 2023-2033 (US$ Million, AGR%, CAGR%)
Table 16 North America NASH Treatment & Therapeutics Market (Pipeline Analysis) Forecast by Country, 2023-2033 (US$ Million, AGR%, CAGR%)
Table 17 North America NASH Treatment & Therapeutics Market (Pipeline Analysis) Forecast by Application, 2023-2033 (US$ Million, AGR%, CAGR%)
Table 18 North America NASH Treatment & Therapeutics Market (Pipeline Analysis) Forecast by Sales Channel, 2023-2033 (US$ Million, AGR%, CAGR%)
Table 19 U.S. NASH Treatment & Therapeutics Market (Pipeline Analysis) Forecast, 2023-2033 (US$ Million, AGR%, CAGR%)
Table 20 Canada NASH Treatment & Therapeutics Market (Pipeline Analysis) Forecast, 2023-2033 (US$ Million, AGR%, CAGR%)
Table 21 Europe NASH Treatment & Therapeutics Market (Pipeline Analysis) Forecast by Country, 2023-2033 (US$ Million, AGR%, CAGR%)
Table 22 Europe NASH Treatment & Therapeutics Market (Pipeline Analysis) Forecast by Application, 2023-2033 (US$ Million, AGR%, CAGR%)
Table 23 Europe NASH Treatment & Therapeutics Market (Pipeline Analysis) Forecast by Sales Channel, 2023-2033 (US$ Million, AGR%, CAGR%)
Table 24 Germany NASH Treatment & Therapeutics Market (Pipeline Analysis) Forecast, 2023-2033 (US$ Million, AGR%, CAGR%)
Table 25 France NASH Treatment & Therapeutics Market (Pipeline Analysis) Forecast, 2023-2033 (US$ Million, AGR%, CAGR%)
Table 26 UK NASH Treatment & Therapeutics Market (Pipeline Analysis) Forecast, 2023-2033 (US$ Million, AGR%, CAGR%)
Table 27 Italy NASH Treatment & Therapeutics Market (Pipeline Analysis) Forecast, 2023-2033 (US$ Million, AGR%, CAGR%)
Table 28 Spain NASH Treatment & Therapeutics Market (Pipeline Analysis) Forecast, 2023-2033 (US$ Million, AGR%, CAGR%)
Table 29 Russia NASH Treatment & Therapeutics Market (Pipeline Analysis) Forecast, 2023-2033 (US$ Million, AGR%, CAGR%)
Table 30 Rest of Europe NASH Treatment & Therapeutics Market (Pipeline Analysis) Forecast, 2023-2033 (US$ Million, AGR%, CAGR%)
Table 31 Asia Pacific NASH Treatment & Therapeutics Market (Pipeline Analysis) Forecast by Country, 2023-2033 (US$ Million, AGR%, CAGR%)
Table 32 Asia Pacific NASH Treatment & Therapeutics Market (Pipeline Analysis) Forecast by Application, 2023-2033 (US$ Million, AGR%, CAGR%)
Table 33 Asia Pacific NASH Treatment & Therapeutics Market (Pipeline Analysis) Forecast by Sales Channel, 2023-2033 (US$ Million, AGR%, CAGR%)
Table 34 Japan NASH Treatment & Therapeutics Market (Pipeline Analysis) Forecast, 2023-2033 (US$ Million, AGR%, CAGR%)
Table 35 China NASH Treatment & Therapeutics Market (Pipeline Analysis) Forecast, 2023-2033 (US$ Million, AGR%, CAGR%)
Table 36 India NASH Treatment & Therapeutics Market (Pipeline Analysis) Forecast, 2023-2033 (US$ Million, AGR%, CAGR%)
Table 37 Australia NASH Treatment & Therapeutics Market (Pipeline Analysis) Forecast, 2023-2033 (US$ Million, AGR%, CAGR%)
Table 38 South Korea NASH Treatment & Therapeutics Market (Pipeline Analysis) Forecast, 2023-2033 (US$ Million, AGR%, CAGR%)
Table 39 Singapore NASH Treatment & Therapeutics Market (Pipeline Analysis) Forecast, 2023-2033 (US$ Million, AGR%, CAGR%)
Table 40 Rest of Asia Pacific NASH Treatment & Therapeutics Market (Pipeline Analysis) Forecast, 2023-2033 (US$ Million, AGR%, CAGR%)
Table 41 Latin America NASH Treatment & Therapeutics Market (Pipeline Analysis) Forecast by Country, 2023-2033 (US$ Million, AGR%, CAGR%)
Table 42 Latin America NASH Treatment & Therapeutics Market (Pipeline Analysis) Forecast by Application, 2023-2033 (US$ Million, AGR%, CAGR%)
Table 43 Latin America NASH Treatment & Therapeutics Market (Pipeline Analysis) Forecast by Sales Channel, 2023-2033 (US$ Million, AGR%, CAGR%)
Table 44 Brazil NASH Treatment & Therapeutics Market (Pipeline Analysis) Forecast, 2023-2033 (US$ Million, AGR%, CAGR%)
Table 45 Mexico NASH Treatment & Therapeutics Market (Pipeline Analysis) Forecast, 2023-2033 (US$ Million, AGR%, CAGR%)
Table 46 Argentina NASH Treatment & Therapeutics Market (Pipeline Analysis) Forecast, 2023-2033 (US$ Million, AGR%, CAGR%)
Table 47 Colombia NASH Treatment & Therapeutics Market (Pipeline Analysis) Forecast, 2023-2033 (US$ Million, AGR%, CAGR%)
Table 48 Rest of Latin America NASH Treatment & Therapeutics Market (Pipeline Analysis) Forecast, 2023-2033 (US$ Million, AGR%, CAGR%)
Table 49 Middle East and Africa NASH Treatment & Therapeutics Market (Pipeline Analysis) Forecast by Country, 2023-2033 (US$ Million, AGR%, CAGR%)
Table 50 Middle East and Africa NASH Treatment & Therapeutics Market (Pipeline Analysis) Forecast by Application, 2023-2033 (US$ Million, AGR%, CAGR%)
Table 51 Middle East and Africa NASH Treatment & Therapeutics Market (Pipeline Analysis) Forecast by Sales Channel, 2023-2033 (US$ Million, AGR%, CAGR%)
Table 52 GCC NASH Treatment & Therapeutics Market (Pipeline Analysis) Forecast, 2023-2033 (US$ Million, AGR%, CAGR%)
Table 53 South Africa NASH Treatment & Therapeutics Market (Pipeline Analysis) Forecast, 2023-2033 (US$ Million, AGR%, CAGR%)
Table 54 Rest of Middle East and Africa NASH Treatment & Therapeutics Market (Pipeline Analysis) Forecast, 2023-2033 (US$ Million, AGR%, CAGR%)
Table 55 Strategic Outlook
Table 56 Intercept Pharmaceuticals, Inc.: Key Details, (CEO, HQ, Revenue, Founded, No. of Employees, Company Type, Website, Business Segment)
Table 57 Intercept Pharmaceuticals, Inc.: Product Benchmarking
Table 58 Intercept Pharmaceuticals, Inc.: Strategic Outlook
Table 59 Gilead Sciences Inc.: Key Details, (CEO, HQ, Revenue, Founded, No. of Employees, Company Type, Website, Business Segment)
Table 60 Gilead Sciences Inc.: Product Benchmarking
Table 61 Genfit Pharma S.A.S: Key Details, (CEO, HQ, Revenue, Founded, No. of Employees, Company Type, Website, Business Segment)
Table 62 Genfit Pharma S.A.S: Product Benchmarking
Table 63 BioPredictive S.A.S: Key Details, (HQ, Company Type, Website, Business Segment)
Table 64 BioPredictive S.A.S: Product Benchmarking
Table 65 Galmed Pharmaceuticals Ltd.: Key Details, (CEO, HQ, Founded, Company Type, Website, Business Segment)
Table 66 Galmed Pharmaceuticals Ltd.: Product Benchmarking
Table 67 Galmed Pharmaceuticals Ltd.: Strategic Outlook
Table 68 Cadila Pharmaceuticals Ltd.: Key Details, (CEO, HQ, Founded, No. of Employees, Company Type, Website, Business Segment)
Table 69 Cadila Pharmaceuticals Ltd.: Product Benchmarking
Table 70 Prometheus Laboratories Inc.: Key Details, (CEO, HQ, Founded, No. of Employees, Company Type, Website, Business Segment)
Table 71 Prometheus Laboratories Inc.: Product Benchmarking
Table 72 AbbVie Inc.: Key Details, (CEO, HQ, Revenue, Founded, No. of Employees, Company Type, Website, Business Segment)
Table 73 AbbVie Inc.: Product Benchmarking
Table 74 AbbVie Inc.: Strategic Outlook
Table 75 Enanta Pharmaceuticals Inc.: Key Details, (CEO, HQ, Revenue, Founded, No. of Employees, Company Type, Website, Business Segment)
Table 76 Enanta Pharmaceuticals Inc.: Product Benchmarking
Table 77 Genentech, Inc.: Key Details, (CEO, HQ, Founded, No. of Employees, Company Type, Website, Business Segment)
Table 78 Genentech, Inc.: Product Benchmarking
List of Figures
Figure 1 NASH Treatment & Therapeutics Market (Pipeline Analysis) Segmentation
Figure 2 NASH Treatment & Therapeutics Market (Pipeline Analysis) by Application: Market Attractiveness Index
Figure 3 NASH Treatment & Therapeutics Market (Pipeline Analysis) by Sales Channel: Market Attractiveness Index
Figure 4 NASH Treatment & Therapeutics Market (Pipeline Analysis) Attractiveness Index by Region
Figure 5 NASH Treatment & Therapeutics Market (Pipeline Analysis): Market Dynamics
Figure 6 NASH Treatment & Therapeutics Market (Pipeline Analysis) by Region, 2023-2033 (US$ Million, AGR %): “V” Shaped Recovery
Figure 7 NASH Treatment & Therapeutics Market (Pipeline Analysis) by Region, 2023-2033 (US$ Million, AGR %): “U” Shaped Recovery
Figure 8 NASH Treatment & Therapeutics Market (Pipeline Analysis) by Region, 2023-2033 (US$ Million, AGR %): “W” Shaped Recovery
Figure 9 NASH Treatment & Therapeutics Market (Pipeline Analysis) by Region, 2023-2033 (US$ Million, AGR %): “L” Shaped Recovery
Figure 10 NASH Treatment & Therapeutics Market (Pipeline Analysis): Porter’s Five Forces Analysis
Figure 11 NASH Treatment & Therapeutics Market (Pipeline Analysis): PEST Analysis
Figure 12 NASH Treatment & Therapeutics Market (Pipeline Analysis): Drug Pipeline Analysis
Figure 13 NASH Treatment & Therapeutics Market (Pipeline Analysis) Forecast by Product Type, 2023-2033 (US$ Million, AGR %)
Figure 14 NASH Treatment & Therapeutics Market (Pipeline Analysis) Share Forecast by Product Type, 2023, 2028, 2033 (%)
Figure 15 NASH Treatment & Therapeutics Market (Pipeline Analysis) by Application: Market Attractiveness Index
Figure 16 NASH Treatment & Therapeutics Market (Pipeline Analysis) Forecast by Application, 2023-2033 (US$ Million, AGR %)
Figure 17 NASH Treatment & Therapeutics Market (Pipeline Analysis) Share Forecast by Application, 2023, 2028, 2033 (%)
Figure 18 Treatment Segment Market Forecast by Region, 2023-2033 (US$ Million, AGR %)
Figure 19 Treatment Segment Market Share Forecast by Region, 2023 & 2033 (%)
Figure 20 Diagnosis Segment Market Forecast by Region, 2023-2033 (US$ Million, AGR %)
Figure 21 Diagnosis Segment Market Share Forecast by Region, 2023 & 2033 (%)
Figure 22 NASH Treatment & Therapeutics Market (Pipeline Analysis) by Sales Channel: Market Attractiveness Index
Figure 23 NASH Treatment & Therapeutics Market (Pipeline Analysis) Forecast by Sales Channel, 2023-2033 (US$ Million, AGR %)
Figure 24 NASH Treatment & Therapeutics Market (Pipeline Analysis) Share Forecast by Sales Channel, 2023, 2028, 2033 (%)
Figure 25 Hospital Pharmacy Segment Market Forecast by Region, 2023-2033 (US$ Million, AGR %)
Figure 26 Hospital Pharmacy Segment Market Share Forecast by Region, 2023 & 2033 (%)
Figure 27 Online Provider Segment Market Forecast by Region, 2023-2033 (US$ Million, AGR %)
Figure 28 Online Provider Segment Market Share Forecast by Region, 2023 & 2033 (%)
Figure 29 Retail Pharmacy Segment Market Forecast by Region, 2023-2033 (US$ Million, AGR %)
Figure 30 Retail Pharmacy Segment Market Share Forecast by Region, 2023 & 2033 (%)
Figure 31 Others Segment Market Forecast by Region, 2023-2033 (US$ Million, AGR %)
Figure 32 Others Segment Market Share Forecast by Region, 2023 & 2033 (%)
Figure 33 NASH Treatment & Therapeutics Market (Pipeline Analysis) Forecast by Region 2023 and 2033 (Revenue, CAGR%)
Figure 34 NASH Treatment & Therapeutics Market (Pipeline Analysis) Share Forecast by Region 2023, 2028, 2033 (%)
Figure 35 NASH Treatment & Therapeutics Market (Pipeline Analysis) by Region, 2023-2033 (US$ Million, AGR %)
Figure 36 North America NASH Treatment & Therapeutics Market (Pipeline Analysis) Attractiveness Index
Figure 37 North America NASH Treatment & Therapeutics Market (Pipeline Analysis) by Region, 2023, 2028 & 2033 (US$ Million)
Figure 38 North America NASH Treatment & Therapeutics Market (Pipeline Analysis) Forecast by Country, 2023-2033 (US$ Million, AGR %)
Figure 39 North America NASH Treatment & Therapeutics Market (Pipeline Analysis) Share Forecast by Country, 2023 & 2033 (%)
Figure 40 North America NASH Treatment & Therapeutics Market (Pipeline Analysis) Forecast by Application, 2023-2033 (US$ Million, AGR %)
Figure 41 North America NASH Treatment & Therapeutics Market (Pipeline Analysis) Share Forecast by Application, 2023 & 2033 (%)
Figure 42 North America NASH Treatment & Therapeutics Market (Pipeline Analysis) Forecast by Sales Channel, 2023-2033 (US$ Million, AGR %)
Figure 43 North America NASH Treatment & Therapeutics Market (Pipeline Analysis) Share Forecast by Sales Channel, 2023 & 2033 (%)
Figure 44 U.S. NASH Treatment & Therapeutics Market (Pipeline Analysis) Forecast, 2023-2033 (US$ Million, AGR %)
Figure 45 Canada NASH Treatment & Therapeutics Market (Pipeline Analysis) Forecast, 2023-2033 (US$ Million, AGR %)
Figure 46 Europe NASH Treatment & Therapeutics Market (Pipeline Analysis) Attractiveness Index
Figure 47 Europe NASH Treatment & Therapeutics Market (Pipeline Analysis) by Region, 2023, 2028 & 2033 (US$ Million)
Figure 48 Europe NASH Treatment & Therapeutics Market (Pipeline Analysis) Forecast by Country, 2023-2033 (US$ Million, AGR %)
Figure 49 Europe NASH Treatment & Therapeutics Market (Pipeline Analysis) Share Forecast by Country, 2023 & 2033 (%)
Figure 50 Europe NASH Treatment & Therapeutics Market (Pipeline Analysis) Forecast by Application, 2023-2033 (US$ Million, AGR %)
Figure 51 Europe NASH Treatment & Therapeutics Market (Pipeline Analysis) Share Forecast by Application, 2023 & 2033 (%)
Figure 52 Europe NASH Treatment & Therapeutics Market (Pipeline Analysis) Forecast by Sales Channel, 2023-2033 (US$ Million, AGR %)
Figure 53 Europe NASH Treatment & Therapeutics Market (Pipeline Analysis) Share Forecast by Sales Channel, 2023 & 2033 (%)
Figure 54 Germany NASH Treatment & Therapeutics Market (Pipeline Analysis) Forecast, 2023-2033 (US$ Million, AGR %)
Figure 55 France NASH Treatment & Therapeutics Market (Pipeline Analysis) Forecast, 2023-2033 (US$ Million, AGR %)
Figure 56 UK NASH Treatment & Therapeutics Market (Pipeline Analysis) Forecast, 2023-2033 (US$ Million, AGR %)
Figure 57 Italy NASH Treatment & Therapeutics Market (Pipeline Analysis) Forecast, 2023-2033 (US$ Million, AGR %)
Figure 58 Spain NASH Treatment & Therapeutics Market (Pipeline Analysis) Forecast, 2023-2033 (US$ Million, AGR %)
Figure 59 Russia NASH Treatment & Therapeutics Market (Pipeline Analysis) Forecast, 2023-2033 (US$ Million, AGR %)
Figure 60 Rest of Europe NASH Treatment & Therapeutics Market (Pipeline Analysis) Forecast, 2023-2033 (US$ Million, AGR %)
Figure 61 Asia Pacific NASH Treatment & Therapeutics Market (Pipeline Analysis) Attractiveness Index
Figure 62 Asia Pacific NASH Treatment & Therapeutics Market (Pipeline Analysis) by Region, 2023, 2028 & 2033 (US$ Million)
Figure 63 Asia Pacific NASH Treatment & Therapeutics Market (Pipeline Analysis) Forecast by Country, 2023-2033 (US$ Million, AGR %)
Figure 64 Asia Pacific NASH Treatment & Therapeutics Market (Pipeline Analysis) Share Forecast by Country, 2023 & 2033 (%)
Figure 65 Asia Pacific NASH Treatment & Therapeutics Market (Pipeline Analysis) Forecast by Application, 2023-2033 (US$ Million, AGR %)
Figure 66 Asia Pacific NASH Treatment & Therapeutics Market (Pipeline Analysis) Share Forecast by Application, 2023 & 2033 (%)
Figure 67 Asia Pacific NASH Treatment & Therapeutics Market (Pipeline Analysis) Forecast by Sales Channel, 2023-2033 (US$ Million, AGR %)
Figure 68 Asia Pacific NASH Treatment & Therapeutics Market (Pipeline Analysis) Share Forecast by Sales Channel, 2023 & 2033 (%)
Figure 69 Japan NASH Treatment & Therapeutics Market (Pipeline Analysis) Forecast, 2023-2033 (US$ Million, AGR %)
Figure 70 China NASH Treatment & Therapeutics Market (Pipeline Analysis) Forecast, 2023-2033 (US$ Million, AGR %)
Figure 71 India NASH Treatment & Therapeutics Market (Pipeline Analysis) Forecast, 2023-2033 (US$ Million, AGR %)
Figure 72 Australia NASH Treatment & Therapeutics Market (Pipeline Analysis) Forecast, 2023-2033 (US$ Million, AGR %)
Figure 73 South Korea NASH Treatment & Therapeutics Market (Pipeline Analysis) Forecast, 2023-2033 (US$ Million, AGR %)
Figure 74 Singapore NASH Treatment & Therapeutics Market (Pipeline Analysis) Forecast, 2023-2033 (US$ Million, AGR %)
Figure 75 Rest of Asia Pacific NASH Treatment & Therapeutics Market (Pipeline Analysis) Forecast, 2023-2033 (US$ Million, AGR %)
Figure 76 Latin America NASH Treatment & Therapeutics Market (Pipeline Analysis) Attractiveness Index
Figure 77 Latin America NASH Treatment & Therapeutics Market (Pipeline Analysis) by Region, 2023, 2028 & 2033 (US$ Million)
Figure 78 Latin America NASH Treatment & Therapeutics Market (Pipeline Analysis) Forecast by Country, 2023-2033 (US$ Million, AGR %)
Figure 79 Latin America NASH Treatment & Therapeutics Market (Pipeline Analysis) Share Forecast by Country, 2023 & 2033 (%)
Figure 80 Latin America NASH Treatment & Therapeutics Market (Pipeline Analysis) Forecast by Application, 2023-2033 (US$ Million, AGR %)
Figure 81 Latin America NASH Treatment & Therapeutics Market (Pipeline Analysis) Share Forecast by Application, 2023 & 2033 (%)
Figure 82 Latin America NASH Treatment & Therapeutics Market (Pipeline Analysis) Forecast by Sales Channel, 2023-2033 (US$ Million, AGR %)
Figure 83 Latin America NASH Treatment & Therapeutics Market (Pipeline Analysis) Share Forecast by Sales Channel, 2023 & 2033 (%)
Figure 84 Brazil NASH Treatment & Therapeutics Market (Pipeline Analysis) Forecast, 2023-2033 (US$ Million, AGR %)
Figure 85 Mexico NASH Treatment & Therapeutics Market (Pipeline Analysis) Forecast, 2023-2033 (US$ Million, AGR %)
Figure 86 Argentina NASH Treatment & Therapeutics Market (Pipeline Analysis) Forecast, 2023-2033 (US$ Million, AGR %)
Figure 87 Colombia NASH Treatment & Therapeutics Market (Pipeline Analysis) Forecast, 2023-2033 (US$ Million, AGR %)
Figure 88 Rest of Latin America NASH Treatment & Therapeutics Market (Pipeline Analysis) Forecast, 2023-2033 (US$ Million, AGR %)
Figure 89 Middle East and Africa NASH Treatment & Therapeutics Market (Pipeline Analysis) Attractiveness Index
Figure 90 Middle East and Africa NASH Treatment & Therapeutics Market (Pipeline Analysis) by Region, 2023, 2028 & 2033 (US$ Million)
Figure 91 Middle East and Africa NASH Treatment & Therapeutics Market (Pipeline Analysis) Forecast by Country, 2023-2033 (US$ Million, AGR %)
Figure 92 Middle East and Africa NASH Treatment & Therapeutics Market (Pipeline Analysis) Share Forecast by Country, 2023 & 2033 (%)
Figure 93 Middle East and Africa NASH Treatment & Therapeutics Market (Pipeline Analysis) Forecast by Application, 2023-2033 (US$ Million, AGR %)
Figure 94 Middle East and Africa NASH Treatment & Therapeutics Market (Pipeline Analysis) Share Forecast by Application, 2023 & 2033 (%)
Figure 95 Middle East and Africa NASH Treatment & Therapeutics Market (Pipeline Analysis) Forecast by Sales Channel, 2023-2033 (US$ Million, AGR %)
Figure 96 Middle East and Africa NASH Treatment & Therapeutics Market (Pipeline Analysis) Share Forecast by Sales Channel, 2023 & 2033 (%)
Figure 97 GCC NASH Treatment & Therapeutics Market (Pipeline Analysis) Forecast, 2023-2033 (US$ Million, AGR %)
Figure 98 South Africa NASH Treatment & Therapeutics Market (Pipeline Analysis) Forecast, 2023-2033 (US$ Million, AGR %)
Figure 99 Rest of Middle East and Africa NASH Treatment & Therapeutics Market (Pipeline Analysis) Forecast, 2023-2033 (US$ Million, AGR %)
Figure 100 NASH Treatment & Therapeutics Market (Pipeline Analysis): Company Share/Ranking, 2022
Figure 101 Intercept Pharmaceuticals, Inc.: Net Revenue, 2017-2022 (US$ Million, AGR%)
Figure 102 Intercept Pharmaceuticals, Inc.: R&D, 2017-2022 (US$ Million, AGR%)
Figure 103 Gilead Sciences Inc.: Net Revenue, 2017-2022 (US$ Million, AGR%)
Figure 104 Gilead Sciences Inc.: R&D, 2017-2022 (US$ Million, AGR%)
Figure 105 Gilead Sciences Inc.: Regional Market Shares, 2022
Figure 106 Genfit Pharma S.A.S: Net Revenue, 2017-2022 (US$ Million, AGR%)
Figure 107 Genfit Pharma S.A.S: R&D, 2017-2022 (US$ Million, AGR%)
Figure 108 AbbVie Inc.: Net Revenue, 2017-2022 (US$ Million, AGR%)
Figure 109 AbbVie Inc.: R&D, 2017-2022 (US$ Million, AGR%)
Figure 110 AbbVie Inc.: Regional Market Shares, 2022
Figure 111 Enanta Pharmaceuticals Inc.: Net Revenue, 2017-2022 (US$ Million, AGR%)
ページTOPに戻る
よくあるご質問
Visiongain社はどのような調査会社ですか?
英国の調査会社ヴィジョンゲイン社(Visiongain)は、通信とエネルギーのほか、自動車や化学・医薬品、金属など、広範な市場を対象に調査を行っています。自動車市場については、市場全般に関する調査のほ... もっと見る
調査レポートの納品までの日数はどの程度ですか?
在庫のあるものは速納となりますが、平均的には 3-4日と見て下さい。
但し、一部の調査レポートでは、発注を受けた段階で内容更新をして納品をする場合もあります。
発注をする前のお問合せをお願いします。
注文の手続きはどのようになっていますか?
1)お客様からの御問い合わせをいただきます。
2)見積書やサンプルの提示をいたします。
3)お客様指定、もしくは弊社の発注書をメール添付にて発送してください。
4)データリソース社からレポート発行元の調査会社へ納品手配します。
5) 調査会社からお客様へ納品されます。最近は、pdfにてのメール納品が大半です。
お支払方法の方法はどのようになっていますか?
納品と同時にデータリソース社よりお客様へ請求書(必要に応じて納品書も)を発送いたします。
お客様よりデータリソース社へ(通常は円払い)の御振り込みをお願いします。
請求書は、納品日の日付で発行しますので、翌月最終営業日までの当社指定口座への振込みをお願いします。振込み手数料は御社負担にてお願いします。
お客様の御支払い条件が60日以上の場合は御相談ください。
尚、初めてのお取引先や個人の場合、前払いをお願いすることもあります。ご了承のほど、お願いします。
データリソース社はどのような会社ですか?
当社は、世界各国の主要調査会社・レポート出版社と提携し、世界各国の市場調査レポートや技術動向レポートなどを日本国内の企業・公官庁及び教育研究機関に提供しております。
世界各国の「市場・技術・法規制などの」実情を調査・収集される時には、データリソース社にご相談ください。
お客様の御要望にあったデータや情報を抽出する為のレポート紹介や調査のアドバイスも致します。
|
|

