オゾン発生器市場レポート:2023-2033
Ozone Generator Market Report 2023-2033
レポート詳細
オゾン発生器市場レポート 2023-2033年 :業界とその基礎となる原動力をよりよく理解することを望むなら、新たな収益ポケットを目指す大手企業にとって貴重なものとなる。異業種への進... もっと見る
※上記価格は部署ライセンス(Departmental licence)価格です。
その他の価格についてはデータリソースまでお問合せください。
日本語のページは自動翻訳を利用し作成しています。
実際のレポートは英文のみでご納品いたします。

|

|
サマリー
レポート詳細
オゾン発生器市場レポート 2023-2033年:業界とその基礎となる原動力をよりよく理解することを望むなら、新たな収益ポケットを目指す大手企業にとって貴重なものとなる。異業種への進出や新地域での既存事業の拡大を希望する企業にも有用です。
清潔で安全な水のためにオゾンの力を利用する
水処理および廃水処理ソリューションに対する需要の増加は、オゾン発生器市場の重要な推進要因である。オゾン発生器は、殺菌と汚染物質の除去のために水処理プロセスで広く使用されており、従来の化学薬品ベースの処理に代わる効果的な選択肢を提供している。人口の増加、都市化、産業活動により、清潔で安全な水へのニーズが高まっており、上下水道処理分野におけるオゾン発生装置の需要を牽引している。オゾン処理は効率的な殺菌を提供し、悪臭を除去し、有害な副生成物の生成を低減するため、水処理の課題に対処するための魅力的なソリューションとなっている。
環境に優しいオゾンソリューションで規制に対応
世界中の政府や規制機関が課す厳しい環境規制や基準が、オゾン発生装置の需要を押し上げています。強力な酸化剤であるオゾンは、従来の化学的処理方法に代わる持続可能で環境に優しい代替手段を提供します。オゾン発生器は、効率的な消毒を提供し、危険な化学物質の必要性を減らし、水や空気処理プロセスの環境への影響を最小限に抑えることで、規制要件を満たすのに役立ちます。環境への関心が高まり続ける中、オゾン発生器の採用は、持続可能な慣行への準拠を目指す産業にとって極めて重要になります。
市場調査レポートを購入する前にすべき質問とは?
- オゾン発生器市場はどのように進化しているのか?
- オゾン発生器市場の推進要因と抑制要因は何か?
- 各オゾン発生器サブマーケットセグメントは予測期間中にどのように成長し、2033年にどれくらいの収益を占めるようになるのか?
- 2023年から2033年にかけて、各オゾン発生器サブマーケットの市場シェアはどのように推移するのか?
- 2023年から2033年にかけて市場全体を牽引する主な要因は何か?
- 主要なオゾン発生器市場はマクロ経済の動きに概ね追随するのか、それとも個々の国別市場が他を上回るのか?
- 2033年までに各国市場のシェアはどのように変化し、2033年に市場をリードするのはどの地域か?
- 主要プレーヤーは誰で、予測期間中の見通しは?
- これらの大手企業のオゾン発生器プロジェクトとは?
- 2023年から2033年の間に、業界はどのように発展していくのか?現在および今後10年間に実施されるオゾン発生器プロジェクトにはどのような意味があるのでしょうか?
- オゾン発生器市場をさらに拡大するために、製品の商業化の必要性は高まっていますか?
- オゾン発生器市場はどこへ向かい、どのようにすれば市場の最前線に立てるか?
- 新製品やサービスラインに対する最適な投資オプションは何か?
- 企業を新たな成長路線とC-suiteに移行させるための重要な展望とは?
このことが、現在、そして今後10年間のオゾン発生器市場にどのような影響を与えるかを見極める必要がある:
- 320ページにわたる本レポートでは、128の表と177の図表を掲載しています。
- 本レポートは、業界における主要な有利分野にハイライトを当てているため、今すぐターゲットを絞ることができます。
- 世界、地域、国の売上と成長に関する詳細な分析が含まれています。
- 競合他社が成功した主なトレンド、変化、収益予測をハイライトしています。
本レポートは、オゾン発生器市場が今後10年間にどのように発展するか、またCOVID-19の景気後退と好転の変動に合わせてどのように発展するかをお伝えします。この市場は、過去10年間のどの時点よりも今が重要です。
2033年までの予測やその他の分析から、商業的な展望が明らかになる
- 2033年までの収益予測に加え、直近の業績、成長率、市場シェアもご覧いただけます。
- ビジネスの展望と展開に関する独自の分析をご覧いただけます。
- 質的分析(市場力学、促進要因、機会、阻害要因、課題を含む)、コスト構造、オゾン発生器価格上昇の影響、最新動向をご覧いただけます。
本レポートには、COVID-19が業界と貴社にどのような影響を与えるかについてのデータ分析と貴重な洞察が含まれている。本レポートでは、COVID-19の4つの回収パターンとその影響、すなわち「V」、「L」、「W」、「U」について論じている。
レポート対象セグメント
プロセス別セグメント
- 悪臭防止
- 地下水浄化
- 消毒
技術別セグメント
- コロナ放電
- 紫外線照射
- 電気分解
- 放射化学
最終用途産業別セグメント
- 都市・工業用水処理
- 住宅・産業用空気処理
- 自動車
- 食品・飲料
- その他の最終用途産業
用途別セグメント
- 浄水
- 空気浄化
- パルプ漂白
- 有機合成
- 水産養殖
- その他の用途
世界市場全体とセグメント別の収益予測に加え、4つの地域と20の主要国市場の収益予測も掲載しています:
北米
- アメリカ
- カナダ
欧州
- ドイツ
- スペイン
- イギリス
- フランス
- イタリア
- その他の欧州地域
アジア太平洋
- 中国
- 日本
- インド
- オーストラリア
- 韓国
- その他のアジア太平洋地域
ラテンアメリカ
- ブラジル
- メキシコ
- その他ラテンアメリカ
中東・アフリカ
- GCC
- 南アフリカ
- その他の中東・アフリカ
また、2023年から2033年までのオゾン発生器市場における主要企業のプロファイルも掲載している。
主要企業と市場成長の可能性
・ Chemtronics Technologies Pvt. Ltd.
・ Corotec Corporation
・ Creative Oz-Air (I) Pvt Ltd
・ Faraday Ozone Products Private Limited
・ Industrie De Nora S.p.A.
・ Lenntech B.V.
・ Metawater Co.,Ltd.
・ Mitsubishi Electric Corporation
・ MKS Instruments, Inc.
・ Ozonetech Systems OTS AB
・ Spartan Environmental Technologies
・ Teledyne Advanced Pollution Instrumentation
・ Toshiba Corporation
・ Veolia Water Technologies & Solutions
・ Xylem Inc.
2023年から2033年までのオゾン発生器市場全体の世界売上高は、金額ベースで2023年に12億4610万米ドルを突破する。2033年まで力強い収益成長を予測。当研究所では、最大の可能性を秘めた組織を特定しています。彼らの能力、進歩、商業的展望を発見し、一歩先を行くお手伝いをします。
オゾン発生器市場、2023-2033年レポートはどのようにお役に立つでしょうか?
要約すると、320ページに及ぶこのレポートは、以下のような知識を提供する:
- オゾン発生器市場の2023年から2033年までの収益予測 - プロセス、技術、最終用途産業、用途の各予測を世界レベルと地域レベルで掲載 - 業界の展望を発見し、投資と収益に最も有利な場所を見つけることができます。
- 4つの地域と20の主要国市場の2033年までの収益予測 - オゾン発生器市場の2023年から2033年までの北米、ヨーロッパ、アジア太平洋、ラテンアメリカ、中東&アフリカ市場の予測をご覧ください。また、米国、カナダ、ブラジル、ドイツ、フランス、英国、イタリア、中国、インド、日本、オーストラリアなど著名な経済圏の市場も予測しています。
- 2023年から2033年までのオゾン発生器市場に関わる主要企業15社の企業プロファイルを含む、既存企業および市場参入を目指す企業の展望。
独自の予測による定量的・定性的分析をご覧ください。当レポートにのみ掲載されている情報を入手し、貴重なビジネスインテリジェンスで情報を得ることができます。
独自の予測による定量的・定性的分析をご覧ください。私たちのレポートだけに含まれる情報を入手し、貴重なビジネスインテリジェンスで情報を得ることができます。
他にはない情報
私たちの新しいレポートがあれば、知識に遅れをとったり、チャンスを逃したりする可能性が低くなります。弊社の調査レポートが貴社の調査、分析、意思決定にどのように役立つかをご覧ください。Visiongainのこの調査レポートは、オゾン発生器市場2023年~2033年、市場リーダー企業の商業分析を必要とするすべての方々を対象としています。データ、トレンド、予測をご覧いただけます。
ページTOPに戻る
目次
目次
1 レポート概要
1.1 研究の目的
1.2 オゾン発生器市場の紹介
1.3 本レポートの内容
1.4 本レポートを読むべき理由
1.5 本分析レポートが回答する主な質問
1.6 本レポートは誰のためのものか?
1.7 調査方法
1.7.1 市場の定義
1.7.2 市場評価・予測手法
1.7.3 データ検証
1.7.3.1 一次調査
1.7.3.2 セカンダリーリサーチ
1.8 よくある質問(FAQ)
1.9 Visiongainの関連レポート
1.10 Visiongainについて
2 エグゼクティブ・サマリー
2.1 セグメント分析
2.1.1 プロセスセグメント市場魅力度指数
2.1.2 技術セグメント:市場魅力度指数
2.1.3 最終用途セグメント:市場魅力度指数
2.1.4 アプリケーションセグメント:市場魅力度指数
2.2 地域別分析
3 市場の概要
3.1 主要な調査結果
3.2 市場ダイナミクス
3.2.1 市場促進要因
3.2.1.1 環境汚染と健康リスクに関する意識と懸念の高まりがオゾン発生装置の需要を促進
3.2.1.2 水処理と空気処理におけるオゾン技術の使用を促進する厳しい政府規制と政策が市場成長を後押し
3.2.1.3 工業化と都市化の進展により、効果的な水と空気の浄化ソリューションへのニーズが高まり、オゾン発生器市場を後押し
3.2.2 市場の阻害要因
3.2.2.1 オゾン発生器システムに関連する高い初期投資と運用コストが市場の普及を妨げる
3.2.2.2 技術的な複雑さとメンテナンス要件が市場成長の課題となる
3.2.2.3 エンドユーザーにおけるオゾン技術に対する認識と理解の低さが市場拡大を阻む
3.2.3 市場機会
3.2.3.1 エネルギー効率の改善や自動化など、オゾン発生器技術の進歩が市場参入者に機会を創出
3.2.3.2 産業部門が拡大する新興経済国でのオゾン発生器需要の増加が未開拓の市場ポテンシャルをもたらす
3.2.3.3 持続可能な開発とグリーンイニシアチブへの注目の高まりが、様々な産業におけるオゾン発生器の採用を促進
3.3 COVID-19の影響分析
3.3.1 V字型回復
3.3.2 W字型回収
3.3.3 U字型回収
3.3.4 L字型回復
3.4 ポーターのファイブフォース分析
3.4.1 サプライヤーの交渉力(中程度)
3.4.2 買い手の交渉力(高)
3.4.3 競争上のライバル(高)
3.4.4 代替品による脅威(低い)
3.4.5 新規参入の脅威(低)
3.5 PEST分析
3.5.1 政治的要因
3.5.2 経済的要因
3.5.3 社会的要因
3.5.4 技術的要因
4 オゾン発生器市場分析:プロセス別
4.1 主要調査結果
4.2 プロセスセグメント: 市場魅力度指数
4.3 プロセス別オゾン発生器市場規模推定と予測
4.4 臭気対策
4.4.1 2023年~2033年、地域別市場規模(US$ Million)
4.4.2 地域別市場シェア、2023年・2033年(%)
4.5 地下水浄化
4.5.1 2023年~2033年、地域別市場規模(US$ Million)
4.5.2 地域別市場シェア、2023年・2033年(%)
4.6 消毒市場
4.6.1 2023年~2033年、地域別市場規模(US$ Million)
4.6.2 地域別市場シェア、2023年・2033年 (%)
5 オゾン発生器市場分析:技術別
5.1 主要調査結果
5.2 技術セグメント: 市場魅力度指数
5.3 技術別オゾン発生器市場規模推定と予測
5.4 コロナ放電市場
5.4.1 2023年~2033年、地域別市場規模(US$ Million)
5.4.2 地域別市場シェア、2023年・2033年(%)
5.5 紫外線市場
5.5.1 2023年~2033年、地域別市場規模(US$ Million)
5.5.2 地域別市場シェア、2023年・2033年(%)
5.6 電解市場
5.6.1 2023年~2033年、地域別市場規模(US$ Million)
5.6.2 地域別市場シェア、2023年・2033年(%)
5.7 放射化学市場
5.7.1 2023年~2033年、地域別市場規模(US$ Million)
5.7.2 地域別市場シェア、2023年・2033年(%)
6 オゾン発生器市場分析:用途別
6.1 主要調査結果
6.2 最終用途セグメント: 市場魅力度指数
6.3 オゾン発生器の用途別市場規模推定と予測
6.4 自治体・工業用水処理市場
6.4.1 2023年~2033年、地域別市場規模(US$ Million)
6.4.2 地域別市場シェア、2023年・2033年(%)
6.5 住宅用・産業用空気処理市場
6.5.1 2023年~2033年、地域別市場規模(US$ Million)
6.5.2 地域別市場シェア、2023年・2033年(%)
6.6 自動車市場
6.6.1 2023年~2033年、地域別市場規模(US$ Million)
6.6.2 地域別市場シェア、2023年・2033年(%)
6.7 食品・飲料市場
6.7.1 2023年~2033年、地域別市場規模(US$ Million)
6.7.2 地域別市場シェア、2023年・2033年(%)
6.8 その他の最終用途産業市場
6.8.1 2023年~2033年、地域別市場規模(US$ Million)
6.8.2 地域別市場シェア、2023年・2033年(%)
7 オゾン発生器市場分析:用途別
7.1 主要な調査結果
7.2 用途セグメント: 市場魅力度指数
7.3 オゾン発生器の用途別市場規模推定と予測
7.4 浄水器市場
7.4.1 2023年~2033年、地域別市場規模(US$ Million)
7.4.2 地域別市場シェア、2023年・2033年(%)
7.5 空気清浄市場
7.5.1 2023年~2033年、地域別市場規模(US$ Million)
7.5.2 地域別市場シェア、2023年・2033年(%)
7.6 パルプ漂白市場
7.6.1 2023年~2033年、地域別市場規模(US$ Million)
7.6.2 地域別市場シェア、2023年・2033年(%)
7.7 有機合成市場
7.7.1 2023年~2033年、地域別市場規模(US$ Million)
7.7.2 地域別市場シェア、2023年・2033年(%)
7.8 水産養殖市場
7.8.1 2023年~2033年、地域別市場規模(US$ Million)
7.8.2 地域別市場シェア、2023年・2033年(%)
7.9 その他の用途市場
7.9.1 2023年~2033年、地域別市場規模(US$ Million)
7.9.2 地域別市場シェア、2023年・2033年(%)
8 オゾン発生器市場分析:地域別
8.1 主要な調査結果
8.2 地域別市場規模の推定と予測
9 北米のオゾン発生器市場分析
9.1 主要な調査結果
9.2 北米オゾン発生器市場魅力度指数
9.3 北米のオゾン発生器国別市場、2023年、2028年、2033年(US$ Million)
9.4 北米のオゾン発生器市場規模推定と予測:金額ベース
9.5 北米のオゾン発生器市場規模推定と予測:国別
9.6 北米のオゾン発生器市場規模推定と予測:プロセス別
9.7 北米のオゾン発生器市場規模推定と予測:技術別
9.8 北米のオゾン発生器市場規模推定と予測:エンドユーズ 別
9.9 北米のオゾン発生器市場規模推定と予測:用途別
9.10 米国オゾン発生器市場
9.11 カナダのオゾン発生器市場
10 欧州のオゾン発生器市場分析
10.1 主要な調査結果
10.2 欧州オゾン発生器市場魅力度指数
10.3 欧州のオゾン発生器市場:国別、2023年、2028年、2033年(US$ Million)
10.4 欧州のオゾン発生器市場規模推定と予測:金額ベース
10.5 欧州のオゾン発生器市場規模推定と予測:国別
10.6 欧州のオゾン発生器市場規模推定と予測:プロセス別
10.7 欧州のオゾン発生器市場規模推定と予測:技術別
10.8 欧州のオゾン発生器市場規模推定と予測:エンドユーズ別
10.9 欧州のオゾン発生器市場規模推定と予測:用途別
10.10 ドイツのオゾン発生器市場
10.11 イギリスのオゾン発生器市場
10.12 フランスのオゾン発生器市場
10.13 イタリアのオゾン発生器市場
10.14 スペインオゾン発生器市場
10.15 その他の欧州地域のオゾン発生器市場
11 アジア太平洋地域のオゾン発生器市場分析
11.1 主要な調査結果
11.2 アジア太平洋地域のオゾン発生器市場魅力度指数
11.3 アジア太平洋地域のオゾン発生器国別市場、2023年、2028年、2033年)(US$ Million)
11.4 アジア太平洋地域のオゾン発生器市場規模推定と予測:金額ベース
11.5 アジア太平洋地域のオゾン発生器市場規模推定と予測:国別
11.6 アジア太平洋地域のオゾン発生器市場規模推定と予測:プロセス別
11.7 アジア太平洋地域のオゾン発生器市場規模推定と予測:技術別
11.8 アジア太平洋地域のオゾン発生器市場規模推定と予測:エンドユーズ別
11.9 アジア太平洋地域のオゾン発生器市場規模推定と予測:用途別
11.10 中国オゾン発生器市場
11.11 インドオゾン発生器市場
11.12 日本オゾン発生器市場
11.13 韓国オゾン発生器市場
11.14 オーストラリアのオゾン発生器市場
11.15 その他のアジア太平洋地域オゾン発生器市場
12 中東・アフリカのオゾン発生器市場分析
12.1 主要な調査結果
12.2 中東・アフリカのオゾン発生器市場魅力度指数
12.3 中東・アフリカのオゾン発生器国別市場:2023年、2028年、2033年(US$ Million)
12.4 中東・アフリカのオゾン発生器市場規模推定と予測:金額ベース
12.5 中東・アフリカのオゾン発生器市場規模推定と予測:国別
12.6 中東・アフリカのオゾン発生器市場規模推定と予測:プロセス別
12.7 中東・アフリカのオゾン発生器市場規模推定と予測:技術別
12.8 中東・アフリカのオゾン発生器市場規模推定と予測:エンドユーズ別
12.9 中東・アフリカのオゾン発生器市場規模推定と予測:用途別
12.10 GCCオゾン発生器市場
12.11 南アフリカのオゾン発生器市場
12.12 その他の中東・アフリカ地域のオゾン発生器市場
13 ラテンアメリカのオゾン発生器市場分析
13.1 主要な調査結果
13.2 ラテンアメリカのオゾン発生器市場魅力度指数
13.3 ラテンアメリカのオゾン発生器国別市場、2023年、2028年、2033年 (US$ Million)
13.4 ラテンアメリカのオゾン発生器市場規模推定と予測:金額ベース
13.5 ラテンアメリカのオゾン発生器市場規模推定と予測:国別
13.6 ラテンアメリカのオゾン発生器市場規模推定と予測:プロセス別
13.7 ラテンアメリカのオゾン発生器市場規模推定と予測:技術別
13.8 ラテンアメリカのオゾン発生器市場規模推定と予測:エンドユーズ別
13.9 ラテンアメリカのオゾン発生器市場規模推定と予測:用途別
13.10 ブラジルオゾン発生器市場
13.11 メキシコオゾン発生器市場
13.12 その他のラテンアメリカのオゾン発生器市場
14 主要企業のプロファイル
14.1 競争環境、2022年
14.2 戦略的展望
14.2.1 主要事業戦略としての新製品投入
14.2.1 主要事業戦略としての買収
14.2.1 主要事業戦略としてのパートナーシップ
14.2.1 主要事業戦略としての契約
14.2.2 主要事業戦略としての契約
14.3 Veolia Water Technologies & Solutions
14.3.1 会社概要
14.3.2 会社概要
14.3.3 製品のベンチマーク
14.3.4 戦略的展望
14.4 Xylem Inc.
14.4.1 会社概要
14.4.2 会社概要
14.4.3 財務分析
14.4.3.1 純収入、2018-2022年
14.4.3.2 R&D、2018年〜2022年
14.4.3.3 地域別収益シェア、2022年(%)
14.4.3.4 事業セグメント収益シェア、2022年(%)
14.4.4 製品ベンチマーク
14.4.5 戦略的展望
14.5 Mitsubishi Electric Corporation
14.5.1 会社概要
14.5.2 会社概要
14.5.3 財務分析
14.5.3.1 純収入、2018-2022年
14.5.3.2 R&D、2018年~2022年
14.5.3.3 地域別収益シェア、2022年(%)
14.5.3.4 事業セグメント収益シェア、2022年(%)
14.5.4 製品ベンチマーク
14.5.5 戦略的展望
14.6 Toshiba Corporation
14.6.1 会社概要
14.6.2 会社概要
14.6.3 財務分析
14.6.3.1 純収入、2018-2022年
14.6.3.2 R&D、2018年~2022年
14.6.3.3 地域別収益シェア、2022年(%)
14.6.3.4 事業セグメント収益シェア、2022年(%)
14.6.4 製品ベンチマーク
14.6.5 戦略的展望
14.7 Metawater Co.,Ltd.
14.7.1 会社概要
14.7.2 会社概要
14.7.3 財務分析
14.7.3.1 純収入、2018-2022年
14.7.3.2 R&D、2018年~2022年
14.7.3.3 事業セグメント収益シェア、2022年(%)
14.7.4 製品ベンチマーク
14.8 Industrie De Nora S.p.A.
14.8.1 会社概要
14.8.2 会社概要
14.8.3 製品ベンチマーク
14.8.4 戦略的展望
14.9 Spartan Environmental Technologies
14.9.1 会社概要
14.9.2 会社概要
14.9.3 製品ベンチマーク
14.10 MKS Instruments, Inc.
14.10.1 会社概要
14.10.2 会社概要
14.10.3 財務分析
14.10.3.1 純収入、2018-2022年
14.10.3.2 R&D、2018年~2022年
14.10.3.3 事業セグメント収益シェア、2022年(%)
14.10.4 製品ベンチマーク
14.10.5 戦略的展望
14.11 Teledyne Advanced Pollution Instrumentation
14.11.1 会社概要
14.11.2 会社概要
14.11.3 製品ベンチマーク
14.12 Creative Oz-Air (I) Pvt Ltd
14.12.1 会社概要
14.12.2 会社概要
14.12.3 製品ベンチマーク
14.13 Corotec Corporation
14.13.1 会社概要
14.13.2 会社概要
14.13.3 製品ベンチマーク
14.14 Ozonetech Systems OTS AB
14.14.1 会社概要
14.14.2 会社概要
14.14.3 製品ベンチマーク
14.15 Lenntech B.V.
14.15.1 会社概要
14.15.2 会社概要
14.15.3 製品ベンチマーク
14.16 Chemtronics Technologies Pvt. Ltd.
14.16.1 会社概要
14.16.2 会社概要
14.16.3 製品ベンチマーク
14.17 Faraday Ozone
14.17.1 会社概要
14.17.2 会社概要
14.17.3 製品ベンチマーク
15 結論と提言
15.1 Visiongainからの結びの言葉
15.2 市場プレイヤーへの提言
ページTOPに戻る
図表リスト
表の一覧
Table 1 Ozone Generator Market Snapshot, 2023 & 2033 (US$ Million, CAGR %)
Table 2 Global Ozone Generator Market Forecast, 2023-2033 (US$ Mn, AGR (%), CAGR (%)) (V-Shaped Recovery Scenario)
Table 3 Global Ozone Generator Market by Region, 2023-2033 (US$ Mn, AGR (%), CAGR (%)) (V-Shaped Recovery Scenario)
Table 4 Global Ozone Generator Market Forecast, 2023-2033 (US$ Mn, AGR (%), CAGR (%)) (W-Shaped Recovery Scenario)
Table 5 Global Ozone Generator Market by Region, 2023-2033 (US$ Mn, AGR (%), CAGR (%)) (W-Shaped Recovery Scenario)
Table 6 Global Ozone Generator Market Forecast, 2023-2033 (US$ Mn, AGR (%), CAGR (%)) (U-Shaped Recovery Scenario)
Table 7 Global Ozone Generator Market by Region, 2023-2033 (US$ Mn, AGR (%), CAGR (%)) (U-Shaped Recovery Scenario)
Table 8 Global Ozone Generator Market Forecast, 2023-2033 (US$ Mn, AGR (%), CAGR (%)) (L-Shaped Recovery Scenario)
Table 9 Global Ozone Generator Market by Region, 2023-2033 (US$ Mn, AGR (%), CAGR (%)) (L-Shaped Recovery Scenario)
Table 10 Global Ozone Generator Market by Process, 2023-2033 (US$ Mn, AGR (%), CAGR (%))
Table 11 Odour Control Market by Region, 2023-2033 (US$ Mn, AGR (%), CAGR (%))
Table 12 Groundwater Remediation Market by Region, 2023-2033 (US$ Mn, AGR (%), CAGR (%))
Table 13 Disinfection Market by Region, 2023-2033 (US$ Mn, AGR (%), CAGR (%))
Table 14 Global Ozone Generator Market by Technology, 2023-2033 (US$ Mn, AGR (%), CAGR (%))
Table 15 Corona Discharge Market by Region, 2023-2033 (US$ Mn, AGR (%), CAGR (%))
Table 16 Ultraviolet Radiation Market by Region, 2023-2033 (US$ Mn, AGR (%), CAGR (%))
Table 17 Electrolysis Market by Region, 2023-2033 (US$ Mn, AGR (%), CAGR (%))
Table 18 Radiochemical Market by Region, 2023-2033 (US$ Mn, AGR (%), CAGR (%))
Table 19 Global Ozone Generator Market by End-use Industry, 2023-2033 (US$ Mn, AGR (%), CAGR (%))
Table 20 Municipal & Industrial Water Treatment Market by Region, 2023-2033 (US$ Mn, AGR (%), CAGR (%))
Table 21 Residential & Industrial Air Treatment Market by Region, 2023-2033 (US$ Mn, AGR (%), CAGR (%))
Table 22 Automotive Market by Region, 2023-2033 (US$ Mn, AGR (%), CAGR (%))
Table 23 Food & Beverage Market by Region, 2023-2033 (US$ Mn, AGR (%), CAGR (%))
Table 24 Other End-use Industry Market by Region, 2023-2033 (US$ Mn, AGR (%), CAGR (%))
Table 25 Global Ozone Generator Market by Application, 2023-2033 (US$ Mn, AGR (%), CAGR (%))
Table 26 Water Purification Market by Region, 2023-2033 (US$ Mn, AGR (%), CAGR (%))
Table 27 Air Purification Market by Region, 2023-2033 (US$ Mn, AGR (%), CAGR (%))
Table 28 Pulp Bleaching Market by Region, 2023-2033 (US$ Mn, AGR (%), CAGR (%))
Table 29 Organic Synthesis Market by Region, 2023-2033 (US$ Mn, AGR (%), CAGR (%))
Table 30 Aquaculture Market by Region, 2023-2033 (US$ Mn, AGR (%), CAGR (%))
Table 31 Other Applications Market by Region, 2023-2033 (US$ Mn, AGR (%), CAGR (%))
Table 32 Global Ozone Generator Market Forecast, 2023-2033 (US$ Mn, AGR (%), CAGR (%))
Table 33 Global Ozone Generator Market by Region, 2023-2033 (US$ Mn, AGR (%), CAGR (%))
Table 34 Global Ozone Generator Market by Process, 2023-2033 (US$ Mn, AGR (%), CAGR (%))
Table 35 Global Ozone Generator Market by Technology, 2023-2033 (US$ Mn, AGR (%), CAGR (%))
Table 36 Global Ozone Generator Market by End-use Industry, 2023-2033 (US$ Mn, AGR (%), CAGR (%))
Table 37 Global Ozone Generator Market by Application, 2023-2033 (US$ Mn, AGR (%), CAGR (%))
Table 38 North America Ozone Generator Market by Value, 2023-2033 (US$ Mn, AGR (%), CAGR (%))
Table 39 North America Ozone Generator Market by Country, 2023-2033 (US$ Mn, AGR (%), CAGR (%))
Table 40 North America Ozone Generator Market by Process, 2023-2033 (US$ Mn, AGR (%), CAGR (%))
Table 41 North America Ozone Generator Market by Technology, 2023-2033 (US$ Mn, AGR (%), CAGR (%))
Table 42 North America Ozone Generator Market by End-use Industry, 2023-2033 (US$ Mn, AGR (%), CAGR (%))
Table 43 North America Ozone Generator Market by Application, 2023-2033 (US$ Mn, AGR (%), CAGR (%))
Table 44 US Ozone Generator Market by Value, 2023-2033 (US$ Mn, AGR (%), CAGR (%))
Table 45 Canada Ozone Generator Market by Value, 2023-2033 (US$ Mn, AGR (%), CAGR (%))
Table 46 Europe Ozone Generator Market by Value, 2023-2033 (US$ Mn, AGR (%), CAGR (%))
Table 47 Europe Ozone Generator Market by Country, 2023-2033 (US$ Mn, AGR (%), CAGR (%))
Table 48 Europe Ozone Generator Market by Process, 2023-2033 (US$ Mn, AGR (%), CAGR (%))
Table 49 Europe Ozone Generator Market by Technology, 2023-2033 (US$ Mn, AGR (%), CAGR (%))
Table 50 Europe Ozone Generator Market by End-use Industry, 2023-2033 (US$ Mn, AGR (%), CAGR (%))
Table 51 Europe Ozone Generator Market by Application, 2023-2033 (US$ Mn, AGR (%), CAGR (%))
Table 52 Germany Ozone Generator Market by Value, 2023-2033 (US$ Mn, AGR (%), CAGR (%))
Table 53 UK Ozone Generator Market by Value, 2023-2033 (US$ Mn, AGR (%), CAGR (%))
Table 54 France Ozone Generator Market by Value, 2023-2033 (US$ Mn, AGR (%), CAGR (%))
Table 55 Italy Ozone Generator Market by Value, 2023-2033 (US$ Mn, AGR (%), CAGR (%))
Table 56 Spain Ozone Generator Market by Value, 2023-2033 (US$ Mn, AGR (%), CAGR (%))
Table 57 Rest of Europe Ozone Generator Market by Value, 2023-2033 (US$ Mn, AGR (%), CAGR (%))
Table 58 Asia-Pacific Ozone Generator Market by Value, 2023-2033 (US$ Mn, AGR (%), CAGR (%))
Table 59 Asia-Pacific Ozone Generator Market by Country, 2023-2033 (US$ Mn, AGR (%), CAGR (%))
Table 60 Asia-Pacific Ozone Generator Market by Process, 2023-2033 (US$ Mn, AGR (%), CAGR (%))
Table 61 Asia-Pacific Ozone Generator Market by Technology, 2023-2033 (US$ Mn, AGR (%), CAGR (%))
Table 62 Asia-Pacific Ozone Generator Market by End-use Industry, 2023-2033 (US$ Mn, AGR (%), CAGR (%))
Table 63 Asia-Pacific Ozone Generator Market by Application, 2023-2033 (US$ Mn, AGR (%), CAGR (%))
Table 64 China Ozone Generator Market by Value, 2023-2033 (US $Mn, AGR (%), CAGR (%))
Table 65 India Ozone Generator Market by Value, 2023-2033 (US$ Mn, AGR (%), CAGR (%))
Table 66 Japan Ozone Generator Market by Value, 2023-2033 (US$ Mn, AGR (%), CAGR (%))
Table 67 South Korea Ozone Generator Market by Value, 2023-2033 (US$ Mn, AGR (%), CAGR (%))
Table 68 Australia Ozone Generator Market by Value, 2023-2033 (US$ Mn, AGR (%), CAGR (%))
Table 69 Rest of Asia-Pacific Ozone Generator Market by Value, 2023-2033 (US$ Mn, AGR (%), CAGR (%))
Table 70 Middle East & Africa Ozone Generator Market by Value, 2023-2033 (US$ Mn, AGR (%), CAGR (%))
Table 71 Middle East & Africa Ozone Generator Market by Country, 2023-2033 (US$ Mn, AGR (%), CAGR (%))
Table 72 Middle East & Africa Ozone Generator Market by Process, 2023-2033 (US$ Mn, AGR (%), CAGR (%))
Table 73 Middle East & Africa Ozone Generator Market by Technology, 2023-2033 (US$ Mn, AGR (%), CAGR (%))
Table 74 Middle East & Africa Ozone Generator Market by End-use Industry, 2023-2033 (US$ Mn, AGR (%), CAGR (%))
Table 75 Middle East & Africa Ozone Generator Market by Application, 2023-2033 (US$ Mn, AGR (%), CAGR (%))
Table 76 GCC Ozone Generator Market by Value, 2023-2033 (US$ Mn, AGR (%), CAGR (%))
Table 77 South Africa Ozone Generator Market by Value, 2023-2033 (US$ Mn, AGR (%), CAGR (%))
Table 78 Rest of Middle East & Africa Ozone Generator Market by Value, 2023-2033 (US$ Mn, AGR (%), CAGR (%))
Table 79 Latin America Ozone Generator Market by Value, 2023-2033 (US$ Mn, AGR (%), CAGR (%))
Table 80 Latin America Ozone Generator Market by Country, 2023-2033 (US$ Mn, AGR (%), CAGR (%))
Table 81 Latin America Ozone Generator Market by Process, 2023-2033 (US$ Mn, AGR (%), CAGR (%))
Table 82 Latin America Ozone Generator Market by Technology, 2023-2033 (US$ Mn, AGR (%), CAGR (%))
Table 83 Latin America Ozone Generator Market by End-use Industry, 2023-2033 (US$ Mn, AGR (%), CAGR (%))
Table 84 Latin America Ozone Generator Market by Application, 2023-2033 (US$ Mn, AGR (%), CAGR (%))
Table 85 Brazil Ozone Generator Market by Value, 2023-2033 (US$ Mn, AGR (%), CAGR (%))
Table 86 Mexico Ozone Generator Market by Value, 2023-2033 (US$ Mn, AGR (%), CAGR (%))
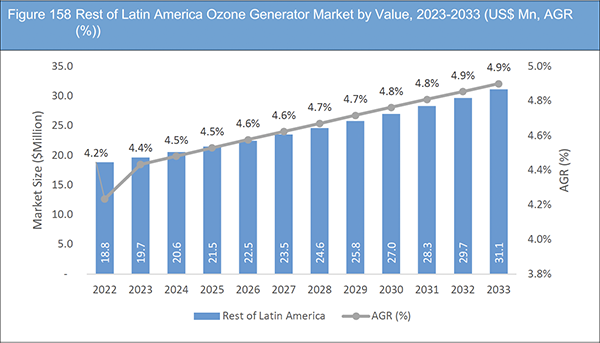
Table 87 Rest of Latin America Ozone Generator Market by Value, 2023-2033 (US$ Mn, AGR (%), CAGR (%))
Table 88 Strategic Outlook: New Product Launch
Table 89 Strategic Outlook: Acquisition
Table 90 Strategic Outlook: Partnership
Table 91 Strategic Outlook: Agreement
Table 92 Strategic Outlook: Contract
Table 93 Veolia Water Technologies & Solutions :Key Details, (CEO, HQ, Revenue, Founded, No. of Employees, Company Type, Website, Business Segment)
Table 94 Veolia Water Technologies & Solutions: Product Benchmarking
Table 95 Veolia Water Technologies & Solutions: Strategic Outlook
Table 96 Xylem Inc. Key Details, (CEO, HQ, Revenue, Founded, No. of Employees, Company Type, Website, Business Segment)
Table 97 Xylem Inc.: Product Benchmarking
Table 98 Xylem Inc.: Strategic Outlook
Table 99 Mitsubishi Electric Corporation Key Details, (CEO, HQ, Revenue, Founded, No. of Employees, Company Type, Website, Business Segment)
Table 100 Mitsubishi Electric Corporation: Product Benchmarking
Table 101 Mitsubishi Electric Corporation: Strategic Outlook
Table 102 Toshiba Corporation Key Details, (CEO, HQ, Revenue, Founded, No. of Employees, Company Type, Website, Business Segment)
Table 103 Toshiba Corporation: Product Benchmarking
Table 104 Toshiba Corporation: Strategic Outlook
Table 105 Metawater Co,Ltd Key Details, (CEO, HQ, Revenue, Founded, No. of Employees, Company Type, Website, Business Segment)
Table 106 Metawater Co,Ltd : Product Benchmarking
Table 107 Industrie De Nora S.p.A. Key Details, (CEO, HQ, Revenue, Founded, No. of Employees, Company Type, Website, Business Segment)
Table 108 Industrie De Nora S.p.A.: Product Benchmarking
Table 109 Industries De Nora S.p.A.: Strategic Outlook
Table 110 Spartan Environmental Technologies Key Details, (CEO, HQ, Revenue, Founded, No. of Employees, Company Type, Website, Business Segment)
Table 111 Spartan Environmental Technologies: Product Benchmarking
Table 112 MKS Instruments, Inc.Key Details, (CEO, HQ, Revenue, Founded, No. of Employees, Company Type, Website, Business Segment)
Table 113 MKS Instruments, Inc: Product Benchmarking
Table 114 MKS Instruments, Inc: Strategic Outlook
Table 115 Teledyne Advanced Pollution Instrumentation Key Details, (CEO, HQ, Revenue, Founded, No. of Employees, Company Type, Website, Business Segment)
Table 116 Teledyne Advanced Pollution Instrumentation: Product Benchmarking
Table 117 Creative Oz-Air (I) Pvt Ltd Key Details, (CEO, HQ, Revenue, Founded, No. of Employees, Company Type, Website, Business Segment)
Table 118 Creative Oz-Air (I) Pvt Ltd: Product Benchmarking
Table 119 Corotec CorporationKey Details, (CEO, HQ, Revenue, Founded, No. of Employees, Company Type, Website, Business Segment)
Table 120 Corotec Corporation: Product Benchmarking
Table 121 Ozonetech Systems OTS AB Key Details, (CEO, HQ, Revenue, Founded, No. of Employees, Company Type, Website, Business Segment)
Table 122 Ozonetech Systems OTS AB: Product Benchmarking
Table 123 Lenntech B.V.Key Details, (CEO, HQ, Revenue, Founded, No. of Employees, Company Type, Website, Business Segment)
Table 124 Lenntech B.V.: Product Benchmarking
Table 125 Chemtronics Technologies Pvt. Ltd. Key Details, (CEO, HQ, Revenue, Founded, No. of Employees, Company Type, Website, Business Segment)
Table 126 Chemtronics Technologies Pvt. Ltd.: Product Benchmarking
Table 127 Faraday Ozone Key Details, (CEO, HQ, Revenue, Founded, No. of Employees, Company Type, Website, Business Segment)
Table 128 Faraday Ozone: Product Benchmarking
図の一覧
Figure 1 Ozone Generator Market Segmentation
Figure 2 Ozone Generator Market by Process: Market Attractiveness Index
Figure 3 Ozone Generator Market by Technology: Market Attractiveness Index
Figure 4 Ozone Generator Market by End-Use: Market Attractiveness Index
Figure 5 Ozone Generator Market by Application: Market Attractiveness Index
Figure 6 Ozone Generator Market Attractiveness Index by Region
Figure 7 Ozone Generator Market: Market Dynamics
Figure 8 Global Ozone Generator Market Forecast by COVID, 2023-2033 (%)
Figure 17 Ozone Generator Market: Porter’s Five Forces Analysis
Figure 18 Ozone Generator Market: PEST Analysis
Figure 19 Ozone Generator Market by Process: Market Attractiveness Index
Figure 21 Global Ozone Generator Market Forecast by Process, 2023-2033 (%)
Figure 23 Process Segment Market Share Forecast by Region, 2023 & 2033 (%)
Figure 25 Process Segment Market Share Forecast by Region, 2023 & 2033 (%)
Figure 27 Process Segment Market Share Forecast by Region, 2023 & 2033 (%)
Figure 28 Ozone Generator Market by Technology: Market Attractiveness Index
Figure 30 Global Ozone Generator Market Forecast by Technology, 2023-2033 (%)
Figure 32 Technology Segment Market Share Forecast by Region, 2023 & 2033 (%)
Figure 34 Technology Segment Market Share Forecast by Region, 2023 & 2033 (%)
Figure 36 Technology Segment Market Share Forecast by Region, 2023 & 2033 (%)
Figure 38 Technology Segment Market Share Forecast by Region, 2023 & 2033 (%)
Figure 39 Ozone Generator Market by End-Use: Market Attractiveness Index
Figure 41 Global Ozone Generator Market Forecast by End-use Industry, 2023-2033 (%)
Figure 43 End-Use Segment Market Share Forecast by Region, 2023 & 2033 (%)
Figure 45 End-Use Segment Market Share Forecast by Region, 2023 & 2033 (%)
Figure 47 End-Use Segment Market Share Forecast by Region, 2023 & 2033 (%)
Figure 49 End-Use Segment Market Share Forecast by Region, 2023 & 2033 (%)
Figure 51 End-Use Segment Market Share Forecast by Region, 2023 & 2033 (%)
Figure 52 Ozone Generator Market by Application: Market Attractiveness Index
Figure 54 Global Ozone Generator Market Forecast by Application, 2023-2033 (%)
Figure 56 Application Segment Market Share Forecast by Region, 2023 & 2033 (%)
Figure 58 Application Segment Market Share Forecast by Region, 2023 & 2033 (%)
Figure 60 Application Segment Market Share Forecast by Region, 2023 & 2033 (%)
Figure 62 Application Segment Market Share Forecast by Region, 2023 & 2033 (%)
Figure 64 Application Segment Market Share Forecast by Region, 2023 & 2033 (%)
Figure 66 Application Segment Market Share Forecast by Region, 2023 & 2033 (%)
Figure 73 Global Ozone Generator Market Forecast by Region, 2023-2033 (%)
Figure 74 North America Ozone Generator Market Attractiveness Index
Figure 75 North America Ozone Generator Market by Country, 2023, 2028 & 2033 (US$ Million)
Figure 78 North America Ozone Generator Market Forecast by Country, 2023-2033 (%)
Figure 80 North America Ozone Generator Market Forecast by Process, 2023-2033 (%)
Figure 82 North America Ozone Generator Market Forecast by Technology, 2023-2033 (%)
Figure 84 North America Ozone Generator Market Forecast by End-use Industry, 2023-2033 (%)
Figure 86 North America Ozone Generator Market Forecast by Application, 2023-2033 (%)
Figure 89 Europe Ozone Generator Market Attractiveness Index
Figure 90 Europe Ozone Generator Market by Region, 2023, 2028 & 2033 (US$ Million)
Figure 93 Europe Ozone Generator Market Forecast by Country, 2023-2033 (%)
Figure 95 Europe Ozone Generator Market Forecast by Process, 2023-2033 (%)
Figure 97 Europe Ozone Generator Market Forecast by Technology, 2023-2033 (%)
Figure 99 Europe Ozone Generator Market Forecast by End-use Industry, 2023-2033 (%)
Figure 101 Europe Ozone Generator Market Forecast by Application, 2023-2033 (%)
Figure 108 Asia-Pacific Ozone Generator Market Attractiveness Index
Figure 109 Asia-Pacific Ozone Generator Market by Region, 2023, 2028 & 2033 (US$ Million)
Figure 112 Asia-Pacific Ozone Generator Market Forecast by Country, 2023-2033 (%)
Figure 114 Asia-Pacific Ozone Generator Market Forecast by Process, 2023-2033 (%)
Figure 116 Asia-Pacific Ozone Generator Market Forecast by Technology, 2023-2033 (%)
Figure 118 Asia-Pacific Ozone Generator Market Forecast by End-use Industry2023-2033 (%)
Figure 120 Asia-Pacific Ozone Generator Market Forecast by Application, 2023-2033 (%)
Figure 127 Middle East & Africa Ozone Generator Market Attractiveness Index
Figure 128 Middle East & Africa Ozone Generator Market by Country, 2023, 2028 & 2033 (US$ Million)
Figure 131 Middle East & Africa Ozone Generator Market Forecast by Country, 2023-2033 (%)
Figure 133 Middle East & Africa Ozone Generator Market Forecast by Process, 2023-2033 (%)
Figure 135 Middle East & Africa Ozone Generator Market Forecast by Technology, 2023-2033 (%)
Figure 139 Middle East & Africa Ozone Generator Market Forecast by Application, 2023-2033 (%)
Figure 143 Latin America Ozone Generator Market Attractiveness Index
Figure 144 Latin America Ozone Generator Market by Country, 2023, 2028 & 2033 (US$ Million)
Figure 147 Latin America Ozone Generator Market Forecast by Country, 2023-2033 (%)
Figure 149 Latin America Ozone Generator Market Forecast by Process, 2023-2033 (%)
Figure 151 Latin America Ozone Generator Market Forecast by Technology, 2023-2033 (%)
Figure 153 Latin America Ozone Generator Market Forecast by End-use Industry, 2023-2033 (%)
Figure 155 Latin America Ozone Generator Market Forecast by Application, 2023-2033 (%)
Figure 159 Ozone Generator Market: Company Share, 2022
Figure 160 Xylem Inc.: Net Revenue, 2018-2022 (US$ Million, AGR%)
Figure 161 Xylem Inc.: R&D, 2018-2022 (US$ Million, AGR%)
Figure 162 Xylem Inc.: Regional Revenue Share, 2022 (%)
Figure 163 Xylem Inc.: Business Segment Revenue Share, 2022 (%)
Figure 164 Mitsubishi Electric Corporation: Net Revenue, 2018-2022 (US$ Million, AGR%)
Figure 165 Mitsubishi Electric Corporation: R&D, 2018-2022 (US$ Million, AGR%)
Figure 166 Mitsubishi Electric Corporation: Regional Revenue Share, 2022 (%)
Figure 167 Mitsubishi Electric Corporation: Business Segment Revenue Share, 2022 (%)
Figure 168 Toshiba Corporation: Net Revenue, 2018-2022 (US$ Million, AGR%)
Figure 169 Toshiba Corporation: R&D, 2018-2022 (US$ Million, AGR%)
Figure 170 Toshiba Corporation: Regional Revenue Share, 2022 (%)
Figure 171 Toshiba Corporation: Business Segment Revenue Share, 2022 (%)
Figure 172 Metawater Co,Ltd : Net Revenue, 2018-2022 (US$ Million, AGR%)
Figure 173 Metawater Co,Ltd : R&D, 2018-2022 (US$ Million, AGR%)
Figure 174 Metawater Co,Ltd : Business Segment Revenue Share, 2022 (%)
Figure 175 MKS Instruments, Inc: Net Revenue, 2018-2022 (US$ Million, AGR%)
Figure 176 MKS Instruments, Inc: R&D, 2018-2022 (US$ Million, AGR%)
Figure 177 MKS Instruments, Inc: Business Segment Revenue Share, 2022 (%)
ページTOPに戻る
Summary
Report Details
The Ozone Generator Market Report 2023-2033: This report will prove invaluable to leading firms striving for new revenue pockets if they wish to better understand the industry and its underlying dynamics. It will be useful for companies that would like to expand into different industries or to expand their existing operations in a new region.
Harnessing the Power of Ozone for Clean and Safe Water
The increasing demand for water and wastewater treatment solutions is a significant driving factor for the ozone generator market. Ozone generators are widely used in water treatment processes to disinfect and remove contaminants, offering an effective alternative to traditional chemical-based treatments. The growing population, urbanization, and industrial activities have led to an increased need for clean and safe water, driving the demand for ozone generators in the water and wastewater treatment sector. Ozone treatment provides efficient disinfection, eliminates odor, and reduces the formation of harmful by-products, making it an attractive solution for addressing water treatment challenges.
Meeting Regulations with Eco-Friendly Ozone Solutions
Stringent environmental regulations and standards imposed by governments and regulatory bodies worldwide are driving the demand for ozone generators. Ozone, as a powerful oxidizing agent, offers a sustainable and environmentally friendly alternative to conventional chemical treatment methods. Ozone generators aid in meeting regulatory requirements by providing efficient disinfection, reducing the need for hazardous chemicals, and minimizing the environmental impact of water and air treatment processes. As environmental concerns continue to grow, the adoption of ozone generators becomes crucial for industries striving for compliance with sustainable practices.
What Questions Should You Ask before Buying a Market Research Report?
• How is the ozone generator market evolving?
• What is driving and restraining the ozone generator market?
• How will each ozone generator submarket segment grow over the forecast period and how much revenue will these submarkets account for in 2033?
• How will the market shares for each ozone generator submarket develop from 2023 to 2033?
• What will be the main driver for the overall market from 2023 to 2033?
• Will leading ozone generator markets broadly follow the macroeconomic dynamics, or will individual national markets outperform others?
• How will the market shares of the national markets change by 2033 and which geographical region will lead the market in 2033?
• Who are the leading players and what are their prospects over the forecast period?
• What are the ozone generator projects for these leading companies?
• How will the industry evolve during the period between 2023 and 2033? What are the implications of ozone generator projects taking place now and over the next 10 years?
• Is there a greater need for product commercialisation to further scale the ozone generator market?
• Where is the ozone generator market heading and how can you ensure you are at the forefront of the market?
• What are the best investment options for new product and service lines?
• What are the key prospects for moving companies into a new growth path and C-suite?
You need to discover how this will impact the ozone generator market today, and over the next 10 years:
• Our 320-page report provides 128 tables and 177 charts/graphs exclusively to you.
• The report highlights key lucrative areas in the industry so you can target them – NOW.
• It contains in-depth analysis of global, regional and national sales and growth.
• It highlights for you the key successful trends, changes and revenue projections made by your competitors.
This report tells you TODAY how the ozone generator market will develop in the next 10 years, and in line with the variations in COVID-19 economic recession and bounce. This market is more critical now than at any point over the last 10 years.
Forecasts to 2033 and other analyses reveal commercial prospects
• In addition to revenue forecasting to 2033, our new study provides you with recent results, growth rates, and market shares.
• You will find original analyses, with business outlooks and developments.
• Discover qualitative analyses (including market dynamics, drivers, opportunities, restraints and challenges), cost structure, impact of rising ozone generator prices and recent developments.
This report includes data analysis and invaluable insight into how COVID-19 will affect the industry and your company. Four COVID-19 recovery patterns and their impact, namely, “V”, “L”, “W” and “U” are discussed in this report.
Segments Covered in the Report
Market Segment by Process
• Odor Control
• Groundwater Remediation
• Disinfection
Market Segment by Technology
• Corona Discharge
• Ultraviolet Radiation
• Electrolysis
• Radiochemical
Market Segment by End-use Industry
• Municipal & Industrial Water Treatment
• Residential & Industrial Air Treatment
• Automotive
• Food & Beverage
• Other End-use Industry
Market Segment by Application
• Water Purification
• Air Purification
• Pulp Bleaching
• Organic Synthesis
• Aquaculture
• Other Applications
In addition to the revenue predictions for the overall world market and segments, you will also find revenue forecasts for four regional and 20 leading national markets:
North America
• U.S.
• Canada
Europe
• Germany
• Spain
• United Kingdom
• France
• Italy
• Rest of Europe
Asia Pacific
• China
• Japan
• India
• Australia
• South Korea
• Rest of Asia Pacific
Latin America
• Brazil
• Mexico
• Rest of Latin America
Middle East & Africa
• GCC
• South Africa
• Rest of Middle East & Africa
The report also includes profiles and for some of the leading companies in the Ozone Generator Market, 2023 to 2033, with a focus on this segment of these companies’ operations.
Leading companies and the potential for market growth
• Chemtronics Technologies Pvt. Ltd.
• Corotec Corporation
• Creative Oz-Air (I) Pvt Ltd
• Faraday Ozone Products Private Limited
• Industrie De Nora S.p.A.
• Lenntech B.V.
• Metawater Co.,Ltd.
• Mitsubishi Electric Corporation
• MKS Instruments, Inc.
• Ozonetech Systems OTS AB
• Spartan Environmental Technologies
• Teledyne Advanced Pollution Instrumentation
• Toshiba Corporation
• Veolia Water Technologies & Solutions
• Xylem Inc.
Overall world revenue for Ozone Generator Market, 2023 to 2033 in terms of value the market will surpass US$1,246.1 million in 2023, our work calculates. We predict strong revenue growth through to 2033. Our work identifies which organizations hold the greatest potential. Discover their capabilities, progress, and commercial prospects, helping you stay ahead.
How will the Ozone Generator Market, 2023 to 2033 report help you?
In summary, our 320-pages report provides you with the following knowledge:
• Revenue forecasts to 2033 for Ozone Generator Market, 2023 to 2033 Market, with forecasts for process, technology, end-use industry, application, each forecast at a global and regional level – discover the industry’s prospects, finding the most lucrative places for investments and revenues.
• Revenue forecasts to 2033 for four regional and 20 key national markets – See forecasts for the Ozone Generator Market, 2023 to 2033 market in North America, Europe, Asia-Pacific, Latin America and Middle East & Africa. Also forecasted is the market in the US, Canada, Brazil, Germany, France, UK, Italy, China, India, Japan, and Australia among other prominent economies.
• Prospects for established firms and those seeking to enter the market – including company profiles for 15 of the major companies involved in the Ozone Generator Market, 2023 to 2033.
Find quantitative and qualitative analyses with independent predictions. Receive information that only our report contains, staying informed with invaluable business intelligence.
Information found nowhere else
With our new report, you are less likely to fall behind in knowledge or miss out on opportunities. See how our work could benefit your research, analyses, and decisions. Visiongain’s study is for everybody needing commercial analyses for the ozone generator market, 2023 to 2033, market-leading companies. You will find data, trends and predictions.
ページTOPに戻る
Table of Contents
Table of Contents
1 Report Overview
1.1 Objectives of the Study
1.2 Introduction to Ozone Generator Market
1.3 What This Report Delivers
1.4 Why You Should Read This Report
1.5 Key Questions Answered by This Analytical Report
1.6 Who is This Report for?
1.7 Research Methodology
1.7.1 Market Definitions
1.7.2 Market Evaluation & Forecasting Methodology
1.7.3 Data Validation
1.7.3.1 Primary Research
1.7.3.2 Secondary Research
1.8 Frequently Asked Questions (FAQs)
1.9 Associated Visiongain Reports
1.10 About Visiongain
2 Executive Summary
2.1 Segment Analysis
2.1.1 Process Segment: Market Attractiveness Index
2.1.2 Technology Segment: Market Attractiveness Index
2.1.3 End-Use Segment: Market Attractiveness Index
2.1.4 Application Segment: Market Attractiveness Index
2.2 Regional Analysis
3 Market Overview
3.1 Key Findings
3.2 Market Dynamics
3.2.1 Market Driving Factors
3.2.1.1 Increasing Awareness and Concerns Regarding Environmental Pollution and Health Risks Drive the Demand for Ozone Generators
3.2.1.2 Stringent Government Regulations and Policies Promoting the Use of Ozone Technology in Water and Air Treatment Fuel Market Growth
3.2.1.3 Growing Industrialization and Urbanization Lead to a Higher Need for Effective Water and Air Purification Solutions, Boosting the Ozone Generator Market
3.2.2 Market Restraints
3.2.2.1 High Initial Investment and Operating Costs Associated with Ozone Generator Systems Hinder Market Adoption
3.2.2.2 Technical Complexities and Maintenance Requirements Pose Challenges to Market Growth
3.2.2.3 Limited Awareness and Understanding of Ozone Technology Among End-Users Restrict Market Expansion
3.2.3 Market Opportunities
3.2.3.1 Advancements in Ozone Generator Technology, Such as Improved Energy Efficiency and Automation, Create Opportunities for Market Players
3.2.3.2 Rising Demand for Ozone Generators in Emerging Economies with Expanding Industrial Sectors Presents Untapped Market Potential
3.2.3.3 Increasing Focus on Sustainable Development and Green Initiatives Drives the Adoption of Ozone Generators in Various Industries
3.3 COVID-19 Impact Analysis
3.3.1 V-Shaped Recovery
3.3.2 W-Shaped Recovery
3.3.3 U-Shaped Recovery
3.3.4 L-Shaped Recovery
3.4 Porter’s Five Forces Analysis
3.4.1 Bargaining Power of Suppliers (Moderate)
3.4.2 Bargaining Power of Buyers (High)
3.4.3 Competitive Rivalry (High)
3.4.4 Threat from Substitutes (Low)
3.4.5 Threat of New Entrants (Low)
3.5 PEST Analysis
3.5.1 Political Factors
3.5.2 Economic Factors:
3.5.3 Social Factors
3.5.4 Technological Factors
4 Ozone Generator Market Analysis by Process
4.1 Key Findings
4.2 Process Segment: Market Attractiveness Index
4.3 Ozone Generator Market Size Estimation and Forecast by Process
4.4 Odour Control
4.4.1 Market Size by Region, 2023-2033 (US$ Million)
4.4.2 Market Share by Region, 2023 & 2033 (%)
4.5 Groundwater Remediation
4.5.1 Market Size by Region, 2023-2033 (US$ Million)
4.5.2 Market Share by Region, 2023 & 2033 (%)
4.6 Disinfection Market
4.6.1 Market Size by Region, 2023-2033 (US$ Million)
4.6.2 Market Share by Region, 2023 & 2033 (%)
5 Ozone Generator Market Analysis by Technology
5.1 Key Findings
5.2 Technology Segment: Market Attractiveness Index
5.3 Ozone Generator Market Size Estimation and Forecast by Technology
5.4 Corona Discharge Market
5.4.1 Market Size by Region, 2023-2033 (US$ Million)
5.4.2 Market Share by Region, 2023 & 2033 (%)
5.5 Ultraviolet Radiation Market
5.5.1 Market Size by Region, 2023-2033 (US$ Million)
5.5.2 Market Share by Region, 2023 & 2033 (%)
5.6 Electrolysis Market
5.6.1 Market Size by Region, 2023-2033 (US$ Million)
5.6.2 Market Share by Region, 2023 & 2033 (%)
5.7 Radiochemical Market
5.7.1 Market Size by Region, 2023-2033 (US$ Million)
5.7.2 Market Share by Region, 2023 & 2033 (%)
6 Ozone Generator Market Analysis by End-Use
6.1 Key Findings
6.2 End-Use Segment: Market Attractiveness Index
6.3 Ozone Generator Market Size Estimation and Forecast by End-Use
6.4 Municipal & Industrial Water Treatment Market
6.4.1 Market Size by Region, 2023-2033 (US$ Million)
6.4.2 Market Share by Region, 2023 & 2033 (%)
6.5 Residential & Industrial Air Treatment Market
6.5.1 Market Size by Region, 2023-2033 (US$ Million)
6.5.2 Market Share by Region, 2023 & 2033 (%)
6.6 Automotive Market
6.6.1 Market Size by Region, 2023-2033 (US$ Million)
6.6.2 Market Share by Region, 2023 & 2033 (%)
6.7 Food & Beverage Market
6.7.1 Market Size by Region, 2023-2033 (US$ Million)
6.7.2 Market Share by Region, 2023 & 2033 (%)
6.8 Other End-use Industry Market
6.8.1 Market Size by Region, 2023-2033 (US$ Million)
6.8.2 Market Share by Region, 2023 & 2033 (%)
7 Ozone Generator Market Analysis by Application
7.1 Key Findings
7.2 Application Segment: Market Attractiveness Index
7.3 Ozone Generator Market Size Estimation and Forecast by Application
7.4 Water Purification Market
7.4.1 Market Size by Region, 2023-2033 (US$ Million)
7.4.2 Market Share by Region, 2023 & 2033 (%)
7.5 Air Purification Market
7.5.1 Market Size by Region, 2023-2033 (US$ Million)
7.5.2 Market Share by Region, 2023 & 2033 (%)
7.6 Pulp Bleaching Market
7.6.1 Market Size by Region, 2023-2033 (US$ Million)
7.6.2 Market Share by Region, 2023 & 2033 (%)
7.7 Organic Synthesis Market
7.7.1 Market Size by Region, 2023-2033 (US$ Million)
7.7.2 Market Share by Region, 2023 & 2033 (%)
7.8 Aquaculture Market
7.8.1 Market Size by Region, 2023-2033 (US$ Million)
7.8.2 Market Share by Region, 2023 & 2033 (%)
7.9 Other Applications Market
7.9.1 Market Size by Region, 2023-2033 (US$ Million)
7.9.2 Market Share by Region, 2023 & 2033 (%)
8 Ozone Generator Market Analysis by Region
8.1 Key Findings
8.2 Regional Market Size Estimation and Forecast
9 North America Ozone Generator Market Analysis
9.1 Key Findings
9.2 North America Ozone Generator Market Attractiveness Index
9.3 North America Ozone Generator Market by Country, 2023, 2028 & 2033 (US$ Million)
9.4 North America Ozone Generator Market Size Estimation and Forecast by Value
9.5 North America Ozone Generator Market Size Estimation and Forecast by Country
9.6 North America Ozone Generator Market Size Estimation and Forecast by Process
9.7 North America Ozone Generator Market Size Estimation and Forecast by Technology
9.8 North America Ozone Generator Market Size Estimation and Forecast by End-Use
9.9 North America Ozone Generator Market Size Estimation and Forecast by Application
9.10 US Ozone Generator Market
9.11 Canada Ozone Generator Market
10 Europe Ozone Generator Market Analysis
10.1 Key Findings
10.2 Europe Ozone Generator Market Attractiveness Index
10.3 Europe Ozone Generator Market by Country, 2023, 2028 & 2033 (US$ Million)
10.4 Europe Ozone Generator Market Size Estimation and Forecast by Value
10.5 Europe Ozone Generator Market Size Estimation and Forecast by Country
10.6 Europe Ozone Generator Market Size Estimation and Forecast by Process
10.7 Europe Ozone Generator Market Size Estimation and Forecast by Technology
10.8 Europe Ozone Generator Market Size Estimation and Forecast by End-Use
10.9 Europe Ozone Generator Market Size Estimation and Forecast by Application
10.10 Germany Ozone Generator Market
10.11 UK Ozone Generator Market
10.12 France Ozone Generator Market
10.13 Italy Ozone Generator Market
10.14 Spain Ozone Generator Market
10.15 Rest of Europe Ozone Generator Market
11 Asia-Pacific Ozone Generator Market Analysis
11.1 Key Findings
11.2 Asia-Pacific Ozone Generator Market Attractiveness Index
11.3 Asia-Pacific Ozone Generator Market by Country, 2023, 2028 & 2033 (US$ Million)
11.4 Asia-Pacific Ozone Generator Market Size Estimation and Forecast by Value
11.5 Asia-Pacific Ozone Generator Market Size Estimation and Forecast by Country
11.6 Asia-Pacific Ozone Generator Market Size Estimation and Forecast by Process
11.7 Asia-Pacific Ozone Generator Market Size Estimation and Forecast by Technology
11.8 Asia-Pacific Ozone Generator Market Size Estimation and Forecast by End-Use
11.9 Asia-Pacific Ozone Generator Market Size Estimation and Forecast by Application
11.10 China Ozone Generator Market
11.11 India Ozone Generator Market
11.12 Japan Ozone Generator Market
11.13 South Korea Ozone Generator Market
11.14 Australia Ozone Generator Market
11.15 Rest of Asia Pacific Ozone Generator Market
12 Middle East & Africa Ozone Generator Market Analysis
12.1 Key Findings
12.2 Middle East & Africa Ozone Generator Market Attractiveness Index
12.3 Middle East & Africa Ozone Generator Market by Country, 2023, 2028 & 2033 (US$ Million)
12.4 Middle East & Africa Ozone Generator Market Size Estimation and Forecast by Value
12.5 Middle East & Africa Ozone Generator Market Size Estimation and Forecast by Country
12.6 Middle East & Africa Ozone Generator Market Size Estimation and Forecast by Process
12.7 Middle East & Africa Ozone Generator Market Size Estimation and Forecast by Technology
12.8 Middle East & Africa Ozone Generator Market Size Estimation and Forecast by End-Use
12.9 Middle East & Africa Ozone Generator Market Size Estimation and Forecast by Application
12.10 GCC Ozone Generator Market
12.11 South Africa Ozone Generator Market
12.12 Rest of Middle East & Africa Ozone Generator Market
13 Latin America Ozone Generator Market Analysis
13.1 Key Findings
13.2 Latin America Ozone Generator Market Attractiveness Index
13.3 Latin America Ozone Generator Market by Country, 2023, 2028 & 2033 (US$ Million)
13.4 Latin America Ozone Generator Market Size Estimation and Forecast by Value
13.5 Latin America Ozone Generator Market Size Estimation and Forecast by Country
13.6 Latin America Ozone Generator Market Size Estimation and Forecast by Process
13.7 Latin America Ozone Generator Market Size Estimation and Forecast by Technology
13.8 Latin America Ozone Generator Market Size Estimation and Forecast by End-Use
13.9 Latin America Ozone Generator Market Size Estimation and Forecast by Application
13.10 Brazil Ozone Generator Market
13.11 Mexico Ozone Generator Market
13.12 Rest of Latin America Ozone Generator Market
14 Company Profiles
14.1 Competitive Landscape, 2022
14.2 Strategic Outlook
14.2.1 New Product Launch as Key Business Strategy
14.2.1 Acquisitions as Key Business Strategy
14.2.1 Partnership as Key Business Strategy
14.2.1 Agreement as Key Business Strategy
14.2.2 Contract as Key Business Strategy
14.3 Veolia Water Technologies & Solutions
14.3.1 Company Snapshot
14.3.2 Company Overview
14.3.3 Product Benchmarking
14.3.4 Strategic Outlook
14.4 Xylem Inc.
14.4.1 Company Snapshot
14.4.2 Company Overview
14.4.3 Financial Analysis
14.4.3.1 Net Revenue, 2018-2022
14.4.3.2 R&D, 2018-2022
14.4.3.3 Regional Revenue Share, 2022 (%)
14.4.3.4 Business Segment Revenue Share, 2022 (%)
14.4.4 Product Benchmarking
14.4.5 Strategic Outlook
14.5 Mitsubishi Electric Corporation
14.5.1 Company Snapshot
14.5.2 Company Overview
14.5.3 Financial Analysis
14.5.3.1 Net Revenue, 2018-2022
14.5.3.2 R&D, 2018-2022
14.5.3.3 Regional Revenue Share, 2022 (%)
14.5.3.4 Business Segment Revenue Share, 2022 (%)
14.5.4 Product Benchmarking
14.5.5 Strategic Outlook
14.6 Toshiba Corporation
14.6.1 Company Snapshot
14.6.2 Company Overview
14.6.3 Financial Analysis
14.6.3.1 Net Revenue, 2018-2022
14.6.3.2 R&D, 2018-2022
14.6.3.3 Regional Revenue Share, 2022 (%)
14.6.3.4 Business Segment Revenue Share, 2022 (%)
14.6.4 Product Benchmarking
14.6.5 Strategic Outlook
14.7 Metawater Co.,Ltd.
14.7.1 Company Snapshot
14.7.2 Company Overview
14.7.3 Financial Analysis
14.7.3.1 Net Revenue, 2018-2022
14.7.3.2 R&D, 2018-2022
14.7.3.3 Business Segment Revenue Share, 2022 (%)
14.7.4 Product Benchmarking
14.8 Industrie De Nora S.p.A.
14.8.1 Company Snapshot
14.8.2 Company Overview
14.8.3 Product Benchmarking
14.8.4 Strategic Outlook
14.9 Spartan Environmental Technologies
14.9.1 Company Snapshot
14.9.2 Company Overview
14.9.3 Product Benchmarking
14.10 MKS Instruments, Inc.
14.10.1 Company Snapshot
14.10.2 Company Overview
14.10.3 Financial Analysis
14.10.3.1 Net Revenue, 2018-2022
14.10.3.2 R&D, 2018-2022
14.10.3.3 Business Segment Revenue Share, 2022 (%)
14.10.4 Product Benchmarking
14.10.5 Strategic Outlook
14.11 Teledyne Advanced Pollution Instrumentation
14.11.1 Company Snapshot
14.11.2 Company Overview
14.11.3 Product Benchmarking
14.12 Creative Oz-Air (I) Pvt Ltd
14.12.1 Company Snapshot
14.12.2 Company Overview
14.12.3 Product Benchmarking
14.13 Corotec Corporation
14.13.1 Company Snapshot
14.13.2 Company Overview
14.13.3 Product Benchmarking
14.14 Ozonetech Systems OTS AB
14.14.1 Company Snapshot
14.14.2 Company Overview
14.14.3 Product Benchmarking
14.15 Lenntech B.V.
14.15.1 Company Snapshot
14.15.2 Company Overview
14.15.3 Product Benchmarking
14.16 Chemtronics Technologies Pvt. Ltd.
14.16.1 Company Snapshot
14.16.2 Company Overview
14.16.3 Product Benchmarking
14.17 Faraday Ozone
14.17.1 Company Snapshot
14.17.2 Company Overview
14.17.3 Product Benchmarking
15 Conclusion and Recommendations
15.1 Concluding Remarks from Visiongain
15.2 Recommendations for Market Players
ページTOPに戻る
List of Tables/Graphs
List of Tables
Table 1 Ozone Generator Market Snapshot, 2023 & 2033 (US$ Million, CAGR %)
Table 2 Global Ozone Generator Market Forecast, 2023-2033 (US$ Mn, AGR (%), CAGR (%)) (V-Shaped Recovery Scenario)
Table 3 Global Ozone Generator Market by Region, 2023-2033 (US$ Mn, AGR (%), CAGR (%)) (V-Shaped Recovery Scenario)
Table 4 Global Ozone Generator Market Forecast, 2023-2033 (US$ Mn, AGR (%), CAGR (%)) (W-Shaped Recovery Scenario)
Table 5 Global Ozone Generator Market by Region, 2023-2033 (US$ Mn, AGR (%), CAGR (%)) (W-Shaped Recovery Scenario)
Table 6 Global Ozone Generator Market Forecast, 2023-2033 (US$ Mn, AGR (%), CAGR (%)) (U-Shaped Recovery Scenario)
Table 7 Global Ozone Generator Market by Region, 2023-2033 (US$ Mn, AGR (%), CAGR (%)) (U-Shaped Recovery Scenario)
Table 8 Global Ozone Generator Market Forecast, 2023-2033 (US$ Mn, AGR (%), CAGR (%)) (L-Shaped Recovery Scenario)
Table 9 Global Ozone Generator Market by Region, 2023-2033 (US$ Mn, AGR (%), CAGR (%)) (L-Shaped Recovery Scenario)
Table 10 Global Ozone Generator Market by Process, 2023-2033 (US$ Mn, AGR (%), CAGR (%))
Table 11 Odour Control Market by Region, 2023-2033 (US$ Mn, AGR (%), CAGR (%))
Table 12 Groundwater Remediation Market by Region, 2023-2033 (US$ Mn, AGR (%), CAGR (%))
Table 13 Disinfection Market by Region, 2023-2033 (US$ Mn, AGR (%), CAGR (%))
Table 14 Global Ozone Generator Market by Technology, 2023-2033 (US$ Mn, AGR (%), CAGR (%))
Table 15 Corona Discharge Market by Region, 2023-2033 (US$ Mn, AGR (%), CAGR (%))
Table 16 Ultraviolet Radiation Market by Region, 2023-2033 (US$ Mn, AGR (%), CAGR (%))
Table 17 Electrolysis Market by Region, 2023-2033 (US$ Mn, AGR (%), CAGR (%))
Table 18 Radiochemical Market by Region, 2023-2033 (US$ Mn, AGR (%), CAGR (%))
Table 19 Global Ozone Generator Market by End-use Industry, 2023-2033 (US$ Mn, AGR (%), CAGR (%))
Table 20 Municipal & Industrial Water Treatment Market by Region, 2023-2033 (US$ Mn, AGR (%), CAGR (%))
Table 21 Residential & Industrial Air Treatment Market by Region, 2023-2033 (US$ Mn, AGR (%), CAGR (%))
Table 22 Automotive Market by Region, 2023-2033 (US$ Mn, AGR (%), CAGR (%))
Table 23 Food & Beverage Market by Region, 2023-2033 (US$ Mn, AGR (%), CAGR (%))
Table 24 Other End-use Industry Market by Region, 2023-2033 (US$ Mn, AGR (%), CAGR (%))
Table 25 Global Ozone Generator Market by Application, 2023-2033 (US$ Mn, AGR (%), CAGR (%))
Table 26 Water Purification Market by Region, 2023-2033 (US$ Mn, AGR (%), CAGR (%))
Table 27 Air Purification Market by Region, 2023-2033 (US$ Mn, AGR (%), CAGR (%))
Table 28 Pulp Bleaching Market by Region, 2023-2033 (US$ Mn, AGR (%), CAGR (%))
Table 29 Organic Synthesis Market by Region, 2023-2033 (US$ Mn, AGR (%), CAGR (%))
Table 30 Aquaculture Market by Region, 2023-2033 (US$ Mn, AGR (%), CAGR (%))
Table 31 Other Applications Market by Region, 2023-2033 (US$ Mn, AGR (%), CAGR (%))
Table 32 Global Ozone Generator Market Forecast, 2023-2033 (US$ Mn, AGR (%), CAGR (%))
Table 33 Global Ozone Generator Market by Region, 2023-2033 (US$ Mn, AGR (%), CAGR (%))
Table 34 Global Ozone Generator Market by Process, 2023-2033 (US$ Mn, AGR (%), CAGR (%))
Table 35 Global Ozone Generator Market by Technology, 2023-2033 (US$ Mn, AGR (%), CAGR (%))
Table 36 Global Ozone Generator Market by End-use Industry, 2023-2033 (US$ Mn, AGR (%), CAGR (%))
Table 37 Global Ozone Generator Market by Application, 2023-2033 (US$ Mn, AGR (%), CAGR (%))
Table 38 North America Ozone Generator Market by Value, 2023-2033 (US$ Mn, AGR (%), CAGR (%))
Table 39 North America Ozone Generator Market by Country, 2023-2033 (US$ Mn, AGR (%), CAGR (%))
Table 40 North America Ozone Generator Market by Process, 2023-2033 (US$ Mn, AGR (%), CAGR (%))
Table 41 North America Ozone Generator Market by Technology, 2023-2033 (US$ Mn, AGR (%), CAGR (%))
Table 42 North America Ozone Generator Market by End-use Industry, 2023-2033 (US$ Mn, AGR (%), CAGR (%))
Table 43 North America Ozone Generator Market by Application, 2023-2033 (US$ Mn, AGR (%), CAGR (%))
Table 44 US Ozone Generator Market by Value, 2023-2033 (US$ Mn, AGR (%), CAGR (%))
Table 45 Canada Ozone Generator Market by Value, 2023-2033 (US$ Mn, AGR (%), CAGR (%))
Table 46 Europe Ozone Generator Market by Value, 2023-2033 (US$ Mn, AGR (%), CAGR (%))
Table 47 Europe Ozone Generator Market by Country, 2023-2033 (US$ Mn, AGR (%), CAGR (%))
Table 48 Europe Ozone Generator Market by Process, 2023-2033 (US$ Mn, AGR (%), CAGR (%))
Table 49 Europe Ozone Generator Market by Technology, 2023-2033 (US$ Mn, AGR (%), CAGR (%))
Table 50 Europe Ozone Generator Market by End-use Industry, 2023-2033 (US$ Mn, AGR (%), CAGR (%))
Table 51 Europe Ozone Generator Market by Application, 2023-2033 (US$ Mn, AGR (%), CAGR (%))
Table 52 Germany Ozone Generator Market by Value, 2023-2033 (US$ Mn, AGR (%), CAGR (%))
Table 53 UK Ozone Generator Market by Value, 2023-2033 (US$ Mn, AGR (%), CAGR (%))
Table 54 France Ozone Generator Market by Value, 2023-2033 (US$ Mn, AGR (%), CAGR (%))
Table 55 Italy Ozone Generator Market by Value, 2023-2033 (US$ Mn, AGR (%), CAGR (%))
Table 56 Spain Ozone Generator Market by Value, 2023-2033 (US$ Mn, AGR (%), CAGR (%))
Table 57 Rest of Europe Ozone Generator Market by Value, 2023-2033 (US$ Mn, AGR (%), CAGR (%))
Table 58 Asia-Pacific Ozone Generator Market by Value, 2023-2033 (US$ Mn, AGR (%), CAGR (%))
Table 59 Asia-Pacific Ozone Generator Market by Country, 2023-2033 (US$ Mn, AGR (%), CAGR (%))
Table 60 Asia-Pacific Ozone Generator Market by Process, 2023-2033 (US$ Mn, AGR (%), CAGR (%))
Table 61 Asia-Pacific Ozone Generator Market by Technology, 2023-2033 (US$ Mn, AGR (%), CAGR (%))
Table 62 Asia-Pacific Ozone Generator Market by End-use Industry, 2023-2033 (US$ Mn, AGR (%), CAGR (%))
Table 63 Asia-Pacific Ozone Generator Market by Application, 2023-2033 (US$ Mn, AGR (%), CAGR (%))
Table 64 China Ozone Generator Market by Value, 2023-2033 (US $Mn, AGR (%), CAGR (%))
Table 65 India Ozone Generator Market by Value, 2023-2033 (US$ Mn, AGR (%), CAGR (%))
Table 66 Japan Ozone Generator Market by Value, 2023-2033 (US$ Mn, AGR (%), CAGR (%))
Table 67 South Korea Ozone Generator Market by Value, 2023-2033 (US$ Mn, AGR (%), CAGR (%))
Table 68 Australia Ozone Generator Market by Value, 2023-2033 (US$ Mn, AGR (%), CAGR (%))
Table 69 Rest of Asia-Pacific Ozone Generator Market by Value, 2023-2033 (US$ Mn, AGR (%), CAGR (%))
Table 70 Middle East & Africa Ozone Generator Market by Value, 2023-2033 (US$ Mn, AGR (%), CAGR (%))
Table 71 Middle East & Africa Ozone Generator Market by Country, 2023-2033 (US$ Mn, AGR (%), CAGR (%))
Table 72 Middle East & Africa Ozone Generator Market by Process, 2023-2033 (US$ Mn, AGR (%), CAGR (%))
Table 73 Middle East & Africa Ozone Generator Market by Technology, 2023-2033 (US$ Mn, AGR (%), CAGR (%))
Table 74 Middle East & Africa Ozone Generator Market by End-use Industry, 2023-2033 (US$ Mn, AGR (%), CAGR (%))
Table 75 Middle East & Africa Ozone Generator Market by Application, 2023-2033 (US$ Mn, AGR (%), CAGR (%))
Table 76 GCC Ozone Generator Market by Value, 2023-2033 (US$ Mn, AGR (%), CAGR (%))
Table 77 South Africa Ozone Generator Market by Value, 2023-2033 (US$ Mn, AGR (%), CAGR (%))
Table 78 Rest of Middle East & Africa Ozone Generator Market by Value, 2023-2033 (US$ Mn, AGR (%), CAGR (%))
Table 79 Latin America Ozone Generator Market by Value, 2023-2033 (US$ Mn, AGR (%), CAGR (%))
Table 80 Latin America Ozone Generator Market by Country, 2023-2033 (US$ Mn, AGR (%), CAGR (%))
Table 81 Latin America Ozone Generator Market by Process, 2023-2033 (US$ Mn, AGR (%), CAGR (%))
Table 82 Latin America Ozone Generator Market by Technology, 2023-2033 (US$ Mn, AGR (%), CAGR (%))
Table 83 Latin America Ozone Generator Market by End-use Industry, 2023-2033 (US$ Mn, AGR (%), CAGR (%))
Table 84 Latin America Ozone Generator Market by Application, 2023-2033 (US$ Mn, AGR (%), CAGR (%))
Table 85 Brazil Ozone Generator Market by Value, 2023-2033 (US$ Mn, AGR (%), CAGR (%))
Table 86 Mexico Ozone Generator Market by Value, 2023-2033 (US$ Mn, AGR (%), CAGR (%))
Table 87 Rest of Latin America Ozone Generator Market by Value, 2023-2033 (US$ Mn, AGR (%), CAGR (%))
Table 88 Strategic Outlook: New Product Launch
Table 89 Strategic Outlook: Acquisition
Table 90 Strategic Outlook: Partnership
Table 91 Strategic Outlook: Agreement
Table 92 Strategic Outlook: Contract
Table 93 Veolia Water Technologies & Solutions :Key Details, (CEO, HQ, Revenue, Founded, No. of Employees, Company Type, Website, Business Segment)
Table 94 Veolia Water Technologies & Solutions: Product Benchmarking
Table 95 Veolia Water Technologies & Solutions: Strategic Outlook
Table 96 Xylem Inc. Key Details, (CEO, HQ, Revenue, Founded, No. of Employees, Company Type, Website, Business Segment)
Table 97 Xylem Inc.: Product Benchmarking
Table 98 Xylem Inc.: Strategic Outlook
Table 99 Mitsubishi Electric Corporation Key Details, (CEO, HQ, Revenue, Founded, No. of Employees, Company Type, Website, Business Segment)
Table 100 Mitsubishi Electric Corporation: Product Benchmarking
Table 101 Mitsubishi Electric Corporation: Strategic Outlook
Table 102 Toshiba Corporation Key Details, (CEO, HQ, Revenue, Founded, No. of Employees, Company Type, Website, Business Segment)
Table 103 Toshiba Corporation: Product Benchmarking
Table 104 Toshiba Corporation: Strategic Outlook
Table 105 Metawater Co,Ltd Key Details, (CEO, HQ, Revenue, Founded, No. of Employees, Company Type, Website, Business Segment)
Table 106 Metawater Co,Ltd : Product Benchmarking
Table 107 Industrie De Nora S.p.A. Key Details, (CEO, HQ, Revenue, Founded, No. of Employees, Company Type, Website, Business Segment)
Table 108 Industrie De Nora S.p.A.: Product Benchmarking
Table 109 Industries De Nora S.p.A.: Strategic Outlook
Table 110 Spartan Environmental Technologies Key Details, (CEO, HQ, Revenue, Founded, No. of Employees, Company Type, Website, Business Segment)
Table 111 Spartan Environmental Technologies: Product Benchmarking
Table 112 MKS Instruments, Inc.Key Details, (CEO, HQ, Revenue, Founded, No. of Employees, Company Type, Website, Business Segment)
Table 113 MKS Instruments, Inc: Product Benchmarking
Table 114 MKS Instruments, Inc: Strategic Outlook
Table 115 Teledyne Advanced Pollution Instrumentation Key Details, (CEO, HQ, Revenue, Founded, No. of Employees, Company Type, Website, Business Segment)
Table 116 Teledyne Advanced Pollution Instrumentation: Product Benchmarking
Table 117 Creative Oz-Air (I) Pvt Ltd Key Details, (CEO, HQ, Revenue, Founded, No. of Employees, Company Type, Website, Business Segment)
Table 118 Creative Oz-Air (I) Pvt Ltd: Product Benchmarking
Table 119 Corotec CorporationKey Details, (CEO, HQ, Revenue, Founded, No. of Employees, Company Type, Website, Business Segment)
Table 120 Corotec Corporation: Product Benchmarking
Table 121 Ozonetech Systems OTS AB Key Details, (CEO, HQ, Revenue, Founded, No. of Employees, Company Type, Website, Business Segment)
Table 122 Ozonetech Systems OTS AB: Product Benchmarking
Table 123 Lenntech B.V.Key Details, (CEO, HQ, Revenue, Founded, No. of Employees, Company Type, Website, Business Segment)
Table 124 Lenntech B.V.: Product Benchmarking
Table 125 Chemtronics Technologies Pvt. Ltd. Key Details, (CEO, HQ, Revenue, Founded, No. of Employees, Company Type, Website, Business Segment)
Table 126 Chemtronics Technologies Pvt. Ltd.: Product Benchmarking
Table 127 Faraday Ozone Key Details, (CEO, HQ, Revenue, Founded, No. of Employees, Company Type, Website, Business Segment)
Table 128 Faraday Ozone: Product Benchmarking
List of Figures
Figure 1 Ozone Generator Market Segmentation
Figure 2 Ozone Generator Market by Process: Market Attractiveness Index
Figure 3 Ozone Generator Market by Technology: Market Attractiveness Index
Figure 4 Ozone Generator Market by End-Use: Market Attractiveness Index
Figure 5 Ozone Generator Market by Application: Market Attractiveness Index
Figure 6 Ozone Generator Market Attractiveness Index by Region
Figure 7 Ozone Generator Market: Market Dynamics
Figure 8 Global Ozone Generator Market Forecast by COVID, 2023-2033 (%)
Figure 17 Ozone Generator Market: Porter’s Five Forces Analysis
Figure 18 Ozone Generator Market: PEST Analysis
Figure 19 Ozone Generator Market by Process: Market Attractiveness Index
Figure 21 Global Ozone Generator Market Forecast by Process, 2023-2033 (%)
Figure 23 Process Segment Market Share Forecast by Region, 2023 & 2033 (%)
Figure 25 Process Segment Market Share Forecast by Region, 2023 & 2033 (%)
Figure 27 Process Segment Market Share Forecast by Region, 2023 & 2033 (%)
Figure 28 Ozone Generator Market by Technology: Market Attractiveness Index
Figure 30 Global Ozone Generator Market Forecast by Technology, 2023-2033 (%)
Figure 32 Technology Segment Market Share Forecast by Region, 2023 & 2033 (%)
Figure 34 Technology Segment Market Share Forecast by Region, 2023 & 2033 (%)
Figure 36 Technology Segment Market Share Forecast by Region, 2023 & 2033 (%)
Figure 38 Technology Segment Market Share Forecast by Region, 2023 & 2033 (%)
Figure 39 Ozone Generator Market by End-Use: Market Attractiveness Index
Figure 41 Global Ozone Generator Market Forecast by End-use Industry, 2023-2033 (%)
Figure 43 End-Use Segment Market Share Forecast by Region, 2023 & 2033 (%)
Figure 45 End-Use Segment Market Share Forecast by Region, 2023 & 2033 (%)
Figure 47 End-Use Segment Market Share Forecast by Region, 2023 & 2033 (%)
Figure 49 End-Use Segment Market Share Forecast by Region, 2023 & 2033 (%)
Figure 51 End-Use Segment Market Share Forecast by Region, 2023 & 2033 (%)
Figure 52 Ozone Generator Market by Application: Market Attractiveness Index
Figure 54 Global Ozone Generator Market Forecast by Application, 2023-2033 (%)
Figure 56 Application Segment Market Share Forecast by Region, 2023 & 2033 (%)
Figure 58 Application Segment Market Share Forecast by Region, 2023 & 2033 (%)
Figure 60 Application Segment Market Share Forecast by Region, 2023 & 2033 (%)
Figure 62 Application Segment Market Share Forecast by Region, 2023 & 2033 (%)
Figure 64 Application Segment Market Share Forecast by Region, 2023 & 2033 (%)
Figure 66 Application Segment Market Share Forecast by Region, 2023 & 2033 (%)
Figure 73 Global Ozone Generator Market Forecast by Region, 2023-2033 (%)
Figure 74 North America Ozone Generator Market Attractiveness Index
Figure 75 North America Ozone Generator Market by Country, 2023, 2028 & 2033 (US$ Million)
Figure 78 North America Ozone Generator Market Forecast by Country, 2023-2033 (%)
Figure 80 North America Ozone Generator Market Forecast by Process, 2023-2033 (%)
Figure 82 North America Ozone Generator Market Forecast by Technology, 2023-2033 (%)
Figure 84 North America Ozone Generator Market Forecast by End-use Industry, 2023-2033 (%)
Figure 86 North America Ozone Generator Market Forecast by Application, 2023-2033 (%)
Figure 89 Europe Ozone Generator Market Attractiveness Index
Figure 90 Europe Ozone Generator Market by Region, 2023, 2028 & 2033 (US$ Million)
Figure 93 Europe Ozone Generator Market Forecast by Country, 2023-2033 (%)
Figure 95 Europe Ozone Generator Market Forecast by Process, 2023-2033 (%)
Figure 97 Europe Ozone Generator Market Forecast by Technology, 2023-2033 (%)
Figure 99 Europe Ozone Generator Market Forecast by End-use Industry, 2023-2033 (%)
Figure 101 Europe Ozone Generator Market Forecast by Application, 2023-2033 (%)
Figure 108 Asia-Pacific Ozone Generator Market Attractiveness Index
Figure 109 Asia-Pacific Ozone Generator Market by Region, 2023, 2028 & 2033 (US$ Million)
Figure 112 Asia-Pacific Ozone Generator Market Forecast by Country, 2023-2033 (%)
Figure 114 Asia-Pacific Ozone Generator Market Forecast by Process, 2023-2033 (%)
Figure 116 Asia-Pacific Ozone Generator Market Forecast by Technology, 2023-2033 (%)
Figure 118 Asia-Pacific Ozone Generator Market Forecast by End-use Industry2023-2033 (%)
Figure 120 Asia-Pacific Ozone Generator Market Forecast by Application, 2023-2033 (%)
Figure 127 Middle East & Africa Ozone Generator Market Attractiveness Index
Figure 128 Middle East & Africa Ozone Generator Market by Country, 2023, 2028 & 2033 (US$ Million)
Figure 131 Middle East & Africa Ozone Generator Market Forecast by Country, 2023-2033 (%)
Figure 133 Middle East & Africa Ozone Generator Market Forecast by Process, 2023-2033 (%)
Figure 135 Middle East & Africa Ozone Generator Market Forecast by Technology, 2023-2033 (%)
Figure 139 Middle East & Africa Ozone Generator Market Forecast by Application, 2023-2033 (%)
Figure 143 Latin America Ozone Generator Market Attractiveness Index
Figure 144 Latin America Ozone Generator Market by Country, 2023, 2028 & 2033 (US$ Million)
Figure 147 Latin America Ozone Generator Market Forecast by Country, 2023-2033 (%)
Figure 149 Latin America Ozone Generator Market Forecast by Process, 2023-2033 (%)
Figure 151 Latin America Ozone Generator Market Forecast by Technology, 2023-2033 (%)
Figure 153 Latin America Ozone Generator Market Forecast by End-use Industry, 2023-2033 (%)
Figure 155 Latin America Ozone Generator Market Forecast by Application, 2023-2033 (%)
Figure 159 Ozone Generator Market: Company Share, 2022
Figure 160 Xylem Inc.: Net Revenue, 2018-2022 (US$ Million, AGR%)
Figure 161 Xylem Inc.: R&D, 2018-2022 (US$ Million, AGR%)
Figure 162 Xylem Inc.: Regional Revenue Share, 2022 (%)
Figure 163 Xylem Inc.: Business Segment Revenue Share, 2022 (%)
Figure 164 Mitsubishi Electric Corporation: Net Revenue, 2018-2022 (US$ Million, AGR%)
Figure 165 Mitsubishi Electric Corporation: R&D, 2018-2022 (US$ Million, AGR%)
Figure 166 Mitsubishi Electric Corporation: Regional Revenue Share, 2022 (%)
Figure 167 Mitsubishi Electric Corporation: Business Segment Revenue Share, 2022 (%)
Figure 168 Toshiba Corporation: Net Revenue, 2018-2022 (US$ Million, AGR%)
Figure 169 Toshiba Corporation: R&D, 2018-2022 (US$ Million, AGR%)
Figure 170 Toshiba Corporation: Regional Revenue Share, 2022 (%)
Figure 171 Toshiba Corporation: Business Segment Revenue Share, 2022 (%)
Figure 172 Metawater Co,Ltd : Net Revenue, 2018-2022 (US$ Million, AGR%)
Figure 173 Metawater Co,Ltd : R&D, 2018-2022 (US$ Million, AGR%)
Figure 174 Metawater Co,Ltd : Business Segment Revenue Share, 2022 (%)
Figure 175 MKS Instruments, Inc: Net Revenue, 2018-2022 (US$ Million, AGR%)
Figure 176 MKS Instruments, Inc: R&D, 2018-2022 (US$ Million, AGR%)
Figure 177 MKS Instruments, Inc: Business Segment Revenue Share, 2022 (%)
ページTOPに戻る
本レポートと同じKEY WORD(ozone)の最新刊レポート
- 本レポートと同じKEY WORDの最新刊レポートはありません。
よくあるご質問
Visiongain社はどのような調査会社ですか?
英国の調査会社ヴィジョンゲイン社(Visiongain)は、通信とエネルギーのほか、自動車や化学・医薬品、金属など、広範な市場を対象に調査を行っています。自動車市場については、市場全般に関する調査のほ... もっと見る
調査レポートの納品までの日数はどの程度ですか?
在庫のあるものは速納となりますが、平均的には 3-4日と見て下さい。
但し、一部の調査レポートでは、発注を受けた段階で内容更新をして納品をする場合もあります。
発注をする前のお問合せをお願いします。
注文の手続きはどのようになっていますか?
1)お客様からの御問い合わせをいただきます。
2)見積書やサンプルの提示をいたします。
3)お客様指定、もしくは弊社の発注書をメール添付にて発送してください。
4)データリソース社からレポート発行元の調査会社へ納品手配します。
5) 調査会社からお客様へ納品されます。最近は、pdfにてのメール納品が大半です。
お支払方法の方法はどのようになっていますか?
納品と同時にデータリソース社よりお客様へ請求書(必要に応じて納品書も)を発送いたします。
お客様よりデータリソース社へ(通常は円払い)の御振り込みをお願いします。
請求書は、納品日の日付で発行しますので、翌月最終営業日までの当社指定口座への振込みをお願いします。振込み手数料は御社負担にてお願いします。
お客様の御支払い条件が60日以上の場合は御相談ください。
尚、初めてのお取引先や個人の場合、前払いをお願いすることもあります。ご了承のほど、お願いします。
データリソース社はどのような会社ですか?
当社は、世界各国の主要調査会社・レポート出版社と提携し、世界各国の市場調査レポートや技術動向レポートなどを日本国内の企業・公官庁及び教育研究機関に提供しております。
世界各国の「市場・技術・法規制などの」実情を調査・収集される時には、データリソース社にご相談ください。
お客様の御要望にあったデータや情報を抽出する為のレポート紹介や調査のアドバイスも致します。
|
|


